1.1.1. Atmosphere
Each of the last three decades has been successively warmer at the Earth’s surface than any preceding decade since 1850. The period from 1983 to 2012 was very likely the warmest 30-year period of the last 800 years in the Northern Hemisphere, where such assessment is possible (high confidence) and likely the warmest 30-year period of the last 1400 years (medium confidence). {WGI 2.4.3, 5.3.5}
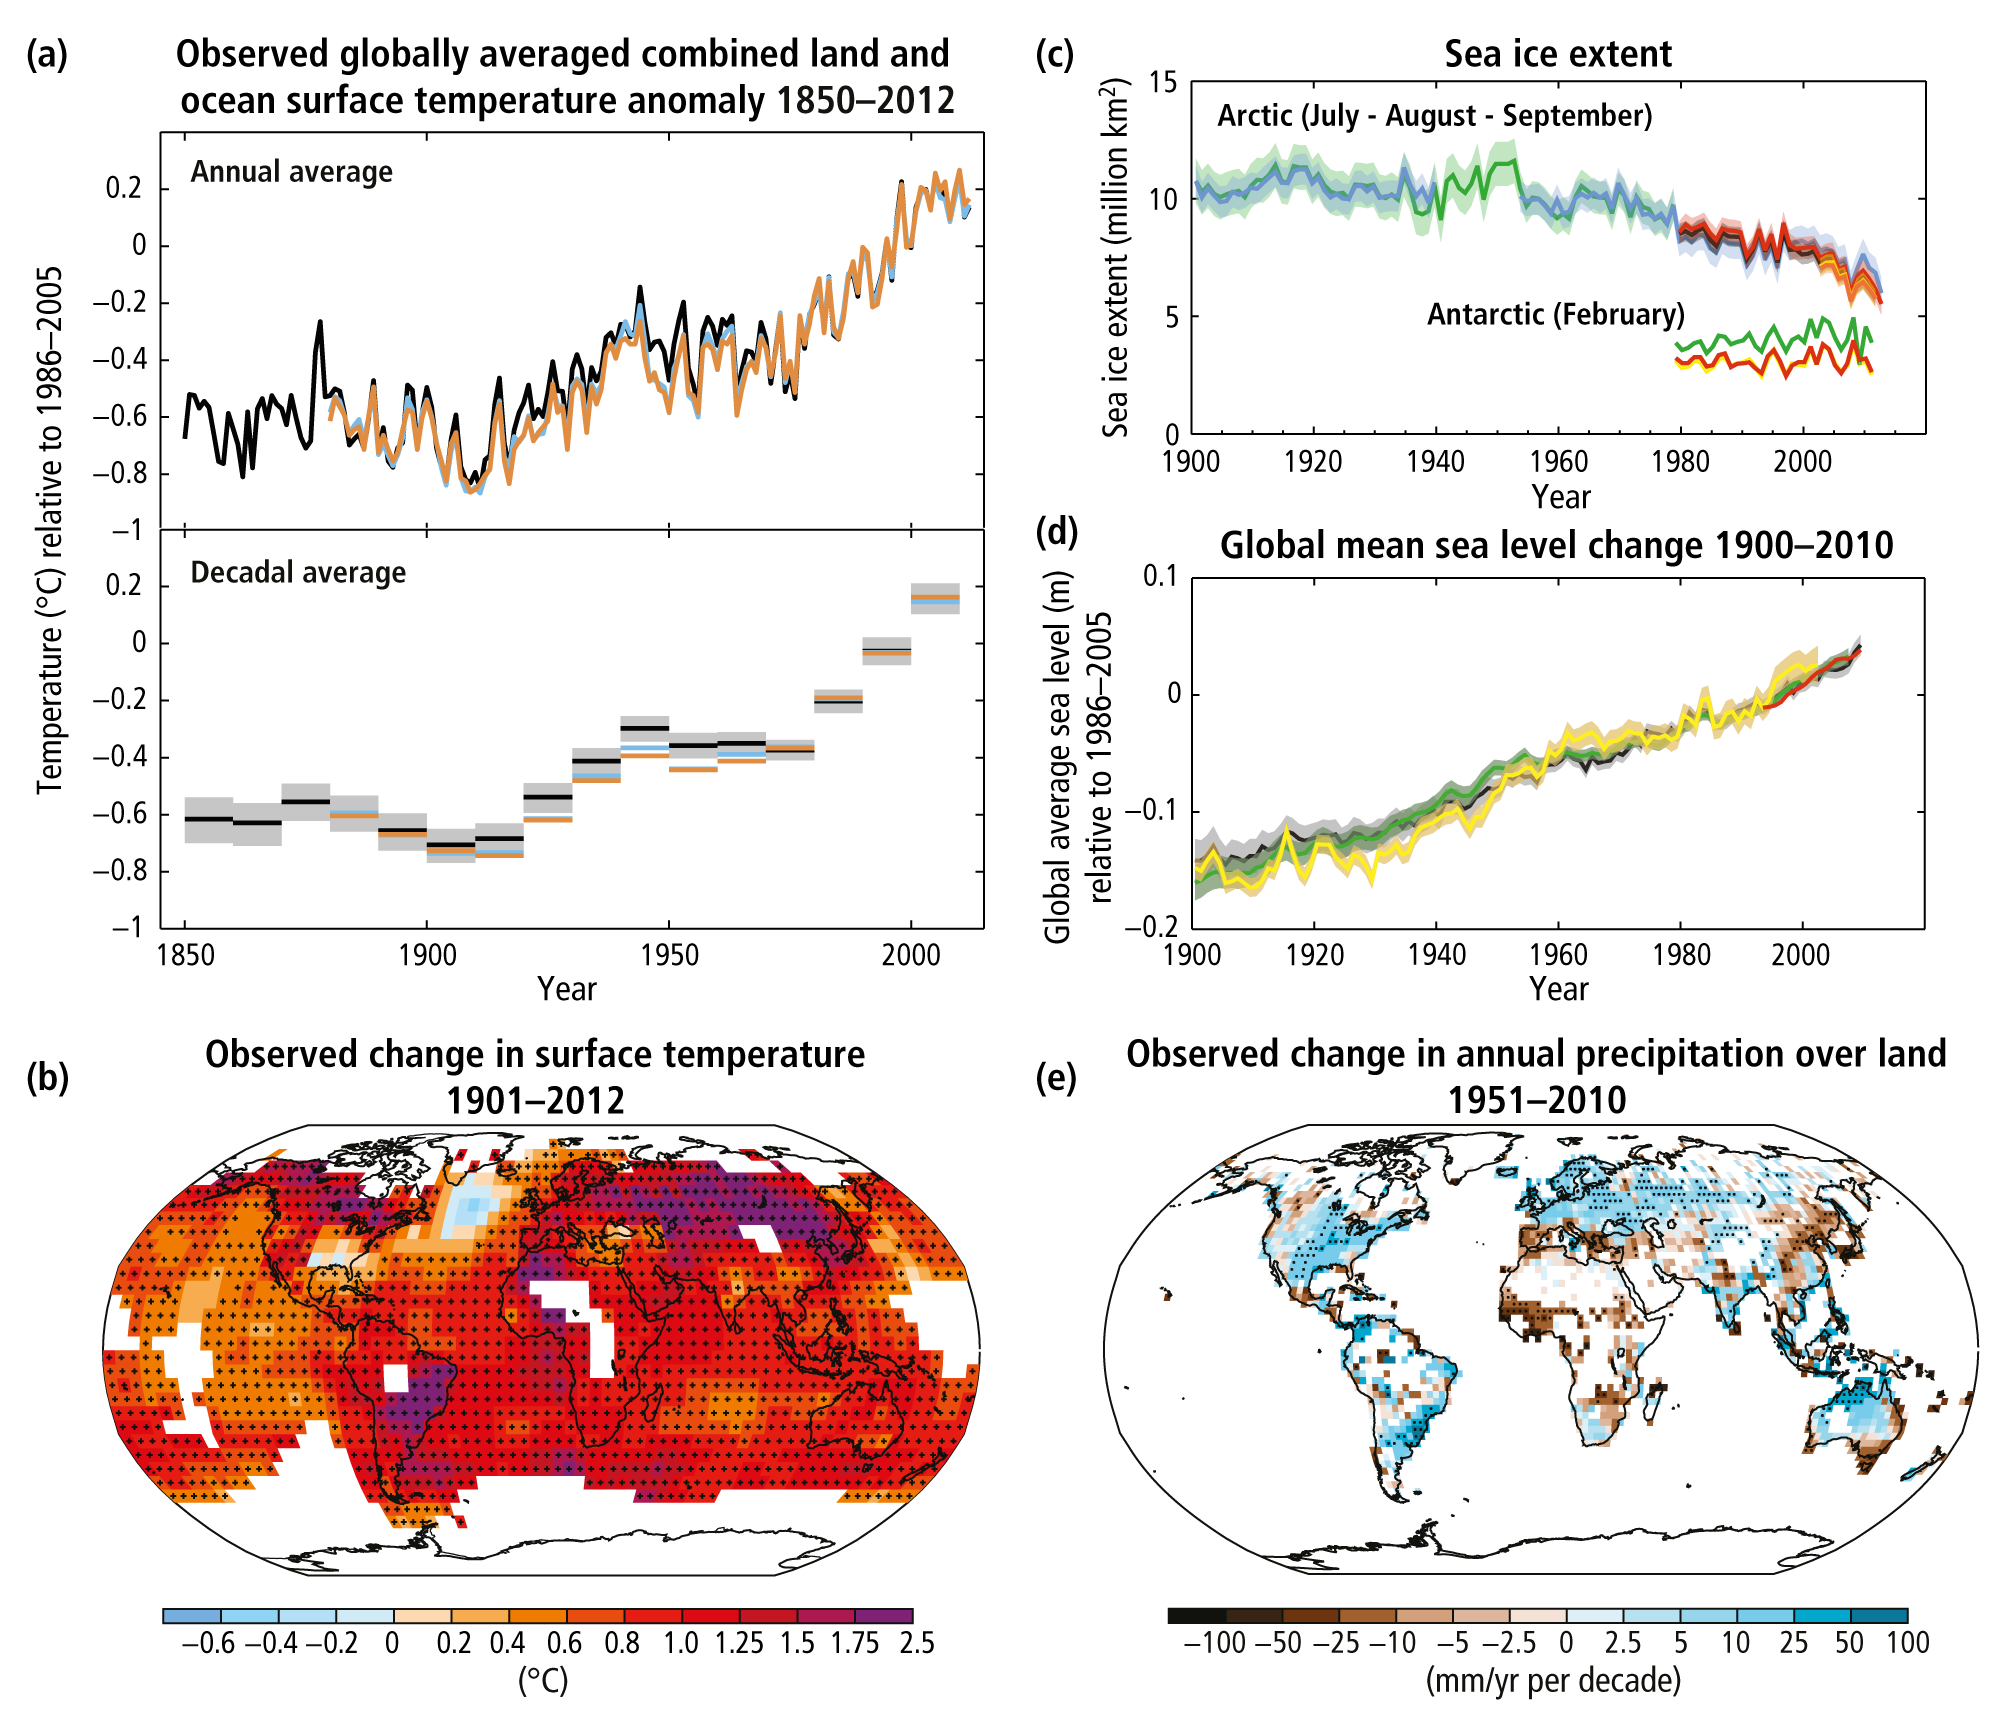
The globally averaged combined land and ocean surface temperature data as calculated by a linear trend show a warming of 0.85 [0.65 to 1.06] °C1 over the period 1880 to 2012, for which multiple independently produced datasets exist. The total increase between the average of the 1850–1900 period and the 2003–2012 period is 0.78 [0.72 to 0.85] °C, based on the single longest dataset available. For the longest period when calculation of regional trends is sufficiently complete (1901 to 2012), almost the entire globe has experienced surface warming (Figure 1.1). {WGI SPM B.1, 2.4.3}
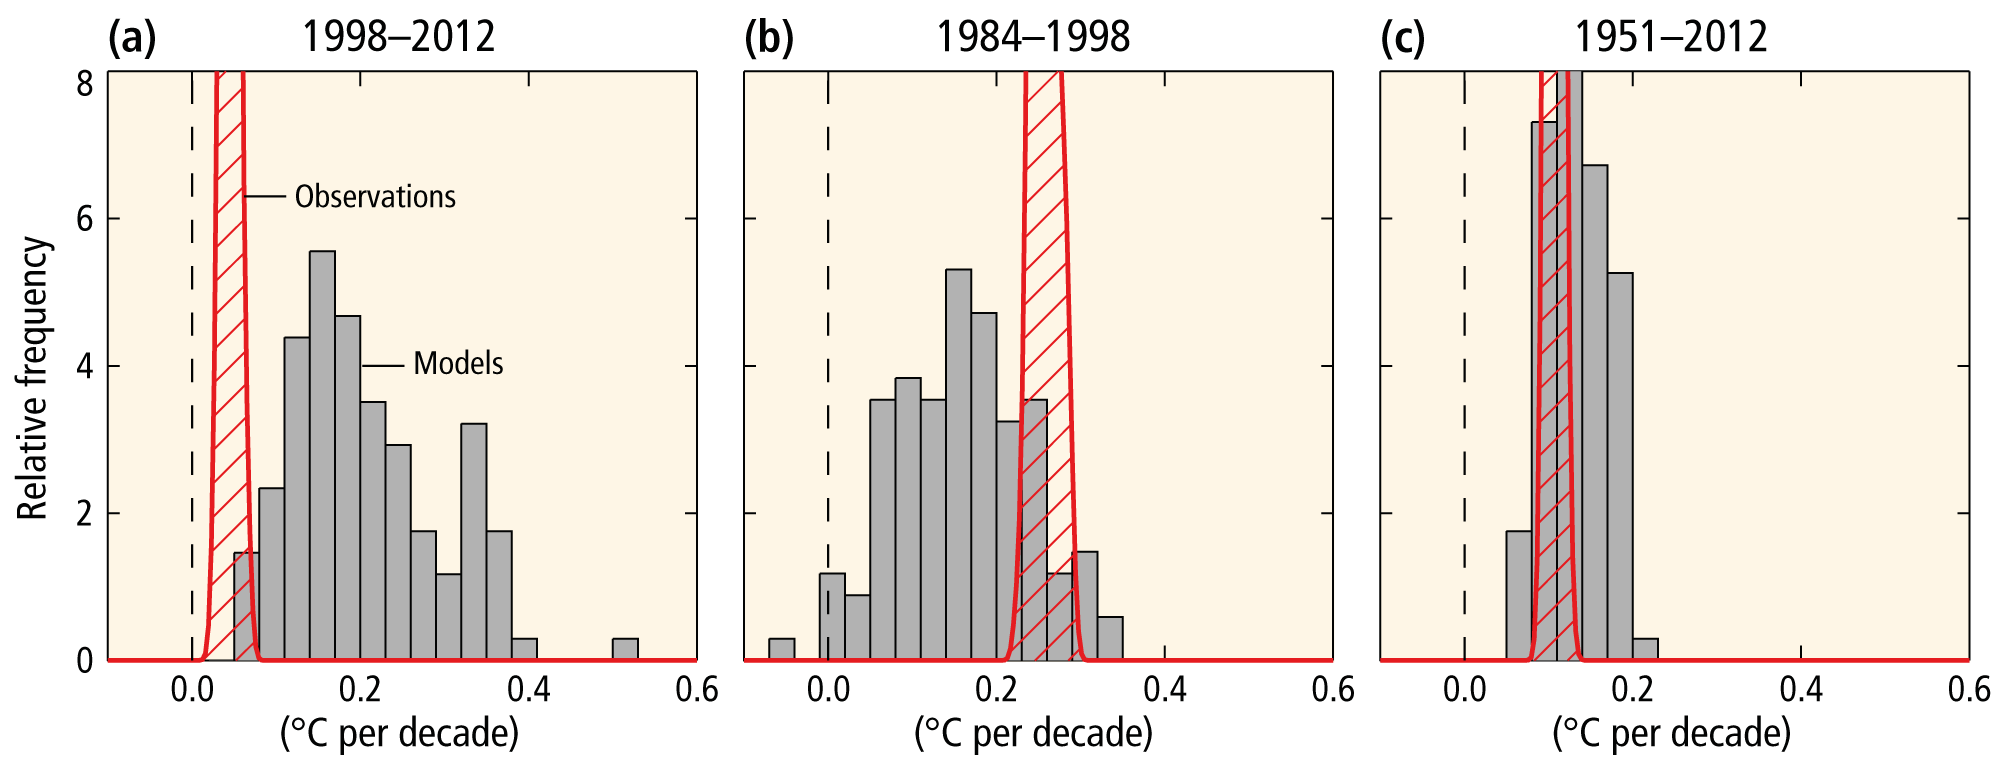
In addition to robust multi-decadal warming, the globally averaged surface temperature exhibits substantial decadal and interannual variability (Figure 1.1). Due to this natural variability, trends based on short records are very sensitive to the beginning and end dates and do not in general reflect long-term climate trends. As one example, the rate of warming over the past 15 years (1998–2012; 0.05 [–0.05 to 0.15] °C per decade), which begins with a strong El Niño, is smaller than the rate calculated since 1951 (1951–2012; 0.12 [0.08 to 0.14] °C per decade; see Box 1.1). {WGI SPM B.1, 2.4.3}
Based on multiple independent analyses of measurements, it is virtually certain that globally the troposphere has warmed and the lower stratosphere has cooled since the mid-20th century. There is medium confidence in the rate of change and its vertical structure in the Northern Hemisphere extratropical troposphere. {WGI SPM B.1, 2.4.4}
Confidence in precipitation change averaged over global land areas since 1901 is low prior to 1951 and medium afterwards. Averaged over the mid-latitude land areas of the Northern Hemisphere, precipitation has likely increased since 1901 (medium confidence before and high confidence after 1951). For other latitudes area-averaged long-term positive or negative trends have low confidence (Figure 1.1). {WGI SPM B.1, Figure SPM.2, 2.5.1}
Edit1.1.2. Oceans
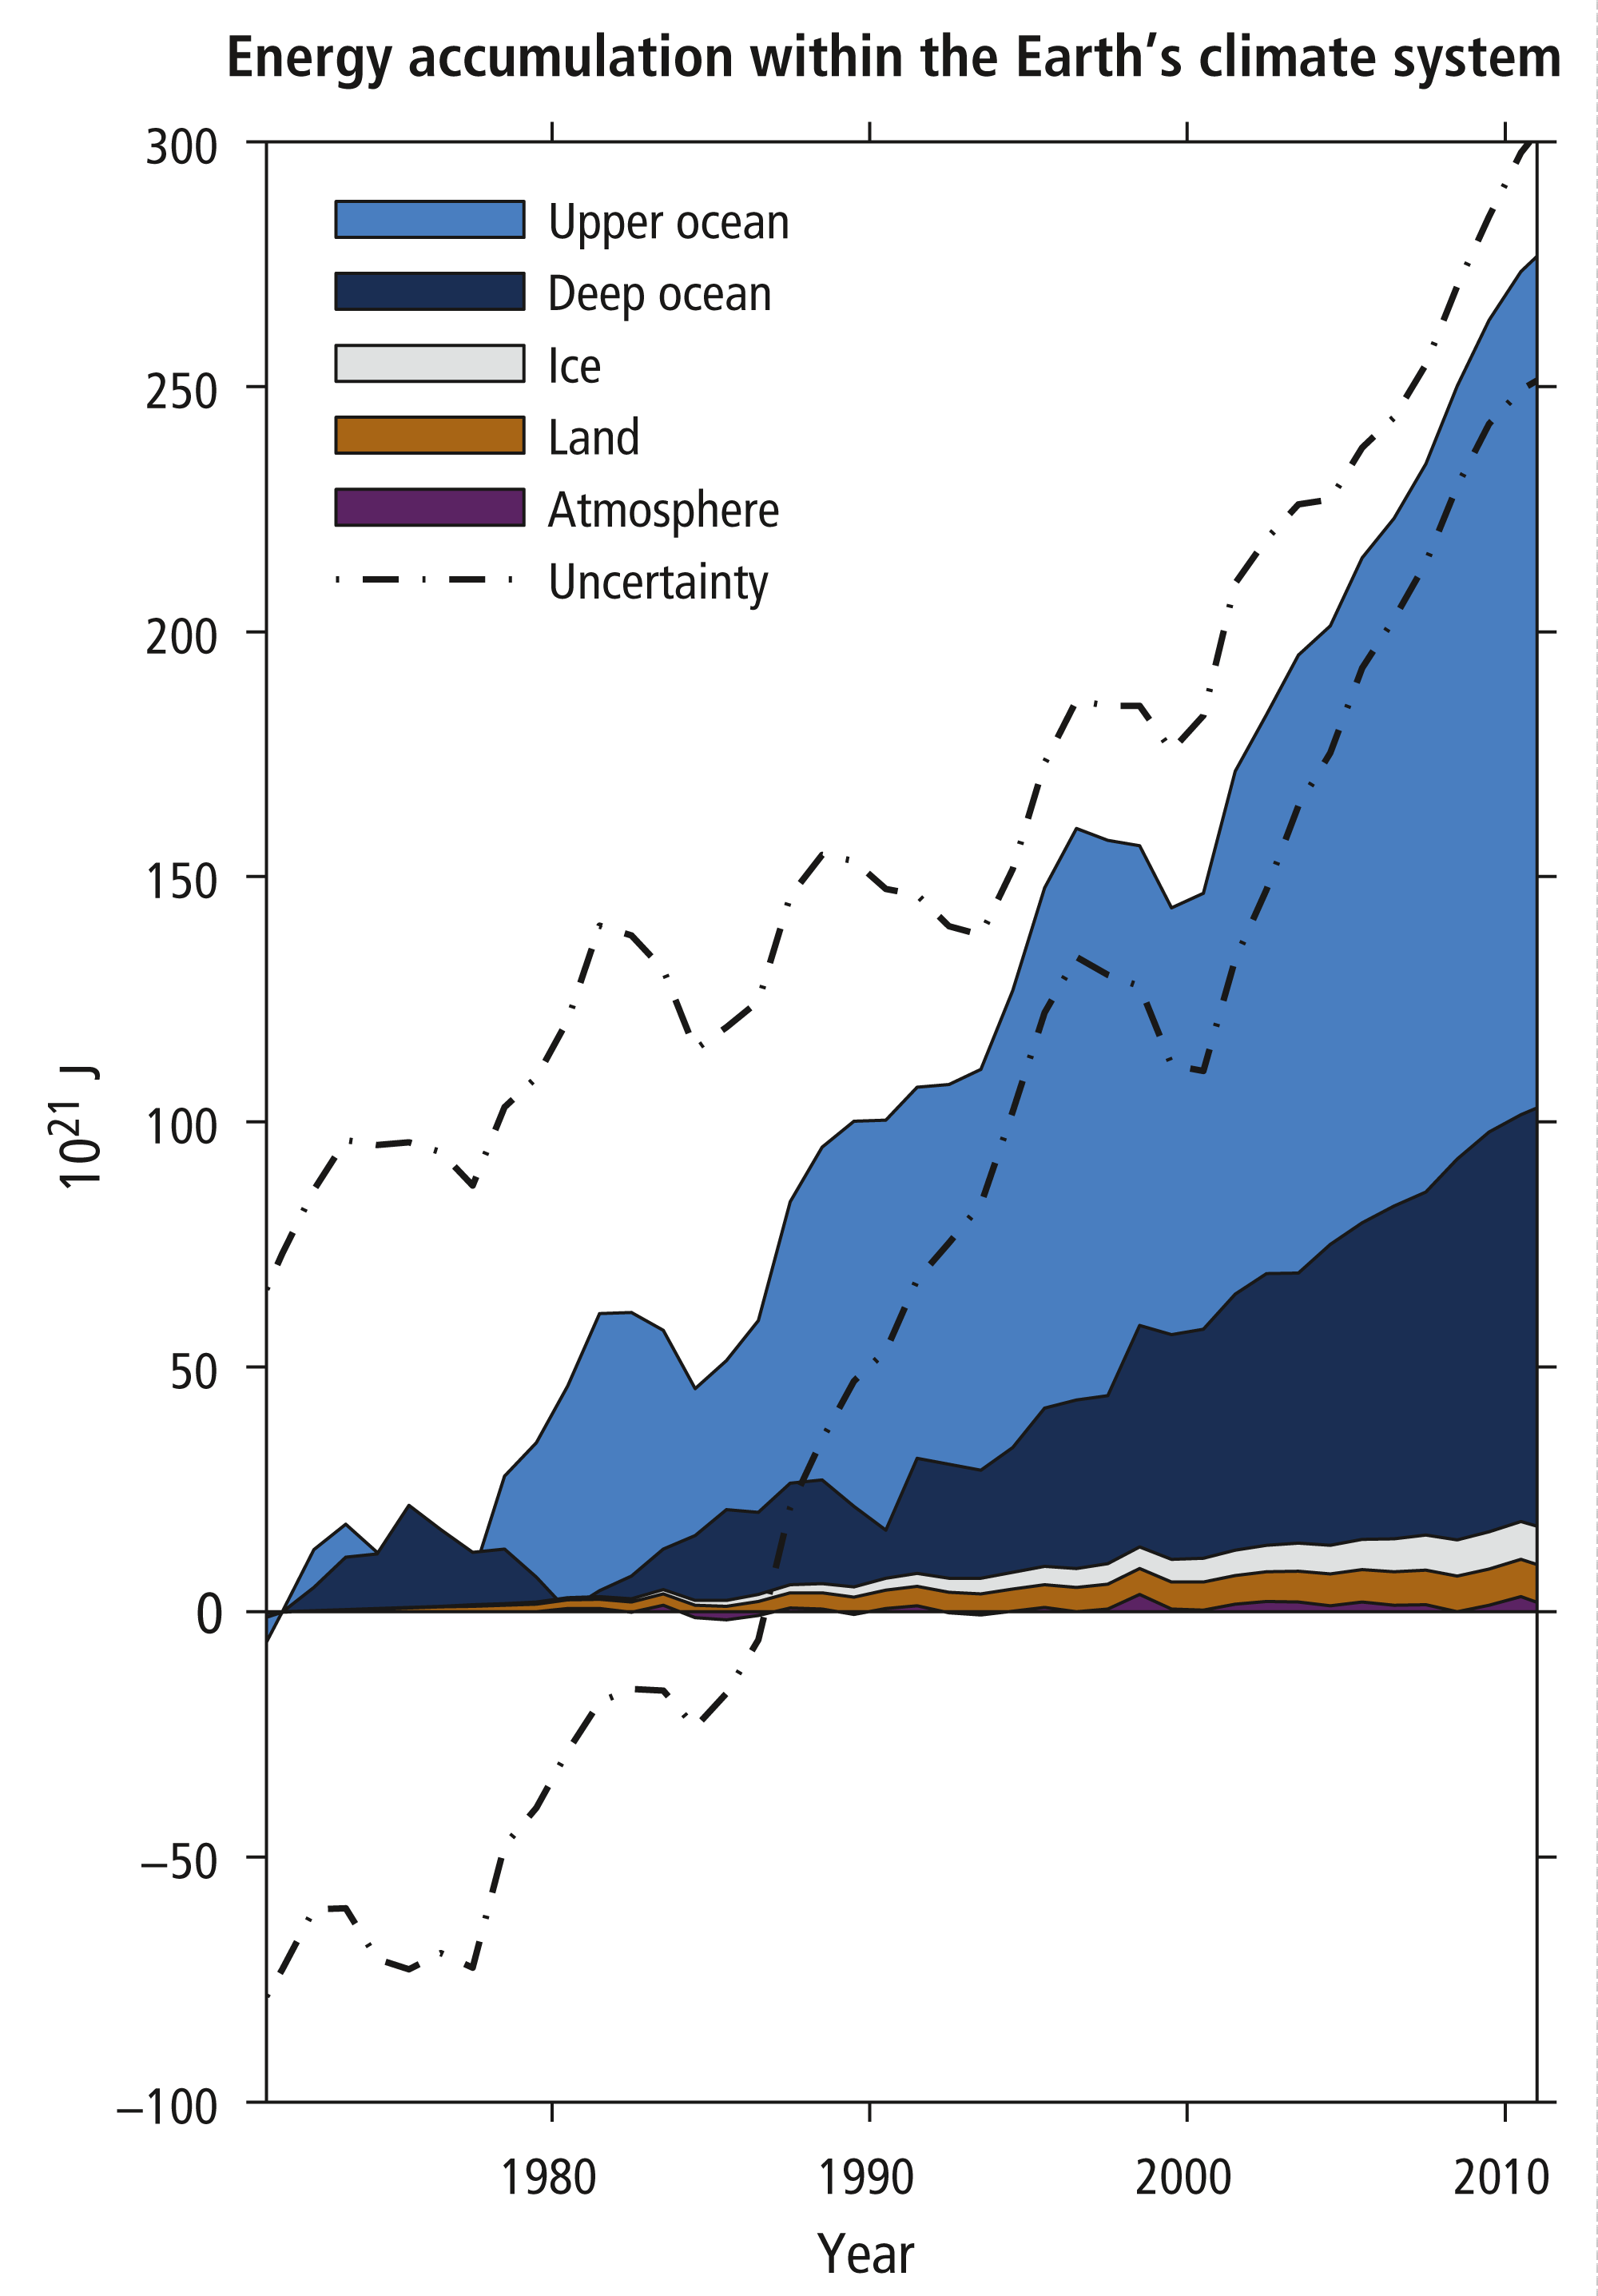
Ocean warming dominates the increase in energy stored in the climate system, accounting for more than 90% of the energy accumulated between 1971 and 2010 (high confidence) with only about 1% stored in the atmosphere (Figure 1.2). On a global scale, the ocean warming is largest near the surface, and the upper 75 m warmed by 0.11 [0.09 to 0.13] °C per decade over the period 1971 to 2010. It is virtually certain that the upper ocean (0−700 m) warmed from 1971 to 2010, and it likely warmed between the 1870s and 1971. It is likely that the ocean warmed from 700 to 2000 m from 1957 to 2009 and from 3000 m to the bottom for the period 1992 to 2005 (Figure 1.2). {WGI SPM B.2, 3.2, Box 3.1}
It is very likely that regions of high surface salinity, where evaporation dominates, have become more saline, while regions of low salinity, where precipitation dominates, have become fresher since the 1950s. These regional trends in ocean salinity provide indirect evidence for changes in evaporation and precipitation over the oceans and thus for changes in the global water cycle (medium confidence). There is no observational evidence of a long-term trend in the Atlantic Meridional Overturning Circulation (AMOC). {WGI SPM B.2, 2.5, 3.3, 3.4.3, 3.5, 3.6.3}
Figure 1.1 | Multiple observed indicators of a changing global climate system. (a) Observed globally averaged combined land and ocean surface temperature anomalies (relative to the mean of 1986 to 2005 period, as annual and decadal averages) with an estimate of decadal mean uncertainty included for one data set (grey shading). {WGI Figure SPM.1, WGI Figure 2.20, a listing of data sets and further technical details are given in the WGI Technical Summary Supplementary Material WGI TS.SM.1.1} (b) Map of the observed surface temperature change, from 1901 to 2012, derived from temperature trends determined by linear regression from one data set (orange line in Panel a). Trends have been calculated where data availability permitted a robust estimate (i.e., only for grid boxes with greater than 70% complete records and more than 20% data availability in the first and last 10% of the time period), other areas are white. Grid boxes where the trend is significant, at the 10% level, are indicated by a + sign. {WGI Figure SPM.1, WGI Figure 2.21, WGI Figure TS.2, a listing of data sets and further technical details are given in the WGI Technical Summary Supplementary Material WGI TS.SM.1.2} (c) Arctic (July to September average) and Antarctic (February) sea ice extent. {WGI Figure SPM.3, Figure 4.3, Figure 4.SM.2, a listing of data sets and further technical details are given in the WGI Technical Summary Supplementary Material WGI TS.SM.3.2} (d) Global mean sea level relative to the 1986–2005 mean of the longest running data set, and with all data sets aligned to have the same value in 1993, the first year of satellite altimetry data. All time series (coloured lines indicating different data sets) show annual values, and where assessed, uncertainties are indicated by coloured shading. {WGI Figure SPM.3, WGI Figure 3.13, a listing of data sets and further technical details are given in the WGI Technical Summary Supplementary Material WGI TS.SM.3.4} (e) Map of observed precipitation change, from 1951 to 2010; trends in annual accumulation calculated using the same criteria as in Panel b. {WGI SPM. Figure.2, WGI TS TFE.1, Figure 2, WGI Figure 2.29. A listing of data sets and further technical details are given in the WGI Technical Summary Supplementary Material WGI TS.SM.2.1}
Figure 1.2 | Energy accumulation within the Earth's climate system. Estimates are in 1021 J, and are given relative to 1971 and from 1971 to 2010, unless otherwise indicated. Components included are upper ocean (above 700 m), deep ocean (below 700 m; including below 2000 m estimates starting from 1992), ice melt (for glaciers and ice caps, Greenland and Antarctic ice sheet estimates starting from 1992, and Arctic sea ice estimate from 1979 to 2008), continental (land) warming, and atmospheric warming (estimate starting from 1979). Uncertainty is estimated as error from all five components at 90% confidence intervals. {WGI Box 3.1, Figure 1}
Since the beginning of the industrial era, oceanic uptake of CO2 has resulted in acidification of the ocean; the pH of ocean surface water has decreased by 0.1 (high confidence), corresponding to a 26% increase in acidity, measured as hydrogen ion concentration. There is medium confidence that, in parallel to warming, oxygen concentrations have decreased in coastal waters and in the open ocean thermocline in many ocean regions since the 1960s, with a likely expansion of tropical oxygen minimum zones in recent decades. {WGI SPM B.5, TS2.8.5, 3.8.1, 3.8.2, 3.8.3, 3.8.5, Figure 3.20}
Edit1.1.3. Cryosphere
Over the last two decades, the Greenland and Antarctic ice sheets have been losing mass (high confidence). Glaciers have continued to shrink almost worldwide (high confidence). Northern Hemisphere spring snow cover has continued to decrease in extent (high confidence). There is high confidence that there are strong regional differences in the trend in Antarctic sea ice extent, with a very likely increase in total extent. {WGI SPM B.3, 4.2–4.7}
Glaciers have lost mass and contributed to sea level rise throughout the 20th century. The rate of ice mass loss from the Greenland ice sheet has very likely substantially increased over the period 1992 to 2011, resulting in a larger mass loss over 2002 to 2011 than over 1992 to 2011. The rate of ice mass loss from the Antarctic ice sheet, mainly from the northern Antarctic Peninsula and the Amundsen Sea sector of West Antarctica, is also likely larger over 2002 to 2011. {WGI SPM B.3, SPM B.4, 4.3.3, 4.4.2, 4.4.3}
The annual mean Arctic sea ice extent decreased over the period 1979 (when satellite observations commenced) to 2012. The rate of decrease was very likely in the range 3.5 to 4.1% per decade. Arctic sea ice extent has decreased in every season and in every successive decade since 1979, with the most rapid decrease in decadal mean extent in summer (high confidence). For the summer sea ice minimum, the decrease was very likely in the range of 9.4 to 13.6% per decade (range of 0.73 to 1.07 million km2 per decade) (see Figure 1.1). It is very likely that the annual mean Antarctic sea ice extent increased in the range of 1.2 to 1.8% per decade (range of 0.13 to 0.20 million km2 per decade) between 1979 and 2012. However, there is high confidence that there are strong regional differences in Antarctica, with extent increasing in some regions and decreasing in others. {WGI SPM B.5, 4.2.2, 4.2.3}
There is very high confidence that the extent of Northern Hemisphere snow cover has decreased since the mid-20th century by 1.6 [0.8 to 2.4] % per decade for March and April, and 11.7% per decade for June, over the 1967 to 2012 period. There is high confidence that permafrost temperatures have increased in most regions of the Northern Hemisphere since the early 1980s, with reductions in thickness and areal extent in some regions. The increase in permafrost temperatures has occurred in response to increased surface temperature and changing snow cover. {WGI SPM B.3, 4.5, 4.7.2}
Edit1.1.4. Sea level
Over the period 1901–2010, global mean sea level rose by 0.19 [0.17 to 0.21] m (Figure 1.1). The rate of sea level rise since the mid-19th century has been larger than the mean rate during the previous two millennia (high confidence). {WGI SPM B.4, 3.7.2, 5.6.3, 13.2}
It is very likely that the mean rate of global averaged sea level rise was 1.7 [1.5 to 1.9] mm/yr between 1901 and 2010 and 3.2 [2.8 to 3.6] mm/yr between 1993 and 2010. Tide gauge and satellite altimeter data are consistent regarding the higher rate during the latter period. It is likely that similarly high rates occurred between 1920 and 1950. {WGI SPM B.4, 3.7, 13.2}
Since the early 1970s, glacier mass loss and ocean thermal expansion from warming together explain about 75% of the observed global mean sea level rise (high confidence). Over the period 1993–2010, global mean sea level rise is, with high confidence, consistent with the sum of the observed contributions from ocean thermal expansion, due to warming, from changes in glaciers, the Greenland ice sheet, the Antarctic ice sheet and land water storage {WGI SPM B.4, 13.3.6}
Rates of sea level rise over broad regions can be several times larger or smaller than the global mean sea level rise for periods of several decades, due to fluctuations in ocean circulation. Since 1993, the regional rates for the Western Pacific are up to three times larger than the global mean, while those for much of the Eastern Pacific are near zero or negative. {WGI 3.7.3, FAQ 13.1}
There is very high confidence that maximum global mean sea level during the last interglacial period (129,000 to 116,000 years ago) was, for several thousand years, at least 5 m higher than present and high confidence that it did not exceed 10 m above present. During the last interglacial period, the Greenland ice sheet very likely contributed between 1.4 and 4.3 m to the higher global mean sea level, implying with medium confidence an additional contribution from the Antarctic ice sheet. This change in sea level occurred in the context of different orbital forcing and with high-latitude surface temperature, averaged over several thousand years, at least 2°C warmer than present (high confidence). {WGI SPM B.4, 5.3.4, 5.6.2, 13.2.1}
EditBox 1.1 Recent temperature trends and their implications
EditThe observed reduction in surface warming trend over the period 1998 to 2012 as compared to the period 1951 to 2012, is due in roughly equal measure to a reduced trend in radiative forcing and a cooling contribution from natural internal variability, which includes a possible redistribution of heat within the ocean (medium confidence). The rate of warming of the observed global mean surface temperature over the period from 1998 to 2012 is estimated to be around one-third to one-half of the trend over the period from 1951 to 2012 (Box 1.1, Figures 1a and 1c). Even with this reduction in surface warming trend, the climate system has very likely continued to accumulate heat since 1998 (Figure 1.2), and sea level has continued to rise (Figure 1.1). {WGI SPM D.1, Box 9.2}
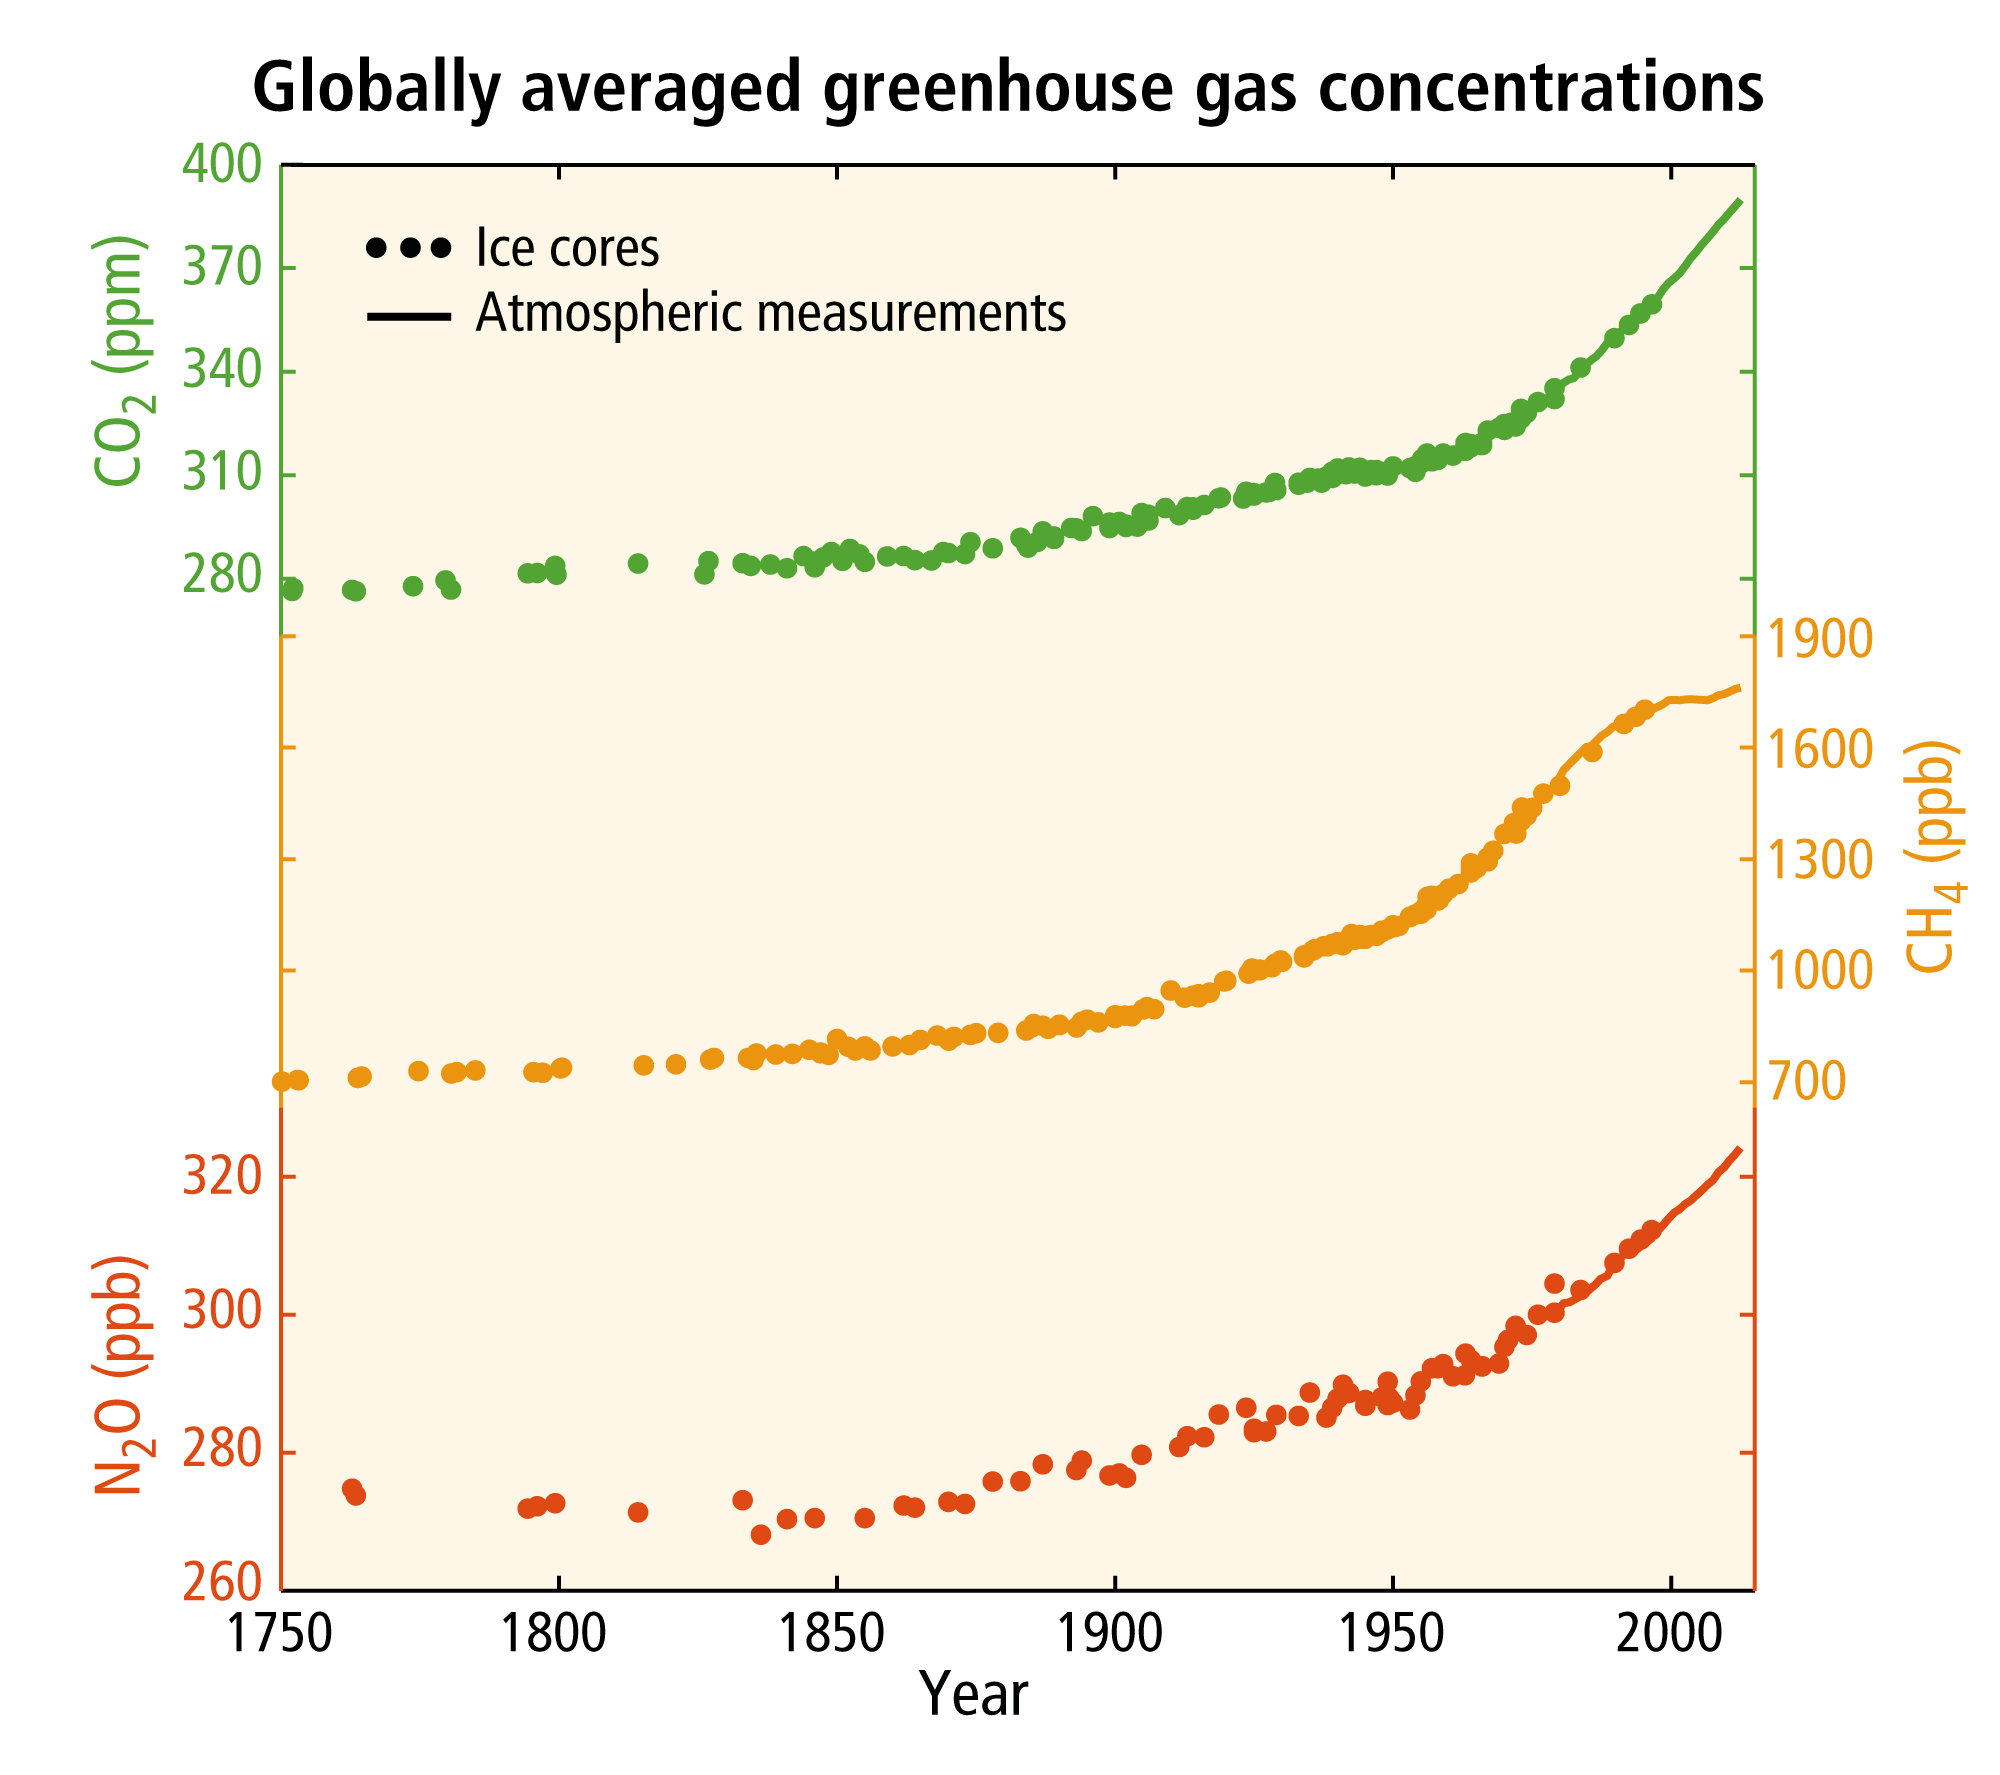
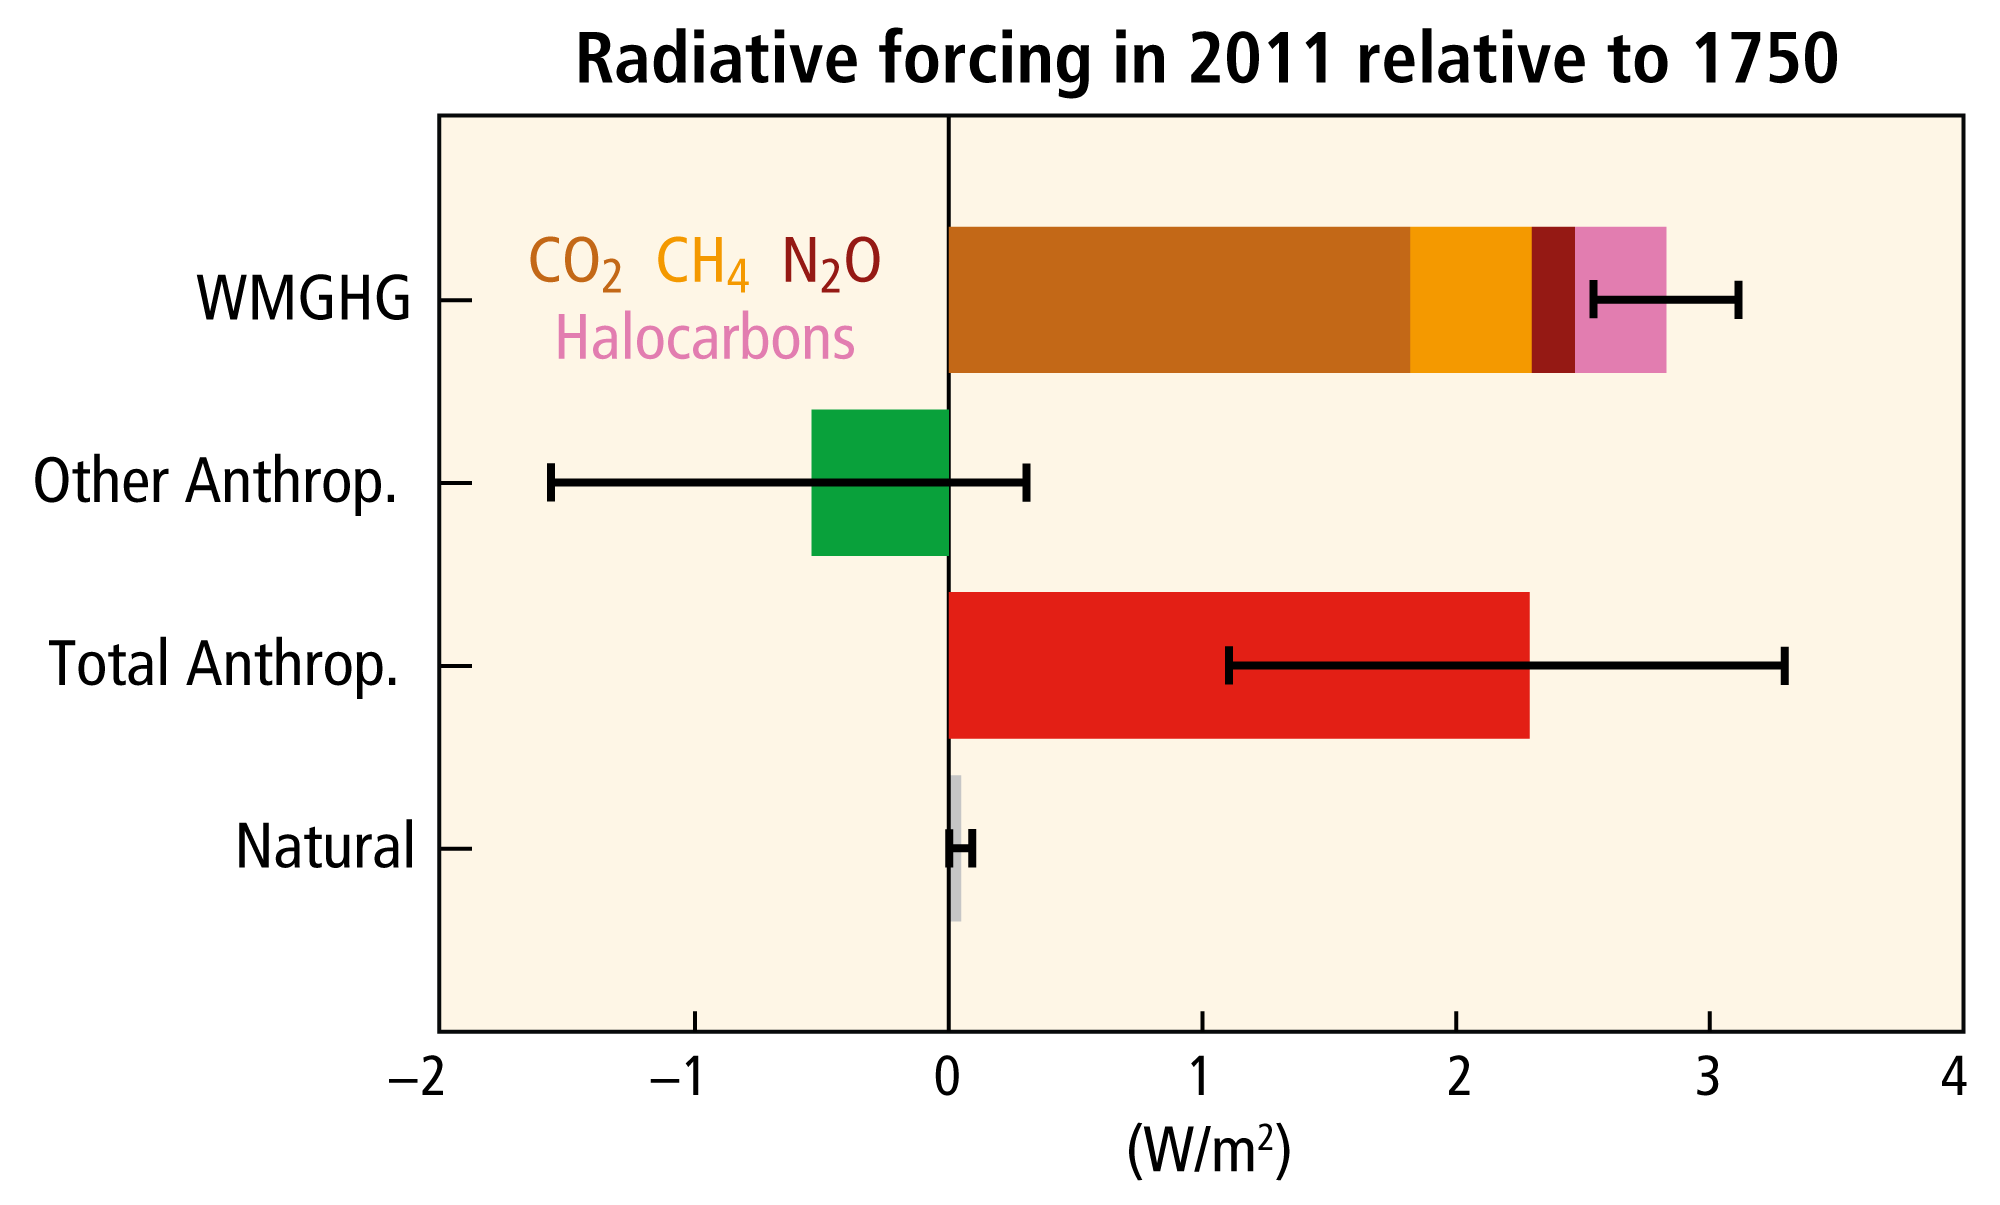
The radiative forcing of the climate system has continued to increase during the 2000s, as has its largest contributor, the atmospheric concentration of CO2. However, the radiative forcing has been increasing at a lower rate over the period from 1998 to 2011, compared to 1984 to 1998 or 1951 to 2011, due to cooling effects from volcanic eruptions and the cooling phase of the solar cycle over the period from 2000 to 2009. There is, however, low confidence in quantifying the role of the forcing trend in causing the reduction in the rate of surface warming. {WGI 8.5.2, Box 9.2}
For the period from 1998 to 2012, 111 of the 114 available climate-model simulations show a surface warming trend larger than the observations (Box 1.1, Figure 1a). There is medium confidence that this difference between models and observations is to a substantial degree caused by natural internal climate variability, which sometimes enhances and sometimes counteracts the long-term externally forced warming trend (compare Box 1.1, Figures 1a and 1b; during the period from 1984 to 1998, most model simulations show a smaller warming trend than observed). Natural internal variability thus diminishes the relevance of short trends for long-term climate change. The difference between models and observations may also contain contributions from inadequacies in the solar, volcanic and aerosol forcings used by the models and, in some models, from an overestimate of the response to increasing greenhouse gas and other anthropogenic forcing (the latter dominated by the effects of aerosols). {WGI 2.4.3, WGI Box 9.2, 9.4.1, 10.3.1.1}
For the longer period from 1951 to 2012, simulated surface warming trends are consistent with the observed trend (very high confidence) (Box 1.1, Figure 1c). Furthermore, the independent estimates of radiative forcing, of surface warming and of observed heat storage (the latter available since 1970) combine to give a heat budget for the Earth that is consistent with the assessed likely range of equilibrium climate sensitivity (1.5–4.5 ºC)2. The record of observed climate change has thus allowed characterization of the basic properties of the climate system that have implications for future warming, including the equilibrium climate sensitivity and the transient climate response (see Topic 2). {WGI Box 9.2, 10.8.1, 10.8.2, Box 12.2, Box 13.1}
Box 1.1, Figure 1 | Trends in the global mean surface temperature over the periods from 1998 to 2012 (a), 1984 to 1998 (b), and 1951 to 2012 (c), from observations (red) and the 114 available simulations with current-generation climate models (grey bars). The height of each grey bar indicates how often a trend of a certain magnitude (in °C per decade) occurs among the 114 simulations. The width of the red-hatched area indicates the statistical uncertainty that arises from constructing a global average from individual station data. This observational uncertainty differs from the one quoted in the text of Section 1.1.1; there, an estimate of natural internal variability is also included. Here, by contrast, the magnitude of natural internal variability is characterised by the spread of the model ensemble. {based on WGI Box 9.2, Figure 1}
