
671
9
Buildings
Coordinating Lead Authors:
Oswaldo Lucon (Brazil), Diana Ürge-Vorsatz (Hungary)
Lead Authors:
Azni Zain Ahmed (Malaysia), Hashem Akbari (USA / Canada), Paolo Bertoldi (Italy), Luisa F. Cabeza
(Spain), Nicholas Eyre (UK), Ashok Gadgil (India / USA) , L. D. Danny Harvey (Canada), Yi Jiang
(China), Enoch Liphoto (South Africa), Sevastianos Mirasgedis (Greece), Shuzo Murakami (Japan),
Jyoti Parikh (India), Christopher Pyke (USA), Maria Virginia Vilariño (Argentina)
Contributing Authors:
Peter Graham (Australia / USA / France), Ksenia Petrichenko (Hungary), Jiyong Eom (Republic of
Korea), Agnes Kelemen (Hungary), Volker Krey (IIASA / Germany)
Review Editors:
Marilyn Brown (USA), Tamás Pálvölgyi (Hungary)
Chapter Science Assistants:
Fonbeyin Henry Abanda (UK), Katarina Korytarova (Slovakia)
This chapter should be cited as:
Lucon O., D. Ürge-Vorsatz, A. Zain Ahmed, H. Akbari, P. Bertoldi, L. F. Cabeza, N. Eyre, A. Gadgil, L. D. D. Harvey, Y. Jiang, E.
Liphoto, S. Mirasgedis, S. Murakami, J. Parikh, C. Pyke, and M. V. Vilariño, 2014: Buildings. In: Climate Change 2014: Mitiga-
tion of Climate Change. Contribution of Working Group III to the Fifth Assessment Report of the Intergovernmental Panel
on Climate Change [Edenhofer, O., R. Pichs-Madruga, Y. Sokona, E. Farahani, S. Kadner, K. Seyboth, A. Adler, I. Baum, S.
Brunner, P. Eickemeier, B. Kriemann, J. Savolainen, S. Schlömer, C. von Stechow, T. Zwickel and J.C. Minx (eds.)]. Cambridge
University Press, Cambridge, United Kingdom and New York, NY, USA.

672672
Buildings
9
Chapter 9
Contents
Executive Summary � � � � � � � � � � � � � � � � � � � � � � � � � � � � � � � � � � � � � � � � � � � � � � � � � � � � � � � � � � � � � � � � � � � � � � � � � � � � � � � � � � � � � � � � � � � � � � � � � � � � � � � � � � � � � � � 675
9�1 Introduction � � � � � � � � � � � � � � � � � � � � � � � � � � � � � � � � � � � � � � � � � � � � � � � � � � � � � � � � � � � � � � � � � � � � � � � � � � � � � � � � � � � � � � � � � � � � � � � � � � � � � � � � � � � 677
9�2 New developments in emission trends and drivers � � � � � � � � � � � � � � � � � � � � � � � � � � � � � � � � � � � � � � � � � � � � � � � � � � � � � � � 678
9�2�1 Energy and GHG emissions from buildings
� � � � � � � � � � � � � � � � � � � � � � � � � � � � � � � � � � � � � � � � � � � � � � � � � � � � � � � � � � � � � � � � � 678
9�2�2 Trends and drivers of thermal energy uses in buildings
� � � � � � � � � � � � � � � � � � � � � � � � � � � � � � � � � � � � � � � � � � � � � � � � � � � � 681
9�2�3 Trends and drivers in energy consumption of appliances in buildings
� � � � � � � � � � � � � � � � � � � � � � � � � � � � � � � � � � � � � 683
9�3 Mitigation technology options and practices, behavioural aspects � � � � � � � � � � � � � � � � � � � � � � � � � � � � � � � � � � 686
9�3�1 Key points from AR4
� � � � � � � � � � � � � � � � � � � � � � � � � � � � � � � � � � � � � � � � � � � � � � � � � � � � � � � � � � � � � � � � � � � � � � � � � � � � � � � � � � � � � � � � � 686
9�3�2 Technological developments since AR4
� � � � � � � � � � � � � � � � � � � � � � � � � � � � � � � � � � � � � � � � � � � � � � � � � � � � � � � � � � � � � � � � � � � � � 686
9�3�3 Exemplary new buildings
� � � � � � � � � � � � � � � � � � � � � � � � � � � � � � � � � � � � � � � � � � � � � � � � � � � � � � � � � � � � � � � � � � � � � � � � � � � � � � � � � � � � 687
9.3.3.1 Energy intensity of new high-performance buildings
. . . . . . . . . . . . . . . . . . . . . . . . . . . . . . . . . . . . . . . . . . . . . . . . . 687
9.3.3.2 Monitoring and commissioning of new and existing buildings
. . . . . . . . . . . . . . . . . . . . . . . . . . . . . . . . . . . . . . 688
9.3.3.3 Zero energy / carbon and energy plus buildings
. . . . . . . . . . . . . . . . . . . . . . . . . . . . . . . . . . . . . . . . . . . . . . . . . . . . . . . 689
9.3.3.4 Incremental cost of low-energy buildings
. . . . . . . . . . . . . . . . . . . . . . . . . . . . . . . . . . . . . . . . . . . . . . . . . . . . . . . . . . . . 689
9�3�4 Retrofits of existing buildings
� � � � � � � � � � � � � � � � � � � � � � � � � � � � � � � � � � � � � � � � � � � � � � � � � � � � � � � � � � � � � � � � � � � � � � � � � � � � � � � 690
9.3.4.1 Energy savings
. . . . . . . . . . . . . . . . . . . . . . . . . . . . . . . . . . . . . . . . . . . . . . . . . . . . . . . . . . . . . . . . . . . . . . . . . . . . . . . . . . . . . . . . 690
9.3.4.2 Incremental cost
. . . . . . . . . . . . . . . . . . . . . . . . . . . . . . . . . . . . . . . . . . . . . . . . . . . . . . . . . . . . . . . . . . . . . . . . . . . . . . . . . . . . . . 690
9�3�5 Appliances, consumer electronics, office equipment, and lighting
� � � � � � � � � � � � � � � � � � � � � � � � � � � � � � � � � � � � � � � � � 690
9�3�6 Halocarbons
� � � � � � � � � � � � � � � � � � � � � � � � � � � � � � � � � � � � � � � � � � � � � � � � � � � � � � � � � � � � � � � � � � � � � � � � � � � � � � � � � � � � � � � � � � � � � � � � � � 692
9�3�7 Avoiding mechanical heating, cooling, and ventilation systems
� � � � � � � � � � � � � � � � � � � � � � � � � � � � � � � � � � � � � � � � � � � 693
9�3�8 Uses of biomass
� � � � � � � � � � � � � � � � � � � � � � � � � � � � � � � � � � � � � � � � � � � � � � � � � � � � � � � � � � � � � � � � � � � � � � � � � � � � � � � � � � � � � � � � � � � � � 693
9�3�9 Embodied energy and building materials lifecycle
� � � � � � � � � � � � � � � � � � � � � � � � � � � � � � � � � � � � � � � � � � � � � � � � � � � � � � � � � 694
9�3�10 Behavioural and lifestyle impacts
� � � � � � � � � � � � � � � � � � � � � � � � � � � � � � � � � � � � � � � � � � � � � � � � � � � � � � � � � � � � � � � � � � � � � � � � � � � 694

673673
Buildings
9
Chapter 9
9�4 Infrastructure and systemic perspectives� � � � � � � � � � � � � � � � � � � � � � � � � � � � � � � � � � � � � � � � � � � � � � � � � � � � � � � � � � � � � � � � � � � � � 696
9�4�1 Urban form and energy supply infrastructure
� � � � � � � � � � � � � � � � � � � � � � � � � � � � � � � � � � � � � � � � � � � � � � � � � � � � � � � � � � � � � � 696
9.4.1.1 District heating and cooling networks
. . . . . . . . . . . . . . . . . . . . . . . . . . . . . . . . . . . . . . . . . . . . . . . . . . . . . . . . . . . . . . . . 696
9.4.1.2 Electricity infrastructure interactions
. . . . . . . . . . . . . . . . . . . . . . . . . . . . . . . . . . . . . . . . . . . . . . . . . . . . . . . . . . . . . . . . . 697
9.4.1.3 Thermal energy storage
. . . . . . . . . . . . . . . . . . . . . . . . . . . . . . . . . . . . . . . . . . . . . . . . . . . . . . . . . . . . . . . . . . . . . . . . . . . . . . . 697
9�4�2 Path dependencies and lock-in
� � � � � � � � � � � � � � � � � � � � � � � � � � � � � � � � � � � � � � � � � � � � � � � � � � � � � � � � � � � � � � � � � � � � � � � � � � � � � � 697
9�5 Climate change feedback and interaction with adaptation � � � � � � � � � � � � � � � � � � � � � � � � � � � � � � � � � � � � � � � � � � � � � 697
9�6 Costs and potentials � � � � � � � � � � � � � � � � � � � � � � � � � � � � � � � � � � � � � � � � � � � � � � � � � � � � � � � � � � � � � � � � � � � � � � � � � � � � � � � � � � � � � � � � � � � � � � � � 699
9�6�1 Summary of literature on aggregated mitigation potentials by key identity
� � � � � � � � � � � � � � � � � � � � � � � � � � � � � � 699
9�6�2 Overview of option-specific costs and potentials
� � � � � � � � � � � � � � � � � � � � � � � � � � � � � � � � � � � � � � � � � � � � � � � � � � � � � � � � � � 702
9.6.2.1 Costs of very high performance new construction
. . . . . . . . . . . . . . . . . . . . . . . . . . . . . . . . . . . . . . . . . . . . . . . . . . . . 702
9.6.2.2 Costs of deep retrofits
. . . . . . . . . . . . . . . . . . . . . . . . . . . . . . . . . . . . . . . . . . . . . . . . . . . . . . . . . . . . . . . . . . . . . . . . . . . . . . . . 704
9�6�3 Assessment of key factors influencing robustness and sensitivity of costs and potentials
� � � � � � � � � � � � � � � 704
9�7 Co-benefits, risks and spillovers � � � � � � � � � � � � � � � � � � � � � � � � � � � � � � � � � � � � � � � � � � � � � � � � � � � � � � � � � � � � � � � � � � � � � � � � � � � � � � � � � 705
9�7�1 Overview
� � � � � � � � � � � � � � � � � � � � � � � � � � � � � � � � � � � � � � � � � � � � � � � � � � � � � � � � � � � � � � � � � � � � � � � � � � � � � � � � � � � � � � � � � � � � � � � � � � � � � 705
9�7�2 Socio-economic effects
� � � � � � � � � � � � � � � � � � � � � � � � � � � � � � � � � � � � � � � � � � � � � � � � � � � � � � � � � � � � � � � � � � � � � � � � � � � � � � � � � � � � � � 705
9.7.2.1 Impacts on employment
. . . . . . . . . . . . . . . . . . . . . . . . . . . . . . . . . . . . . . . . . . . . . . . . . . . . . . . . . . . . . . . . . . . . . . . . . . . . . . 705
9.7.2.2 Energy security
. . . . . . . . . . . . . . . . . . . . . . . . . . . . . . . . . . . . . . . . . . . . . . . . . . . . . . . . . . . . . . . . . . . . . . . . . . . . . . . . . . . . . . . . 707
9.7.2.3 Benefits related to workplace productivity
. . . . . . . . . . . . . . . . . . . . . . . . . . . . . . . . . . . . . . . . . . . . . . . . . . . . . . . . . . . 707
9.7.2.4 Rebound effects
. . . . . . . . . . . . . . . . . . . . . . . . . . . . . . . . . . . . . . . . . . . . . . . . . . . . . . . . . . . . . . . . . . . . . . . . . . . . . . . . . . . . . . . 707
9.7.2.5 Fuel poverty alleviation
. . . . . . . . . . . . . . . . . . . . . . . . . . . . . . . . . . . . . . . . . . . . . . . . . . . . . . . . . . . . . . . . . . . . . . . . . . . . . . . 708
9�7�3 Environmental and health effects
� � � � � � � � � � � � � � � � � � � � � � � � � � � � � � � � � � � � � � � � � � � � � � � � � � � � � � � � � � � � � � � � � � � � � � � � � � � 708
9.7.3.1 Health co-benefits due to improved indoor conditions
. . . . . . . . . . . . . . . . . . . . . . . . . . . . . . . . . . . . . . . . . . . . . . . 708
9.7.3.2 Health and environmental co-benefits due to reduced outdoor air pollution
. . . . . . . . . . . . . . . . . . . . . . . . 709
9.7.3.3 Other environmental benefits
. . . . . . . . . . . . . . . . . . . . . . . . . . . . . . . . . . . . . . . . . . . . . . . . . . . . . . . . . . . . . . . . . . . . . . . . . 709
9�8 Barriers and opportunities � � � � � � � � � � � � � � � � � � � � � � � � � � � � � � � � � � � � � � � � � � � � � � � � � � � � � � � � � � � � � � � � � � � � � � � � � � � � � � � � � � � � � � � � 709

674674
Buildings
9
Chapter 9
9�9 Sectoral implication of transformation pathways and sustainable development � � � � � � � � � � � � � � � � 710
9�9�1 Introduction
� � � � � � � � � � � � � � � � � � � � � � � � � � � � � � � � � � � � � � � � � � � � � � � � � � � � � � � � � � � � � � � � � � � � � � � � � � � � � � � � � � � � � � � � � � � � � � � � � � 710
9�9�2 Overview of building sector energy projections
� � � � � � � � � � � � � � � � � � � � � � � � � � � � � � � � � � � � � � � � � � � � � � � � � � � � � � � � � � � � 710
9�9�3 Key mitigation strategies as highlighted by the pathway analysis
� � � � � � � � � � � � � � � � � � � � � � � � � � � � � � � � � � � � � � � � 712
9�9�4 Summary and general observations of global building final energy use
� � � � � � � � � � � � � � � � � � � � � � � � � � � � � � � � � � 714
9�10 Sectoral policies � � � � � � � � � � � � � � � � � � � � � � � � � � � � � � � � � � � � � � � � � � � � � � � � � � � � � � � � � � � � � � � � � � � � � � � � � � � � � � � � � � � � � � � � � � � � � � � � � � � � � � 715
9�10�1 Policies for energy efficiency in buildings
� � � � � � � � � � � � � � � � � � � � � � � � � � � � � � � � � � � � � � � � � � � � � � � � � � � � � � � � � � � � � � � � � � 715
9.10.1.1 Policy packages
. . . . . . . . . . . . . . . . . . . . . . . . . . . . . . . . . . . . . . . . . . . . . . . . . . . . . . . . . . . . . . . . . . . . . . . . . . . . . . . . . . . . . . . 718
9.10.1.2 A holistic approach
. . . . . . . . . . . . . . . . . . . . . . . . . . . . . . . . . . . . . . . . . . . . . . . . . . . . . . . . . . . . . . . . . . . . . . . . . . . . . . . . . . . 718
9�10�2 Emerging policy instruments in buildings
� � � � � � � � � � � � � � � � � � � � � � � � � � � � � � � � � � � � � � � � � � � � � � � � � � � � � � � � � � � � � � � � � � 719
9.10.2.1 New developments in building codes (ordinance, regulation, or by-laws)
. . . . . . . . . . . . . . . . . . . . . . . . . . . 719
9.10.2.2 Energy efficiency obligation schemes and ‘white’ certificates
. . . . . . . . . . . . . . . . . . . . . . . . . . . . . . . . . . . . . . . . 719
9�10�3 Financing opportunities
� � � � � � � � � � � � � � � � � � � � � � � � � � � � � � � � � � � � � � � � � � � � � � � � � � � � � � � � � � � � � � � � � � � � � � � � � � � � � � � � � � � � � 720
9.10.3.1 New financing schemes for deep retrofits
. . . . . . . . . . . . . . . . . . . . . . . . . . . . . . . . . . . . . . . . . . . . . . . . . . . . . . . . . . . . 720
9.10.3.2 Opportunities in financing for green buildings
. . . . . . . . . . . . . . . . . . . . . . . . . . . . . . . . . . . . . . . . . . . . . . . . . . . . . . . 720
9�10�4 Policies in developing countries
� � � � � � � � � � � � � � � � � � � � � � � � � � � � � � � � � � � � � � � � � � � � � � � � � � � � � � � � � � � � � � � � � � � � � � � � � � � � � 721
9�11 Gaps in knowledge and data � � � � � � � � � � � � � � � � � � � � � � � � � � � � � � � � � � � � � � � � � � � � � � � � � � � � � � � � � � � � � � � � � � � � � � � � � � � � � � � � � � � � � 721
9�12 Frequently Asked Questions � � � � � � � � � � � � � � � � � � � � � � � � � � � � � � � � � � � � � � � � � � � � � � � � � � � � � � � � � � � � � � � � � � � � � � � � � � � � � � � � � � � � � � 722
References � � � � � � � � � � � � � � � � � � � � � � � � � � � � � � � � � � � � � � � � � � � � � � � � � � � � � � � � � � � � � � � � � � � � � � � � � � � � � � � � � � � � � � � � � � � � � � � � � � � � � � � � � � � � � � � � � � � � � � � � � � 723

675675
Buildings
9
Chapter 9
Executive Summary
In 2010 buildings accounted for 32 % of total global final
energy use, 19 % of energy-related GHG emissions (including
electricity-related), approximately one-third of black carbon
emissions, and an eighth to a third of F-gases (medium evidence,
medium agreement). This energy use and related emissions may dou-
ble or potentially even triple by mid-century due to several key trends.
A very important trend is the increased access for billions of people
in developing countries to adequate housing, electricity, and improved
cooking facilities. The ways in which these energy-related needs will be
provided will significantly determine trends in building energy use and
related emissions. In addition, population growth, migration to cities,
household size changes, and increasing levels of wealth and lifestyle
changes globally will all contribute to significant increases in building
energy use. The substantial new construction that is taking place in
developing countries represents both a significant risk and opportunity
from a mitigation perspective. [Sections 9.1, 9.2]
In contrast to a doubling or tripling, final energy use may stay
constant or even decline by mid-century, as compared to today’s
levels, if today’s cost-effective best practices and technologies
are broadly diffused (robust evidence, high agreement). The technol-
ogy solutions to realize this potential exist and are well demonstrated.
Recent advances in technology, design practices and know-how, cou-
pled with behavioural changes, can achieve a two to ten-fold reduction
in energy requirements of individual new buildings and a two to four-
fold reduction for individual existing buildings largely cost-effectively or
sometimes even at net negative costs. New improved energy efficiency
technologies have been developed as existing energy efficiency oppor-
tunities have been taken up, so that the potential for cost-effective
energy efficiency improvement has not been diminishing. Recent devel-
opments in technology and know-how enable construction and retrofit
of very low- and zero-energy buildings, often at little marginal invest-
ment cost, typically paying back well within the building lifetime (robust
evidence, high agreement). In existing buildings 50 – 90 % energy sav-
ings have been achieved throughout the world through deep retrofits
(medium evidence, high agreement). Energy efficient appliances, light-
ing, information communication (ICT), and media technologies can
reduce the substantial increases in electricity use that are expected due
to the proliferation of equipment types used and their increased owner-
ship and use (robust evidence, high agreement). [9.2, 9.3]
Strong barriers hinder the market uptake of these cost-effec-
tive opportunities, and large potentials will remain untapped
without adequate policies (robust evidence, high agreement). These
barriers include imperfect information, split incentives, lack of aware-
ness, transaction costs, inadequate access to financing, and industry
fragmentation. In developing countries, corruption, inadequate service
levels, subsidized energy prices, and high discount rates are additional
barriers. Market forces alone are not likely to achieve the necessary
transformation without external stimuli. Policy intervention addressing
all stages of the building and appliance lifecycle and use, plus new
business and financial models are essential. [9.8, 9.10]
There is a broad portfolio of effective policy instruments avail-
able to remove these barriers, some of them being implemented
also in developing countries, thus saving emissions at large
negative costs (robust evidence, high agreement). Overall, the his-
tory of energy efficiency programmes in buildings shows that 25 – 30 %
efficiency improvements have been available at costs substantially
lower than marginal supply. Dynamic developments in building-related
policies in some developed countries have demonstrated the effec-
tiveness of such instruments, as total building energy use has started
to decrease while accommodating continued economic, and in some
cases, population growth. Building codes and appliance standards with
strong energy efficiency requirements that are well enforced, tightened
over time, and made appropriate to local climate and other conditions
have been among the most environmentally and cost-effective. Net
zero energy buildings are technically demonstrated, but may not always
be the most cost- and environmentally effective solutions. Experience
shows that pricing is less effective than programmes and regulation
(medium evidence, medium agreement). Financing instruments, poli-
cies, and other opportunities are available to improve energy efficiency
in buildings, but the results obtained to date are still insufficient to
deliver the full potential (medium evidence, medium agreement). Com-
bined and enhanced, these approaches could provide significant further
improvements in terms of both enhanced energy access and energy
efficiency. Delivering low-carbon options raises major challenges for
data, research, education, capacity building, and training. [9.10]
Due to the very long lifespans of buildings and retrofits there is
a very significant lock-in risk pointing to the urgency of ambi-
tious and immediate measures (robust evidence, medium agree-
ment). Even if the most ambitious of currently planned policies are
implemented, approximately 80 % of 2005 energy use in buildings
globally will be ‘locked in’ by 2050 for decades, compared to a sce-
nario where today’s best practice buildings become the standard in
new building construction and existing building retrofit. As a result,
the urgent adoption of state-of-the-art performance standards, in both
new and retrofit buildings, avoids locking-in carbon intensive options
for several decades. [9.4]
In addition to technologies and architecture, behaviour, life-
style, and culture have a major effect on buildings’ energy use;
three- to five-fold difference in energy use has been shown for
provision of similar building-related energy service levels (limited
evidence, high agreement). In developed countries, evidence indicates
that behaviours informed by awareness of energy and climate issues can
reduce demand by up to 20 % in the short term and 50 % of present
levels by 2050. Alternative development pathways exist that can moder-
ate the growth of energy use in developing countries through the pro-
vision of high levels of building services at much lower energy inputs,
incorporating certain elements of traditional lifestyles and architecture,
and can avoid such trends. In developed countries, the concept of ‘suf-

676676
Buildings
9
Chapter 9
ficiency’ has also been emerging, going beyond pure ‘efficiency’. Reduc-
ing energy demand includes rationally meeting floor space needs. [9.3]
Beyond energy cost savings, most mitigation options in this
sector have other significant and diverse co-benefits (robust evi-
dence, high agreement). Taken together, the monetizable co-benefits of
many energy efficiency measures alone often substantially exceed the
energy cost savings and possibly the climate benefits (medium evidence,
medium agreement), with the non-monetizable benefits often also
being significant (robust evidence, high agreement). These benefits offer
attractive entry points for action into policy-making, even in countries or
jurisdictions where financial resources for mitigation are limited (robust
evidence, high agreement). These entry points include, but are not lim-
ited to, energy security; lower need for energy subsidies; health (due to
Table 9�1 | Summary of chapter’s main findings organized by major mitigation strategies (identities)
Carbon efficiency Energy efficiency of technology System / (infrastructure) efficiency
Service demand
reduction
Mitigation
options
Building integrated RES
(BiRES, BiPV). Fuel switching
to low-carbon fuels such as
electricity (9.4.1.2). Use of
natural refrigerants to reduce
halocarbon emissions (9.3.6).
Advanced biomass stoves (9.3.8).
High-performance building envelope (HPE).
Efficient appliances (EA). Efficient lighting (EL).
Efficient Heating, Ventilation, and Air-Conditioning
systems (eHVAC). Building automation and control
systems (BACS). Daylighting, heat pumps, indirect
evaporative cooling to replace chillers in dry
climates, advances in digital building automation
and control systems, smart meters and grids (9.3.2).
Solar-powered desiccant dehumidification.
Passive House standard (PH). Nearly / net zero and
energy plus energy buildings (NZEB) (9.3.3.3).
Integrated Design Process (IDP). Urban planning
(UP), (9.4.1). District heating / cooling (DH / C).
Commissioning (C). Advanced building control
systems (9.3.3.2). High efficiency distributed
energy systems, co-generation, trigeneration,
load levelling, diurnal thermal storage,
advanced management (9.4.1.1). ‘Smart-grids’
(9.4.1.2). Utilization of waste heat (9.4.1.1)
Behavioural change
(BC). Lifestyle
change (LSC). Smart
metering (9.4.1.2)
Potential
reductions
of energy
use / emissions
(versus
baseline BAU)
Solar electricity generation
through buildings’ roof-top
photo voltaic (PV) installations:
energy savings – 15 to – 58 %
relative to BAU (Table 9.4)
– 9.5 % to – 68 % energy savings relative to
BAU (Table 9.4). Energy savings from advanced
appliances: Ovens: – 45 %; Microwave ovens:
– 75 %; Dishwashers: up to – 45 %; Clothes washers:
– 28 % (by 2030, globally); Clothes dryers: factor
of 2 reduction; Air-conditioners: – 50 to – 75 %;
Ceiling fans: – 50 to – 57 %; Office computers/
monitors: – 40 %; Circulation pumps for hydronic
heating / cooling: – 40 % (by 2020, EU); Residential
water heaters: factor of 4 improvement (Table
9.3); Fuel savings: – 30 to – 60 %; Indoor air
pollution levels from advanced biomass stoves (as
compared to open fires): – 80 to – 90 % (9.3.8).
– 30 to – 70 % CO2 of BAU. PH & NZEB (new
versus conventional building): – 83 % (residential
heating energy) and – 50 % (commercial heating &
cooling energy); Deep retrofits (DR): – 40 to – 80 %
(residential, Europe); IDP: up to – 70 % (final energy
by 2050; Table 9.4); Potential global building final
energy demand reduction: – 5 % to – 27 % (IAMs ),
– 14 % to – 75 % (bottom up models) (Fig. 9.21).
Energy savings by building type: (i) Detached
single-family homes: – 50 – 75 % (total energy use);
(ii) Multi-family housing: – 80 to – 90 % (space
heating requirements); (iii) Multi-family housing
in developing countries: – 30 % (cooling energy
use), – 60 % (heating energy); (iv) Commercial
buildings: – 25 % to – 50 % (total HVAC), – 30
to – 60 % (lighting retrofits) (9.3.4.1).
– 20 to – 40 % of
BAU. LSC about
– 40 % electricity
use (Table 9.4).
Cost-
effectiveness
– Retrofit of separate measures: CCE: 0.01 – 0.10
USD
2010
/ kWh (Fig. 9.13). Efficient Appliances:
CCE: – 0.09 USD
2010
/ kWh / yr (9.3.4.2)
PH & NZEB (new, EU&USA): CCE: 0.2 – 0.7
USD
2010
/ kWh (Figure 9.11, 9.12); DR
(with energy savings of 60 – 75 %): CCE:
0.05 – 0.25 USD
2010
/ kWh (Fig. 9.13)
Co-benefits
(CB),
adverse side
effects (AE)
CB: Energy security; lower need for energy subsidies; health and environmental benefits
CB: Employment impact;
enhanced asset value of buildings;
energy / fuel poverty alleviation.
AE: Energy access / fuel poverty
CB: Employment; energy / fuel poverty alleviation;
improved productivity / competitiveness;
asset value of buildings; improved quality
of life. AE: rebound and lock-in effects
CB: Employment impact; improved productivity
and competitiveness; enhanced asset values of
buildings; improved quality of life. AE: Rebound
effect, lower lifecycle energy use of low-energy
buildings in comparison to the conventional (9.3.9)
Key barriers Suboptimal measures, subsidies
to conventional fuels
Transaction costs, access to financing, principal
agent problems, fragmented market and
institutional structures, poor feedback
Energy and infrastructure lock-in (9.4.2),
path-dependency (9.4.2) fragmented
market and institutional structures,
poor enforcement of regulations
Imperfect information,
risk aversion, cognitive
and behavioural
patterns, lack of
awareness, poor
personnel qualification
Key policies Carbon tax, feed-in tariffs
extended for small capacity; soft
loans for renewable technologies
Public procurement, appliance standards,
tax exemptions, soft loans
Building codes, preferential loans, subsidised
financing schemes, ESCOs, EPCs, suppliers‘
obligations, white certificates, IDP into Urban
Planning, Importance of policy packages
rather than single instruments (9.10.1.2)
Awareness raising,
education, energy
audits, energy labelling,
building certificates
& ratings, energy or
carbon tax, personal
carbon allowance

677677
Buildings
9
Chapter 9
reduced indoor and outdoor air pollution as well as fuel poverty alle-
viation) and environmental benefits; productivity and net employment
gains; alleviated energy and fuel poverties as well as reduced energy
expenditures; increased value for building infrastructure; improved
comfort and services (medium evidence, high agreement). However,
these are rarely internalized by policies, while a number of tools and
approaches are available to quantify and monetize co-benefits that can
help this integration (medium evidence, medium agreement). [9.7]
In summary, buildings represent a critical piece of a low-carbon
future and a global challenge for integration with sustainable
development (robust evidence, high agreement). Buildings embody
the biggest unmet need for basic energy services, especially in develop-
ing countries, while much existing energy use in buildings in developed
countries is very wasteful and inefficient. Existing and future buildings
will determine a large proportion of global energy demand. Current
trends indicate the potential for massive increases in energy demand
and associated emissions. However, this chapter shows that build-
ings offer immediately available, highly cost-effective opportunities
to reduce (growth in) energy demand, while contributing to meeting
other key sustainable development goals including poverty alleviation,
energy security, and improved employment. This potential is more fully
represented in sectoral models than in many integrated models, as
the latter do not represent any or all of the options to cost-effectively
reduce building energy use. Realizing these opportunities requires
aggressive and sustained policies and action to address every aspect
of the design, construction, and operation of buildings and their equip-
ment around the world. The significant advances in building codes and
appliance standards in some jurisdictions over the last decade already
demonstrated that they were able to reverse total building energy use
trends in developed countries to its stagnation or reduction. However,
in order to reach ambitious climate goals, these standards need to be
substantially strengthened and adopted for further jurisdictions, build-
ing types, and vintages. [9.6, 9.9, 9.10] Table 9.1 summarizes some
main findings of the chapter by key mitigation strategy.
9.1 Introduction
This chapter aims to update the knowledge on the building sector
since the Intergovernmental Panel on Climate Change (IPCC) Fourth
Assessment Report (AR4) from a mitigation perspective. Buildings and
activities in buildings are responsible for a significant share of GHG
emissions, but they are also the key to mitigation strategies. In 2010,
the building sector accounted for approximately 117 Exajoules (EJ) or
32 % of global final energy consumption and 19 % of energy-related
CO
2
emissions; and 51 % of global electricity consumption. Buildings
contribute to a significant amount of F-gas emissions , with large differ-
ences in reported figures due to differing accounting conventions, rang-
ing from around an eighth to a third of all such emissions (9.3.6). The
chapter argues that beyond a large emission role, mitigation opportuni-
ties in this sector are also significant, often very cost-effective, and are
in many times associated with significant co-benefits that can exceed
the direct benefits by orders of magnitude. The sector has significant
mitigation potentials at low or even negative costs. Nevertheless, with-
out strong actions emissions are likely to grow considerably — and they
may even double by mid-century — due to several drivers. The chapter
points out that certain policies have proven to be very effective and
several new ones are emerging. As a result, building energy use trends
have been reversed to stagnation or even reduction in some jurisdic-
tions in recent years, despite the increases in affluence and population.
The chapter uses a novel conceptual framework, in line with the gen-
eral analytical framework of the contribution of Working Group III
(WGIII) to the IPCC Fifth Assessment Report (AR5), which focuses on
identities as an organizing principle. This section describes the iden-
tity decomposition Chapter 9 chooses to apply for assessing the litera-
ture, resting on the general identity framework described in Chapter 6.
Building-related emissions and mitigation strategies have been decom-
posed by different identity logics. Commonly used decompositions use
factors such as CO
2
intensity, energy intensity, structural changes, and
economic activity (Isaac and Van Vuuren, 2009; Zhang etal., 2009), as
well as the IPAT (Income-Population-Affluence-Technology) approach
(MacKellar etal., 1995; O’ Mahony etal., 2012). In this assessment, the
review focuses on the main decomposition logic described in Chapter
6, adopted and further decomposed into four identities key to driving
building sector emissions:
C O
2
= CI·TEI·SEI·A
where CO
2
is the emissions from the building sector; (Identity 1) CI is the
carbon intensity; (Identity 2) TEI is the technological energy intensity;
(Identity 3) SEI is the structural\systemic energy intensity and (Identity
4) A is the activity. For a more precise interpretation of the factors, the
following conceptual equation demonstrates the different components:
C O
2
=
C O
2
_
FE
·
FE
_
UsefulE
·
UsefulE
_
ES
·
ES
_
pop
·pop ≈ CI·TEI·SEI·
A
_
pop
·pop
in which FE is the final energy; UsefulE is the useful energy for a par-
ticular energy service (ES), as occurring in the energy conversion chain,
and pop is population. Instead of population in the residential sector
the Gross Domestic Product (GDP) is often used as the main decompo-
sition factor for commercial building emissions. Because ES is often dif-
ficult to rigorously define and measure, and UsefulE and ES are either
difficult to measure or little data are available, this chapter does not
attempt a systematic quantitative decomposition, but rather focuses
on the main strategic categories for mitigation based on the relation-
ship established in the previous equation:
C O
2
mitigation ≈ C
Eff
· T
Eff
·S I
Eff
·DR
whereby (1) C
Eff
, or carbon efficiency, entails fuel switch to low-carbon
fuels, building-integrated renewable energy sources, and other supply-
side decarbonization; (2) T
Eff
, or technological efficiency, focuses on
678678
Buildings
9
Chapter 9
the efficiency improvement of individual energy-using devices; (3)
SI
Eff
, or systemic / infrastructural efficiency, encompass all efficiency
improvements whereby several energy-using devices are involved, i. e.,
systemic efficiency gains are made, or energy use reductions due to
architectural, infrastructural, and systemic measures; and finally (4) DR,
or demand reduction, composes all measures that are beyond tech-
nological efficiency and decarbonization measures, such as impacts
on floor space, service levels, behaviour, lifestyle, use, and penetration
of different appliances. The four main emission drivers and mitigation
strategies can be further decomposed into more distinct sub-strategies,
but due to the limited space in this report and in order to maintain
a structure that supports convenient comparison between different
sectoral chapters, we focus on these four main identities during the
assessment of literature in this chapter and use this decomposition as
the main organizing / conceptual framework.
9.2 New developments
in emission trends
and drivers
9�2�1 Energy and GHG emissions from
buildings
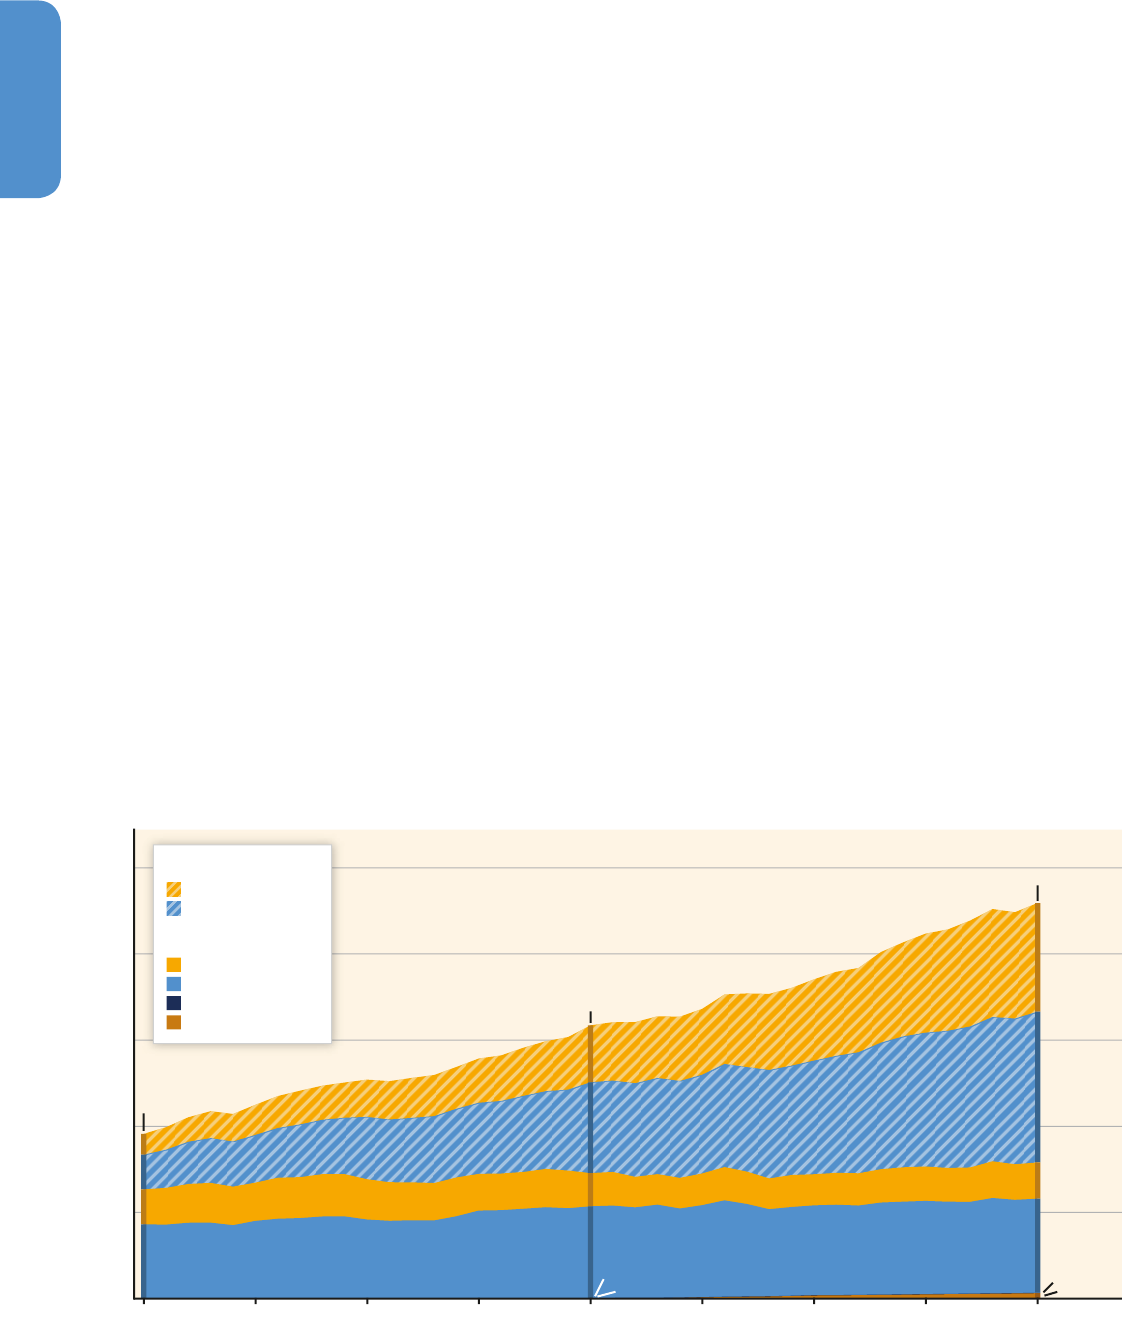
Greenhouse gas (GHG) emissions from the building sector have more
than doubled since 1970 to reach 9.18 GtCO
2
eq in 2010 (Figure 9.1),
representing 25 % of total emissions without the Agriculture, Forestry,
and Land Use (AFOLU) sector; and 19 % of all global 2010 GHG emis-
sions (IEA, 2012a; JRC / PBL, 2013; see Annex II.8). Furthermore, they
account for approximately one-third of black carbon emissions (GEA,
2012), and one-eighth to one-third of F-gas emissions, depending par-
tially on the accounting convention used (UNEP, 2011a; EEA, 2013; US
EPA, 2013; JRC / PBL, 2013; IEA, 2012a; see Annex II.8).
Most of GHG emissions (6.02 Gt) are indirect CO
2
emissions from elec-
tricity use in buildings, and these have shown dynamic growth in the
studied period in contrast to direct emissions, which have roughly stag-
nated during these four decades (Figure 9.1). For instance, residential
indirect emissions quintupled and commercial emissions quadrupled.
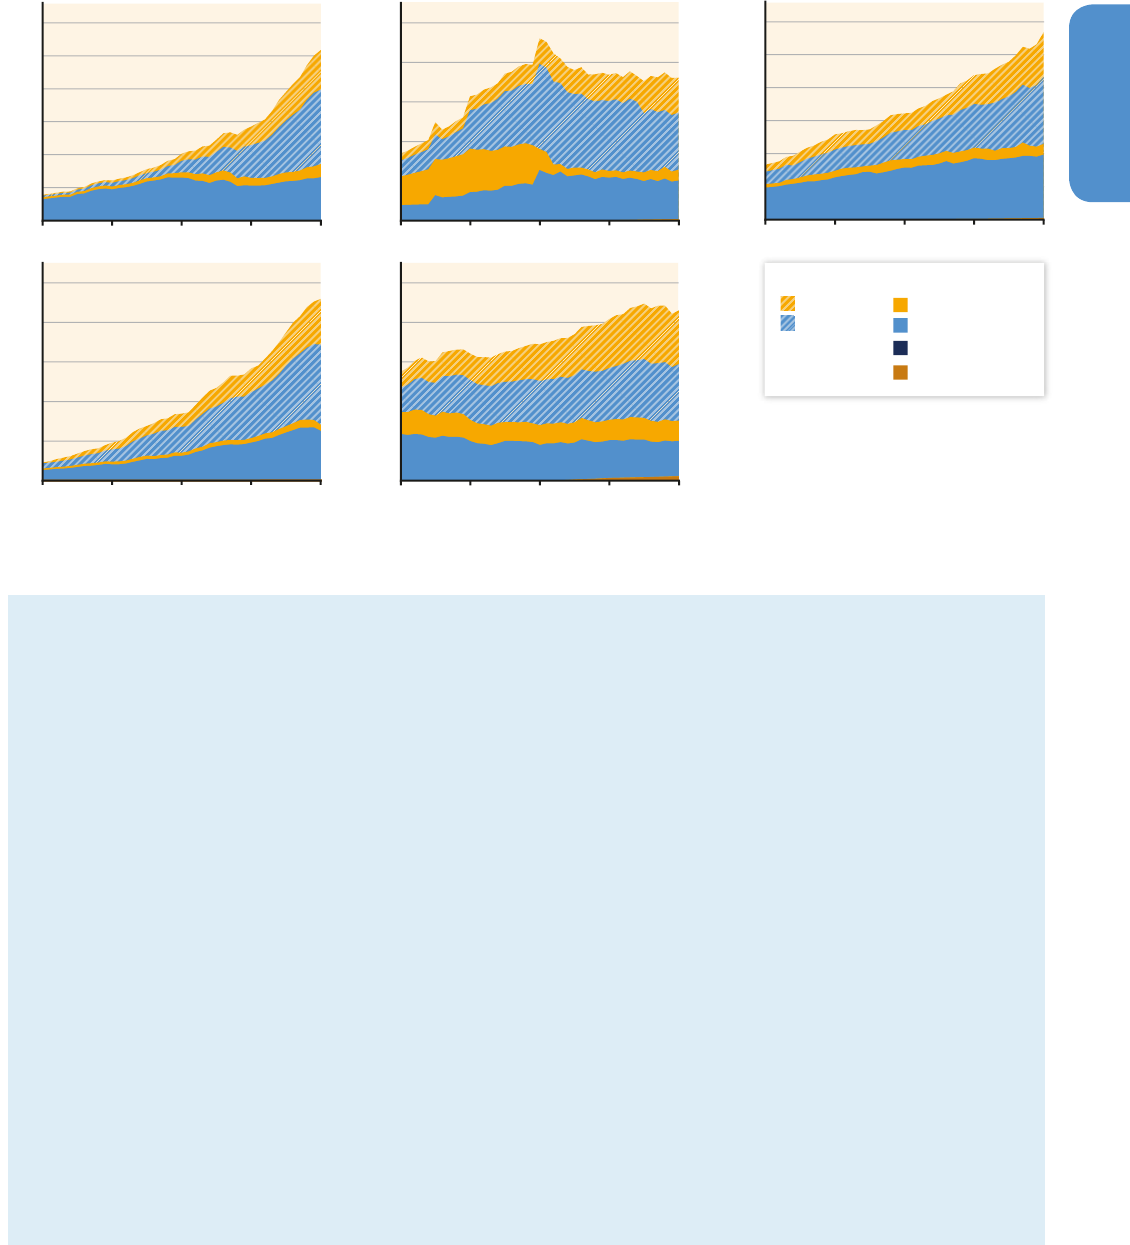
Figure 9.2 shows the regional trends in building-related GHG emissions.
Organisation for Economic Co-operation Development (OECD) coun-
tries have the highest emissions, but the growth in this region between
1970 and 2010 was moderate. For least developed countries, the emis-
sions are low with little growth. The largest growth has taken place in
Asia where emissions in 1970 were similar to those in other developing
regions, but by today they are closing in on those of OECD countries.
Due to the high share of indirect emissions in the sector, actual emission
values very strongly depend on emission factors — mainly that of electric-
ity production — that are beyond the scope of this chapter. Therefore, the
rest of this chapter focuses on final energy use (rather than emissions)
that is determined largely by activities and measures within the sector.
In 2010 buildings accounted for 32 % (24 % for residential and 8 % for
commercial) of total global final energy use (IEA, 2013), or 32.4 PWh,
being one of the largest end-use sectors worldwide. Space heating rep-
Figure 9�1 | Direct and indirect emissions (from electricity and heat production) in the building subsectors (IEA, 2012a; JRC / PBL, 2013; see Annex II.9).
Commercial
Residential
N
2
O Emissions (Indirect)
Others
Commercial
Residential
Direct
Indirect
0
2
4
6
8
10
GHG Emissions [GtCO
2
eq/yr]
0.48
1.32
2.52
Total Direct and Indirect 3.8
(Total Direct 2.5)
Total Direct and Indirect 6.3
(Total Direct 2.9)
Total Direct
and Indirect 9.2
(Total Direct 3.2)
0.80
2.11
3.50
0.81
0.77
0.84
1.72
2.13
2.18
0.01
0.01
0.01 0.13
1970 1975 1980 1985 1990 1995 2000 2005
2010
Figure 9�2 | Regional direct and indirect emissions in the building subsectors (IEA, 2012a; JRC / PBL, 2013; see Annex II.9).
GHG Emissions [GtCO
2
eq/yr]
1970 1980 1990 2000 2010
1970 1980 1990 2000 2010
1970 1980 1990 2000 2010
1970 1980 1990 2000 2010
1970 1980 1990 2000 2010
GHG Emissions [GtCO
2
eq/yr]
GHG Emissions [GtCO
2
eq/yr]
GHG Emissions [GtCO
2
eq/yr]
Non-OECD Asia
Total Direct + Indirect: 2.6
Total Direct: 0.86
(2010)
0.0
0.5
1.0
1.5
2.0
2.5
3.0
OECD-1990 Countries
Total Direct + Indirect: 4.3
Total Direct: 1.5
(2010)
0.00
0.05
0.10
0.15
0.20
0.25
0.30
0.0
0.2
0.4
0.6
0.8
1.0
Africa and Middle East
Total Direct + Indirect: 0.92
Total Direct: 0.28
(2010)
0
1
2
3
4
5
0.0
0.3
0.6
0.9
1.2
1.5
GHG Emissions [GtCO
2
eq/yr]
Economies in Transition
Total Direct + Indirect: 1.1
Total Direct: 0.39
(2010)
Latin America and Caribbean
Total Direct + Indirect: 0.28
Total Direct: 0.11
(2010)
Commercial
Indirect
Residential
Commercial
Direct
Residential
N
2
O Emissions (Indirect)
Others
679679
Buildings
9
Chapter 9
and Land Use (AFOLU) sector; and 19 % of all global 2010 GHG emis-
sions (IEA, 2012a; JRC / PBL, 2013; see Annex II.8). Furthermore, they
account for approximately one-third of black carbon emissions (GEA,
2012), and one-eighth to one-third of F-gas emissions, depending par-
tially on the accounting convention used (UNEP, 2011a; EEA, 2013; US
EPA, 2013; JRC / PBL, 2013; IEA, 2012a; see Annex II.8).
Most of GHG emissions (6.02 Gt) are indirect CO
2
emissions from elec-
tricity use in buildings, and these have shown dynamic growth in the
studied period in contrast to direct emissions, which have roughly stag-
nated during these four decades (Figure 9.1). For instance, residential
indirect emissions quintupled and commercial emissions quadrupled.
Figure 9.2 shows the regional trends in building-related GHG emissions.
Organisation for Economic Co-operation Development (OECD) coun-
tries have the highest emissions, but the growth in this region between
1970 and 2010 was moderate. For least developed countries, the emis-
sions are low with little growth. The largest growth has taken place in
Asia where emissions in 1970 were similar to those in other developing
regions, but by today they are closing in on those of OECD countries.
Due to the high share of indirect emissions in the sector, actual emission
values very strongly depend on emission factors — mainly that of electric-
ity production — that are beyond the scope of this chapter. Therefore, the
rest of this chapter focuses on final energy use (rather than emissions)
that is determined largely by activities and measures within the sector.
In 2010 buildings accounted for 32 % (24 % for residential and 8 % for
commercial) of total global final energy use (IEA, 2013), or 32.4 PWh,
being one of the largest end-use sectors worldwide. Space heating rep-
Figure 9�1 | Direct and indirect emissions (from electricity and heat production) in the building subsectors (IEA, 2012a; JRC / PBL, 2013; see Annex II.9).
Commercial
Residential
N
2
O Emissions (Indirect)
Others
Commercial
Residential
Direct
Indirect
0
2
4
6
8
10
GHG Emissions [GtCO
2
eq/yr]
0.48
1.32
2.52
Total Direct and Indirect 3.8
(Total Direct 2.5)
Total Direct and Indirect 6.3
(Total Direct 2.9)
Total Direct
and Indirect 9.2
(Total Direct 3.2)
0.80
2.11
3.50
0.81
0.77
0.84
1.72
2.13
2.18
0.01
0.01
0.01 0.13
1970 1975 1980 1985 1990 1995 2000 2005
2010
Figure 9�2 | Regional direct and indirect emissions in the building subsectors (IEA, 2012a; JRC / PBL, 2013; see Annex II.9).
GHG Emissions [GtCO
2
eq/yr]
1970 1980 1990 2000 2010
1970 1980 1990 2000 2010
1970 1980 1990 2000 2010
1970 1980 1990 2000 2010
1970 1980 1990 2000 2010
GHG Emissions [GtCO
2
eq/yr]
GHG Emissions [GtCO
2
eq/yr]
GHG Emissions [GtCO
2
eq/yr]
Non-OECD Asia
Total Direct + Indirect: 2.6
Total Direct: 0.86
(2010)
0.0
0.5
1.0
1.5
2.0
2.5
3.0
OECD-1990 Countries
Total Direct + Indirect: 4.3
Total Direct: 1.5
(2010)
0.00
0.05
0.10
0.15
0.20
0.25
0.30
0.0
0.2
0.4
0.6
0.8
1.0
Africa and Middle East
Total Direct + Indirect: 0.92
Total Direct: 0.28
(2010)
0
1
2
3
4
5
0.0
0.3
0.6
0.9
1.2
1.5
GHG Emissions [GtCO
2
eq/yr]
Economies in Transition
Total Direct + Indirect: 1.1
Total Direct: 0.39
(2010)
Latin America and Caribbean
Total Direct + Indirect: 0.28
Total Direct: 0.11
(2010)
Commercial
Indirect
Residential
Commercial
Direct
Residential
N
2
O Emissions (Indirect)
Others
Box 9�1 | Least Developed Countries (LDCs) in the context of the developing world
878 million people with an average 2 USD
2010
per day of gross
national income (The World Bank, 2013) live in the LDCs group.
Rapid economic development, accompanied by urbanization, is
propelling large building activity in developing countries (WBCSD,
2007, 2009; ABC, 2008; Li and Colombier, 2009). The fast grow-
ing rates of new construction, which is occurring in emerging
economies, is not being witnessed in LDCs. This group of countries
is still at the fringe of modern development processes and has
special needs in terms of access to housing, modern energy carri-
ers, and efficient and clean-burning cooking devices (Zhang and
Smith, 2007; Duflo etal., 2008; WHO, 2009, 2011; Wilkinson etal.,
2009; Hailu, 2012; Pachauri, 2012). Around one-third of the urban
population in developing countries in 2010 did not have access to
adequate housing (UNHSP, 2010) and the number of slum dwell-
ers is likely to rise in the near future (UN-Habitat, 2011). In order
to avoid locking in carbon-intensive options for several decades,
a shift to electricity and modern fuels needs to be accompanied
by energy-saving solutions (technological, architectural), as well
as renewable sources, adequate management, and sustainable
lifestyles (WBCSD, 2006; Ürge-Vorsatz etal., 2009; Wilkinson
etal., 2009; US EERE, 2011; GEA, 2012; Wallbaum etal., 2012).
Modern knowledge and techniques can be used to improve ver-
nacular designs (Foruzanmehr and Vellinga, 2011). Principles of
low-energy design often provide comfortable conditions much of
the time, thereby reducing the pressure to install energy-intensive
cooling equipment such as air conditioners. These principles are
embedded in vernacular designs throughout the world, and have
evolved over centuries in the absence of active energy systems.
Beyond the direct energy cost savings, many mitigation options
in this sector have significant and diverse co-benefits that offer
attractive entry points for mitigation policy-making, even in
countries / jurisdictions where financial resources for mitigation are
limited. These co-benefits include, but are not limited to, energy
security, air quality, and health benefits; reduced pressures to
expand energy generation capacities in developing regions; pro-
ductivity, competitiveness, and net employment gains; increased
social welfare; reduced fuel poverty; decreased need for energy
subsidies and exposure to energy price volatility risks; improved
comfort and services; and improved adaptability to adverse cli-
mate events (Tirado Herrero et al., 2012; Clinch and Healy, 2001;
see also Table 9.7).
680680
Buildings
9
Chapter 9
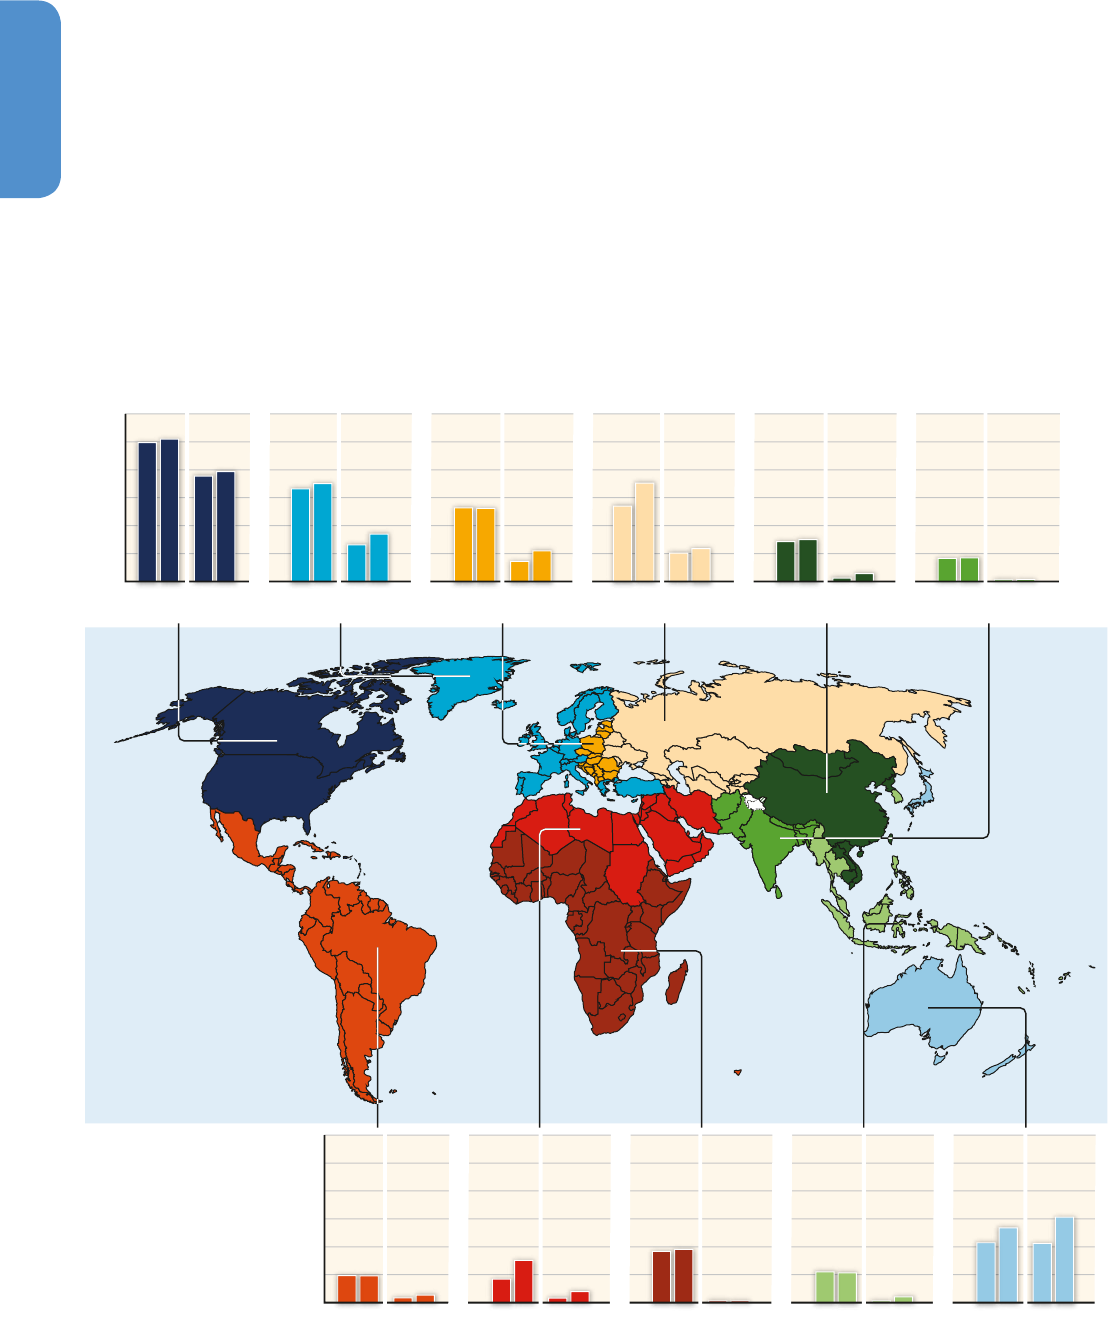
Figure 9�3 | Annual per capita final energy use of residential and commercial buildings for eleven regions (GEA RC11, see Annex II.2.4) in 1990 and 2010. Data from IEA (2012b, 2013).
0
2
4
6
8
10
12
0
2
4
6
8
10
12
1990 2010 1990 2010
Residential Commercial
1990 2010 1990 2010
Residential Commercial
1990 2010 1990 2010
Residential Commercial
1990 2010 1990 2010
Residential Commercial
1990 2010 1990 2010
Residential Commercial
1990 2010 1990 2010
Residential Commercial
1990 2010 1990 2010
Residential Commercial
1990 2010 1990 2010
Residential Commercial
1990 2010 1990 2010
Residential Commercial
1990 2010 1990 2010
Residential Commercial
1990 2010 1990 2010
Residential Commercial
Final Energy Use [MWh/cap/yr]
Final Energy Use [MWh/cap/yr]
PAS
SASCPA
MNA SSALAM
FSUEEUWEUNAM
POECD
4,3
5,4
4,2
6,1
7,9
7,6
10,2
10,0
6,6
7,0
2,6
3,4
5,3 5,2
1,4
2,2
5,4
7,1
2,0
2,4
1,9 1,9
0,3
0,5
3,8
3,7
0,10,1
1,7
3,0
0,3
0,8
2,9
3,0
0,2
0,6
1,7
1,7
0,1 0,1
2,2
2,1
0,1
0,4
resented 32 – 34 % of the global final energy consumption in both the
residential and the commercial building sub-sectors in 2010 (Figure
9.4). Moreover, in the commercial sub-sector, lighting was very impor-
tant, while cooking and water heating were significant end-uses in
residential buildings. In contrast to the dynamically growing total emis-
sions, per capita final energy use did not grow substantially over the
two decades between 1990 and 2010 in most world regions (see Figure
9.3). This value stagnated in most regions during the period, except for a
slight increase in the Former Soviet Union (FSU) and a dynamic growth
in North Africa and Middle East (MEA). Commercial energy use has also
grown only moderately in most regions on a per capita basis, with more
dynamic growth shown in Centrally Planned Asia (CPA), South Asia
(SAS) and MEA. This indicates that most trends to drive building energy
use up have been compensated by efficiency gains. In many developing
regions this can largely be due to switching from traditional biomass to
modern energy carriers that can be utilized much more efficiently.
As shown in Section 9.9 global building energy use may double to
triple by mid-century due to several key trends. An estimated 0.8 bil-
lion people lack access to adequate housing (UN-Habitat, 2010) while
an estimated 1.3 billion people lacked access to electricity in 2010
and about 3 billion people worldwide relied on highly-polluting and
unhealthy traditional solid fuels for household cooking and heating
(IEA, 2012a; Pachauri et al., 2012; see Section 14.3.2.1).The ways
these energy services will be provided will significantly influence the
development of building related emissions. In addition, migration to

681681
Buildings
9
Chapter 9
cities, decreasing household size, increasing levels of wealth and life-
style changes, including an increase in personal living space, the types
and number of appliances and equipment and their use — all contrib-
ute to significant increases in building energy use. Rapid economic
development accompanied by urbanization and shifts from informal
to formal housing is propelling significant building activity in develop-
ing countries (WBCSD, 2007). As a result, this substantial new con-
struction, which is taking place in these dynamically growing regions
represents both a significant risk and opportunity from a mitigation
perspective.
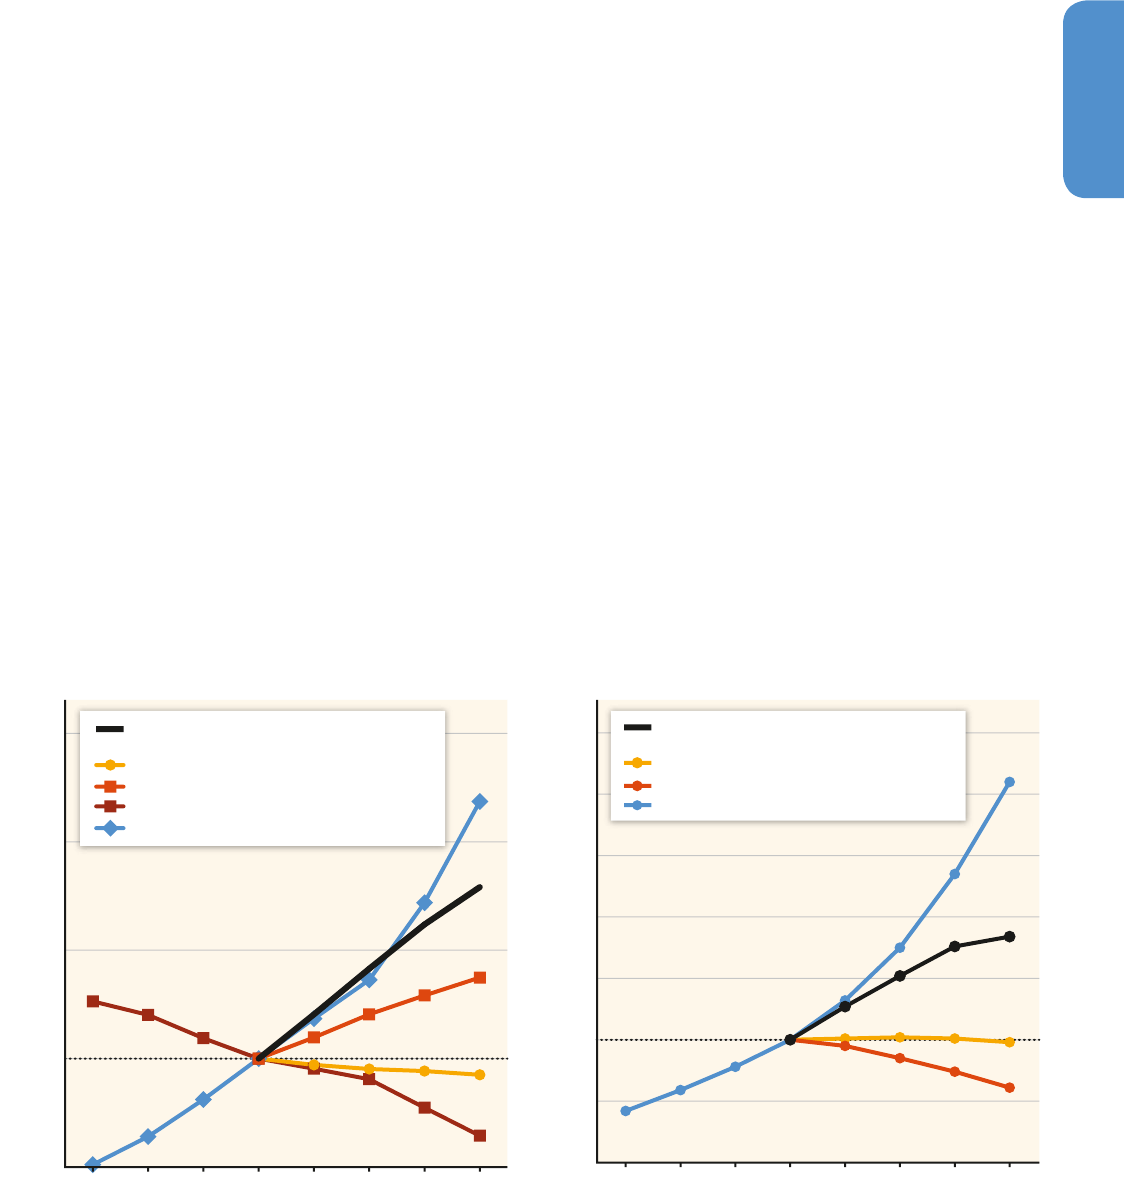
9�2�2 Trends and drivers of thermal energy
uses in buildings
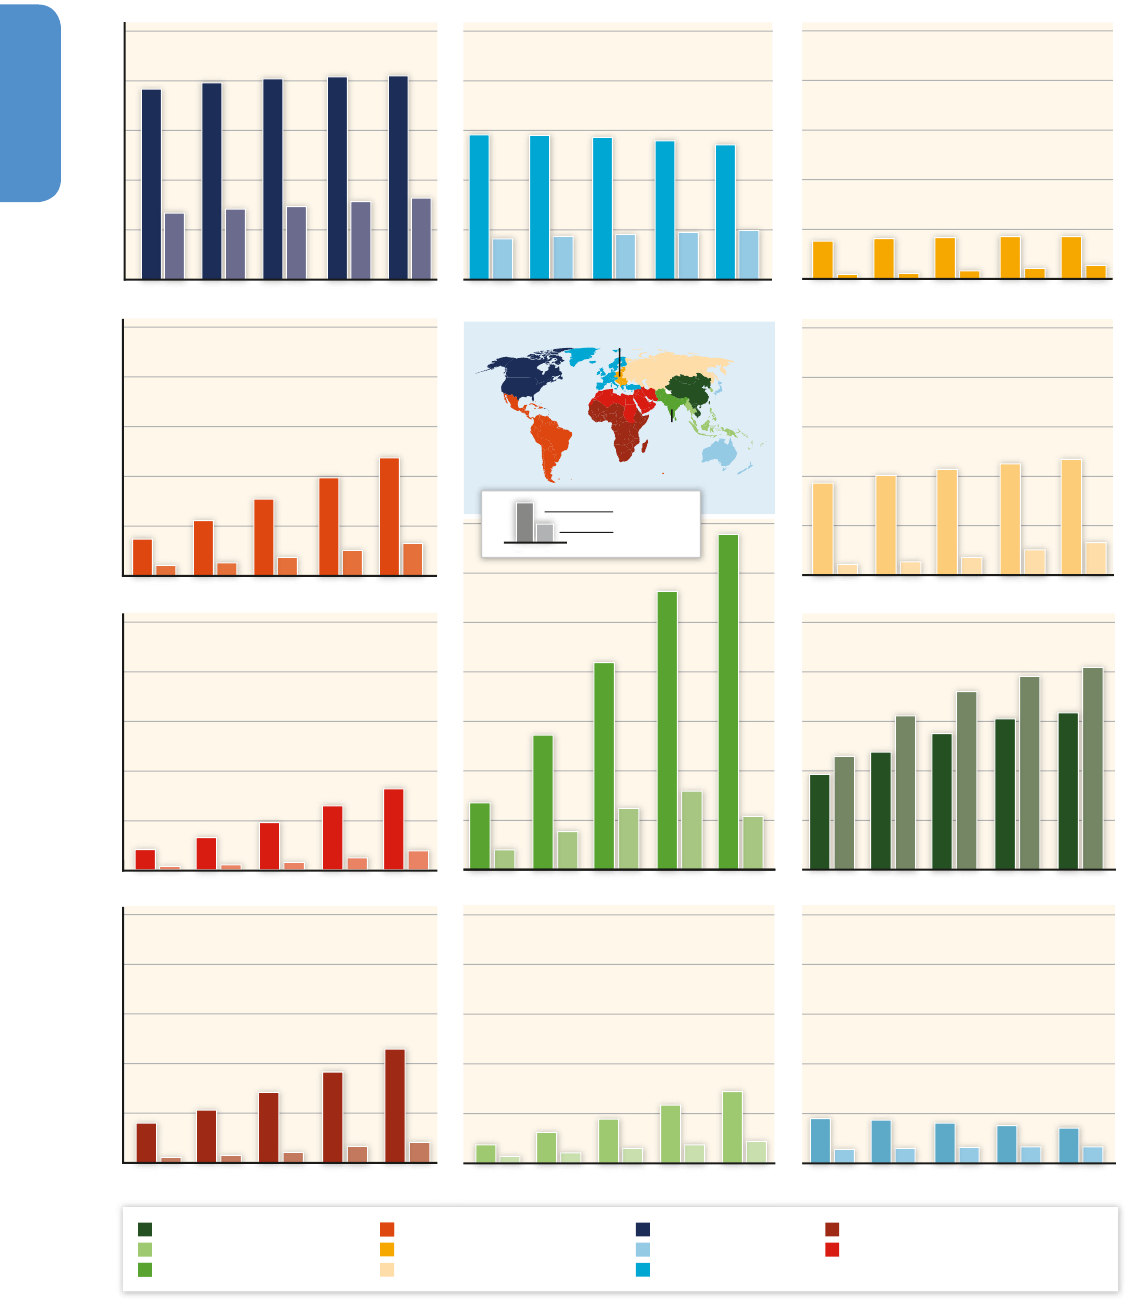
Figure 9.5 shows projections of thermal energy uses in commercial and
residential buildings in the regions of the world from 2010 to 2050.
While energy consumption for thermal uses in buildings in the devel-
oped countries (see North America and Western Europe) accounts for
most of the energy consumption in the world, its tendency is to grow
little in the period shown, while developing countries show an impor-
tant increase. Commercial buildings represent between 10 to 30 % of
total building sector thermal energy consumption in most regions of
the world, except for China, where heating and cooling energy con-
sumption in commercial buildings is expected to overtake that of resi-
dential buildings. Drivers to these trends and their developments are
discussed separately for heating / cooling and other building energy
services because of conceptually different drivers. Heating and cooling
energy use in residential buildings can be decomposed by the follow-
ing key identities:
energ y
residential
= h·
p
_
h
·
area
_
p
·
energy
_
area
where energy
residential
stands for the total residential thermal energy
demand, [h] and [p / h] are the activity drivers, with [h] being the num-
ber of households and the p / h number of persons (p) living in each
household, respectively. [area / p] is the use intensity driver, with the
floor area (usually m
2
) per person; and [energy / area] is the energy
intensity driver, i. e., the annual thermal energy consumption (usually
kWh) per unit of floor area, also referred to as specific energy con-
sumption. For commercial buildings, the heating and cooling use is
decomposed as
energ y
commercial
= GDP·
area
_
GDP
·
energy
_
area
where energy
commercial
stands for the total commercial thermal energy
demand, [GDP], i. e., nominal Gross Domestic Product is the activity
driver; [area / GDP] is the use intensity driver and [energy / area] is the
energy intensity driver, the annual thermal energy consumption (in
kWh) per unit of floor area (in m
2
), also referred to as specific energy
consumption. Figures 9.6 and 9.7 illustrate the main trends in heating
and cooling energy use as well as its drivers globally and by region.
Figure 9�4 | World building final energy consumption by end-use in 2010. Source: IEA (2013).
29%
9%
24%
2%
4%
32%
32%
7%
16%
12%
33%
Space Heating
Cooking
Water Heating
Appliances
Lighting
Cooling
Other
(IT Equipment, etc.)
Total = 8.42 PWhTotal = 24.3 PWh
CommercialResidential
682682
Buildings
9
Chapter 9
Figure 9�5 | Total annual final thermal energy consumption (PWh / yr) trends in eleven world regions (GEA RC11, see Annex II.2.4) for residential and commercial buildings (GEA
region abbreviation added in brackets where different from abbreviation used in this report). Historical data (1980 – 2000) are from IEA statistics; projections (2010 – 2050) are
based on a frozen (i. e. unchanged over time) efficiency scenario (Ürge-Vorsatz etal., 2013).
EEU
POECD
0
1
2
3
4
5
NAM
LAM
WEU
0
1
2
3
4
5
SSA
0
1
2
3
4
5
FSU
CPA
SAS
2010 2020 2030 2040 2050
2010 2020 2030 2040 2050
2010 2020 2030 2040 2050
2010 2020 2030 2040 2050
2010 2020 2030 2040 2050
2010 2020 2030 2040 2050
2010 2020 2030 2040 2050
2010 2020 2030 2040 2050 2010 2020 2030 2040 2050
2010 2020 2030 2040 2050
2010 2020 2030 2040 2050
PAS
0
1
2
3
4
5
Final Energy Use [PWh/yr] Final Energy Use [PWh/yr] Final Energy Use [PWh/yr] Final Energy Use [PWh/yr]
MNA
CPA
PAS
SAS
LAM
SSA
EEU
FSU
MNA
NAM
POECD
WEU
CPA Centrally Planned Asia and China
PAS Other Pacific Asia
SAS South Asia
LAM Latin America and the Caribbean (LAC)
SSA Sub-Saharan Africa (AFR)
EEU Central and Eastern Europe MNA Middle East and North Africa (MEA)
FSU Former Soviet Union
NAM North America
POECD Pacific OECD (PAO)
WEU Western Europe
Residential
Commercial
683683
Buildings
9
Chapter 9
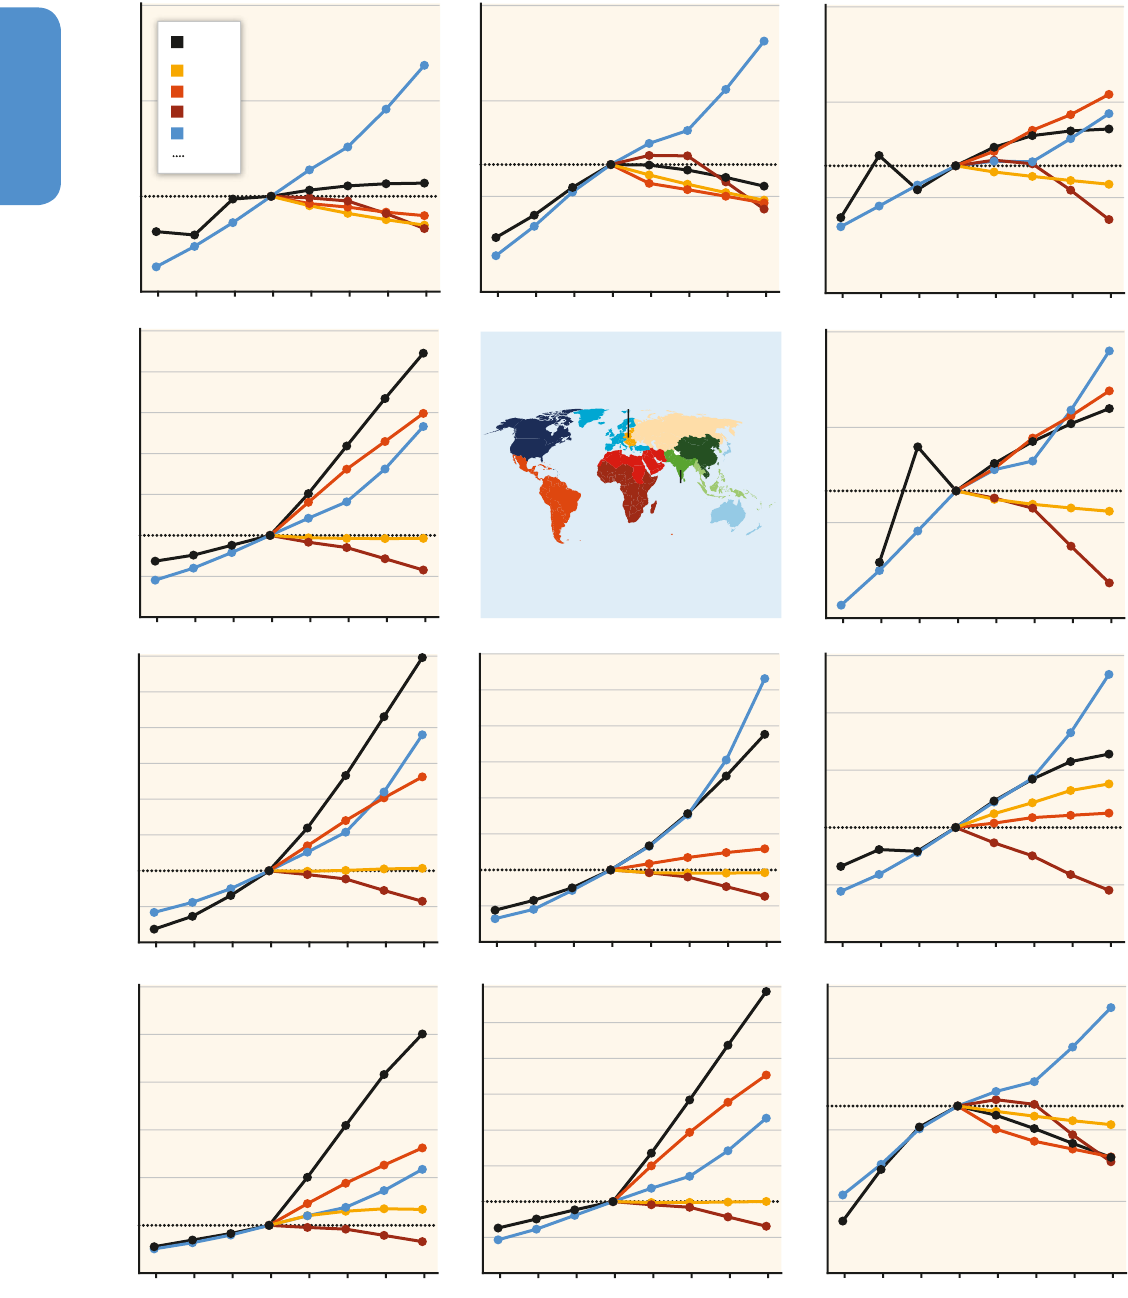
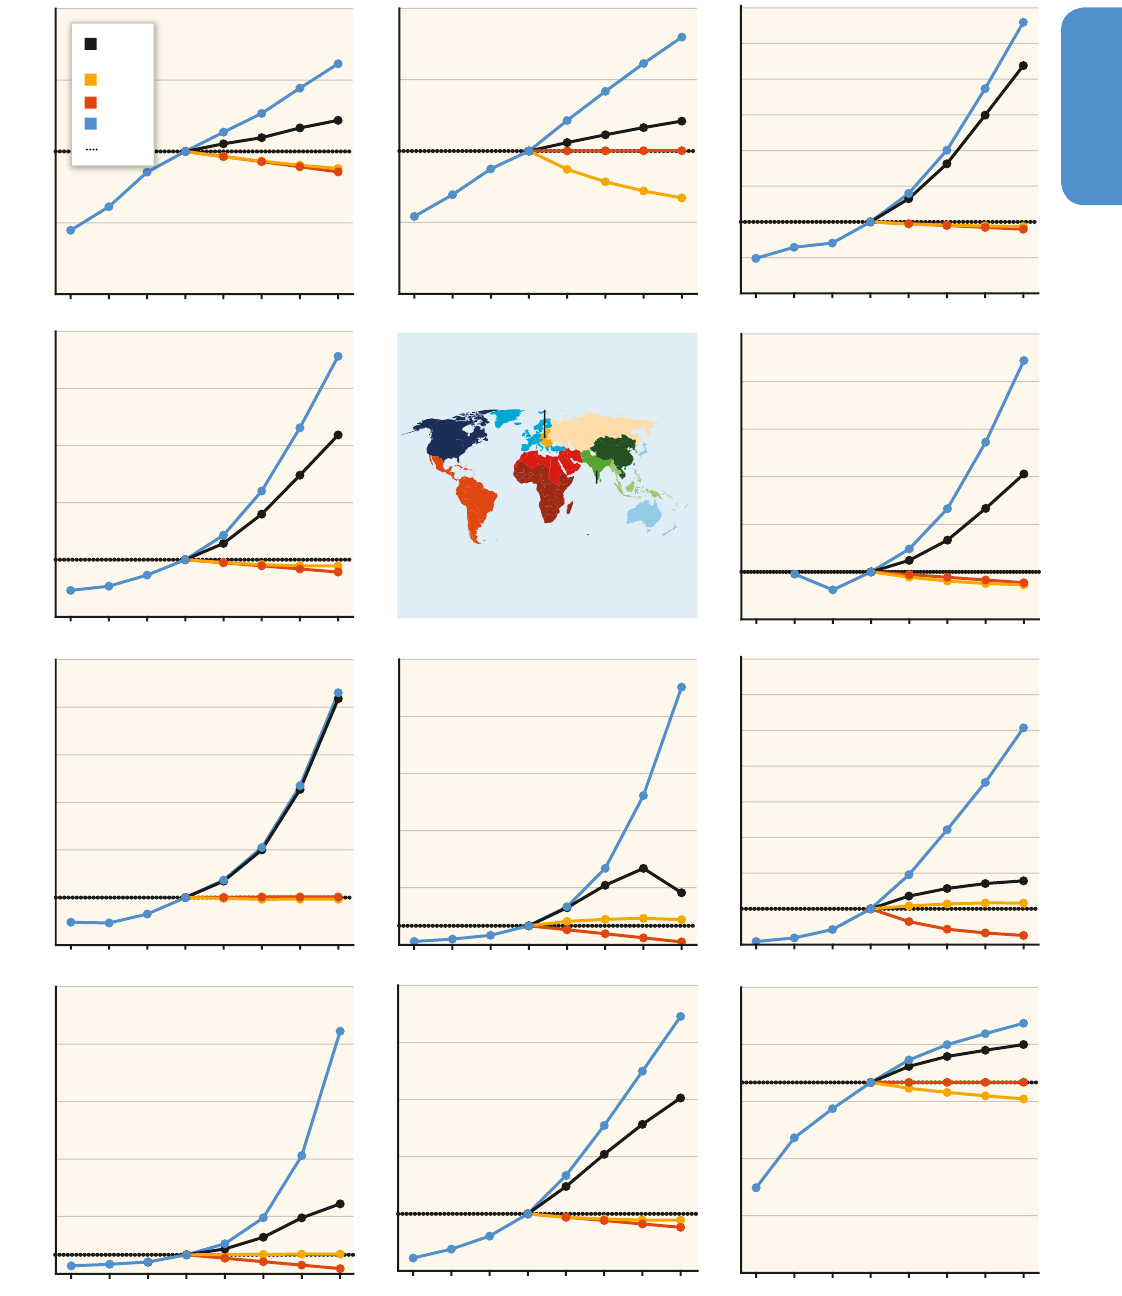
Heating and cooling energy use in residential and commercial build-
ings is expected to grow by 79 % and 84 %, respectively, over the
period 2010 – 2050 (Figure 9.6) in a business-as-usual scenario. In resi-
dential buildings, both the growing number of households and the
area per household tend to increase energy consumption, while the
decrease in the number of persons per household and in specific
energy consumption tend to decrease energy consumption. In com-
mercial buildings, the projected decrease of area / GDP is 61 %, while
energy / area is expected to stay constant over the period 2010 – 2050.
Different tendencies of the drivers are shown for both residential and
commercial buildings in the world as whole (Figure 9.6) and in differ-
ent world regions (Figure 9.7). These figures indicate that in some
regions (e. g., NAM and WEU), strong energy building policies are
already resulting in declining or stagnating total energy use trends
despite the increase in population and service levels.
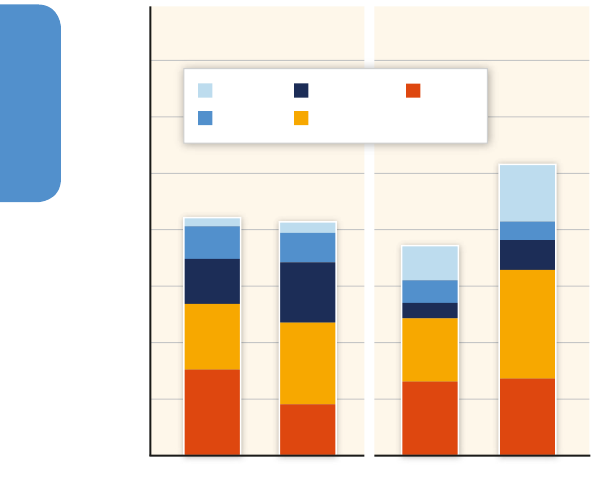
9�2�3 Trends and drivers in energy consump-
tion of appliances in buildings
In this chapter, we use the word ‘appliances’ in a broad sense, cover-
ing all electricity-using non-thermal equipment in buildings, including
lighting and ICT. Traditional large appliances, such as refrigerators and
washing machines, are still responsible for most household electricity
consumption (IEA, 2012c) albeit with a falling share related to the equip-
ment for information technology and communications (including home
entertainment) accounting in most countries for 20 % or more of resi-
dential electricity consumption (Harvey, 2008). This rapid growth offers
opportunities to roll out more efficient technologies, but this effect to
date has been outcompeted by the increased uptake of devices and new
devices coming to the market. Energy use of appliances can be decom-
posed as shown in the following equation from (Cabeza etal., 2013b):
energy =
∑
a
h·
n
_
h
·
energy
_
n
Where ∑
a
is the sum overall appliances; [h] is the activity driver, the
number of households; [n / h] is the use intensity driver, i. e., the num-
ber of appliances of appliance type ‘a’ per household; and [energy] is
the energy intensity driver (kWh / yr used per appliance). The number
of appliances used increased around the world. Figure 9.8 shows that
the energy consumption of major appliances in non-OECD countries is
already nearly equal to consumption in the OECD, due to their large
populations and widespread adoption of the main white appliances
and lighting. In addition, while fans are a minor end-use in most OECD
countries, they continue to be extremely important in the warm devel-
oping countries.
Figure 9�6 | Trends in the different drivers for global heating and cooling thermal energy consumption in residential and commercial buildings. Source: Ürge-Vorsatz et al. (2013)
with projection data (2010 – 2050) from frozen efficiency scenario.
50
100
2050204020302020201020001990198020502040203020202010200019901980
150
200
250
Residential
Commercial
Heating and Cooling Energy Use (kWh/yr)
Number of Households (h)
Number of Persons per Household (p/h)
Energy Used for Heating and/or Cooling per Area (kWh/m
2
/yr)
Area per Person (m
2
/p)
Relative Change with Respect to Reference Year 2010 [%]
Relative Change with Respect to Reference Year 2010 [%]
179%
137%
93%
64%
126%
51%
219%
0
50
100
150
200
250
300
350
184%
98%
61%
42%
310%
Energy Used for Heating and/or Cooling per Area (kWh/m
2
/yr)
Number of sq. Meter per GDP (m
2
/GDP)
Gross Domestic Product (GDP)
Heating and Cooling Energy Use (kWh/yr)
684684
Buildings
9
Chapter 9
Relative Change in Drivers (2010=100%) [%] Relative Change in Drivers (2010=100%) [%] Relative Change in Drivers (2010=100%) [%] Relative Change in Drivers (2010=100%) [%]
20502040203020202010200019901980
20502040203020202010200019901980
20502040203020202010200019901980
20502040203020202010200019901980
20502040203020202010200019901980
20502040203020202010200019901980
20502040203020202010200019901980
20502040203020202010200019901980
20502040203020202010200019901980
20502040203020202010200019901980
20502040203020202010200019901980
kWh/m
2
m
2
/GDP
kWh
100%
GDP
0
300
600
900
1200
1500
SAS
WEU
NAM
POECD
PAS
FSU
LAM
MNA
SSA
CPA
EEU
0
100
200
300
400
500
600
700
800
0
50
100
150
200
250
300
350
400
0
100
200
300
400
500
600
0
100
200
300
400
500
0
100
200
300
400
500
600
0
50
100
150
200
0
30
60
90
120
150
0
100
200
300
400
500
0
300
600
900
1200
1500
0
50
100
150
200
CPA
PAS
SAS
LAM
SSA
EEU
FSU
MNA
NAM
POECD
WEU
CPA
PAS
SAS
LAM
SSA
EEU
FSU
MNA
NAM
POECD
WEU
20502040203020202010200019901980
20502040203020202010200019901980
20502040203020202010200019901980 20502040203020202010200019901980
20502040203020202010200019901980
20502040203020202010200019901980
20502040203020202010200019901980 20502040203020202010200019901980
20502040203020202010200019901980
2050204020302020201020001990198020502040203020202010200019901980
kWh/m
2
m
2
/p
p/h
h
100%
kWh
0
50
100
150
200
250
300
350
400
SAS
WEU
NAM
POECDPAS
FSU
LAM
MNA
SSA CPA
EEU
0
50
100
150
200
250
60
90
120
150
60
90
120
150
0
50
100
150
200
250
300
350
0
50
100
150
200
250
300
350
400
50
100
150
200
30
60
90
120
150
0
50
100
150
200
250
300
350
400
0
100
200
300
400
500
600
60
90
120
150
Relative Change in Drivers (2010=100%) [%] Relative Change in Drivers (2010=100%) [%] Relative Change in Drivers (2010=100%) [%] Relative Change in Drivers (2010=100%) [%]
⇒
685685
Buildings
9
Chapter 9
Relative Change in Drivers (2010=100%) [%] Relative Change in Drivers (2010=100%) [%] Relative Change in Drivers (2010=100%) [%] Relative Change in Drivers (2010=100%) [%]
20502040203020202010200019901980
20502040203020202010200019901980
20502040203020202010200019901980
20502040203020202010200019901980
20502040203020202010200019901980
20502040203020202010200019901980
20502040203020202010200019901980
20502040203020202010200019901980
20502040203020202010200019901980
20502040203020202010200019901980
20502040203020202010200019901980
kWh/m
2
m
2
/GDP
kWh
100%
GDP
0
300
600
900
1200
1500
SAS
WEU
NAM
POECD
PAS
FSU
LAM
MNA
SSA
CPA
EEU
0
100
200
300
400
500
600
700
800
0
50
100
150
200
250
300
350
400
0
100
200
300
400
500
600
0
100
200
300
400
500
0
100
200
300
400
500
600
0
50
100
150
200
0
30
60
90
120
150
0
100
200
300
400
500
0
300
600
900
1200
1500
0
50
100
150
200
CPA
PAS
SAS
LAM
SSA
EEU
FSU
MNA
NAM
POECD
WEU
CPA
PAS
SAS
LAM
SSA
EEU
FSU
MNA
NAM
POECD
WEU
20502040203020202010200019901980
20502040203020202010200019901980
20502040203020202010200019901980 20502040203020202010200019901980
20502040203020202010200019901980
20502040203020202010200019901980
20502040203020202010200019901980 20502040203020202010200019901980
20502040203020202010200019901980
2050204020302020201020001990198020502040203020202010200019901980
kWh/m
2
m
2
/p
p/h
h
100%
kWh
0
50
100
150
200
250
300
350
400
SAS
WEU
NAM
POECDPAS
FSU
LAM
MNA
SSA CPA
EEU
0
50
100
150
200
250
60
90
120
150
60
90
120
150
0
50
100
150
200
250
300
350
0
50
100
150
200
250
300
350
400
50
100
150
200
30
60
90
120
150
0
50
100
150
200
250
300
350
400
0
100
200
300
400
500
600
60
90
120
150
Relative Change in Drivers (2010=100%) [%] Relative Change in Drivers (2010=100%) [%] Relative Change in Drivers (2010=100%) [%] Relative Change in Drivers (2010=100%) [%]
Figure 9�7 | Trends in the drivers of heating and cooling thermal energy consumption of residential (first page) and commercial (this page) buildings in world regions (GEA RC11, see
Annex II.2.4). Source: Ürge-Vorsatz et al. (2013) with projection data (2010 – 2050) from frozen efficiency scenario.
686686
Buildings
9
Chapter 9
9.3 Mitigation technology
options and practices,
behavioural aspects
This section provides a broad overview at the strategic and planning
level of the technological options, design practices, and behavioural
changes that can achieve large reductions in building energy use
(50 % – 90 % in new buildings, 50 % – 75 % in existing buildings). Table
9.2 summarizes the energy savings and CO
2
emission reduction poten-
tial according to the factors introduced in Section 9.1 based on mate-
rial presented in this section or in references given. A synthesis of doc-
umented examples of large reductions in energy use achieved in real,
new, and retrofitted buildings in a variety of different climates, and of
costs at the building level, is presented in this section, while Section
9.4 reviews the additional savings that are possible at the community
level and their associated costs, and Section 9.6 presents a synthesis of
studies of the costs, their trends, and with integrated potential calcula-
tions at the national, regional, and global levels.
9�3�1 Key points from AR4
The AR4 Chapter 6 on Buildings (Levine et al., 2007) contains an
extensive discussion of the wide range of techniques and designs to
reduce energy use in new buildings. Savings at the system level are
generally larger than for individual devices (pumps, motors, fans, heat-
ers, chillers, etc.), as are related net investment-cost savings — usually
several times higher (Levine et al., 2007; Harvey, 2008). Integrated
Design Process (IDP) allows for the systemic approach, which opti-
mizes building performance iteratively, and involves all design team
members from the start (Montanya et al., 2009; Pope and Tardiff,
2011). However, the conventional process of designing and construct-
ing a building and its systems is largely linear, in which design ele-
ments and system components are specified, built, and installed with-
out consideration of optimization opportunities in the following
design and building phases, thus losing key opportunities for the opti-
mization of whole buildings as systems (Lewis, 2004). As discussed in
AR4, essential steps in the design of low-energy buildings are: (1)
building orientation, thermal mass, and shape; (2) high-performance
envelope specification; (3) maximization of passive features (day-
lighting, heating, cooling, and ventilation); (4) efficient systems meet-
ing remaining loads; (5) highest possible efficiencies and adequate
sizing of individual energy-using devices; and (6) proper commission-
ing of systems and devices. Cost savings can substantially offset addi-
tional high-performance envelope and higher-efficiency equipment
costs, of around 35 – 50 % compared to standard practices of new
commercial buildings (or 50 – 80 % with more advanced approaches).
Retrofits can routinely achieve 25 – 70 % savings in total energy use
(Levine etal., 2007; Harvey, 2009).
9�3�2 Technological developments
since AR4
Since AR4, there have been important performance improvements
and cost reductions in many relevant technologies, and further sig-
nificant improvements are expected. Examples include (1) daylighting
and electric lighting (Dubois and Blomsterberg, 2011); (2) household
appliances (Bansal et al., 2011); (3) insulation materials (Baetens
etal., 2011; Korjenic etal., 2011; Jelle, 2011); (4) heat pumps (Chua
etal., 2010); (5) indirect evaporative cooling to replace chillers in dry
climates (Jiang and Xie, 2010); (6) fuel cells (Ito and Otsuka, 2011);
(7) advances in digital building automation and control systems
(NBI, 2011); and (8) smart meters and grids as a means of reducing
peak demand and accommodating intermittent renewable electric-
ity sources (Catania, 2012). Many of these measures can individually
reduce the relevant specific energy use by half or more. In addition
to the new technologies, practitioners have also increasingly applied
more established technology and knowledge both in new building
construction and in the existing building retrofits. These practices
have been driven in part by targeted demonstration programmes in
a number of countries. They have been accompanied by a progres-
sive strengthening of the energy provisions of building codes in
many countries, as well as by plans for significant further tightening
in the near future (see also Section 9.10). In the following sections
we review the literature published largely since AR4 concerning the
energy intensity of low-energy new buildings and of deep retrofits of
existing buildings.
Table 9�2 | Savings or off-site energy use reductions achievable in buildings for various end uses due to on-site active solar energy systems, efficiency improvements, or behavioural
changes.
End Use On-site C-Free Energy Supply
(1)
Device Efficiency System Efficiency Behavioural Change
Heating 20 % – 95 %
(2)
30 %
(3)
– 80 %
(4)
90 %
(5)
10 % – 30 %
(6)
Hot water 50 % – 100 %
(7)
60 %
(8)
– 75 %
(9)
40 %
(10)
50 %
(11)
Cooling 50 % – 80 %
(12)
50 %
(13)
– 75 %
(14)
67 %
(15)
50 % – 67 %
(16)
Cooking 0 – 30 %
(17)
25 – 75 %
(18)
– 80 %
(19)
50 %
(20)
Lighting 10 – 30 % 75 %
(21)
; 83 % – 90 %
(22)
; 99.83 %
(23)
80 % – 93 %
(24)
70 %
(25)
Refrigerators 40 %
(25a)
30 %
(26)
; 50 %
(27)
Dishwashers 17+%
(27a)
75 %
(28)
Clothes washers 30 %
(28a)
60 % – 85 %
(29)
Clothes dryers 50+%
(29a)
10 % – 15 %
(30)
– 100 %
(31)
Office computers & monitors 40 %
(31a)
General electrical loads 10 % – 120 %
(32)
Notes:
(1)
Only active solar energy systems. Higher percentage contributions achievable if loads are first reduced through application of device, system, and behavioural efficiencies.
Passive solar heating, cooling, ventilation, and daylighting are considered under Systemic Efficiency.
(2)
Space heating. Lower value representative of combi-systems in Europe; upper
value is best solar district heating systems with seasonal underground thermal energy storage, after a 5-year spin-up (SAIC, 2013).
(3)
Replacement of 75 % efficient furnace / boiler
with 95 % efficient unit (e. g., condensing natural gas boilers).
(4)
Replacement of 80 % efficient furnace or boiler with ground-source heat pump with a seasonal COP for space
heating of 4 (from ground-source heat pumps in well-insulated new buildings in Germany (DEE, 2011).
(5)
Reduction from a representative cold-climate heating energy intensity of
150 kWh / m
2
/ yr to 15 kWh / m
2
/ yr (Passive House standard, Section 9.3.2).
(6)
Typical value; 2 °C cooler thermostat setting at heating season. Absolute savings is smaller but relative
savings is larger the better the thermal envelope of the building (see also Section 9.3.9).
(7)
Water heaters. 50 – 80 % of residential hot water needs supplied in Sydney, Australia
and Germany (Harvey, 2007), while upper limit of 100 % is conceivable in hot desert regions.
(8)
Replacement of a 60 % efficient with a 95 % efficient water heater (typical of
condensing and modulating wall-hung natural gas heaters).
(9)
Table 9.4.
(10)
Elimination of standby and distribution heat losses in residential buildings (typically accounting for
30 % water-heating energy use in North America (Harvey, 2007) through use of point-of-use on- demand water heaters.
(11)
Shorter showers, switch from bathing to showering, and
other hot-water-conserving behaviour.
(12)
Air conditioning and dehumidification. Range for systems from central to Southern Europe with a relatively large solar collector area in
relation to the cooling load (Harvey, 2007).
(13)
Replacement of air conditioners having a COP of 3 (typical in North America) with others with a COP of 6 (Japanese units); Table 9.4.
(14)
Replacement of North American units with units incorporating all potential efficiency improvements; Table 9.4.
(15)
Reduction (even elimination) of cooling loads through better
building orientation & envelopes, provision for passive cooling, and reduction of internal heat gains (Harvey, 2007).
(16)
Section 9.3.9. Fans during tolerable brief periods eliminating
cooling equipment in moderately hot climates.
(17)
Cooking range, various ovens.
(18)
Range pertains to various kinds of ovens; Table 9.4.
(19)
Replacement of 10 % – 15 % with 60 %
efficient (traditional biomass) cookstoves (Rawat etal., 2010).
(20)
Same recipe with different cooking practices; Table 9.4 / Section 9.3.9.
(21)
Replacement of 10 – 17 lm / W incandes-
cent lamps with 50 – 70 lm / W compact fluorescent (Harvey, 2010).
(22)
Replacement of 15 lm / W incandescent lamps with (year 2030) LEDs, 100 – 160 lm / W (McNeil etal., 2005;
US DOE, 2006).
(23)
Replacement of 0.25 lm / W kerosene lamps (Fouquet and Pearson, 2006) with future 150 lm / W LEDs.
(24)
Reduction from average US office lighting energy
intensity of the existing stock of 73 kWh / m
2
/ yr (Harvey, 2013) to 5 – 15 kWh / m
2
/ yr state-of-art systems (Harvey, 2013).
(25)
Turning off not needed lights (6000 hours / yr out of 8760
hours / yr).
(25a)
Table 9.4
(26)
12.5 ft
3
vs 18.5 ft
3
(350 litres, 350 kWh / yr vs 520 litres, 500 kWh / yr) refrigerator-freezers or 18.5 vs 30.5 ft
3
(860 litres, 700 kWh / yr) (Harvey, 2010).
(27)
Elimination of a second (‘beer’) fridge.
(27a)
Table 9.4
(28)
Fully loaded operation versus typical part-load operation (Table 9.4).
(28a)
by 2030 (Table 9.4).
(29)
Cold compared to hot
water washing, based on relative contribution of water heating to total clothes washer energy use for the best US&EU models (Harvey, 2010).
(29a)
Table 9.4.
(30)
Operation at full
load rather than at one-third to half load (Smith, 1997).
(31)
Air drying inside when there is no space heating requirement, or outside.
(31a)
Table 9.4.
(32)
Fraction of on-site electricity
demand typically generated by on-site PV with low demand kept low through electricity-efficiency measures.
Figure 9�8 | Residential electricity consumption by end-use in a policy scenario from
the Bottom-Up Energy Analysis System (BUENAS) model. Source: Cabeza etal. (2013b).
0
200
400
600
800
1000
1400
1200
Fans
Televisions
Laundry
Refrigerators
Lighting
OECD-1990
Non-OECD-1990
Electricity Consumption [TWh]
2030
2030
2010
2010
36%
28%
19%
14%
3.6%
22%
35%
26%
13%
4.7%
35%
30%
7.4%
11%
17%
26%
37%
10%
6.4%
20%

687687
Buildings
9
Chapter 9
9�3�3 Exemplary New Buildings
This section presents an overview of the energy performance and
incremental cost of exemplary buildings from around the world, based
on the detailed compilation of high-performance buildings presented
in Harvey (2013). The metrics of interest are the on-site energy inten-
sity — annual energy use per square meter of building floor area
(kWh / m
2
/ yr) — for those energy uses (heating, cooling, ventilation,
and lighting) that naturally increase with the building floor area, and
energy use per person for those energy uses — such as service hot
water, consumer electronics, appliances, and office equipment — that
naturally increase with population or the size of the workforce.
9�3�3�1 Energy intensity of new high-performance
buildings
The energy performance of new buildings have improved considerably
since AR4, as demonstrated in Table 9.3, which summarizes the specific
energy consumption for floor-area driven final energy uses by climate
type or region.
A number of voluntary standards for heating energy use have been
developed in various countries for residential buildings (see Table 1 in
Harvey, 2013). The most stringent of standards with regard to heat-
ing requirements is the Passive House standard, which prescribes a
ers, chillers, etc.), as are related net investment-cost savings — usually
several times higher (Levine et al., 2007; Harvey, 2008). Integrated
Design Process (IDP) allows for the systemic approach, which opti-
mizes building performance iteratively, and involves all design team
members from the start (Montanya et al., 2009; Pope and Tardiff,
2011). However, the conventional process of designing and construct-
ing a building and its systems is largely linear, in which design ele-
ments and system components are specified, built, and installed with-
out consideration of optimization opportunities in the following
design and building phases, thus losing key opportunities for the opti-
mization of whole buildings as systems (Lewis, 2004). As discussed in
AR4, essential steps in the design of low-energy buildings are: (1)
building orientation, thermal mass, and shape; (2) high-performance
envelope specification; (3) maximization of passive features (day-
lighting, heating, cooling, and ventilation); (4) efficient systems meet-
ing remaining loads; (5) highest possible efficiencies and adequate
sizing of individual energy-using devices; and (6) proper commission-
ing of systems and devices. Cost savings can substantially offset addi-
tional high-performance envelope and higher-efficiency equipment
costs, of around 35 – 50 % compared to standard practices of new
commercial buildings (or 50 – 80 % with more advanced approaches).
Retrofits can routinely achieve 25 – 70 % savings in total energy use
(Levine etal., 2007; Harvey, 2009).
9�3�2 Technological developments
since AR4
Since AR4, there have been important performance improvements
and cost reductions in many relevant technologies, and further sig-
nificant improvements are expected. Examples include (1) daylighting
and electric lighting (Dubois and Blomsterberg, 2011); (2) household
appliances (Bansal et al., 2011); (3) insulation materials (Baetens
etal., 2011; Korjenic etal., 2011; Jelle, 2011); (4) heat pumps (Chua
etal., 2010); (5) indirect evaporative cooling to replace chillers in dry
climates (Jiang and Xie, 2010); (6) fuel cells (Ito and Otsuka, 2011);
(7) advances in digital building automation and control systems
(NBI, 2011); and (8) smart meters and grids as a means of reducing
peak demand and accommodating intermittent renewable electric-
ity sources (Catania, 2012). Many of these measures can individually
reduce the relevant specific energy use by half or more. In addition
to the new technologies, practitioners have also increasingly applied
more established technology and knowledge both in new building
construction and in the existing building retrofits. These practices
have been driven in part by targeted demonstration programmes in
a number of countries. They have been accompanied by a progres-
sive strengthening of the energy provisions of building codes in
many countries, as well as by plans for significant further tightening
in the near future (see also Section 9.10). In the following sections
we review the literature published largely since AR4 concerning the
energy intensity of low-energy new buildings and of deep retrofits of
existing buildings.
Table 9�2 | Savings or off-site energy use reductions achievable in buildings for various end uses due to on-site active solar energy systems, efficiency improvements, or behavioural
changes.
End Use On-site C-Free Energy Supply
(1)
Device Efficiency System Efficiency Behavioural Change
Heating 20 % – 95 %
(2)
30 %
(3)
– 80 %
(4)
90 %
(5)
10 % – 30 %
(6)
Hot water 50 % – 100 %
(7)
60 %
(8)
– 75 %
(9)
40 %
(10)
50 %
(11)
Cooling 50 % – 80 %
(12)
50 %
(13)
– 75 %
(14)
67 %
(15)
50 % – 67 %
(16)
Cooking 0 – 30 %
(17)
25 – 75 %
(18)
– 80 %
(19)
50 %
(20)
Lighting 10 – 30 % 75 %
(21)
; 83 % – 90 %
(22)
; 99.83 %
(23)
80 % – 93 %
(24)
70 %
(25)
Refrigerators 40 %
(25a)
30 %
(26)
; 50 %
(27)
Dishwashers 17+%
(27a)
75 %
(28)
Clothes washers 30 %
(28a)
60 % – 85 %
(29)
Clothes dryers 50+%
(29a)
10 % – 15 %
(30)
– 100 %
(31)
Office computers & monitors 40 %
(31a)
General electrical loads 10 % – 120 %
(32)
Notes:
(1)
Only active solar energy systems. Higher percentage contributions achievable if loads are first reduced through application of device, system, and behavioural efficiencies.
Passive solar heating, cooling, ventilation, and daylighting are considered under Systemic Efficiency.
(2)
Space heating. Lower value representative of combi-systems in Europe; upper
value is best solar district heating systems with seasonal underground thermal energy storage, after a 5-year spin-up (SAIC, 2013).
(3)
Replacement of 75 % efficient furnace / boiler
with 95 % efficient unit (e. g., condensing natural gas boilers).
(4)
Replacement of 80 % efficient furnace or boiler with ground-source heat pump with a seasonal COP for space
heating of 4 (from ground-source heat pumps in well-insulated new buildings in Germany (DEE, 2011).
(5)
Reduction from a representative cold-climate heating energy intensity of
150 kWh / m
2
/ yr to 15 kWh / m
2
/ yr (Passive House standard, Section 9.3.2).
(6)
Typical value; 2 °C cooler thermostat setting at heating season. Absolute savings is smaller but relative
savings is larger the better the thermal envelope of the building (see also Section 9.3.9).
(7)
Water heaters. 50 – 80 % of residential hot water needs supplied in Sydney, Australia
and Germany (Harvey, 2007), while upper limit of 100 % is conceivable in hot desert regions.
(8)
Replacement of a 60 % efficient with a 95 % efficient water heater (typical of
condensing and modulating wall-hung natural gas heaters).
(9)
Table 9.4.
(10)
Elimination of standby and distribution heat losses in residential buildings (typically accounting for
30 % water-heating energy use in North America (Harvey, 2007) through use of point-of-use on- demand water heaters.
(11)
Shorter showers, switch from bathing to showering, and
other hot-water-conserving behaviour.
(12)
Air conditioning and dehumidification. Range for systems from central to Southern Europe with a relatively large solar collector area in
relation to the cooling load (Harvey, 2007).
(13)
Replacement of air conditioners having a COP of 3 (typical in North America) with others with a COP of 6 (Japanese units); Table 9.4.
(14)
Replacement of North American units with units incorporating all potential efficiency improvements; Table 9.4.
(15)
Reduction (even elimination) of cooling loads through better
building orientation & envelopes, provision for passive cooling, and reduction of internal heat gains (Harvey, 2007).
(16)
Section 9.3.9. Fans during tolerable brief periods eliminating
cooling equipment in moderately hot climates.
(17)
Cooking range, various ovens.
(18)
Range pertains to various kinds of ovens; Table 9.4.
(19)
Replacement of 10 % – 15 % with 60 %
efficient (traditional biomass) cookstoves (Rawat etal., 2010).
(20)
Same recipe with different cooking practices; Table 9.4 / Section 9.3.9.
(21)
Replacement of 10 – 17 lm / W incandes-
cent lamps with 50 – 70 lm / W compact fluorescent (Harvey, 2010).
(22)
Replacement of 15 lm / W incandescent lamps with (year 2030) LEDs, 100 – 160 lm / W (McNeil etal., 2005;
US DOE, 2006).
(23)
Replacement of 0.25 lm / W kerosene lamps (Fouquet and Pearson, 2006) with future 150 lm / W LEDs.
(24)
Reduction from average US office lighting energy
intensity of the existing stock of 73 kWh / m
2
/ yr (Harvey, 2013) to 5 – 15 kWh / m
2
/ yr state-of-art systems (Harvey, 2013).
(25)
Turning off not needed lights (6000 hours / yr out of 8760
hours / yr).
(25a)
Table 9.4
(26)
12.5 ft
3
vs 18.5 ft
3
(350 litres, 350 kWh / yr vs 520 litres, 500 kWh / yr) refrigerator-freezers or 18.5 vs 30.5 ft
3
(860 litres, 700 kWh / yr) (Harvey, 2010).
(27)
Elimination of a second (‘beer’) fridge.
(27a)
Table 9.4
(28)
Fully loaded operation versus typical part-load operation (Table 9.4).
(28a)
by 2030 (Table 9.4).
(29)
Cold compared to hot
water washing, based on relative contribution of water heating to total clothes washer energy use for the best US&EU models (Harvey, 2010).
(29a)
Table 9.4.
(30)
Operation at full
load rather than at one-third to half load (Smith, 1997).
(31)
Air drying inside when there is no space heating requirement, or outside.
(31a)
Table 9.4.
(32)
Fraction of on-site electricity
demand typically generated by on-site PV with low demand kept low through electricity-efficiency measures.

688688
Buildings
9
Chapter 9
heating load (assuming a uniform indoor temperature of 20°C) of no
more than 15 kWh / m
2
/ yr irrespective of the climate. It typically entails a
high-performance thermal envelope combined with mechanical ventila-
tion with heat recovery to ensure high indoor air quality. Approximately
57,000 buildings complied with this standard in 31 European countries
in 2012, covering 25.15 million square metres (Feist, 2012) with exam-
ples as far north as Helsinki, with significant additional floor area that
meets or exceeds the standard but have not been certified due to the
higher cost of certification. As seen from Table 9.3, this standard repre-
sents a factor of 6 – 12 reduction in heating load in mild climates (such
as Southern Europe) and up to a factor of 30 reduction in cold climate
regions where existing buildings have little to no insulation. Where
buildings are not currently heated to comfortable temperatures, adop-
tion of a high-performance envelope can aid in achieving comfortable
conditions while still reducing heating energy use in absolute terms.
Cooling energy use is growing rapidly in many regions where, with
proper attention to useful components of vernacular design combined
with modern passive design principles, mechanical air conditioning
would not be needed. This use includes regions that have a strong
diurnal temperature variation (where a combination of external insula-
tion, exposed interior thermal mass, and night ventilation can maintain
comfortable conditions), or a strong seasonal temperature variation
(so that the ground can be used to cool incoming ventilation air) or
which are dry, thereby permitting evaporative cooling or hybrid evapo-
rative / mechanical cooling strategies to be implemented.
Combining insulation levels that meet the Passive House standard for
heat demand in Southern Europe with the above strategies, heating
loads can be reduced by a factor of 6 – 12 (from 100 – 200 kWh / m
2
/ yr
to 10 – 15 kWh / m
2
/ yr) and cooling loads by a factor of 10 (from < 30
kWh / m
2
/ yr to < 3 kWh / m
2
/ yr) (Schneiders et al., 2009). With good
design, comfortable conditions can be maintained ≥80 % of the time
(and closer to 100 % of the time if fans are used) without mechanical
cooling in relatively hot and humid regions such as Southern China
(Ji etal., 2009; Zhang and Yoshino, 2010; Lin and Chuah, 2011), Viet-
nam (Nguyen etal., 2011), Brazil (Grigoletti etal., 2008; Andreasi etal.,
2010; Cândido etal., 2011), and the tropics (Lenoir etal., 2011).
In commercial buildings, specific energy consumption of modern office
and retail buildings are typically 200 – 500 kWh / m
2
/ yr including all
end-uses, whereas advanced buildings have frequently achieved less
than 100 kWh / m
2
/ yr in climates ranging from cold to hot and humid.
The Passive House standard for heating has been achieved in a wide
range of different types of commercial buildings in Europe. Sensible
cooling loads (energy that must be removed from, e. g., the air inside
a building) can typically be reduced by at least a factor of four com-
pared to recent new buildings — through measures to reduce cooling
loads (often by a factor of 2 – 4) and through more efficient systems
in meeting reduced loads (often a factor of two). Dehumidification
energy use is less amenable to reduction but can be met through solar-
powered desiccant dehumidification with minimal non-solar energy
requirements. Advanced lighting systems that include daylighting with
appropriate controls and sensors, and efficient electric lighting systems
(layout, ballasts, luminaires) typically achieve a factor of two reduc-
tion in energy intensity compared to typical new systems (Dubois and
Blomsterberg, 2011).
9�3�3�2 Monitoring and commissioning of new and
existing buildings
Commissioning is the process of systematically checking that all com-
ponents of building HVAC (Heating, Ventilation and Air Condition-
ing) and lighting systems have been installed properly and operate
correctly. It often identifies problems that, unless corrected, increase
energy use by 20 % or more, but is often not done (Piette etal., 2001).
Advanced building control systems are a key to obtaining very low
energy intensities in commercial buildings. It routinely takes over one
year or more to adjust the control systems so that they deliver the
expected savings (Jacobson etal., 2011) through detailed monitoring
of energy use once the building is occupied. Wagner etal. (2007) give
Table 9�3 | Typical and current best case specific energy consumption (kWh / m
2
/ yr) for building loads directly related to floor area (Harvey, 2013).
End Use Climate Region
Residential Commercial
Advanced Typical Advanced Typical
Heating Cold 15 – 30 60 – 200 15 – 30 75 – 250
Heating Moderate 10 – 20 40 – 100 10 – 30 40 – 100
Cooling Moderate 0 – 5 0 – 10 0 – 15 20 – 40
Cooling Hot-dry 0 – 10 10 – 20 0 – 10 20 – 50
Cooling Hot-humid 3 – 15 10 – 30 15 – 30 50 – 150
Ventilation All 4 – 8 0 – 8 0 – 20 10 – 50
Lighting All 2 – 4 3 – 10 5 – 20 30 – 80
Notes: Lighting energy intensity for residential buildings is based on typical modern intensities times a factor of 0.3 – 0.4 to account for an eventual transition to LED lighting.
Definitions here for climate regions for heating: Cold > 3000 HDD; Moderate 1000 – 3000 HDD. Similarly for cooling: moderate < 750 CDD; hot-dry > 750 CDD; hot-humid > 750
CDD. HDD = heating degree days (K-day) and CCD = cooling-degree days (K-day). Energy intensity ranges for commercial buildings exclude hospitals and research laboratories.

689689
Buildings
9
Chapter 9
an example where monitoring of a naturally ventilated and passively
cooled bank building in Frankfurt, Germany lead to a reduction in pri-
mary energy intensity from about 200 kWh / m
2
/ yr during the first year
of operation to 150 kWh / m
2
/ yr during the third year (with a predicted
improvement to 110 kWh / m
2
/ yr during the fourth year). Post-construc-
tion evaluation also provides opportunities for improving the design
and construction of subsequent buildings (Wingfield etal., 2011).
9�3�3�3 Zero energy / carbon and energy plus
buildings
Net zero energy buildings (NZEBs) refer to buildings with on-site
renewable energy systems (such as PV, wind turbines, or solar thermal)
that, over the year, generate as much energy as is consumed by the
building. NZEBs have varying definitions around the world, but these
typically refer to a net balance of on-site energy, or in terms of a net
balance of primary energy associated with fuels used by the building
and avoided through the net export of electricity to the power grid
(Marszal etal., 2011). Space heating and service hot water has been
supplied in NZEBs either through heat pumps (supplemented with
electric resistance heating on rare occasions), biomass boilers, or fossil
fuel-powered boilers, furnaces, or cogeneration. Musall etal. (2010)
identify almost 300 net zero or almost net zero energy buildings con-
structed worldwide (both commercial and residential). There have also
been some NZE retrofits of existing buildings. Several jurisdictions
have adopted legislation requiring some portion of, or all, new build-
ings to be NZEBs by specific times in the future (Kapsalaki and Leal,
2011).
An extension of the NZEB concept is the Positive-Energy Building Con-
cept (having net energy production) (Stylianou, 2011; Kolokotsa etal.,
2011). Issues related to NZEBs include (1) the feasibility of NZEBs; (2)
minimizing the cost of attaining an NZEB, where feasible; (3) the cost
of a least-cost NZEB in comparison with the cost of supplying a build-
ing’s residual energy needs (after implementing energy efficiency mea-
sures) from off-site renewable energy sources; (4) the sustainability of
NZEBs; (5) lifecycle energy use; and (6) impact on energy use of alter-
native uses or treatments of roofs.
To create a NZEB at minimal cost requires implementing energy saving
measures in the building in order of increasing cost up to the point
where the next energy savings measure would cost more than the cost
of on-site renewable energy systems. In approximately one-third of
NZEBs worldwide, the reduction in energy use compared to local con-
ventional buildings is about 60 % (Musall etal., 2010). Attaining net
zero energy use is easiest in buildings with a large roof area (to host
PV arrays) in relation to the building’s energy demand, so a require-
ment that buildings be NZEB will place a limit on the achievable height
and therefore on urban density. In Abu Dhabi, for example, NZEB is
possible in office buildings of up to five stories if internal heat gains
and lighting and HVAC loads are aggressively reduced (Phillips etal.,
2009).
9�3�3�4 Incremental cost of low-energy buildings
A large number of published studies on the incremental costs of spe-
cific low-energy buildings are reviewed in Harvey (2013). Summary
conclusions from this review, along with key studies underlying the
conclusions, are given here, with Table 9.4 presenting a small selection
to illustrate some of the main findings.
In the residential sector, several studies indicate an incremental cost
of achieving the Passive House standard in the range of 6 – 16 % of the
construction cost (about 66 – 265 USD
2010
/ m
2
) as compared to standard
construction. A variety of locations in the United States, show addi-
tional costs of houses that achieve 34 – 76 % reduction in energy use
of about 30 – 163 USD
2010
/ m
2
– this excludes solar PV for both savings
and costs (Parker, 2009). The extra cost of meeting the ‘Advanced’ ther-
mal envelope standard in the UK, which reduces heating energy use
by 44 % relative to the 2006 regulations, has been estimated at 7 – 9 %
(about 66 – 265 USD
2010
/ m
2
) relative to a design that meets the 2006
mandatory regulations — which have since been strengthened (Davis
Langdon and Element Energy, 2011).
Several cold-climate studies indicate that if no simplification of the
heating system is possible as a result of reducing heating require-
ments, then the optimal (least lifecycle cost, excluding environmen-
tal externalities) level of heating energy savings compared to recent
code-compliant buildings is about 20 – 50 % (Anderson et al., 2006;
Hasan etal., 2008; Kerr and Kosar, 2011; Kurnitski etal., 2011). How-
ever, there are several ways in which costs can be reduced: (1) if the
reference building has separate mechanical ventilation and hydronic
heating, then the hydronic heating system can be eliminated or at least
greatly simplified in houses meeting the Passive House standard (Feist
and Schnieders, 2009); (2) perimeter heating units or heating vents can
be eliminated with the use of sufficiently insulated windows, thereby
reducing plumbing or ductwork costs (Harvey and Siddal, 2008); (3) the
building shape can be simplified (reducing the surface area-to-volume
ratio), which both reduces construction costs and makes it easier to
reach any given low-energy standard (Treberspurg etal., 2010); and (4)
in Passive Houses (where heating cost is negligibly small), individual
metering units in multi-unit residential buildings could be eliminated
(Behr, 2009). As well, it can be expected that costs will decrease with
increasing experience and large-scale implementation on the part of
the design and construction industries. For residential buildings in
regions where cooling rather than heating is the dominant energy use,
the key to low cost and emissions is to achieve designs that can main-
tain comfortable indoor temperatures while permitting elimination of
mechanical cooling systems.
Available studies (such as in Table 9.4) indicate that the incremental
cost of low-energy buildings in the commercial sector is less than in the
residential sector, due to the greater opportunities for simplification of
the HVAC system, and that it is possible for low-energy commercial
buildings to cost less than conventional buildings. In particular, there
are a number of examples of educational and small office buildings

690690
Buildings
9
Chapter 9
that have been built to the Passive House standard at no additional
cost compared to similar conventional or less-stringently low-energy
local buildings (Anwyl, 2011; Pearson, 2011). The Research Support
Facilities Building (RSF) at the National Renewable Energy Labora-
tory (NREL) in Golden, Colorado achieved a 67 % reduction in energy
use (excluding the solar PV offset) at zero extra cost for the efficiency
measures, as the design team was contractually obliged to deliver a
low-energy building at no extra cost (Torcellini etal., 2010). Torcellini
and Pless (2012) present many opportunities for cost savings such that
low-energy buildings can often be delivered at no extra cost. Other
examples of low-energy buildings (50 – 60 % savings relative to stan-
dards at the time) that cost less than conventional buildings are given
in McDonell (2003) and IFE (2005). New Buildings Institute (2012)
reports examples of net-zero-energy buildings that cost no more than
conventional buildings. Even when low-energy buildings cost more, the
incremental costs are often small enough that they can be paid back
in energy cost savings within a few years or less (Harvey, 2013). The
keys to delivering low-energy buildings at zero or little additional cost
are through implementation of the Integrated Design Process (IDP;
described in Section 9.3.1) and the design-bid-build process. Vaidya
etal. (2009) discuss how the traditional, linear design process leads
to missed opportunities for energy savings and cost reduction, often
leading to the rejection of highly attractive energy savings measures.
9�3�4 Retrofits of existing buildings
As buildings are very long-lived and a large proportion of the total
building stock existing today will still exist in 2050 in developed coun-
tries, retrofitting the existing stock is key to a low-emission building
sector.
9�3�4�1 Energy savings
Numerous case studies of individual retrofit projects (in which mea-
sures, savings, and costs are documented) are reviewed in Harvey
(2013), but a few broad generalizations are: (1) For detached single-
family homes, the most comprehensive retrofit packages have achieved
reductions in total energy use by 50 – 75 %; (2) in multi-family hous-
ing (such as apartment blocks), a number of projects have achieved
reductions in space heating requirements by 80 – 90 %, approaching,
in many cases, the Passive House standard for new buildings; (3) rela-
tively modest envelope upgrades to multi-family housing in developing
countries such as China have achieved reductions in cooling energy
use by about one-third to one-half, and reductions in heating energy
use by two-thirds; (4) in commercial buildings, savings in total HVAC
energy use achieved through upgrades to equipment and control sys-
tems, but without changing the building envelope, are typically on the
order of 25 – 50 %; (5) eventual re-cladding of building façades — espe-
cially when the existing façade is largely glass with a high solar heat
gain coefficient, no external shading, and no provision for passive ven-
tilation, and cooling — offers an opportunity for yet further significant
savings in HVAC energy use; and (6) lighting retrofits of commercial
buildings in the early 2000s typically achieved a 30 – 60 % energy sav-
ings (Bertoldi and Ciugudeanu, 2005).
9�3�4�2 Incremental cost
Various isolated studies of individual buildings and systematic pilot
projects involving many buildings, reviewed in Harvey (2013), indi-
cate potentials (with comprehensive insulation and window upgrades,
air sealing, and implementation of mechanical ventilation with heat
recovery) reductions in heating energy requirements of 50 – 75 % in
single-family housing and 50 – 90 % in multi-family housing at costs
of about 100 – 400 USD
2010
/ m
2
above that which would be required
for a routine renovation. For a small selection of these studies, see
Table 9.4. In the commercial sector, significant savings can often be
achieved at very low cost simply through retro-commissioning of
equipment. Mills (2011) evaluated the benefits of commissioning and
retro-commissioning for a sample of 643 buildings across the United
States and reports a 16 % median whole-building energy savings in
California, with a mean payback time of 1.1 years. Rødsjø etal. (2010)
showed that among the 60 demonstration projects reviewed, the aver-
age primary energy demand savings was 76 %, and 13 of the projects
reached or almost reached the Passive House standard. Although ret-
rofits generally entail a large upfront cost, they also generate large
annual cost savings, and so are often attractive from a purely eco-
nomic point of view. Korytarova and Ürge-Vorsatz (2012) note that
shallow retrofits can result in greater lifecycle costs than deep retro-
fits. Mata etal. (2010) studied 23 retrofit measures for buildings in
Sweden and report a simple technical potential for energy savings in
the residential sector of 68 % of annual energy use. They estimated a
cost per kWh saved between – 0.09 USD
2010
/ kWh (appliance upgrades)
and +0.45 USD
2010
/ kWh (façade retrofit). Polly etal. (2011) present a
method for determining optimal residential energy efficiency retrofit
packages in the United States, and identify near-cost-neutral packages
of measures providing between 29 % and 48 % energy savings across
eight US locations. Lewis (2004) has compiled information from sev-
eral studies in old buildings in Europe and indicates that the total and
marginal cost of conserved energy both tend to be relatively uniform
for savings of up to 70 – 80 %, but increase markedly for savings of
greater than 80 % or for final heating energy intensities of less than
about 40 kWh / m
2
/ yr.
9�3�5 Appliances, consumer electronics, office
equipment, and lighting
Residential appliances have dramatically improved in efficiency over
time, particularly in OECD countries (Barthel and Götz, 2013; Labanca
and Paolo, 2013) due to polices such as efficiency standards, labels, and
subsides and technological progress. Improvements are also appear-
ing in developing countries such as China (Barthel and Götz, 2013)
and less developed countries, such as Ghana (Antwi-Agyei, 2013). Old

691691
Buildings
9
Chapter 9
Table 9�4 | Summary of estimates for extra investment cost required for selected very low- / zero-energy buildings.
Case Location Type Energy performance Extra investment costs
CCE
(USD
2010
/ kWh)
References
Passive House Projects Central Europe New Passive House standard 5 – 8 % (143 – 225 USD
2010
/ m
2
) – (Bretzke, 2005; Schnieders
and Hermelink, 2006)
5 Passive Houses Belgium New 62 kWh / m
2
/ yr total 16 % (252 USD
2010
/ m
2
) – (Audenaert etal., 2008)
Passive House apartment block Vienna New Passive House standard 5 % (69 USD
2010
/ m
2
) – (Mahdavi and
Doppelbauer, 2010)
12 very low or net zero-
energy houses
United States New 0.07 – 0.12 USD
2010
/ kWh (CCE) – (Parker, 2009)
10 buildings in the
SolarBauprogramme
Germany New < 100 kWh / m
2
/ yr
primary energy vs.
300 – 600 — conventional
Comparable to the difference
in costs between alternative
standards for interior finishes
– (Wagner etal., 2004)
High performance
commercial buildings
Vancouver New 100 kWh / m
2
/ yr total
vs. 180 — conventional
10 % lower cost – (McDonell, 2003)
Offices and laboratory,
Concordia University
Montreal New 2.30 % – (Lemire and Charneux, 2005)
Welsh Information and
Technology Adult Learning
Centre (CaolfanHyddgen)
Wales New Passive House standard No extra cost compared to
BREEAM ‘Excellent’ standard
– (Pearson, 2011)
Hypothetical 6,000 m
2
office building
Las Vegas New 42 % of energy savings USD
2010
2,719 – (Vaidya etal., 2009)
10-story, 7,000 m
2
residential building
Denmark New 14 kWh / m
2
/ yr
(heating) vs. 45
3.4 % (115 USD
2010
/ m
2
) – (Marszal and Heiselberg, 2009)
Leslie Shao-Ming Sun Field
Station, Stanford University
California New NZEB 4 – 10 % more based on
hard construction costs
– (NBI, 2011)
Hudson Valley Clean
Energy Headquarters
New York New NZEB 665 USD
2010
/ month in mortgage
payments but saves 823
USD
2010
/ month in energy costs
– (NBI, 2011)
IAMU Office Ankeny, IA New NZEB None – (NBI, 2011)
EcoFlats Building Portland, OR New NZEB None – (NBI, 2011)
10-story, 7,000 m
2
residential building
Denmark New NZEB 24 % (558 USD
2010
/ m
2
) – (Marszal and Heiselberg, 2009)
Toronto towers Toronto Retrofit 194 / 95 % 259 USD
2010
/ m
2
0.052 (Kesik and Saleff, 2009)
Multi-family housing EU Retrofit 62 – 150 / 52 % – 86 % 53 – 124 USD
2010
/ m
2
0.014 – 0.023 (Petersdorff etal., 2005)
Terrace housing EU Retrofit 97 – 266 / 59 % – 84 % 90 – 207 USD
2010
/ m
2
0.13 – 0.023 (Petersdorff etal., 2005)
High-rise housing EU Retrofit 70 % – 81 % 2.5 – 5.8 USD
2010
/ m
2
/ yr 0.018 – 0.028 (Waide etal., 2006)
1950s MFH Germany Retrofit 82 – 247 / 30 % – 90 % 48 – 416 USD
2010
/ m
2
0.023 – 0.065 (Galvin, 2010)
1925 SFH Denmark Retrofit 120 217 USD
2010
/ m
2
0.071 (Kragh and Rose, 2011)
1929 MFH Germany Retrofit 140 – 200 / 58 % – 82 % 167 – 340 USD
2010
/ m
2
0.060 – 0.088 (Hermelink, 2009)
19th century flat UK Retrofit 192 – 234 / 48 % – 59 % 305 – 762 USD
2010
/ m
2
0.068 – 0.140 (United House, 2009)
appliances consume 650 TWh worldwide, which is almost 14 % of total
residential electricity consumption (Barthel and Götz, 2013).
Table 9.5 summarizes potential reductions in unit energy by house-
hold appliances and equipment through improved technologies. The
saving potentials identified for individual equipment are typically
40 – 50 %. Indeed, energy use by the most efficient appliances avail-
able today is often 30 – 50 % less than required by standards; the
European A+++ model refrigerator, for example, consumes 50 %
less electricity than the current regulated level in the EU (Letschert
etal., 2013a), while the most efficient televisions awarded under the
Super-efficient Equipment and Appliance Deployment (SEAD) initia-
tive use 33 – 44 % less electricity than similar televisions (Ravi etal.,
2013). Aggregate energy consumption by these items is expected
to continue to grow rapidly as the types and number of equipment
proliferate, and ownership rates increase with wealth. This will occur
unless standards are used to induce close to the maximum techni-
cally achievable reduction in unit energy requirements. Despite pro-
jected large increase in the stock of domestic appliances, especially
in developing countries, total appliance energy consumption could be
reduced if the best available technology were installed (Barthel and
Götz, 2013; Letschert etal., 2013b). This could yield energy savings of

692692
Buildings
9
Chapter 9
2600 TWh / yr by 2030 between the EU, United States, China and India
(Letschert etal., 2013a). Ultra-low-power micro-computers in a wide
variety of appliances and electronic equipment also have the potential
to greatly reduce energy use through better control (Koomey etal.,
2013). Conversely, new types of electronic equipment for ICT (e. g.,
satellite receivers, broadband home gateways, etc.), broadband and
network equipment, and dedicated data centre buildings are predicted
to increase their energy consumption (Fettweis and Zimmermann,
2008; Bolla etal., 2011; Bertoldi, 2012). Solid State Lighting (SSL) is
revolutionizing the field of lighting. In the long term, inorganic light
emitting diodes (LEDs) are expected to become the most widely used
light sources. White LEDs have shown a steady growth in efficacy for
more than fifteen years, with average values of 65 – 70 lm / W (Schäppi
and Bogner, 2013) and the best products achieving 100 lm / W (Moura
etal., 2013). LED lighting will soon reach efficacy levels above all the
other commercially available light source (Aman etal., 2013), includ-
ing high efficiency fluorescent lamps.
9�3�6 Halocarbons
The emissions of F-gases (see Chapter 1 Table 1.1 and Chapter 5.3.1)
related to the building sector primarily originate from cooling / refriger-
ation and insulation with foams. The sector’s share of total F-gas emis-
Table 9�5 | Potential savings in energy consumption by household appliances and equipment.
Item Savings potential Reference
Televisions Average energy use of units sold in the United States (largely LCDs) was426 kWh / yr in
2008 and 102 kWh / yr in 2012. Further reductions (30 – 50 % below LCD TVs) are expected
with use of organic LED backlighting (likely commercially available by 2015).
(Howard etal., 2012;
Letschert etal., 2012)
Televisions Energy savings of best available TVs compared to market norms are 32 – 45 % in
Europe, 44 – 58 % in North America, and 55 – 60 % in Australia
(Park, 2013)
Computer monitors 70 % reduction in on-mode power draw expected from 2011 to 2015 (Park etal., 2013)
Computing At least a factor of 10 million potential reduction in the energy required per
computation (going well beyond the so-called Feynman limit).
(Koomey etal., 2013)
Refrigerator-freezer units 40 % minimum potential savings compared to the best standards, 27 % savings
at ≤0.11 USD
2010
/ kWh CCE (Costs of Conserved Energy)
(Bansal etal., 2011;
McNeil and Bojda, 2012)
Cooking 50 % savings potential (in Europe), largely through more efficient cooking practices alone (Fechter and Porter, 1979;
Oberascher etal., 2011)
Ovens 25 % and 45 % potential savings through advanced technology in natural gas and
conventional electric ovens, respectively, and 75 % for microwave ovens
(Mugdal, 2011; Bansal etal., 2011)
Dishwashers Typically only 40 – 45 % loaded, increasing energy use per place setting by 77 – 97 % for 3 dishwashers studied (Richter, 2011)
Dishwashers Current initiative targets 17 % less electricity, 35 % less water than best US standard (Bansal etal., 2011)
Clothes washers Global 28 % potential savings by 2030 relative to business-as-usual (Letschert etal., 2012)
Clothes Dryers Factor of two difference between best and average units on the market in Europe (0.27
kWh / kg vs 0.59 kWh / kg). More than a factor of 2 reduction in going from United States
average to European heat pump dryer (820 kWh / yr vs 380 kWh / yr)
(Werle etal., 2011)
Standby loads Potential of < 0.005 W for adapters and chargers, < 0.05 for large appliances (‘zero’
in both cases) (typical mid 2000s standby power draw: 5 – 15 W)
(Harvey, 2010; Matthews, 2011),
(Harvey, 2010) for mid 2000s data
Air conditioners COP (a measure of efficiency) of 2.5 – 3.5 in Europe and United States,
5.0 – 6.5 in Japan (implies up to 50 % energy savings)
(Waide etal., 2011)
Air conditioners COP of 4.2 – 6.8 for air conditioners such that the cost of saving electricity does not exceed the local
cost of electricity, and a potential COP of 7.3 – 10.2 if all available energy-saving measures were to
be implemented (implies a 50 – 75 % savings for a given cooling load and operating pattern).
(Shah etal., 2013)
Ceiling fans 50 – 57 % energy savings potential (Letschert etal., 2012;
Sathaye etal., 2013)
Package of household
appliances in Portugal
60 % less energy consumption by best available equipment compared to typically-used equipment (da Graca etal., 2012)
Office computers and monitors 40 % savings from existing low-to-zero cost measures only (Mercier and Morrefield, 2009)
Circulation pumps for hydronic
heating and cooling
40 % savings from projected energy use in 2020 in Europe (relative to a baseline with
efficiencies as of 2004) due to legislated standards already in place
(Bidstrup, 2011)
Residential lighting Efficacies (lm / W) (higher is better): standard incandescent, 15; CFL, 60; best currently
available white-light LEDs, 100; current laboratory LEDs, 250
(Letschert etal., 2012)
Residential water-using fixtures 50 – 80 % reduction in water use by water-saving fixtures compared to older standard fixtures (Harvey, 2010)
Residential water heaters Typical efficiency factor (EF) for gas and electric water heaters in the USA is 0.67 and 0.8 in EU, while the most
efficient heat-pump water heaters have EF=2.35 and an EF of 3.0 is foreseeable (factor of 4 improvement)
(Letschert etal., 2012)

693693
Buildings
9
Chapter 9
sions is subject to high variation due to uncertainties, lack of detailed
reporting and differences in accounting conventions. The following
section discusses the role of the buildings sector in F-gas emissions
under these constraints.
F-gases are used in buildings through several types of products and
appliances, including refrigeration, air conditioning, in foams (such
as for insulation) as blowing agents, fire extinguishers, and aero-
sols. The resulting share of the building sector in the total F-gas
emissions, similarly to indirect CO
2
emissions from electricity gen-
eration, depends on their attribution. Inventories, such as EDGAR
(JRC / PBL, 2013), are related to the production and sales of these
gases and differing accounting conventions attribute emissions
based on the point of their use, emissions, or production (UNEP,
2011a; EEA, 2013; US EPA, 2013). IPCC emission categories pro-
vide numbers to different sources of emission but do not system-
atically attribute these to sectors. Attribution can be done using a
production or consumption perspective, rendering different sectoral
shares (see Chapter 5.2.3.3). Compounding this variation, there are
uncertainties resulting from the lack of attribution of the use of cer-
tain emission categories to different sectors they are used in and
uncertainties in reported figures for the same emissions by different
sources.
As a guidance on the share of F-gases in the building sector, for
example, EDGAR (JRC / PBL, 2013; Annex II.9) attributed 12 % of direct
F-gas emissions to the building sector in 2010 (JRC / PBL, 2013; Annex
II.9). Of a further share of 22.3 % of F-gas emissions (21 % from HFC
and SF6 production and 1.3 % from foam blowing) a substantial part
can be allocated to the buildings sector. The greatest uncertainty of
attribution of IPCC categories to the buildings sector is the share of
Refrigeration and Air Conditioning Equipment (2F1a). This totals to up
to one-third for the share of (direct plus indirect) buildings in F-gas
emissions.
As another proxy, EDGAR estimates that HFCs represent the largest
share (GWP adjusted) in the total F-gas emissions, at about 76 % of
total 2010 F-gas emissions (JRC / PBL, 2013). Global HFC emissions
are reported to be 760 MtCO
2
eq by EDGAR (JRC / PBL, 2013); and
1100 MtCO
2
eq by the US EPA (2010). These gases are used mostly
(55 % of total in 2010) in refrigeration and air-conditioning equip-
ment in homes, other buildings and industrial operations (UNEP,
2011a).
While F-gases represent a small fraction of the current total GHG emis-
sions — around 2 % (see Chapter 1.2 and Chapter 5.2), their emissions
are projected to grow in the coming decades, mostly due to increased
demand for cooling and because they are the primary substitutes for
ozone-depleting substances (US EPA, 2013).
Measures to reduce these emissions include the phase-out of HFCs
and minimization of the need for mechanical cooling through high-
performance buildings, as discussed in the following sections. The
use of F-gases as an expanding agent in polyurethane foam has
been banned in the EU since 2008, and by 2005, 85 % of produc-
tion had already been shifted to hydrocarbons (having a much
lower GWP). In Germany, almost all new refrigerators use natural
refrigerants (isobutane, HC-600a, and propane, HC-29), which have
great potential to reduce emissions during the operation and servic-
ing of HFC-containing equipment (McCulloch, 2009; Rhiemeier and
Harnisch, 2009). Their use in insulation materials saves heating and
cooling related CO
2
emissions and thus their use in these materi-
als still typically has a net benefit to GHG emissions, but a lifecycle
assessment is required to determine the net effect on a case-by-case
basis.
9�3�7 Avoiding mechanical heating, cooling,
and ventilation systems
In many parts of the world, high-performance mechanical cooling sys-
tems are not affordable, especially those used for residential hous-
ing. The goal, then is to use principles of low-energy design to pro-
vide comfortable conditions as much of the time as possible, thereby
reducing the pressure to later install energy-intensive cooling equip-
ment such as air conditioners. These principles are embedded in ver-
nacular designs throughout the world, which evolved over centuries in
the absence of mechanical heating and cooling systems. For example,
vernacular housing in Vietnam (Nguyen etal., 2011) experienced con-
ditions warmer than 31 °C only 6 % of the time. The natural and pas-
sive control system of traditional housing in Kerala, India has been
shown to maintain bedroom temperatures of 23 – 29 °C even as out-
door temperatures vary from 17 – 36 °C on a diurnal time scale (Dili
etal., 2010). While these examples show that vernacular architecture
can be an energy efficient option, in order to promote the technology,
it is necessary to consider the cultural and convenience factors and
perceptions concerning ‘modern’ approaches, as well as the environ-
mental performance, that influence the decision to adopt or abandon
vernacular approaches (Foruzanmehr and Vellinga, 2011). In some
cases, modern knowledge and techniques can be used to improve ver-
nacular designs.
9�3�8 Uses of biomass
Biomass is the single largest source of energy for buildings at the
global scale, and it plays an important role for space heating, pro-
duction of hot water, and for cooking in many developing countries
(IEA, 2012d). Compared to open fires, advanced biomass stoves pro-
vide fuel savings of 30 – 60 % and reduce indoor air pollution levels
by 80 – 90 % for models with chimneys (Ürge-Vorsatz etal., 2012b).
For example, in the state of Arunachal Pradesh, advanced cookstoves
with an efficiency of 60 %, has been used in place of traditional cook-
stoves with an efficiency of 6 – 8 % (Rawat etal., 2010). Gasifier and
biogas cookstoves have also undergone major developments since
AR4.

694694
Buildings
9
Chapter 9
9�3�9 Embodied energy and building materials
lifecycle
Research published since AR4 confirms that the total lifecycle energy
use of low-energy buildings is less than that of conventional buildings,
in spite of generally greater embodied energy in the materials and
energy efficiency features (Citherlet and Defaux, 2007; GEA, 2012).
However, the embodied energy and carbon in construction materials
is especially important in regions with high construction rates, and
the availability of affordable low-carbon, low-energy materials that
can be part of high-performance buildings determines construction-
related emissions substantially in rapidly developing countries (Sar-
tori and Hestnes, 2007; Karlsson and Moshfegh, 2007; Ramesh etal.,
2010). A review of lifecycle assessment, lifecycle energy analysis, and
material flow analysis in buildings (conventional and traditional) can
be found in Cabeza et al. (2013a). Recent research indicates that
wood-based wall systems entail 10 – 20 % less embodied energy than
traditional concrete systems (Upton etal., 2008; Sathre and Gustavs-
son, 2009) and that concrete-framed buildings entail less embodied
energy than steel-framed buildings (Xing et al., 2008). Insulation
materials entail a wide range of embodied energy per unit volume,
and the time required to pay back the energy cost of successive incre-
ments insulation through heating energy savings increases as more
insulation is added. However, this marginal payback time is less than
the expected lifespan of insulation (50 years) even as the insulation
level is increased to that required to meet the Passive House standard
(Harvey, 2007). The embodied energy of biomass-based insulation
products is not lower than that of many non-biomass insulation prod-
ucts when the energy value of the biomass feedstock is accounted for,
but is less if an energy credit can be given for incineration with cogen-
eration of electricity and heat, assuming the insulation is extracted
during demolition of the building at the end of its life (Ardente etal.,
2008).
9�3�10 Behavioural and lifestyle
impacts
Chapter 2 discusses behavioural issues in a broad sense. There are
substantial differences in building energy use in the world driven
largely by behaviour and culture. Factors of 3 to 10 differences can
be found worldwide in residential energy use for similar dwellings
with same occupancy and comfort levels (Zhang etal., 2010), and
up to 10 times difference in office buildings with same climate
and same building functions with similar comfort and health levels
(Batty etal., 1991; Zhaojian and Qingpeng, 2007; Zhang etal., 2010;
Grinshpon, 2011; Xiao, 2011). The major characteristics of the lower
energy use buildings are windows that can be opened for natural
ventilation, part time & part space control of indoor environment
(thermal and lighting), and variably controllable indoor thermal
parameters (temperature, humidity, illumination and fresh air). These
are traditional approaches to obtain a suitable indoor climate and
thermal comfort. However, since the spread of globalized supply of
commercial thermal conditioning, heating / cooling solutions tend
towards fully controlled indoor climates through mechanical systems
and these typically result in a significantly increased energy demand
(TUBESRC, 2009). An alternative development pathway to the ubiq-
uitous use of fully conditioned spaces by automatically operated
mechanical systems is to integrate key elements of the traditional
lifestyles in buildings, in particular through the use of 'part-time'
and 'part-space' indoor climate conditioning, using mechanical sys-
tems only for the remaining needs when passive approaches can-
not meet comfort demands. Such pathways can reach the energy use
levels below 30 kWh
e
/ m
2
/ yr as a world average (TUBESRC, 2009;
Murakami etal., 2009), as opposed to the 30 – 50 kWh
e
/ m
2
/ yr achiev-
able through building development pathways utilizing fully automa-
tized full thermal conditioning (Murakami etal., 2009; Yoshino etal.,
2011).
Behaviour and local cultural factors can drive basic energy use prac-
tices, such as how people and organizations adjust their thermostats
during different times of the year. During the cooling season, increas-
ing the thermostat setting from 24 °C to 28 °C will reduce annual cool-
ing energy use by more than a factor of three for a typical office build-
ing in Zurich and by more than a factor of two in Rome (Jaboyedoff
etal., 2004), and by a factor of two to three if the thermostat setting is
increased from 23 °C to 27 °C for night-time air conditioning of bed-
rooms in apartments in Hong Kong (Lin and Deng, 2004). Thermostat
settings are also influenced by dress codes and cultural expectations
towards attires, and thus major energy savings can be achieved
through changes in attire standards, for example Japan’s ‘Cool Biz’ ini-
tiative to relax certain business dress codes to allow higher thermostat
settings (GEA, 2011).
Behaviour and lifestyle are crucial drivers of building energy use in
more complex ways, too. Figure 9.9 shows the electricity use for sum-
mer cooling in apartments of the same building (occupied by house-
holds of similar affluence and size) in Beijing (Zhaojian and Qingpeng,
2007), ranging from 0.5 to 14.2 kWh / m
2
/ yr. The use difference is
Figure 9�9 | Annual measured electricity per unit of floor space for cooling in an apart-
ment block in Beijing (Zhang etal., 2010).
0
2
4
6
8
10
12
14
1 2 3 4 5 6 7 8 9 10 11 12 13 14 15 16 17 18 19 20 21 22 23 24 25
Appartments Ordered by Electricity Consumption [Rank]
Electricity Consumption of Cooling Systems [kWh/m
2
/yr]
Average: 2.3
Figure 9�10 | Annual total electricity use per unit of floor space of buildings on a university campus in Beijing, China, 2006 (Zhang etal., 2010).
Buildings Ordered by Electricity Consumption [Rank]
Electricity Use [kWh/m
2
/yr]
Average: 30
0
50
100
150
200
3 5 7 9 1 3 5 7 9 11 13 15 17 1 3 5 7 9 111 13
Average: 64
Average: 82
Buildings with Fans Only Buildings with Split A/C Units Buildings with Centralized A/C System
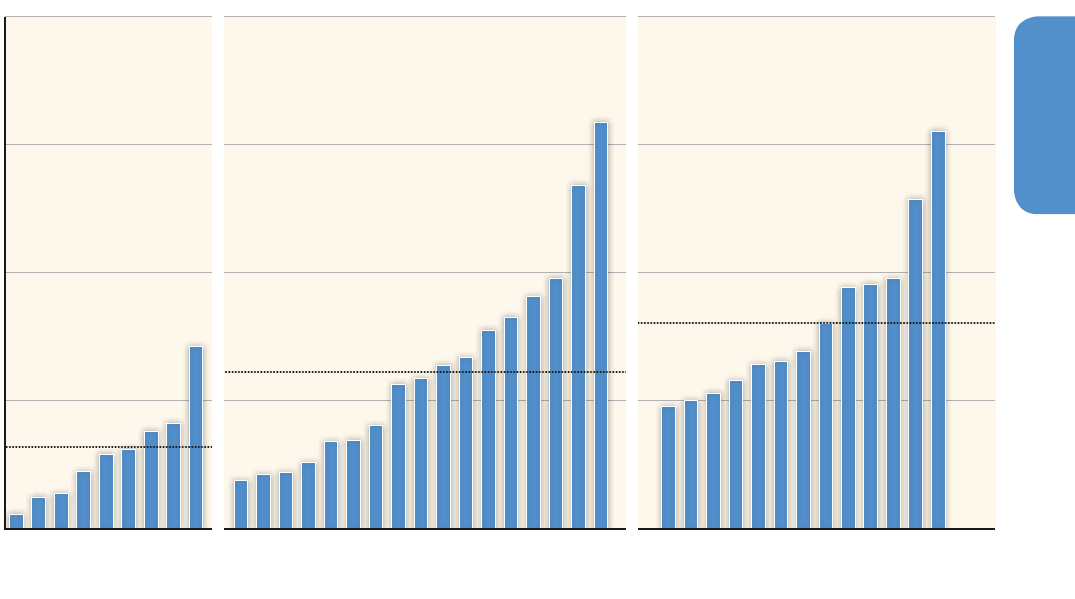
695695
Buildings
9
Chapter 9
mainly caused by different operating hours of the split air-conditioner
units. Opening windows during summer and relying on natural venti-
lation can reduce the cooling load while maintaining indoor air qual-
ity in most warm climate countries (Batty etal., 1991), compared to
solely relying on mechanical ventilation (Yoshino etal., 2011). Build-
ings with high-performance centralized air-conditioning can use much
more energy than decentralized split units that operate part time and
for partial space cooling, with a factor of 9 found by (Zhaojian and
Qingpeng, 2007; Murakami etal., 2009), as also illustrated in Fig-
ure 9.10. There are similar findings for other energy end-uses, such
as clothes dryers (the dominant practice in laundering in the United
States) consuming about 600 – 1000 kWh / yr, while drying naturally is
dominant in developing and even in many developed countries (Grin-
shpon, 2011).
Quantitative modelling of the impact of future lifestyle change on
energy demand shows that, in developed countries where energy ser-
vice levels are already high, lifestyle change can produce substantial
energy use reductions. In the United States, for example, the short term
behavioural change potential is estimated to be at least 20 % (Dietz
et al., 2009) and over long periods of time, much more substantial
reductions (typically 50 %) are possible, even in developed countries
with relatively low consumption (Fujino etal., 2008; Eyre etal., 2010).
Similar absolute reductions are not possible in developing countries
where energy services demands need to grow to satisfy development
needs. However, the rate of growth can be reduced by lower consump-
tion lifestyles (Wei etal., 2007; Sukla etal., 2008). For more on con-
sumption, see also Section 4.4.
Energy use of buildings of similar functions and occupancies can vary
by a factor of 2 – 10, depending on culture and behaviour. For instance,
Figure 9.10 and Figure 9.11 show the electricity usage of the HVAC
system at two university campuses (in Philadelphia and Beijing) with
similar climates and functions. The differences arise from: operating
hours of lighting and ventilation (24h / day vs. 12h / day); full mechani-
cal ventilation in all seasons versus natural ventilation for most of the
year; and district cooling with selective re-heating versus seasonal
decentralized air-conditioning. When the diversity of users’ activities
is taken into account, different technologies may be needed to satisfy
the energy service demand. Therefore, buildings and their energy infra-
structure need to be designed, built, and used taking into account cul-
ture, norms, and occupant behaviour. One universal standard of ‘high
efficiency’ based on certain cultural activities may increase the energy
usage in buildings with other cultural backgrounds, raising costs and
emissions without improving the living standards. This is demonstrated
in a recent case study of 10 ‘low-energy demonstration buildings’ in
China built in international collaborations. Most of these demonstra-
tion buildings use more energy in operation than ordinary buildings
with the same functions and service levels (Xiao, 2011). Although sev-
eral energy saving technologies have been applied, occupant behav-
iours were also restricted by, for instance, using techniques only suit-
able for full-time and full-space cooling.
commercial thermal conditioning, heating / cooling solutions tend
towards fully controlled indoor climates through mechanical systems
and these typically result in a significantly increased energy demand
(TUBESRC, 2009). An alternative development pathway to the ubiq-
uitous use of fully conditioned spaces by automatically operated
mechanical systems is to integrate key elements of the traditional
lifestyles in buildings, in particular through the use of 'part-time'
and 'part-space' indoor climate conditioning, using mechanical sys-
tems only for the remaining needs when passive approaches can-
not meet comfort demands. Such pathways can reach the energy use
levels below 30 kWh
e
/ m
2
/ yr as a world average (TUBESRC, 2009;
Murakami etal., 2009), as opposed to the 30 – 50 kWh
e
/ m
2
/ yr achiev-
able through building development pathways utilizing fully automa-
tized full thermal conditioning (Murakami etal., 2009; Yoshino etal.,
2011).
Behaviour and local cultural factors can drive basic energy use prac-
tices, such as how people and organizations adjust their thermostats
during different times of the year. During the cooling season, increas-
ing the thermostat setting from 24 °C to 28 °C will reduce annual cool-
ing energy use by more than a factor of three for a typical office build-
ing in Zurich and by more than a factor of two in Rome (Jaboyedoff
etal., 2004), and by a factor of two to three if the thermostat setting is
increased from 23 °C to 27 °C for night-time air conditioning of bed-
rooms in apartments in Hong Kong (Lin and Deng, 2004). Thermostat
settings are also influenced by dress codes and cultural expectations
towards attires, and thus major energy savings can be achieved
through changes in attire standards, for example Japan’s ‘Cool Biz’ ini-
tiative to relax certain business dress codes to allow higher thermostat
settings (GEA, 2011).
Behaviour and lifestyle are crucial drivers of building energy use in
more complex ways, too. Figure 9.9 shows the electricity use for sum-
mer cooling in apartments of the same building (occupied by house-
holds of similar affluence and size) in Beijing (Zhaojian and Qingpeng,
2007), ranging from 0.5 to 14.2 kWh / m
2
/ yr. The use difference is
Figure 9�9 | Annual measured electricity per unit of floor space for cooling in an apart-
ment block in Beijing (Zhang etal., 2010).
0
2
4
6
8
10
12
14
1 2 3 4 5 6 7 8 9 10 11 12 13 14 15 16 17 18 19 20 21 22 23 24 25
Appartments Ordered by Electricity Consumption [Rank]
Electricity Consumption of Cooling Systems [kWh/m
2
/yr]
Average: 2.3
Figure 9�10 | Annual total electricity use per unit of floor space of buildings on a university campus in Beijing, China, 2006 (Zhang etal., 2010).
Buildings Ordered by Electricity Consumption [Rank]
Electricity Use [kWh/m
2
/yr]
Average: 30
0
50
100
150
200
3 5 7 9 1 3 5 7 9 11 13 15 17 1 3 5 7 9 111 13
Average: 64
Average: 82
Buildings with Fans Only Buildings with Split A/C Units Buildings with Centralized A/C System
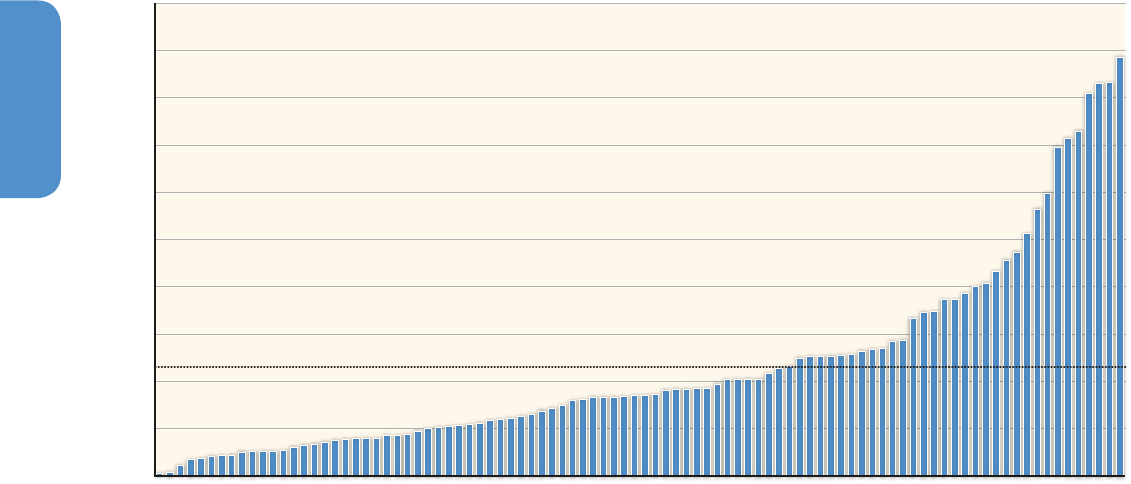
696696
Buildings
9
Chapter 9
9.4 Infrastructure and
systemic perspectives
9�4�1 Urban form and energy supply
infrastructure
Land use planning influences greenhouse gas emissions in several
ways, including through the energy consumption of buildings. More
compact urban form tends to reduce consumption due to lower per
capita floor areas, reduced building surface to volume ratio, increased
shading, and more opportunities for district heating and cooling sys-
tems (Ürge-Vorsatz et al., 2012a). Greater compactness often has
tradeoffs in regions with significant cooling demand, as it tends to
increase the urban heat island effect. However, the overall impact of
increased compactness is to reduce GHG emissions. Broader issues of
the implications of urban form and land use planning for emissions
are discussed in Chapter 12.5. Energy-using activities in buildings and
their energy supply networks co-evolve. While the structure of the
building itself is key to the amount of energy consumed, the energy
supply networks largely determine the energy vector used, and there-
fore the carbon intensity of supply. Changing fuels and energy supply
infrastructure to buildings will be needed to deliver large emissions
reductions even with the major demand reductions outlined in Section
9.3. This section therefore focuses on the interaction of buildings with
the energy infrastructure, and its implications for use of lower carbon
fuels.
9�4�1�1 District heating and cooling networks
Heating and cooling networks facilitate mitigation where they allow
the use of higher efficiency systems or the use of waste heat or lower
carbon fuels (e. g., solar heat and biomass) than can be used cost effec-
tively at the scale of the individual building. High efficiency distributed
energy systems, such as gas engines and solid oxide fuel cell cogen-
eration, generate heat and electricity more efficiently than the com-
bination of centralized power plants and heating boilers, where heat
can be used effectively. District energy systems differ between climate
zones. Large-scale district heating systems of cold-climate cities pre-
dominantly provide space heating and domestic hot water. There are
also some examples that utilize non-fossil heat sources, for example
biomass and waste incineration (Holmgren, 2006). Despite their energy
saving benefits, fossil fuel district heating systems cannot alone deliver
very low carbon buildings. In very low energy buildings, hot water is
the predominant heating load, and the high capital and maintenance
costs of district heating infrastructure may be uneconomic (Thyholt and
Hestnes, 2008; Persson and Werner, 2011). The literature is therefore
presently divided on the usefulness of district heating to serve very
low energy buildings. In regions with cold winters and hot summers,
district energy systems can deliver both heating and cooling, usually at
the city block scale, and primarily to commercial buildings. Energy sav-
ings of 30 % can be achieved using trigeneration, load levelling, diur-
nal thermal storage, highly-efficient refrigeration, and advanced man-
agement (Nagota etal., 2008). Larger benefits are possible by using
waste heat from incineration plants (Shimoda etal., 1998) and heat or
cold from water source heat pumps (Song etal., 2007).
Figure 9�11 | Annual unit area electricity use per unit of floor space of buildings on a university campus in Philadelphia, USA, 2006 (Zhang etal., 2010).
0
100
200
300
400
500
600
700
800
900
1000
1 85 908075706560555045403530252015105
Buildings Rank Ordered by Electricity Usage [Rank]
Electricity Use of Building Unit [kWh/m
2
/yr]
Average: 231

697697
Buildings
9
Chapter 9
9�4�1�2 Electricity infrastructure interactions
Universal access to electricity remains a key development goal in
developing countries. The capacity, and therefore cost, of electricity
infrastructure needed to supply any given level of electricity services
depends on the efficiency of electricity use. Electricity is the dominant
energy source for cooling and appliances, but energy use for heating is
dominated by direct use of fossil fuels in most countries. Electrification
of heating can therefore be a mitigation measure, depending on the lev-
els of electricity decarbonization and its end use efficiency. Heat pumps
may facilitate this benefit as they allow electrification to be a mitigation
technology at much lower levels of electricity decarbonization (Lowe,
2007). Ground-source heat pumps already have a high market share in
some countries with low-cost electricity and relatively efficient build-
ings (IEA HPG, 2010). There is a growing market for low-cost air source
heat pumps in mid-latitude countries (Cai etal., 2009; Howden-Chap-
man etal., 2009; Singh etal., 2010a). In many cases the attractions are
that there are not pre-existing whole-house heating systems and that
air-source heat pumps can provide both heating and cooling. A review
of scenario studies indicates heating electrification may have a key role
in decarbonization (Sugiyama, 2012), with heat pumps usually assumed
to be the preferred heating technology (IEA, 2010a). This would imply a
major technology shift from direct combustion of fossil fuels for build-
ing heating. Electricity use, even at high efficiency, will increase winter
peak demand (Cockroft and Kelly, 2006) with implications for genera-
tion and distribution capacity that have not been fully assessed; there
are challenges in retrofitting to buildings not designed for heating with
low temperature systems (Fawcett, 2011), and the economics of a high
capital cost heating system, such as a heat pump, in a low-energy build-
ing are problematic. The literature is inconclusive on the role and scale
of electrification of heating as a mitigation option, although it is likely to
be location-dependent. However, significant energy demand reduction
is likely to be critical to facilitate universal electrification (Eyre, 2011),
and therefore transition pathways with limited efficiency improvement
and high electrification are implausible. Electricity infrastructure in
buildings will increasingly need to use information technology in ‘smart
grids’ to provide consumer information and enable demand response to
assist load balancing (see Chapter 7.12.3).
9�4�1�3 Thermal energy storage
Thermal energy storage can use diurnal temperature variations to
improve load factors, and therefore reduce heating and cooling system
size, which will be particularly important if heating is electrified. Thermal
storage technologies could also be important in regions with electricity
systems using high levels of intermittent renewable energy. The use of
storage in a building can smooth temperature fluctuations and can be
implemented by sensible heat (e. g., changing the building envelope
temperature), or by storing latent heat using ice or phase change mate-
rials, in either passive or active systems (Cabeza etal., 2011). Both ther-
mochemical energy storage (Freire González, 2010) and underground
thermal energy storage (UTES) with ground source heat pumps (GSHP)
(Sanner etal., 2003) are being studied for seasonal energy storage in
buildings or district heating and cooling networks, although UTES and
GSHP are already used for short term storage (Paksoy etal., 2009).
9�4�2 Path dependencies and lock-in
Buildings and their energy supply infrastructure are some of the lon-
gest-lived components of the economy. Buildings constructed and ret-
rofitted in the next few years to decades will determine emissions for
many decades, without major opportunities for further change. There-
fore the sector is particularly prone to lock-in, due to favouring incre-
mental change (Bergman etal., 2008), traditionally low levels of inno-
vation (Rohracher, 2001), and high inertia (Brown and Vergragt, 2008).
When a major retrofit or new construction takes place, state-of-the-
art performance levels discussed in Section 9.3 are required to avoid
locking in sub-optimal outcomes. Sunk costs of district heating, in par-
ticular, can be a disincentive to investments in very low energy build-
ings. Without the highest achievable performance levels, global build-
ing energy use will rise (Ürge-Vorsatz etal., 2012a). This implies that
a major reduction in building energy use will not take place without
strong policy efforts, and particularly the use of building codes that
require adoption of the ambitious performance levels set out in Section
9.3 as soon as possible. Recent research (Ürge-Vorsatz etal., 2012a)
finds that by 2050 the size of the lock-in risk is equal to almost 80 % of
2005 global building heating and cooling final energy use (see Figure
9.12). This is the gap between a scenario in which today’s best cost-
effective practices in new construction and retrofits become standard
after a transitional period, and a scenario in which levels of building
energy performance are changed only to today’s best policy ambi-
tions. This alerts us that while there are good developments in building
energy efficiency policies, significantly more advances can and need to
be made if ambitious climate goals are to be reached, otherwise signif-
icant emissions can be ‘locked in’ that will not be possible to mitigate
for decades. The size of the lock-in risk varies significantly by region:
e. g., in South-East Asia (including India) the lock-in risk is over 200 %
of 2005 final heating and cooling energy use.
9.5 Climate change feed-
back and interaction
with adaptation
Buildings are sensitive to climate change, which influences energy
demand and its profile. As climate warms, cooling demand increases and
heating demand decreases (Day etal., 2009; Isaac and Van Vuuren, 2009;
Hunt and Watkiss, 2011), while passive cooling approaches become less
effective (Artmann etal., 2008; Chow and Levermore, 2010). Under a
+3.7 °C scenario by 2100, the worldwide reduction in heating energy
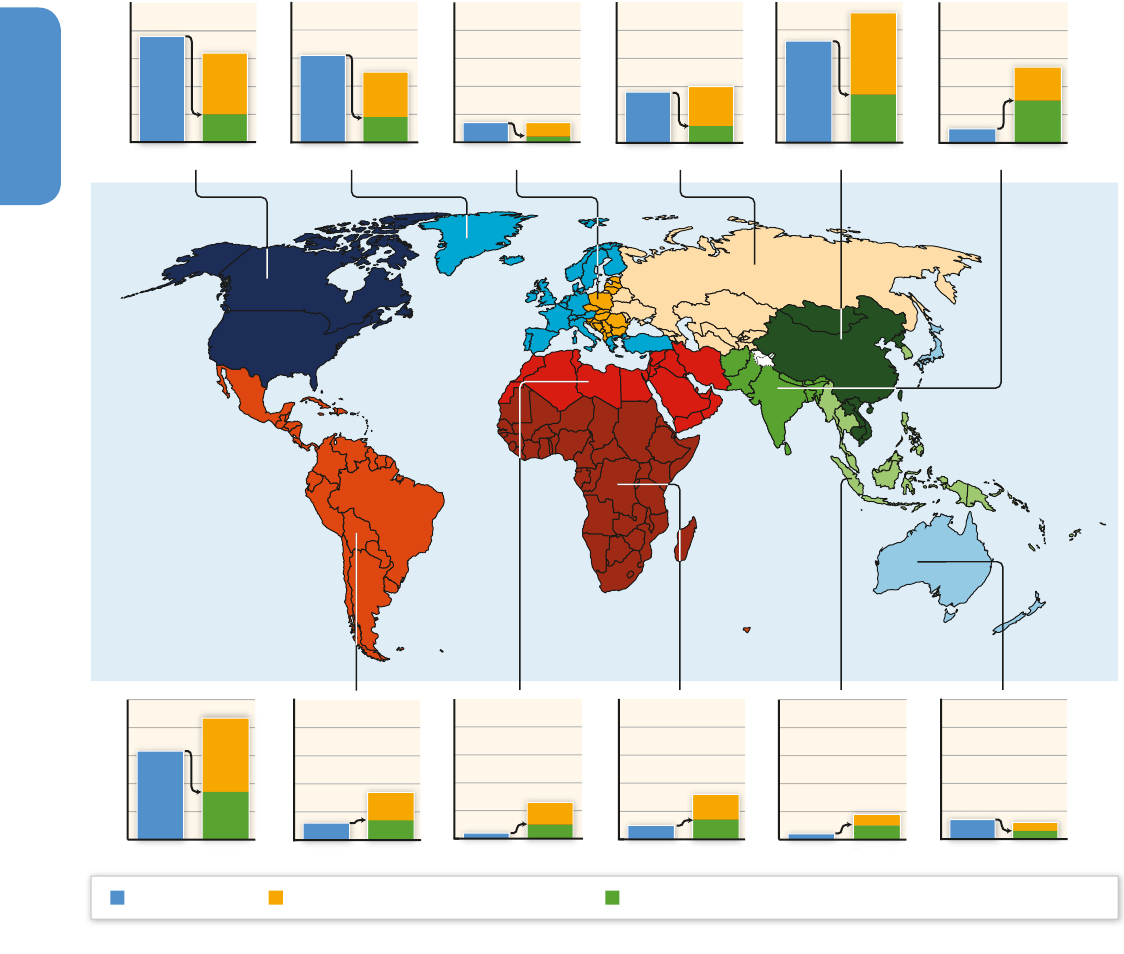
698698
Buildings
9
Chapter 9
demand due to climate change may reach 34 % in 2100, while cooling
demand may increase by ≥ 70 %; net energy demand could reach – 6 %
by 2050 and + 5 % by 2100; with significant regional differences, e. g., ≥
20 % absolute reductions in heating demand in temperate Canada and
Russia; cooling increasing by ≥ 50 % in warmer regions and even higher
increases in cold regions (Isaac and Van Vuuren, 2009). Other regional
and national studies (Mansur etal., 2008; van Ruijven etal., 2011; Wan
etal., 2011; Xu etal., 2012a) reveal the same general tendencies, with
energy consumption in buildings shifting from fossil fuels to electricity
and affecting peak loads (Isaac and Van Vuuren, 2009; Hunt and Wat-
kiss, 2011), especially in warmer regions (Aebischer etal., 2007). Emis-
sions implications of this shift are related to the fuels and technologies
locally used for heat and power generation: a global reference scenario
from Isaac and Van Vuuren (2009) shows a net increase in residential
emissions of ≥ 0.3 Gt C (≥ 1.1 Gt CO
2
eq) by 2100.
There is a wide-range of sensitivities but also many opportunities to
respond to changing climatic conditions in buildings: modified design
goals and engineering specifications increase resilience (Gerdes etal.
2011; Pyke etal., 2012). There is no consensus on definitions of climate
Figure 9�12 | Final building heating and cooling energy use in 2005 and in scenarios from the Global Energy Assessment (GEA) for 2050, organized by eleven regions (Ürge-
Vorsatz etal., 2012a). Notes: Green bars, indicated by arrows with numbers (relative to 2005 values), represent the opportunities through the GEA state-of-the-art scenario, while
the yellow bars with black numbers show the size of the lock-in risk (difference between the sub-optimal and state-of-the-art scenario). Percent figures are relative to 2005 values.
For region definitions see Annex II.2.4.
0
1
2
3
4
5
2005 2050 2005 2050 2005 2050 2005 2050
2005 2050 2005 2050 2005 2050 2005 2050 2005 2050
NAM
0
1
2
3
4
5
0
1
2
3
4
5
0
1
2
3
4
5
0
1
2
3
4
5
2005 2050 2005 2050
0
1
2
3
4
5
0
1
2
3
4
5
0
1
2
3
4
5
0
1
2
3
4
5
0
1
2
3
4
5
0
1
2
3
4
5
0
5
10
15
20
25
Energy Use [PWh/yr] Energy Use [PWh/yr]
CPA
WEU
EEU SAS
LAM MNA SSA PAS POECD
WORLD
FSU
Historic Energy Use State-of-the-Art ScenarioDifference from State-of-the-Art to Moderate Scenario
+175%
201%*
-54%
76%*
-66%
72%*
-67%
75%*
-72%
46%*
-75%
50%*
+127%
375%*
+46%
189%*
+113%
157%*
-66%
41%*
-46%
79%*
+15%
181%*
*Lock-in Risk of Sub-Optimal Scenario Realative to Energy Use in 2005.
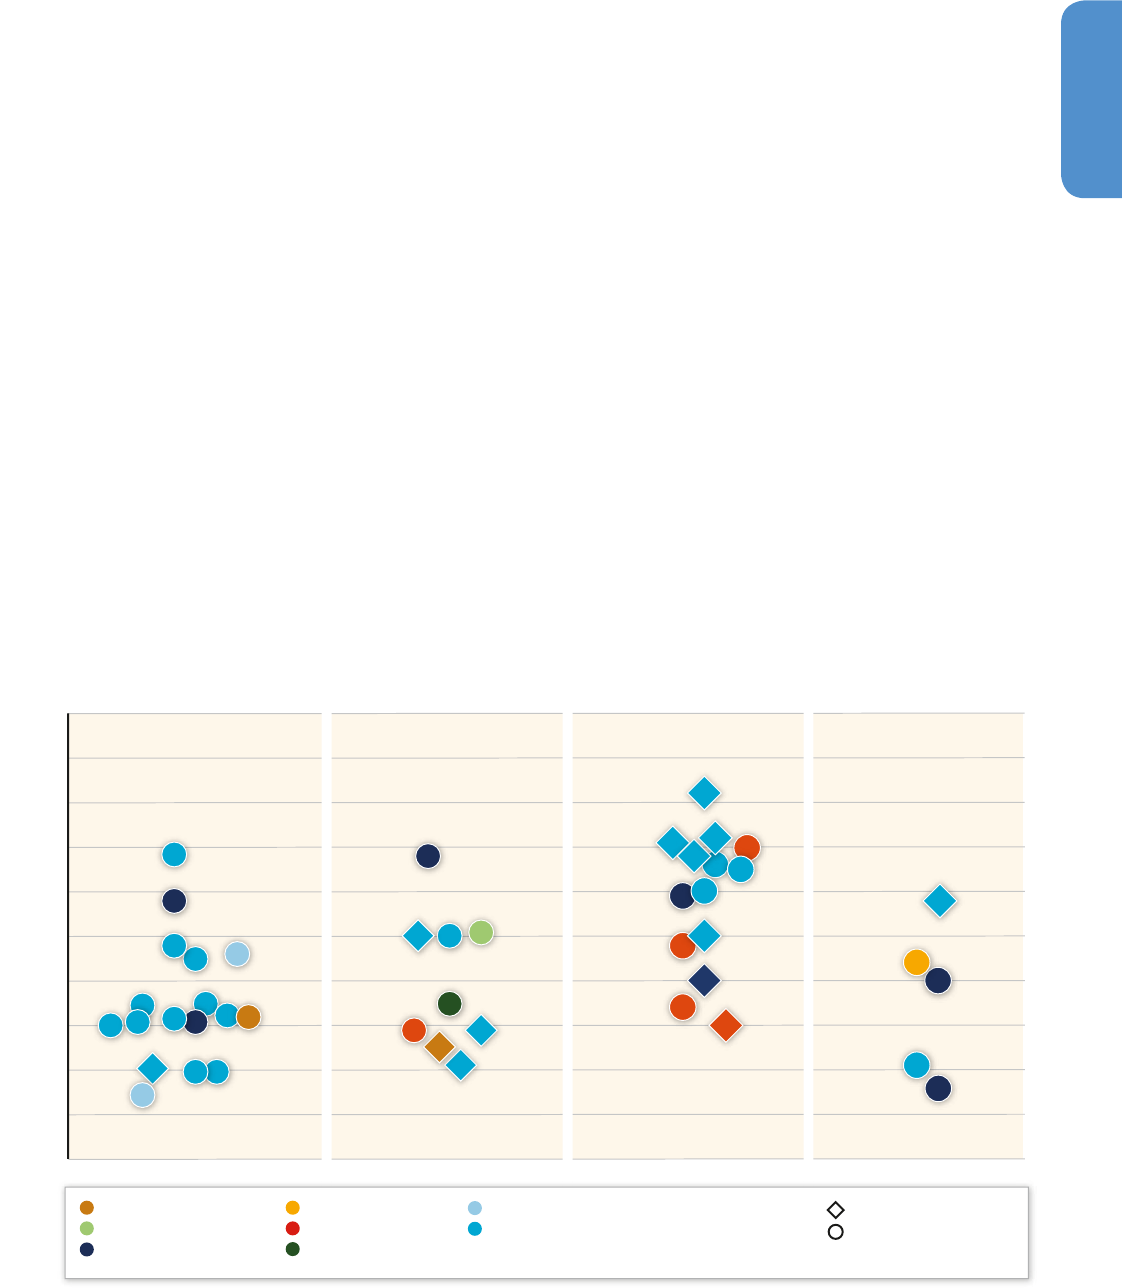
699699
Buildings
9
Chapter 9
adaptive buildings, but several aims include minimizing energy con-
sumption for operation, mitigating GHG emissions, providing adaptive
capacity and resilience to the building stock, reducing costs for main-
taining comfort, minimizing the vulnerability of occupants to extreme
weather conditions, and reducing risks of disruption to energy supply
and addressing fuel poverty (Roaf etal., 2009; Atkinson etal., 2009).
Adaptation and mitigation effects may be different by development
and urbanization level, climate conditions and building infrastructure.
Contemporary strategies for adapting buildings to climate change still
often emphasize increasing the physical resilience of building structure
and fabric to extreme weather and climatic events, but this can lead
to decreased functional adaptability and increased embodied energy
and associated GHG emissions. Increased extremes in local weather-
patterns can lead to sub-optimal performance of buildings that were
designed to provide thermal comfort ‘passively’ using principles of
bioclimatic design. In such circumstances, increased uncertainty over
future weather patterns may encourage demand for mechanical space
heating and / or cooling regardless of the climate-zone.
There are also several opportunities for heat island reduction, air
quality improvement, and radiation management (geo-engineering)
through building roofs and pavements, which constitute over 60 % of
most urban surfaces and with co-benefits such as improved air qual-
ity (Ihara etal., 2008; Taha, 2008). Simulations estimate reductions in
urban temperatures by up to 0.7 K (Campra etal., 2008; Akbari etal.,
2009; Oleson etal., 2010; Millstein and Menon, 2011). Akbari etal.,
(2009, 2012) estimated that changing the solar reflectance of a dark
roof (0.15) to an aged white roof (0.55) results in a one-time offset
of 1 to 2.5 tCO
2
per 10 m
2
of roof area through enhanced reflection.
Global CO
2
one-time offset potentials from cool roofs and pavements
amount to 78 GtCO
2
(Menon etal., 2010). Increasing the albedo of a 1
m
2
area by 0.01 results in a global temperature reduction of 3 × 10
– 15
K and offsets emission of 7 kg CO
2
(Akbari etal., 2012).
9.6 Costs and potentials
9�6�1 Summary of literature on aggregated
mitigation potentials by key identity
The chapter’s earlier sections have demonstrated that there is a broad
portfolio of different technologies and practices available to cut build-
ing-related emissions significantly. However, whereas these potentials
are large at an individual product / building level, an important question
is to determine what portion of the stock they apply to, and what the
overall potential is if we consider the applicability, feasibility, and
replacement dynamics, together with other constraints (Wada et al.,
Figure 9�13 | Regional studies on aggregated mitigation potentials grouped by key identity (i. e., main mitigation strategy). Note: Values correspond to the percentage reduction
as compared to baseline (circle), if available, otherwise to base year (diamond), studies are numbered, for details see Table 9.6, note that for some studies there are multiple entries
(indicated by number in extra bracket). For RC10 region definitions see Annex II.2.1.
0
10
20
30
40
50
60
70
80
90
100
Mitigation Potential [%]
Carbon Efficiency Technical Efficiency Systemic Efficiency Demand Reduction
9
2
16
1
12 6
10
3
4
5
7
14
13
8
11
17
21
24
20
23
26
18
22
25
19
33
33
31
32
15
34
30
27
28
29
30
33
31
33
27
35
38
36
35
37
POECD (2, 9)
MNA (16, 24)
EAS (26)
NAM (4, 15, 19, 30 (2), 36, 38)
EIT (37)
PAS (21)
Relative to Baseline
World (18, 27 (2), 28, 29)
Relative to Base Year
WEU (1, 3, 5, 6, 7, 8, 10, 11, 12, 13, 14, 17, 20, 22, 23,
25, 31 (2), 32, 33 (4), 34, 35 (2))

700700
Buildings
9
Chapter 9
Table 9�6 | Summary of literature on aggregated mitigation potentials in buildings categorized by key mitigation strategies.
1
Region (Study)
2
Description of mitigation measures / package (year)
3
End-uses
4
Type
5
Sector
6
Base-end
yrs
% change to
baseline
% change
to base yr
7
CARBON EFFICIENCY
EU (1) Additional solar domestic hot water system HW T RS 2010 – 20 20 %, pr.e
AU (2), AT (3)
CA (4), DK (5)
FL (6), DE (7)
IT (8), JP (9)
NL (10), ES (11)
SE (12), CH (13)
UK (14), US (15)
Solar electricity generation through buildings’ roof-top PV installations El. T BS yearly – 46 %, – 35 %,
– 31 %, – 32 %,
– 19 %, – 30 %,
– 45 %, – 15 %,
– 32 %, – 48 %,
– 20 %, – 35 %,
– 31 %, – 58 %
IL (16) All available rooftops are accounted for producing solar energy El. T BS yearly – 32 %
ES (17) An optimal implementation of the Spanish Technical Building Code and usage of 17 % of the available roof surface area W T-E BS 2009 – 68.4 %
TECHNICAL EFFICIENCY
World (18) Significant efforts to fully exploit the potential for EE, all cost-effective renewable energy sources
(RES) for heat and electricity generation, production of bio fuels, EE equipment
ALL T BS 2007 – 50 – 29 %
US (19) The cost-effective energy saving targets, assumed for each end-use on the basis of several earlier studies, are achieved by 2030 ALL T-E BS 2010 – 30 – 68 %
NO (20) Wide diffusion of heat pumps and other energy conservation measures, e. g.,
replacement of windows, additional insulation, heat recovery etc.
ALL T BS 2005 – 35 – 9.50 % – 21 %
TH (21) Building energy code and building energy labeling are widely implemented, the requirements
towards (nearly) zero-energy building (NZEBs) are gradually strengthened by 2030
ALL T CS by 2030 – 51 %
Northern Europe (22) Improvements in lamp, ballast, luminaire technology, use of task / ambient lighting, reduction of
illuminance levels, switch-on time, manual dimming, switch-off occupancy sensors, daylighting
L T CS 2011 – 50 %
Catalonia, ES (23) Implementation of Technical Code of Buildings for Spain, using insulation and
construction solutions that ensure the desired thermal coefficients
H / C T BS 2005 – 15 – 29 %
BH (24) Implementation of the envelope codes requiring that the building envelope is well-insulated and efficient glazing is used C T CS 1 year – 25 %
UK (25) Fabric improvements, heating, ventilation and air-conditioning (HVAC) changes (including ventilation
heat recovery), lighting and appliance improvements and renewable energy generation
ALL T CS 2005 – 30 – 50 %
(CO
2
)
CN (26) Best Practice Scenario (BPS) examined the potential of an achievement of
international best-practice efficiency in broad energy use today
APPL T RS, CS 2009 – 30 – 35 %
SYSTEMIC EFFICIENCY
World (27) Today‘s cost-effective best practice integrated design & retrofit becomes a standard H / C T-E BS 2005 – 50 – 70 % – 30 %
World (28) The goal of halving global energy-related CO
2
emissions by 2050 (compared to 2005
levels); the deployment of existing and new low-carbon technologies
ALL T-E BS 2007 – 50 – 34 %
World (29) High-performance thermal envelope, maximized the use of passive solar energy for
heating, ventilation and daylighting, EE equipment and systems
ALL T BS 2005 – 50 – 48 %
US (30) Advanced technologies, infrastructural improvements and some displacement of existing stock, configurations of
the built environment that reduce energy requirements for mobility, but not yet commercially available
ALL T-E BS 2010 – 50 – 59 % – 40 %
EU27 (31) Accelerated renovation rates up to 4 %; 100 % refurbishment at high standards; in 2010
20 % of the new built buildings are at high EE standard; 100 % — by 2025
ALL T RS 2004 – 30 – 66 % – 71 %
DK (32) Energy consumption for H in new RS will be reduced by 30 % in 2005, 2010, 2015 and 2020;
renovated RS are upgraded to the energy requirements applicable for the new ones
H T-E RS 2005 – 50 – 82 %

701701
Buildings
9
Chapter 9
Region (Study)
2
Description of mitigation measures / package (year)
3
End-uses
4
Type
5
Sector
6
Base-end
yrs
% change to
baseline
% change
to base yr
7
CH (33) Compliance with the standard comparable to the MINERGIE-P5, the Passive House and the
standard A of the 2000 Watt society with low-carbon systems for H and W
H / W T RS 2000 – 50 – 60 % – 68 %
Buildings comply with zero energy standard (no heating demand) H / W T RS 2000 – 50 – 65 % – 72 %
DE (34) The proportion of very high-energy performance dwellings increases by up to 30 % of the total
stock in 2020; the share of (nearly) zero-energy buildings (NZEBs) makes up 6 %
H / W T BS 2010 – 20 – 25 %(pr.e)
– 50 %
(CO
2
)
ENERGY SERVICE DEMAND REDUCTION
FR (35) EE retrofits, information acceleration, learning-by-doing and the increase in energy
price. Some barriers to EE, sufficiency in H consumption are overcome
H T BS 2008 – 50 – 21 % – 58 %
US (36) Influence of five lifestyle factors reflecting consumers’ behavioural patterns on residential electricity consumption was analyzed El. T RS 2005 – 40 %
LT (37) Change in lifestyle towards saving energy and reducing waste ALL T RS 1 year – 44 %
US (38) Commissioning as energy saving measure applied in 643 commercial buildings ALL T CS 1 year – 16 % (existing
buildings)
– 13 % (new
buildings)
Notes:
1) The Table presents the potential of final energy use reduction (if another is not specified) compared to the baseline and/or base year for the end-uses given in the column 3 and for the sectors indicated in the column 5.
2) References: 1: Anisimova (2011), 2 – 15: IEA (2002), 16: Yue and Huang (2011), 17: Vardimon (2011), 18: Izquierdo etal. (2011), 19: GPI (2010), 20: Brown et al. (2008a), 21: Sartori et al. (2009), 22: Pantong et al. (2011), 23: Dubois
and Blomsterberg (2011), 24: Garrido-Soriano etal. (2012), 25: Radhi (2009), 26: Taylor etal. (2010), 27: Zhou etal. (2011a), 28: Ürge-Vorsatz etal. (2012c), 29: IEA (2010b), 30: Harvey (2010), 31: Laitner etal. (2012), 32: Eichhammer et
al. (2009), 33: Tommerup and Svendsen (2006), 34: Chan and Yeung (2005), 35: Siller etal. (2007), 36: Schimschar etal. (2011), 37: Giraudet etal. (2012), 38: Sanquist etal. (2012), 39: Streimikiene and Volochovic (2011), 40: Mills (2011).
3) EE – energy efficiency;
4) H – space heating; C – space cooling; W – hot water; L – lighting; APPL – appliances; ALL – all end-uses; El - elecriticy;
5) T – technical; T-E – techno-economical;
6) BS – the whole building sector; RS – residential sector; CS – commercial sector;
7) pr.e. – primary energy.
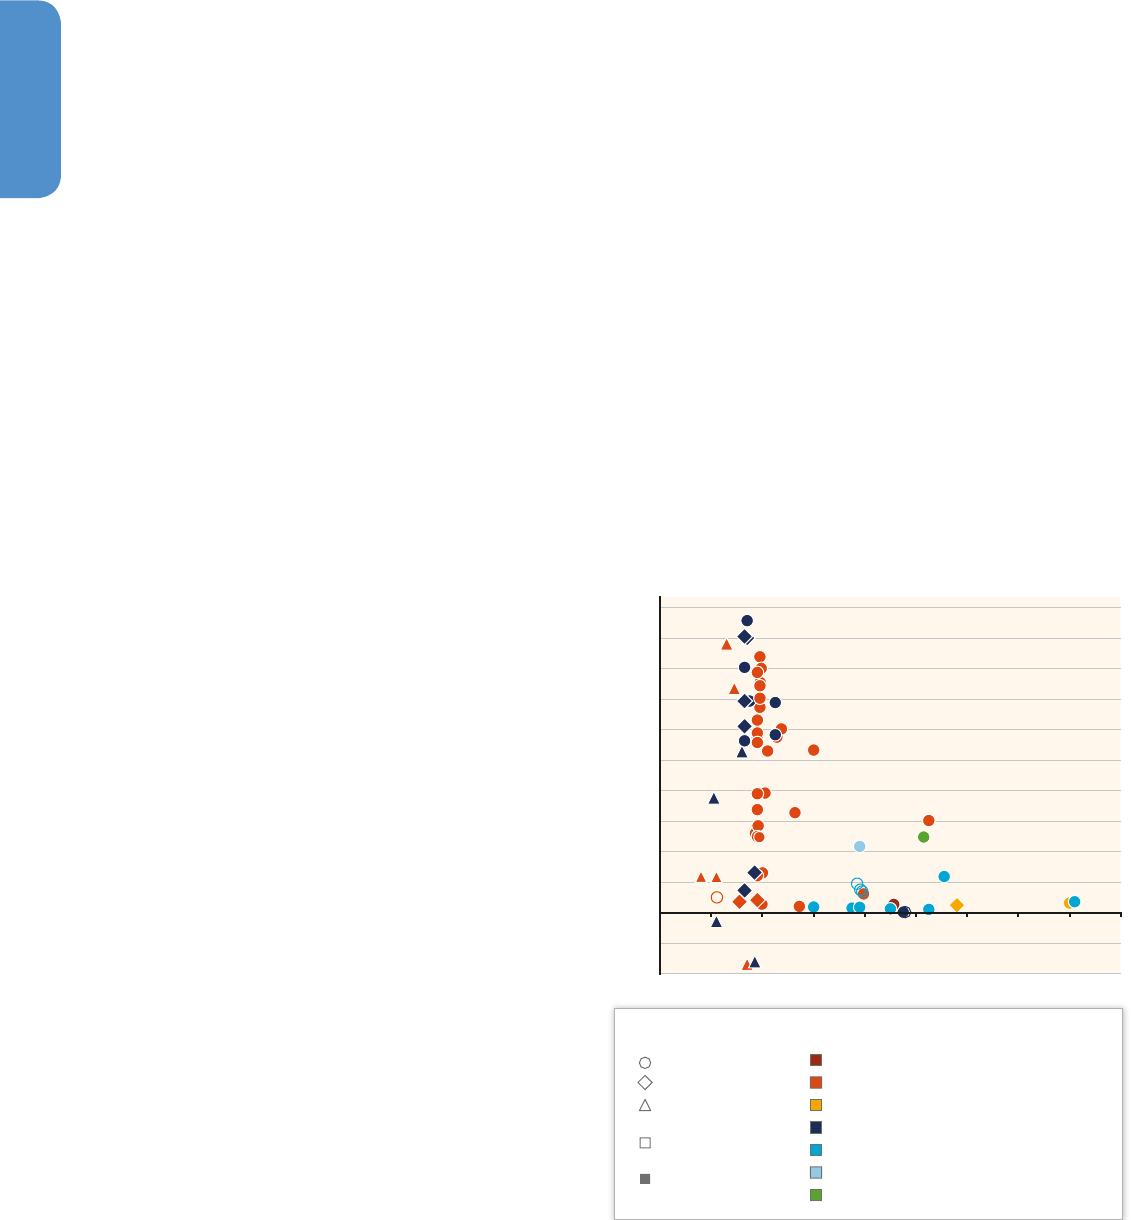
702702
Buildings
9
Chapter 9
2012). Figure 9.13 and the corresponding Table 9.6 synthesize the liter-
ature on a selection of regional studies on potentials through different
types of measures, aggregated to stocks of the corresponding prod-
ucts / buildings at the regional level. The studies are organized by the
four key identities discussed at the beginning of the chapter, translating
into the four key mitigation strategies that apply to this sector — i. e.,
carbon efficiency, technological efficiency, systemic efficiency, and
energy service demand reduction. However, as pointed out earlier, it is
often not possible to precisely distinguish one category from the other,
especially given the different categorizations in the studies, therefore
the binning should be treated as indicative only. The potentials illus-
trated in the table and figure are usually given for final energy use (if
not specified otherwise) and are mostly presented as a percentage of
the respective baseline energy, specified in the original source. The fig-
ure demonstrates that the high potentials at the individual prod-
uct / building level translate into relatively high potentials also at stock-
aggregated levels: mitigation or energy saving potentials often go
beyond 30 % to even 60 % of the baseline energy use / emission of the
stock the measures apply to. The figure also attests that each of the four
key mitigation strategies relevant to buildings can bring very large
reductions, although systemic efficiency seems to bring higher results
than other strategies, and energy service demand reduction has been so
far estimated to bring the most modest results from among these strat-
egies, although studies less often assess these options systematically.
The efficiency and cost studies presented here represent a single snap-
shot in time, implying that as this potential is being captured by poli-
cies or measures, the remaining potential dwindles. This has not been
reinforced by experience and research. Analyses have shown that tech-
nological improvement keeps replenishing the potential for efficiency
improvement, so that the potential for cost-effective energy efficiency
improvement has not been diminishing in spite of continuously improv-
ing standards (NAS, 2010). The National Academy of Science (NAS)
study (NAS, 2010) of the energy savings potentials of energy efficiency
technologies and programmes across all sectors in the United States
note that “[s]tudies of technical and economic energy-savings poten-
tial generally capture energy efficiency potential at a single point in
time based on technologies that are available at the time a study is
conducted. But new efficiency measures continue to be developed
and to add to the long-term efficiency potential.” These new efficiency
opportunities continue to offer substantial cost-effective additional
energy savings potentials after previous potentials have been captured
so that the overall technical potential has been found to remain at the
same order of magnitude for decades (NAS, 2010).
9�6�2 Overview of option-specific costs and
potentials
Since the building sector comprises a very large number of end-uses, in
each of these many different types of equipment being used, and for
each of which several mitigation alternatives exist, giving a comprehen-
sive account of costs and potentials of each, or even many, is out of the
scope of this report. The next two sections focus on selected key mitiga-
tion options and discuss their costs and potentials in more depth. Sec-
tion 9.6.2 focuses on whole-building approaches for new and retrofitted
buildings, while the Section 9.6.3 analyzes a selection of important tech-
nologies systematically. Finally, Section 9.6.5 discusses the sensitivity of
the findings from the earlier section to various assumptions and inputs.
9�6�2�1 Costs of very high performance new
construction
There is increasing evidence that very high performance new construc-
tion can be achieved at little, or occasionally even at negative, addi-
tional costs (Ürge-Vorsatz etal., 2012a; Harvey, 2013 and Section 9.3).
There are various methodologies applied to understand and demon-
strate the cost-effectiveness of whole building new construction and
retrofit, including project-based incremental cost accounting, popu-
lation studies, and comparative modelling (Kats, 2009). For commer-
cial buildings, there are instances where these methods have found
no additional cost in meeting standards as high as the Passive House
standard (see Section 9.3; Lang Consulting, 2013), or where the cost
Figure 9�14 |
Cost of conserved energy as a function of energy performance improve-
ment (kWh / m
2
/ yr difference to baseline) to reach ‘Passive House’ or more stringent
performance levels, for new construction by different building types and climate zones
in Europe.
A discount rate of 3 % and the lifetime of 30 years for retrofit and 40 years
for new buildings have been assumed. Sources: Hermelink (2006), Galvin (2010), ETK
(2011), Gardiner and Theobald (2011), Nieminen (2011), Energy Institute Vorarlberg
(2013), PHI (2013), Harvey (2013).
Only Heating - Very High Heating Demand
Only Heating - High Heating Demand
Only Heating - Medium and Low Heating Demand
High Heating and Low Cooling Demand
Medium Heating and Low Cooling Demand
Low Heating and Medium Cooling Demand
Cooling and Dehumidification - High Cooling Demand
Single-Family Buildings
Multifamily Buildings
Commercial Buildings
Case Studies from
Western Europe
Case Studies from
Eastern Europe
- 0.4
- 0.2
0
0.2
0.4
0.6
0.8
1.0
1.2
1.4
1.6
1.8
2.0
0 20 40 60 80 100 120 140 160 180
Cost of Conserved Energy (CCE) [USD
2010
/kWh/yr]
Energy Performance Improvement (Difference to Baseline) [kWh/m
2
/yr]
BUILDING TYPES CLIMATE
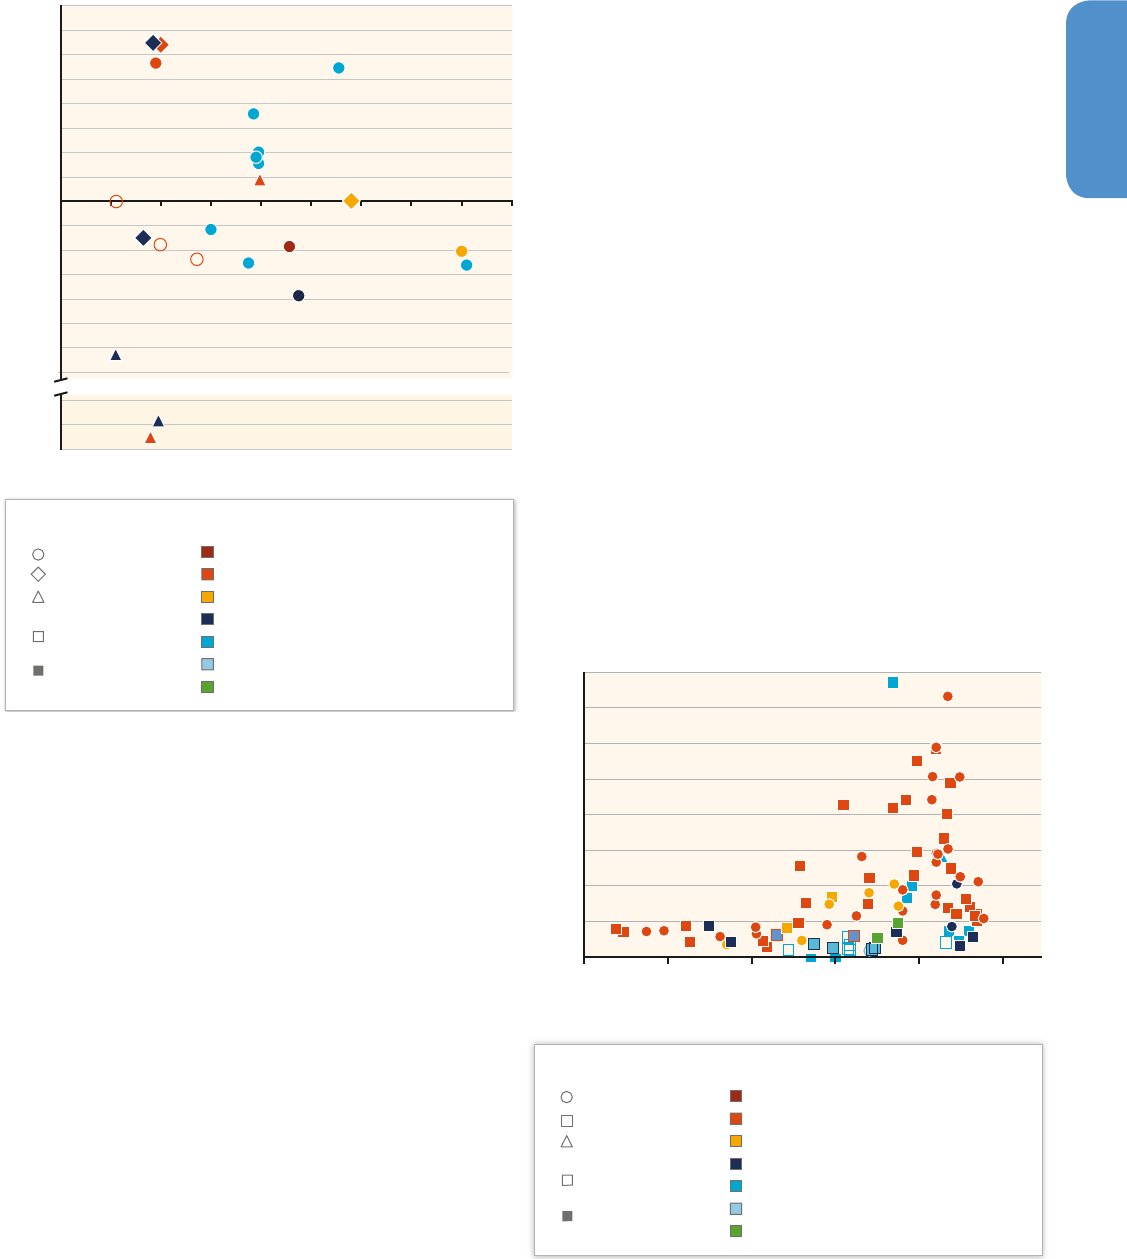
703703
Buildings
9
Chapter 9
of low-energy buildings has been less than that of buildings meeting
local energy codes. Surveys of delivered full building construction costs
in the United States and Australia comparing conventional and green
buildings in a variety of circumstances have been consistently unable
to detect a significant difference in delivered price between these two
categories. Rather, they find a wide range of variation costs irrespective
of performance features (Davis Langdon, 2007; Urban Green Coun-
cil and Davis Langdon, 2009). Collectively, these studies, along with
evidence in 9.3 and the tables in this section indicate that significant
improvements in design and operational performance can be achieved
today under the right circumstances at relatively low or potentially no
increases, or even decreases, in total cost.
The cost and feasibility of achieving various ZNEB definitions have
shown that such goals are rarely cost-effective by conventional stan-
dards; however, specific circumstances, operational goals, and incen-
tives can make them feasible (Boehland, 2008; Meacham, 2009). Table
9.4 in Section 9.3.5 highlights selected published estimates of the
incremental cost of net zero-energy buildings; even for these buildings,
there are cases where there appears to have been little additional cost
(e. g., NREL Laboratory).The costs of new ZNEBs are heavily dependent
on supporting policies, such as net metering and feed-in-tariffs, and
anticipated holding times, beyond the factors described below for all
buildings. Unlike residential buildings, high-performance commercial
buildings can cost less to build than standard buildings, even with-
out simplifying the design, because the cost savings from the down-
sizing in mechanical and electricity equipment that is possible with a
high-performance envelope can offset the extra cost of the envelope.
In other cases, the net incremental design and construction cost can
be reduced to the point that the time required to payback the initial
investment through operating cost savings is quite attractive.
Figure 9.14 shows the resulting cost-effectiveness from a set of doc-
umented best practices from different regions measured in cost of
conserved energy (CCE). The figure demonstrates well that, despite
the very broad typical variation in construction costs due to different
designs and non-energy related extra investments, high-performance
new construction can be highly cost-effective. Several examples con-
firming the point established in Section 9.3 that even negative CCEs
can be achieved for commercial buildings — i. e., that the project is
profitable already at the investment stage, or that the high-perfor-
mance building costs less than the conventional one. Cost-effective-
ness requires that the investments are optimized with regard to the
Figure 9�16 | Cost of conserved energy as a function of energy saving in percent for
European retrofitted buildings by building type and climate zones. A discount rate of
3 % and the lifetime of 30 years for retrofit and 40 years for new buildings have been
assumed. Sources: Hermelink (2006), Galvin (2010), ETK (2011), Gardiner and Theobald
(2011), Nieminen (2011), Energy Institute Vorarlberg (2013), PHI (2013), Harvey (2013).
0
0.1
0.2
0.3
0.4
0.5
0.6
0.7
0.8
0 20 40 60 80 100
Cost of Conserved Energy (CCE) [USD
2010
/kWh/yr]
Energy Saving Relative to Baseline [%]
Heating Only - Very High Heating Demand
Heating Only - High Heating Demand
Heating Only - Medium and Low Heating Demand
High Heating and Low Cooling Demand
Medium Heating and Low Cooling Demand
Low Heating and Medium Cooling Demand
Cooling and Dehumidification - High Cooling Demand
Single-Family Buildings
Multifamily Buildings
Commercial Buildings
BUILDING TYPES CLIMATE
Case Studies from
Western Europe
Case Studies from
Eastern Europe
Figure 9�15 | Cost of conserved carbon as a function of specific energy consumption
for selected best practices shown in Figure 9.14. A discount rate of 3 % and the lifetime
of 30 years for retrofit and 40 years for new buildings have been assumed. Sources:
Hermelink (2006), Galvin (2010), ETK (2011), Gardiner and Theobald (2011), Nieminen
(2011), Energy Institute Vorarlberg (2013), PHI (2013), Harvey (2013).
-350
-300
-250
-200
-150
-100
-50
0
50
100
150
200
250
300
350
400
20 40 60 80 100 120 140 160 180
Cost of Conserved Carbon [CCC) [USD
2010
/tCO
2
/yr]
Energy Performance Improvement (Difference to Baseline) [kWh/m
2
/yr]
Only Heating - Very High Heating Demand
Only Heating - High Heating Demand
Only Heating - Medium and Low Heating Demand
High Heating and Low Cooling Demand
Medium Heating and Low Cooling Demand
Low Heating and Medium Cooling Demand
Cooling and Dehumidification - High Cooling Demand
Single-Family Buildings
Multifamily Buildings
Commercial Buildings
Case Studies from
Western Europe
Case Studies from
Eastern Europe
BUILDING TYPES CLIMATE
-875
-841
-900
-850
-800
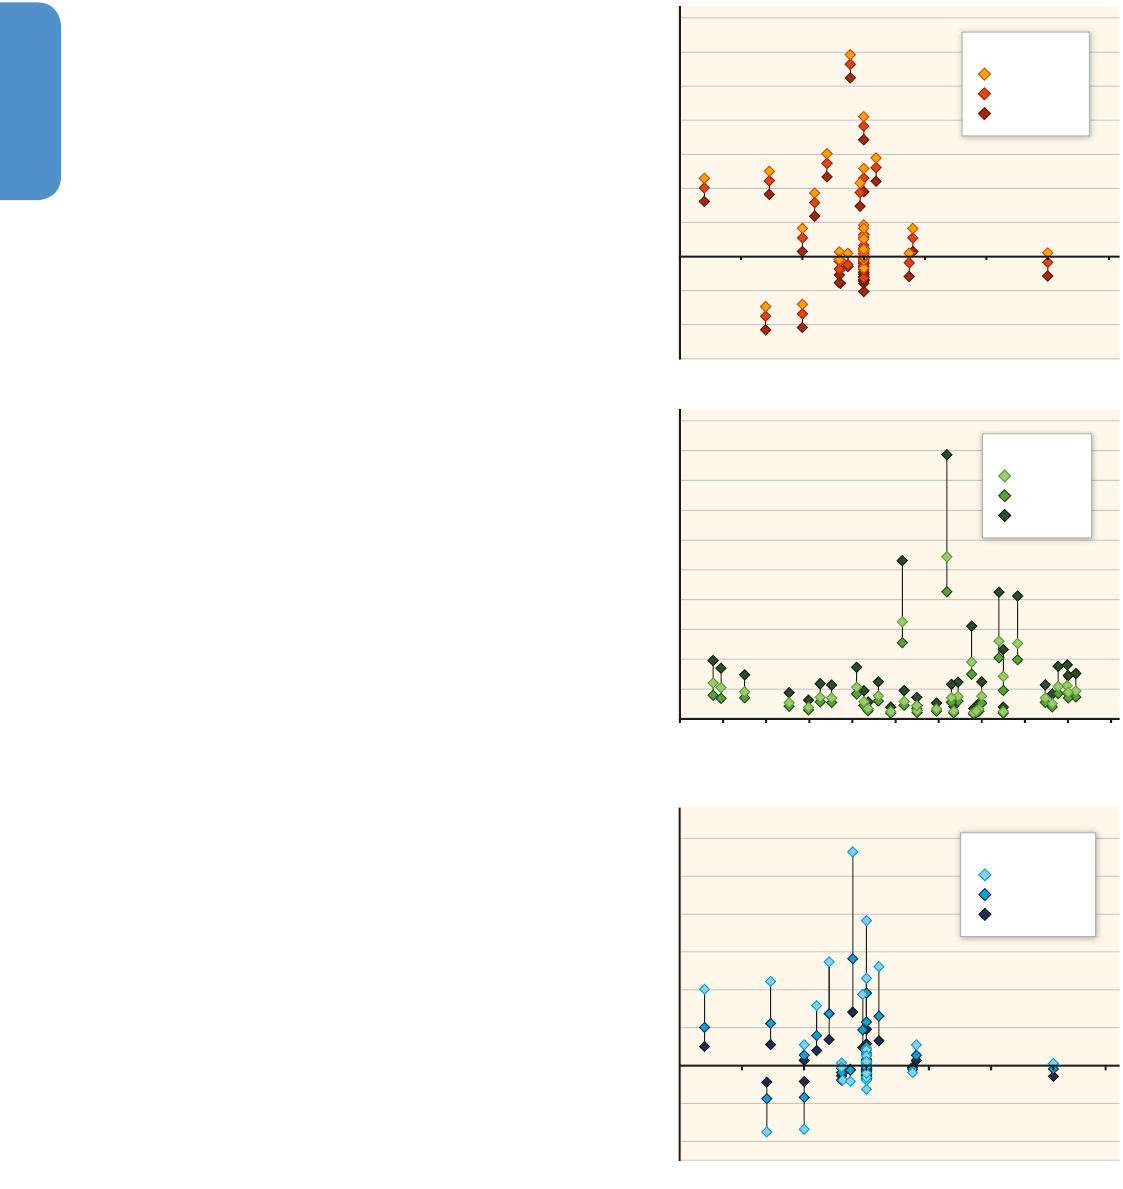
704704
Buildings
9
Chapter 9
additional vs. reduced (e. g., simplified or no heating system, ductwork,
etc.) investment requirements and no non-energy related ‘luxury’ con-
struction investments are included (see Section 9.3 for further discus-
sion of ensuring cost-effectiveness at the individual building level). It
is also important to note that very high-performance construction is
still at the demonstration / early deployment level in many jurisdictions,
and further cost reductions are likely to occur (see, e. g., GEA, 2012).
Figure 9.14 also shows that higher savings compared to the baseline
come at a typically lower cost per unit energy saving — i. e., deeper
reductions from the baseline tend to increase the cost-efficiency.
Although converting energy saving costs to mitigation costs introduces
many problems, especially due to the challenges of emission factors,
Figure 9.15 displays the associated mitigation cost estimates of
selected points from Figure 9.14 to illustrate potential trends in cost of
conserved carbon (CCC). The result is a huge range of CCC, which
extends from three-digit negative costs to triple digit positive costs per
ton of CO
2
emissions avoided.
9�6�2�2 Costs of deep retrofits
Studies have repeatedly indicated the important distinction between
conventional ‘shallow’ retrofits, often reducing energy use by only
10 – 30 %, and aggressive ‘deep’ retrofits (i. e., 50 % or more relative
to baseline conditions, especially when considering the lock-in effect.
Korytarova and Ürge-Vorsatz (2012) evaluated a range of existing
building types to characterize different levels of potential energy sav-
ings under different circumstances. They describe the potential risk for
shallow retrofits to result in lower levels of energy efficiency and higher
medium-term mitigation costs when compared to performance-based
policies promoting deep retrofits. Figure 9.16 presents the costs of con-
served energy related to a selection of documented retrofit best prac-
tices, especially at the higher end of the savings axis. The figure shows
that there is sufficient evidence that deep retrofits can be cost-effective
in many climates, building types, and cultures. The figure further shows
that, while the cost range expands with very large savings, there are
many examples that indicate that deep retrofits do not necessarily need
to cost more in specific cost terms than the shallow retrofits — i. e., their
cost-effectiveness can remain at equally attractive levels for best prac-
tices. Retrofits getting closer to 100 % savings start to get more expen-
sive, mainly due to the introduction of presently more expensive PV and
other building-integrated renewable energy generation technologies.
9�6�3 Assessment of key factors influencing
robustness and sensitivity of costs and
potentials
Costs and potentials of the measures described in previous sections
depend heavily on various factors and significantly influence the cost-
effectiveness of the investments. While these investments vary with
the types of measures, a few common factors can be identified.
Figure 9�17 | Sensitivity analysis of the key parameters: Top: CCC for new buildings
in response to the variation in fuel price; middle: CCE for retrofit buildings in response
to the variation in discount rate for selected data points shown in Figure 9.14, Figure
9.15 and Figure 9.16; bottom: CCC for new buildings in response to the variation in
emission factor.
0
0.0
0.1
0.2
0.3
0.4
0.5
0.6
0.7
0.8
0.9
1.0
0 0.1 0.2 0.3 0.4 0.5 0.6 0.7 0.8 0.9 1
Cost of Conserved Energy (CCE) [USD/kWh/yr]
Specific Energy Consumption [kWh/m
2
/yr]
-1.5
-1.0
-0.5
0
0.5
1.0
1.5
2.0
2.5
3.0
3.5
5 10 15 20 25 30 35
5 10 15 20 25 30 35
-2
-1
1
2
3
4
5
6
Specific Energy Consumption [kWh/m
2
/yr]
Specific Energy Consumption Relative to Baseline
Cost of Conserved Carbon (CCC) [kUSD
2010
/tCO
2
/yr] Cost of Conserved Carbon (CCC) [kUSD
2010
/tCO
2
/yr]
0.03 USD
2010
/kWh
0.1 USD
2010
/kWh
0.2 USD
2010
/kWh
Fuel Price
10%
5%
3%
Discount Rate
250 gCO
2
/kWh
500 gCO
2
/kWh
1000 gCO
2
/kWh
Emission Factor

705705
Buildings
9
Chapter 9
For the cost-effectiveness of energy-saving investments, the state of
efficiency of the baseline is perhaps the most important determin-
ing factor. For instance, a Passive House represents a factor of 10 – 20
improvement when compared to average building stocks, but only a
fraction of this when compared to, for instance, upcoming German
new building codes. Figure 9.16 and Figure 9.17 both vary the baseline
for the respective measure.
CCE figures and thus ‘profitability’, fundamentally depend on the dis-
count rate and assumed lifetime of the measure, and CCC depends fur-
ther on the background emission factor and energy price. Figure 9.17
illustrates, for instance, the major role discount rate, emission factor,
and energy price play when determining costs and cost-effectiveness.
Beyond the well quantifiable influences, further parameters that con-
tribute to the variability of the cost metrics are climate type, geo-
graphic region, building type, etc.
9.7 Co-benefits, risks
and spillovers
9�7�1 Overview
Mitigation measures depend on and interact with a variety of fac-
tors that relate to broader economic, social, and / or environmental
objectives that drive policy choices. Positive side-effects are deemed
‘co-benefits’; if adverse and uncertain, they imply risks.
1
Potential co-
benefits and adverse side-effects of alternative mitigation measures
(Sections 9.7.1 – 9.7.3), associated technical risks, and uncertainties, as
well as their public perception (see the relevant discussion in Sections
9.3.10 and 9.8), can significantly affect investment decisions, individ-
ual behaviour, and policymaking priority settings. Table 9.7 provides an
overview of the potential co-benefits and adverse side-effects of the
mitigation measures assessed in accordance with sustainable develop-
ment pillars (Chapter 4). The extent to which co-benefits and adverse
side-effects will materialize in practice, as well as their net effect on
social welfare, differ greatly across regions. It is strongly dependent
on local circumstances, implementation practices, scale, and pace of
measures deployment (see Section 6.6). Ürge-Vorsatz etal. (2009) and
GEA (2012), synthesizing previous research efforts (Mills and Rosen-
feld, 1996), recognize the following five major categories of co-bene-
fits attributed to mitigation actions in buildings: (1) health effects (e. g.,
reduced mortality and morbidity from improved indoor and outdoor
air quality), (2) ecological effects (e. g., reduced impacts on ecosys-
tems due to the improved outdoor environment), (3) economic effects
1
Co-benefits and adverse side-effects describe effects in non-monetary units
without yet evaluating the net effect on overall social welfare. Please refer to the
respective sections in the framing chapters (particularly 2.4, 3.6.3, and 4.8) as
well as to the glossary in Annex I for concepts and definitions.
(e. g., decreased energy bill payments, employment creation, improved
energy security, improved productivity), (4) service provision benefits
(e. g., reduction of energy losses during energy transmission and distri-
bution), and (5) social effects (e. g., fuel poverty alleviation, increased
comfort due to better control of indoor conditions and the reduction of
outdoor noise, increased safety). Taken together, the GEA (2012) found
that only the monetizable co-benefits associated with energy efficiency
in buildings are at least twice the resulting operating cost savings.
On the other hand, some risks are also associated with the implemen-
tation of mitigation actions in buildings emanating mostly from limited
energy access and fuel poverty issues due to higher investment and
(sometimes) operating costs, health risks in sub-optimally designed
airtight buildings, and the use of sub-standard energy efficiency tech-
nologies including risks of premature failure. The AR4 (Levine etal.,
2007) and other major recent studies (UNEP, 2011b; GEA, 2012) pro-
vide a detailed presentation and a comprehensive analysis of such
effects. Here, a review of recent advances focuses on selected co-ben-
efits / risks, with a view to providing methods, quantitative information,
and examples that can be utilized in the decision-making process.
9�7�2 Socio-economic effects
9�7�2�1 Impacts on employment
Studies (Scott etal., 2008; Pollin et al., 2009; Kuckshinrichs etal.,
2010; Köppl etal., 2011; ILO, 2012) have found that greater use of
renewables and energy efficiency in the building sector results in
positive economic effects through job creation, economic growth,
increase of income, and reduced needs for capital stock in the energy
sector. These conclusions, however, have been criticized on grounds
that include, among others, the accounting methods used, the effi-
cacy of using public funds for energy projects instead of for other
investments, and the possible inefficiencies of investing in labour-
intensive activities (Alvarez etal., 2010; Carley etal., 2011; Gülen,
2011). A review of the literature on quantification of employment
effects of energy efficiency and mitigation measures in the building
sector is summarized in Figure 9.18. The bulk of the studies reviewed,
which mainly concern developed economies, point out that the
implementation of mitigation interventions in buildings generates
on average 13 (range of 0.7 to 35.5) job-years per million USD
2010
spent. This range does not change if only studies estimating net
employment effects are considered. Two studies (Scott etal., 2008;
Gold etal., 2011) focus on cost savings from unspent energy bud-
gets that can be redirected in the economy, estimating that the
resulting employment effects range between 6.0 and 10.2 job-years
per million USD
2010
spent. Several studies (Pollin etal., 2009; Ürge-
Vorsatz etal., 2010; Wei etal., 2010; Carley etal., 2011) agree that
building retrofits and investments in clean energy technologies are
more labour-intensive than conventional approaches (i. e., energy
production from fossil fuels, other construction activities). However,

706706
Buildings
9
Chapter 9
Table 9�7 | Overview of potential co-benefits (green arrows) and adverse side-effects (orange arrows) associated with mitigation actions in buildings. Please refer to Sections 7.9,
11.7, and 11.13 for possible upstream effects of low-carbon electricity and biomass supply on additional objectives. Co-benefits and adverse side-effects depend on local circum-
stances as well as on the implementation practice, pace, and scale (see Section 6.6). For an assessment of macroeconomic, cross-sectoral effects associated with mitigation policies
(e. g., on energy prices, consumption, growth, and trade), see Sections 3.9, 6.3.6, 13.2.2.3 and 14.4.2.
Co-benefits / Adverse side-effects
Residential buildings
Commercial buildings
Buildings in developed countries
Buildings in developing countries
Retrofits of existing buildings
Exemplary new buildings
Efficient equipment
Fuel switching / RES incorporation / green roofs
Behavioural changes
References
Economic
↑ Employment impact
X X X X X X X X
Scott etal. (2008); Pollin etal. (2009); Ürge-Vorsatz etal. (2010); Gold etal. (2011)
↑ Energy security
X X X X X X X X X
IEA (2007); Dixon etal. (2010); Borg and Kelly (2011); Steinfeld etal. (2011)
↑ Productivity
X X X X X X
Fisk (2002); Kats etal. (2003); Loftness etal. (2003); Singh etal. (2010b)
↑ Enhanced asset values of buildings
X X X X X X X
Miller etal. (2008); Brounen and Kok (2011); Deng etal. (2012b)
↑ Lower need for energy subsidies
X X X X X X X X X
Ürge-Vorsatz etal. (2009); GEA (2012)
↑ Disaster resilience
X X X X X X
Berdahl (1995); Mills (2003); Coaffee (2008)
Social
↑ Fuel poverty alleviation (reduced
demand for energy)
X X X X X X
Tirado Herrero etal. (2012b); Healy (2004); Liddell and Morris
(2010); Hills (2011); Ürge-Vorsatz and Tirado Herrero (2012)
↓ Fuel poverty alleviation (in cases of
increases in the cost of energy)
X X X X
GEA (2012); Rao (2013)
↓ Energy access (in cases of increases in the cost
of energy, high investment costs needed, etc.)
X X X X X X
GEA (2012); for a more in-depth discussion please see Section 7.9.1
↑ Noise impact, thermal comfort
X X X X X X
Jakob (2006); Stoecklein and Skumatz (2007)
↑ Increased productive time for women and
children (for replaced traditional cookstoves)
X X X X
Reddy etal. (2000); Lambrou and Piana (2006); Hutton etal.
(2007); Anenberg etal. (2013); Wodon and Blackden (2006)
↓ Rebound effect
X X X X X X X X
Greening etal. (2000); Sorrell (2007); Hens etal. (2009); Sorrell etal.
(2009); Druckman etal. (2011); Ürge-Vorsatz etal. (2012a)
Health / Environmental
Health impact due to:
↑ reduced outdoor pollution
X X X X X X X X X
Levy etal. (2003); Aunan etal. (2004); Mirasgedis etal. (2004); Chen etal.
(2007); Crawford-Brown etal. (2012); Milner etal. (2012); see Section 7.9.2
↑ reduced indoor pollution
X X X X
Bruce etal. (2006); Zhang and Smith (2007); Duflo etal. (2008);
WHO (2009); Wilkinson etal. (2009); Howden-Chapman and
Chapman (2012); Milner etal. (2012); WGII Section 11.9.
↑ improved indoor environmental conditions
X X X X X X X
Fisk (2002); Singh etal. (2010b); Howden-Chapman
and Chapman (2012); Milner etal. (2012)
↑ fuel poverty alleviation
X X X X X X
Tirado Herrero etal. (2012b); Healy (2004); Liddell and Morris
(2010); Hills (2011); Ürge-Vorsatz and Tirado Herrero (2012)
↓ insufficient ventilation (sick building
syndrome), sub-standard energy
efficiency technologies, etc.
X X X X X X
Fisk (2002); GEA (2012); Milner etal. (2012)
↑ Ecosystem impact
X X X X X X X X X
Aunan etal. (2004); Mirasgedis etal. (2004); Ürge-Vorsatz etal. (2009); Cam (2012)
↑ Reduced water consumption
and sewage production
X X X X X X X
Kats etal. (2005); Bansal etal. (2011)
↑ Urban heat island effect
X X X X X X
Cam (2012); Xu etal. (2012b); see Sections 9.5 and 12.8

707707
Buildings
9
Chapter 9
to what extent investing in clean energy creates more employment
compared to conventional activities depends also on the structure of
the economy in question, level of wages, and if the production of
equipment and services to develop these investments occurs or not
inside the economy under consideration. To this end, the estimation
of net employment benefits instead of gross effects is of particular
importance for an integrated analysis of energy efficiency implica-
tions on the economy. Investing in clean technologies may create
new job activities (e. g., in solar industry, in the sector of new build-
ing materials etc.), but the vast majority of jobs can be in traditional
areas (Pollin et al., 2009) albeit with different skills required (ILO,
2012).
9�7�2�2 Energy security
Implementation of mitigation measures in the buildings sector can play
an important role in increasing the sufficiency of resources to meet
national energy demand at competitive and stable prices and improv-
ing the resilience of the energy supply system. Specifically, mitigation
actions result in: (1) strengthening power grid reliability through the
enhancement of properly managed on-site generation and the reduc-
tion of the overall demand, which result in reduced power transmis-
sion and distribution losses and constraints (Kahn, 2008; Passey etal.,
2011); (2) reducing cooling-related peak power demand and shifting
demand to off-peak periods (Borg and Kelly, 2011; Steinfeld et al.,
2011); and (3) increasing the diversification of energy sources as well
as the share of domestic energy sources used in a specific energy sys-
tem (see for example Dixon etal., 2010). A more general discussion on
energy security is provided in Section 6.6.
9�7�2�3 Benefits related to workplace
productivity
Investment in low-carbon technologies related to air conditioning and
wall thermal properties during construction or renovation improves
workplace productivity, as evidenced by a meta-analysis of several
studies (Fisk, 2002; Kats etal., 2003; Loftness etal., 2003; Ries etal.,
2006; Sustainability Victoria and Kador Group, 2007; Miller etal., 2009;
Singh etal., 2010b). On average, energy efficient buildings may result
in increased productivity by 1 – 9 % or even higher for specific activities
or case studies. The productivity gains can be attributed to: (1) reduced
working days lost due to asthma and respiratory allergies; (2) fewer
work hours affected by flu, respiratory illnesses, depression, and stress;
and (3) improved worker performance from changes in thermal com-
fort and lighting. Productivity gains can rank among the highest value
co-benefits when these are monetized, especially in countries with
high labour costs (GEA, 2012).
9�7�2�4 Rebound effects
Improvements in energy efficiency can be offset by increases in demand
for energy services due to the rebound effect. The general issues relat-
ing to the effect are set out in Sections 3.9.5 and 5.6. The rebound
effect is of particular importance in buildings because of the high
proportion of energy efficiency potential in this sector. Studies related
to buildings form a major part of the two major reviews of rebound
(Greening etal., 2000; Sorrell, 2007). Direct rebound effects tend to
be in the range 0 – 30 % for major energy services in buildings such as
heating and cooling (Sorrell etal., 2009; Ürge-Vorsatz etal., 2012b)
Figure 9�18 | Employment effects attributed to GHG mitigation initiatives from different provinces, countries and regions in the building sector.
Sources used: USA (Scott etal., 2008; Bezdek, 2009; Hendricks etal., 2009; Pollin etal., 2009; Garrett-Peltier, 2011; Gold etal., 2011), Hungary (Ürge-Vorsatz etal., 2010), Ontario,
Canada (Pollin and Garrett-Peltier, 2009), Germany (Kuckshinrichs etal., 2010), Denmark (Ege etal., 2009), EU (ETUC, 2008), Greece (Markaki etal., 2013), France (ADEME, 2008).
All studies from the USA, Hungary, Ontario Canada and Greece include the direct, indirect and induced employment effects. In ADEME (2008) and ETUC (2008) only the direct
effects are taken into account. Ege etal. (2009) includes the direct and indirect effects while this information is not provided in Kuckshinrichs etal. (2010).
0
USA Hungary Ontario, Canada Germany Denmark EU Greece France
5
10
15
20
25
Jobs Created per Money Spent [Million Jobs/USB
2010
]
30
35
40
EU 25
New MS
EU 15
EU 15
Net Employment Effects Gross Employment Effects

708708
Buildings
9
Chapter 9
in developed countries. For energy services where energy is a smaller
fraction of total costs, e. g., electrical appliances, there is less evidence,
but values are lower and less than 20 % (Sorrell, 2007). Somewhat
higher rebound levels have been found for lower income groups (Hens
et al., 2009; Roy, 2000), implying that rebound contributes positively to
energy service affordability and development. However, there is limited
evidence outside OECD countries (Roy, 2000; Ouyang etal., 2010) and
further research is required here. Studies of indirect rebound effects for
buildings tend to show low values, e. g., 7 % for thermostat changes
(Druckman etal., 2011). Some claims have been made that indirect
rebound effects may be very large (Brookes, 2000; Saunders, 2000),
even exceeding 100 %, so that energy efficiency improvement would
increase energy use. These claims may have had some validity for criti-
cal ‘general purpose technologies’ such as steam engines during inten-
sive periods of industrialization (Sorrell, 2007), but there is no evidence
to support large rebound effects for energy efficiency in buildings.
Declining energy use in developed countries with strong policies for
energy efficiency in buildings indicates rebound effects are low (see
Section 9.2). Rebound effects should be taken into account in build-
ing energy efficiency policies, but do not alter conclusions about their
importance and cost effectiveness in climate mitigation (Sorrell, 2007).
9�7�2�5 Fuel poverty alleviation
Fuel poverty is a condition in which a household is unable to guarantee
a certain level of consumption of domestic energy services (especially
heating) or suffers disproportionate expenditure burdens to meet these
needs (Boardman, 1991; BERR, 2001; Healy and Clinch, 2002; Buzar,
2007; Ürge-Vorsatz and Tirado Herrero, 2012). As such, it has a range
of negative effects on the health and welfare of fuel poor households.
For instance, indoor temperatures that are too low affect vulnerable
population groups like children, adolescent, or the elderly (Liddell and
Morris, 2010; Marmot Review Team, 2011) and increase excess winter
mortality rates (The Eurowinter Group, 1997; Wilkinson et al., 2001;
Healy, 2004). A more analytical discussion on the potential health
impacts associated with fuel poverty is presented in Section 9.7.3.
Despite the fact that some mitigation measures (e. g., renewables) may
result in higher consumer energy prices aggravating energy poverty,
substantially improving the thermal performance of buildings (such as
Passive House) and educating residents on appropriate energy man-
agement can largely alleviate fuel poverty. Several studies have shown
that fuel poverty-related monetized co-benefits make up over 30 % of
the total benefits of energy efficiency investments and are more impor-
tant than those arising from avoided emissions of greenhouses gases
and other harmful pollutants like SO
2
, NO
x,
and PM
10
(Clinch and Healy,
2001; Ürge-Vorsatz and Tirado Herrero, 2012).
9�7�3 Environmental and health effects
9�7�3�1 Health co-benefits due to improved indoor
conditions
The implementation of energy efficiency interventions in buildings
improves indoor conditions resulting in significant co-benefits for pub-
lic health, through: (1) reduction of indoor air pollution, (2) improve-
ment of indoor environmental conditions, and (3) alleviation of fuel
poverty particularly in cold regions. In developing countries, inefficient
combustion of traditional solid fuels in households produces signifi-
cant gaseous and particulate emissions known as products of incom-
plete combustion (PICs), and results in significant health impacts, par-
ticularly for women and children, who spend longer periods at home
(Zhang and Smith, 2007; Duflo etal., 2008; Wilkinson etal., 2009).
Indoor air pollution from the use of biomass and coal was responsible
for 2 million premature deaths and 41 million disability-adjusted life-
years (DALYs) worldwide in 2004 (WHO, 2009), with recent estimates
(Lim etal., 2012) reaching as high as 3.5 million premature deaths in
2010. Another half a million premature deaths are attributed to
household cook fuel’s contribution to outdoor air pollution, making a
total of about 4 million (see WGII Chapter 11.9.1.3). Several climate
mitigation options such as improved cookstoves, switching to cleaner
fuels, changing behaviours, and switching to more efficient and less
dangerous lighting technologies address not only climate change but
also these health issues (Anenberg etal., 2012; Smith etal., 2013; Rao
etal., 2013). Wilkinson etal. (2009) showed that the implementation
of a national programme promoting modern low-emissions stove
technologies in India could result in significant health benefits
amounting to 12,500 fewer DALYs per million population in one year.
Bruce etal. (2006) investigated the health benefits and the costs asso-
ciated with the implementation of selected interventions aiming at
reducing indoor air pollution from the use of solid fuels for cook-
ing / space heating in various world regions (Table 9.8).
In both developed and developing countries, better insulation, ven-
tilation, and heating systems in buildings improve the indoor condi-
tions and result in fewer respiratory diseases, allergies and asthma as
Table 9�8 | Healthy years gained per thousand USD
2010
spent in implementing interventions aiming at reducing indoor air pollution. Source: Bruce etal. (2006).
Intervention
Sub-Saharan
Africa
Latin America
and Caribbean
Middle East and
North Africa
Europe and
Central Asia
South
Asia
East Asia and
the Pacific
Access to cleaner fuels: LPG 1.30 — 1.79 0.66 — 1.19 ~1.2 0.70 — 0.76 1.70 — 2.97 0.55 — 9.30
Access to cleaner fuels: Kerosene 11.1 — 15.4 1.46 — 8.77 ~9.7 5.07 — 5.56 14.8 — 25.8 4.11 — 79.5
Improved stoves 36.7 — 45.9 0.84 — 0.98 2.03 — 2.52 n. a. 62.4 — 70.7 1.58 — 3.11

709709
Buildings
9
Chapter 9
well as reduced sick building syndrome (SBS) symptoms (Fisk, 2002;
Singh etal., 2010b). On the other hand, insufficient ventilation in air-
tight buildings has been found to affect negatively their occupants’
health, as has the installation of sub-standard energy efficiency tech-
nologies due to in-situ toxic chemicals (Fisk, 2002; GEA, 2012; Milner
etal., 2012). Of particular importance is the alleviation of fuel pov-
erty in buildings, which is associated with excess mortality and mor-
bidity effects, depression, and anxiety (Green and Gilbertson, 2008).
It is estimated that over 10 % to as much as 40 % of excess winter
deaths in temperate countries is related to inadequate indoor tem-
peratures (Clinch and Healy, 2001; Marmot Review Team, 2011). In
countries such as Poland, Germany, or Spain, this amounts to several
thousand — up to 10,000 — excess annual winter deaths. These fig-
ures suggest that in developed countries, fuel poverty may be caus-
ing premature deaths per year similar to or higher than that of road
traffic accidents (Bonnefoy and Sadeckas, 2006; Ürge-Vorsatz et al.,
2012; Tirado Herrero etal., 2012b). Improved residential insulation is
expected to reduce illnesses associated with room temperature thus
provide non-energy benefits, such as reduced medical expenses and
reduced loss of income due to unpaid sick leave from work and school.
A study in the UK found that for each USD
2010
1 invested for warm-
ing homes reduces the healthcare costs by USD
2010
0.49 (Liddell, 2008).
Such findings suggest that addressing fuel poverty issues and the
resulting health impacts in developing nations are even more impor-
tant, as a greater share of the population is affected (WHO, 2011).
9�7�3�2 Health and environmental co-benefits due to
reduced outdoor air pollution
The implementation of mitigation measures in the building sector
reduces the consumption of fossil fuels and electricity, thus improv-
ing the outdoor air quality and resulting in: (1) reduced mortality and
morbidity, particularly in developing countries and big cities (Smith
et al., 2010; Harlan and Ruddell, 2011; see Section 12.8); and (2)
less stresses on natural and anthropogenic ecosystems (see Section
7.9.1). Quantification and valuation of these benefits is possible, and
allows them to be integrated into cost-benefit analysis. Many studies
(Levy etal., 2003; Aunan etal., 2004; Mirasgedis etal., 2004; Chen
etal., 2007; Crawford-Brown etal., 2012) have monetized the health
and environmental benefits attributed to reduced outdoor air pollu-
tion that result from the implementation of energy efficiency mea-
sures in buildings. The magnitude of these benefits is of the order
of 8 – 22 % of the value of energy savings in developed countries
(Levy etal., 2003; Næss-Schmidt et al., 2012), and even higher in
developing nations (see Chapter 6.6). Markandya etal. (2009) esti-
mated that the health benefits expressed in USD
2010
per ton of CO
2
not emitted from power plants (through for example the implemen-
tation of electricity conservation interventions) are in the range of
2 USD
2010
/ tCO
2
in EU, 7 USD
2010
/ tCO
2
in China and 46 USD
2010
/ tCO
2
in India, accounting for only the mortality impacts associated with
PM
2.5
emissions. Please refer to Section 5.7 for other estimates in the
assessed literature.
9�7�3�3 Other environmental benefits
Energy efficiency measures that are implemented in buildings result
in several other environmental benefits. Specifically, using energy effi-
cient appliances such as washing machines and dishwashers in homes
results in considerable water savings (Bansal etal., 2011). More gener-
ally, a number of studies show that green design in buildings is associ-
ated with lower demand for water, resulting in reduced costs and emis-
sions from the utilities sector. For example, Kats etal. (2005) evaluated
30 green schools in Massachusetts and found an average water use
reduction of 32 % compared to conventional schools, achieved through
the reuse of the rain water and other non-potable water as well as the
installation of water efficient appliances (e. g., in toilets) and advanced
controls. Also, the implementation of green roofs, roof gardens, bal-
cony gardens, and sky terraces as well as green façades / walls in build-
ings, results in: (1) reducing heat gains for buildings in hot climates; (2)
reducing the heat island effect; (3) improving air quality; (4) enhancing
urban biodiversity, especially with the selection of indigenous vegeta-
tion species; (5) absorbing CO
2
emissions, etc. (see Cam, 2012; Xu et
al., 2012b; Gill et al., 2007; and Section 12.5.2.2).
9.8 Barriers and opportunities
Strong barriers — many particular to the buildings sector — hinder the
market uptake of largely cost-effective opportunities to achieve energy
efficiency improvements shown in earlier sections. Large potentials
will remain untapped without adequate policies that induce the
needed changes in private decisions and professional practices. Bar-
riers and related opportunities vary considerably by location, building
type, culture, and stakeholder groups, as vary the options to overcome
them, such as policies, measures, and innovative financing schemes. A
vast literature on barriers and opportunities in buildings enumerates
and describes these factors (Brown etal., 2008b; Ürge-Vorsatz etal.,
2012a; Power, 2008; Lomas, 2009; Mlecnik, 2010; Short, 2007; Hegner,
2010; Stevenson, 2009; Pellegrini-Masini and Leishman, 2011; Greden,
2006; Collins, 2007; Houghton, 2011; Kwok, 2010; Amundsen, 2010;
Monni, 2008).
Barriers include imperfect information, transaction costs, limited capital,
externalities, subsidies, risk aversion, principal agent problems, frag-
mented market and institutional structures, poor feedback, poor enforce-
ment of regulations, cultural aspects, cognitive and behavioural patterns,
as well as difficulties concerning patent protection and technology
transfer. In less developed areas, lack of awareness, financing, qualified
personnel, economic informality, and generally insufficient service levels
lead to suboptimal policies and measures thus causing lock-in effects in
terms of emissions. The pace of policy uptake is especially important in
developing countries because ongoing development efforts that do not
consider co-benefits may lock in suboptimal technologies and infrastruc-
ture and result in high costs in future years (Williams etal., 2012).

710710
Buildings
9
Chapter 9
9.9 Sectoral implication
of transformation
pathways and sustainable
development
9�9�1 Introduction
The purpose of this section is to review both the integrated as well as
sectoral bottom-up modelling literature from the perspective of what
main trends are projected for the future building emissions and energy
use developments, and the role of major mitigation strategies outlined
in Section 9.1. The section complements the analysis in Section 6.8
with more details on findings from the building sector. The two key
pillars of the section are (1) a statistical analysis of a large population
of scenarios from integrated models (665 scenarios in total) grouped
by their long-term CO
2
-equivalent (CO
2
eq) concentration level by 2100,
complemented by the analysis of sectoral models (grouped by baseline
and advanced scenario, since often these do not relate to concentra-
tion goals); and (2) a more detailed analysis of a small selection of
integrated and end-use / sectoral models. The source of the integrated
models is the WGIII AR5 Scenario Database (see Section 6.2.2 for
details), and those of the sectoral models are Cornelissen etal. (2012),
Deng etal. (2012a), Dowling etal. (2012), GPI (2010), Harvey (2010),
IEA (2012c0a), Laustsen (2010), McNeil et al. (2013), Ürge-Vorsatz
etal. (2012a3), WBCSD (2009), WEO (2011).
9�9�2 Overview of building sector energy
projections
Figure 9.19, together with Figure 9.20 and Figure 9. 21 indicate that
without action, global building final energy use could double or pos-
sibly triple by mid-century. While the median of integrated model sce-
narios forecast an approximate 75 % increase as compared to 2010 (Fig-
ure 9.19), several key scenarios that model this sector in greater detail
foresee a larger growth, such as: AIM, Message, and the Global Change
Assessment Model (GCAM), all of which project an over 150 % baseline
growth (Figure 9.20). The sectoral / bottom-up literature, however, indi-
cates that this growing trend can be reversed and the sector’s energy use
can stagnate, or even decline, by mid-century, under advanced scenarios.
The projected development in building final energy use is rather dif-
ferent in the sectoral (bottom-up) and integrated modelling literature,
as illustrated in Figure 9.19, Figure 9.20, and Figure 9. 21. For instance,
the integrated model literature foresees an increase in building energy
consumption in most scenarios with almost none foreseeing stabili-
zation, whereas the vast majority of ambitious scenarios from the
bottom-up / sectoral literature stabilize or even decline despite the
increases in wealth, floorspace, service levels, and amenities (see Sec-
tion 9.2). Several stringent mitigation scenarios from integrated mod-
Figure 9�19 | Development of normalized annual global building final energy
demand (2010=100) until 2050 in the integrated modelling literature, grouped by
the three levels of long-term CO
2
eq concentration level by 2100 (245 scenarios with
430 – 530 ppm CO
2
eq, 156 scenarios with 530 – 650 ppm CO
2
eq, and 177 scenarios
exceeding 720 ppm CO
2
eq — for category descriptions see Chapter 6.3.3; see box plots)
and sectoral / bottom-up literature (9 baseline scenarios and 9 advanced scenarios; see
square, triangle and circle symbols). Sectoral scenarios covering appliances (A) only are
denoted as squares (), scenarios covering heating / cooling / water heating (HCW) as
triangles (), scenarios covering heating / cooling / water heating / lighting / appliances
(HCWLA) as circles (). Filled symbols are for baseline scenario, whereas empty sym-
bols are for advanced scenarios. Box plots show minimum, 25
th
percentile, median, 75
th
percentile and maximum. Sources: Cornelissen etal. (2012), Deng etal. (2012a), Dowl-
ing etal. (2012), GPI (2010), Harvey (2010), IEA (2012c0a), Laustsen (2010), McNeil
etal. (2013), Ürge-Vorsatz etal. (2012a3), WBCSD (2009), WEO (2011) and WG III AR5
Scenario Database (Annex II.10).
Note on this section: This section builds upon emissions scenarios, which were
collated by Chapter6 in the WGIII AR5 scenario database (Section 6.2.2), and com-
pares them to detailed building sector studies. The scenarios were grouped into
baseline and mitigation scenarios. As described in more detail in Section 6.3.2, the
scenarios are further categorized into bins based on 2100 concentrations: between
430 – 480 ppm CO2eq, 480 – 530 ppm CO2eq, 530 – 580 ppm CO2eq, 580 – 650 ppm
CO2eq, 650 – 720 ppm CO2eq, and >720 ppm CO2eq by 2100. An assessment of
geo-physical climate uncertainties consistent with the dynamics of Earth System
Models assessed in WGI found that the most stringent of these scenarios — lead-
ing to 2100 concentrations between 430 and 480 ppm CO2eq — would lead to an
end-of-century median temperature change between 1.6 to 1.8 °C compared to pre-
industrial times, although uncertainties in understanding of the climate system mean
that the possible temperature range is much wider than this range. They were found
to maintain temperature change below 2 °C over the course of the century with
a likely chance. Scenarios in the concentration category of 650 – 720 ppm CO2eq
correspond to comparatively modest mitigation efforts, and were found to lead to
median temperature rise of approximately 2.6 – 2.9 °C in 2100 (see Section 6.3.2
for details).
BUENAS, Baseline
BUENAS, EES&L
3CSEP HEB, Frozen Efficiency
3CSEP HEB, Deep Efficiency
LAUSTSEN, Baseline
LAUSTSEN, Factor 4
HARVEY, High GDP High Pop.
Slow Efficiency w/o Heat Pump
HARVEY, High GDP High Pop.
Fast Efficiency w/ Heat Pump
WEO10, Baseline
WEO10, 450 Scenario
ETP10, Baseline
ETP10, BLUE Map
POLES-IPTS, Reference
POLES-IPTS, CO
2
Price USD 50
Greenpeace [R]evolution 2010, Baseline
Greenpeace [R]evolution 2010, Policy
Ecofys Baseline
Ecofys Policy
250
2020 2030 2040 2050
200
150
50
0
100
Normalized Global Buildings Final Energy Demand (2010=100)
430-530 ppm CO
2
eq (N=245)
530-650 ppm CO
2
eq (N=156)
>720 ppm CO
2
eq (N=177)

711711
Buildings
9
Chapter 9
els are above baseline scenarios from the sectoral literature (Figure
9.20). In general, the sectoral literature sees deeper opportunities for
energy use reductions in the building sector than integrated models.
As the focus on selected scenarios in Figure 9.21 suggests, thermal
energy use can be reduced more strongly than energy in other building
end-uses: reductions in the total are typically as much as, or less than,
decreases in heating and cooling (sometimes with hot water) energy
use scenarios. Figure 9.21 shows that deep reductions are foreseen only
in the thermal energy uses by bottom-up / sectoral scenarios, but appli-
ances can be reduced only moderately, even in sectoral studies. This
indicates that mitigation is more challenging for non-thermal end-uses
and is becoming increasingly important for ambitious mitigation over
time, especially in advanced heating and cooling scenarios where this
energy use can be successfully pushed down to a fraction of its 2005
levels. These findings confirm the more theoretical discussions in this
chapter, i. e., that in thermal end-uses deeper reductions can be expected
while appliance energy use will be more difficult to reduce or even limit
its growth. For instance Ürge-Vorsatz etal. (2012d) show a 46 % reduc-
tion in heating and cooling energy demand as compared to 2005 — even
under baseline assumptions on wealth and amenities increases. In con-
trast, the selected integrated models that focus on detailed building sec-
tor modelling project very little reduction in heating and cooling.
Another general finding is that studies show significantly larger reduc-
tion potentials by 2050 than by 2030, pointing to the need for a longer-
term, strategic policy planning, due to long lead times of building infra-
structure modernization (see Section 9.4). In fact, most of these studies
and scenarios show energy growth through 2020, with the decline start-
ing later, suggesting that ‘patience’ and thus policy permanence is vital
for this sector in order to be able to exploit its large mitigation potentials.
The trends noted above are very different in the different world regions.
As Figure 9.22 demonstrates, both per capita and total final building
energy use is expected to decline or close to stabilize even in baseline
scenarios in OECD countries. In contrast, the Latin-American and Asian
regions will experience major growth both for per capita and total lev-
els, even in the most stringent mitigation scenarios. MAF will experience
major growth for total levels, but growth is not projected for per capita
levels even in baseline scenarios. This is likely due mainly to the fact that
Figure 9�20 | Annual global final energy demand development in the building sector by 2050 (except WEO'10 and BUENAS) in selected sectoral models for baseline (left) and advanced
(right) scenarios, for total energy (All, heating / cooling / hot water / lighting / appliances), thermal energy (HCW, includes heating / cooling / hot water), and appliances (A); compared to selected
integrated models. Dashed lines show integrated models, solid lines show sectoral / bottom-up models. Sources: Cornelissen etal. (2012), Deng etal. (2012a), Dowling etal. (2012), GPI
(2010), Harvey (2010), IEA (2012c0a), Laustsen (2010), McNeil etal. (2013), Ürge-Vorsatz etal. (2012a3), WBCSD (2009), WEO (2011) and WG III AR5 Scenario Database (Annex II.10).
Note: For the analysis to follow, we have chosen seven illustrative integrated models with two scenarios each, covering the full range of year-2050 final energy use in all no-policy
scenarios in the WGIII AR5 scenario database and their 450 ppm scenario counterparts. These no-policy scenarios are MESSAGE V.4_EMF27-Base-EERE, IMAGE 2.4_AMPERE2-
Base-LowEI-OPT, AIM-Enduse[Backcast] 1.0_LIMITS-StrPol, BET 1.5_EMF27-Base-FullTech, TIAM-WORLD 2012.2_EMF27-Base-FullTech, GCAM 3.0_AMPERE3-Base, and POLES
AMPERE_AMPERE3-Base. The mitigation scenario counterparts are MESSAGE V.4_EMF27 – 450-EERE, IMAGE 2.4_AMPERE2 – 450-LowEI-OPT, AIM-Enduse[Backcast] 1.0_LIM-
ITS-StrPol-450, BET 1.5_EMF27 – 450-FullTech, TIAM-WORLD 2012.2_EMF27 – 450-FullTech, GCAM 3.0_AMPERE3-CF450, and POLES AMPERE_AMPERE3-CF450. In addition,
sectoral / bottom-up models and scenarios were also included. The no policy / baseline scenarios are BUENAS Baseline, 3CSEP HEB Frozen efficiency, LAUSTSEN Baseline, WEO’10
Current Policies, ETP’10 Baseline, Ecofys Baseline, and Greenpeace Energy Revolution 2010 Baseline. The advanced scenarios are BUENAS EES&L, 3CSEP HEB Deep efficiency,
LAUSTSEN Factor 4, WEO’10 450 Scenario, ETP’10 BLUE Map, Ecofys TER, and Greenpeace Energy Revolution 2010 Revolution.
Greenpeace Energy Revolution 2010
Ecofys
ETP'10
WEO'10
HARVEY
LAUSTSEN
3CSEP HEB
BUENAS
POLES AMPERE
GCAM 3.0
TIAM-WORLD 2012.2
BET 1.5
AIM-Enduse (Backcast) 1.0
IMAGE 2.4
MESSAGE V.4
Integrated Models Sectoral Models
Global Buildings Energy Demand [EJ/yr]
2050204020302020201020502040203020202010
Global Buildings Energy Demand [EJ/yr]
0
50
100
150
200
250
300
0
50
100
150
200
250
300
Baseline Mitigation
AII
HCW
A
AII
HCW
A
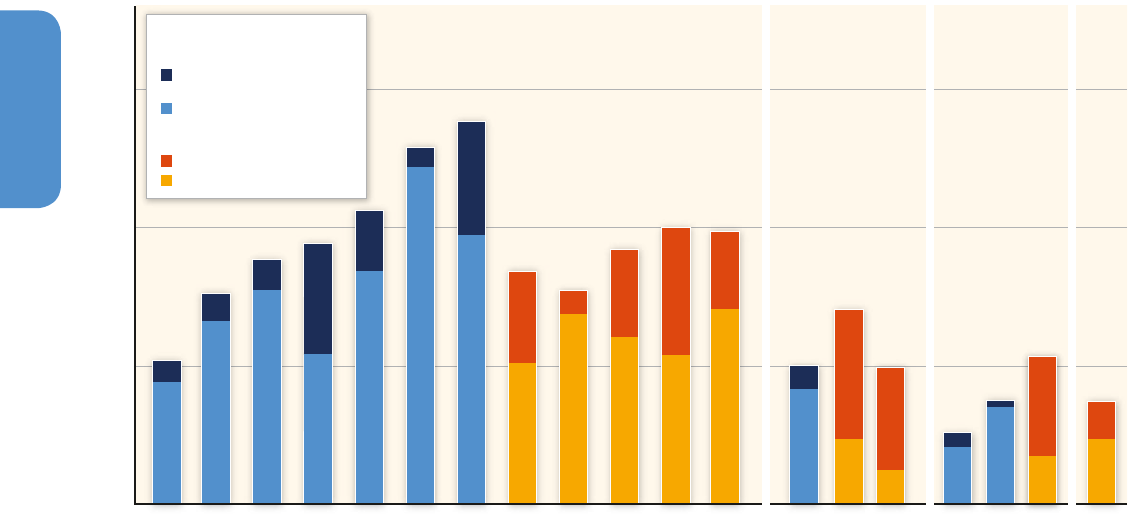
712712
Buildings
9
Chapter 9
fuel switching from traditional biomass to modern energy carriers results
in significant conversion efficiency gains, thus allowing substantial
increases in energy service levels without increasing final energy use.
9�9�3 Key mitigation strategies as highlighted
by the pathway analysis
The diversity of the development in final energy demand even among
the most stringent mitigation scenarios suggests that different mod-
els take different foci for their building mitigation strategies. While
most mitigation and advanced bottom-up / sectoral scenarios show flat
or reducing global final building energy use, a few integrated mod-
els achieve stringent mitigation from rather high final energy demand
levels, thereby focusing on energy supply-side measures for reducing
emissions. These scenarios have about twice as high per capita final
energy demand levels in 2050 as the lowest mitigation scenarios. This
suggests a focus on energy supply side measures for decarbonization.
In general, Figure 9.19, Figure 9.20, and Figure 9. 21 all demonstrate
that integrated models generally place a larger focus on supply-side
solutions than on final energy reduction opportunities in the building
sector (see Section 6.8) — except for a small selection of studies.
Fuel switching to electricity that is increasingly being decarbonized is
a robust mitigation strategy as shown in Sections 6.3.4 and 6.8. How-
ever, as Figure 9.23a indicates, this is not fully the case in the buildings
sector. The total share of electricity in this sector is influenced little by
mitigation stringency except for the least ambitious scenarios: it exhib-
its an autonomous increase from about 28 % of final energy in 2010
to 50 % and more in 2050 in almost all scenarios, i. e., the use of more
electricity as a share of building energy supply is an important baseline
trend in the sector. Compared to this robust baseline trend, the addi-
tional electrification in mitigation scenarios is rather modest (see also
Section 6.8.4).
Figure 9.23b indicates that the higher rates of energy growth (x-axis) in
the models involve generally higher rates of electricity growth (y-axis).
The two increases are nearly proportional, so that the rates of electricity
demand share growth, of which level is indicated by 45
o
lines, remain
mostly below 2 % per year even in the presence of climate policy.
The seven selected integrated models see a very different development
in the fuel mix (Figure 9. 24). In the baseline scenarios, interestingly,
most scenarios show a fairly similar amount of power use; and the
difference in total building final energy use largely stems from the dif-
Figure 9�21 | Building final energy use in EJ / yr in 2050 (2030 for BUENAS and WEO'10) for advanced scenarios, modelling four groups of building end-uses as compared to refer-
ence ones. Blue bars show scenarios from integrated models meeting 480 – 580 ppm CO
2
eq concentration in 2100, orange / red bars are from sectoral models. Sources: Cornelissen
etal. (2012), Deng etal. (2012a), Dowling etal. (2012), GPI (2010), Harvey (2010), IEA (2012c0a), Laustsen (2010), McNeil etal. (2013), Ürge-Vorsatz etal. (2012a3), WBCSD
(2009), WEO (2011) and WG III AR5 Scenario Database (Annex II.10)
67%67%
37%
6%
19%
75%
66%
16%
29%
46%34%
11%
39%
30%
6%
20%
42%
13%
13%
15%
Difference Baseline to Advanced
Advanced
Sectoral Models
Difference Baseline to Mitigation
Scenario
Mitigation Scenario
Integrated Models
(480-580 ppm CO
2
eq)
0
100
200
300
All End Uses Heating
Cooling
Hot Water
Heating
Cooling
App-
liances
MESSAGE V.4
IMAGE 2.4
AIM-Enduse (Backcast) 1.0
BET 1.5
TAM-WORLD 2012.2
GCAM 3.0
POLES AMPERE
HARVEY
WEO‘10
ETP‘10
Ecofys
Greenpeace ER‘10
AIM-Enduse (Backcast) 1.0
3CSEP HEB
LAUSTSEN
AIM-Enduse (Backcast) 1.0
GCAM 3.0
BUENAS
Building Final Energy Use [EJ/yr]
3CSEP HEB
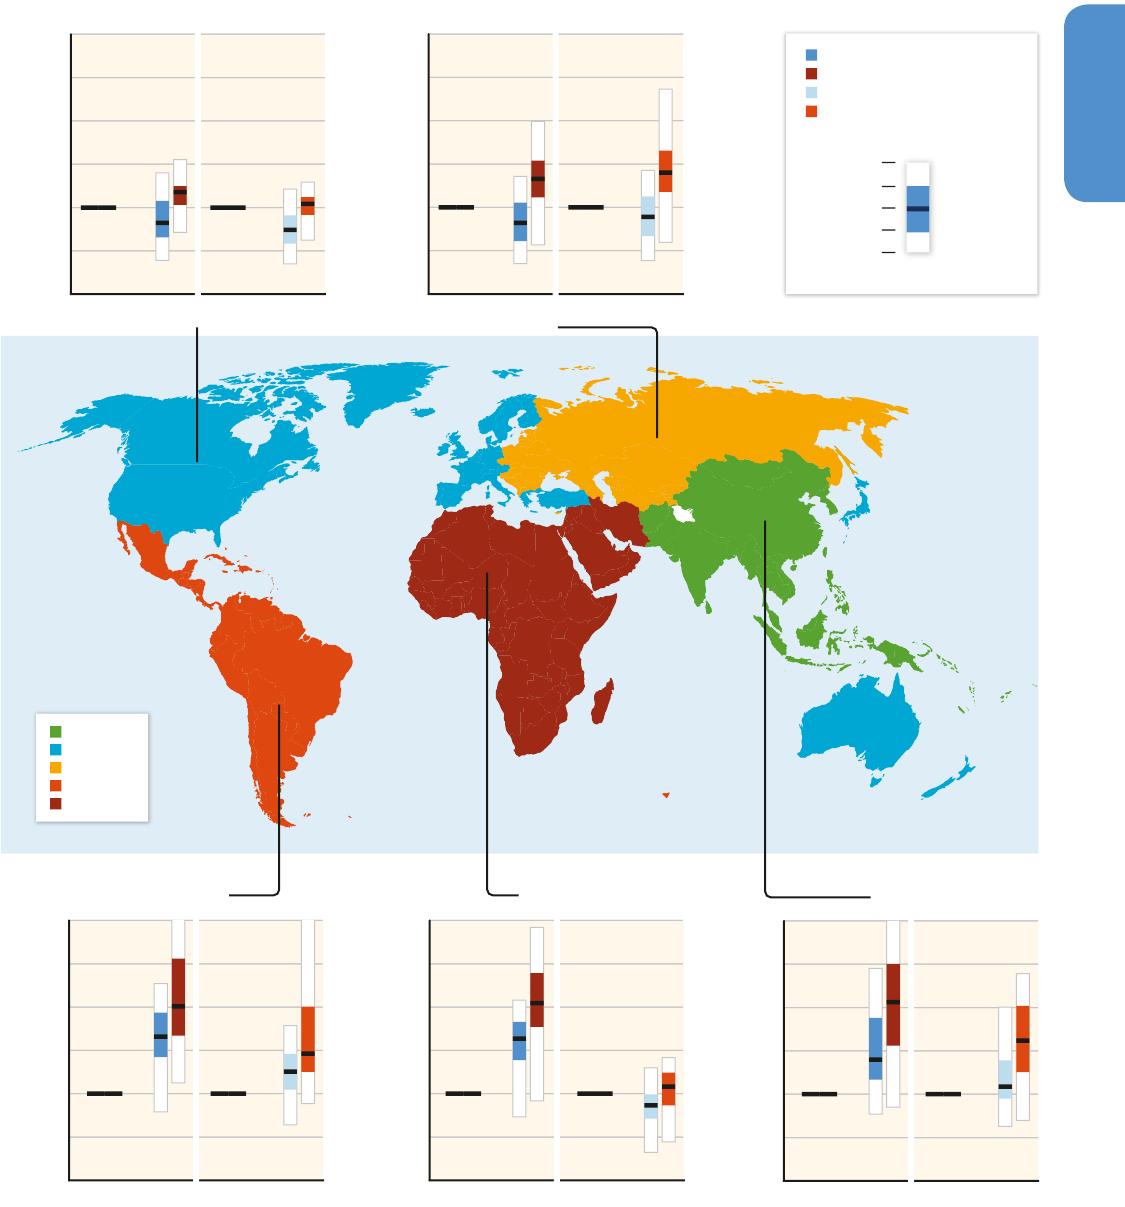
713713
Buildings
9
Chapter 9
Figure 9�22 | Normalized total (for first two pairs of box plots) and per capita (for next two pairs of box plots) buildings final energy demand in 2010 and 2050 for each of the
RC5 regions (Annex II.2.2) in scenarios from integrated models (2010=100). The absolute values of the medians are also shown with the unit of EJ for total buildings final energy
demand and the unit of GJ for per capita buildings final energy demand (229 scenarios with 430 – 530 ppm CO
2
eq and 154 scenarios exceeding 720 ppm CO
2
eq — for category
descriptions see Section 6.3.2). Note that the 2010 absolute values are not equal for the two CO
2
eq concentration categories because for most integrated models 2010 is a model-
ling year implying some variation across models, such as in the treatment of traditional biomass. Sources: WG III AR5 Scenario Database (Annex II.10).
ASIA
OECD-1990
EIT
LAM
MAF
Total (430−530 ppm CO
2
eq )
Total (>720 ppm CO
2
eq )
Per Capita (430−530 ppm CO
2
eq )
Per Capita (>720 ppm CO
2
eq )
Total or per Capita Final Energy Normalized
(2010=100%) [%]
Total or per Capita Final Energy Normalized
(2010=100%) [%]
Total or per Capita Final Energy Normalized
(2010=100%) [%]
Total or per Capita Final Energy Normalized
(2010=100%) [%]
Total or per Capita Final Energy Normalized
(2010=100%) [%]
ASIA
EIT
OECD-1990
MAF
LAM
2010 2050 2010 2050
2010 2050 2010 2050
2010 2050 2010 2050
2010 2050 2010 2050
2010 2050 2010 2050
100
150
200
250
300
100
150
200
250
300
100
150
200
250
300
100
150
200
250
300
100
150
200
250
300
100
150
200
250
300
100
150
200
250
300
100
150
200
250
300
0
50
0
50
0
50
0
50
0
100
150
200
250
300
50
100
150
200
250
300
14.4
14.1
31.6
48.8
35.6
35.4
37.2
49.9
50.3
47.3
41.7
56.8
48.3
47.2
9.2
9.2
5.4
5.4
11.8
13.8
8.8
11.0
11.0
10.8
11.6
15.4
40.9
39.2
53.5
70.9
10.3
13.7
12.2
13.2
24.5
32.4
15.2
15.8
11.5
18.1
Min
75
th
Percentile
Max
Median
25
th
Percentile
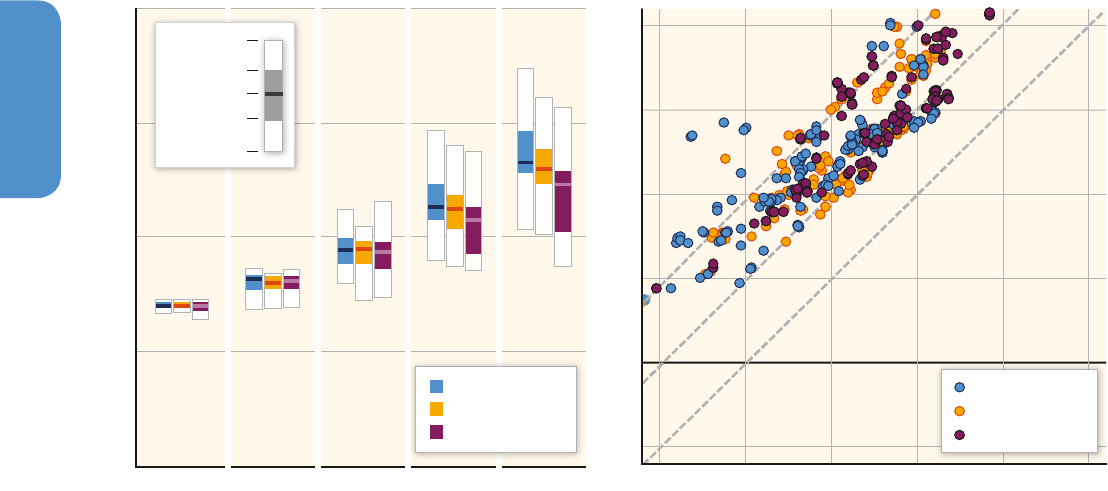
714714
Buildings
9
Chapter 9
ferences in the use of other fuels. Particularly large differences are fore-
seen in the use of natural gas and oil, and, to a lesser extent, biomass.
Mitigation scenarios are somewhat more uniform: mostly a bit over
half of their fuel mix is comprised of electricity, with the remaining part
more evenly distributed among the other fuels except coal that disap-
pears from the portfolio, although some scenarios exclude further indi-
vidual fuels (such as no biomass in MESSAGE, no oil in BET, no natural
gas in Image) by scenarios outcomes.
9�9�4 Summary and general observations of
global building final energy use
The material summarized in this section concludes that without action,
global building final energy use may double or potentially even triple
by mid-century, but with ambitious action it can possibly stabilize or
decline as compared to its present levels. However, the integrated and
sectoral models do not fully agree with regard to the extent of mitiga-
tion potential and the key mitigation strategy, although there is a very
wide variation among integrated models with some more agreement
across sectoral models’ conclusions.
The broad mitigation strategy for buildings implied by sectoral analysis
is first to significantly reduce demand for both primary fuels and elec-
tricity by using available technologies for energy efficiency improve-
ment, many of which are cost effective without a carbon price. To the
extent this is insufficient, further mitigation can be achieved through
additional use of low and zero carbon electricity, from a combination
of building integrated renewable energy and substitution of fossil fuels
with low carbon electricity.
The broad mitigation strategies for buildings implied by integrated
models, however, include a greater emphasis on switching to low-
carbon energy carriers (predominantly electricity). These strategies
place less emphasis on reducing energy demand, possibly because
many integrated models do not represent all technical options to
reduce building energy consumption cost-effectively which are covered
in sectoral studies and because of the implicit assumption of general
equilibrium models that all cost-effective opportunities had been taken
up already in the baseline which is at odds with empirical data from
the buildings sector. Integrated model outputs tend to show energy
demand reduction over the coming decades, followed by a more sig-
nificant role for decarbonization of energy supply (with, in some cases,
heavy reliance on bioenergy with carbon dioxide capture and storage
(CCS) to offset remaining direct emissions from buildings and the other
end-use sectors).
To summarize, sectoral studies show there is a larger potential for
energy efficiency measures to reduce building sector final energy use
than is most typically shown by integrated models. This indicates that
some options for demand reductions in the buildings sector are not
included, or at least not fully deployed, by integrated models because
of different model assumptions and / or level of richness in technol-
ogy / option representation (see Section 6.8).
Figure 9�23 | Left panel: The development in the share of electricity in global final energy demand until 2050 in integrated model scenarios (167 scenarios with 430 – 530 ppm
CO
2
eq, 138 scenarios with ppm 530 – 650 CO
2
eq, and 149 scenarios exceeding 720 ppm CO
2
eq — for category descriptions see Chapter 6.3.3), and right panel decomposition of
the annual change in electricity demand share into final energy demand change rate and electricity demand change rate (each gray line indicates a set of points with the same
annual change in electricity demand share). Sources: WG III AR5 Scenario Database (Annex II.10).
0
20
40
60
80
Electricity Share of Global Buildings Final Energy Demand [%]
-1 0 1 2 3 4
4
3
2
1
-1
0
Electricity Change Rate [%/yr]
Final Energy Change Rate [%/yr]
2% per Year
1% per Year
2010 2020 2030 2040 2050
430-530 ppm CO
2
eq
530-650 ppm CO
2
eq
>720 ppm CO
2
eq
Electricity Demand Share Increase 0% per Year
430-530 ppm CO
2
eq
530-650 ppm CO
2
eq
>720 ppm CO
2
eq
Min
75
th
Percentile
Max
Median
25
th
Percentile

715715
Buildings
9
Chapter 9
9.10 Sectoral policies
This section first outlines the policy options to promote energy effi-
ciency in buildings, then provides more detail on the emerging policy
instruments since AR4, then focuses on the key new instruments for
financing and finally considers the policy issues specific to developing
countries.
9�10�1 Policies for energy efficiency in buildings
Section 9.8 shows that many strong barriers prevent the full uptake of
energy saving measures. Market forces alone will not achieve the nec-
essary transformation towards low carbon buildings without external
policy intervention to correct market failures and to encourage new
business and financial models that overcome the first-investment cost
hurdle, which is one of the key barriers. There is a broad portfolio of
effective policy instruments available that show reductions of emis-
sions at low and negative costs; many of them have been implemented
in developed countries and, more recently, in developing countries.
When these policies are implemented in a coordinated manner, they
can be effective in reversing the trend of growing energy consump-
tion. This chapter shows that building energy use has fallen in several
European countries in recent years where strong policies have been
implemented. Beside technological improvement in energy efficiency,
which has been so far the main focus of most polices, policymakers
have recently focused on the need to change consumer behaviour and
lifestyle, based on the concept of sufficiency. Particularly in developed
countries, the existing building stock is large and renewed only very
slowly, and therefore it is important to introduce policies that spe-
cifically target the existing stock, e. g., aiming at accelerating rates
of energy refurbishment and avoiding lock-in to suboptimal retro-
fits — for example, the case of China (Dongyan, 2009). Policies also
need to be dynamic, with periodic revision to follow technical and
market changes; in particular, regulations need regular strengthening,
for example for equipment minimum efficiency standards (Siderius and
Nakagami, 2013) or building codes (Weiss etal., 2012). Recently there
has been more attention to enforcement, which is needed if countries
are to achieve the full potential of implemented or planned policies
(Ellis etal., 2009; Weiss etal., 2012).
The most common policies for the building sector are summarized in
Table 9.9, which includes some examples of the results achieved. Policy
instruments for energy efficiency in buildings may be classified in the
following categories: (1) Regulatory measures are one of the most
effective and cost-effective instruments, for example, building codes
and appliance standards (Boza-Kiss etal., 2013) if properly enforced
(Weiss etal., 2012); see also (Koeppel and Ürge-Vorsatz, 2007; McCor-
mick and Neij, 2009). Standards need to be set at appropriate levels
and periodically strengthened to avoid lock-in to sub-optimal perfor-
mance. (2) Information instruments including equipment energy labels,
building labels and certificates, and mandatory energy audits can be
Figure 9�24 | Global buildings final energy demands by fuel for the seven baseline
scenarios of seven integrated models and their corresponding mitigation scenarios
(480 – 580 ppm CO
2
eq concentration in 2100). AIM-Enduse 1.0 = AIM-Enduse (Back-
cast) 1.0. Sources: WG III AR5 Scenario Database (Annex II.10).
Electricity Gas Oil
Coal Biomass Other
Energy Demand [EJ/yr]
Baseline in 2050
Energy Demand [EJ/yr]
C)
A)
B)
0
100
200
300
0
100
200
300
0
100
200
300
MESSAGE V.4
IMAGE 2.4
AIM-Enduse 1.0
BET 1.5
TAM-WORLD
2012.2
GCAM 3.0
POLES AMPERE
Energy Demand [EJ/yr]
2010
Mitigation Scenarios in 2050

716716
Buildings
9
Chapter 9
Table 9�9 | Policies for energy efficiency in buildings, their environmental effectiveness, i. e., emission reduction impact and societal cost-effectiveness. Source: Based on Boza-Kiss et al. (2013).
Policy title and brief definition Further information, comments
Environmental effectiveness (selected best
practices of annual CO
2
emission reduction)
Cost effectiveness of CO
2
emission reduction (selected best
practices, USD
2010
/ tCO
2
per yr)
References
Building codes are sets of standards
for buildings or building systems
determining minimum requirements
of energy performance.
Lately standards have also been adopted for existing buildings (Desogus etal.,
2013). Traditionally typical low enforcement has resulted in lower than projected
savings. Building codes need to be regularly strengthened to be effective.
EU: 35 – 45 MtCO
2
(2010 – 2011)
LV: 0.002 MtCO
2
/ yr in 2016 (estimated in 2008)
ES: 0.35 MtCO
2
/ yr in 2012
UK : 0.02 MtCO
2
/ yr by 2020 (estimated in 2011)
EU region: <36.5 USD
2010
/ tCO
2
ES: 0.17 USD
2010
/ tCO
2
LV: – 206 USD
2010
/ tCO
2
[1,2,3,4]
Appliance standards (MEPS) are rules or
guidelines for a particular product class that
set a minimum efficiency level, and usually
prohibit the sale of underperforming products.
Most OECD countries have adopted MEPS (in the EU under the Eco-design
Directive). Voluntary agreements with equipment manufacturers are considered
as effective alternatives in some jurisdictions. The Japanese Top Runners
Schemes have proven as successful as MEPS (Siderius and Nakagami, 2013)
(). Developing countries may suffer a secondary effect, receiving products
banned from other markets or inefficient second hand products.
JP: 0.1 MtCO
2
/ yr in 2025 (Top Runner Scheme, 2007)
US: 158 MtCO
2
cumulative in 2030 (2010), updating
the standard — 18 MtCO
2
/ yr in 2040 (2010)
KE: 0.3 MtCO
2
/ yr (for lighting only)
BF: 0.01 MtCO
2
/ yr (lighting only)
JP: 51 USD
2010
/ tCO
2
(Top Runner)
Mor: 13 USD
2010
/ tCO
2
AU: – 52 USD
2010
/ tCO
2
US: – 82 USD
2010
/ tCO
2
EU: – 245 USD
2010
/ tCO
2
[5, 6, 7,8]
Energy labelling is the mandatory
(or voluntary) provision of information
about the energy / other resource use of
end-use products at the point of sale.
Examples include voluntary endorsement labelling (e. g., Energy Star)
and mandatory energy labelling (e. g., the EU energy label). Technical
specifications for the label should be regularly updated to adjust
to the best products on the market. MEPS and labels are usually
co-ordinated policy measures with common technical analysis.
EU: 237 MtCO
2
(1995 – 2020)
OECD N-Am: 792 MtCO
2
(1990 – 2010)
OECD EU: 211 MtCO
2
(1990 – 2010)
NL: 0.11 MtCO
2
/ yr (1995 – 2004)
DK: 0.03 MtCO
2
/ yr (2004)
AU: – 38 USD
2010
/ tCO
2
[9,10,11]
Building labels and certificates
rate buildings related to their energy
performance and provide credible
information about it to users / buyers.
Building labels could be mandatory (for example in the EU) or
voluntary (such as BREEAM, CASBEE, Effinergie, LEED, European
GreenBuilding label, Minergie and PassivHaus). Labels are beginning
to influence market prices (Brounen and Kok, 2011).
SK: 0.05 MtCO
2
(during 2008 – 2010) for mandatory certification
SK: 0.001 MtCO
2
(during 2008 – 2010) for promoting
voluntary certification and audits
EU: 27 USD
2010
/ tCO
2
(2008 – 2010)
for mandatory certification
DK: almost 0 USD
2010
/ tCO
2
[12]
Mandatory energy audits measure the
energy performance of existing buildings and
identify cost-effective improvement potentials.
Audits should be mandatory and subsidized (in particular for developing
countries). Audits are reinforced by incentives or regulations that require
the implementation of the cost-effective recommended measures.
SK: 0.001 MtCO
2
(during 2008 – 2010) for promoting
voluntary certification and audits
FI: 0.036 MtCO
2
(2010)
FI: 27.7 USD
2010
/ tCO
2
(2010)
mandatory audit programme
[2, 12, 13]
Sustainable public procurement
is the organized purchase by public
bodies following pre-set procurement
regulations incorporating energy
performance / sustainability requirements.
Setting a high level of efficiency requirement for all the products that the
public sector purchases, as well as requiring energy efficient buildings when
renting or constructing them, can achieve a significant market transformation,
because the public sector is responsible for a large share of these purchases
and investments. In the EU the EED requires Member States to procure
only most efficient equipment. In the US this is carried out under FEMP.
SK: 0.01 MtCO
2
(introduction of sustainable
procurement principle) (2011 – 2013)
CN: 3.7 MtCO
2
(1993 – 2003)
MX: 0.002 MtCO
2
(2004 – 2005)
UK: 0.34 MtCO
2
(2011)
AT: 0.02 MtCO
2
(2010)
SK: 0.03 USD
2010
/ tCO
2
CN: – 10 USD
2010
/ tCO
2
[12, 14, 15, 16]
Promotion of energy services
(ESCOs) aims to increase the market and
quality of energy service offers, in which
savings are guaranteed and investment
needs are covered from cost savings.
Energy performance contracting (EPC) schemes enable ESCOs or similar
(Duplessis etal., 2012) . Many countries have recently adopted policies
for the promotion of EPC delivered via ESCOs (Marino etal., 2011).
EU:40 – 55MtCO
2
by 2010
AT: 0.016 MtCO
2
/ yr in 2008 – 2010
US: 3.2 MtCO
2
/ yr
CN: 34 MtCO
2
EU: mostly at no cost
AT: no cost
HU: <1 USD
2010
/ tCO
2
US: Public sector: B / C ratio
1.6, Private sector: 2.1
[2, 17,18]
Energy Efficiency Obligations and
White Certificates set, record and
prove that a certain amount of energy
has been saved at the point of end-use.
Schemes may incorporate trading.
Suppliers‘ obligations and white certificates have been introduced in Italy,
France, Poland, the UK, Denmark and the Flemish Region of Belgium and
in Australia. In all the White Certificates schemes the targets imposed
by governments have been so far exceeded (Bertoldi etal., 2010b).
FR: 6.6 MtCO
2
/ yr (2006 – 2009)
IT: 21.5 MtCO
2
(2005 – 2008)
UK: 24.2 MtCO
2
/ yr (2002 – 2008)
DK: 0.5 MtCO
2
/ yr (2006 – 2008)
Flanders (BE): 0.15 MtCO
2
(2008 – 2016)
FR: 36 USD
2010
/ tCO
2
IT: 12 USD
2010
/ tCO
2
UK: 24 USD
2010
/ tCO
2
DK: 66 USD
2010
/ tCO
2
Flanders (BE): 201 USD
2010
/ tCO
2
[19, 20, 21, 22,
23, 24, 25, 26, 27]
Carbon markets limit the total amount
of allowed emissions. Carbon emission
allowances are then distributed and traded.
Carbon cap and trade for the building sector is an emerging policy
instrument (e. g., the Tokyo CO
2
Emission Reduction Program, which
imposes a cap on electricity and energy emissions for large commercial
buildings), although the program is currently under change due
to the special measure for the Great East Japan Earthquake.
CDM: 1267 MtCO
2
(average cumulative saving
per project for 32 registered CDM projects on
residential building efficiency, 2004 – 2012)
JI: 699 MtCO
2
(cumulative) from the single JI project on
residential building energy efficiency (2006 – 2012)
CDM end-use energy efficiency projects,
In:– 113 to 96 USD
2010
/ tCO
2
JI projects (buildings): between
122 and 238 USD
2010
/ tCO
2
[28, 29, 30]

717717
Buildings
9
Chapter 9
Policy title and brief definition Further information, comments
Environmental effectiveness (selected best
practices of annual CO
2
emission reduction)
Cost effectiveness of CO
2
emission reduction (selected best
practices, USD
2010
/ tCO
2
per yr)
References
Energy and carbon tax is levied on
fossil fuels or on energy using products,
based on their energy demand and / or
their carbon content respectively.
Fiscal tools can be powerful, because the increased (relative) price
of polluting energy sources or less sustainable products is expected
to cause a decrease in consumption. However, depending on price
electricity, the tax typically should be quite substantial to have
an effect on behaviour and energy efficiency investments.
SE: 1.15 MtCO
2
/ yr (2006)
DE: 24 MtCO
2
cummulative (1999 – 2010)
DK: 2.3 MtCO
2
(2005)
NL: 3.7 – 4.85 MtCO
2
/ yr (1996 – 2020)
SE: 8.5 USD
2010
/ tCO
2
DE: 96 USD
2010
/ tCO
2
NL: – 421 to – 552 USD
2010
/ tCO
2
(2000 – 2020)
[31, 32, 33, 34]
Use of taxation can be considered as a
type of subsidy, representing a transfer of
funds to investors in energy efficiency.
Examples include reduced VAT, accelerated
depreciation, tax deductions, feebates etc.
TH: 2.04 MtCO
2
(2006 – 2009)
IT: 0.65 MtCO
2
(2006 – 2010)
FR: 1 MtCO
2
(2002)
US: 88 MtCO
2
(2006)
TH: 26.5 USD
2010
/ tCO
2
[35, 36, 37]
Grants and subsidies are economic
incentives, in the form of funds transfer.
Incentives (e. g., grants and subsidies) for investments in energy efficiency,
as provided for building renovation in Estonia, Poland and Hungary
DK: 170 MtCO
2
cummulative (1993 – 2003)
UK: 1.41 MtCO
2
(2008 – 2009)
CZ: 0.05 MtCO
2
(2007)
AU: 0.7 MtCO
2
(2009 – 2011)
FR: 0.4 MtCO
2
(2002 – 2006)
DK: 0.5 USD
2010
/ tCO
2
UK: 84.8 USD
2010
/ tCO
2
FR: 17.9 USD
2010
/ tCO
2
[35, 37, 38, 39]
Soft loans (including preferential
mortgages) are given for carbon-reduction
measures with low interest rates.
Governmental a fiscal incentive to banks, which offer preferential interest
rates to customers and also incentives based on the performances
achieved, e. g., in Germany (CO
2
-Rehabilitation Program).
TH: 0.3 MtCO
2
(2008 – 2009)
LT: 0.33 MtCO
2
/ yr (2009 – 2020)
PL: 0.98 MtCO
2
(2007 – 2010)
TH: 108 USD
2010
/ tCO
2
(total cost of loan)
[37, 40]
Voluntary and negotiated agreements
are tailored contracts between an authority
and another entity, aimed at meeting a
predefined level of energy savings.
Voluntary programmes can be also applied in the built environment as
in the Netherlands and Finland, where housing association and public
property owners agree on energy efficiency targets with the government.
Some voluntary agreements have a binding character; as the agreed
objectives are binding. At city level, an example is the Covenant of Mayors
FI: 9.2 MtCO
2
NL: 2.5 MtCO
2
(2008 – 2020)
DK: 0.09 MtCO
2
/ yr (1996)
FI: 0.15 USD
2010
/ tCO
2
NL: 14 USD
2010
/ tCO
2
DK: 39 USD
2010
/ tCO
2
[2, 13, 41, 42]
Awareness raising and information
campaigns, are programs transmitting
general messages to the whole population�
Individual feedback is characterized by
the provision of tailored information.
Information campaigns to stimulate behavioural changes (e. g., to
turn down the thermostat by 1 °C during the heating season) as well
as investments in energy efficiency technologies; new developments
are seen in the area of smart metering and direct feedback.
BR: 6 – 12 MtCO
2
/ yr (2005)
UK: 0.01 MtCO
2
/ yr (2005)
EU: 0.0004 MtCO
2
(2009)
FI: 0.001 MtCO
2
/ yr (2010)
UK: 0.25 % household energy saving / yr, that is 0.5 MtCO
2
/ yr
(cumulated 2011 – 2020) (billing and metering)
BR: – 69 USD
2010
/ tCO
2
UK: 8.4 USD
2010
/ tCO
2
EU: 40.2 USD
2010
/ tCO
2
US: 20 – 98 USD
2010
/ tCO
2
[2, 43, 44, 45, 46]
Public Leadership Programmes are
public practices going beyond the minimum
requirements in order to lead by example
and demonstrate good examples.
IE: 0.033 MtCO
2
(2006 – 2010)
BR: 6.5 – 12.2 MtCO
2
/ yr
ZA: 25 USD
2010
/ tCO
2
BR: – 125 USD
2010
/ tCO
2
[2, 47]
Notes: Country codes (ISO 3166): AT-Austria; AU-Australia; BE- Belgium; BF- Burkina Faso; BR- Brazil; CN- China; CZ-Czech Republic; DE- Germany; DK- Denmark; ES- Spain; EU- European Union; FI- Finland; FR-France; HU- Hungary;
IE- Ireland; IN-India; IT-Italy; JP- Japan; KE- Kenya; LT- Lithuania; LV- Latvia; Mor – Morocco; MX- Mexico; NL-The Netherlands; OECD EU- OECD countries in Europe; OECD N-Am: OECD countries in North-America; PL- Poland; SE-Sweden;
SK- Slovak Republic; SL- Slovenia; TH- Thailand; UK- United Kingdom; US- United States; ZA South Africa.
References: [1](EC, 2003);[2] (Koeppel and Ürge-Vorsatz, 2007);[3](DECC, 2011); [4] (Government of Latvia, 2011);[5](Kainou, 2007);[6] (AHAM, 2010); [7] (En.lighten, 2010);[8] (US EERE, 2010); [9] (IEA, 2003) [10] (Wiel and McMahon,
2005); [11] (Luttmer, 2006); [12] (Government of Slovakia, 2011); [13] (Government of Finland, 2011); [14] (FI, 2005); [15] (Van Wie McGrory etal., 2006);[16] (LDA, 2011); [17] (AEA, 2011); [19] (MNDH, 2011); [20] (Lees, 2006); [21]
(Lees, 2008); [22] (Lees, 2011); [23] (Pavan, 2008); [24] (Bertoldi and Rezessy, 2009); [25](Bertoldi etal., 2010b); [26] (Giraudet etal., 2011); [27] (Langham etal., 2010); [28] (BETMG, 2012); [29] (UNEP Risoe, 2012); [30] (Bertoldi etal.,
2013b); [31](Knigge and Görlach, 2005); [32] (Price etal., 2005); [33] (EPC, 2008); [34] (IEA, 2012b); [35] (GMCA, 2009); [36] (APERC, 2010); [37] (BPIE, 2010); [38] (Missaoui and Mourtada, 2010); [39] (Hayes etal., 2011); [40] (Galvin,
2012); [41] (Rezessy and Bertoldi, 2010); [42] (MIKR, 2011); [43] (Uitdenbogerd etal., 2009); [44] (CPI, 2011); [45] (UK DE, 2011); [46] (CB, 2012); [47] (Government of Ireland, 2011).

718718
Buildings
9
Chapter 9
relatively effective on their own depending on their design, but can also
support other instruments, in particular standards (Kelly, 2012; Boza-
Kiss etal., 2013). (3) Direct market intervention instruments include
public procurement, which can have an important role in transforming
the market. More recently, governments have supported the develop-
ment of energy service companies (ESCOs) (see section 9.10.3). (4)
Economic Instruments include several options, including both tradable
permits, taxes, and more focussed incentives. Tradable permits (often
called market-based instruments) include tradable white certificates
(see section 9.10.2), as well as broader carbon markets (see Chapter
13). Taxes include energy and carbon taxes and have increasingly been
implemented to accelerate energy efficiency (UNEP SBCI, 2007). They
are discussed in more detail in Chapter 15, and can complement and
reinforce other policy instruments in the building sector. Sector specific
tax exemptions and reductions, if appropriately structured, can provide
a more effective mechanism than energy taxes (UNEP SBCI, 2007).
Options include tax deductions building retrofits (Valentini and Pisto-
chini, 2011), value-added tax exemption, and various tax reliefs (Dong-
yan, 2009), as well as exemptions from business taxes for CDM proj-
ects (RSA, 2009). More focussed incentives include low interest loans
and incentives which can be very effective in enlarging the market for
new efficient products and to overcome first cost barriers for deep ret-
rofits (McGilligan etal., 2010). (5) Voluntary agreements include pro-
grammes such as industry agreements. Their effectiveness depends on
the context and on accompanying policy measures (Bertoldi, 2011). (6)
Advice and leadership programmes include policies such as informa-
tion campaigns, advice services, and public leadership programmes to
build public awareness and capacity.
A large number of countries have successfully adopted building sec-
tor policies. The most popular instruments in developing countries so
far have been appliance standards, public procurement, and leader-
ship programmes. Table 9.9 provides more detailed descriptions of the
various instruments, a brief identification of some key issues related to
their success, and a quantitative evaluation of their environmental and
cost-effectiveness from the literature. Although there is a significant
spread in the results, and the samples are small for conclusive judg-
ments on individual instruments, the available studies indicate that
among the most cost-effective instruments have been building codes
and labels, appliance standards and labels, supplier obligations, public
procurement, and leadership programmes. Most of these are regula-
tory instruments. However, most instruments have best practice appli-
cations that have achieved CO
2
reductions at low or negative social
costs, signalling that a broad portfolio of tools is available to govern-
ments to cost-effectively cut building-related emissions.
Appliance standards and labels, building codes, promotion of ESCOs,
Clean Development Mechanisms and Joint Implementation (CDM
JI), and financing tools (grants and subsidies) have so far performed
as the most environmentally effective tools among the documented
cases. However, the environmental effectiveness also varies a lot by
case. Based on a detailed analysis of policy evaluations, virtually any
of these instruments can perform very effectively (environmentally
and / or cost-wise) if tailored to local conditions and policy settings, and
if implemented and enforced well (Boza-Kiss etal., 2013). Therefore, it
is likely that the choice of instrument is less crucial than whether it is
designed, applied, implemented, and enforced well and consistently.
Most of these instruments are also effective in developing countries,
where it is essential that the co-benefits of energy-efficiency policies
(see Section 10.7) are well-mapped, quantified and well understood by
the policy-makers (Ryan and Campbell, 2012; Koeppel and Ürge-Vor-
satz, 2007). Policy integration with other policy domains is particularly
effective to leverage these co-benefits in developing countries, and
energy-efficiency goals can often be pursued more effectively through
other policy goals that have much higher ranking in political agen-
das and thus may enjoy much more resources and a stronger political
momentum than climate change mitigation.
9�10�1�1 Policy packages
No single policy is sufficient to achieve the potential energy savings
and that combination (packages) of polices can have combined results
that are bigger than the sum of the individual policies (Harmelink etal.,
2008; Tambach etal., 2010; Weiss etal., 2012; Murphy etal., 2012).
The EU’s Energy Efficiency Directive (EED) (European Union, 2012) has,
since 2008, required Member States to describe co-ordinated packages
of policies in their National Energy Efficiency Action Plans (NEEAP).
Market transformation of domestic appliances in several developed
countries has been achieved through a combination of minimum stan-
dards, energy labels, incentives for the most efficient equipment, and
an effective communication campaign for end-users (Boza-Kiss etal.,
2013). The specific policies, regulations, programmes and incentives
needed are highly dependent on the product, market structure, institu-
tional capacity, and the background conditions in each country. Other
packages of measures are mandatory audits and financial incentives
for the retrofitting of existing buildings, with incentives linked to the
implementation of the audit findings and minimum efficiency require-
ments; voluntary programmes coupled with tax exemptions and other
financial incentives (Murphy et al., 2012); and suppliers’ obligations
and white certificates (and, in France, tax credits) in addition to equip-
ment labelling and standards — in order to promote products beyond
the standards’ requirements (Bertoldi et al., 2010b).
9�10�1�2 A holistic approach
Energy efficiency in buildings requires action beyond the point of
investment in new buildings, retrofit, and equipment. A holistic
approach considers the whole lifespan of the building, including master
planning, lifecycle assessment and integrated building design to obtain
the broadest impact possible, and therefore needs to begin at the
neighbourhood or city level (see Chapter 12). In the holistic approach,
building codes, design, operation, maintenance, and post occupancy
evaluation are coordinated. Continuous monitoring of building energy
use and dynamic codes allow policies to close the gap between design

719719
Buildings
9
Chapter 9
goals and actual building energy performance. The use of modern
technologies to provide feedback on consumption in real time allows
adjustment of energy performance and as a function of external energy
supply. Dynamic information can also be used for energy certificates
and databases to disclose building energy performance. Moreover,
studies on durability and climate change mitigation show that the lifes-
pan of a technical solution is as important as the choice of material,
which signals to the importance of related policies such as eco-design
directives and mandatory warranties (Mequignon etal., 2013a; b).
Another challenge is the need to develop the skills and training to
deliver, maintain, and manage low carbon buildings. To implement the
large number of energy saving projects (building retrofits or new con-
struction) a large, skilled workforce is needed to carry out high-quality
work at relatively low cost.
Implementation and enforcement of policies are key components of
effective policy. These two components used together are the only way
to ensure that the expected results of the policy are achieved. Devel-
oped countries are now increasing attention to proper implementation
and enforcement (Jollands etal., 2010), for example, to survey equip-
ment efficiency when minimum standards are in place and to check
compliance with building codes. For example, EU Member States are
required to develop independent control systems for their building
labelling schemes (European Union, 2012). Public money invested in
implementation and enforcement will be highly cost effective (Tambach
etal., 2010), as it contributes to the overall cost-effectiveness of poli-
cies. In addition to enforcement, ex-post evaluation of policies is needed
to assess their impact and to review policy design and stringency or to
complement it with other policies. Implementation and enforcement is
still a major challenge for developing countries that lack much of the
capacity (e. g., testing laboratories for equipment efficiency) and knowl-
edge to implement policies such as standards, labels and building codes.
9�10�2 Emerging policy instruments in
buildings
Recent reports have comprehensively reviewed building-related poli-
cies (IPCC, 2007; GEA, 2012); the remainder of this chapter focuses on
recent developments and important emerging instruments.
While technical efficiency improvements are still needed and are impor-
tant to reduce energy demand (Alcott, 2008), increases in energy use
are driven primarily by increasing demand for energy services (e. g.,
built space per capita and additional equipment). To address this, poli-
cies need to influence consumer behaviour and lifestyle (Herring, 2006;
Sanquist etal., 2012) and the concept of sufficiency has been intro-
duced in the energy efficiency policy debate (Herring, 2006; Oikonomou
etal., 2009). Policies to target sufficiency aim at capping or discourag-
ing increasing energy use due to increased floor space, comfort levels,
and equipment. Policy instruments in this category include: (1) personal
carbon trading (i. e., carbon markets with equitable personal alloca-
tions) — this has not yet been introduced and its social acceptability
(Fawcett, 2010) and implementation (Eyre, 2010) have to be further
demonstrated; (2) property taxation (e. g., related to a building’s CO
2
emissions); and (3) progressive appliance standards and building codes,
for example, with absolute consumption limits (kWh / person / year)
rather than efficiency requirements (kWh / m
2
/ year) (Harris etal., 2007).
In order to reduce energy demand, policies may include promoting
density, high space utilization, and efficient occupant behaviour as
increased floor space entails more energy use. This might be achieved,
for example, through incentives for reducing energy consumption — the
so-called energy saving feed-in tariff (Bertoldi etal., 2010a; 2013a).
9�10�2�1 New developments in building codes (ordinance,
regulation, or by-laws)
A large number of jurisdictions have now set, or are considering,
very significant strengthening of the requirements for energy per-
formance in building codes. There are debates about the precise
level of ambition that is appropriate, especially with regard to NZEB
mandates, which can be problematic (see 9.3). The EU is requiring
its Member States to introduce building codes set at the cost opti-
mal point using a lifecycle calculation, both for new buildings and
those undergoing major renovation. As a result, by the end of 2020,
all new buildings must be nearly zero energy by law. Many Mem-
ber States (e. g., Denmark, Germany) have announced progressive
building codes to gradually reduce the energy consumption of build-
ings towards nearly net zero levels. There is also action within local
jurisdictions, e. g., the city of Brussels has mandated that all new
social and public buildings must meet Passive House levels from
2013, while all new buildings have to meet these norms from 2015
(Moniteur Belge, 2011; BE, 2012; CSTC, 2012). In China, building
codes have been adopted that seek saving of 50 % from pre-existing
levels, with much increased provision for enforcement, leading to
high expected savings (Zhou etal., 2011b). As demonstrated in sec-
tions 9.2 and 9.9, the widespread proliferation of these ambitious
building codes, together with other policies to encourage efficiency,
have already contributed to total building energy use trends stabiliz-
ing, or even slowing down.
9�10�2�2 Energy efficiency obligation schemes and ‘white’
certificates
Energy efficiency obligation schemes with or without so-called ‘white
certificates’ as incentive schemes have been applied in some Member
States of the European Union (Bertoldi et al., 2010a) and Australia
(Crossley, 2008), with more recent uses in Brazil and India. White cer-
tificates evolved from non-tradable obligations on monopoly energy
utilities, also known as suppliers’ obligations or energy efficiency
resources standards, largely but not only in the United States. Market
liberalization initially led to a reduction in such activity (Ürge-Vorsatz

720720
Buildings
9
Chapter 9
etal., 2012b), driven by a belief that such approaches were not needed
in, or incompatible with, competitive markets, although this is not cor-
rect (Vine etal., 2003). Their main use has been in regulated markets
driven by obligations on energy companies to save energy (Bertoldi
and Rezessy, 2008). The use of suppliers’ obligations began in the UK
in 2000, and these obligations are now significant in a number of EU
countries, notably UK, France and Italy (Eyre etal., 2009). Energy sup-
plier obligation schemes are a key part of EU policy for energy effi-
ciency and the Energy Efficiency Directive (European Union, 2012)
requires all EU Member States to introduce this policy or alternative
schemes. Precise objectives, traded quantity and rules differ across
countries. Cost effectiveness is typically very good (Bertoldi, 2012).
However, white certificates tend to incentivize low cost, mass market
measures rather than deep retrofits, and therefore there are concerns
that this policy approach may not be best suited to future policy objec-
tives (Eyre etal., 2009).
9�10�3 Financing opportunities
9�10�3�1 New financing schemes for deep retrofits
Energy efficiency in buildings is not a single market: it covers a diverse
range of end-use equipment and technologies and requires very large
numbers of small, dispersed projects with a diverse range of decision
makers. As the chapter has demonstrated, many technologies in the
building sector are proven and economic: if properly financed, the
investment costs are paid back over short periods from energy cost
savings. However, many potentially attractive energy investments do
not meet the short-term financial return criteria of businesses, inves-
tors, and individuals, or there is no available financing. While signifi-
cant savings are possible with relatively modest investment premiums,
a first-cost sensitive buyer, or one lacking financing, will never adopt
transformative solutions. Major causes of this gap are the shortage of
relevant finance and of delivery mechanisms that suit the specifics of
energy efficiency projects and the lack — in some markets — of pipe-
lines of bankable energy efficiency projects. Creative business models
from energy utilities, businesses, and financial institutions can over-
come first-cost hurdles (Veeraboina and Yesuratnam, 2013). One inno-
vative example is for energy-efficiency investment funds to capitalize
on the lower risk of mortgage lending on low-energy housing; the
funds to provide such investment can be attractive to socially respon-
sible investment funds. In Germany, through the KfW development
bank, energy efficiency loans with low interest rate are offered mak-
ing it attractive to end-users. The scheme has triggered many building
refurbishments (Harmelink etal., 2008).
Another example is the ‘Green Deal’, which is a new initiative by the
UK government designed to facilitate the retrofitting of energy sav-
ing measures to all buildings. Such schemes allows for charges on
electricity bills in order to recoup costs of building energy efficiency
improvements by private firms to consumers (Bichard and Thurairajah,
2013). The finance is tied to the energy meter rather than the building
owner. The Green Deal was expected primarily to finance short pay-
back measures previously covered by the suppliers’ obligation, rather
than deep retrofits. However, the UK government does not subsidize
the loan interest rate, and commercial interest rates are not generally
attractive to end-users. Take-up of energy efficiency in the Green Deal
is therefore expected to be much lower than in a supplier obligation
(Rosenow and Eyre, 2013).
In areas of the United States with Property Assessed Clean Energy
(PACE) legislation in place, municipality governments offer a specific
bond to investors and then use this to finance lending to consumers
and businesses for energy retrofits (Headen etal., 2010). The loans are
repaid over the assigned term (typically 15 or 20 years) via an annual
assessment on their property tax bill. Legal concerns about the effect
of PACE lending on mortgages for residential buildings (Van Nostrand,
2011) have resulted in the approach being mainly directed to non-
domestic buildings.
ESCOs provide solutions for improving energy efficiency in buildings
by guaranteeing that energy savings are able to repay the efficiency
investment, thus overcoming financial constraints to energy efficiency
investments. The ESCO model has been found to be effective in devel-
oped countries such as Germany (Marino etal., 2011) and the United
States. In the last decade ESCOs have been created in number of devel-
oping countries (e. g., China, Brazil, and South Korea) supported by
international financial institutions and their respective governments
(UNEP SBCI, 2007; Da-li, 2009). Since the introduction of an interna-
tional cooperation project by the Chinese government and World Bank
in 1998, a market-based energy performance contract mechanism and
ESCO industry has developed in China (Da-li, 2009) with Chinese gov-
ernment support. Policies for the support of ESCOs in developing coun-
tries include the creation of a Super ESCOs (Limaye and Limaye, 2011)
by governmental agencies. Financing environments for ESCOs need to
be improved to ensure they operate optimally and sources of financ-
ing, such as debt and equity, need to be located. Possible financing
sources are commercial banks, venture capital firms, equity funds, leas-
ing companies, and equipment manufacturers (Da-li, 2009). In social
housing in Europe, funding can be provided through Energy Perfor-
mance Certificates (EPC), in which an ESCO invests in a comprehensive
refurbishment and repays itself through the generated savings. Social
housing operators and ESCOs have established the legal, financial, and
technical framework to do this (Milin and Bullier, 2011).
9�10�3�2 Opportunities in financing for green buildings
The existing global green building market is valued at approximately
550 billion USD
2010
and is expected to grow through to 2015, with Asia
anticipated to be the fastest growing region (Lewis, 2010). A survey
on responsible property investing (RPI) (UNEP FI, 2009), covering key
markets around the world, has shown it is possible to achieve a com-
petitive advantage and greater return on property investment by effec-

721721
Buildings
9
Chapter 9
tively tackling environmental and social issues when investing in real
estate (UNEP FI and PRI signatories, 2008). For example, in Japan, new
rental-apartment buildings equipped with solar power systems and
energy-saving devices had significantly higher occupancy rates than
the average for other properties in the neighbourhood, and investment
return rates were also higher (MLIT, 2010a; b). A survey comparing rent
and vacancy rates of buildings (Watson, 2010) showed rents for LEED
certified buildings were consistently higher than for uncertified build-
ings. In many municipalities in Japan, assessment by the Comprehen-
sive Assessment System for Built Environment Efficiency (CASBEE) and
notification of assessment results are required at the time of construc-
tion (Murakami etal., 2004). Several financial products are available
that provide a discount of more than 1 % on housing loans, depending
on the grade received by the CASBEE assessment. This has been con-
tributing to the diffusion of green buildings through financial schemes
(IBEC, 2009). In addition, a housing eco-point system was implemented
in 2009 in Japan, broadly divided between a home appliances eco-
point system and a housing eco-point system. In the housing eco-point
system, housing which satisfies the Top Runner-level standards are tar-
geted, both newly constructed and existing buildings. This programme
has contributed to the promotion of green buildings, with 160,000
(approximately 20 % of the total market) applications for subsidies for
newly constructed buildings in 2010. In existing buildings, the number
of window replacements has increased, and has attracted much atten-
tion (MLIT, 2012).
9�10�4 Policies in developing countries
Economic instruments and incentives are very important means to
encourage stakeholders and investors in the building sector to adopt
more energy efficient approaches in the design, construction, and
operation of buildings (Huovila, 2007). This section provides an over-
view of financial instruments commonly applied in the developing
world to promote emissions reduction in building sector.
In terms of carbon markets, the Clean Development Mechanism
(CDM) has a great potential to promote energy efficiency and lower
emissions in building sector. However, until recently it has bypassed
the sector entirely, due to some methodological obstacles to energy
efficiency projects (Michaelowa etal., 2009). However, a ‘whole build-
ing’ baseline and monitoring methodology approved in 2011 may pave
the way for more building projects (Michaelowa and Hayashi, 2011).
Since 2009, the share of CDM projects in the buildings sector has
increased, particularly with regard to efficient lighting schemes (UNEP
Risoe, 2012). The voluntary market has complemented the CDM as a
financing mechanism, for example for solar home systems projects
(Michaelowa etal., 2009; Michaelowa and Hayashi, 2011).
Public benefits charges are financing mechanisms meant to raise funds
for energy efficiency measures and to accelerate market transforma-
tion in both developed and developing countries (UNEP SBCI, 2007).
In Brazil, all energy distribution utilities are required to spend a mini-
mum of 1 % of their revenue on energy efficiency interventions while
at least a quarter of this fund is expected to be spent on end-user effi-
ciency projects (UNEP SBCI, 2007).
Utility demand side management (DSM) may be the most viable option
to implement and finance energy efficiency programs in smaller devel-
oping countries (Sarkar and Singh, 2010). In a developing country
context, it is common practice to house DSM programmes within the
local utilities due to their healthy financial means and strong techni-
cal and implementation capacities, for example, in Argentina, South
Africa, Brazil, India, Thailand, Uruguay and Vietnam (Winkler and Van Es,
2007; Sarkar and Singh, 2010). Eskom, the South African electricity util-
ity, uses its DSM funds mainly to finance load management and energy
efficiency improvement including millions of free issued compact fluo-
rescent lamps that have been installed in households (Winkler and Van
Es, 2007).
Capital subsidies, grants and subsidized loans are among the most
frequently used instruments for implementation of increased energy
efficiency projects in buildings. Financial subsidy is used as the primary
supporting fund in the implementation of retrofit projects in China
(Dongyan, 2009). In recent years, the World Bank Group has steadily
increased energy efficiency lending to the highest lending ever in the
fiscal year of 2009 of USD
2010
3.3 billion, of which USD
2010
1.7 billion
committed investments in the same year alone (Sarkar and Singh,
2010). Examples include energy efficient lighting programmes in
Mali, energy efficiency projects in buildings in Belarus, carbon finance
blended innovative financing to replace old chillers (air conditioning)
with energy efficient and chlorofluorocarbon-free (CFC) chillers in com-
mercial buildings in India (Sarkar and Singh, 2010). The Government
of Nepal has been providing subsidies in the past few years to pro-
mote the use of solar home systems (SHS) in rural households (Dhakal
and Raut, 2010). The certified emission reductions (CERs) accumulated
from this project were expected to be traded in order to supplement
the financing of the lighting program. The Global Environmental Facil-
ity (GEF) has directed a significant share of its financial resources to
SHS and the World Bank similarly has provided a number of loans for
SHS projects in Asia (Wamukonya, 2007). The GEF has provided a grant
of 219 million USD
2010
to finance 23 off-grid SHS projects in 20 coun-
tries (Wamukonya, 2007).
9.11 Gaps in knowledge
and data
Addressing these main gaps and problems would improve the under-
standing of mitigation in buildings:
• The lack of adequate bottom-up data leads to a dominance of top
down and supply-focused decisions about energy systems.

722722
Buildings
9
Chapter 9
• Misinformation and simplified techniques pose risks to providing a
full understanding of integrated and regionally adequate building
systems, and this leads to fragmented actions and weaker results.
• Weak or poor information about opportunities and costs affects
optimal decisions and appropriate allocation of financial resources.
• Energy indicators relate to efficiency, but rarely to sufficiency.
• Improved and more comprehensive databases on real, measured
building energy use, and capturing behaviour and lifestyles are
necessary to develop exemplary practices from niches to standard.
• Continuous monitoring and constant modification of performance
and dynamics of codes would allow implementation to catch up
with the potential for efficiency improvements and co-benefits;
this would also provide better feedback to the policymaking pro-
cess, to education, to capacity building, and to training.
• Quantification and monetization of (positive and negative) exter-
nalities over the building life cycle should be well-integrated into
decision-making processes.
9.12 Frequently Asked
Questions
FAQ 9�1 What are the recent advances in
building sector technologies and know-
how since the AR4 that are important
from a mitigation perspective?
Recent advances in information technology, design, construction,
and know-how have opened new opportunities for a transforma-
tive change in building-sector related emissions that can contribute
to meeting ambitious climate targets at socially acceptable costs, or
often at net benefits. Main advances do not lie in major technologi-
cal developments, but rather in their extended systemic application,
partially as a result of advanced policies, as well as in improvements
in the performance and reductions in the cost of several technologies.
For instance, there are over 57,000 buildings meeting Passive House
standard and ‘nearly zero energy’ new construction has become the
law in the 27 Member States of the European Union. Even higher
energy performance levels are being successfully applied to new and
existing buildings, including non-residential buildings. The costs have
been gradually declining; for residential buildings at the level of Pas-
sive House standard they account for 5 – 8 % of conventional building
costs, and some net zero or nearly zero energy commercial buildings
having been built at equal or even lower costs than conventional ones
(see 9.3 and 9.7).
FAQ 9�2 How much could the building sector
contribute to ambitious climate change
mitigation goals, and what would be the
costs of such efforts?
According to the GEA ‘efficiency’ pathway, by 2050 global heating and
cooling energy use could decrease by as much as 46 % as compared to
2005, if today’s best practices in construction and retrofit know-how
are broadly deployed (Ürge-Vorsatz etal., 2012c). This is despite the
over 150 % increase in floor area during the same period, as well as
significant increase in thermal comfort, as well as the eradication of
fuel poverty (Ürge-Vorsatz etal., 2012c). The costs of such scenarios are
also significant, but according to most models, the savings in energy
costs typically more than exceed the investment costs. For instance,
GEA (2012) projects an approximately 24 billion USD
2010
in cumulative
additional investment needs for realizing these advanced scenarios,
but estimates an over 65 billion USD
2010
in cumulative energy cost sav-
ings until 2050.
FAQ 9�3 Which policy instrument(s) have been
particularly effective and / or cost-
effective in reducing building-sector
GHG emission (or their growth, in
developing countries)?
Policy instruments in the building sector have proliferated since the
AR4, with new instruments such as white certificates, preferential
loans, grants, progressive building codes based on principles of cost-
optimum minimum requirements of energy performance and life cycle
energy use calculation, energy saving feed-in tariffs as well as suppli-
ers’ obligations, and other measures introduced in several countries.
Among the most cost-effective instruments have been building codes
and labels, appliance standards and labels, supplier obligations, public
procurement and leadership programs. Most of these are regulatory
instruments. However, most instruments have best practice applica-
tions that have achieved CO
2
reductions at low or negative social
costs, signalling that a broad portfolio of tools is available to govern-
ments to cut building-related emissions cost-effectively. Appliance
standards and labels, building codes, promotion of ESCOs, CDM and
JI, and financing tools (grants and subsidies) have so far performed
as the most environmentally effective tools among the documented
cases. However, the environmental effectiveness also varies a lot by
case. Based on a detailed analysis of policy evaluations, virtually any of
these instruments can perform very effective (environmentally and / or
cost-wise) if tailored to local conditions and policy settings, and if
implemented and enforced well (Boza-Kiss etal., 2013). Therefore it
is likely that the choice of instrument is less crucial than whether it is
designed, applied, implemented and enforced well and consistently.

723723
Buildings
9
Chapter 9
References
ABC (2008)� Building energy efficiency: why green buildings are key to Asia’s future.
Hong Kong.
ADEME (2008)� Activities Related to Renewable Energy & Energy Efficiency: Mar-
kets, Employment and Energy Stakes Situation 2006 – 2007 — Projections 2012.
Agence de l’Environnement et La Maîtrise de l’Energie(ADEME) / Direction Exéc-
utive de La Stratégie et de La Recherche (DESR) / Service Observation Economie
et Evaluation (SOEE), Angers, France, 139 pp.
AEA (2011)� Second National Energy Efficiency Action Plan of the Republic of Aus-
tria 2011. Austrian Energy Agency, Federal Ministry of Economy, Family and
Youth. Vienna, Austria, 119 pp.
Aebischer B�, G� Catenazzi, and M� Jakob (2007)� Impact of climate change on
thermal comfort, heating and cooling energy demand in Europe. In: Proceed-
ings ECEEE Summer Study.
AHAM (2010)� Energy Efficient and Smart Appliance Agreement of 2010. Associa-
tion of Home Appliance Manufacturers.
Akbari H�, H� Damon Matthews, and D� Seto (2012)� The long-term effect of
increasing the albedo of urban areas. Environmental Research Letters 7,
024004. doi: 10.1088 / 1748-9326 / 7 / 2 / 024004, ISSN: 1748 – 9326.
Akbari H�, S� Menon, and A� Rosenfeld (2009)� Global cooling: increasing
world-wide urban albedos to offset CO
2
. Climatic Change 94, 275 – 286. doi:
10.1007 / s10584-008-9515-9, ISSN: 0165 – 0009, 1573 – 1480.
Alcott B� (2008)� The sufficiency strategy: Would rich-world frugality lower envi-
ronmental impact? Ecological Economics 64, 770 – 786. doi: 10.1016 / j.ecole-
con.2007.04.015, ISSN: 0921 – 8009.
Alvarez G� C�, R� M� Jara, J� R� R� Julián, and J� I� G� Bielsa (2010)� Study of the
Effects on Employment of Public Aid to Renewable Energy Sources. Univer-
sidad Rey Juan Carlos, Madrid, Spain, 52 pp. Available at: http: / / www. voced.
edu. au / word / 49731.
Aman M� M�, G� B� Jasmon, H� Mokhlis, and A� H� A� Bakar (2013)� Analysis of
the performance of domestic lighting lamps. Energy Policy 52, 482 – 500. doi:
10.1016 / j.enpol.2012.09.068, ISSN: 0301 – 4215.
Amundsen H� A� (2010)� Overcoming barriers to climate change adaptation-a
question of multilevel governance? Environment and Planning C: Government
and Policy 28, 276 – 289. Available at: http: / / www. scopus. com / inward / record.
url?eid=2-s2.0 – 77953333390&partnerID=40&md5=f66b5281061c5e9bd52ec
3b162e29f28.
Anderson R�, C� Christensen, and S� Horowitz (2006)� Analysis of residential sys-
tem strategies targeting least-cost solutions leading to net zero energy homes.
In: ASHRAE Transactions. American Society of Heating, Refrigerating and Air-
Conditioning Engineers, Atlanta. 330 – 341 pp.
Andreasi W� A�, R� Lamberts, and C� Candido (2010)� Thermal acceptability
assessment in buildings located in hot and humid regions in Brazil. Building
and Environment 45, 1225 – 1232. doi: 10.1016 / j.buildenv.2009.11.005, ISSN:
0360 – 1323.
Anenberg S� C�, K� Balakrishnan, J� Jetter, O� Masera, S� Mehta, J� Moss, and V�
Ramanathan (2013)� Cleaner Cooking Solutions to Achieve Health, Climate,
and Economic Cobenefits. Environmental Science & Technology 47, 3944 – 3952.
Available at: http: / / pubs.acs.org / doi / full / 10.1021 / es304942e.
Anenberg S� C�, J� Schwartz, D� Shindell, M� Amann, G� Faluvegi, Z� Klimont, G�
Janssens-Maenhout, L� Pozzoli, R� Van Dingenen, E� Vignati, L� Emberson,
N� Z� Muller, J� J� West, M� Williams, V� Demkine, W� K� Hicks, J� Kuylensti-
erna, F� Raes, and V� Ramanathan (2012)� Global Air Quality and Health Co-
benefits of Mitigating Near-Term Climate Change through Methane and Black
Carbon Emission Controls. Environmental Health Perspectives 120, 831 – 839.
doi: 10.1289 / ehp.1104301, ISSN: 0091 – 6765.
Anisimova N� (2011)� The capability to reduce primary energy demand in EU hous-
ing. Energy and Buildings 43, 2747 – 2751. doi: 10.1016 / j.enbuild.2011.06.029,
ISSN: 03787788.
Antwi-Agyei E� (2013)� Refrigerator energy efficiency project. Available at:
http: / / www. energyguide. org. gh / page.php?page=429§ion=57&typ=1.
Anwyl J� (2011)� Passivhaus architecture for schools, case study: Hadlow Col-
lege. London, UK. Available at: http: / / www. ukpassivhausconference.
org. uk / 2011-conference-presentations-day-one-24th-october-2011.
APERC (2010)� Compendium of Energy Efficiency Policies of APEC Economies
Thailand. Asia Pacific Energy Research Centre, Japan, 13 pp. Available at:
http: / / aperc.ieej.or.jp / file / 2014 / 1 / 27 / CEEP2012_Thailand.pdf.
Ardente F�, M� Beccali, M� Cellura, and M� Mistretta (2008)� Building energy
performance: A LCA case study of kenaf-fibres insulation board. Energy and
Buildings 40, 1 – 10. doi: 10.1016 / j.enbuild.2006.12.009, ISSN: 03787788.
Artmann N�, D� Gyalistras, H� Manz, and P� Heiselberg (2008)� Impact of climate
warming on passive night cooling potential. Building Research and Information
36, 111 – 128.
Atkinson J� G� B�, T� Jackson, and E� Mullings-Smith (2009)� Market influence
on the low carbon energy refurbishment of existing multi-residential build-
ings. Energy Policy 37, 2582 – 2593. doi: 10.1016 / j.enpol.2009.02.025, ISSN:
0301 – 4215.
Audenaert A�, S� De Cleyn, and B� Vankerckhove (2008)� Economic analysis of
Passive Houses and low-energy houses compared with standard houses. Energy
Policy 36, 47 – 55.
Aunan K�, J� Fang, H� Vennemo, K� Oye, and H� M� Seip (2004)� Co-benefits of
climate policy — lessons learned from a study in Shanxi, China. Energy Policy
32, 567 – 581. Available at: http: / / www. sciencedirect. com / science / article /
pii / S0301421503001563.
Baetens R�, B� P� Jelle, and A� Gustavsen (2011)� Aerogel insulation for building
applications: A state-of-the-art review. Energy and Buildings 43, 761 – 769. doi:
10.1016 / j.enbuild.2010.12.012, ISSN: 03787788.
Bansal P�, E� Vineyard, and O� Abdelaziz (2011)� Advances in household appli-
ances — a review. Applied Thermal Engineering 31, 3748 – 3760. doi: 10.1016 / j.
applthermaleng.2011.07.023, ISSN: 1359 – 4311.
Barthel C�, and T� Götz (2013)� What Users Can Save with Energy and Water Effi-
cient Washing Machines. Wuppertal Institute for Climate, Environment and
Energy. Wuppertal, Germany, 22 pp.
Batty W� J�, H� Al-Hinai, and S� D� Probert (1991)� Natural-cooling techniques
for residential buildings in hot climates. Applied Energy 39, 301 – 337. doi:
10.1016 / 0306-2619(91)90002-F, ISSN: 0306 – 2619.
BE (2012)� Bruxelles, pionnière dans le “standard passif.” Available at: http: / / www.
bruxellesenvironnement. be / Templates / news.aspx?id=36001&langtype=2060&
site=pr.
Behr (2009)� Utility bills in Passive Houses — doing away with metered billing. In:
Conference Proceedings. Passive House Institute, Darmstadt, Germany, Frank-
furt am Main. 377 – 382 pp.

724724
Buildings
9
Chapter 9
Berdahl P� (1995)� Building energy efficiency and fire safety aspects of reflec-
tive coatings. Energy and Buildings 22, 187 – 191. Available at: http: / / www.
sciencedirect. com / science / article / pii / 037877889500921J.
Bergman N�, L� Whitmarsh, and J� Köhler (2008)� Transition to Sustainable Devel-
opment in the UK Housing Sector: From Case Study to Model Implementation.
Tyndall Centre for Climate Change Research, School of Environmental Sciences,
University of East Anglia, 32 pp.
BERR (2001)� UK Fuel Poverty Strategy. Department for Business Enterprise and
Regulatory Reform, UK, London, UK, 158 pp.
Bertoldi P� (2011)� Assessment and Experience of White Certificate Schemes in the
European Union. JRC European Commission.
Bertoldi P� (2012)� Energy Efficiency Policies and white certificates: analysis of
experiences in the European Union. JRC European Commission.
Bertoldi P�, and C� N� Ciugudeanu (2005)� Successful Examples of Efficient Light-
ing. European Commission, DG JRC, Institute for Environment and Sustain-
ability, Renewable Energies Unit, Ispra, Italy. Available at: http: / / www. eu-
greenlight. org / pdf / GL_Reports / GL_Report_2005.pdf.
Bertoldi P�, and S� Rezessy (2008)� Tradable white certificate schemes: fundamen-
tal concepts. Energy Efficiency 1, 237 – 255. doi: 10.1007 / s12053-008-9021-y,
ISSN: 1570 – 646X.
Bertoldi P�, and S� Rezessy (2009)� Energy Saving Obligations and Tradable White
Certificates, Ispra, Italy. Joint Research Centre of the European Commission.
Bertoldi P�, S� Rezessy, E� Lees, P� Baudry, A� Jeandel, and N� Labanca (2010a)�
Energy supplier obligations and white certificate schemes: Comparative analy-
sis of experiences in the European Union. Energy Policy 38, 1455 – 1469. doi:
10.1016 / j.enpol.2009.11.027, ISSN: 0301 – 4215.
Bertoldi P�, S� Rezessy, and V� Oikonomou (2013a)� Rewarding energy sav-
ings rather than energy efficiency: Exploring the concept of a feed-in tariff for
energy savings. Energy Policy 56, 526 – 535. doi: 10.1016 / j.enpol.2013.01.019,
ISSN: 0301 – 4215.
Bertoldi P�, S� Rezessy, V� Oikonomou, and B� Boza-Kiss (2010b)� Rewarding
Energy Savings Rather than Energy Efficiency. In: The Climate for Efficiency is
Now. Pacific Grove, CA. 13 pp.
Bertoldi P�, S� Rezessy, S� Steuwer, V� Oikonomou, and N� Labanca (2013b)�
Where to place the saving obligation: energy end-users or suppliers? Energy
Policy 63, 328 – 337.
BETMG (2012)� The Tokyo Cap-and-Trade Program Results of the First Fiscal Year of
Operation (Provisional Results). Bureau of Environment of Tokyo Metropolitan
Government.
Bezdek R� (2009)� Green Collar Jobs in the U. S. and Colorado. American Solar
Energy Society, Boulder, Colorado, 67 pp. Available at: http: / / www. misi-net.
com / publications / ASES-JobsRpt09.pdf.
Bichard E�, and N� Thurairajah (2013)� Behaviour change strategies for energy
efficiency in owner-occupied housing. Construction Innovation: Information,
Process, Management 13, 165 – 185. doi: 10.1108 / 14714171311322147, ISSN:
1471 – 4175.
Bidstrup N� (2011)� Circulators — From voluntary A-G labelling to legislation in EU.
Grundfos Managements A / S, Copenhagen. 18 pp. Available at: http: / / www.
eedal. dk / Conference / Programme%20and%20Presentations.aspx.
Boardman B� (1991)� Fuel Poverty: From Cold Homes to Affordable Warmth. Bel-
haven Press, London, UK, 267 pp. ISBN: 1852931396.
Boehland J� (2008)� Building on Aldo Leopold’s Legacy: The Aldo Leopold Foun-
dation aims to uphold the land ethic in its new headquarters. Green Source.
Available at: http: / / greensource.construction.com / projects / 0804_AldoLeopold-
LegacyCenter.asp.
Bolla R�, F� Davoli, R� Bruschi, K� Christensen, F� Cucchietti, and S� Singh
(2011)� The potential impact of green technologies in next-generation wireline
networks: Is there room for energy saving optimization? IEEE Communications
Magazine 49, 80 – 86. doi: 10.1109 / MCOM.2011.5978419, ISSN: 0163 – 6804.
Bonnefoy X�, and D� Sadeckas (2006)� A study on the prevalence, perception,
and public policy of “fuel poverty” in European countries. Somerville College,
University of Oxford, UK.
Borg S� P�, and N� J� Kelly (2011)� The effect of appliance energy efficiency improve-
ments on domestic electric loads in European households. Energy and Buildings
43, 2240 – 2250.
Boza-Kiss B�, S� Moles-Grueso, and D� Ürge-Vorsatz (2013)� Evaluating policy
instruments to foster energy efficiency for the sustainable transformation of
buildings. Current Opinion in Environmental Sustainability 5, 163 – 176. doi:
10.1016 / j.cosust.2013.04.002, ISSN: 1877 – 3435.
BPIE (2010)� Cost Optimality, Discussing Methodology and Challenges within the
Recast Energy Performance of Buildings Directive. BPIE, Brussels, Belgium, 39
pp. Available at: http: / / www. buildup. eu / publications / 12072.
Bretzke A� (2005)� Planning and Construction of the Passive House Primary School
in Kalbacher Höhe 15, Frankfurt Am Main. Hochbauamt der Stadt Frankfurt,
Germany, 6 pp.
Brookes L� (2000)� Energy efficiency fallacies revisited. Energy Policy 28, 355 – 366.
doi: 10.1016 / S0301-4215(00)00030-6, ISSN: 0301 – 4215.
Brounen D�, and N� Kok (2011)� On the economics of energy labels in the hous-
ing market. Journal of Environmental Economics and Management 62,
166 – 179. Available at: http: / / www. sciencedirect. com / science / article / pii /
S0095069611000337.
Brown R�, S� Borgeson, J� Koomey, and P� Biermayer (2008a)� U. S. Building-
Sector Energy Efficiency Potential. Environmental Energy Technologies
Division,Ernest Orlando Lawrence Berkeley National Laboratory University of
California, Berkeley, California, 33 pp.
Brown M�, J� Chandler, M� Lapsa, and B� Sovacool (2008b)� Carbon Lock-In: Bar-
riers To Deploying Climate Change Mitigation Technologies. Oak Ridge National
Laboratory US. Available at: http: / / www. ornl. gov / sci / eere / PDFs / ORNLTM-
2007 – 124_rev200801.pdf.
Brown H� S�, and P� J� Vergragt (2008)� Bounded socio-technical experiments
as agents of systemic change: The case of a zero-energy residential building.
Technological Forecasting and Social Change 75, 107 – 130. doi: 10.1016 / j.tech-
fore.2006.05.014, ISSN: 00401625.
Bruce N�, E� Rehfuess, S� Mehta, G� Hutton, K� Smith, D� T� Jamison, J� G� Bre-
man, A� R� Measham, G� Alleyne, and M� Claeson (2006)� Indoor air pollu-
tion. In: Disease control priorities in developing countries. World Bank, Wash-
ington, DC, pp. 793 – 815. ISBN: 0 – 8213 – 0821361791.
Buzar S� (2007)� Energy Poverty in Eastern Europe: Hidden Geographies of Depriva-
tion. Ashgate, Surrey, UK, 190 pp. ISBN: 0754671305.
Cabeza L� F�, C� Barreneche, L� Miró, M� Martínez, A� I� Fernández, Parikh, and
D� Ürge-Vorsatz (2013a)� Low carbon materials and low embodied energy
materials in buildings: a review. Renewable and Sustainable Energy Reviews
23, 536 – 542.

725725
Buildings
9
Chapter 9
Cabeza L� F�, A� Castell, C� Barreneche, A� de Gracia, and A� I� Fernández (2011)�
Materials Used as PCM in Thermal Energy Storage in Buildings: A Review.
Renewable and Sustainable Energy Reviews 15, 1675 – 1695. doi: 10.1016 / j.
rser.2010.11.018, ISSN: 13640321.
Cabeza L� F�, D� Ürge-Vorsatz, M� McNeil, C� Barreneche, and S� Serrano
(2013b)� Investigating greenhouse challenge from growing trends of electricity
consumption through home appliances in buildings. Renewable and Sustain-
able Energy Reviews 36, 188 – 193. doi: 10.1016 / j.rser.2014.04.053.
Cai W� G�, Y� Wu, Y� Zhong, and H� Ren (2009)� China building energy consump-
tion: Situation, challenges and corresponding measures. Energy Policy 37,
2054 – 2059. doi: 10.1016 / j.enpol.2008.11.037, ISSN: 0301 – 4215.
Cam W� C�-N� (2012)� Technologies for Climate Change Mitigation: Building Sector.
UNEP Risoe Centre on Energy, Climate and Sustainable Development, Roskilde,
Denmark, 197 pp. ISBN: 978-87-92706-57-7.
Campra P�, M� Garcia, Y� Canton, and A� Palacios-Orueta (2008)� Surface tem-
perature cooling trends and negative radiative forcing due to land use change
toward greenhouse farming in southeastern Spain. Journal of Geophysical
Research 113. doi: 10.1029 / 2008JD009912, ISSN: 0148 – 0227.
Cândido C�, R� de Dear, and R� Lamberts (2011)� Combined thermal acceptability
and air movement assessments in a hot humid climate. Building and Environ-
ment 46, 379 – 385. doi: 10.1016 / j.buildenv.2010.07.032, ISSN: 0360 – 1323.
Carley S�, S� Lawrence, A� Brown, A� Nourafshan, and E� Benami (2011)�
Energy-based economic development. Renewable and Sustainable Energy
Reviews 15, 282 – 295.
Catania T� (2012)� Appliances and the smart grid. ASHRAE Journal 52, 72 – 76. ISSN:
00012491.
CB (2012)� Changing Behaviour EU-project. Available at: http: / / www. energychange.
info / .
Chan A� T�, and V� C� H� Yeung (2005)� Implementing building energy codes in Hong
Kong: energy savings, environmental impacts and cost. Energy and Buildings
37, 631 – 642. doi: 10.1016 / j.enbuild.2004.09.018, ISSN: 0378 – 7788.
Chen C�, B� Chen, B� Wang, C� Huang, J� Zhao, Y� Dai, and H� Kan (2007)� Low-
carbon energy policy and ambient air pollution in Shanghai, China: a health-
based economic assessment. The Science of the Total Environment 373, 13 – 21.
Available at: http: / / ukpmc.ac.uk / abstract / MED / 17207519.
Chow D� H�, and G� J� Levermore (2010)� The effects of future climate change on
heating and cooling demands in office buildings in the UK. Building Services
Engineering Research and Technology 31, 307 – 323.
Chua K� J�, S� K� Chou, and W� M� Yang (2010)� Advances in heat pump systems: A
review. Applied Energy 87, 3611 – 3624. doi: 10.1016 / j.apenergy.2010.06.014,
ISSN: 03062619.
Citherlet S�, and T� Defaux (2007)� Energy and environmental comparison of three
variants of a family house during its whole life span. Building and Environment
42, 591 – 598. doi: 10.1016 / j.buildenv.2005.09.025, ISSN: 03601323.
Clinch J� P�, and J� D� Healy (2001)� Cost-benefit analysis of domestic energy effi-
ciency. Energy Policy 29, 113 – 124. ISSN: 0301 – 4215.
Coaffee J� (2008)� Risk, resilience, and environmentally sustainable cities. Energy
Policy 36, 4633 – 4638. Available at: http: / / www. sciencedirect. com / science /
article / pii / S0301421508004977.
Cockroft J�, and N� Kelly (2006)� A comparative assessment of future heat and
power sources for the UK domestic sector. Energy Conversion and Management
47, 2349 – 2360. doi: 10.1016 / j.enconman.2005.11.021, ISSN: 0196 – 8904.
Collins P� D� (2007)� Time is money. Environment Business, 15. Available at:
http: / / www. scopus. com / inward / record.url?eid=2-s2.0 – 34248386964&partner
ID=40&md5=628015e0d1ac2279004d45215de562ea.
Cornelissen, S�, M� Koper, Y�Y� Deng (2012)� The role of bioenergy in a fully sus-
tainable global energy system. Biomass and Bioenergy 41, pp. 21 – 33. doi:
10.1016 / j.biombioe.2011.12.049.
CPI (2011)� Information Tools for Energy Demand Reduction in Existing Residential
Buildings CPI Report. Climate Policy Initiative, San Francisco, CA, 32 pp.
Crawford-Brown D�, T� Barker, A� Anger, and O� Dessens (2012)� Ozone and PM
related health co-benefits of climate change policies in Mexico. Environmental
Science & Policy 17, 33 – 40. Available at: http: / / www. sciencedirect. com / science /
article / pii / S1462901111001961.
Crossley D� (2008)� Tradeable energy efficiency certificates in Australia. Energy Effi-
ciency 1, 267 – 281. doi: 10.1007 / s12053-008-9018-6, ISSN: 1570 – 646X.
CSTC (2012)� Centre Scientifique et Technique de la Construction. Available at:
http: / / www. cstc. be / homepage / index.cfm?cat=information.
Da-li Gan (2009)� Energy service companies to improve energy efficiency in
China: barriers and removal measures. Procedia Earth and Planetary Science 1,
1695 – 1704. doi: 10.1016 / j.proeps.2009.09.260, ISSN: 1878 – 5220.
Davis Langdon (2007)� The Cost & Benefit of Achieving Green Buildings. Davis
Langdon & SEAH International, 8 pp. Available at: http: / / www. davislangdon.
com / upload / StaticFiles / AUSNZ%20Publications / Info%20Data / InfoData_
Green_Buildings.pdf.
Davis Langdon, and Element Energy (2011)� Cost of Building to the Code for
Sustainable Homes. Department for Communities and Local Government, Lon-
don, UK, 90 pp. Available at: https: / / www. gov. uk / government / uploads / system /
uploads / attachment_data / file / 6378 / 1972728.pdf.
Day A� R�, P� G� Jones, and G� G� Maidment (2009)� Forecasting future cooling
demand in London. Energy and Buildings 41, 942 – 948.
DECC (2011)� UK Report on Articles 4 and 14 of the EU End-Use Efficiency and
Energy Services Directive (ESD). Update on Progress against the 2007 UK
National Energy Efficiency Action Plan. Department of Energy and Climate
Change, London, UK, 43 pp.
DEE (2011)� Heat Pumps in the UK: How Hot Can They Get? Delta Energy and Envi-
ronment, Edinburgh, UK, 7 pp.
Deng, Y�Y�, K� Blok, K� van der Leun (2012a)� Transition to a fully sustainable,
global energy system. Energy Strategy Reviews 1 (2), pp. 109 – 121. doi:
10.1016 / j.esr.2012.07.003.
Deng Y�, Z� Li, and J� M� Quigley (2012b)� Economic returns to energy-efficient
investments in the housing market: Evidence from Singapore. Regional Science
and Urban Economics 42, 506 – 515. Available at: http: / / www. sciencedirect.
com / science / article / pii / S016604621100055X.
Desogus G�, L� Di Pilla, S� Mura, G� L� Pisano, and R� Ricciu (2013)� Economic effi-
ciency of social housing thermal upgrade in Mediterranean climate. Energy and
Buildings 57, 354 – 360. doi: 10.1016 / j.enbuild.2012.11.016, ISSN: 0378 – 7788.
Dhakal S�, and A� K� Raut (2010)� Potential and bottlenecks of the carbon market:
The case of a developing country, Nepal. Energy Policy 38, 3781 – 3789. doi:
10.1016 / j.enpol.2010.02.057, ISSN: 0301 – 4215.
Dietz T�, G� T� Gardner, J� Gilligan, P� C� Stern, and M� P� Vandenbergh (2009)�
Household actions can provide a behavioral wedge to rapidly reduce US
carbon emissions. Proceedings of the National Academy of Sciences 106,
18452 – 18456. doi: 10.1073 / pnas.0908738106.

726726
Buildings
9
Chapter 9
Dili A� S�, M� A� Naseer, and T� Z� Varghese (2010)� Passive control methods of Ker-
ala traditional architecture for a comfortable indoor environment: Comparative
investigation during various periods of rainy season. Building and Environment
45, 2218 – 2230. doi: 10.1016 / j.buildenv.2010.04.002, ISSN: 0360 – 1323.
Dixon R� K�, E� McGowan, G� Onysko, and R� M� Scheer (2010)� US energy con-
servation and efficiency policies: Challenges and opportunities. Energy Policy
38, 6398 – 6408.
Dongyan L� (2009)� Fiscal and tax policy support for energy efficiency retrofit
for existing residential buildings in China’s northern heating region. Energy
Policy 37, 2113 – 2118. Available at: http: / / ideas.repec.org / a / eee / enepol /
v37y2009i6p2113 – 2118.html.
Dowling P�, P� Russ (2012)� The benefit from reduced energy import bills and the
importance of energy prices in GHG reduction scenarios. Energy Economics 34,
pp. 429 – 435. doi: 10.1016 / j.eneco.2011.12.010.
Druckman A�, M� Chitnis, S� Sorrell, and T� Jackson (2011)� Missing carbon
reductions? Exploring rebound and backfire effects in UK households. Energy
Policy 39, 3572 – 3581. doi: 10.1016 / j.enpol.2011.03.058, ISSN: 0301 – 4215.
Dubois M�-C�, and � Blomsterberg (2011)� Energy saving potential and strat-
egies for electric lighting in future North European, low energy office build-
ings: A literature review. Energy and Buildings 43, 2572 – 2582. doi: 10.1016 / j.
enbuild.2011.07.001, ISSN: 03787788.
Duflo E�, M� Greenstone, and R� Hanna (2008)� Indoor air pollution, health and
economic well-being. Surveys and Perspectives Integrating Environment and
Society 1, 7 – 16. Available at: http: / / sapiens.revues.org / 130.
Duplessis B�, J� Adnot, M� Dupont, and F� Racapé (2012)� An empirical typology
of energy services based on a well-developed market: France. Energy Policy 45,
268 – 276. doi: 10.1016 / j.enpol.2012.02.031, ISSN: 0301 – 4215.
EC (2003)� Directive 2002 / 91 / EC of the European Parliament and of the Council of
16 December 2002 on the energy performance of buildings. Official Journal of
the European Communities 46, 65 – 71.
EEA (2013)� Production, imports, exports and consumption of Fluorinated gases
(F-gases) for years 2007 – 2011 in the EU-27 (Mt CO
2
eq, GWP TAR). European
Environment Agency. Available at: http: / / www. eea. europa. eu / data-and-
maps / figures / production-imports-exports-and-consumption.
Ege C�, T� Bang Hansen, and J� Juul (2009)� Green Jobs: Examples of Energy and
Climate Initiatives That Generate Employment. United Federation of Danish
Workers 3F in collaboration with The Ecological Council, Copenhagen, Den-
mark, 48 pp.
Eichhammer W�, T� Fleiter, B� Schlomann, S� Faberi, M� Fioretto, N� Piccioni,
S� Lechtenböhmer, A� Schüring, and G� Resch (2009)� Study on the Energy
Savings Potentials in EU Member States, Candidate Countries and EEA Coun-
tries. The European Commission Directorate-General Energy and Transport,
Brussels, Belgium, 313 pp.
Ellis M�, I� Barnsley, and S� Holt (2009)� Barriers to maximising compliance with
energy efficiency policy — ECEEE. European Council for an Energy Efficient
Economy, La Colle sur Loup, France. 341 – 351 pp. Available at: http: / / www.
eceee. org / conference_proceedings / eceee / 2009 / Panel_2 / 2.072.
En�lighten (2010)� Country Lighting Assessments — European Union. En.lighten,
UNEP. Available at: http: / / www. olela. net / infomap / files / clas / CLA_EUU.pdf.
Energy Institute Vorarlberg (2013)� Passive House retrofit kit. Available at:
http: / / www. energieinstitut. at / retrofit / .
EPA (2010)� Transition to low-GWP alternatives in unitary air conditioning, Fact
Sheet. United States Environmental Protection Agency.
EPC (2008)� Economic Instruments to Reach Energy and Climate Change Targets.
Economic Policy Committee, Brussels, Belgium, 29 pp.
ETK (2011)� Építőipari Költségbecslési Segédlet [Handbook of Construction Costs
Estimates 2011]. Budapest: ETK.
ETUC (2008)� Climate Change and Employment: Impact on Employment in the
European Union-25 of Climate Change and CO
2
Emission Reduction Measures
by 2030. European Trade Union Confederation, Brussels, Belgium, 206 pp. Avail-
able at: http: / / www. unizar. es / gobierno / consejo_social / documents / 070201
ClimateChang-Employment.pdf.
European Union (2012)� Directive 2012 / 27 / EU of the European Parliament and
of the Council of 25 October 2012 on energy efficiency, amending Direc-
tives 2009 / 125 / EC and 2010 / 30 / EU and repealing Directives 2004 / 8 / EC and
2006 / 32 / EC. Official Journal of European Union. L315, 1 – 56.
Eyre N� (2010)� Policing carbon: design and enforcement options for personal car-
bon trading. Climate Policy 10, 432 – 446. doi: 10.3763 / cpol.2009.0010, ISSN:
1469 – 3062.
Eyre N� (2011)� Efficiency, Demand Reduction or Electrification? In: Proceedings:
Energy Efficiency First: The Foundation of a Low Carbon Society. European
Council for an Energy Efficient Economy Summer Study. ECEEE, Presqu’ile de
Giens, France. pp. 1391 – 1400.
Eyre N�, J� Anable, C� Brand, R� Layberry, and N� Strachan (2010)� The way we
live from now on: lifestyle and energy consumption. In: Energy 2050: the transi-
tion to a secure low carbon energy system for the UK. P. Ekins, J. Skea, M. Win-
skel, (eds.), Earthscan, London, pp. 258 – 293. ISBN: 1849710848.
Eyre N�, M� Pavan, and L� Bodineau (2009)� Energy Company Obligations to Save
Energy in Italy, the UK and France: What have we learnt? European Council for
an Energy Efficient Economy, La Colle sur Loup, France, pp. 429 – 439.
Fawcett T� (2010)� Personal carbon trading: A policy ahead of its time? Energy
Efficiency Policies and Strategies with Regular Papers. 38, 6868 – 6876. doi:
10.1016 / j.enpol.2010.07.001, ISSN: 0301 – 4215.
Fawcett T� (2011)� The future role of heat pumps in the domestic sector. In: Energy
Efficiency First: The Foundation of a Low Carbon Society. European Council for
an Energy Efficient Economy Summer Study. ECEEE, Presqu’ile de Giens, France.
1547 – 1558 pp.
Fechter J� V�, and L� G� Porter (1979)� Kitchen Range Energy Consumption. Office
of Energy Conservation, U. S. Department of Energy, Washington, DC, 60 pp.
Feist W� (2012)� Master plan for the European Energy revolution put forth. 16th
International Passive House Conference 2012, 6. Hanover, Germany.
Feist W�, and J� Schnieders (2009)� Energy efficiency — a key to sustain-
able housing. European Physical Journal-Special Topics 176, 141 – 153. doi:
10.1140 / epjst / e2009-01154-y, ISSN: 1951 – 6355.
Fettweis G�, and E� Zimmermann (2008)� ICT energy trends — Trends and chal-
lenges. In: The 11th International Symposium on Wireless Personal Multimedia
Communications (WPMC 2008). Finland. 4 pp.
FI (2005)� Innovation and Public Procurement. Review of Issues at Stake. Fraunhofer
Institute.
Fisk W� J� (2002)� How IEQ affects health, productivity. ASHRAE Journal-American
Society of Heating Refrigerating and Airconditioning Engineers 44, 56 – 60.
Available at: http: / / doas.psu.edu / fisk.pdf.
Foruzanmehr A�, and M� Vellinga (2011)� Vernacular architecture: questions of
comfort and practicability. Building Research and Information 39, 274 – 285.
doi: 10.1080 / 09613218.2011.562368, ISSN: 0961 – 3218.

727727
Buildings
9
Chapter 9
Fouquet R�, and P� J� G� Pearson (2006)� Seven centuries of energy services: The
price and use of light in the United Kingdom (1300 – 2000). Energy Journal 27,
139 – 177. ISSN: 0195 – 6574.
Freire González J� (2010)� Empirical evidence of direct rebound effect in Cata-
lonia. Energy Policy 38, 2309 – 2314. doi: 10.1016 / j.enpol.2009.12.018, ISSN:
0301 – 4215.
Fujino J�, G� Hibino, T� Ehara, Y� Matsuoka, T� Masui, and M� Kainuma (2008)�
Back-casting analysis for 70 % emission reduction in Japan by 2050. Climate
Policy 8, S108 – S124. Available at: http: / / www. ingentaconnect. com / content /
earthscan / cpol / 2008 / 00000008 / a00101s1 / art00009.
Galvin R� (2010)� Thermal upgrades of existing homes in Germany: The building
code, subsidies, and economic efficiency. Energy and Buildings 42, 834 – 844.
doi: 10.1016 / j.enbuild.2009.12.004, ISSN: 0378 – 7788.
Galvin R� (2012)� German Federal policy on thermal renovation of existing homes:
A policy evaluation. Sustainable Cities and Society 4, 58 – 66. doi: 10.1016 / j.
scs.2012.05.003, ISSN: 2210 – 6707.
Gardiner, and Theobald (2011)� International Construction Cost Sur-
vey. Gardiner & Theobald LLP, London, UK, 20 pp. Available at:
http: / / www. gardiner. com / assets / files / files / 973bd8f7bd7c6f4038153d-
c47a3705fc26138616 / ICCS%202011 %20 %C2 %A3 %20Version.pdf.
Garrett-Peltier H� (2011)� Employment Estimates for Energy Efficiency Retrofits
of Commercial Buildings. Political Economy Research Institute, Amherst, MA,
USA, 7 pp. Available at: http: / / www. peri. umass. edu / fileadmin / pdf / research_
brief / PERI_USGBC_Research_Brief.pdf.
Garrido-Soriano N�, M� Rosas-Casals, A� Ivancic, and M� D� Álvarez-del Castillo
(2012)� Potential energy savings and economic impact of residential build-
ings under national and regional efficiency scenarios. A Catalan case study.
Energy and Buildings 49, 119 – 125. doi: 10.1016 / j.enbuild.2012.01.030, ISSN:
0378 – 7788.
GEA (2011)� GEA Database. International Institute for Applied Systems Analysis,
Laxenburg, Austria. Available at: http: / / www. iiasa. ac. at / .
GEA (2012)� Global Energy Assessment. Cambridge University Press, Laxenburg,
Austria, 1802 pp.
Gerdes A�, C� Kottmeier, and A� Wagner (2011)� Climate and Construction. In:
International Conference 24 and 25 October 2011, Karlsruhe, Germany / Compe-
tence Area “Earth and Environment” KIT Scientific Reports; 7618. KIT Scientific
Publishing. 367 pp.
Gill S� E�, J� F� Handley, and S� Pauleit (2007)� Adapting cities for climate change:
The role of the green infrastructure. Built Environment 33, 115 – 133.
Giraudet L� G�, C� Guivarch, and P� Quirion (2011)� Comparing and Combining
Energy Saving Policies: Will Proposed Residential Sector Policies Meet French
Official Targets? The Energy Journal 32. doi: 10.5547 / ISSN0195-6574-EJ-Vol32-
SI1-12, ISSN: 01956574.
Giraudet L�-G�, C� Guivarch, and P� Quirion (2012)� Exploring the potential for
energy conservation in French households through hybrid modeling. Energy
Economics 34, 426 – 445. doi: 10.1016 / j.eneco.2011.07.010, ISSN: 0140 – 9883.
GMCA (2009)� Lessons Learned From Energy Efficiency Finance Programs in the
Building Sector. Prepared for European Climate Foundation, GreenMax Capital
Advisors, New York, USA, 54 pp.
Gold R�, S� Nadel, J� Laitner, and A� deLaski (2011)� Appliance and Equipment
Efficiency Standards: A Money Maker and Job Creator. American Council for
an Energy-Efficient Economy, Appliance Standards Awareness Project, Wash-
ington, DC, Boston, MA, 28 pp. Available at: http: / / www. appliance-standards.
org / sites / default / files / Appliance-and-Equipment-Efficiency-Standards-Money-
Maker-Job-Creator.pdf.
Government of Latvia (2011)� Second National Energy Efficiency Action Plan
of Latvia 2011 — 2013. Government of Latvia. Available at: http: / / ec.europa.
eu / energy / efficiency / end-use_en.htm.
Government of Slovakia (2011)� Energy Efficiency Action Plan 2011 – 2013. Gov-
ernment of Slovakia.
Government of Finland (2011)� Finland’s Second National Energy Efficiency
Action Plan (NEEAP-2) 27 June 2011. Government of Finland. Available at:
http: / / ec.europa.eu / energy / efficiency / end-use_en.htm.
Government of Ireland (2011)� National Action Plan on Green Public Procure-
ment. Government of Ireland.
GPI (2010)� Energy [R]evolution. A Sustainable World Energy Outlook 2010 World
Energy Scenario. European Renewable Energy Council (EREC), Brussels, Bel-
gium, 259 pp.
Da Graca G� C�, A� Augusto, and M� M� Lerer (2012)� Solar powered net zero
energy houses for southern Europe: Feasibility study. Solar Energy 86, 634 – 646.
doi: 10.1016 / j.solener.2011.11.008, ISSN: 0038 – 092X.
Greden L� V� A� (2006)� Reducing the risk of natural ventilation with flexible design.
In: International Solar Energy Conference 2006. Available at: http: / / www.
scopus. com / inward / record.url?eid=2-s2.0 – 36048952082&partnerID=40&md5
=3a4215b25926aa2ed94ea73b738bb860.
Green G�, and J� Gilbertson (2008)� Warm Front Better Health: Health Impact
Evaluation of the Warm Front Scheme. Centre for Regional Economic and Social
Research, Sheffield, UK, 25 pp. Available at: http: / / www. google. de / url?sa=t&rc
t=j&q=&esrc=s&source=web&cd=1&ved=0CC0QFjAA&url=http%3A%2F%2F
www. apho. org. uk%2Fresource%2Fview. aspx%3FRID%3D53281&ei=Zy_ 6Uv3
hOsPpswaKwoGYAg&usg=AFQjCNHdMI2DjMei6aCG9VGTJ3HSdignAA&sig2=
5hWAJNrpnUNcWsOe2K4jAQ&bvm=bv. 61190604,d. Yms.
Greening L� A�, D� L� Greene, and C� Difiglio (2000)� Energy efficiency and con-
sumption — the rebound effect — a survey. Energy Policy 28, 389 – 401. doi:
10.1016 / S0301-4215(00)00021-5, ISSN: 0301 – 4215.
Grigoletti G�, M� A� Sattler, and A� Morello (2008)� Analysis of the thermal behav-
iour of a low cost, single-family, more sustainable house in Porto Alegre, Bra-
zil. Energy and Buildings 40, 1961 – 1971. doi: 10.1016 / j.enbuild.2008.05.004,
ISSN: 0378 – 7788.
Grinshpon M� (2011)� A Comparison of Residential Energy Consumption Between
the United States and China. Tsinghua University, Beijing, 94 pp.
Gülen G� (2011)� Defining, Measuring and Predicting Green Jobs. Copenhagen
Consensus Center, Lowell, USA, 33 pp. Available at: http: / / www. lsarc. ca /
Predicting%20Green%20Jobs.pdf.
Hailu Y� G� (2012)� Measuring and monitoring energy access: Decision-support
tools for policymakers in Africa. Energy Policy 47, 56 – 63. doi: http: / / dx.doi.
org / 10.1016 / j.enpol.2012.03.065.
Harlan S� L�, and D� M� Ruddell (2011)� Climate change and health in cities:
impacts of heat and air pollution and potential co-benefits from mitigation and
adaptation. Current Opinion in Environmental Sustainability 3, 126 – 134.

728728
Buildings
9
Chapter 9
Harmelink M�, L� Nilsson, and R� Harmsen (2008)� Theory-based policy evalu-
ation of 20 energy efficiency instruments. Energy Efficiency 1, 131 – 148. doi:
10.1007 / s12053-008-9007-9, ISSN: 1570 – 646X.
Harris J�, R� Diamond, M� Iyer, C� Payne, C� Blumstein, and H�-P� Siderius
(2007)� Towards a Sustainable Energy Balance: Progressive Efficiency and the
Return of Energy Conservation. Energy Efficiency 1, 175 – 188. Available at:
http: / / escholarship.org / uc / item / 09v4k44b.
Harvey L� D� D� (2007)� Net climatic impact of solid foam insulation produced with
halocarbon and non-halocarbon blowing agents. Building and Environment 42,
2860 – 2879. doi: 10.1016 / j.buildenv.2006.10.028, ISSN: 0360 – 1323.
Harvey L� D� D� (2008)� Energy Savings by Treating Buildings as Systems. In: Phys-
ics of Sustainable Energy: Using Energy Efficiently and Producing it Renewably.
American Institute of Physics, Berkeley, California. 67 – 87 pp.
Harvey L� D� D� (2009)� Reducing energy use in the buildings sector: measures,
costs, and examples. Energy Efficiency 2, 139 – 163.
Harvey L� D� D� (2010)� Energy and the New Reality 1: Energy Efficiency and the
Demand for Energy Services. Earthscan, London, and Washington, DC, 672 pp.
ISBN: 1849710724.
Harvey L� D� D� (2013)� Recent Advances in Sustainable Buildings: Review of the
Energy and Cost Performance of the State-of-The-Art Best Practices from
Around the World. Social Science Research Network, Rochester, NY, 281 – 309
pp. Available at: http: / / papers.ssrn.com / abstract=2343677.
Harvey L� D� D�, and M� Siddal (2008)� Advanced glazing systems and the econom-
ics of comfort. Green Building Magazine, 30 – 35.
Hasan A�, M� Vuolle, and K� Sirén (2008)� Minimisation of life cycle cost of a
detached house using combined simulation and optimisation. Building and
Environment 43, 2022 – 2034. doi: 10.1016 / j.buildenv.2007.12.003, ISSN:
03601323.
Hayes S�, S� Nadel, C� Granda, and K� Hottel (2011)� What Have We Learned
from Energy Efficiency Financing Programs? American Council for an Energy-
Efficient Economy, Washington DC, USA.
Headen R� C�, S� W� Bloomfield, M� Warnock, and C� Bell (2010)� Property
Assessed Clean Energy Financing: The Ohio Story. The Electricity Journal 24,
47 – 56. doi: 10.1016 / j.tej.2010.11.004.
Healy J� D� (2004)� Housing, Fuel Poverty, and Health: A Pan-European Analysis.
Ashgate, Surrey, UK, 266 pp.
Healy J� D�, and J� P� Clinch (2002)� Fuel poverty, thermal comfort and occupancy:
results of a national household-survey in Ireland. Applied Energy 73, 329 – 343.
ISSN: 0306 – 2619.
Hegner H�-D� (2010)� Sustainable construction in Germany — Assessment system
of the Federal Government for office and administration buildings [Nach-
haltiges Bauen in Deutschland — Bewertungssystem des Bundes für Büro- und
Verwaltungsbauten]. Stahlbau 79, 407 – 417. doi: 10.1002 / stab.201001335,
ISSN: 00389145.
Hendricks B�, B� Goldstein, R� Detchon, and K� Shickman (2009)� Rebuild-
ing America: A National Policy Framework for Investment in Energy
Efficiency Retrofits. Center for American Progress, Energy Future
Coalition, Washington, DC, 56 pp. Available at: http: / / www. americanprogress.
org / issues / 2009 / 08 / pdf / rebuilding_america.pdf.
Hens H�, W� Parijs, and M� Deurinck (2009)� Energy consumption for heating and
rebound effects. Energy and Buildings 42, 105 – 110. ISSN: 0378 – 7788.
Hermelink A� (2006)� Reality Check: The Example SOLANOVA, Hungary. In: Sustain-
able energy systems for the buildings: Challenges and changes. Vienna, Austria.
15 pp.
Hermelink A� (2009)� How Deep to Go: Remarks on How to Find the Cost-Optimal
Level for Building Renovation. Ecofys, Köln, Germany, 18 pp.
Herring H� (2006)� Energy efficiency — a critical view. Energy 31, 10 – 20. doi:
10.1016 / j.energy.2004.04.055, ISSN: 0360 – 5442.
Hills J� (2011)� Fuel Poverty: The Problem and Its Measurement. Centre for Analysis
of Social Exclusion: The London School of Economics and Political Science, Lon-
don, UK, 192 pp. Available at: http: / / eprints.lse.ac.uk / 39270 / 1 / CASEreport69
(lsero).pdf.
Holmgren K� (2006)� Role of a district-heating network as a user of waste-heat
supply from various sources — the case of Göteborg. Applied Energy 83,
1351 – 1367. doi: 10.1016 / j.apenergy.2006.02.001, ISSN: 0306 – 2619.
Houghton A� (2011)� Health impact assessments a tool for designing climate
change resilience into green building and planning projects. Journal of Green
Building 6, 66 – 87. doi: 10.3992 / jgb.6.2.66, ISSN: 15526100.
Howard A� J�, Z� Baron, and K� Kaplan (2012)� Transformation of an industry: A
history of energy efficiency in televisions. In: ACEEE Summer Study on Energy
Efficiency in Buildings. American Council for an Energy Efficient Economy. pp.
190 – 203.
Howden-Chapman P�, and R� Chapman (2012)� Health co-benefits from
housing-related policies. Current Opinion in Environmental Sustainability 4,
414 – 419. Available at: http: / / www. sciencedirect. com / science / article / pii /
S1877343512001066.
Howden-Chapman P�, H� Viggers, R� Chapman, D� O’Dea, S� Free, and K�
O’Sullivan (2009)� Warm homes: Drivers of the demand for heating in the resi-
dential sector in New Zealand. Energy Policy 37, 3387 – 3399. doi: 10.1016 / j.
enpol.2008.12.023, ISSN: 0301 – 4215.
Hunt A�, and P� Watkiss (2011)� Climate change impacts and adaptation in cities: a
review of the literature. Climatic Change, 1 – 37.
Huovila P� (2007)� Buildings and Climate Change: Status, Challenges, and Opportu-
nities. United Nations Environmental Programme, Nairobi, Kenya, 78 pp.
Hutton G�, E� Rehfuess, and F� Tediosi (2007)� Evaluation of the costs and benefits of
interventions to reduce indoor air pollution. Energy for Sustainable Development
11, 34 – 43. Available at: http: / / www. who. int / entity / indoorair / interventions /
iap_cba_esd_article.pdf.
IBEC (2009)� CASBEE property appraisal manual. Institute for Building Environment
and Energy Conservation.
IEA (2002)� Potential for Building Integrated Photovoltaics. Photovoltaic Power Sys-
tem Programme. International Energy Agency, Paris, France, 11 pp.
IEA (2003)� Cool Appliances Policy Strategies for Energy-Efficient Homes.
International Energy Agency, Paris, Paris, France, 233 pp. ISBN:
92 – 64 – 19661 – 7 — 2003.
IEA (2007)� Energy Security and Climate Policy: Assessing Interactions. International
Energy Agency / Organisation for Economic Co-operation and Development,
Paris, France, 145 pp.
IEA (2010a)� Energy Technology Perspectives 2010. International Energy Agency,
Paris, France, 706 pp.
IEA (2010b)� Policy Pathways: Energy Performance Certification of Buildings. Inter-
national Energy Agency, Paris, France, 64 pp. Available at: http: / / www. iea.
org / publications / freepublications / publication / name,3923,en.html.

729729
Buildings
9
Chapter 9
IEA (2012a)� CO
2
Emissions from Fuel Combustion. Beyond 2020 Online Database.
International Energy Agency, Paris, 138 pp. Available at: http: / / data.iea.org.
IEA (2012b)� Policies and Measures Database. International Energy Agency, Paris,
France,
IEA (2012c)� Energy Technology Perspectives 2012: Pathways to a Clean Energy
System. International Energy Agency, Paris, France, 700 pp.
IEA (2012d)� Energy Balances of Non-OECD Countries. 2012 Edition. International
Energy Agency, Paris, France, 554 pp.
IEA (2013)� IEA Online Data Services. Available at: http: / / data.iea.org / ieastore /
statslisting.asp.
IEA HPG (2010)� Retrofit Heat Pumps for Buildings: Final Report. Boras, IEA Heat
Pump Centre, Sweden, 144 pp.
IFE (2005)� Engineering a Sustainable World: Design Process and Engineering Inno-
vations for the Center for Health and Healing at the Oregon Health and Science
University, River Campus.
Ihara T�, Y� Kikegawa, K� Asahi, Y� Genchi, and H� Kondo (2008)� Changes in
year-round air temperature and annual energy consumption in office build-
ing areas by urban heat-island countermeasures and energy-saving measures.
Applied Energy 85, 12 – 25.
ILO (2012)� Working towards Sustainable Development: Opportunities for Decent
Work and Social Inclusion in a Green Economy. International Labour Office,
Geneva, Switzerland, 288 pp. ISBN: 978 – 92 – 2-126378 – 4.
IPCC (2007)� Climate Change 2007: Mitigation of Climate Change. Contribution of
Working Group III to the Fourth Assessment Report of the Intergovernmental
Panel on Climate Change [B. Metz, O. R. Davidson, P. R. Bosch, R. Dave, L. A.
Meyer (eds.)]. Cambridge University Press, Cambridge, United Kingdom and
New York, NY, USA, 851 pp.
Isaac M�, and D� P� Van Vuuren (2009)� Modeling global residential sector energy
demand for heating and air conditioning in the context of climate change.
Energy Policy 37, 507 – 521.
Ito Y�, and K� Otsuka (2011)� Commercialization of Residential PEFC Cogeneration
System. In: Proceedings of International Gas Union Research Conference.
Izquierdo S�, C� Montañés, C� Dopazo, and N� Fueyo (2011)� Roof-top solar
energy potential under performance-based building energy codes: The case of
Spain. Solar Energy 85, 208 – 213. doi: 10.1016 / j.solener.2010.11.003, ISSN:
0038 – 092X.
Jaboyedoff P�, C� A� Roulet, V� Dorer, A� Weber, and A� Pfeiffer (2004)� Energy in
air-handling units — results of the AIRLESS European Project. Energy and Build-
ings 36, 391 – 399. doi: 10.1016 / j.enbuild.2004.01.047.
Jacobson C� A�, S� Narayanan, K� Otto, P� Ehrlich, and K� Åström (2011)� Build-
ing Control Systems. Study Notes on Low Energy Buildings: European Design
and Control. Available at: http: / / www. youtube. com / watch?v=USnLOCDvNBs
Jakob M� (2006)� Marginal costs and co-benefits of energy efficiency investments:
The case of the Swiss residential sector. Energy Policy 34, 172 – 187. Available
at: http: / / www. sciencedirect. com / science / article / pii / S030142150400271X.
Jelle B� P� (2011)� Traditional, state-of-the-art and future thermal building insulation
materials and solutions — Properties, requirements and possibilities. Energy
and Buildings 43, 2549 – 2563. doi: 10.1016 / j.enbuild.2011.05.015, ISSN:
03787788.
Ji Y�, K� J� Lomas, and M� J� Cook (2009)� Hybrid ventilation for low energy build-
ing design in south China. Building and Environment 44, 2245 – 2255. doi:
10.1016 / j.buildenv.2009.02.015, ISSN: 0360 – 1323.
Jiang Y�, and X� Xie (2010)� Theoretical and testing performance of an innovative
indirect evaporative chiller. Solar Energy 84, 2041 – 2055. ISSN: 0038092x.
Jollands N�, P� Waide, M� Ellis, T� Onoda, J� Laustsen, K� Tanaka, P� de T’Serclaes,
I� Barnsley, R� Bradley, and A� Meier (2010)� The 25 IEA energy efficiency
policy recommendations to the G8 Gleneagles Plan of Action. Energy Policy 38,
6409 – 6418. doi: 10.1016 / j.enpol.2009.11.090, ISSN: 0301 – 4215.
JRC / PBL (2013)� Emission Database for Global Atmospheric Research (EDGAR),
Release Version 4.2 FT2010. European Commission, Joint Research Cen-
tre (JRC) / PBL Netherlands Environmental Assessment Agency. Available at:
http: / / edgar.jrc.ec.europa.eu.
Kahn E� (2008)� Avoidable transmission cost is a substantial benefit of solar PV. The
Electricity Journal 21, 41 – 50.
Kainou K� (2007)� Why Do Top Runner Energy Efficiency Standard Regulations
Result in Large Positive or Negative Costs? — Risk of Investment in High Effi-
ciency Products and Risk of Government Regulation Failure. Research Institute
of Economy, Trade and Industry, IAA, Japan.
Kapsalaki M�, and V� Leal (2011)� Recent progress on net zero energy buildings.
Advances in Building Energy Research 5, 129 – 162.
Karlsson J� F�, and B� Moshfegh (2007)� A comprehensive investigation of a low-
energy building in Sweden. Renewable Energy 32, 1830 – 1841. doi: 10.1016 / j.
renene.2006.10.009, ISSN: 0960 – 1481.
Kats G� (2009)� Greening Our Built World: Costs, Benefits, and Strategies. Island
Press, Washington, DC, 280 pp. ISBN: 159726668X.
Kats G�, L� Alevantis, A� Berman, E� Mills, and J� Perlman (2003)� The Costs and
Financial Benefits of Green Buildings. Sustainable Building Task Force, 120 pp.
Available at: http: / / www. usgbc. org / Docs / Archive / MediaArchive / 607_Kats_
AB184.pdf.
Kats G�, J� Perlman, and S� Jamadagni (2005)� National Review of Green Schools:
Costs, Benefits, and Implications for Massachusetts. Good Energies, Washing-
ton, DC, 66 pp. Available at: www. azdeq. gov / ceh / download / natreview.pdf.
Kelly G� (2012)� Sustainability at home: Policy measures for energy-efficient
appliances. Renewable and Sustainable Energy Reviews 16, 6851 – 6860. doi:
10.1016 / j.rser.2012.08.003, ISSN: 1364 – 0321.
Kerr R�, and D� Kosar (2011)� Gas use roadmap to zero energy homes. In: ASHRAE
Transactions. American Society of Heating, Refrigerating and Air-Conditioning
Engineers, Atlanta. 340 – 347 pp.
Kesik T�, and I� Saleff (2009)� Tower Renewal Guidelines for the Comprehensive
Retrofit of Multi-Unit Residential Buildings in Cold Climates. Faculty of Archi-
tecture, Landscape, and Design, University of Toronto, Toronto, Canada, 259 pp.
Knigge M�, and M� Görlach (2005)� Effects of Germany’s Ecological Tax Reforms
on the Environment, Employment and Technological Innovation. Ecologic
Institute for International and European Environmental Policy GmbH, Berlin,
Germany, 15 pp. Available at: http: / / www. ecologic. eu / download / projekte /
1850 – 1899 / 1879 / 1879_summary.pdf.
Koeppel S�, and D� Ürge-Vorsatz (2007)� Assessment of Policy Instruments for
Reducing Greenhouse Gas Emissions from Buildings. United Nations Environ-
ment Programme – Sustainable Buildings and Construction Initiative, Nairobi,
Kenya, 12 pp.
Kolokotsa D�, D� Rovas, E� Kosmatopoulos, and K� Kalaitzakis (2011)� A road-
map towards intelligent net zero- and positive-energy buildings. Solar Energy
85, 3067 – 3084. doi: 10.1016 / j.solener.2010.09.001, ISSN: 0038092X.

730730
Buildings
9
Chapter 9
Koomey J� G�, H� S� Matthews, and E� Williams (2013)� Smart everything: Will
intelligent systems reduce resource use? Annual Review of Environment and
Resources 38, 311 – 343.
Köppl A�, C� Kettner, D� Kletzan-Slamanig, H� Schnitzer, M� Titz, A� Damm, K�
Steininger, B� Wolkinger, H� Artner, and A� Karner (2011)� EnergyTransition
2012\2020\2050 Strategies for the Transition to Low Energy and Low Emission
Structures (Final Report). Österreichisches Institut Für Wirtschaftsforschung,
Vienna, Austria, 38 pp.
Korjenic A�, V� Petránek, J� Zach, and J� Hroudová (2011)� Development and
performance evaluation of natural thermal-insulation materials composed of
renewable resources. Energy and Buildings 43, 2518 – 2523. doi: 10.1016 / j.
enbuild.2011.06.012, ISSN: 03787788.
Korytarova K�, and D� Ürge-Vorsatz (2012)� Energy savings potential in Hungar-
ian public buildings. Scenarios for 2030 and beyond. In: International Energy
Workshop 2012, Cape Town, 19 – 21 June 2012. South Africa. 11 pp.
Kragh J�, and J� Rose (2011)� Energy renovation of single-family houses in Den-
mark utilising long-term financing based on equity. Applied Energy 88,
2245 – 2253. doi: 10.1016 / j.apenergy.2010.12.049, ISSN: 0306 – 2619.
Kuckshinrichs W�, T� Kronenberg, and P� Hansen (2010)� The social return on
investment in the energy efficiency of buildings in Germany. Energy Policy 38,
4317 – 4329.
Kurnitski J�, A� Saari, T� Kalamees, M� Vuolle, J� Niemelä, and T� Tark (2011)�
Cost optimal and nearly zero (nZEB) energy performance calculations for resi-
dential buildings with REHVA definition for nZEB national implementation.
Energy and Buildings 43, 3279 – 3288. doi: 10.1016 / j.enbuild.2011.08.033,
ISSN: 03787788.
Kwok A� G� A� (2010)� Addressing climate change in comfort standards. Build-
ing and Environment 45, 18 – 22. doi: 10.1016 / j.buildenv.2009.02.005, ISSN:
03601323.
Labanca N�, and B� Paolo (2013)� First steps towards a deeper understanding of
energy efficiency impacts in the age of systems. In: Proceedings of eceee 2013
Summer Study: Rethink, Renew, Restart. Belambra Les Criques, Toulon / Hyères,
France. Available at: http: / / publications.jrc.ec.europa.eu / repository / handle /
111111111 / 28670.
Laitner J� A� S�, S� Nadel, R� N� Elliott, H� Sachs, and A� S� Khan (2012)� The Long-
Term Energy Efficiency Potential: What the Evidence Suggests. American Coun-
cil for an Energy-Efficient Economy, Washington, D. C., 96 pp.
Lambrou Y�, and G� Piana (2006)� Energy and Gender Issues in Rural Sustainable
Development. Food and Agriculture Organization of the United Nations, Rome,
Italy, 41 pp.
Lang Consulting (2013)� 1000 passivehouses in Austria — Interactive
documentation network on Passive Houses. Available at: http: / / www.
langconsulting. at / index.php / en / the-passive-house.
Langham E�, C� Dunstan, G� Walgenwitz, P� Denvir, A� Lederwasch, and J� Land-
ler (2010)� Building Our Savings — Reduced Infrastructure Costs from Improv-
ing Building Energy Efficiency. Institute for Sustainable Futures and Energet-
ics, Univers Ity of Technology Sydney, Sydney, Australia, 103 pp. Available at:
http: / / ee.ret.gov.au / energy-efficiency / strategies-and-initiatives / national-
construction-code / building-our-savings-reduced-infrastructure-costs-
improving-building-energy-efficiency.
Laustsen J� (2010)� The Factor Four Model Supporting Policies to Reduce Energy
Use in Buildings by a Factor of Four. International Energy Agency (IEA), Paris,
France.
LDA (2011)� Case Studies: LDA_BEEP. Greater London Authority. Available at:
http: / / www. london. gov. uk / rp / docs / casestudies / LDA_BEEP_v4.pdf.
Lees E� (2006)� Evaluation of the Energy Efficiency Commitment 2002 – 05. Depart-
ment for Environment and Rural Affairs, UK, 81 pp.
Lees E� (2008)� Evaluation of the Energy Efficiency Commitment 2005 – 08. Depart-
ment of Energy and Climate Change, UK, 105 pp.
Lees E� (2011)� Experience of EU Energy Efficiency Obligations — Diverse but Deliv-
ering. Brussels, Belgium.
Lemire N�, and R� Charneux (2005)� Energy-Efficient Laboratory Design. ASHRAE
Journal 47, 58 – 60,62 – 64. ISSN: 00012491.
Lenoir A�, F� Thellier, and F� Garde (2011)� Towards net zero energy buildings in
hot climate, Part 2: Experimental feedback. In: ASHRAE Transactions. Ameri-
can Society of Heating, Refrigerating and Air-Conditioning Engineers, Atlanta.
458 – 465 pp.
Letschert V�, S� R� Can, M� McNeil, P� Kalavase, A� H� Fan, and G� Dreyfus
(2013a)� Energy Efficiency Appliance Standards: Where do we stand, how far
can we go and how do we get there? An analysis across several economies.
European Council for an Energy Efficient Economy, Toulon / Hyères, France.
1759 – 1768 pp.
Letschert V� E�, L�-B� Desroches, J� Ke, and M� A� McNeil (2012)� Estimate of
Technical Potential for Minimum Efficiency Performance Standards in 13 Major
World Economies. Lawrence Berkeley National Laboratory, Berkeley, CA, 31
pp. Available at: http: / / ies.lbl.gov / publications / estimate-technical-potential-
minimum-.
Letschert V�, L�-B� Desroches, J� Ke, and M� McNeil (2013b)� How Far Can We
Raise the Bar? Revealing the Potential of Best Available Technologies-Energy.
Energy Efficiency 59, 72 – 82.
Levine M�, Ürge-Vorsatz, D�, Blok, K�, Geng,L�, Harvey, D�, Lang, S�, Levermore,
G�, Mongameli Mehlwana, A�, Mirasgedis, S�, Novikova, A�, Rilling, J�, and
Yoshino, H� (2007)� Residential and commercial buildings. In: Climate Change
2007: Mitigation of Climate Change. Contribution of Working Group III to the
Fourth Assessment Report of the Intergovernmental Panel on Climate Change
[B. Metz, O. R. Davidson, P. R. Bosch, R. Dave, L. A. Meyer (eds.)]. Cambridge Uni-
versity Press, Cambridge, United Kingdom and New York, NY, USA, pp. 387 – 446.
Levy J�, Y� Nishioka, and J� Spengler (2003)� The public health benefits of insula-
tion retrofits in existing housing in the United States. Environmental Health: A
Global Access Science Source 2. Available at: http: / / www. ehjournal. net / content /
2 / 1 / 4.
Lewis M� (2004)� Energy-Efficient Laboratory Design. American Society of Heating,
Refrigerating and Air-Conditioning Engineers Journal 46, Supplement, 22 – 30.
ISSN: 00012491.
Lewis R� (2010)� Green Building In Asia — Issues for Responsible Investors. Respon-
sible Research, 9 pp.
Li J�, and M� Colombier (2009)� Managing carbon emissions in China through
building energy efficiency. Journal of Environmental Management 90,
2436 – 2447.
Liddell C� (2008)� The Impact of Fuel Poverty on Children. Save the Children / Uni-
versity of Ulster, Belfast, 20 pp.
Liddell C�, and C� Morris (2010)� Fuel poverty and human health: A review of
recent evidence. Energy Policy 38, 2987 – 2997.

731731
Buildings
9
Chapter 9
Lim S� S�, T� Vos, A� D� Flaxman, G� Danaei, K� Shibuya, H� Adair-Rohani, M�
Amann, H� R� Anderson, K� G� Andrews, and M� Aryee (2012)� A comparative
risk assessment of burden of disease and injury attributable to 67 risk factors
and risk factor clusters in 21 regions, 1990 – 2010: a systematic analysis for the
Global Burden of Disease Study 2010. The Lancet 380, 2224 – 2260. Available
at: http: / / www. sciencedirect. com / science / article / pii / S0140673612617668.
Limaye D� R�, and E� S� Limaye (2011)� Scaling up energy efficiency: the case for
a Super ESCO. Energy Efficiency 4, 133 – 144. doi: 10.1007 / s12053-011-9119-5,
ISSN: 1570 – 646X, 1570 – 6478.
Lin J�-T�, and Y� K� Chuah (2011)� A study on the potential of natural ventilation
and cooling for large spaces in subtropical climatic regions. Building and Envi-
ronment 46, 89 – 97. doi: 10.1016 / j.buildenv.2010.07.007, ISSN: 0360 – 1323.
Lin Z� P�, and S� M� Deng (2004)� A study on the characteristics of nighttime bed-
room cooling load in tropics and subtropics. Building and Environment 39,
1101 – 1114. doi: 10.1016 / j.buildenv.2004.01.035.
Loftness V�, V� Hartkopf, B� Gurtekin, D� Hansen, and R� Hitchcock (2003)�
Linking Energy to Health and Productivity in the Built Environment. Center
for Building Performance and Diagnostics, Carnegie Mellon University. 12 pp.
Available at: http: / / mail.seedengr.com / documents / LinkingEnergytoHealthand
Productivity.pdf.
Lomas K� J� (2009)� Decarbonizing national housing stocks: Strategies, barriers and
measurement. Building Research and Information 37, 187 – 191. Available at:
http: / / www. scopus. com / inward / record.url?eid=2-s2.0 – 61449104947&partner
ID=40&md5=473d914e21d7753337cba231fe505604.
Lowe R� (2007)� Technical options and strategies for decarboniz-
ing UK housing. Building Research & Information 35, 412 – 425. doi:
10.1080 / 09613210701238268, ISSN: 0961 – 3218.
Luttmer M� (2006)� Evaluation of Labelling of Appliances in the Netherlands: Case
study executed within the framework of the AID-EE project. Active Implementa-
tion of the Proposed Directive on Energy Efficiency.
MacKellar F� L�, W� Lutz, C� Prinz, and A� Goujon (1995)� Population, Households
and CO
2
Emissions. Population and Development Review 21, 849 – 865. doi:
10.2307 / 2137777.
Mahdavi A�, and E� M� Doppelbauer (2010)� A performance comparison of pas-
sive and low-energy buildings. Energy and Buildings 42, 1314 – 1319.
Mansur E� T�, R� Mendelsohn, and W� Morrison (2008)� Climate change adap-
tation: A study of fuel choice and consumption in the US energy sector. Jour-
nal of Environmental Economics and Management 55, 175 – 193. Available at:
http: / / www. sciencedirect. com / science / article / pii / S0095069607001040.
Marino A�, P� Bertoldi, S� Rezessy, and B� Boza-Kiss (2011)� A snapshot of the
European energy service market in 2010 and policy recommendations to foster
a further market development. Energy Policy 39, 6190 – 6198. doi: 10.1016 / j.
enpol.2011.07.019, ISSN: 0301 – 4215.
Markaki M�, A� Belegri-Roboli, P� Michaelides, S� Mirasgedis, and D� P� Lalas
(2013)� The impact of clean energy investments on the Greek economy: An
input-output analysis (2010 – 2020). Energy Policy 57, 263 – 275.
Markandya A�, B� Armstrong, S� Hales, A� Chiabai, P� Criqui, S� Mima, C� Tonne,
and P� Wilkinson (2009)� Public health benefits of strategies to reduce
greenhouse-gas emissions: low-carbon electricity generation. The Lancet 374,
2006 – 2015. doi: 10.1016 / S0140-6736(09)61715-3.
Marmot Review Team (2011)� The Health Impacts of Cold Homes and Fuel Pov-
erty. Friends of the Earth and the Marmot Review Team, London, UK, 42 pp.
Marszal A� J�, and P� Heiselberg (2009)� A Literature Review of Zero Energy Build-
ings (ZEB) Definitions. Aalborg University Department of Civil Engineering, Aal-
borg, DK, 24 pp.
Marszal A� J�, P� Heiselberg, J� S� Bourrelle, E� Musall, K� Voss, I� Sartori, and
A� Napolitano (2011)� Zero Energy Building — A review of definitions and
calculation methodologies. Energy and Buildings 43, 971 – 979. doi: 10.1016 / j.
enbuild.2010.12.022, ISSN: 03787788.
Mata E�, A� S� Kalagasidis, and F� Johnsson (2010)� Assessment of retrofit mea-
sures for reduced energy use in residential building stocks-Simplified costs cal-
culation. In: SB10mad Sustainable Buildings Conference. Green Building Coun-
cil España, Madrid, Spain. 10 pp.
Matthews M� (2011)� Solutions for zero standby and no-load consumption, presen-
tation at EEDAL. Copenhagen. Available at: http: / / www. eedal. dk / Conference /
Programme%20and%20Presentations.aspx.
McCormick K�, and L� Neij (2009)� Experience of Policy Instruments for Energy
Efficiency in Buildings in the Nordic Countries. International Institute for Indus-
trial Environmental Economics (IIIEE) Lund University, Lund, Sweden, 67 pp.
McCulloch A� (2009)� Evidence for improvements in containment of fluorinated
hydrocarbons during use: an analysis of reported European emissions. Environ-
mental Science & Policy 12, 149 – 156. doi: 10.1016 / j.envsci.2008.12.003.
McDonell G� (2003)� Displacement ventilation. The Canadian Architect 48, 32 – 33.
McGilligan C�, M� Sunikka-Blank, and S� Natarajan (2010)� Subsidy as an agent
to enhance the effectiveness of the energy performance certificate. Energy Pol-
icy 38, 1272 – 1287. ISSN: 03014215.
McNeil M� A�, and N� Bojda (2012)� Cost-effectiveness of high-efficiency appli-
ances in the U. S. residential sector: A case study. Energy Policy 45, 33 – 42. doi:
10.1016 / j.enpol.2011.12.050, ISSN: 0301 – 4215.
McNeil M� A�, R� D� V� Buskirk, and V� E� Letschert (2005)� The Value of Standards
and Labelling: An international cost-benefit analysis tool for Standards & Label-
ling programs with results for Central American Countries. In: ECEEE Summer
Study. European Council for an Energy Efficient Economy, Mandelieu La Napoule,
France. 897 – 904 pp. Available at: http: / / www. eceee. org / library / conference_
proceedings / eceee_Summer_Studies / 2005c / Panel_4 / 4260vanbuskirk.
McNeil, M�A�, V�E� Letschert, S� de la Rue du Can, J� Ke (2013)� Bottom–Up
Energy Analysis System (BUENAS) — an international appliance efficiency pol-
icy tool. Energy Efficiency 6 (2) 191 – 217. doi: 10.1007 / s12053-012-9182-6.
Meacham J� (2009)� Solara: a case study in zero net energy design for affordable
housing. Available at: http: / / www. solaripedia. com / files / 713.pdf.
Menon S�, H� Akbari, S� Mahanama, I� Sednev, and R� Levinson (2010)� Radia-
tive forcing and temperature response to changes in urban albedos and associ-
ated CO
2
offsets. Environmental Research Letters 5, 014005. doi: 10.1088 / 1748-
9326 / 5 / 1 / 014005, ISSN: 1748 – 9326.
Mequignon M�, L� Adolphe, F� Thellier, and H� Ait Haddou (2013a)� Impact
of the lifespan of building external walls on greenhouse gas index. Building
and Environment 59, 654 – 661. doi: 10.1016 / j.buildenv.2012.09.020, ISSN:
0360 – 1323.
Mequignon M�, H� Ait Haddou, F� Thellier, and M� Bonhomme (2013b)� Green-
house gases and building lifetimes. Building and Environment 68, 77 – 86. doi:
10.1016 / j.buildenv.2013.05.017, ISSN: 0360 – 1323.
Mercier C�, and L� Morrefield (2009)� Commercial Office Plug Load Savings and
Assessment: Executive Summary. California Energy Commission, Public Interest
Energy Research. Available at: http: / / newbuildings.org / commercial-office-plug-
load-savings-and-assessment-executive-summary.

732732
Buildings
9
Chapter 9
Michaelowa A�, and D� Hayashi (2011)� Waking up the sleeping giant — how the
new benchmark methodology can boost CDM in the building sector. Trading
Carbon Magazine 5, 32 – 34.
Michaelowa A�, D� Hayashi, and M� Marr (2009)� Challenges for energy efficiency
improvement under the CDM — the case of energy-efficient lighting. Energy
Efficiency 2, 353 – 367. doi: 10.1007 / s12053-009-9052-z, ISSN: 1570 – 646X,
1570 – 6478.
MIKR (2011)� Second National Energy Efficiency Plan for The Netherlands. The Min-
ister of the Interior and Kingdom Relations.
Milin C�, and A� Bullier (2011)� Energy Retrofitting of Social Housing through
Energy Performance Contracts: A Feedback from the FRESH Project: France,
Italy, United Kingdom and Bulgaria. Intelligent Energy Europe, Brussels, Bel-
gium,
Miller N� G�, D� Pogue, Q� D� Gough, and S� M� Davis (2009)� Green buildings
and productivity. The Journal of Sustainable Real Estate 1, 65 – 89. Available at:
http: / / ares.metapress.com / index / 6402637N11778213.pdf.
Miller N�, J� Spivey, and A� Florance (2008)� Does green pay off? Journal of Real
Estate Portfolio Management 14, 385 – 400. Available at: http: / / ares.metapress.
com / index / M5G300025P233U24.pdf.
Mills E� (2003)� Climate change, insurance and the buildings sector: techno-
logical synergisms between adaptation and mitigation. Building Research
& Information 31, 257 – 277. Available at: http: / / www. tandfonline.
com / doi / abs / 10.1080 / 0961321032000097674.
Mills E� (2011)� Building Commissioning. A Golden Opportunity for Reducing Energy
Costs and Greenhouse Gas Emissions. Energy Efficiency 4, 145 – 173. Available
at: http: / / cx.lbl.gov / documents / 2009-assessment / lbnl-cx-cost-benefit.pdf.
Mills E�, and A� Rosenfeld (1996)� Consumer non-energy benefits as a motivation
for making energy-efficiency improvements. Energy 21, 707 – 720. Available at:
http: / / www. sciencedirect. com / science / article / pii / 0360544296000059.
Millstein D�, and S� Menon (2011)� Regional climate consequences of large-scale
cool roof and photovoltaic array deployment. Environmental Research Letters
6, 034001. doi: 10.1088 / 1748-9326 / 6 / 3 / 034001, ISSN: 1748 – 9326.
Milner J�, M� Davies, and P� Wilkinson (2012)� Urban energy, carbon management
(low carbon cities) and co-benefits for human health. Current Opinion in Envi-
ronmental Sustainability 4, 398 – 404. Available at: http: / / www. sciencedirect.
com / science / article / pii / S1877343512001182.
Mirasgedis S�, E� Georgopoulou, Y� Sarafidis, C� Balaras, A� Gaglia, and D� P�
Lalas (2004)� CO
2
emission reduction policies in the Greek residential sector:
A methodological framework for their economic evaluation. Energy Conver-
sion and Management 45, 537 – 557. Available at: http: / / www. sciencedirect.
com / science / article / pii / S0196890403001602.
Missaoui R�, and A� Mourtada (2010)� Instruments and Financial Mechanisms of
energy efficiency measures in building sector. World Energy Council and French
Environment and Energy Management Agency.
Mlecnik E� (2010)� Adoption of Highly Energy-Efficient Renovation Concepts. Open
House International 35, 39 – 48. ISSN: 0168 – 2601.
MLIT (2010a)� Dwellings by Occupancy Status (9 Groups) and Occupied Build-
ings other than Dwelling by Type of Building (4 Groups) — Major Metropolitan
Areas. Ministry of Land, Infrastructure, Transport and Tourism Japan. Available
at: http: / / www. e-stat. go. jp / SG1 / estat / Xlsdl.do?sinfid=000007454534.
MLIT (2010b)� Dwellings by Type of Dwelling (2 Groups) and Tenure of Dwelling
(9 Groups) and Occupied Buildings other than Dwelling by Type of Occupied
Buildings other than Dwelling (4 Groups) and Tenure of Occupied Buildings
other than Dwelling (2 Groups) and Households and Household Members by
Type of Household (4 Groups) — Major Metropolitan Areas. Ministry of Land,
Infrastructure, Transport and Tourism Japan. Available at: http: / / www. e-stat.
go. jp / SG1 / estat / Xlsdl.do?sinfid=000007454536.
MLIT (2012)� Housing Starts: New Construction Starts of Dwellings by Owner Occu-
pant Relation. Ministry of Land, Infrastructure, Transport and Tourism Japan.
MNDH (2011)� Second National Energy Efficiency Action Plan of Hungary until
2016 with an outlook to 2020. Budapest. Ministry of National Development
of Hungary.
Moniteur Belge (2011)� Lois, Decrets, Ordonnances et Reglements. Ministere de La
Region de Bruxelles-Capitale, 59148 – 59379 pp.
Monni S� (2008)� Multilevel climate policy: the case of the European Union, Fin-
land and Helsinki. Environmental Science and Policy 11, 743 – 755. Available at:
http: / / www. scopus. com / inward / record.url?eid=2-s2.0 – 54249169015&partner
ID=40&md5=9876aba889c0d8bb44c209a6d77472e0.
Montanya E� C�, D� Keith, and J� Love (2009)� Integrated Design & UFAD. ASHRAE
Journal 51, 30 – 32,34 – 38,40. ISSN: 00012491.
Moura P� S�, G� L� López, J� I� Moreno, and A� T� D� Almeida (2013)� The role of
Smart Grids to foster energy efficiency. Energy Efficiency 6, 621 – 639. doi:
10.1007 / s12053-013-9205-y, ISSN: 1570 – 646X, 1570 – 6478.
Mugdal S� (2011)� Ecodesign of domestic ovens, hobs and grills. Danish Energy
Association, Copenhagen. Available at: http: / / www. eedal. dk / Conference /
Programme%20and%20Presentations.aspx.
Murakami S�, K� Iwamra, Y� Sakamoto, T� Yashiro, K� Bogaki, M� Sato, T� Ikaga,
and J� Endo (2004)� CASBEE; comprehensive assessment system for building
environmental efficiency (Environmental Engineering). Journal of Architecture
and Building Science, 199 – 204. ISSN: 13419463.
Murakami S�, M� D� Levine, H� Yoshino, T� Inoue, T� Ikaga, Y� Shimoda, S� Miura,
T� Sera, M� Nishio, Y� Sakamoto, and W� Fujisaki (2009)� Overview of
energy consumption and GHG mitigation technologies in the building sector of
Japan. Energy Efficiency 2, 179 – 194. doi: 10.1007 / s12053-008-9040-8, ISSN:
1570 – 646X.
Murphy L�, F� Meijer, and H� Visscher (2012)� A qualitative evaluation of pol-
icy instruments used to improve energy performance of existing private
dwellings in the Netherlands. Energy Policy 45, 459 – 468. doi: 10.1016 / j.
enpol.2012.02.056, ISSN: 0301 – 4215.
Musall E�, T� Weiss, A� Lenoir, K� Voss, F� Garde, and M� Donn (2010)� Net Zero
energy solar buildings: an overview and analysis on worldwide building proj-
ects. In: EuroSun conference.
Næss-Schmidt H� S�, M� B� Hansen, and C� von Utfall Danielsson (2012)� Mul-
tiple Benefits of Investing in Energy Efficient Renovation of Buildings: Impact
on Public Finances. Copenhagen Economics, Copenhagen, Denmark.
Nagota T�, Y� Shimoda, and M� Mizuno (2008)� Verification of the energy-saving
effect of the district heating and cooling system — simulation of an electric-
driven heat pump system. Energy and Buildings 40, 732 – 741.
NAS (2010)� Real Prospects for Energy Efficiency in the United States. National
Academies Press, Washington, D.C, 329 pp. ISBN: 9780309137164.
NBI (2011)� A Search for Deep Energy Savings. Northwest Energy Efficiency Alli-
ance, Portland, Oregon, USA.

733733
Buildings
9
Chapter 9
New Buildings Institute (2012)� Getting to Zero 2012 Status Update: A First Look
at the Costs and Features of Zero Energy Commercial Buildings. New Build-
ings Institute, Vancouver, Washington, 46 pp. Available at: http: / / newbuildings.
org / sites / default / files / GettingtoZeroReport_0.pdf.
Nguyen A� T�, Q� B� Tran, D� Q� Tran, and S� Reiter (2011)� An investigation on cli-
mate responsive design strategies of vernacular housing in Vietnam. Building
and Environment 46, 2088 – 2106. doi: 10.1016 / j.buildenv.2011.04.019, ISSN:
0360 – 1323.
Nieminen J� (2011)� Passive and Zero Energy Buildings in Finland. VTT Technical
Research Centre of Finland, Finland.
Van Nostrand J� M� (2011)� Legal Issues in Financing Energy Efficiency: Creative
Solutions for Funding the Initial Capital Costs of Investments in Energy Effi-
ciency Measures. George Washington Journal of Energy and Environmental Law
2, 1 – 16.
O’ Mahony T�, P� Zhou, and J� Sweeney (2012)� The driving forces of change in
energy-related CO
2
emissions in Ireland: A multi-sectoral decomposition from
1990 to 2007. Energy Policy 44, 256 – 267. doi: 10.1016 / j.enpol.2012.01.049,
ISSN: 0301 – 4215.
Oberascher C�, R� Stamminger, and C� Pakula (2011)� Energy efficiency in daily
food preparation. International Journal of Consumer Studies 35, 201 – 211. doi:
10.1111 / j.1470-6431.2010.00963.x, ISSN: 1470 – 6423.
Oikonomou V�, F� Becchis, L� Steg, and D� Russolillo (2009)� Energy saving and
energy efficiency concepts for policy making. Energy Policy 37, 4787 – 4796. doi:
10.1016 / j.enpol.2009.06.035, ISSN: 0301 – 4215.
Oleson K� W�, G� B� Bonan, and J� Feddema (2010)� Effects of white roofs on
urban temperature in a global climate model. Geophysical Research Letters 37.
doi: 10.1029 / 2009GL042194, ISSN: 0094 – 8276.
Ouyang J�, E� Long, and K� Hokao (2010)� Rebound effect in Chinese household
energy efficiency and solution for mitigating it. Energy 35, 5269 – 5276. doi:
10.1016 / j.energy.2010.07.038, ISSN: 0360 – 5442.
Pachauri S� (2012)� Demography, urbanisation and energy demand. Energy for
Development, 81 – 94.
Pachauri S�, A� Brew-hammond, D� F� Barnes, S� Gitonga, V� Modi, G� Prasad,
A� Rath, H� Zerriffi, and J� Sathaye (2012)� Chapter 19: Energy Access for
Development — IIASA. International Institute for Applied Systems Analy-
sis, Laxenburg, Austria, 1401 – 1458 pp. Available at: http: / / www. iiasa.
ac. at / web / home / research / Flagship-Projects / Global-Energy-Assessment /
Chapte19.en.html.
Paksoy H�, A� Snijders, and L� Stiles (2009)� State-of-the-art review of under-
ground thermal energy storage systems for heating and cooling buildings. In:
World Energy Engineering Congress 2009. pp. 1465 – 1480.
Pantong K�, S� Chirarattananon, and P� Chaiwiwatworakul (2011)� Develop-
ment of Energy Conservation Programs for Commercial Buildings based on
Assessed Energy Saving Potentials. In: 9th Eco-Energy and Materials Science
and Engineering Symposium. Energy Procedia, Chiang Rai, Thailand. 70 — 83
pp.
Park W� Y� (2013)� Assessment of SEAD Global Efficiency Medals for Televisions.
Lawrence Berkeley National Laboratory, Berkeley, CA, 31 pp. Available at:
http: / / www. superefficient. org / ~ / media / Files / TV%20Awards / Assessment%20
of%20SEAD%20Global%20Efficiency%20Medals%20for%20TVs_FINAL.pdf.
Park W� Y�, A� Phadke, and N� Shah (2013)� Efficiency improvement opportunities
for personal computer monitors: implications for market transformation pro-
grams. Energy Efficiency 6, 545 – 569. doi: 10.1007 / s12053-013-9191-0, ISSN:
1570 – 646X.
Parker D� S� (2009)� Very low energy homes in the United States: Perspectives on
performance from measured data. Energy and Buildings 41, 512 – 520.
Passey R�, T� Spooner, I� MacGill, M� Watt, and K� Syngellakis (2011)� The poten-
tial impacts of grid-connected distributed generation and how to address them:
A review of technical and non-technical factors. Energy Policy 39, 6280 – 6290.
Pavan M� (2008)� Tradable energy efficiency certificates: the Italian experi-
ence. Energy Efficiency 1, 257 – 266. doi: 10.1007 / s12053-008-9022-x, ISSN:
1570 – 646X.
Pearson A� (2011)� Passive performer. CIBSE Journal, 34 – 40.
Pellegrini-Masini G�, and C� Leishman (2011)� The role of corporate reputa-
tion and employees’ values in the uptake of energy efficiency in office build-
ings. Energy Policy 39, 5409 – 5419. doi: 10.1016 / j.enpol.2011.05.023, ISSN:
03014215.
Persson U�, and S� Werner (2011)� Heat Distribution and the Future Competitive-
ness of District Heating. Applied Energy 88, 568 – 576. doi: 10.1016 / j.apen-
ergy.2010.09.020, ISSN: 0306 – 2619.
Petersdorff C�, T� Boermans, J� Harnisch, O� Stobbe, S� Ullrich, and S� Wort-
mann (2005)� Cost-Effective Climate Protection in the Building Stock of
the New EU Members: Beyond the EU Energy Performance of Buildings
Directive. European Insulation Manufacturers Association, Germany. Avail-
able at: http: / / www. eurima. org / uploads / ModuleXtender / Publications / 44 /
ECOFYS4 – 5_report_EN.pdf.
PHI (2013)� Passive House Building Database. Passive House Institute (PHI). Avail-
able at: http: / / www. passivhausprojekte. de / projekte.php.
Phillips D�, M� Beyers, and J� Good (2009)� Building Height and Net Zero; How
High Can You Go? Ashrae Journal 51, 26 – 35. ISSN: 0001 – 2491.
Piette M� A�, S� K� Kinney, and P� Haves (2001)� Analysis of an information moni-
toring and diagnostic system to improve building operations. Energy and Build-
ings 33, 783 – 791. doi: 10.1016 / S0378-7788(01)00068-8, ISSN: 0378 – 7788.
Pollin R�, and H� Garrett-Peltier (2009)� Building a Green Economy: Employment
Effects of Green Energy Investments for Ontario. Political Economy Research Insti-
tute (PERI), Amherst, MA, 31 pp. Available at: http: / / www. peri. umass. edu / fil-
eadmin / pdf / other_publication_types / green_economics / Green_Economy_
of_Ontario.PDF.
Pollin R�, J� Heintz, and H� Garrett-Peltier (2009)� The Economic Benefits of
Investing in Clean Energy: How the Economic Stimulus Program and New Leg-
islation Can Boost US Economic Growth and Employment. Department of Eco-
nomics and Political Economy Research Institute, USA, 1 – 65 pp.
Polly B�, M� Gestwick, M� Bianchi, R� Anderson, S� Horowitz, C� Christensen,
and R� Judkoff (2011)� A Method for Determining Optimal Residential Energy
Efficiency Retrofit Packages. US National Renewable Energy Laboratory,
Golden, CO, USA, 61 pp.
Pope S�, and M� Tardiff (2011)� Integrated design process: Planning and team
engagement. In: ASHRAE Transactions. American Society of Heating, Refrigerat-
ing and Air-Conditioning Engineers, Atlanta. 433 – 440 pp.

734734
Buildings
9
Chapter 9
Power A� (2008)� Does demolition or refurbishment of old and inefficient homes
help to increase our environmental, social and economic viability? Energy
Policy 36, 4487 – 4501. Available at: http: / / www. scopus. com / inward / record.
url?eid=2-s2.0 – 55549099866&partnerID=40&md5=1079ffd415d57cb8ccc511
ed8d55cce4.
Price L�, C� Galitsky, J� Sinton, E� Worrell, and W� Graus (2005)� Tax and Fiscal
Policies for Promotion of Industrial Energy Efficiency: A Survey of International
Experience. California, US: Lawrence Berkeley National Laboratory, USA,
Pyke C� R�, S� McMahon, L� Larsen, N� B� Rajkovich, and A� Rohloff (2012)�
Development and analysis of Climate Sensitivity and Climate Adaptation oppor-
tunities indices for buildings. Building and Environment 55, 141 – 149. doi:
10.1016 / j.buildenv.2012.02.020, ISSN: 03601323.
Radhi H� (2009)� Can envelope codes reduce electricity and CO
2
emissions in differ-
ent types of buildings in the hot climate of Bahrain? Energy 34, 205 – 215. doi:
10.1016 / j.energy.2008.12.006, ISSN: 0360 – 5442.
Ramesh T�, R� Prakash, and K� K� Shukla (2010)� Life cycle energy analysis of
buildings: An overview. Energy and Buildings 42, 1592 – 1600. doi: 10.1016 / j.
enbuild.2010.05.007, ISSN: 03787788.
Rao N� D� (2013)� Distributional impacts of climate change mitigation in Indian
electricity: The influence of governance. Energy Policy 61, 1344 – 1356. Available
at: http: / / www. sciencedirect. com / science / article / pii / S0301421513004588.
Rao S�, S� Pachauri, F� Dentener, P� Kinney, Z� Klimont, K� Riahi, and W� Scho-
epp (2013)� Better air for better health: Forging synergies in policies for energy
access, climate change and air pollution. Global Environmental Change 23,
1122 – 1130. doi: 10.1016 / j.gloenvcha.2013.05.003, ISSN: 0959 – 3780.
Ravi K�, P� Bennich, M� Walker, A� Lising, and S� Pantano (2013)� The SEAD
Global Efficiency Medal Competition: Accelerating Market Transformation for
Efficient Televisions in Europe. In: European Council for an Energy Efficient
Economy 2013 Summer Study.
Rawat J� S�, D� Sharma, G� Nimachow, and O� Dai (2010)� Energy efficient chulha
in rural Arunachal Pradesh. Current Science 98, 1554 – 1555. ISSN: 0011 – 3891.
Reddy A� K�, W� Annecke, K� Blok, D� Bloom, and B� Boardman (2000)� Energy and
Social Issues. United Nations Developement Programme and the World Energy
Council, USA, 39 – 60 pp. Available at: http: / / citeseerx.ist.psu.edu / viewdoc /
download?doi=10.1.1.196.4978&rep=rep1&type=pdf.
Rezessy S�, and P� Bertoldi (2010)� Financing Energy Efficiency: Forging the Link
between Financing and Project Implementation. European Commission, Brus-
sels, Belgium, 45 pp.
Rhiemeier J�-M�, and J� Harnisch (2009)� F-Gases (HFCs, PFCs and SF6).
Ecofys, Utrecht, The Netherlands, 59 pp. Available at: http: / / www. ecofys.
com / files / files / serpec_fgases_report.pdf.
Richter P� (2011)� Dishwasher household loads and their impact on the energy con-
sumption. Copenhagen, Denmark. Available at: http: / / www. eedal. dk / Conference /
Programme%20and%20Presentations.aspx.
Ries R�, M� M� Bilec, N� M� Gokhan, and K� L� S� Needy (2006)� The eco-
nomic benefits of green buildings: a comprehensive case study. The Engi-
neering Economist 51, 259 – 295. Available at: http: / / www. tandfonline.
com / doi / abs / 10.1080 / 00137910600865469.
Roaf S�, D� Crichton, and F� Nicol (2009)� Adapting Buildings and Cities for Cli-
mate Change : A 21st Century Survival Guide. Architectural Press / Elsevier, Kid-
lington, 385 pp. ISBN: 9781856177207 1856177203.
Rødsjø A�, E� Prendergast, E� Mlecnik, T� Haavik, and P� Parker (2010)�
From Demonstration Projects to Volume Markets: Market Development for
Advanced Housing Renovation. International Energy Agency, Solar Heating
and Cooling Program, Task 37, Paris, France, 85 pp. Available at: www. iea-shc.
org / task37 / index.html.
Rohracher H� (2001)� Managing the Technological Transition to Sustainable Con-
struction of Buildings: A Socio-Technical Perspective. Technology Analysis &
Strategic Management 13, 137 – 150. doi: 10.1080 / 09537320120040491, ISSN:
0953 – 7325.
Rosenow J�, and N� Eyre (2013)� The Green Deal and the Energy Company Obliga-
tion. Proceedings of the ICE — Energy 166, 127 – 136.
Roy J� (2000)� The rebound effect: some empirical evidence from India. Energy
Policy 28, 433 – 438. doi: 10.1016 / S0301-4215(00)00027-6, ISSN: 0301 – 4215.
RSA (2009)� Taxation Laws Amendment Bill, Insertion of Section 12K in Act 58 of
1962: Exemption of Certified Emission Reductions. Republic of South Africa.
Van Ruijven B� J�, D� P� van Vuuren, B� J� M� de Vries, M� Isaac, J� P� van der Sluijs,
P� L� Lucas, and P� Balachandra (2011)� Model projections for household
energy use in India. Energy Policy 39, 7747 – 7761. Available at: http: / / www.
sciencedirect. com / science / article / pii / S0301421511007105.
Ryan L�, and N� Campbell (2012)� Spreading the Net: The Multi Benefits of Energy
Efficiency Improvements. International Energy Agency, Paris, France, 36 pp.
SAIC (2013)� Drake Landing Solar Community, Energy Report for June 2013. Science
Applications International Corporation (SAIC Canada), McLean, VA, 3 pp. Avail-
able at: http: / / www. dlsc. ca / reports / DLSC_June2013ReportSummary_v1.0.pdf.
Sanner B�, C� Karytsas, D� Mendrinos, and L� Rybach (2003)� Current Status
of Ground Source Heat Pumps and Underground Thermal Energy Storage in
Europe. Geothermics 32, 579 – 588. doi: 10.1016 / S0375-6505(03)00060-9,
ISSN: 03756505.
Sanquist T� F�, H� Orr, B� Shui, and A� C� Bittner (2012)� Lifestyle factors in U. S.
residential electricity consumption. Energy Policy 42, 354 – 364. doi: 10.1016 / j.
enpol.2011.11.092, ISSN: 0301 – 4215.
Sarkar A�, and J� Singh (2010)� Financing energy efficiency in developing coun-
tries — lessons learned and remaining challenges. Energy Policy 38, 5560 – 5571.
doi: 10.1016 / j.enpol.2010.05.001, ISSN: 0301 – 4215.
Sartori I�, and A� Hestnes (2007)� Energy use in the life cycle of conventional and
low-energy buildings: A review article. Energy and Buildings 39, 249 – 257. doi:
10.1016 / j.enbuild.2006.07.001, ISSN: 03787788.
Sartori I�, B� J� W� Wachenfeldt, and A� G� H� Hestnes (2009)� Energy demand in
the Norwegian building stock: Scenarios on potential reduction. Energy Policy
37, 1614 – 1627. doi: 10.1016 / j.enpol.2008.12.031, ISSN: 0301 – 4215.
Sathaye N�, A� Phadke, N� Shah, and V� Letschert (2013)� Potential Global
Benefits of Improved Ceiling Fan Efficiency. Lawrence Berkeley National
Laboratory, Berkeley, CA. Available at: http: / / www. superefficient.
org / en / Resources / ~ / media / Files / SEAD%20Ceiling%20Fan%20Analysis /
Final%20SEAD%20Ceiling%20Fans%20Report.pdf.
Sathre R�, and L� Gustavsson (2009)� Using wood products to mitigate climate
change: External costs and structural change. Applied Energy 86, 251 – 257. doi:
10.1016 / j.apenergy.2008.04.007, ISSN: 03062619.
Saunders H� D� (2000)� A view from the macro side: rebound, backfire, and
Khazzoom-Brookes. Energy Policy 28, 439 – 449. doi: 10.1016 / S0301-
4215(00)00024-0, ISSN: 0301 – 4215.
Schäppi B�, and T� Bogner (2013)� Top-Quality and efficiency lighting with LED
lamps? Available at: http: / / www. buildup. eu / news / 36457.

735735
Buildings
9
Chapter 9
Schimschar S�, K� Blok, T� Boermans, and A� Hermelink (2011)� Germany’s path
towards nearly zero-energy buildings — Enabling the greenhouse gas mitiga-
tion potential in the building stock. Energy Policy 39, 3346 – 3360.
Schneiders J�, A� Wagner, and H� Heinrich (2009)� Certification as a European
Passive House planner. In: 13th International Passive House Conference 2009,
17 – 18 April. Passive House Institute, Darmstadt, Germany, Frankfurt am Main.
Schnieders J�, and A� Hermelink (2006)� CEPHEUS results: measurements
and occupants’ satisfaction provide evidence for Passive Houses being an
option for sustainable building. Energy Policy 34, 151 – 171. doi: 10.1016 / j.
enpol.2004.08.049, ISSN: 0301 – 4215.
Scott M� J�, J� M� Roop, R� W� Schultz, D� M� Anderson, and K� A� Cort (2008)� The
impact of DOE building technology energy efficiency programs on US employ-
ment, income, and investment. Energy Economics 30, 2283 – 2301.
Shah N�, A� Phadke, and P� Waide (2013)� Cooling the Planet: Opportunities
for Deployment of Superefficient Room Air Conditioners. Lawrence Berkeley
National Laboratory, Berkeley, California. Available at: http: / / ies.lbl.gov / pub-
lications / cooling-planet-opportunities-deployment-superefficient-room-air-
conditioners.
Shimoda Y�, M� Mizuno, S� Kametani, and T� Kanaji (1998)� Evaluation of low-
level thermal energy flow in the Osaka prefectural area. International Journal of
Global Energy Issues 11, 178 – 87.
Short C� A� (2007)� Exploiting a hybrid environmental design strategy in a US con-
tinental climate. Building Research and Information 35, 119 – 143. Available at:
http: / / www. scopus. com / inward / record.url?eid=2-s2.0 – 33947376005&partner
ID=40&md5=6dc6051140312890699208b8fea6ad23.
Siderius P� J� S�, and H� Nakagami (2013)� A MEPS is a MEPS is a MEPS: compar-
ing Ecodesign and Top Runner schemes for setting product efficiency standards.
Energy Efficiency 6, 1 – 19. doi: 10.1007 / s12053-012-9166-6, ISSN: 1570 – 646X,
1570 – 6478.
Siller T�, M� Kost, and D� Imboden (2007)� Long-term energy savings and green-
house gas emission reductions in the Swiss residential sector. Energy Policy 35,
529 – 539. doi: 10.1016 / j.enpol.2005.12.021, ISSN: 0301 – 4215.
Singh H�, A� Muetze, and P� C� Eames (2010a)� Factors influencing the uptake
of heat pump technology by the UK domestic sector. Renewable Energy 35,
873 – 878. ISSN: 0960 – 1481.
Singh A�, M� Syal, S� C� Grady, and S� Korkmaz (2010b)� Effects of green build-
ings on employee health and productivity. American Journal of Public Health
100, 1665 – 1668. Available at: http: / / www. ncbi. nlm. nih. gov / pmc / articles /
PMC2920980 / .
Smith C� B� (1997)� Electrical energy management in buildings. In: CRC Handbook
of Energy Efficiency. CRC Press, Boca Roton, pp. 305 – 336.
Smith K� R�, H� Frumkin, K� Balakrishnan, C� D� Butler, Z� A� Chafe, I� Fairlie, P�
Kinney, T� Kjellstrom, D� L� Mauzerall, T� E� McKone, A� J� McMichael, and M�
Schneider (2013)� Energy and Human Health. Annual Review of Public Health
34, 159 – 188. doi: 10.1146 / annurev-publhealth-031912-114404.
Smith K� R�, M� Jerrett, H� R� Anderson, R� T� Burnett, V� Stone, R� Derwent, R� W�
Atkinson, A� Cohen, S� B� Shonkoff, and D� Krewski (2010)� Public health
benefits of strategies to reduce greenhouse-gas emissions: health implications
of short-lived greenhouse pollutants. The Lancet 374, 2091 – 2103. Available at:
http: / / www. sciencedirect. com / science / article / pii / S0140673609617165.
Song Y�, Y� Akashi, and J� J� Yee (2007)� Effects of utilizing seawater as a cooling
source system in a commercial complex. Energy and Buildings 39, 1080 – 1087.
Sorrell S� (2007)� The Rebound Effect: An Assessment of the Evidence for Economy-
Wide Energy Savings from Improved Energy Efficiency. UK Energy Research
Centre, ISBN: ISBN 1 – 903144 – 0-35.
Sorrell S�, J� Dimitropoulos, and M� Sommerville (2009)� Empirical estimates
of the direct rebound effect: A review. Energy Policy 37, 1356 – 1371. doi:
10.1016 / j.enpol.2008.11.026, ISSN: 0301 – 4215.
Steinfeld J�, A� Bruce, and M� Watt (2011)� Peak load characteristics of Sydney
office buildings and policy recommendations for peak load reduction. Energy
and Buildings 43, 2179 – 2187.
Stevenson F� (2009)� Post-occupancy evaluation and sustainability: A review.
Proceedings of the Institution of Civil Engineers: Urban Design and Planning
162, 123 – 130. Available at: http: / / www. scopus. com / inward / record.url?eid=2-
s2.0 – 77956208499&partnerID=40&md5=09754b92abec93a14f09be1858b
31f81.
Stoecklein A�, and L� A� Skumatz (2007)� Zero and low energy homes in New Zea-
land: The value of non-energy benefits and their use in attracting homeowners.
In: ECEEE Summer Study Proceedings.
Streimikiene D�, and A� Volochovic (2011)� The impact of household behavioral
changes on GHG emission reduction in Lithuania. Renewable and Sustain-
able Energy Reviews 15, 4118 – 4124. doi: 10.1016 / j.rser.2011.07.027, ISSN:
1364 – 0321.
Stylianou M� (2011)� Smart net zero energy buildings and their integration in the
electrical grid. In: ASHRAE Transactions. American Society of Heating, Refriger-
ating and Air-Conditioning Engineers, Atlanta. 322 – 329 pp.
Sugiyama M� (2012)� Climate change mitigation and electrification. Energy Policy
44, 464 – 468. doi: 10.1016 / j.enpol.2012.01.028, ISSN: 0301 – 4215.
Sukla P� R�, S� Dhar, and D� Mahapatra (2008)� Low-carbon society scenarios for
India. Climate Policy 8, S156 – S176. Available at: http: / / www. ingentaconnect.
com / content / earthscan / cpol / 2008 / 00000008 / a00101s1 / art00012 http: / / dx.
doi.org / 10.3763 / cpol.2007.0498.
Sustainability Victoria, and Kador Group (2007)� Employee Productivity in a
Sustainable Building: Pre- and Post-Occupancy Studies in 500 Collins Street.
Sustainability Victoria, Melbourne, Victoria, 42 pp.
Taha H� (2008)� Urban Surface Modification as a Potential Ozone Air-quality
Improvement Strategy in California: A Mesoscale Modelling Study. Boundary-
Layer Meteorology 127, 219 – 239. doi: 10.1007 / s10546-007-9259-5, ISSN:
0006 – 8314, 1573 – 1472.
Tambach M�, E� Hasselaar, and L� Itard (2010)� Assessment of current Dutch
energy transition policy instruments for the existing housing stock. Energy Pol-
icy 38, 981 – 996. doi: 10.1016 / j.enpol.2009.10.050, ISSN: 0301 – 4215.
Taylor S�, A� Peacock, P� Banfill, and L� Shao (2010)� Reduction of greenhouse gas
emissions from UK hotels in 2030. Building and Environment 45, 1389 – 1400.
doi: 10.1016 / j.buildenv.2009.12.001, ISSN: 0360 – 1323.
The Eurowinter Group (1997)� Cold exposure and winter mortality from isch-
aemic heart disease, cerebrovascular disease, respiratory disease, and all
causes in warm and cold regions of Europe. The Lancet 349, 1341 – 1346. doi:
10.1016 / S0140-6736(96)12338-2, ISSN: 01406736.
Thyholt M�, and A� G� Hestnes (2008)� Heat Supply to Low-Energy Buildings in
District Heating Areas: Analyses of ´CO
2
Emissions and Electricity Supply Secu-
rity. Energy and Buildings 40, 131 – 139. doi: 10.1016 / j.enbuild.2007.01.016,
ISSN: 0378 – 7788.

736736
Buildings
9
Chapter 9
Tirado Herrero S�, J� L� López Fernández, and P� Martín García (2012a)� Pobreza
Energética En España, Potencial de Generación de Empleo Directo de La
Pobreza Derivado de La Rehabilitación Energética de Viviendas. Asociación de
Ciencias Ambientales, Madrid, Spain.
Tirado Herrero S�, D� Ürge-Vorsatz, and J�D� Healy (2012b)� Alleviating fuel
poverty in Hungary through residential energy efficiency: a social cost-benefit
analysis. Available at: http://www.webmeets.com/files/papers/AIEE/2012/434/
Tirado%20et%20al_paper1.pdf
Tommerup H�, and S� Svendsen (2006)� Energy savings in Danish residen-
tial building stock. Energy and Buildings 38, 618 – 626. doi: 10.1016 / j.
enbuild.2005.08.017, ISSN: 0378 – 7788.
Torcellini P�, and S� Pless (2012)� Controlling capital costs in high performance
office buildings: A review of best practices for overcoming cost barriers. In:
ACEEE Summer Study on Energy Efficiency in Buildings. American Council for
an Energy Efficient Economy, CA. 350 – 366 pp.
Torcellini P�, S� Pless, C� Lobato, and T� Hootman (2010)� Main Street Net-Zero
Energy Buildings: The Zero Energy Method in Concept and Practice. In: The
ASME 2010 4th International Conference on Energy Sustainability. National
Renewable Energy Laboratory, Phoenix, Arizona, USA.
Treberspurg M�, R� Smutny, and R� Grünner (2010)� Energy monitoring in exist-
ing Passive House housing estates in Austria. In: Conference Proceedings. Pas-
sive House Institute, Darmstadt, Germany, Dresden. 35 – 41 pp.
TUBESRC (2009)� Annual Report on China Building Energy Efficiency. China Archi-
tecture and Building Press, Beijing, China.
Uitdenbogerd D�, M� Scharp, and J� Kortman (2009)� BewareE: Using an Energy
Services Database in a Five Step Approach for the Development of Projects
About Energy Saving with Household Behaviour. In: Proceedings European
Council for an Energy Efficient Economy 2009 Summer Study. 1 – 6 June 2009,
La Colle sur Loup, France.
UK DE (2011)� UK Report on Articles 4 and 14 of the EU End-Use Efficiency and
Energy Services Directive. UK Department of Energy,
UNEP (2011a)� HFCs: A Critical Link in Protecting Climate and the Ozone Layer.
United Nations Environment Programme, Nairobi, Kenya, 35 pp. Available at:
http: / / www. unep. org / dewa / portals / 67 / pdf / HFC_report.pdf.
UNEP (2011b)� Towards a Green Economy: Pathways to Sustainable Development
and Poverty Eradication. United Nations Environment Programme, Nairobi,
Kenya, 44 pp. Available at: www. unep. org / greeneconomy.
UNEP FI (2009)� Energy Efficiency & the Finance Sector — a Survey on Lending
Activities and Policy Issues. United Nations Environment Programme Finance
Initiative, Geneva, Switzerland, 68 pp.
UNEP FI and PRI signatories (2008)� Principles Responsible Investment for Build-
ing responsible property portfolios. United Nations Environment Programme,
Finance Initiative.
UNEP Risoe (2012)� CDM Pipeline Analysis and Database. Available at:
http: / / cdmpipeline.org / overview.htm.
UNEP SBCI (2007)� Assessment of Policy Instrument for Reducing Greenhouse Gas
Emissions from Buildings. United Nations Environment Programme Sustainable
Buildings and Construction Initiative, Paris, France, 12 pp.
UN-Habitat (2010)� State of the World’s Cities 2010 / 2011. UN-HABITAT, 224 pp.
ISBN: 9781849711753.
UN-Habitat (2011)� Cities and Climate Change — Global Report on Human Settle-
ments 2011. UN-Habitat. Earthscan, London, UK, and Washington DC, USA.
UNHSP (2010)� The Challenge of Slums : Global Report on Human Settlements
2010. Earthscan Publications, London; Sterling, VA.
United House (2009)� Green Living: Case Study of a Victorian Flat’s Eco Improve-
ment. United House, Swanley, UK. Available at: http: / / www. unitedhouse.
net / uploads / documents / victorian-flat-eco-improvment.pdf on 24 Sept 2011.
Upton B�, R� Miner, M� Spinney, and L� S� Heath (2008)� The greenhouse gas and
energy impacts of using wood instead of alternatives in residential construction
in the United States. Biomass and Bioenergy 32, 1 – 10. doi: 10.1016 / j.biom-
bioe.2007.07.001, ISSN: 09619534.
Urban Green Council, and Davis Langdon (2009)� Cost of Green in NYC. US
Green Building Council, Washington, D. C., 32 pp.
Ürge-Vorsatz D�, D� Arena, S� Tirado Herrero, and A� Butcher (2010)� Employ-
ment Impacts of a Large-Scale Deep Building Energy Retrofit Programme in
Hungary. Center for Climate Change and Sustainable Energy Policy (3CSEP) of
Central European University, Budapest, Hungary.
Ürge-Vorsatz D�, N� Eyre, P� Graham, D� Harvey, E� Hertwich, Y� Jiang, C�
Kornevall, M� Majumdar, J� E� McMahon, S� Mirasgedis, S� Murakami,
and A� Novikova (2012a)� Chapter 10 — Energy End-Use: Buildings. In: Global
Energy Assessment-Towards a Sustainable Future. Cambridge University Press,
Cambridge, UK and New York, USA and the International Institute for Applied
Systems Analysis, Laxenburg, Austria, Laxenburg, Austria, pp. 649 – 760.
Ürge-Vorsatz D�, N� Eyre, P� Graham, C� Kornevall, L� D� D� Harvey, M�
Majumdar, M� McMahon, S� Mirasgedis, S� Murakami, A� Novikova,
and J� Yi (2012b)� Energy End-Use: Buildings. In: Global Energy Assessment:
Toward a more Sustainable Future. IIASA, Laxenburg, Austria and Cambridge
University Press, Cambridge, United Kingdom and New York, NY, USA.
Ürge-Vorsatz D�, A� Novikova, and M� Sharmina (2009)� Counting good: quan-
tifying the co-benefits of improved efficiency in buildings. In: European Coun-
cil for an Energy Efficient Economy Summer Study. La Colle sur Loup, France.
185 – 195 pp.
Ürge-Vorsatz D�, K� Petrichenko, M� Antal, M� Staniec, M� Labelle, E� Ozden,
and E� Labzina (2012c)� Best Practice Policies for Low Energy and Carbon
Buildings. A Scenario Analysis. Research Report Prepared by the Center for
Climate Change and Sustainable Policy (3CSEP) for the Global Best Practice
Network for Buildings. Central European University (CEU) and Global Buildings
Performance Network.
Ürge-Vorsatz D�, K� Petrichenko, M� Staniec, and E� Jiyong (2013)� Energy use
in buildings in a long-term perspective. Current Opinion in Environmental Sus-
tainability 5 (2) 141 – 151.
Ürge-Vorsatz D�, and S� Tirado Herrero (2012)� Building synergies between
climate change mitigation and energy poverty alleviation. Energy Policy 49,
83 – 90. doi: 10.1016 / j.enpol.2011.11.093, ISSN: 0301 – 4215.
Ürge-Vorsatz D�, E� Wójcik-Gront, S� T� Herrero, E� Labzina, and P� Foley
(2012d)� Employment Impacts of a Large-Scale Deep Building Energy Retrofit
Programme in Poland [C1]. Prepared for the European Climate Foundation by
The Centre for Climate Change and Sustainable Energy Policy (3CSEP). Central
European University, Budapest, Hungary.
US DOE (2006)� Energy Savings Potential of Solid State Lighting in General Illumina-
tion Applications. US Department of Energy, 2 pp. Available at: http: / / apps1.eere.
energy.gov / buildings / publications / pdfs / ssl / ssl_energy_savings_potential_
report_2006_final4.pdf.

737737
Buildings
9
Chapter 9
US EERE (2010)� Multi-Year Program Plan Building Regulatory Programs. U. S.
Department of Energy Energy Efficiency and Renewable Energy, Washington,
DC, 108 pp. Available at: http: / / apps1.eere.energy.gov / buildings / publications /
pdfs / corporate / regulatory_programs_mypp.pdf.
US EERE (2011)� Appliances and Commercial Equipment Standards. US Department
of Energy, Energy Efficiency & Renewable Energy. Available at: http: / / www1.
eere. energy. gov / buildings / appliance_standards / index.html.
US EPA (2013)� Overview of Greenhouse Gases. Emissions of Fluorinated Gases.
United States Environmental Protection Agency. Available at: http: / / epa.
gov / climatechange / ghgemissions / gases / fgases.html.
Vaidya P�, L� V� Greden, Eijadi, T� McDougall, and R� Cole (2009)� Integrated cost-
estimation methodology to support high-performance building design. Energy
Efficiency 2, 69 – 85. doi: 10.1007 / s12053-008-9028-4, ISSN: 1570 – 646X.
Valentini G�, and P� Pistochini (2011)� The 55 % tax reductions for building ret-
rofitting in Italy: the results of the ENEA’s four years activities. In: 6th EEDAL
Conference, Copenhagen.
Vardimon R� (2011)� Assessment of the potential for distributed photovoltaic elec-
tricity production in Israel. Renewable Energy 36, 591 – 594. doi: 10.1016 / j.
renene.2010.07.030, ISSN: 0960 – 1481.
Veeraboina P�, and G� Yesuratnam (2013)� Significance of design for energy con-
servation in buildings: building envelope components. International Journal of
Energy Technology and Policy 9, 34 – 52. doi: 10.1504 / IJETP.2013.055814.
Vine E�, J� Hamrin, N� Eyre, D� Crossley, M� Maloney, and G� Watt (2003)� Public
policy analysis of energy efficiency and load management in changing electric-
ity businesses. Energy Policy 31, 405 – 430.
Wada K�, K� Akimoto, F� Sano, J� Oda, and T� Homma (2012)� Energy efficiency
opportunities in the residential sector and their feasibility. Energy 48, 5 – 10.
doi: 10.1016 / j.energy.2012.01.046, ISSN: 0360 – 5442.
Wagner A�, S� Herkel, G� Löhnert, and K� Voss (2004)� Energy efficiency in com-
mercial buildings: Experiences and results from the German funding program
SolarBau. Available at: http: / / eetd.lbl.gov / news / events / 2005 / 06 / 20 / energy-
efficiency-in-commercial-buildings-experiences-and-results-from-the-ge.
Wagner A�, M� Kleber, and C� Parker (2007)� Monitoring of results of a naturally
ventilated and passively cooled office building in Frankfurt, Germany. Interna-
tional Journal of Ventilation 6, 3 – 20.
Waide P�, P� Guertler, and W� Smith (2006)� High-Rise Refurbishment: The energy-
efficient upgrade of multi-story residences in the European Union. International
Energy Agency.
Waide P�, F� Klinckenberg, L� Harrington, and J� Scholand (2011)� Learning from
the best: The potential for energy savings from upward alignment of equip-
ment energy efficiency requirements? Copenhagen. Available at: http: / / www.
eedal. dk / Conference / Programme%20and%20Presentations.aspx.
Wallbaum H�, Y� Ostermeyer, C� Salzer, and E� Zea Escamilla (2012)� Indica-
tor based sustainability assessment tool for affordable housing construc-
tion technologies. Ecological Indicators 18, 353 – 364. doi: 10.1016 / j.
ecolind.2011.12.005, ISSN: 1470 – 160X.
Wamukonya N� (2007)� Solar home system electrification as a viable technol-
ogy option for Africa’s development. Energy Policy 35, 6 – 14. Available at:
http: / / ideas.repec.org / a / eee / enepol / v35y2007i1p6 – 14.html.
Wan K� K� W�, D� H� W� Li, W� Pan, and J� C� Lam (2011)� Impact of climate change
on building energy use in different climate zones and mitigation and adapta-
tion implications. Applied Energy 97, 274 – 282. Available at: http: / / www.
sciencedirect. com / science / article / pii / S0306261911007458.
Watson R� (2010)� Green Building Market and Impact Report 2010. GreenBiz
Group, USA.
WBCSD (2006)� Energy Efficiency in Buildings Executive Brief #1: Our vision: A
world where buildings consume zero net energy. World Business Council for
Sustainable Development, Geneva, Switzerland�
WBCSD (2007)� Energy Efficiency in Buildings Facts & Trends. World Business Coun-
cil for Sustainable Development, Geneva, Switzerland.
WBCSD (2009)� Energy Efficiency in Buildings: Transforming the Market. World
Business Council for Sustainable Development, Geneva, Switzerland, 67 pp.
Available at: http: / / www.wbcsd.org / Pages / EDocument / EDocumentDetails.
aspx?ID=11006.
Wei Y�, L� Liu, Y� Fan, and G� Wu (2007)� The impact of lifestyle on energy use
and CO
2
emission: An empirical analysis of China’s residents. Energy Policy 35,
247 – 257. doi: 10.1016 / j.enpol.2005.11.020, ISSN: 0301 – 4215.
Wei M�, S� Patadia, and D� M� Kammen (2010)� Putting renewables and energy
efficiency to work: How many jobs can the clean energy industry generate in
the US? Energy Policy 38, 919 – 931.
Weiss J�, E� Dunkelberg, and T� Vogelpohl (2012)� Improving policy instruments
to better tap into homeowner refurbishment potential: Lessons learned from a
case study in Germany. Energy Policy 44, 406 – 415. Available at: http: / / ideas.
repec.org / a / eee / enepol / v44y2012icp406 – 415.html.
WEO (2011)� World Energy Outlook 2011. International Energy Agency, Paris,
France, 660 pp. ISBN: 978-92-64-12413-4.
Werle R�, E� Bush, B� Josephy, J� Nipkow, and C� Granda (2011)� Energy efficient
heat pump driers — European experiences and efforts in the USA and Canada.
In: Energy Efficient Domestic Appliances and Lighting. Copenhagen. Available
at: http: / / www. eedal. dk / Conference / Programme%20and%20Presentations.
aspx.
WHO (2009)� Global Health Risks: Mortality and Burden of Disease Attributable to
Selected Major Risks. World Health Organization, Geneva, Switzerland, 62 pp.
ISBN: 9789241563871.
WHO (2011)� Health in the Green Economy: Health Co-Benefits of Climate Change
Mitigation, Housing Sector. World Health Organization, Geneva, Switzerland,
121 pp. ISBN: 978 92 4 150171 2.
Van Wie McGrory L�, P� Coleman, D� Fridley, J� Harris, and E� Villasenor (2006)�
Two Paths to Transforming Markets Through Public Sector Energy Efficiency:
Bottom Up Vs. Top Down. Washington, D. C.
Wiel S�, and J� E� McMahon (2005)� Energy-Efficiency Labels and Standards: A
Guidebook for Appliances, Equipment, and Lighting — 2nd Edition. Lawrence
Berkeley National Laboratory, Berkeley, CA, 316 pp. Available at: http: / / www.
escholarship. org / uc / item / 01d3r8jg#page-2.
Wilkinson P�, M� Landon, B� Armstrong, S� Stevenson, S� Pattenden, M� McKee,
and T� Fletcher (2001)� Cold Comfort: The Social and Environmental Determi-
nants of Excess Winter Deaths in England, 1986 – 96. Policy Press, Bristol, UK, 24
pp. ISBN: 1861343558 9781861343550.
Wilkinson P�, K� R� Smith, M� Davies, H� Adair, B� G� Armstrong, M� Barrett, N�
Bruce, A� Haines, I� Hamilton, and T� Oreszczyn (2009)� Public health ben-
efits of strategies to reduce greenhouse-gas emissions: household energy. The
Lancet 374, 1917 – 1929. Available at: http: / / www. sciencedirect. com / science /
article / pii / S014067360961713X.

738738
Buildings
9
Chapter 9
Williams C�, A� Hasanbeigi, G� Wu, and L� Price (2012)� International Experience
with Quantifying the Co-Benefits of Energy Efficiency and Greenhouse Gas Mit-
igation Programs and Policies. Report LBNL-5924E. Lawrence Berkeley National
Laboratory, USA. Available at: http: / / eaei.lbl.gov / sites / all / files / LBL_5924E_
Co-benefits.Sep_.2012.pdf.
Wingfield J�, M� Bell, D� Miles-Shenton, and J� Seavers (2011)� Elm Tree Mews
Field Trial — Evaluation and Monitory of Dwellings Performance, Final Technical
Report. Centre for the Built Environment, Leeds Metropolitan University, UK.
Available at: http: / / www. leedsmet. ac. uk / as / cebe / projects / elmtree / elmtree_
finalreport.pdf.
Winkler H�, and D� Van Es (2007)� Energy efficiency and the CDM in South Africa:
constraints and opportunities. Journal of Energy in Southern Africa 18, 29 – 38.
Available at: http: / / www. eri. uct. ac. za / jesa / volume18 / 18 – 1jesa-winkler.pdf.
Wodon Q�, and C� M� Blackden (2006)� Gender, Time Use and Poverty in Sub-Saha-
ran Africa. World Bank, 152 pp. ISBN: 0 – 8213 – 6561 – 4.
Xiao J� (2011)� Research on the operation energy consumption and the renewable
energy systems of several demonstration public buildings in China. World Sus-
tainable Building Conference, Helsinki.
Xing S�, Z� Xu, and G� Jun (2008)� Inventory analysis of LCA on steel- and con-
crete-construction office buildings. Energy and Buildings 40, 1188 – 1193. doi:
10.1016 / j.enbuild.2007.10.016, ISSN: 03787788.
Xu P�, Y� J� Huang, N� Miller, N� Schlegel, and P� Shen (2012a)� Impacts of climate
change on building heating and cooling energy patterns in California. Energy
44, 792 – 804. Available at: http: / / www. sciencedirect. com / science / article /
pii / S0360544212003921.
Xu T�, J� Sathaye, H� Akbari, V� Garg, and S� Tetali (2012b)� Quantifying the direct
benefits of cool roofs in an urban setting: Reduced cooling energy use and low-
ered greenhouse gas emissions. Building and Environment 48, 1 – 6. Available
at: http: / / www. sciencedirect. com / science / article / pii / S036013231100254X.
Yoshino H�, T� Hu, M� Levine, and Y� Jiang (2011)� Total Energy use in Build-
ing — Analysis and evaluation methods. In: International Symposium on Heat-
ing, Ventilating and Air Conditioning.
Yue C�-D�, and G�-R� Huang (2011)� An evaluation of domestic solar energy poten-
tial in Taiwan incorporating land use analysis. Energy Policy 39, 7988 – 8002.
doi: 10.1016 / j.enpol.2011.09.054, ISSN: 0301 – 4215.
Zhang M�, H� Mu, Y� Ning, and Y� Song (2009)� Decomposition of energy-related
CO
2
emission over 1991 – 2006 in China. Ecological Economics 68, 2122 – 2128.
doi: 10.1016 / j.ecolecon.2009.02.005, ISSN: 0921 – 8009.
Zhang J� J�, and K� R� Smith (2007)� Household air pollution from coal and bio-
mass fuels in China: measurements, health impacts, and interventions. Environ-
mental Health Perspectives 115, 848. Available at: http: / / www. ncbi. nlm. nih.
gov / pmc / articles / PMC1892127 / .
Zhang S�, X� Yang, Y� Jiang, and Q� Wei (2010)� Comparative analysis of energy use
in China building sector: current status, existing problems and solutions. Fron-
tiers of Energy and Power Engineering in China 4, 2 – 21. doi: 10.1007 / s11708-
010-0023-z, ISSN: 1673 – 7393, 1673 – 7504.
Zhang H�, and H� Yoshino (2010)� Analysis of indoor humidity environment in
Chinese residential buildings. Building and Environment 45, 2132 – 2140. doi:
10.1016 / j.buildenv.2010.03.011, ISSN: 0360 – 1323.
Zhaojian L�, and J� Y� W� Qingpeng (2007)� Survey and analysis on influence of
environment parameters and residents’ behaviours on air conditioning energy
consumption in a residential building. Heating Ventilating & Air Conditioning.
Zhou N�, D� Fridley, M� McNeil, N� Zheng, V� Letschert, J� Ke, and Y� Saheb
(2011a)� Analysis of potential energy saving and CO
2
emission reduction of
home appliances and commercial equipments in China. Energy Policy 39,
4541 – 4550. doi: 10.1016 / j.enpol.2011.04.027, ISSN: 0301 – 4215.
Zhou N�, M� McNeil, and M� Levine (2011b)� Assessment of Building Energy-
Saving Policies and Programs in China during the 11th Five Year Plan. Lawrence
Berkeley National Laboratory, Berkeley, CA, 19 pp.
