Topic 4

Adaptation and Mitigation

Many adaptation and mitigation options can help address climate change, but no single option is sufficient by itself. Effective implementation depends on policies and cooperation at all scales and can be enhanced through integrated responses that link mitigation and adaptation with other societal objectives.

Edit
Scroll
Edit

Topic 3 demonstrates the need and strategic considerations for both adaptation and global-scale mitigation to manage risks from climate change. Building on these insights, Topic 4 presents near-term response options that could help achieve such strategic goals. Near-term adaptation and mitigation actions will differ across sectors and regions, reflecting development status, response capacities and near- and long-term aspirations with regard to both climate and non-climate outcomes. Because adaptation and mitigation inevitably take place in the context of multiple objectives, particular attention is given to the ability to develop and implement integrated approaches that can build on co-benefits and manage trade-offs.

4.1. Common enabling factors and constraints for adaptation and mitigation responses

Adaptation and mitigation responses are underpinned by common enabling factors. These include effective institutions and governance, innovation and investments in environmentally sound technologies and infrastructure, sustainable livelihoods and behavioural and lifestyle choices.

Edit

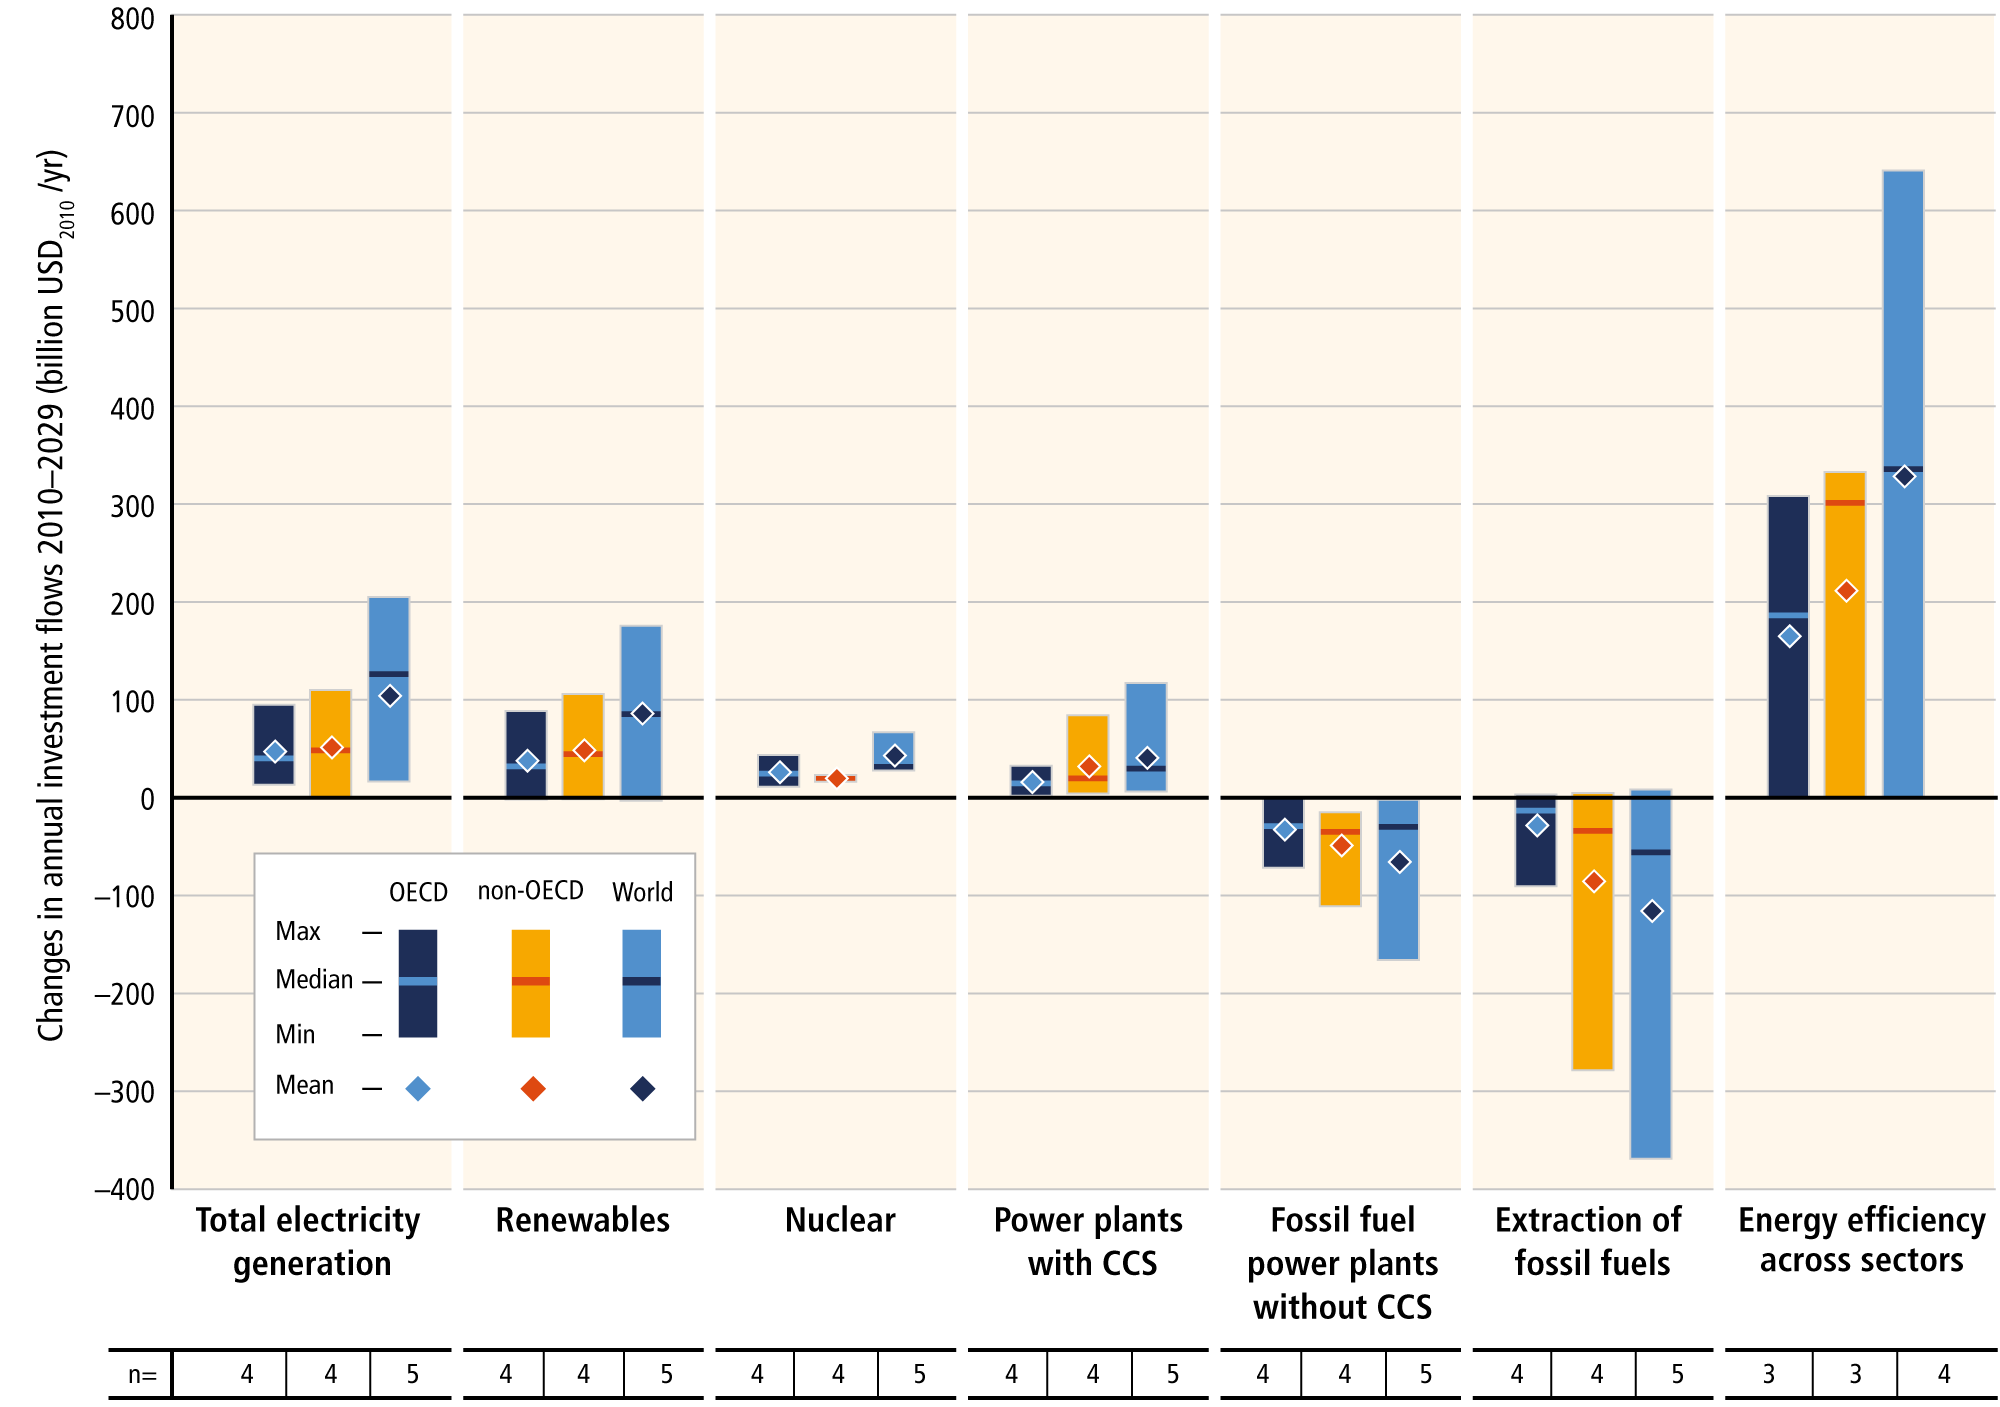
Innovation and investments in environmentally sound infrastructure and technologies can reduce greenhouse gas (GHG) emissions and enhance resilience to climate change (very high confidence). Innovation and change can expand the availability and/ or effectiveness of adaptation and mitigation options. For example, investments in low-carbon and carbon-neutral energy technologies can reduce the energy intensity of economic development, the carbon intensity of energy, GHG emissions, and the long-term costs of mitigation. Similarly, new technologies and infrastructure can increase the resilience of human systems while reducing adverse impacts on natural systems. Investments in technology and infrastructure rely on an enabling policy environment, access to finance and technology and broader economic development that builds capacity (Table 4.1, Section 4.4). {WGII SPM C-2, Table SPM.1, Table TS.8, WGIII SPM.4.1, Table SPM.2, TS.3.1.1, TS 3.1.2, TS.3.2.1}

Adaptation and mitigation are constrained by the inertia of global and regional trends in economic development, GHG emissions, resource consumption, infrastructure and settlement patterns, institutional behaviour and technology (medium evidence, high agreement). Such inertia may limit the capacity to reduce GHG emissions, remain below particular climate thresholds or avoid adverse impacts (Table 4.1). Some constraints may be overcome through new technologies, financial resources, increased institutional effectiveness and governance or changes in social and cultural attitudes and behaviours. {WGII SPM C-1, WGIII SPM.3, SPM.4.2, Table SPM.2}

Vulnerability to climate change, GHG emissions, and the capacity for adaptation and mitigation are strongly influenced by livelihoods, lifestyles, behaviour and culture (medium evidence, medium agreement) (Table 4.1). Shifts toward more energy-intensive lifestyles can contribute to higher energy and resource consumption, driving greater energy production and GHG emissions and increasing mitigation costs. In contrast, emissions can be substantially lowered through changes in consumption patterns (see 4.3 for details). The social acceptability and/or effectiveness of climate policies are influenced by the extent to which they incentivize or depend on regionally appropriate changes in lifestyles or behaviours. Similarly, livelihoods that depend on climate-sensitive sectors or resources may be particularly vulnerable to climate change and climate change policies. Economic development and urbanization of landscapes exposed to climate hazards may increase the exposure of human settlements and reduce the resilience of natural systems. {WGII SPM A-2, SPM B-2, Table SPM.1, TS A-1, TS A-2, TS C-1, TS C-216.3.2.7, WGIII SPM.4.2, TS.2.24.2}

For many regions and sectors, enhanced capacities to mitigate and adapt are part of the foundation essential for managing climate change risks (high confidence). Such capacities are place-and context-specific and therefore there is no single approach for reducing risk that is appropriate across all settings. For example, developing nations with low income levels have the lowest financial, technological and institutional capacities to pursue low-carbon, climate-resilient development pathways. Although developed nations generally have greater relative capacity to manage the risks of climate change, such capacity does not necessarily translate into the implementation of adaptation and mitigation options. {WGII SPM B-1SPM B-2TS B-116.3.1.1, 16.3.2, 16.5, WGIII SPM.5.1, TS.4.3, TS.4.54.6}

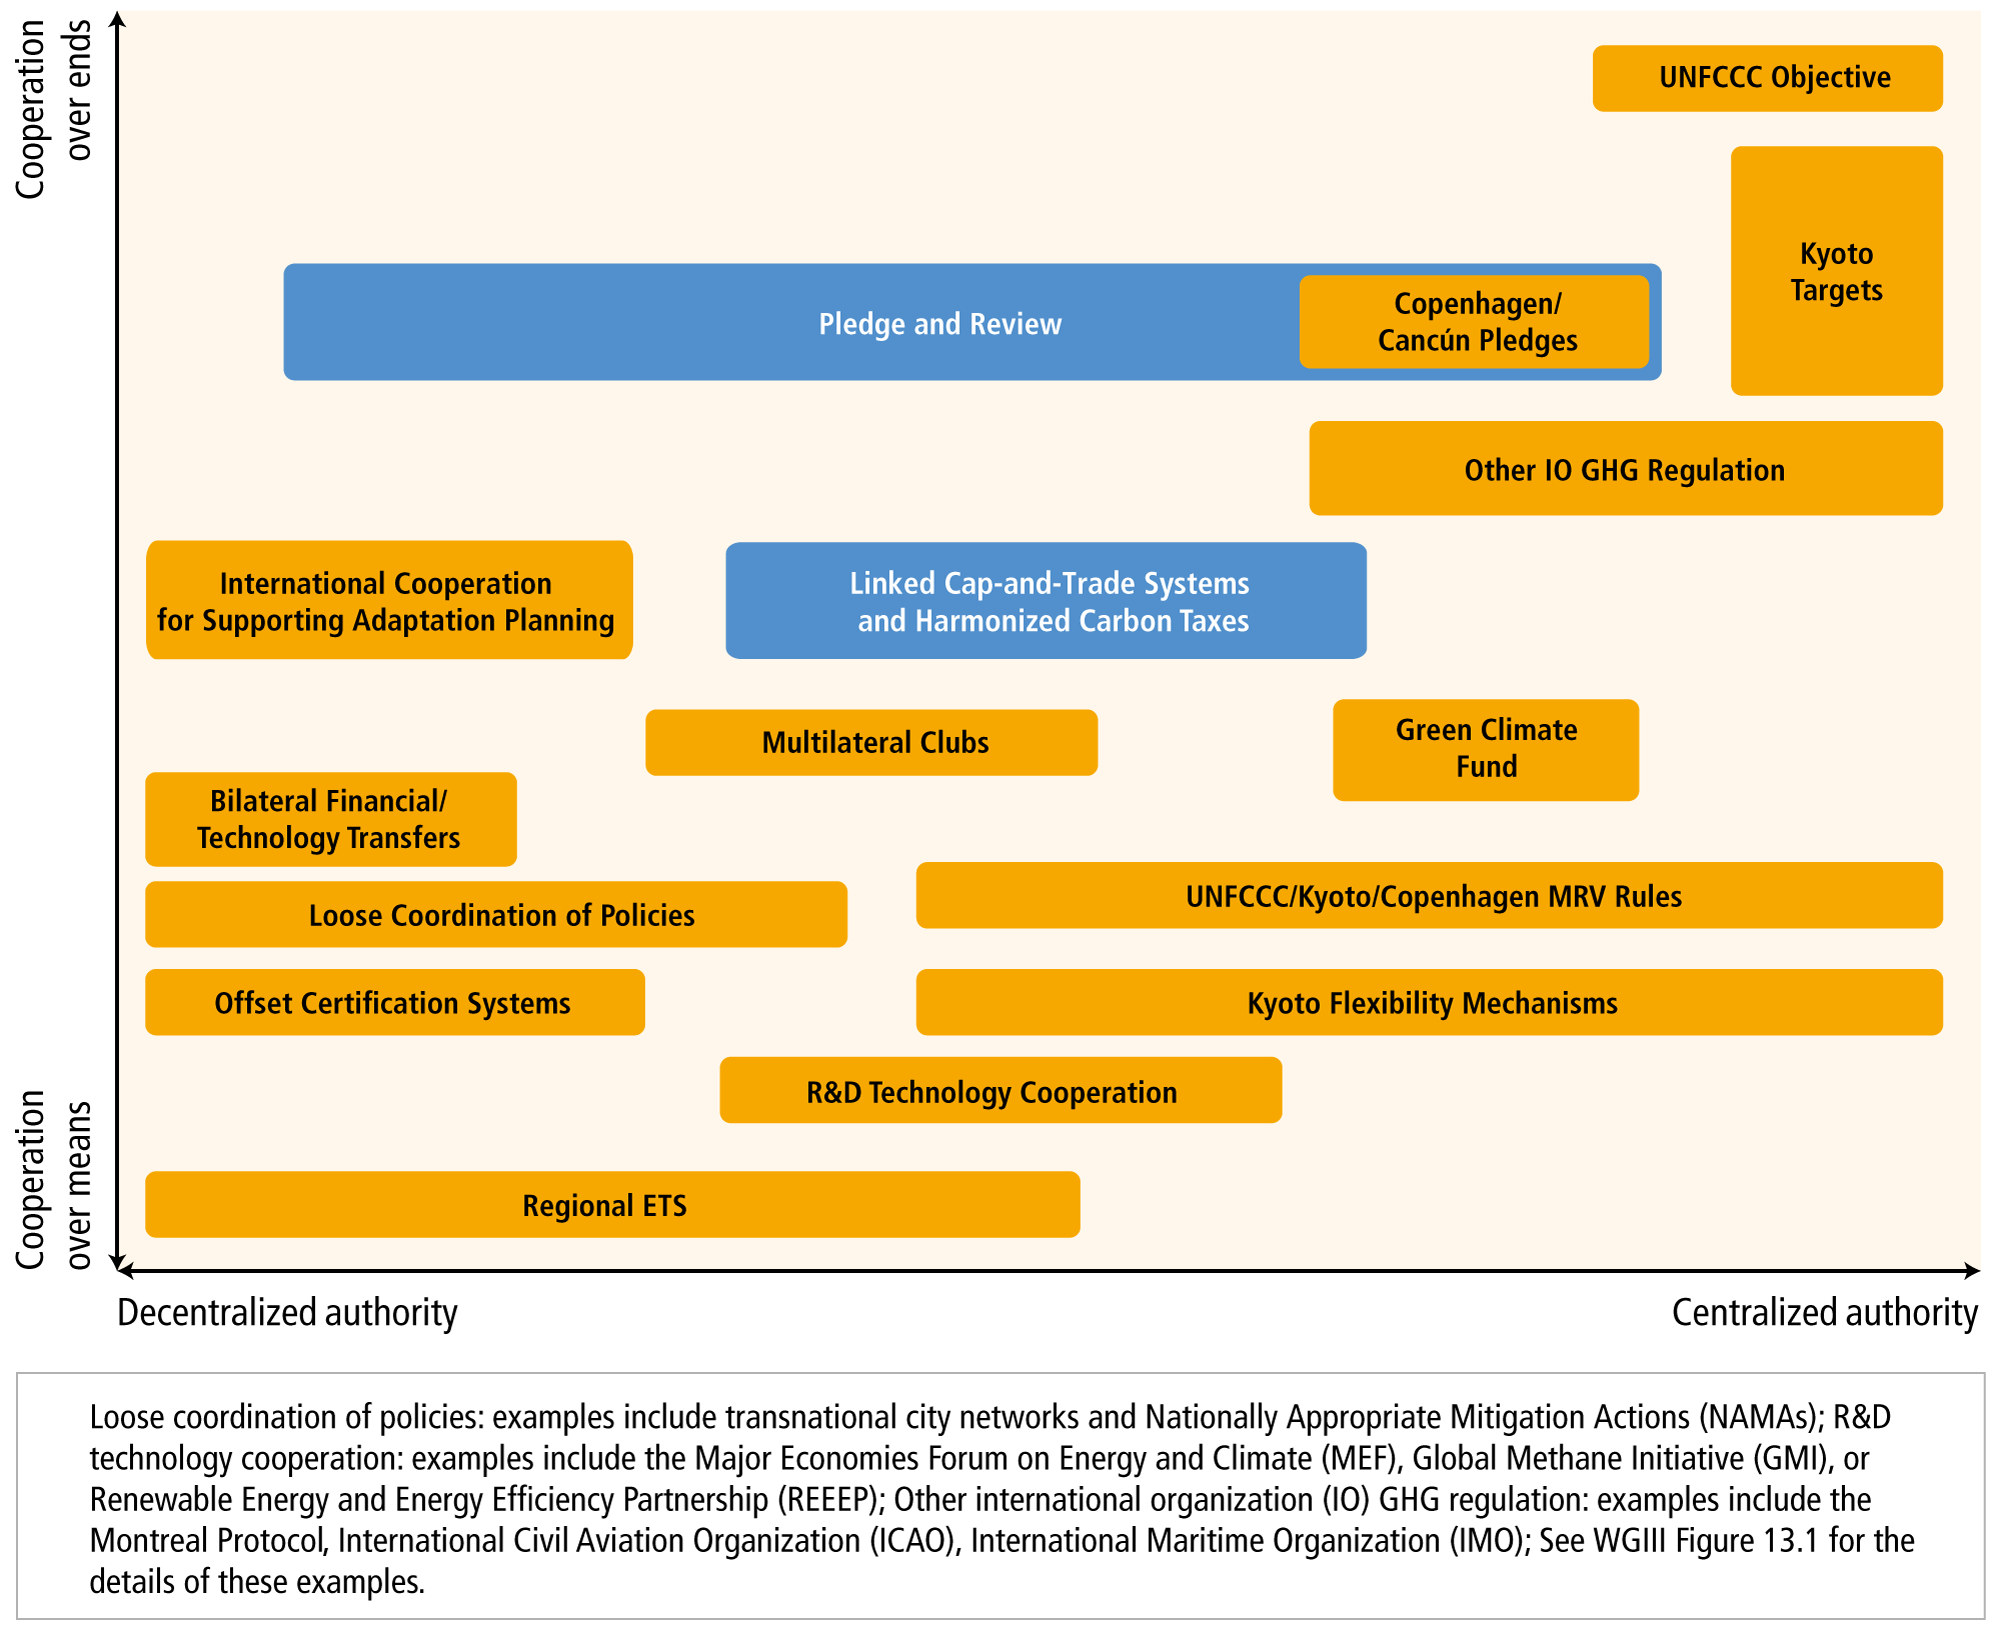
Improving institutions as well as enhancing coordination and cooperation in governance can help overcome regional constraints associated with mitigation, adaptation and disaster risk reduction (very high confidence). Despite the presence of a wide array of multilateral, national and sub-national institutions focused on adaptation and mitigation, global GHG emissions continue to increase and identified adaptation needs have not been adequately addressed. The implementation of effective adaptation and mitigation options may necessitate new institutions and institutional arrangements that span multiple scales (medium confidence) (Table 4.1). {WGII SPM B-2TS C-116.3.2.4, 16.8, WGIII SPM.4.2.5, SPM.5.1, SPM.5.2, TS.1, TS.3.1.3, TS.4.1, TS.4.2, TS.4.4}

Edit

Table 4.1

Edit

Table 4.1 | Common factors that constrain the implementation of adaptation and mitigation options

Constraining Factor Potential Implications for Adaptation Potential Implications for Mitigation
Adverse externalities of population growth and urbanization Increase exposure of human populations to climate variability and change as well as demands for, and pressures on, natural resources and ecosystem services {WGII 16.3.2.3, Box 16-3} Drive economic growth, energy demand and energy consumption, resulting in increases in greenhouse gas emissions {WGIII SPM.3}
Deficits of knowledge, education, and human capital Reduce national, institutional and individual perceptions of the risks posed by climate change as well as the costs and benefits of different adaptation options {WGII 16.3.2.1} Reduce national, institutional and individual risk perception, willingness to change behavioural patterns and practices and to adopt social and technological innovations to reduce emissions {WGIII SPM.3SPM.5.12.4.1, 3.10.1.5, 4.3.5, 9.8, 11.8.1}
Divergences in social and cultural attitudes, values and behaviours Reduce societal consensus regarding climate risk and therefore demand for specific adaptation policies and measures {WGII 16.3.2.7} Influence emission patterns, societal perceptions of the utility of mitigation policies and technologies, and willingness to pursue sustainable behaviours and technologies {WGIII SPM.22.4.5, 2.6.6.1, 3.7.2.2, 3.9.2, 4.3.4, 5.5.1}
Challenges in governance and institutional arrangements Reduce the ability to coordinate adaptation policies and measures and to deliver capacity to actors to plan and implement adaptation {WGII 16.3.2.8} Undermine policies, incentives and cooperation regarding the development of mitigation policies and the implementation of efficient, carbon-neutral and renewable energy technologies {WGIII SPM.3, SPM 5.2, 4.3.2, 6.4.3, 14.1.3.1, 14.3.2.2, 15.12.2, 16.5.3}
Lack of access to national and international climate finance Reduces the scale of investment in adaptation policies and measures and therefore their effectiveness {WGII 16.3.2.5} Reduces the capacity of developed and, particularly, developing nations to pursue policies and technologies that reduce emissions. {WGIII TS.4.3, 12.6.2, 16.2.2.2}
Inadequate technology Reduces the range of available adaptation options as well as their effectiveness in reducing or avoiding risk from increasing rates or magnitudes of climate change {WGII 16.3.2.1} Slows the rate at which society can reduce the carbon intensity of energy services and transition toward low-carbon and carbon-neutral technologies {WGIII TS.3.1.3, 4.3.6, 6.3.2.2, 11.8.4}


Insufficient quality and/or quantity of natural resources Reduce the coping range of actors, vulnerability to non-climatic factors and potential competition for resources that enhances vulnerability {WGII 16.3.2.3} Reduce the long-term sustainability of different energy technologies {WGIII 4.3.7, 4.4.1, 11.8.3}
Adaptation and development deficits Increase vulnerability to current climate variability as well as future climate change {WGII TS A-1, Table TS 5, 16.3.2.4} Reduce mitigative capacity and undermine international cooperative efforts on climate owing to a contentious legacy of cooperation on development {WGIII 4.3.1, 4.6.1}
Inequality Places the impacts of climate change and the burden of adaptation disproportionately on the most vulnerable and/or transfers them to future generations {WGII TS B-2, Box TS 4Box 13-1, 16.7} Constrains the ability for developing nations with low income levels, or different communities or sectors within nations, to contribute to GHG mitigation {WGIII 4.6.2.1}


4.2. Response options for adaptation

Adaptation options exist in all sectors, but their context for implementation and potential to reduce climate-related risks differs across sectors and regions. Some adaptation responses involve significant co-benefits, synergies and trade-offs. Increasing climate change will increase challenges for many adaptation options.

Edit

People, governments and the private sector are starting to adapt to a changing climate. Since the IPCC Fourth Assessment Report (AR4), understanding of response options has increased, with improved knowledge of their benefits, costs and links to sustainable development. Adaptation can take a variety of approaches depending on its context in vulnerability reduction, disaster risk management or proactive adaptation planning. These include (see Table 4.2 for examples and details):

  • Social, ecological asset and infrastructure development
  • Technological process optimization
  • Integrated natural resources management
  • Institutional, educational and behavioural change or reinforcement
  • Financial services, including risk transfer
  • Information systems to support early warning and proactive planning

There is increasing recognition of the value of social (including local and indigenous), institutional, and ecosystem-based measures and of the extent of constraints to adaptation. Effective strategies and actions consider the potential for co-benefits and opportunities within wider strategic goals and development plans. {WGII SPM A-2, SPM C-1, TS A-2, 6.4, 8.3, 9.4, 15.3}

Edit

Table 4.2

Edit

Table 4.2 | Approaches for managing the risks of climate change through adaptation. These approaches should be considered overlapping rather than discrete, and they are often pursued simultaneously. Examples are presented in no specific order and can be relevant to more than one category. {WGII Table SPM.1}

Opportunities to enable adaptation planning and implementation exist in all sectors and regions, with diverse potential and approaches depending on context. The need for adaptation along with associated challenges is expected to increase with climate change (very high confidence). Examples of key adaptation approaches for particular sectors, including constraints and limits, are summarized below. {WGII SPM B, SPM C, 16.4, 16.6, 17.2, 19.6, 19.7, Table 16-3}

Freshwater resources

Adaptive water management techniques, including scenario planning, learning-based approaches and flexible and low-regret solutions, can help adjust to uncertain hydrological changes due to climate change and their impacts (limited evidence, high agreement). Strategies include adopting integrated water management, augmenting supply, reducing the mismatch between water supply and demand, reducing non-climate stressors, strengthening institutional capacities and adopting more water-efficient technologies and water-saving strategies. {WGII SPM B-2, Assessment Box SPM.2 Table 1, SPM B-3, 3.6, 22.3-22.4, 23.4, 23.7, 24.4, 27.2-27.3, Box 25-2}

Terrestrial and freshwater ecosystems

Management actions can reduce but not eliminate risks of impacts to terrestrial and freshwater ecosystems due to climate change (high confidence). Actions include maintenance of genetic diversity, assisted species migration and dispersal, manipulation of disturbance regimes (e.g., fires, floods) and reduction of other stressors. Management options that reduce non-climatic stressors, such as habitat modification, overexploitation, pollution and invasive species, increase the inherent capacity of ecosystems and their species to adapt to a changing climate. Other options include improving early warning systems and associated response systems. Enhanced connectivity of vulnerable ecosystems may also assist autonomous adaptation. Translocation of species is controversial and is expected to become less feasible where whole ecosystems are at risk. {WGII SPM B-2, SPM B-3, Figure SPM.5, Table TS.8, 4.4, 25.6, 26.4, Box CC-RF}

Coastal systems and low-lying areas

Increasingly, coastal adaptation options include those based on integrated coastal zone management, local community participation, ecosystems-based approaches and disaster risk reduction, mainstreamed into relevant strategies and management plans (high confidence). The analysis and implementation of coastal adaptation has progressed more significantly in developed countries than in developing countries (high confidence). The relative costs of coastal adaptation are expected to vary strongly among and within regions and countries. {WGII SPM B-2, SPM B-3, 5.5, 8.3, 22.3, 24.426.8, Box 25-1}

Marine systems and oceans 

Marine forecasting and early warning systems as well as reducing non-climatic stressors have the potential to reduce risks for some fisheries and aquaculture industries, but options for unique ecosystems such as coral reefs are limited (high confidence). Fisheries and some aquaculture industries with high-technology and/or large investments have high capacities for adaptation due to greater development of environmental monitoring, modelling and resource assessments. Adaptation options include large-scale translocation of industrial fishing activities and flexible management that can react to variability and change. For smaller-scale fisheries and nations with limited adaptive capacities, building social resilience, alternative livelihoods and occupational flexibility are important strategies. Adaptation options for coral reef systems are generally limited to reducing other stressors, mainly by enhancing water quality and limiting pressures from tourism and fishing, but their efficacy will be severely reduced as thermal stress and ocean acidification increase. {WGII SPM B-2SPM Assessment Box SPM.2 Table 1TS B-25.56.47.525.6.229.430.6-7Box CC-MBBox CC-CR}

Food production system/Rural areas

Adaptation options for agriculture include technological responses, enhancing smallholder access to credit and other critical production resources, strengthening institutions at local to regional levels and improving market access through trade reform (medium confidence). Responses to decreased food production and quality include: developing new crop varieties adapted to changes in CO2, temperature, and drought; enhancing the capacity for climate risk management; and offsetting economic impacts of land use change. Improving financial support and investing in the production of small-scale farms can also provide benefits. Expanding agricultural markets and improving the predictability and reliability of the world trading system could result in reduced market volatility and help manage food supply shortages caused by climate change. {WGII SPM B-2, SPM B-3, 7.5, 9.3, 22.4, 22.6, 25.9, 27.3}

Urban areas, key economic sectors and services

Urban adaptation benefits from effective multi-level governance, alignment of policies and incentives, strengthened local government and community adaptation capacity, synergies with the private sector and appropriate financing and institutional development (medium confidence). Enhancing the capacity of low-income groups and vulnerable communities and their partnerships with local governments can also be an effective urban climate adaptation strategy. Examples of adaptation mechanisms include large-scale public-private risk reduction initiatives and economic diversification and government insurance for the non-diversifiable portion of risk. In some locations, especially at the upper end of projected climate changes, responses could also require transformational changes such as managed retreat. {WGII SPM B-2, 8.3-8.4, 24.4, 24.5, 26.8, Box 25-9}

Human health, security and livelihoods

Adaptation options that focus on strengthening existing delivery systems and institutions, as well as insurance and social protection strategies, can improve health, security and livelihoods in the near term (high confidence). The most effective vulnerability reduction measures for health in the near term are programmes that implement and improve basic public health measures such as provision of clean water and sanitation, secure essential health care including vaccination and child health services, increase capacity for disaster preparedness and response and alleviate poverty (very high confidence). Options to address heat related mortality include health warning systems linked to response strategies, urban planning and improvements to the built environment to reduce heat stress. Robust institutions can manage many transboundary impacts of climate change to reduce risk of conflicts over shared natural resources. Insurance programmes, social protection measures and disaster risk management may enhance long-term livelihood resilience among the poor and marginalized people, if policies address multi-dimensional poverty. {WGII SPM B-2, SPM B-3, 8.2, 10.8, 11.7-11.8, 12.5-12.6, 22.3, 23.9, 25.8, 26.6, Box CC-HS}

Significant co-benefits, synergies and trade-offs exist between adaptation and mitigation and among different adaptation responses; interactions occur both within and across regions and sectors (very high confidence). For example, investments in crop varieties adapted to climate change can increase the capacity to cope with drought, and public health measures to address vector-borne diseases can enhance the capacity of health systems to address other challenges. Similarly, locating infrastructure away from low-lying coastal areas helps settlements and ecosystems adapt to sea level rise while also protecting against tsunamis. However, some adaptation options may have adverse side effects that imply real or perceived trade-offs with other adaptation objectives (see Table 4.3 for examples), mitigation objectives or broader development goals. For example, while protection of ecosystems can assist adaptation to climate change and enhance carbon storage, increased use of air conditioning to maintain thermal comfort in buildings or the use of desalination to enhance water resource security can increase energy demand, and therefore, GHG emissions. {WGII SPM B-2, SPM C-1, 5.4.2, 16.3.2.9, 17.2.3.1, Table 16-2}

Edit

Table 4.3

Edit

Table 4.3 | Examples of potential trade-offs associated with an illustrative set of adaptation options that could be implemented by actors to achieve specific management objectives. {WGII Table 16-2}

Sector Actor’s adaptation objective Adaptation option Real or perceived trade-off
Agriculture Enhance drought and pest resistance; enhance yields Biotechnology and genetically modified crops Perceived risk to public health and safety; ecological risks associated with introduction of new genetic variants to natural environments
Provide financial safety net for farmers to ensure continuation of farming enterprises Subsidized drought assistance; crop insurance Creates moral hazard and distributional inequalities if not appropriately administered
Maintain or enhance crop yields; suppress opportunistic agricultural pests and invasive species Increased use of chemical fertilizer and pesticides Increased discharge of nutrients and chemical pollution to the environment; adverse impacts of pesticide use on non-target species; increased emissions of greenhouse gases; increased human exposure to pollutants
Biodiversity Enhance capacity for natural adaptation and migration to changing climatic conditions Migration corridors; expansion of conservation areas Unknown efficacy; concerns over property rights regarding land acquisition; governance challenges
Enhance regulatory protections for species potentially at risk due to climate and non-climatic changes Protection of critical habitat for vulnerable species Addresses secondary rather than primary pressures on species; concerns over property rights; regulatory barriers to regional economic development
Facilitate conservation of valued species by shifting populations to alternative areas as the climate changes Assisted migration Difficult to predict ultimate success of assisted migration; possible adverse impacts on indigenous flora and fauna from introduction of species into new ecological regions
Coasts Provide near-term protection to financial assets from inundation and/or erosion Sea walls High direct and opportunity costs; equity concerns; ecological impacts to coastal wetlands
Allow natural coastal and ecological processes to proceed; reduce long-term risk to property and assets Managed retreat Undermines private property rights; significant governance challenges associated with implementation
Preserve public health and safety; minimize property damage and risk of stranded assets Migration out of low-lying areas Loss of sense of place and cultural identity; erosion of kinship and familial ties; impacts to receiving communities
Water resources management Increase water resource reliability and drought resilience Desalination Ecological risk of saline discharge; high energy demand and associated carbon emissions; creates disincentives for conservation
Maximize efficiency of water management and use; increase flexibility Water trading Undermines public good/social aspects of water
Enhance efficiency of available water resources Water recycling/reuse Perceived risk to public health and safety


4.3. Response options for mitigation

Mitigation options are available in every major sector. Mitigation can be more cost-effective if using an integrated approach that combines measures to reduce energy use and the greenhouse gas intensity of end-use sectors, decarbonize energy supply, reduce net emissions and enhance carbon sinks in land-based sectors.

Edit

A broad range of sectoral mitigation options is available that can reduce GHG emission intensity, improve energy intensity through enhancements of technology, behaviour, production and resource efficiency and enable structural changes or changes in activity. In addition, direct options in agriculture, forestry and other land use (AFOLU) involve reducing CO2 emissions by reducing deforestation, forest degradation and forest fires; storing carbon in terrestrial systems (for example, through afforestation); and providing bioenergy feedstocks. Options to reduce non-CO2 emissions exist across all sectors but most notably in agriculture, energy supply and industry. An overview of sectoral mitigation options and potentials is provided in Table 4.4. {WGIII TS 3.2.1}

Figure 4.1

Edit

Figure 4.1 | Carbon dioxide (CO2) emissions by sector and total non-CO2 greenhouse gas (GHG) emissions (Kyoto gases) across sectors in baseline (left panel) and mitigation scenarios that reach about 450 (430 to 480) ppm CO2-eq (likely to limit warming to 2°C above pre-industrial levels) with carbon dioxide capture and storage (CCS, middle panel) and without CCS (right panel). Light yellow background denotes direct CO2 and non-CO2 GHG emissions for both the baseline and mitigation scenarios. In addition, for the baseline scenarios, the sum of direct and indirect emissions from the energy end-use sectors (transport, buildings and industry) is also shown (dark yellow background). Mitigation scenarios show direct emissions only. However, mitigation in the end-use sectors leads also to indirect emissions reductions in the upstream energy supply sector. Direct emissions of the end-use sectors thus do not include the emission reduction potential at the supply-side due to, for example, reduced electricity demand. Note that for calculating the indirect emissions only electricity emissions are allocated from energy supply to end-use sectors. The numbers at the bottom of the graphs refer to the number of scenarios included in the range, which differs across sectors and time due to different sectoral resolution and time horizon of models. Note that many models cannot reach concentrations of about 450 ppm CO2-eq by 2100 in the absence of CCS, resulting in a low number of scenarios for the right panel. Negative emissions in the electricity sector are due to the application of bioenergy with carbon dioxide capture and storage (BECCS). ‘Net’ agriculture, forestry and other land use (AFOLU) emissions consider afforestation, reforestation as well as deforestation activities. {Figure WGIII SPM.7, Figure TS.15}

Well-designed systemic and cross-sectoral mitigation strategies are more cost-effective in cutting emissions than a focus on individual technologies and sectors with efforts in one sector affecting the need for mitigation in others (medium confidence). In baseline scenarios without new mitigation policies, GHG emissions are projected to grow in all sectors, except for net CO2 emissions in the AFOLU sector (Figure 4.1, left panel). Mitigation scenarios reaching around 450 ppm CO2-eq1 concentration by 21002 (likely to limit warming to 2°C above pre-industrial levels) show large scale global changes in the energy supply sector (Figure 4.1, middle and right panel). While rapid decarbonization of energy supply generally entails more flexibility for end-use and AFOLU sectors, stronger demand reductions lessen the mitigation challenge for the supply side of the energy system (Figures 4.1 and 4.2). There are thus strong interdependencies across sectors and the resulting distribution of the mitigation effort is strongly influenced by the availability and performance of future technologies, particularly BECCS and large scale afforestation (Figure 4.1, middle and right panel). The next two decades present a window of opportunity for mitigation in urban areas, as a large portion of the world’s urban areas will be developed during this period. {WGIII SPM.4.2, TS.3.2}

Decarbonizing (i.e., reducing the carbon intensity of) electricity generation is a key component of cost-effective mitigation strategies in achieving low stabilization levels (of about 450 to about 500 ppm CO2-eq, at least about as likely as not to limit warming to 2°C above pre-industrial levels) (medium evidence, high agreement). In most integrated modelling scenarios, decarbonization happens more rapidly in electricity generation than in the industry, buildings and transport sectors. In scenarios reaching 450 ppm CO2-eq concentrations by 2100, global CO2 emissions from the energy supply sector are projected to decline over the next decade and are characterized by reductions of 90% or more below 2010 levels between 2040 and 2070. {WGIII SPM.4.2, 6.8, 7.11}

Efficiency enhancements and behavioural changes, in order to reduce energy demand compared to baseline scenarios without compromising development, are a key mitigation strategy in scenarios reaching atmospheric CO2-eq concentrations of about 450 to about 500 ppm by 2100 (robust evidence, high agreement). Near-term reductions in energy demand are an important element of cost-effective mitigation strategies, provide more flexibility for reducing carbon intensity in the energy supply sector, hedge against related supply-side risks, avoid lock-in to carbon-intensive infrastructures and are associated with important co-benefits (Figure 4.2, Table 4.4). Emissions can be substantially lowered through changes in consumption patterns (e.g., mobility demand and mode, energy use in households, choice of longer-lasting products) and dietary change and reduction in food wastes. A number of options including monetary and non-monetary incentives as well as information measures may facilitate behavioural changes. {WGIII SPM.4.2}

Edit

Figure 4.2

Edit

Figure 4.2 | Influence of energy demand on the deployment of energy supply technologies in 2050 in mitigation scenarios reaching about 450 to about 500 ppm CO2-eq concentrations by 2100 (at least about as likely as not to limit warming to 2°C above pre-industrial levels). Blue bars for ‘low energy demand’ show the deployment range of scenarios with limited growth in final energy demand of <20% in 2050 compared to 2010. Red bars show the deployment range of technologies in a case of ‘high energy demand’ (>20% growth in 2050 compared to 2010). For each technology, the median, interquartile and full deployment range is displayed. Notes: Scenarios assuming technology restrictions are excluded. Ranges include results from many different integrated models. Multiple scenario results from the same model were averaged to avoid sampling biases. {WGIII Figure TS.16}

Table 4.4

Edit

Table 4.4 | Sectoral carbon dioxide (CO2) emissions, associated energy system changes and examples of mitigation measures (including for non-CO2 gases; see Box 3.2 for metrics regarding the weighting and abatement of non-CO2 emissions). {WGIII Figure SPM.7, Figure SPM.8Table TS.27.11.3, 7.13, 7.14}

Decarbonization of the energy supply sector (i.e., reducing the carbon intensity) requires upscaling of low- and zero-carbon electricity generation technologies (high confidence). In the majority of lowconcentration stabilization scenarios (about 450 to about 500 ppm CO2-eq , at least about as likely as not to limit warming to 2°C above pre-industrial levels), the share of lowcarbon electricity supply (comprising renewable energy (RE), nuclear and CCS, including BECCS) increases from the current share of approximately 30% to more than 80% by 2050 and 90% by 2100, and fossil fuel power generation without CCS is phased out almost entirely by 2100. Among these low-carbon technologies, a growing number of RE technologies have achieved a level of maturity to enable deployment at significant scale since AR4 (robust evidence, high agreement) and nuclear energy is a mature low-GHG emission source of baseload power, but its share of global electricity generation has been declining (since 1993). GHG emissions from energy supply can be reduced significantly by replacing current world average coalfired power plants with modern, highly efficient natural gas combinedcycle power plants or combined heat and power plants, provided that natural gas is available and the fugitive emissions associated with extraction and supply are low or mitigated. {WGIII SPM.4.2}

Behaviour, lifestyle and culture have a considerable influence on energy use and associated emissions, with high mitigation potential in some sectors, in particular when complementing technological and structural change (medium evidence, medium agreement). In the transport sector, technical and behavioural mitigation measures for all modes, plus new infrastructure and urban redevelopment investments, could reduce final energy demand significantly below baseline levels (robust evidence, medium agreement) (Table 4.4). While opportunities for switching to low-carbon fuels exist, the rate of decarbonization in the transport sector might be constrained by challenges associated with energy storage and the relatively low energy density of low-carbon transport fuels (medium confidence). In the building sector, recent advances in technologies, know-how and policies provide opportunities to stabilize or reduce global energy use to about current levels by mid-century. In addition, recent improvements in performance and costs make very low energy construction and retrofits of buildings economically attractive, sometimes even at net negative costs (robust evidence, high agreement). In the industry sector, improvements in GHG emission efficiency and in the efficiency of material use, recycling and reuse of materials and products, and overall reductions in product demand (e.g., through a more intensive use of products) and service demand could, in addition to energy efficiency, help reduce GHG emissions below the baseline level. Prevalent approaches for promoting energy efficiency in industry include information programmes followed by economic instruments, regulatory approaches and voluntary actions. Important options for mitigation in waste management are waste reduction, followed by re-use, recycling and energy recovery (robust evidence, high agreement). {WGIII SPM.4.2, Box TS.12, TS.3.2}

The most cost-effective mitigation options in forestry are afforestation, sustainable forest management and reducing deforestation, with large differences in their relative importance across regions. In agriculture, the most cost-effective mitigation options are cropland management, grazing land management and restoration of organic soils (medium evidence, high agreement). About a third of mitigation potential in forestry can be achieved at a cost <20 USD/tCO2-eq emission. Demand‐side measures, such as changes in diet and reductions of losses in the food supply chain, have a significant, but uncertain, potential to reduce GHG emissions from food production (medium evidence, medium agreement). {WGIII SPM.4.2.4

Bioenergy can play a critical role for mitigation, but there are issues to consider, such as the sustainability of practices and the efficiency of bioenergy systems (robust evidence, medium agreement). Evidence suggests that bioenergy options with low lifecycle emissions, some already available, can reduce GHG emissions; outcomes are sitespecific and rely on efficient integrated ‘biomassto‐bioenergy systems’, and sustainable land use management and governance. Barriers to largescale deployment of bioenergy include concerns about GHG emissions from land, food security, water resources, biodiversity conservation and livelihoods. {WGIII SPM.4.2.4}

Mitigation measures intersect with other societal goals, creating the possibility of cobenefits or adverse sideeffects. These intersections, if wellmanaged, can strengthen the basis for undertaking climate mitigation actions (robust evidence, medium agreement). Mitigation can positively or negatively influence the achievement of other societal goals, such as those related to human health, food security, biodiversity, local environmental quality, energy access, livelihoods and equitable sustainable development (see also Section 4.5). On the other hand, policies towards other societal goals can influence the achievement of mitigation and adaptation objectives. These influences can be substantial, although sometimes difficult to quantify, especially in welfare terms. This multi‐objective perspective is important in part because it helps to identify areas where support for policies that advance multiple goals will be robust. Potential co-benefits and adverse side effects of the main sectoral mitigation measures are summarized in Table 4.5Overall, the potential for co-benefits for energy end-use measures outweigh the potential for adverse side effects, whereas the evidence suggests this may not be the case for all energy supply and AFOLU measures. {WGIII SPM.2}

Edit

4.4. Policy approaches for adaptation and mitigation, technology and finance

Effective adaptation and mitigation responses will depend on policies and measures across multiple scales: international, regional, national and sub-national. Policies across all scales supporting technology development, diffusion and transfer, as well as finance for responses to climate change, can complement and enhance the effectiveness of policies that directly promote adaptation and mitigation.

Edit

4.4.1. International and regional cooperation on adaptation and mitigation

Because climate change has the characteristics of a collective action problem at the global scale (see 3.1), effective mitigation will not be achieved if individual agents advance their own interests independently, even though mitigation can also have local co-benefits. Cooperative responses, including international cooperation, are therefore required to effectively mitigate GHG emissions and address other climate change issues. While adaptation focuses primarily on local to national scale outcomes, its effectiveness can be enhanced through coordination across governance scales, including international cooperation. In fact, international cooperation has helped to facilitate the creation of adaptation strategies, plans, and actions at national, sub-national, and local levels. A variety of climate policy instruments have been employed, and even more could be employed, at international and regional levels to address mitigation and to support and promote adaptation at national and sub-national scales. Evidence suggests that outcomes seen as equitable can lead to more effective cooperation. {WGII SPM C-1, 2.2, 15.2, WGIII 13.ES14.3, 15.8, SREX SPM, 7.ES}

The United Nations Framework Convention on Climate Change (UNFCCC) is the main multilateral forum focused on addressing climate change, with nearly universal participation. UNFCCC activities since 2007, which include the 2010 Cancún Agreements and the 2011 Durban Platform for Enhanced Action, have sought to enhance actions under the Convention, and have led to an increasing number of institutions and other arrangements for international climate change cooperation. Other institutions organized at different levels of governance have resulted in diversifying international climate change cooperation. {WGIII SPM.5.2, 13.5}

Existing and proposed international climate change cooperation arrangements vary in their focus and degree of centralization and coordination. They span: multilateral agreements, harmonized national policies and decentralized but coordinated national policies, as well as regional and regionally-coordinated policies (see Figure 4.3). {WGIII SPM.5.2}

Table 4.5

Edit

Table 4.5 | Potential co-benefits (blue text) and adverse side effects (red text) of the main sectoral mitigation measures. Co-benefits and adverse side effects, and their overall positive or negative effect, all depend on local circumstances as well as on the implementation practice, pace and scale. For an assessment of macroeconomic, cross-sectoral effects associated with mitigation policies, see Section 3.4. The uncertainty qualifiers between brackets denote the level of evidence and agreement on the respective effect. Abbreviations for evidence: l = limited, m = medium, r = robust; for agreement: l = low, m = medium, h = high. {WGIII Table TS.3Table TS.4Table TS.5Table TS.6Table TS.7Table 6.7}


Sectoral mitigation measures Effect on additional objectives/concerns
Economic Social Environmental
Energy Supply For possible upstream effects of biomass supply for bioenergy, see AFOLU.
Nuclear replacing coal power Energy security (reduced exposure to fuel price volatility) (m/m); local employment impact (but uncertain net effect) (l/m); legacy/cost of waste and abandoned reactors (m/h) Mixed health impact via reduced air pollution and coal mining accidents (m/h), nuclear accidents and waste treatment, uranium mining and milling (m/l); safety and waste concerns (r/h); proliferation risk (m/m) Mixed ecosystem impact via reduced air pollution (m/h) and coal mining (l/h), nuclear accidents (m/m)
Renewable Energy (wind, PV, CSP, hydro, geothermal, bioenergy) replacing coal  Energy security (r/m); local employment (but uncertain net effect) (m/m); water management (for some hydro energy) (m/h); extra measures to match demand (for PV, wind, some CSP) (r/h); higher use of critical metals for PV and direct drive wind turbines (r/m) Reduced health impact via reduced air pollution (except bioenergy) (r/h) and coal mining accidents (m/h); contribution to (off-grid) energy access (m/l); threat of displacement (for large hydro installations) (m/h) Mixed ecosystem impact via reduced air pollution (except bioenergy) (m/h) and coal mining (l/h), habitat impact (for some hydro energy) (m/m), landscape and wildlife impact (m/m); lower/higher water use (for wind, PV (m/m); bioenergy CSP, geothermal and reservoir hydro (m/h)
Fossil energy with CCS replacing coal  Preservation vs lock-in of human and physical capital in the fossil industry (m/m); long-term monitoring of CO2 storage (m/h) Health impact via risk of CO2 leakage (m/m), and additional upstream supply-chain activities (m/h); safety concerns (CO2 storage and transport) (m/h) Ecosystem impact via additional upstream supply-chain activities (m/mhigher water use (m/h)
CH4 leakage prevention, capture or treatment Energy security (potential to use gas in some cases) (l/h) Reduced health impact via reduced air pollution (m/m); occupational safety at coal mines (m/m) Reduced ecosystem impact via reduced air pollution (l/m)
Transport For possible upstream effects of low-carbon electricity, see Energy Supply. For biomass supply, see AFOLU.
Reduction of carbon intensity of fuel Energy security (diversification, reduced oil dependence and exposure to oil price volatility) (m/m); technological spillovers (l/l) Mixed health impact via increased/reduced urban air pollution by electricity and hydrogen (r/h), diesel (l/m), ; road safety concerns (l/l) but reduced health impact via reduced noice (l/m) of electric LDVs Mixed ecosystem impact of electricity and hydrogen via reduced urban air pollution (m/m), material use (unsustainable mining) (l/l)
Reduction of energy intensity Energy security (reduced oil dependence and exposure to oil price volatility) (m/m) Reduced health impact via reduced urban air pollution (r/h); road safety (crash-worthiness depending on the design of the standards) (m/m) Reduced ecosystem and biodiversity impact via reduced urban air pollution (m/h)
Compact urban form and improved transport infrastructure Modal shift Energy security (reduced oil dependence and exposure to oil price volatility) (m/m); productivity (reduced urban congestion and travel times, affordable and accessible transport) (m/h) Mixed health impact for non-motorized modes via increased physical activity (r/h), potentially higher exposure to air pollution (r/h), reduced noise (via modal shift and travel reduction) (r/h); equitable mobility access to employment opportunities (r/h); road safety (via modal shift) (r/h) Reduced ecosystem impact via reduced urban air pollution (r/h); land-use competition (m/m)
Journey distance reduction and avoidance Energy security (reduced oil dependence and exposure to oil price volatility) (r/h); productivity (reduced urban congestion/travel times, walking) (r/h) Reduced health impact (for non-motorized transport modes) (r/h) Mixed ecosystem impact via reduced urban air pollution (r/h), new/shorter shipping routes (r/h); reduced land-use competition from transport infrastructure (r/h)
Buildings For possible upstream effects of fuel switching and RES, see Energy Supply.
Reduction of GHG emissions intensity (e.g. fuel switching, RES incorporation, green roofs) Energy security (m/h); employment impact (m/m); lower need for energy subsidies (l/l); asset values of buildings (l/m) Fuel poverty alleviation via reduced energy demand (m/h); energy access (for higher energy cost) (l/m); productive time for women/children (for replaced traditional cookstoves) (m/h) Reduced health impact in residential buildings and ecosystem impact (via reduced fuel poverty (r/h), indoor/outdoor air pollution (r/h), and UHI effect) (l/m); urban biodiversity (for green roofs) (m/m)
Retrofits of existing buildings
Exemplary new buildings
Efficient equipment 
Energy security (m/h); employment impact (m/m); productivity (for commercial buildings) (m/h); less need for energy subsidies (l/l); asset value of buildings (l/m); disaster resilience (l/m) Fuel poverty alleviation via reduced energy demand (for retrofits, efficient equipment) (m/h); energy access (higher housing cost) (l/m); thermal comfort (m/h); productive time for women and children (for replaced traditional cookstoves) (m/h) Reduced health and ecosystem impact (e.g. via reduced fuel poverty) (r/h), indoor/outdoor air pollution (r/h) and UHI effect (l/m), improved indoor environmental conditions (m/h)); health risk via insufficient ventilation (m/m); reduced water consumption and sewage production (l/l)
Behavioural changes reducing energy demand Energy security (m/h); less need for energy subsidies (l/l)   Reduced health and ecosystem impact (e.g. via improved indoor environmental conditions (m/h) and less outdoor air pollution (r/h))
Industry For possible upstream effects of low-carbon energy supply (incl. CCS), see Energy Supply and of biomass supply, see AFOLU.
Reduction of CO2/non-CO2 emission intensity  Competitiveness and productivity (m/h) Reduced health impact via reduced local air pollution and better working conditions (PFC from aluminium) (m/m) Reduced ecosystem impact (via reduced local air and water pollution) (m/m); water conservation (l/m)
Technial energy efficiency improvements via new processes/technologies Energy security (via lower energy intensity) (m/m); employment impact (l/l); competitiveness and productivity (m/h); technological spillovers in DCs (l/l) Reduced health impact via reduced local pollution (l/m); new business opportunities (m/m); increased water availability and quality (l/l); improved safety, working conditions and job satisfaction (m/m) Reduced ecosystem impact via fossil fuel extraction (l/l) and reduced local pollution and waste (m/m)
Material efficiency of goods, recycling Decreased national sales tax revenue in the medium term (l/l); employment impact (waste recycling) (l/l); competitiveness in manufacturing (l/l); new infrastructure for industrial clusters (l/l) Reduced health impacts and safety concerns (l/m); new business opportunities (m/m) and local conflicts (reduced resource extraction) (l/m) Reduced ecosystem impact via reduced local air and water pollution and waste material disposal (m/m); reduced use of raw/virgin materials and natural resources implying reduced unsustainable resource mining (l/l)
Product demand reductions Decreased national sales tax revenue in medium term (l/l) Increased wellbeing via diverse lifestyle choices (l/l) Reduced post-consumption waste (l/l)
AFOLU Note: co-benefits and adverse side-effects depend on the development context and the scale of the intervention (size).
Supply side: forestry, land-based agriculture, livestock, livestock, integrated systems and bioenergy

Demand Side: reduced losses in the food supply chain, changes in human diets and in demand for wood and forestry products
Mixed employment impact via entrepreneurship development (m/h), use of less labour-intensive technologies in agriculture (m/m); diversification of income sources and access to markets (r/h); additional income to sustainable landscape management (m/h); income concentration (m/m); energy security (resource sufficiency) (m/h); Innovative financing mechanisms for sustainable resource management (m/h); technology innovation and transfer (m/m) Increased food-crops production through integrated systems and sustainable agriculture intensification (r/m); decreased food production (locally) due to large-scale monocultures of non-food crops (r/l); increased cultural habitats and recreational areas via (sustainable) forest management and conservation (m/m); improved human health and animal welfare (e.g. through less use of pesticides, reduced burning practices, and agroforestry and silvo-pastoral systems) (m/h); human health related to burning practices (in agriculture or bioenergy) (m/m); mixed impacts on gender, intra- and inter-generational equity via participation and fair benefit sharing (r/h) and higher concentration of benefits (m/m) Mixed impact on ecosystem services via large-scale monocultures (r/h), ecosystem conservation, sustainable management as well as sustainable agriculture (r/h); increased land-use competition (r/m); soil quality (r/h); decreased erosion (r/h); increased ecosystem resilience (m/h); albedo and evaporation (r/h)
Institutional aspects: mixed impact on tenure and use rights at the local level (for indigenous people and local communities) (r/h) and on access to participative mechanisms for land management decisions (r/h); enforcement of existing policies for sustainable resource management (r/h)
Human Settlements and Infrastructure For compact urban form and improved transport infrastructure, see also Transport.
Compact development and infrastructure Increased innovation and efficient resource use (r/h); higher rents and property values (m/m) Improved health from increased physical activity: see Transport Preservation of open space (m/m)
Increased accessibility Commute savings (r/h) Improved health from increased physical activity: see Transport; increased social interaction and mental health (m/m) Improved air quality and reduced ecosystem and health impacts (m/h)
Mixed land use Commute savings (r/h); higher rents and property values (m/m) Improved health from increased physical activity (r/h); social interaction and mental health (l/m) Improved air quality and reduced ecosystem and health impacts (m/h)


Edit

Figure 4.3

Edit

Figure 4.3 | Alternative forms of international cooperation. The figure represents a compilation of existing and possible forms of international cooperation, based upon a survey of published research, but is not intended to be exhaustive of existing or potential policy architectures, nor is it intended to be prescriptive. Examples in orange are existing agreements. Examples in blue are structures for agreements proposed in the literature. The width of individual boxes indicates the range of possible degrees of centralization for a particular agreement. The degree of centralization indicates the authority an agreement confers on an international institution, not the process of negotiating the agreement. {WGIII Figure 13.2}

While a number of new institutions are focused on adaptation funding and coordination, adaptation has historically received less attention than mitigation in international climate policy (robust evidence, medium agreement). Inclusion of adaptation is increasingly important to reduce the risk from climate change impacts and may engage a greater number of countries. {WGIII 13.2, 13.3.3, 13.5.1.1, 13.14}

The Kyoto Protocol offers lessons towards achieving the ultimate objective of the UNFCCC, particularly with respect to participation, implementation, flexibility mechanisms, and environmental effectiveness (medium evidence, low agreement). The Protocol was the first binding step toward implementing the principles and goals provided by the UNFCCC. According to national GHG inventories through 2012 submitted to the UNFCCC by October 2013, Annex B Parties with quantified emission limitations (and reduction obligations) in aggregate may have bettered their collective emission reduction target in the first commitment period,3 but some emissions reductions that would have occurred even in its absence were also counted. The Protocol’s Clean Development Mechanism (CDM) created a market for emissions offsets from developing countries, the purpose being two-fold: to help Annex I countries fulfill their commitments and to assist non-Annex I countries achieve sustainable development. The CDM generated Certified Emission Reductions (offsets) equivalent to emissions of over 1.4 GtCO2-eq by October 2013, led to significant project investments, and generated investment flows for a variety of functions, including the UNFCCC Adaptation Fund. However, its environmental effectiveness has been questioned by some, particularly in regard to its early years, due to concerns about the additionality of projects (that is, whether projects bring about emissions that are different from business as usual (BAU) circumstances), the validity of baselines, and the possibility of emissions leakage (medium evidence, medium agreement). Such concerns about additionality are common to any emission-reduction-credit (offset) program, and are not specific to the CDM. Due to market forces, the majority of single CDM projects have been concentrated in a limited number of countries, while Programmes of Activities, though less frequent, have been more evenly distributed. In addition, the Kyoto Protocol created two other ‘flexibility mechanisms’: Joint Implementation and International Emissions Trading. {WGIII SPM.5.2, Table TS.913.7, 13.13.1.1, 14.3}

Several conceptual models for effort-sharing have been identified in research. However, realized distributional impacts from actual international cooperative agreements depend not only on the approach taken but also on criteria applied to operationalize equity and the manner in which developing countries’ emissions reduction plans are financed. {WGIII 4.6, 13.4}

Policy linkages among regional, national and sub-national climate policies offer potential climate change mitigation benefits (medium evidence, medium agreement). Linkages have been established between carbon markets and in principle could also be established between and among a heterogeneous set of policy instruments including non-market-based policies, such as performance standards. Potential advantages include lower mitigation costs, decreased emission leakage and increased market liquidity. {WGIII SPM.5.2, 13.3, 13.5, 13.6, 13.7, 14.5}

Regional initiatives between national and global scales are being developed and implemented, but their impact on global mitigation has been limited to date (medium confidence). Some climate policies could be more environmentally and economically effective if implemented across broad regions, such as by embodying mitigation objectives in trade agreements or jointly constructing infrastructures that facilitate reduction in carbon emissions. {WGIII Table TS.9, 13.13, 14.4, 14.5}

International cooperation for supporting adaptation planning and implementation has assisted in the creation of adaptation strategies, plans and actions at national, sub-national and local levels (high confidence). For example, a range of multilateral and regionally targeted funding mechanisms have been established for adaptation; UN agencies, international development organizations and non-governmental organisations (NGOs) have provided information, methodologies and guidelines; and global and regional initiatives supported and promoted the creation of national adaptation strategies in both developing and developed countries. Closer integration of disaster risk reduction and climate change adaptation at the international level, and the mainstreaming of both into international development assistance, may foster greater efficiency in the use of resources and capacity. However, stronger efforts at the international level do not necessarily lead to substantive and rapid results at the local level. {WGII 15.2, 15.3, SREX SPM, 7.4, 8.2, 8.5}

Edit

4.4.2. National and Sub-National Policies

4.4.2.1 Adaptation

Adaptation experience is accumulating across regions in the public and private sector and within communities (high confidence). Adaptation options adopted to date (see Table 4.6) emphasize incremental adjustments and co-benefits and are starting to emphasize flexibility and learning (medium evidence, medium agreement). Most assessments of adaptation have been restricted to impacts, vulnerability and adaptation planning, with very few assessing the processes of implementation or the effects of adaptation actions (medium evidence, high agreement). {WGII SPM A-2TS A-2}

Table 4.6

Edit

Table 4.6 | Recent adaptation actions in the public and private sector across regions. {WGII SPM A-2}

Region Example of actions
Africa Most national governments are initiating governance systems for adaptation. Disaster risk management, adjustments in technologies and infrastructure, ecosystem-based approaches, basic public health measures, and livelihood diversification are reducing vulnerability, although efforts to date tend to be isolated.
Europe Adaptation policy has been developed across all levels of government, with some adaptation planning integrated into coastal and water management, into environmental protection and land planning, and into disaster risk management.
Asia Adaptation is being facilitated in some areas through mainstreaming climate adaptation action into subnational development planning, early warning systems, integrated water resources management, agroforestry, and coastal reforestation of mangroves.
Australasia Planning for sea-level rise, and in southern Australia for reduced water availability, is becoming adopted widely. Planning for sea-level rise has evolved considerably over the past two decades and shows a diversity of approaches, although its implementation remains piecemeal.
North America Governments are engaging in incremental adaptation assessment and planning, particularly at the municipal level. Some proactive adaptation is occurring to protect longer-term investments in energy and public infrastructure.
Central and South America Ecosystem-based adaptation including protected areas, conservation agreements, and community management of natural areas is occurring. Resilient crop varieties, climate forecasts, and integrated water resources management are being adopted within the agricultural sector in some areas.
The Arctic Some communities have begun to deploy adaptive co-management strategies and communications infrastructure, combining traditional and scientific knowledge.
Small Islands Small islands have diverse physical and human attributes; community-based adaptation has been shown to generate larger benefits when delivered in conjunction with other development activities.
The Ocean International cooperation and marine spatial planning are starting to facilitate adaptation to climate change, with constraints from challenges of spatial scale and governance issues.


Edit

National governments play key roles in adaptation planning and implementation (robust evidence, high agreement). There has been substantial progress since the AR4 in the development of national adaptation strategies and plans. This includes National Adaptation Programmes of Action (NAPAs) by least developed countries, the National Adaptation Plan (NAP) process, and strategic frameworks for national adaptation in Organisation for Economic Co-operation and Development (OECD) countries. National governments can coordinate adaptation efforts of local and sub-national governments, for example by protecting vulnerable groups, by supporting economic diversification, and by providing information, policy and legal frameworks and financial support. {WGII SPM C-1, 15.2}

While local government and the private sector have different functions, which vary regionally, they are increasingly recognized as critical to progress in adaptation, given their roles in scaling up adaptation of communities, households and civil society and in managing risk information and financing (medium evidence, high agreement). There is a significant increase in the number of planned adaptation responses at the local level in rural and urban communities of developed and developing countries since the AR4. However, local councils and planners are often confronted by the complexity of adaptation without adequate access to guiding information or data on local vulnerabilities and potential impacts. Steps for mainstreaming adaptation into local decision-making have been identified but challenges remain in their implementation. Hence, scholars stress the important role of linkages with national and sub-national levels of government as well as partnerships among public, civic and private sectors in implementing local adaptation responses. {WGII SPM A-2SPM C-1, 14.2, 15.2}

Institutional dimensions of adaptation governance, including the integration of adaptation into planning and decision-making, play a key role in promoting the transition from planning to implementation of adaptation (robust evidence, high agreement). The most commonly emphasized institutional barriers or enablers for adaptation planning and implementation are: 1) multilevel institutional co-ordination between different political and administrative levels in society; 2) key actors, advocates and champions initiating, mainstreaming and sustaining momentum for climate adaptation; 3) horizontal interplay between sectors, actors and policies operating at similar administrative levels; 4) political dimensions in planning and implementation; and 5) coordination between formal governmental, administrative agencies and private sectors and stakeholders to increase efficiency, representation and support for climate adaptation measures. {WGII 15.2, 15.5, 16.3, Box 15-1}

Existing and emerging economic instruments can foster adaptation by providing incentives for anticipating and reducing impacts (medium confidence). Instruments include public-private finance partnerships, loans, payments for environmental services, improved resource pricing, charges and subsidies, norms and regulations and risk sharing and transfer mechanisms. Risk financing mechanisms in the public and private sector, such as insurance and risk pools, can contribute to increasing resilience, but without attention to major design challenges, they can also provide disincentives, cause market failure and decrease equity. Governments often play key roles as regulators, providers or insurers of last resort. {WGII SPM C-1}

Edit

4.4.2.2 Mitigation

There has been a considerable increase in national and sub‐national mitigation plans and strategies since AR4. In 2012, 67% of global GHG emissions4 were subject to national legislation or strategies versus 45% in 2007. However, there has not yet been a substantial deviation in global emissions from the past trend. These plans and strategies are in their early stages of development and implementation in many countries, making it difficult to assess their aggregate impact on future global emissions (medium evidence, high agreement). {WGIII SPM.5.1}

Since AR4, there has been an increased focus on policies designed to integrate multiple objectives, increase co-benefits and reduce adverse side effects (high confidence). Governments often explicitly reference co-benefits in climate and sectoral plans and strategies. {WGIII SPM.5.1}

Sector-specific policies have been more widely used than economy-wide policies (Table 4.7) (medium evidence, high agreement). Although most economic theory suggests that economy-wide policies for mitigation would be more cost-effective than sector-specific policies, administrative and political barriers may make economy-wide policies harder to design and implement than sector-specific policies. The latter may be better suited to address barriers or market failures specific to certain sectors and may be bundled in packages of complementary policies. {WGIII SPM.5.1}

In principle, mechanisms that set a carbon price, including cap and trade systems and carbon taxes, can achieve mitigation in a cost-effective way, but have been implemented with diverse effects due in part to national circumstances as well as policy design. The short-run environmental effects of cap and trade systems have been limited as a result of loose caps or caps that have not proved to be constraining (limited evidence, medium agreement). In some countries, tax-based policies specifically aimed at reducing GHG emissions—alongside technology and other policies—have helped to weaken the link between GHG emissions and gross domestic product (GDP) (high confidence). In addition, in a large group of countries, fuel taxes (although not necessarily designed for the purpose of mitigation) have had effects that are akin to sectoral carbon taxes (robust evidence, medium agreement). Revenues from carbon taxes or auctioned emission allowances are used in some countries to reduce other taxes and/or to provide transfers to low‐income groups. This illustrates the general principle that mitigation policies that raise government revenue generally have lower social costs than approaches which do not. {WGIII SPM.5.1}

Edit

Table 4.7

Edit

Table 4.7 | Sectoral Policy Instruments. {WGIII Table 15.2}

Policy Instruments Energy Transport Buildings Industry AFOLU Human Settlements and Infrastructure
Economic Instruments – Taxes (carbon taxes may be economy-wide)
  • Carbon tax (e.g. applied to electricity or fuels)
  • Fuel taxes
  • Congestion charges, vehicle registration fees, road tolls
  • Vehicle taxes
  • Carbon and/or energy taxes (either sectoral or economy-wide)
  • Carbon tax or energy tax
  • Waste disposal taxes or charges
  • Fertilizer or nitrogen taxes to reduce nitrous oxide (N2O)
  • Sprawl taxes, Impact fees, exactions, split-rate property taxes, tax increment finance, betterment taxes, congestion charges
Economic Instruments – Tradable Allowances(may be economy-wide)
  • Emission trading
  • Emission credits under the Clean Development Mechanism (CDM)
  • Tradable Green Certificates
  • Fuel and vehicle standards
  • Tradable certificates for energy efficiency improvements (white certificates) 
  • Emission trading
  • Emission credit under CDM
  • Tradable Green Certificates
  • Emission credits under CDM
  • Compliance schemes outside Kyoto protocol (national schemes)
  • Voluntary carbon markets
  • Urban-scale cap and trade
Economic Instruments – Subsidies
  • Fossil fuel subsidy removal
  • Feed in tariffs (FITs) for renewable energy
  • Biofuel subsidies
  • Vehicle purchase subsidies
  • Feebates
  • Subsidies or tax exemptions for investment in efficient buildings, retrofits and products
  • Subsidized loans
  • Subsidies (e.g., for energy audits)
  • Fiscal incentives (e.g. for fuel switching)
  • Credit lines for low-carbon agriculture, sustainable forestry.
  • Special Improvement or Redevelopment Districts
Regulatory Approaches
  • Efficiency or environmental performance standards
  • Renewable Portfolio Standards (RPS) for renewable energy (RE)
  • Equitable access to electricity grid
  • Legal status of long term CO2 storage
  • Fuel economy performance standards
  • Fuel quality standards
  • GHG emission performance standards
  • Regulatory restrictions to encourage modal shifts (road to rail)
  • Restriction on use of vehicles in certain areas
  • Environmental capacity constraints on airports
  • Urban planning and zoning restrictions
  • Building codes and standards
  • Equipment and appliance standards
  • Mandates for energy retailers to assist customers invest in energy efficiency
  • Energy efficiency standards for equipment
  • Energy management systems (also voluntary)
  • Voluntary agreements (where bound by regulation)
  • Labelling and public procurement regulations
  • National policies to support REDD+ including monitoring, reporting and verification
  • Forest laws to reduce deforestation
  • Air and water pollution control GHG precursors
  • Land-use planning and governance
  • Mixed use zoning
  • Development restrictions
  • Affordable housing mandates
  • Site access controls
  • Transfer development rights
  • Design codes
  • Building codes
  • Street codes
  • Design standards
Information Programmes  
  • Fuel labelling
  • Vehicle efficiency labelling
  • Energy audits
  • Labelling programmes
  • Energy advice programmes
  • Energy audits
  • Benchmarking
  • Brokerage for industrial cooperation
  • Certification schemes for sustainable forest practices
  • Information policies to support REDD+ including monitoring, reporting and verification
 
Government Provision of Public Goods or Services
  • Research and development
  • Infrastructure expansion (district heating/cooling or common carrier) 
  • Investment in transit and human powered transport
  • Investment in alternative fuel infrastructure
  • Low-emission vehicle procurement
  • Public procurement of efficient buildings and applicances
  • Training and education
  • Brokerage for industrial cooperation
  • Protection of national, state, local forests
  • Investment in improvment and diffusion of innovative technologies in agriculture and forestry
  • Provision of utility infrastructure, such as electricity distribution, district heating/cooling and wastewater connections, etc.
  • Park improvements
  • Trail improvements
  • Urban rail
Voluntary Actions  


  • Labelling programmes for efficient buildings
  • Product eco-labelling
  • Voluntary agreements on energy targets, adoption of energy management systems, or resource efficiency
  • Promotion of sustainability by developing standards and educational campaigns


Economic instruments in the form of subsidies may be applied across sectors, and include a variety of policy designs, such as tax rebates or exemptions, grants, loans and credit lines. An increasing number and variety of RE policies including subsidies—motivated by many factors—have driven escalated growth of RE technologies in recent years. Government policies play a crucial role in accelerating the deployment of RE technologies. Energy access and social and economic development have been the primary drivers in most developing countries whereas secure energy supply and environmental concerns have been most important in developed countries. The focus of policies is broadening from a concentration primarily on RE electricity to include RE heating and cooling and transportation. {SRREN SPM.7}

The reduction of subsidies for GHG-related activities in various sectors can achieve emission reductions, depending on the social and economic context (high confidence). While subsidies can affect emissions in many sectors, most of the recent literature has focused on subsidies for fossil fuels. Since AR4 a small but growing literature based on economy-wide models has projected that complete removal of subsidies to fossil fuels in all countries could result in reductions in global aggregate emissions by mid-century (medium evidence, medium agreement). Studies vary in methodology, the type and definition of subsidies and the time frame for phase out considered. In particular, the studies assess the impacts of complete removal of all fossil fuel subsides without seeking to assess which subsidies are wasteful and inefficient, keeping in mind national circumstances. {WGIII SPM.5.1}

Regulatory approaches and information measures are widely used and are often environmentally effective (medium evidence, medium agreement). Examples of regulatory approaches include energy efficiency standards; examples of information programmes include labelling programmes that can help consumers make better-informed decisions. {WGIII SPM.5.1}

Mitigation policy could devalue fossil fuel assets and reduce revenues for fossil fuel exporters, but differences between regions and fuels exist (high confidence). Most mitigation scenarios are associated with reduced revenues from coal and oil trade for major exporters. The effect on natural gas export revenues is more uncertain. The availability of CCS would reduce the adverse effect of mitigation on the value of fossil fuel assets (medium confidence). {WGIII SPM.5.1}

Interactions between or among mitigation policies may be synergistic or may have no additive effect on reducing emissions (medium evidence, high agreement). For instance, a carbon tax can have an additive environmental effect to policies such as subsidies for the supply of RE. By contrast, if a cap and trade system has a sufficiently stringent cap to affect emissionrelated decisions, then other policies have no further impact on reducing emissions (although they may affect costs and possibly the viability of more stringent future targets) (medium evidence, high agreement). In either case, additional policies may be needed to address market failures relating to innovation and technology diffusion. {WGIII SPM.5.1}

Sub-national climate policies are increasingly prevalent, both in countries with national policies and in those without. These policies include state and provincial climate plans combining market, regulatory and information instruments, and sub-national cap-and-trade systems. In addition, transnational cooperation has arisen among sub-national actors, notably among institutional investors, NGOs seeking to govern carbon offset markets, and networks of cities seeking to collaborate in generating low-carbon urban development. {WGIII 13.5.2, 15.2.4, 15.8}

Co-benefits and adverse side effects of mitigation could affect achievement of other objectives such as those related to human health, food security, biodiversity, local environmental quality, energy access, livelihoods and equitable sustainable development. {WGIII SPM.2}

  • Mitigation scenarios reaching about 450 or 500 ppm CO2-equivalent by 2100 show reduced costs for achieving air quality and energy security objectives, with significant co-benefits for human health, ecosystem impacts and sufficiency of resources and resilience of the energy system. {WGIII SPM.4.1}

  • Some mitigation policies raise the prices for some energy services and could hamper the ability of societies to expand access to modern energy services to underserved populations (low confidence). These potential adverse side effects can be avoided with the adoption of complementary policies such as income tax rebates or other benefit transfer mechanisms (medium confidence). The costs of achieving nearly universal access to electricity and clean fuels for cooking and heating are projected to be between USD 72 to 95 billion per year until 2030 with minimal effects on GHG emissions (limited evidence, medium agreement) and multiple benefits in health and air pollutant reduction (high confidence). {WGIII SPM.5.1}

Whether or not side effects materialize, and to what extent side effects materialize, will be case- and site-specific, and depend on local circumstances and the scale, scope and pace of implementation. Many co-benefits and adverse side effects have not been well-quantified. {WGIII SPM.4.1}

Edit

4.4.3. Technology development and transfer

Technology policy (development, diffusion and transfer) complements other mitigation policies across all scales from international to sub-national, but worldwide investment in research in support of GHG mitigation is small relative to overall public research spending (high confidence). Technology policy includes technology-push (e.g., publicly-funded R&D) and demand-pull (e.g., governmental procurement programmes). Such policies address a pervasive market failure because, in the absence of government policy such as patent protection, the invention of new technologies and practices from R&D efforts has aspects of a public good and thus tends to be under-provided by market forces alone. Technology support policies have promoted substantial innovation and diffusion of new technologies, but the cost-effectiveness of such policies is often difficult to assess. Technology policy can increase incentives for participation and compliance with international cooperative efforts, particularly in the long run. {WGIII SPM.5.1, 2.6.5, 3.11, 13.9, 13.12, 15.6.5}

Many adaptation efforts also critically rely on diffusion and transfer of technologies and management practices, but their effective use depends on a suitable institutional, regulatory, social and cultural context (high confidence). Adaptation technologies are often familiar and already applied elsewhere. However, the success of technology transfer may involve not only the provision of finance and information, but also strengthening of policy and regulatory environments and capacities to absorb, employ and improve technologies appropriate to local circumstances. {WGII 15.4}

Figure 4.4

Edit

Figure 4.4 | Change in annual investment flows from the average baseline level over the next two decades (2010 to 2029) for mitigation scenarios that stabilize concentrations (without overshoot) within the range of approximately 430-530 ppm CO2-eq by 2100. Total electricity generation (leftmost column) is the sum of renewable and nuclear energy, power plants with CCS, and fossil-fuel power plants without CCS. The vertical bars indicate the range between the minimum and maximum estimate; the horizontal bar indicates the median. The numbers in the bottom row show the total number of studies in the literature used in the assessment. Individual technologies shown are found to be used in different model scenarios in either a complementary or a synergistic way, depending largely on technology-specific assumptions and the timing and ambition level of the phase-in of global climate policies. {WGIII Figure SPM.9}

Edit

4.4.4. Investment and finance

Substantial reductions in emissions would require large changes in investment patterns (high confidence). Mitigation scenarios in which policies stabilize atmospheric concentrations (without overshoot) in the range from 430 to 530 ppm CO2-eq by 21005 lead to substantial shifts in annual investment flows during the period 2010–2029 compared to baseline scenarios. Over the next two decades (2010– 2029), annual investments in conventional fossil fuel technologies associated with the electricity supply sector are projected to decline in the scenarios by about USD 30 (2 to 166) billion (median: –20% compared to 2010) while annual investment in low carbon electricity supply (i.e., renewables, nuclear and electricity with CCS) is projected to rise in the scenarios by about USD 147 (31 to 360) billion (median: +100% compared to 2010) (limited evidence, medium agreement). In addition, annual incremental energy efficiency investments in transport, industry and buildings is projected to rise in the scenarios by about USD 336 (1 to 641) billion. Global total annual investment in the energy system is presently about USD 1,200 billion. This number includes only energy supply of electricity and heat and respective upstream and downstream activities. Energy efficiency investment or underlying sector investment is not included (Figure 4.4). {WGIII SPM.5.1, 16.2}

There is no widely agreed definition of what constitutes climate finance, but estimates of the financial flows associated with climate change mitigation and adaptation are available. See Figure 4.5 for an overview of climate finance flows. Published assessments of all current annual financial flows whose expected effect is to reduce net GHG emissions and/or to enhance resilience to climate change and climate variability show USD 343 to 385 billion per year globally (medium confidence). Out of this, total public climate finance that flowed to developing countries is estimated to be between USD 35 and 49 billion per year in 2011 and 2012 (medium confidence). Estimates of international private climate finance flowing to developing countries range from USD 10 to 72 billion per year including foreign direct investment as equity and loans in the range of USD 10 to 37 billion per year over the period of 2008–2011 (medium confidence). {WGIII SPM.5.1}

Figure 4.5

Edit

Figure 4.5 | Overview of climate finance flows. Note: Capital should be understood to include all relevant financial flows. The size of the boxes is not related to the magnitude of the financial flow. {WGIII Figure TS.40}

In many countries, the private sector plays central roles in the processes that lead to emissions as well as to mitigation and adaptation. Within appropriate enabling environments, the private sector, along with the public sector, can play an important role in financing mitigation and adaptation (medium evidence, high agreement). The share of total mitigation finance from the private sector, acknowledging data limitations, is estimated to be on average between two-thirds and three-fourths on the global level (2010–2012) (limited evidence, medium agreement). In many countries, public finance interventions by governments and international development banks encourage climate investments by the private sector and provide finance where private sector investment is limited. The quality of a country’s enabling environment includes the effectiveness of its institutions, regulations and guidelines regarding the private sector, security of property rights, credibility of policies and other factors that have a substantial impact on whether private firms invest in new technologies and infrastructures. Dedicated policy instruments and financial arrangements, for example, credit insurance, feed-in tariffs, concessional finance or rebates provide an incentive for mitigation investment by improving the return adjusted for the risk for private actors. Public-private risk reduction initiatives (such as in the context of insurance systems) and economic diversification are examples of adaptation action enabling and relying on private sector participation. {WGII SPM B-2, SPM C-1, WGIII SPM.5.1}

Financial resources for adaptation have become available more slowly than for mitigation in both developed and developing countries. Limited evidence indicates that there is a gap between global adaptation needs and the funds available for adaptation (medium confidence). Potential synergies between international finance for disaster risk management and adaptation to climate change have not yet been fully realized (high confidence). There is a need for better assessment of global adaptation costs, funding and investment. Studies estimating the global cost of adaptation are characterized by shortcomings in data, methods and coverage (high confidence). {WGII SPM C-1, 14.2, SREX SPM}

Edit

4.5. Trade-offs, synergies and integrated responses

There are many opportunities to link mitigation, adaptation and the pursuit of other societal objectives through integrated responses (high confidence). Successful implementation relies on relevant tools, suitable governance structures and enhanced capacity to respond (medium confidence).

Edit

A growing evidence base indicates close links between adaptation and mitigation, their co-benefits and adverse side effects, and recognizes sustainable development as the overarching context for climate policy (see Sections 3.5, 4.1, 4.2 and 4.3). Developing tools to address these linkages is critical to the success of climate policy in the context of sustainable development (see also Sections 4.4 and 3.5). This section presents examples of integrated responses in specific policy arenas, as well as some of the factors that promote or impede policies aimed at multiple objectives.

Increasing efforts to mitigate and adapt to climate change imply an increasing complexity of interactions, encompassing connections among human health, water, energy, land use and biodiversity (very high confidence). Mitigation can support the achievement of other societal goals, such as those related to human health, food security, environmental quality, energy access, livelihoods and sustainable development, although there can also be negative effects. Adaptation measures also have the potential to deliver mitigation co-benefits, and vice versa, and support other societal goals, though trade-offs can also arise. {WGII SPM C-1, SPM C-28.49.3-9.411.9, Box CC-WE, WGIII Table TS.3, Table TS.4, Table TS.5, Table TS.6, Table TS.7}

Integration of adaptation and mitigation into planning and decision-making can create synergies with sustainable development (high confidence). Synergies and trade-offs among mitigation and adaptation policies and policies advancing other societal goals can be substantial, although sometimes difficult to quantify especially in welfare terms (see also Section 3.5). A multi-objective approach to policy-making can help manage these synergies and trade-offs. Policies advancing multiple goals may also attract greater support. {WGII SPM C-1, SPM C-2, 20.3, WGIII 1.2.1, 3.6.3, 4.3, 4.6, 4.8, 6.6.1}

Effective integrated responses depend on suitable tools and governance structures, as well as adequate capacity (medium confidence). Managing trade-offs and synergies is challenging and requires tools to help understand interactions and support decision-making at local and regional scales. Integrated responses also depend on governance that enables coordination across scales and sectors, supported by appropriate institutions. Developing and implementing suitable tools and governance structures often requires upgrading the human and institutional capacity to design and deploy integrated responses. {WGII SPM C-1, SPM C-2, 2.2, 2.4, 15.4, 15.5, 16.3, Table 14-1, Table 16-1, WGIII TS.1, TS.3, 15.2}

An integrated approach to energy planning and implementation that explicitly assesses the potential for co-benefits and the presence of adverse side effects can capture complementarities across multiple climate, social and environmental objectives (medium confidence). There are strong interactive effects across various energy policy objectives, such as energy security, air quality, health and energy access (see Figure 3.5) and between a range of social and environmental objectives and climate mitigation objectives (see Table 4.5). An integrated approach can be assisted by tools such as cost-benefit analysis, cost-effectiveness analysis, multi-criteria analysis and expected utility theory. It also requires appropriate coordinating institutions. {WGIII Figure SPM.6, TS.1, TS.3}

Explicit consideration of interactions among water, food, energy and biological carbon sequestration plays an important role in supporting effective decisions for climate resilient pathways (medium evidence, high agreement). Both biofuel-based power generation and large-scale afforestation designed to mitigate climate change can reduce catchment run-off, which may conflict with alternative water uses for food production, human consumption or the maintenance of ecosystem function and services (see also Box 3.4). Conversely, irrigation can increase the climate resilience of food and fibre production but reduces water availability for other uses. {WGII Box CC-WE, Box TS.9}

An integrated response to urbanization provides substantial opportunities for enhanced resilience, reduced emissions and more sustainable development (medium confidence). Urban areas account for more than half of global primary energy use and energy-related CO2 emissions (medium evidence, high agreement) and contain a high proportion of the population and economic activities at risk from climate change. In rapidly growing and urbanizing regions, mitigation strategies based on spatial planning and efficient infrastructure supply can avoid the lock-in of high emission patterns. Mixed-use zoning, transport-oriented development, increased density and co-located jobs and homes can reduce direct and indirect energy use across sectors. Compact development of urban spaces and intelligent densification can preserve land carbon stocks and land for agriculture and bioenergy. Reduced energy and water consumption in urban areas through greening cities and recycling water are examples of mitigation actions with adaptation benefits. Building resilient infrastructure systems can reduce vulnerability of urban settlements and cities to coastal flooding, sea level rise and other climate-induced stresses. {WGII SPM B-2, SPM C-1, TS B-2, TS C-1, TS C-2, WGIII SPM.4.2.5, TS.3}

Edit

Footnotes

  1. See Glossary for definition of CO2-eq concentrations and emissions; also Box 3.2 for metrics to calculate the CO2 equivalence of non-CO2 emissions and their influence on sectoral abatement strategies.
  2. For comparison, the CO2-eq concentration in 2011 is estimated to be 430 ppm (uncertainty range 340 – 520 ppm).
  3. The final conclusion regarding compliance of Annex B Parties remains subject to the review process under the Kyoto Protocol as of October 2014.
  4. See Glossary for definition of CO2-eq concentrations and emissions; also Box 3.2 for metrics to calculate the CO2-equivalence of non-CO2 emissions and their influence on sectoral abatement strategies.
  5. This range comprises scenarios that reach 430 to 480 ppm CO2-eq by 2100 (likely to limit warming to 2°C above pre-industrial levels) and scenarios that reach 480 to 530 ppm CO2-eq by 2100 (without overshoot: more likely than not to limit warming to 2°C above pre-industrial levels).
]t

The IPCC is experimenting with ways to make its reports more accessible to the public and easier to navigate for different stakeholder groups. We are pleased to release this beta version of a website to present the Synthesis Report. Among other things this site makes it easy to navigate between the Synthesis Report and the underlying Working Group contributions.

Users who wish to view the original versions of the reports in their official layout, with the full high-resolution graphics, are encouraged to go to ipcc.ch/report/ar5/ or the the Working Group microsites: Working Group I, Working Group II, and Working Group III.

As this is a beta version, users are encouraged to inform the IPCC of any errors on this site in representing the official versions of the reports. Please write to ipcc-sec@wmo.int.

Referencing this report

IPCC, 2014: Climate Change 2014: Synthesis Report. Contribution of Working Groups I, II and III to the Fifth Assessment Report of the Intergovernmental Panel o Climate Change [Core Writing Team, R.K. Pachauri and L.A. Meyer (eds.)]. IPCC, Geneva, Switzerland, 151 pp. in IPCC AR5 Synthesis Report website

Disclaimer

Unless otherwise stated, the information available on this website, including text, logos, graphics, maps, images, and electronic downloads is the property of the Intergovernmental Panel on Climate Change (IPCC) and is protected by intellectual property laws.

You may freely download and copy the material contained on this website for your personal, non-commercial use, provided that the original source is properly acknowledged, without any right to resell, redistribute, compile or create derivative works therefrom.

The designations employed and the presentation of material on maps do not imply the expression of any opinion whatsoever on the part of the IPCC concerning the legal status of any country, territory, city or area or of its authorities, or concerning the delimitation of its frontiers or boundaries.

Close