
923
12
Human Settlements,
Infrastructure, and
Spatial Planning
Coordinating Lead Authors:
Karen C. Seto (USA), Shobhakar Dhakal (Nepal / Thailand)
Lead Authors:
Anthony Bigio (Italy / USA), Hilda Blanco (USA), Gian Carlo Delgado (Mexico), David Dewar (South
Africa), Luxin Huang (China), Atsushi Inaba (Japan), Arun Kansal (India), Shuaib Lwasa (Uganda),
James McMahon (USA), Daniel B. Müller (Switzerland / Norway), Jin Murakami (Japan / China),
Harini Nagendra (India), Anu Ramaswami (USA)
Contributing Authors:
Antonio Bento (Portugal / USA), Michele Betsill (USA), Harriet Bulkeley (UK), Abel Chavez
(USA / Germany), Peter Christensen (USA), Felix Creutzig (Germany), Michail Fragkias
(Greece / USA), Burak Güneralp (Turkey / USA), Leiwen Jiang (China / USA), Peter Marcotullio (USA),
David McCollum (IIASA/ USA), Adam Millard-Ball (UK / USA), Paul Pichler (Germany), Serge Salat
(France), Cecilia Tacoli (UK / Italy), Helga Weisz (Germany), Timm Zwickel (Germany)
Review Editors:
Robert Cervero (USA), Julio Torres Martinez (Cuba)
Chapter Science Assistants:
Peter Christensen (USA), Cary Simmons (USA)
This chapter should be cited as:
Seto K. C., S. Dhakal, A. Bigio, H. Blanco, G. C. Delgado, D. Dewar, L. Huang, A. Inaba, A. Kansal, S. Lwasa, J. E. McMahon,
D. B. Müller, J. Murakami, H. Nagendra, and A. Ramaswami, 2014: Human Settlements, Infrastructure and Spatial Planning.
In: Climate Change 2014: Mitigation of Climate Change. Contribution of Working Group III to the Fifth Assessment Report
of the Intergovernmental Panel on Climate Change [Edenhofer, O., R. Pichs-Madruga, Y. Sokona, E. Farahani, S. Kadner, K.
Seyboth, A. Adler, I. Baum, S. Brunner, P. Eickemeier, B. Kriemann, J. Savolainen, S. Schlömer, C. von Stechow, T. Zwickel and
J.C. Minx (eds.)]. Cambridge University Press, Cambridge, United Kingdom and New York, NY, USA.

924924
Human Settlements, Infrastructure, and Spatial Planning
12
Chapter 12
Contents
Executive Summary . . . . . . . . . . . . . . . . . . . . . . . . . . . . . . . . . . . . . . . . . . . . . . . . . . . . . . . . . . . . . . . . . . . . . . . . . . . . . . . . . . . . . . . . . . . . . . . . . . . . . . . . . . . . . . . 927
12.1 Introduction . . . . . . . . . . . . . . . . . . . . . . . . . . . . . . . . . . . . . . . . . . . . . . . . . . . . . . . . . . . . . . . . . . . . . . . . . . . . . . . . . . . . . . . . . . . . . . . . . . . . . . . . . . . 929
12.2 Human settlements and GHG emissions . . . . . . . . . . . . . . . . . . . . . . . . . . . . . . . . . . . . . . . . . . . . . . . . . . . . . . . . . . . . . . . . . . . . . . 930
12.2.1 The role of cities and urban areas in energy use and GHG emissions
. . . . . . . . . . . . . . . . . . . . . . . . . . . . . . . . . . . . . . 930
12.2.1.1 Urban population dynamics
. . . . . . . . . . . . . . . . . . . . . . . . . . . . . . . . . . . . . . . . . . . . . . . . . . . . . . . . . . . . . . . . . . . . . . . . . . . 931
12.2.1.2 Urban land use
. . . . . . . . . . . . . . . . . . . . . . . . . . . . . . . . . . . . . . . . . . . . . . . . . . . . . . . . . . . . . . . . . . . . . . . . . . . . . . . . . . . . . . . . 933
12.2.1.3 Urban economies and GDP
. . . . . . . . . . . . . . . . . . . . . . . . . . . . . . . . . . . . . . . . . . . . . . . . . . . . . . . . . . . . . . . . . . . . . . . . . . . 933
12.2.2 GHG emission estimates from human settlements
. . . . . . . . . . . . . . . . . . . . . . . . . . . . . . . . . . . . . . . . . . . . . . . . . . . . . . . . . 933
12.2.2.1 Estimates of the urban share of global emissions
. . . . . . . . . . . . . . . . . . . . . . . . . . . . . . . . . . . . . . . . . . . . . . . . . . . 935
12.2.2.2 Emissions accounting for human settlements
. . . . . . . . . . . . . . . . . . . . . . . . . . . . . . . . . . . . . . . . . . . . . . . . . . . . . . . . 936
12.2.3 Future trends in urbanization and GHG emissions from human settlements
. . . . . . . . . . . . . . . . . . . . . . . . . . . . . . 939
12.2.3.1 Dimension 1: Urban population
. . . . . . . . . . . . . . . . . . . . . . . . . . . . . . . . . . . . . . . . . . . . . . . . . . . . . . . . . . . . . . . . . . . . . . . 939
12.2.3.2 Dimension 2: Urban land cover
. . . . . . . . . . . . . . . . . . . . . . . . . . . . . . . . . . . . . . . . . . . . . . . . . . . . . . . . . . . . . . . . . . . . . . . 940
12.2.3.3 Dimension 3: GHG emissions
. . . . . . . . . . . . . . . . . . . . . . . . . . . . . . . . . . . . . . . . . . . . . . . . . . . . . . . . . . . . . . . . . . . . . . . . . 941
12.3 Urban systems: Activities, resources, and performance . . . . . . . . . . . . . . . . . . . . . . . . . . . . . . . . . . . . . . . . . . . . . . . . . . 942
12.3.1 Overview of drivers of urban GHG emissions
. . . . . . . . . . . . . . . . . . . . . . . . . . . . . . . . . . . . . . . . . . . . . . . . . . . . . . . . . . . . . . . 942
12.3.1.1 Emission drivers decomposition via IPAT
. . . . . . . . . . . . . . . . . . . . . . . . . . . . . . . . . . . . . . . . . . . . . . . . . . . . . . . . . . . . . 942
12.3.1.2 Interdependence between drivers
. . . . . . . . . . . . . . . . . . . . . . . . . . . . . . . . . . . . . . . . . . . . . . . . . . . . . . . . . . . . . . . . . . . . 944
12.3.1.3 Human settlements, linkages to sectors, and policies
. . . . . . . . . . . . . . . . . . . . . . . . . . . . . . . . . . . . . . . . . . . . . . . . 944
12.3.2 Weighing of drivers
. . . . . . . . . . . . . . . . . . . . . . . . . . . . . . . . . . . . . . . . . . . . . . . . . . . . . . . . . . . . . . . . . . . . . . . . . . . . . . . . . . . . . . . . . . 944
12.3.2.1 Qualitative weighting
. . . . . . . . . . . . . . . . . . . . . . . . . . . . . . . . . . . . . . . . . . . . . . . . . . . . . . . . . . . . . . . . . . . . . . . . . . . . . . . . . 944
12.3.2.2 Relative weighting of drivers for sectoral mitigation options
. . . . . . . . . . . . . . . . . . . . . . . . . . . . . . . . . . . . . . . . 947
12.3.2.3 Quantitative modelling to determine driver weights
. . . . . . . . . . . . . . . . . . . . . . . . . . . . . . . . . . . . . . . . . . . . . . . . . 948
12.3.2.4 Conclusions on drivers of GHG emissions at the urban scale
. . . . . . . . . . . . . . . . . . . . . . . . . . . . . . . . . . . . . . . . 948
12.3.3 Motivation for assessment of spatial planning, infrastructure, and urban form drivers
. . . . . . . . . . . . . . . . . . 949

925925
Human Settlements, Infrastructure, and Spatial Planning
12
Chapter 12
12.4 Urban form and infrastructure . . . . . . . . . . . . . . . . . . . . . . . . . . . . . . . . . . . . . . . . . . . . . . . . . . . . . . . . . . . . . . . . . . . . . . . . . . . . . . . . . . . 949
12.4.1 Infrastructure
. . . . . . . . . . . . . . . . . . . . . . . . . . . . . . . . . . . . . . . . . . . . . . . . . . . . . . . . . . . . . . . . . . . . . . . . . . . . . . . . . . . . . . . . . . . . . . . 951
12.4.2 Urban form
. . . . . . . . . . . . . . . . . . . . . . . . . . . . . . . . . . . . . . . . . . . . . . . . . . . . . . . . . . . . . . . . . . . . . . . . . . . . . . . . . . . . . . . . . . . . . . . . . . . 952
12.4.2.1 Density
. . . . . . . . . . . . . . . . . . . . . . . . . . . . . . . . . . . . . . . . . . . . . . . . . . . . . . . . . . . . . . . . . . . . . . . . . . . . . . . . . . . . . . . . . . . . . . . . 952
12.4.2.2 Land use mix
. . . . . . . . . . . . . . . . . . . . . . . . . . . . . . . . . . . . . . . . . . . . . . . . . . . . . . . . . . . . . . . . . . . . . . . . . . . . . . . . . . . . . . . . . . 955
12.4.2.3 Connectivity
. . . . . . . . . . . . . . . . . . . . . . . . . . . . . . . . . . . . . . . . . . . . . . . . . . . . . . . . . . . . . . . . . . . . . . . . . . . . . . . . . . . . . . . . . . . 956
12.4.2.4 Accessibility
. . . . . . . . . . . . . . . . . . . . . . . . . . . . . . . . . . . . . . . . . . . . . . . . . . . . . . . . . . . . . . . . . . . . . . . . . . . . . . . . . . . . . . . . . . . 956
12.4.2.5 Effects of combined options
. . . . . . . . . . . . . . . . . . . . . . . . . . . . . . . . . . . . . . . . . . . . . . . . . . . . . . . . . . . . . . . . . . . . . . . . . . 957
12.5 Spatial planning and climate change mitigation . . . . . . . . . . . . . . . . . . . . . . . . . . . . . . . . . . . . . . . . . . . . . . . . . . . . . . . . . . . 958
12.5.1 Spatial planning strategies
. . . . . . . . . . . . . . . . . . . . . . . . . . . . . . . . . . . . . . . . . . . . . . . . . . . . . . . . . . . . . . . . . . . . . . . . . . . . . . . . . . 958
12.5.1.1 Macro: Regions and metropolitan areas
. . . . . . . . . . . . . . . . . . . . . . . . . . . . . . . . . . . . . . . . . . . . . . . . . . . . . . . . . . . . . . 958
12.5.1.2 Meso: Sub-regions, corridors, and districts
. . . . . . . . . . . . . . . . . . . . . . . . . . . . . . . . . . . . . . . . . . . . . . . . . . . . . . . . . . . 960
12.5.1.3 Micro: communities, neighbourhoods, streetscapes
. . . . . . . . . . . . . . . . . . . . . . . . . . . . . . . . . . . . . . . . . . . . . . . . . . 960
12.5.2 Policy instruments
. . . . . . . . . . . . . . . . . . . . . . . . . . . . . . . . . . . . . . . . . . . . . . . . . . . . . . . . . . . . . . . . . . . . . . . . . . . . . . . . . . . . . . . . . . . 962
12.5.2.1 Land use regulations
. . . . . . . . . . . . . . . . . . . . . . . . . . . . . . . . . . . . . . . . . . . . . . . . . . . . . . . . . . . . . . . . . . . . . . . . . . . . . . . . . . 962
12.5.2.2 Land management and acquisition
. . . . . . . . . . . . . . . . . . . . . . . . . . . . . . . . . . . . . . . . . . . . . . . . . . . . . . . . . . . . . . . . . . . 963
12.5.2.3 Market-based instruments
. . . . . . . . . . . . . . . . . . . . . . . . . . . . . . . . . . . . . . . . . . . . . . . . . . . . . . . . . . . . . . . . . . . . . . . . . . . . 964
12.5.3 Integrated spatial planning and implementation
. . . . . . . . . . . . . . . . . . . . . . . . . . . . . . . . . . . . . . . . . . . . . . . . . . . . . . . . . . . 966
12.6 Governance, institutions, and finance . . . . . . . . . . . . . . . . . . . . . . . . . . . . . . . . . . . . . . . . . . . . . . . . . . . . . . . . . . . . . . . . . . . . . . . . . 966
12.6.1 Institutional and governance constraints and opportunities
. . . . . . . . . . . . . . . . . . . . . . . . . . . . . . . . . . . . . . . . . . . . . . . 966
12.6.2 Financing urban mitigation
. . . . . . . . . . . . . . . . . . . . . . . . . . . . . . . . . . . . . . . . . . . . . . . . . . . . . . . . . . . . . . . . . . . . . . . . . . . . . . . . . . 968
12.7 Urban climate mitigation: Experiences and opportunities . . . . . . . . . . . . . . . . . . . . . . . . . . . . . . . . . . . . . . . . . . . . . . 969
12.7.1 Scale of urban mitigation efforts
. . . . . . . . . . . . . . . . . . . . . . . . . . . . . . . . . . . . . . . . . . . . . . . . . . . . . . . . . . . . . . . . . . . . . . . . . . . 971
12.7.2 Targets and timetables
. . . . . . . . . . . . . . . . . . . . . . . . . . . . . . . . . . . . . . . . . . . . . . . . . . . . . . . . . . . . . . . . . . . . . . . . . . . . . . . . . . . . . . 972
12.7.3 Planned and implemented mitigation measures
. . . . . . . . . . . . . . . . . . . . . . . . . . . . . . . . . . . . . . . . . . . . . . . . . . . . . . . . . . . 973

926926
Human Settlements, Infrastructure, and Spatial Planning
12
Chapter 12
12.8 Sustainable development, co-benefits, trade-offs, and spill-over effects . . . . . . . . . . . . . . . . . . . . . . . . . . . 974
12.8.1 Urban air quality co-benefits
. . . . . . . . . . . . . . . . . . . . . . . . . . . . . . . . . . . . . . . . . . . . . . . . . . . . . . . . . . . . . . . . . . . . . . . . . . . . . . . . 975
12.8.2 Energy security side-effects for urban energy systems
. . . . . . . . . . . . . . . . . . . . . . . . . . . . . . . . . . . . . . . . . . . . . . . . . . . . . 976
12.8.3 Health and socioeconomic co-benefits
. . . . . . . . . . . . . . . . . . . . . . . . . . . . . . . . . . . . . . . . . . . . . . . . . . . . . . . . . . . . . . . . . . . . . 976
12.8.4 Co-benefits of reducing the urban heat island effect
. . . . . . . . . . . . . . . . . . . . . . . . . . . . . . . . . . . . . . . . . . . . . . . . . . . . . . 977
12.9 Gaps in knowledge and data . . . . . . . . . . . . . . . . . . . . . . . . . . . . . . . . . . . . . . . . . . . . . . . . . . . . . . . . . . . . . . . . . . . . . . . . . . . . . . . . . . . . . 977
12.10 Frequently Asked Questions . . . . . . . . . . . . . . . . . . . . . . . . . . . . . . . . . . . . . . . . . . . . . . . . . . . . . . . . . . . . . . . . . . . . . . . . . . . . . . . . . . . . . . 978
References . . . . . . . . . . . . . . . . . . . . . . . . . . . . . . . . . . . . . . . . . . . . . . . . . . . . . . . . . . . . . . . . . . . . . . . . . . . . . . . . . . . . . . . . . . . . . . . . . . . . . . . . . . . . . . . . . . . . . . . . . . 979

927927
Human Settlements, Infrastructure, and Spatial Planning
12
Chapter 12
Executive Summary
The shift from rural to more urban societies is a global trend with
significant consequences for greenhouse gas (GHG) emissions and
climate change mitigation. Across multiple dimensions, the scale and
speed of urbanization is unprecedented: more than half of the world
population live in urban areas and each week the global urban pop-
ulation increases by 1.3 million. Today there are nearly 1000 urban
agglomerations with populations of 500,000 or greater; by 2050, the
global urban population is expected to increase by between 2.5 to 3
billion, corresponding to 64 % to 69 % of the world population (robust
evidence, high agreement). Expansion of urban areas is on average
twice as fast as urban population growth, and the expected increase
in urban land cover during the first three decades of the 21st century
will be greater than the cumulative urban expansion in all of human
history (medium evidence, high agreement). Urban areas generate
around 80 % of global Gross Domestic Product (GDP) (medium evi-
dence, medium agreement). Urbanization is associated with increases
in income, and higher urban incomes are correlated with higher con-
sumption of energy use and GHG emissions (medium evidence, high
agreement) [Sections 12.1, 12.2, 12.3].
Current and future urbanization trends are significantly dif-
ferent from the past (robust evidence, high agreement). Urbaniza-
tion is taking place at lower levels of economic development and the
majority of future urban population growth will take place in small-
to medium-sized urban areas in developing countries. Expansion of
urban areas is on average twice as fast as urban population growth,
and the expected increase in urban land cover during the first three
decades of the 21st century will be greater than the cumulative urban
expansion in all of human history (robust evidence, high agreement).
[12.1, 12.2]
Urban areas account for between 71 % and 76 % of CO
2
emis-
sions from global final energy use and between 67 – 76 % of
global energy use (medium evidence, medium agreement). There
are very few studies that have examined the contribution of all urban
areas to global GHG emissions. The fraction of global CO
2
emissions
from urban areas depends on the spatial and functional boundary
definitions of urban and the choice of emissions accounting method.
Estimates for urban energy related CO
2
emissions range from 71 % for
2006 to between 53 % and 87 % (central estimate, 76 %) of CO
2
emis-
sions from global final energy use (medium evidence, medium agree-
ment). There is only one attempt in the literature that examines the
total GHG (CO
2
, CH
4
, N
2
O and SF
6
) contribution of urban areas globally,
estimated at between 37 % and 49 % of global GHG emissions for the
year 2000. Using Scope1 accounting, urban share of global CO
2
emis-
sions is about 44 % (limited evidence, medium agreement). [12.2]
No single factor explains variations in per-capita emissions
across cities, and there are significant differences in per capita
GHG emissions between cities within a single country (robust
evidence, high agreement). Urban GHG emissions are influenced by
a variety of physical, economic and social factors, development lev-
els, and urbanization histories specific to each city. Key influences on
urban GHG emissions include income, population dynamics, urban
form, locational factors, economic structure, and market failures. There
is a prevalence for cities in AnnexI countries to have lower per capita
final energy use and GHG emissions than national averages, and for
per capita final energy use and GHG emissions of cities in non-AnnexI
countries tend to be higher than national averages (robust evidence,
high agreement) [12.3].
The anticipated growth in urban population will require a mas-
sive build-up of urban infrastructure, which is a key driver of
emissions across multiple sectors (limited evidence, high agree-
ment). If the global population increases to 9.3 billion by 2050 and
developing countries expand their built environment and infrastruc-
ture to current global average levels using available technology of
today, the production of infrastructure materials alone would gener-
ate approximately 470 Gt of CO
2
emissions. Currently, average per
capita CO
2
emissions embodied in the infrastructure of industrialized
countries is five times larger than those in developing countries. The
continued expansion of fossil fuel-based infrastructure would produce
cumulative emissions of 2,986 – 7,402 GtCO
2
during the remainder of
the 21st century (limited evidence, high agreement). [12.2, 12.3]
The existing infrastructure stock of the average AnnexI resident
is three times that of the world average and about five times
higher than that of the average non-AnnexI resident (medium
evidence, medium agreement). The long life of infrastructure and the
built environment, make them particularly prone to lock-in of energy
and emissions pathways, lifestyles and consumption patterns that are
difficult to change. The committed emissions from energy and trans-
portation infrastructures are especially high, with respective ranges
of 127 – 336 and 63 – 132 Gt, respectively (medium evidence, medium
agreement). [12.3, 12.4]
Infrastructure and urban form are strongly linked, especially
among transportation infrastructure provision, travel demand
and vehicle kilometres travelled (robust evidence, high agree-
ment). In developing countries in particular, the growth of transport
infrastructure and ensuing urban forms will play important roles in
affecting long-run emissions trajectories. Urban form and structure
significantly affect direct (operational) and indirect (embodied) GHG
emissions, and are strongly linked to the throughput of materials and
energy in a city, the wastes that it generates, and system efficiencies of
a city. (robust evidence, high agreement) [12.4, 12.5]
Key urban form drivers of energy and GHG emissions are den-
sity, land use mix, connectivity, and accessibility (medium evi-
dence, high agreement). These factors are interrelated and interde-
pendent. Pursuing one of them in isolation is insufficient for lower
emissions. Connectivity and accessibility are tightly related: highly con-
nected places are accessible. While individual measures of urban form

928928
Human Settlements, Infrastructure, and Spatial Planning
12
Chapter 12
have relatively small effects on vehicle miles travelled, they become
more effective when combined. There is consistent evidence that co-
locating higher residential densities with higher employment densities,
coupled with significant public transit improvements, higher land use
mixes, and other supportive demand management measurescan lead
to greater emissions savings in the long run. Highly accessible com-
munities are typically characterized by low daily commuting distances
and travel times, enabled by multiple modes of transportation (robust
evidence, high agreement). [12.5]
Urban mitigation options vary across urbanization trajectories
and are expected to be most effective when policy instruments
are bundled (robust evidence, high agreement). For rapidly develop-
ing cities, options include shaping their urbanization and infrastructure
development towards more sustainable and low carbon pathways. In
mature or established cities, options are constrained by existing urban
forms and infrastructure and the potential for refurbishing existing sys-
tems and infrastructures. Key mitigation strategies include co-locating
high residential with high employment densities, achieving high land
use mixes, increasing accessibility and investing in public transit and
other supportive demand management measures. Bundling these
strategies can reduce emissions in the short term and generate even
higher emissions savings in the long term (robust evidence, high agree-
ment). [12.5]
Successful implementation of mitigation strategies at local
scales requires that there be in place the institutional capacity
and political will to align the right policy instruments to specific
spatial planning strategies (robust evidence, high agreement). Inte-
grated land-use and transportation planning provides the opportunity
to envision and articulate future settlement patterns, backed by zon-
ing ordinances, subdivision regulations, and capital improvements pro-
grammes to implement the vision. While smaller scale spatial planning
may not have the energy conservation or emissions reduction benefits
of larger scale ones, development tends to occur parcel by parcel and
urbanized areas are ultimately the products of thousands of individual
site-level development and design decisions (robust evidence, high
agreement). [12.5, 12.6]
The largest opportunities for future urban GHG emissions
reduction are in rapidly urbanizing areas where urban form and
infrastructure are not locked-in, but where there are often lim-
ited governance, technical, financial, and institutional capaci-
ties (robust evidence, high agreement). The bulk of future infrastruc-
ture and urban growth is expected in small- to medium-size cities in
developing countries, where these capacities are often limited or weak
(robust evidence, high agreement). [12.4, 12.5, 12.6, 12.7]
Thousands of cities are undertaking climate action plans, but
their aggregate impact on urban emissions is uncertain (robust
evidence, high agreement). Local governments and institutions pos-
sess unique opportunities to engage in urban mitigation activities
and local mitigation efforts have expanded rapidly. However, there
has been little systematic assessment regarding the overall extent to
which cities are implementing mitigation policies and emission reduc-
tion targets are being achieved, or emissions reduced. Climate action
plans include a range of measures across sectors, largely focused on
energy efficiency rather than broader land-use planning strategies and
cross-sectoral measures to reduce sprawl and promote transit-oriented
development. The majority of these targets have been developed for
Annex I countries and reflect neither their mitigation potential nor
implementation. Few targets have been established for non-Annex I
country cities, and it is in these places where reliable city-level GHG
emissions inventory may not exist (robust evidence, high agreement).
[12.6, 12.7, 12.9]
The feasibility of spatial planning instruments for climate
change mitigation is highly dependent on a city’s financial and
governance capability (robust evidence, high agreement). Drivers
of urban GHG emissions are interrelated and can be addressed by a
number of regulatory, management, and market-based instruments.
Many of these instruments are applicable to cities in both developed
and developing countries, but the degree to which they can be imple-
mented varies. In addition, each instrument varies in its potential to
generate public revenues or require government expenditures, and the
administrative scale at which it can be applied. A bundling of instru-
ments and a high level of coordination across institutions can increase
the likelihood of achieving emissions reductions and avoiding unin-
tended outcomes (robust evidence, high agreement). [12.6, 12.7]
For designing and implementing climate policies effectively,
institutional arrangements, governance mechanisms, and finan-
cial resources should be aligned with the goals of reducing
urban GHG emissions (robust evidence, high agreement). These goals
will reflect the specific challenges facing individual cities and local
governments. The following have been identified as key factors: (1)
institutional arrangements that facilitate the integration of mitigation
with other high-priority urban agendas; (2) a multilevel governance
context that empowers cities to promote urban transformations; (3)
spatial planning competencies and political will to support integrated
land-use and transportation planning; and (4) sufficient financial flows
and incentives to adequately support mitigation strategies (robust evi-
dence, high agreement). [12.6, 12.7]
Successful implementation of urban climate change mitigation
strategies can provide co-benefits (robust evidence, high agree-
ment). Urban areas throughout the world continue to struggle with
challenges, including ensuring access to energy, limiting air and water
pollution, and maintaining employment opportunities and competi-
tiveness. Action on urban-scale mitigation often depends on the ability
to relate climate change mitigation efforts to local co-benefits. The co-
benefits of local climate change mitigation can include public savings,
air quality and associated health benefits, and productivity increases
in urban centres, providing additional motivation for undertaking miti-
gation activities (robust evidence, high agreement). [12.5, 12.6, 12.7,
12.8]

929929
Human Settlements, Infrastructure, and Spatial Planning
12
Chapter 12
This assessment highlights a number of key knowledge gaps. First,
there is lack of consistent and comparable emissions data at local
scales, making it particularly challenging to assess the urban share
of global GHG emissions as well as develop urbanization typologies
and their emissions pathways. Second, there is little scientific under-
standing of the magnitude of the emissions reduction from altering
urban form, and the emissions savings from integrated infrastructure
and land use planning. Third, there is a lack of consistency and thus
comparability on local emissions accounting methods, making cross-
city comparisons of emissions or climate action plans difficult. Fourth,
there are few evaluations of urban climate action plans and their effec-
tiveness. Fifth, there is lack of scientific understanding of how cities
can prioritize mitigation strategies, local actions, investments, and pol-
icy responses that are locally relevant. Sixth, there are large uncertain-
ties about future urbanization trajectories, although urban form and
infrastructure will play large roles in determining emissions pathways.
[12.9]
12.1 Introduction
Urbanization is a global phenomenon that is transforming human
settlements. The shift from primarily rural to more urban societies is
evident through the transformation of places, populations, economies,
and the built environment. In each of these dimensions, urbanization is
unprecedented for its speed and scale: massive urbanization is a meg-
atrend of the 21st century. With disorienting speed, villages and towns
are being absorbed by, or coalescing into, larger urban conurbations
and agglomerations. This rapid transformation is occurring throughout
the world, and in many places it is accelerating.
Today, more than half of the global population is urban, compared
to only 13 % in 1900 (UN DESA, 2012). There are nearly 1,000 urban
agglomerations with populations of 500,000 or more, three-quarters
of which are in developing countries (UN DESA, 2012). By 2050, the
global urban population is expected to increase between 2.5 to 3 bil-
lion, corresponding to 64 % to 69 % of the world population (Grubler
etal., 2007; IIASA, 2009; UN DESA, 2012). Put differently, each week
the urban population is increasing by approximately 1.3 million.
Future trends in the levels, patterns, and regional variation of urban-
ization will be significantly different from those of the past. Most of
the urban population growth will take place in small- to medium-sized
urban areas. Nearly all of the future population growth will be absorbed
by urban areas in developing countries (IIASA, 2009; UN DESA, 2012).
In many developing countries, infrastructure and urban growth will be
greatest, but technical capacities are limited, and governance, finan-
cial, and economic institutional capacities are weak (Bräutigam and
Knack, 2004; Rodrik etal., 2004). The kinds of towns, cities, and urban
agglomerations that ultimately emerge over the coming decades will
have a critical impact on energy use and carbon emissions.
The Fourth Assessment Report (AR4) of the Intergovernmental Panel
on Climate Change (IPCC) did not have a chapter on human settle-
ments or urban areas. Urban areas were addressed through the lens of
individual sector chapters. Since the publication of AR4, there has been
a growing recognition of the significant contribution of urban areas to
GHG emissions, their potential role in mitigating them, and a multi-fold
increase in the corresponding scientific literature. This chapter provides
an assessment of this literature and the key mitigation options that are
available at the local level. The majority of this literature has focused
on urban areas and cities in developed countries. With the exception of
China, there are few studies on the mitigation potential or GHG emis-
sions of urban areas in developing countries. This assessment reflects
these geographic limitations in the published literature.
Urbanization is a process that involves simultaneous transitions and
transformations across multiple dimensions, including demographic, eco-
nomic, and physical changes in the landscape. Each of these dimensions
presents different indicators and definitions of urbanization. The chapter
begins with a brief discussion of the multiple dimensions and definitions
of urbanization, including implications for GHG emissions accounting,
and then continues with an assessment of historical, current, and future
trends across different dimensions of urbanization in the context of GHG
emissions (12.2). It then discusses GHG accounting approaches and
challenges specific to urban areas and human settlements.
In Section 12.3, the chapter assesses the drivers of urban GHG emis-
sions in a systemic fashion, and examines the impacts of drivers on
individuals sectors as well as the interaction and interdependence of
drivers. In this section, the relative magnitude of each driver’s impact
on urban GHG emissions is discussed both qualitatively and quantita-
tively, and provides the context for a more detailed assessment of how
urban form and infrastructure affect urban GHG emissions (12.4). Here,
the section discusses the individual urban form drivers such as density,
connectivity, and land use mix, as well as their interactions with each
other. Section 12.4 also examines the links between infrastructure and
urban form, as well as their combined and interacting effects on GHG
emissions.
Section 12.5 identifies spatial planning strategies and policy instru-
ments that can affect multiple drivers, and Section 12.6 examines
the institutional, governance, and financial requirements to imple-
ment such policies. Of particular importance with regard to mitigation
potential at the urban or local scale is a discussion of the geographic
and administrative scales for which policies are implemented, overlap-
ping, and / or in conflict. The chapter then identifies the scale and range
of mitigation actions currently planned and / or implemented by local
governments, and assesses the evidence of successful implementa-
tion of the plans, as well as barriers to further implementation (12.7).
Next, the chapter discusses major co-benefits and adverse side-effects
of mitigation at the local scale, including opportunities for sustainable
development (12.8). The chapter concludes with a discussion of the
major gaps in knowledge with respect to mitigation of climate change
in urban areas (12.9).

930930
Human Settlements, Infrastructure, and Spatial Planning
12
Chapter 12
12.2 Human settlements
and GHG emissions
This section assesses past, current, and future trends in human settle-
ments in the context of GHG emissions. It aims to provide a multi-
dimensional perspective on the scale of the urbanization process. This
section includes a discussion of the development trends of urban areas,
including population size, land use, and density. Section 12.2.1 outlines
historic urbanization dynamics in multiple dimensions as drivers of
GHG emissions. Section 12.2.2 focuses on current GHG emissions.
Finally, Section 12.2.3 assesses future scenarios of urbanization in
order to frame the GHG emissions challenges to come.
12.2.1 The role of cities and urban
areas in energy use and GHG
emissions
Worldwide, 3.3 billion people live in rural areas, the majority of whom,
about 92 %, live in rural areas in developing countries (UN DESA,
2012). In general, rural populations have lower per capita energy con-
sumption compared with urban populations in developing countries
(IEA, 2008). Globally, 32 % of the rural population lack access to elec-
tricity and other modern energy sources, compared to only 5.3 % of the
urban population (IEA, 2010). Hence, energy use and GHG emissions
from human settlements is mainly from urban areas rather than rural
areas, and the role of cities and urban areas in global climate change
has become increasingly important over time.
Box 12.1 | What is urban? The system boundary problem
Any empirical analysis of urban and rural areas, as well as human
settlements, requires clear delineation of physical boundaries.
However, it is not a trivial or unambiguous task to determine
where a city, an urban area, or human settlement physically
begins and ends. In the literature, there are a number of methods
to establish the boundaries of a city or urban area (Elliot, 1987;
Buisseret, 1998; Churchill, 2004). Three common types of boundar-
ies include:
1. Administrative boundaries, which refer to the territorial or
political boundaries of a city (Hartshorne, 1933; Aguilar and
Ward, 2003).
2. Functional boundaries, which are delineated according to
connections or interactions between areas, such as economic
activity, per capita income, or commuting zone (Brown and
Holmes, 1971; Douglass, 2000; Hidle etal., 2009).
3. Morphological boundaries, which are based on the form
or structure of land use, land cover, or the built environment.
This is the dominant approach when satellite images are used
to delineate urban areas (Benediktsson etal., 2003; Rashed
etal., 2003).
What approach is chosen will often depend on the particular
research question under consideration. The choice of the physical
boundaries can have a substantial influence on the results of the
analysis. For example, the Global Energy Assessment (GEA) (GEA,
2012) estimates global urban energy consumption between
180 – 250 EJ / yr depending on the particular choice of the physical
delineation between rural and urban areas. Similarly, depend-
ing on the choice of different administrative, morphological,
and functional boundaries, between 37 % and 86 % in buildings
and industry, and 37 % to 77 % of mobile diesel and gasoline
consumption can be attributed in urban areas (Parshall etal.,
2010). Thus any empirical evidence presented in this chapter is
dependent on the particular boundary choice made in the respec-
tive analysis.
Table 12.1 | Arithmetic growth of human settlement classes for five periods between 1950 – 2050. Number of human settlements by size class at four points in time.
Population
Average annual growth [%] Number of cities
1950 – 1970 1970 – 1990 1990 – 2010 1950 – 2010 2010 – 2050 1950 1970 1990 2010
10,000,000 and more 2.60 6.72 4.11 4.46 2.13 2 2 10 23
5,000,000 — 10,000,000 7.55 1.34 2.53 3.77 1.22 4 15 19 38
1,000,000 — 5,000,000 3.27 3.17 2.70 3.05 1.36 69 128 237 388
100,000 – 1,000,000 2.86 2.48 1.87 2.40 0.70
Not AvailableLess than 100,000 2.54 2.37 1.71 2.21 1.95
Rural 1.38 1.23 0.61 1.07 -0.50
Source: (UN DESA, 2012).

931931
Human Settlements, Infrastructure, and Spatial Planning
12
Chapter 12
Urbanization involves change across multiple dimensions and accord-
ingly is defined differently by different disciplines. Demographers
define urbanization as a demographic transition that involves a popu-
lation becoming urbanized through the increase in the urban propor-
tion of the total population (Montgomery, 2008; Dorélien etal., 2013).
Geographers and planners describe urbanization as a land change pro-
cess that includes the expansion of the urban land cover and growth in
built-up areas and infrastructure (Berry etal., 1970; Blanco etal., 2011;
Seto et al., 2011). Economists characterize urbanization as a struc-
tural shift from primary economic activities such as agriculture and
forestry to manufacturing and services (Davis and Henderson, 2003;
Henderson, 2003). Sociologists, political scientists, and other social sci-
entists describe urbanization as cultural change, including change in
social interactions and the growing complexity of political, social, and
economic institutions (Weber, 1966; Berry, 1973). The next sections
describe urbanization trends across the first three of these four dimen-
sions and point to the increasing and unprecedented speed and scale
of urbanization.
12.2.1.1 Urban population dynamics
In the absence of any other independent data source with global cover-
age, assessments of historic urban and rural population are commonly
based on statistics provided by the United Nations Department for Eco-
nomic and Social Affairs (UN DESA). The World Urbanization Prospects
is published every two years by UN DESA and provides projections of
key demographic and urbanization indicators for all countries in the
world. Even within this dataset, there is no single definition of urban
or rural areas that is uniformly applied across the data. Rather, each
country develops its own definition of urban, often based on a com-
bination of population size or density, and other criteria such as the
percentage of population not employed in agriculture; the availability
of electricity, piped water, or other infrastructure; and characteristics of
the built environment such as dwellings and built structures (UN DESA,
2012). The large variation in criteria gives rise to significant differences
in national definitions. However, the underlying variations in the data
do not seriously affect an assessment of urbanization dynamics as
long as the national definitions are sufficiently consistent over time
(GEA, 2012; UN DESA, 2012). Irrespective of definition, the underlying
assumption in all the definitions is that urban areas provide a higher
standard of living than rural areas (UN DESA, 2013). A comprehensive
assessment of urban and rural population dynamics is provided in the
Global Energy Assessment (2012). Here, only key developments are
briefly summarized.
For most of human history, the world population mostly lived in rural
areas and in small urban settlements, and growth in global urban
population occurred slowly. In 1800, when the world population was
around one billion, only 3 % of the total population lived in urban
areas and only one city — Beijing — had had a population greater than
one million (Davis, 1955; Chandler, 1987; Satterthwaite, 2007). Over
the next one hundred years, the global share of urban population
Figure 12.1 | Urban population as percentage of regional and world populations and
in absolute numbers for RC5 regions (see AnnexII.2), 1950 – 2010 Source: UN DESA
(2012).
Urban Population of Region [%]
Total Population [Billion]
Urban Population of World [%]
in 1950
from 1950 to 2010
in 1950
from 1950 to 2010
in 1950
in 2010
0 1 2 3 4 5 6 7 8
0 20 40 60 10080
0 20 40 60
LAM
MAF
ASIA
OECD-1990
EIT
World
LAM
MAF
ASIA
OECD-1990
EIT
World
LAM
MAF
ASIA
OECD-1990
EIT
932932
Human Settlements, Infrastructure, and Spatial Planning
12
Chapter 12
increased to 13 % in 1900. The second half of the 20th century expe-
rienced rapid urbanization. The proportion of world urban population
increased from 13 % in 1900, to 29 % in 1950, and to 52 % in 2011
(UN DESA, 2012). In 1960, the world reached a milestone when global
urban population surpassed one billion (UN DESA, 2012). Although it
took all previous human history to 1960 to reach one billion urban
dwellers, it took only additional 26 years to reach two billion (Seto
etal., 2010). Since then, the time interval to add an additional one
billion urban dwellers is decreasing, and by approximately 2030, the
world urban population will increase by one billion every 13 years
(Seto etal., 2010). Today, approximately 52 % of the global population,
or 3.6 billion, are estimated to live in urban areas (UN DESA, 2012).
While urbanization has been occurring in all major regions of the
world (Table 12.1) since 1950, there is great variability in urban tran-
sitions across regions and settlement types. This variability is shaped
by multiple factors, including history (Melosi, 2000), migration patterns
(Harris and Todaro, 1970; Keyfitz, 1980; Chen etal., 1998), technologi-
cal development (Tarr, 1984), culture (Wirth, 1938; Inglehart, 1997),
governance institutions (National Research Council, 2003), as well as
environmental factors such as the availability of energy (Jones, 2004;
Dredge, 2008). Together, these factors partially account for the large
variations in urbanization levels across regions.
Urbanization rates in developed regions are high, between 73 % in
Europe to 89 % in North America, compared to 45 % in Asia and 40 %
in Africa (UN DESA, 2012).The majority of urbanization in the future is
expected to take place primarily in Africa and Asia, and will occur at
lower levels of economic development than the urban transitions that
occurred in Europe and North America. While its urbanization rate is
still lower than that of Europe and the Americas, the urban population
in Asia increased by 2.3 billion between 1950 and 2010 (Figure 12.1).
Overall, urbanization has led to the growth of cities of all sizes (Figure
12.2). Although mega-cities (those with populations of 10 million or
greater) receive a lot of attention in the literature, urban population
growth has been dominated by cities of smaller sizes. About one-third
of the growth in urban population between 1950 and 2010 (1.16 bil-
lion) occurred in settlements with populations fewer than 100 thou-
sand. Currently, approximately 10 % of the 3.6 billion urban dwellers
live in mega-cities of 10 million or greater (UN DESA, 2012). Within
regions and countries, there are large variations in development lev-
els, urbanization processes, and urban transitions. While the dominant
global urbanization trend is growth, some regions are experiencing
significant urban population declines. Urban shrinkage is not a new
phenomenon, and most cities undergo cycles of growth and decline,
which is argued to correspond to waves of economic growth and reces-
sion (Kondratieff and Stolper, 1935). There are few systematic analyses
on the scale and prevalence of shrinking cities (UN-Habitat, 2008). A
recent assessment by the United Nations (UN) (UN DESA, 2012) indi-
cates that about 11 % of 3,552 cities with populations of 100,000 or
more in 2005 experienced total population declines of 10.4 million
between 1990 and 2005. These ‘shrinking cities’ are distributed glob-
ally but concentrated mainly in Eastern Europe (Bontje, 2005; Bernt,
2009) and the rust belt in the United States (Martinez-Fernandez etal.,
2012), where de-urbanization is strongly tied with de-industrialization.
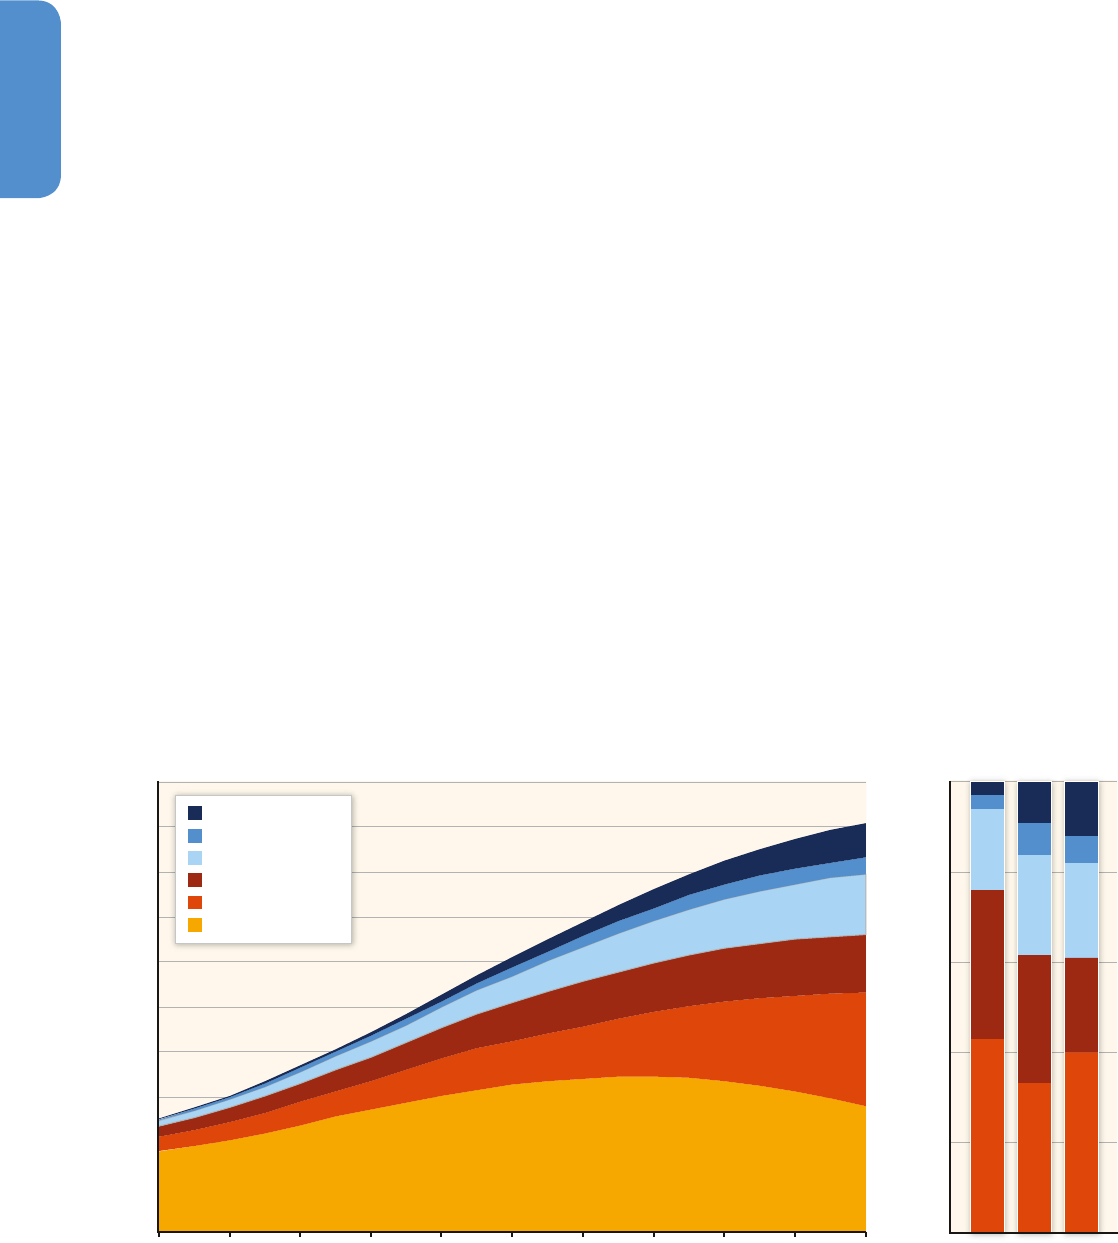
Figure 12.2 | Population by settlement size using historical (1950 – 2010) and projected data to 2050. Source: UN DESA (2010), Grubler etal. (2012). Note: rounded population
percentages displayed across size classes sum do not sum to 100 % for year 2010 due to rounding. Urbanization results in not only in growth in urban population, but also changes
in household structures and dynamics. As societies industrialize and urbanize, there is often a decline in household size, as traditional complex households become more simple and
less extended (Bongaarts, 2001; Jiang and O’Neill, 2007; O’Neill etal., 2010). This trend has been observed in Europe and North America, where household size has declined from
between four to six in the mid 1800s to between two and three today (Bongaarts, 2001).
0
20
40
60
80
100
1950 2010 2050
Total Urban Population [%]
3%
3%
18%
43%
33%
9%
7%
22%
33%
28%
12%
6%
21%
40%
21%
0
1
2
3
4
5
6
7
8
9
10
1950 1960 1970 1980 1990 2000 2010 2020 2030 2040 2050
[Billion Persons]
10 Million and more
5 to 10 Million
1 to 5 Million
100,000 to 1 Million
Less than 100,000
Rural

933933
Human Settlements, Infrastructure, and Spatial Planning
12
Chapter 12
12.2.1.2 Urban land use
Another key dimension of urbanization is the increase in built-up area
and urban land cover. Worldwide, urban land cover occupies a small
fraction of global land surface, with estimates ranging between 0.28 to
3.5 million km
2
, or between 0.2 % to 2.7 % of ice free terrestrial land
(Schneider etal., 2009). Although the urban share of global land cover
is negligible, urban land use at the local scale shows trends of declin-
ing densities and outward expansion.
Analyses of 120 global cities show significant variation in densities
across world regions, but the dominant trend is one of declining built-
up and population densities across all income levels and city sizes
(Figure 12.3) (Angel et al., 2010). For this sample of cities, built-up
area densities have declined significantly between 1990 and 2000, at
an average annual rate of 2.0± 0.4 % (Angel et al., 2010). On aver-
age, urban population densities are four times higher in low-income
countries (11,850 persons / km
2
in 2000) than in high-income countries
(2,855 persons / km
2
in 2000). Urban areas in Asia experienced the larg-
est decline in population densities during the 1990s. Urban population
densities in East Asia and Southeast Asia declined 4.9 % and 4.2 %,
respectively, between 1990 and 2000 (World Bank, 2005). These urban
population densities are still higher than those in Europe, North Amer-
ica, and Australia, where densities are on average 2,835 persons / km
2
.
As the urban transition continues in Asia and Africa, it is expected that
their urban population densities will continue to decline. Although
urban population densities are decreasing, the amount of built-up area
per person is increasing (Seto etal., 2010; Angel etal., 2011). A meta-
analysis of 326 studies using satellite data shows a minimum global
increase in urban land area of 58,000km
2
between 1970 and 2000,
or roughly 9 % of the 2000 urban extent (Seto etal., 2011). At current
rates of declining densities among developing country cities, a dou-
bling of the urban population over the next 30 years will require a tri-
pling of built-up areas (Angel etal., 2010). For a discussion on drivers
of declining densities, see Box 12.4.
12.2.1.3 Urban economies and GDP
Urban areas are engines of economic activities and growth. Further,
the transition from a largely agrarian and rural society to an industrial
and consumption-based society is largely coincident with a country’s
level of industrialization and economic development (Tisdale, 1942;
Jones, 2004), and reflects changes in the relative share of GDP by both
sector and the proportion of the labour force employed in these sectors
(Satterthwaite, 2007; World Bank, 2009). The concentration and scale
of people, activities, and resources in urban areas fosters economic
growth (Henderson etal., 1995; Fujita and Thisse, 1996; Duranton and
Puga, 2004; Puga, 2010), innovation (Feldman and Audretsch, 1999;
Bettencourt etal., 2007; Arbesman etal., 2009), and an increase of
economic and resource use efficiencies (Kahn, 2009; Glaeser and Kahn,
2010). The agglomeration economies made possible by the concentra-
tion of individuals and firms make cities ideal settings for innovation,
job, and wealth creation (Rosenthal and Strange, 2004; Carlino etal.,
2007; Knudsen etal., 2008; Puga, 2010).
A precise estimate of the contribution of all urban areas to global GDP
is not available. However, a downscaling of global GDP during the
Global Energy Assessment (Grubler etal., 2007; GEA, 2012) showed
that urban areas contribute about 80 % of global GDP. Other studies
show that urban economies generate more than 90 % of global gross
value (Gutman, 2007; United Nations, 2011). In OECD countries, more
than 80 % of the patents filed are in cities (OECD, 2006a). Not many
cities report city-level GDP but recent attempts have been made by
the Metropolitan Policy Program of the Brookings Institute, PriceWa-
terhouseCoopers (PWC), and the McKinsey Global Institute to provide
such estimates. The PWC report shows that key 27 key global cities
1
accounted for 8 % of world GDP for 2012 but only 2.5 % of the global
population (PwC and Partnership for New York City, 2012).
In a compilation by UN-Habitat, big cities are shown to have dispro-
portionately high share of national GDP compared to their population
(UN-Habitat, 2012). The importance of big cities is further underscored
in a recent report that shows that 600 cities generated 60 % of global
GDP in 2007 (McKinsey Global Institute, 2011). This same report shows
that the largest 380 cities in developed countries account for half of
the global GDP. More than 20 % of global GDP comes from 190 North
American cities alone (McKinsey Global Institute, 2011). In contrast,
the 220 largest cities in developing countries contribute to only 10 %
global of GDP, while 23 global megacities generated 14 % of global
GDP in 2007. The prevalence of economic concentration in big cities
highlights their importance but does not undermine the role of small
and medium size cities. Although top-down and bottom-up estimates
suggest a large urban contribution to global GDP, challenges remain
in estimating the size of this, given large uncertainties in the down-
scaled GDP, incomplete urban coverage, sample bias, methodological
ambiguities, and limitations of the city-based estimations in the exist-
ing studies.
12.2.2 GHG emission estimates from human
settlements
Most of the literature on human settlements and climate change is
rather recent.
2
Since AR4, there has been a considerable growth in
scientific evidence on energy consumption and GHG emissions from
human settlements. However, there are very few studies that have
examined the contribution of all urban areas to global GHG emissions.
1
Paris, Hong Kong, Sydney, San Francisco, Singapore, Toronto, Berlin, Stockholm,
London, Chicago, Los Angeles, New York, Tokyo, Abu Dhabi, Madrid, Kuala Lumpur,
Milan, Moscow, São Paulo, Beijing, Buenos Aires, Johannesburg, Mexico City,
Shanghai, Seoul, Istanbul, and Mumbai.
2
A search on the ISI Web of Science database for keywords “urban AND climate
change” for the years 1900 – 2007 yielded over 700 English language publica-
tions. The same search for the period from 2007 to present yielded nearly 2800
English language publications.
934934
Human Settlements, Infrastructure, and Spatial Planning
12
Chapter 12
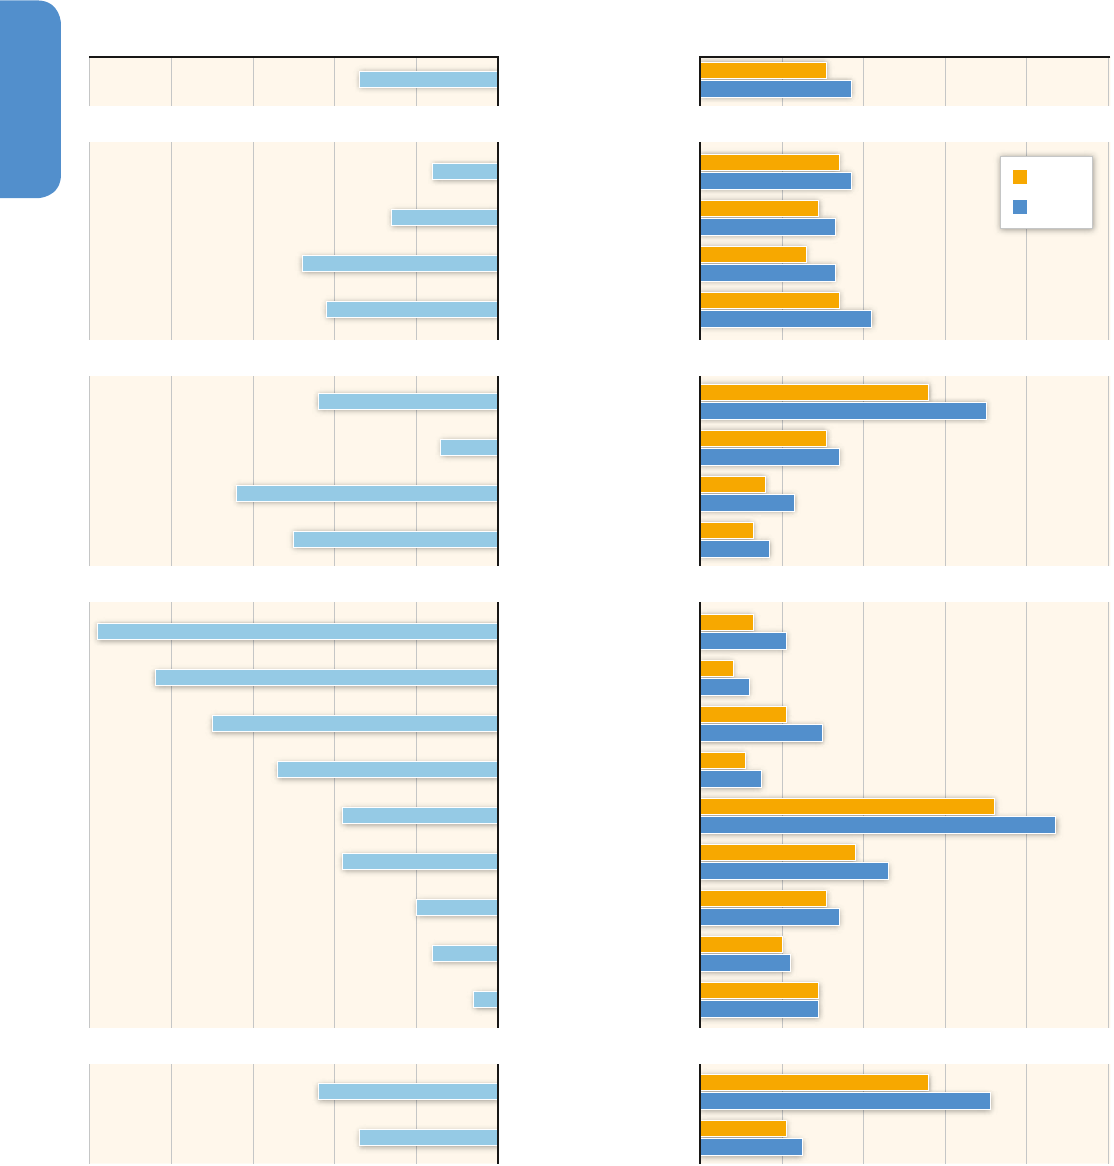
Figure 12.3 | Left: Average annual percent change in density between 1990 and 2010 (light blue). Right: Average built-up area per person (m
2
) in 1990 (yellow) and 2000 (blue).
Data from 120 cities. Source: Angel etal. (2005).
Average Annual Change in Density [%] Average Built-up Area per Person [m
2
/cap]
-5
-4 -3 -2 -1 0 0 100 200 300 400 500
Developing Countries
Industrialized Countries
Development
Latin America and
the Caribbean
Northern Africa
Western Asia
Europe
North America,
Japan, Australia
South and Central Asia
Sub-Saharan Africa
Southeast Asia
East Asia and the Pacific
Geographic
Low Income
Lower-Middle Income
Upper-Middle Income
High Income
Income
100,000-528,000
528,000-1,490,000
1,490,000-4,180,000
More than 4,180,000
City Size
Global Average
1990
2000

935935
Human Settlements, Infrastructure, and Spatial Planning
12
Chapter 12
The few studies that do exist will be discussed in Section 12.2.2.1. In
contrast, a larger number of studies have quantified GHG emissions for
individual cities and other human settlements. These will be assessed
in Section 12.2.2.2.
12.2.2.1 Estimates of the urban share of global emissions
There are very few studies that estimate the relative urban and rural
shares of global GHG emissions. One challenge is that of boundary def-
initions and delineation: it is difficult to consistently define and delin-
eate rural and urban areas globally (see Box 12.1). Another challenge is
that of severe data constraints about GHG emissions. There is no com-
prehensive statistical database on urban or rural GHG emissions. Avail-
able global estimates of urban and rural emission shares are either
derived bottom-up or top-down. Bottom-up, or up-scaling studies, use
a representative sample of estimates from regions or countries and
scale these up to develop world totals (see IEA, 2008). Top-down stud-
ies use global or national datasets and downscale these to local grid
cells. Urban and rural emissions contributions are then estimated based
on additional spatial information such as the extent of urban areas or
the location of emission point sources (GEA, 2012). In the absence of
a more substantive body of evidence, large uncertainties remain sur-
rounding the estimates and their sensitivities (Grubler etal., 2012).
The World Energy Outlook 2008 estimates urban energy related CO
2
emissions at 19.8 Gt, or 71 % of the global total for the year 2006 (IEA,
2008). This corresponds to 330 EJ of primary energy, of which urban
final energy use is estimated to be at 222 EJ. The Global Energy Assess-
ment provides a range of final urban energy use between 180 and 250
EJ with a central estimate of 240 EJ for the year 2005. This is equivalent
to an urban share between 56 % and 78 % (central estimate, 76 %) of
global final energy use. Converting the GEA estimates on urban final
energy (Grubler etal., 2012) into CO
2
emissions (see Methodology and
Metrics Annex) results in global urban energy related CO
2
emissions of
8.8 — 14.3 Gt (central estimate, 12.5Gt) which is between 53 % and
87 % (central estimate, 76 %) of CO
2
emissions from global final energy
use and between 30 % and 56 % (central estimate, 43 %) of global pri-
mary energy related CO
2
emissions (CO
2
includes flaring and cement
emissions which are small). Urban CO
2
emission estimates refer to
commercial final energy fuel use only and exclude upstream emissions
from energy conversion.
Aside from these global assessments, there is only one attempt in the
literature to estimate the total GHG (CO
2
, CH
4
, N
2
O and SF
6
) contribu-
tion of urban areas globally (Marcotullio etal., 2013). Estimates are
provided in ranges where the lower end provides an estimate of the
direct emissions from urban areas only and the higher end provides
an estimate that assigns all emissions from electricity consumption to
the consuming (urban) areas. Using this methodology, the estimated
total GHG emission contribution of all urban areas is lower than
other approaches, and ranges from 12.8 GtCO
2eq
to 16.9 GtCO
2eq
, or
between 37 % and 49 % of global GHG emissions in the year 2000.
The estimated urban share of energy related CO
2
emissions in 2000
is slightly lower than the GEA and IEA estimate, at 72 % using Scope
2 accounting and 44 % using Scope 1 accounting (see Figure 12.4).
The urban GHG emissions (CO
2
, N
2
O, CH
4
, and SF
6
) from the energy
share of total energy GHGs is between 42 % and 66 %. Hence, while
the sparse evidence available suggests that urban areas dominate final
energy consumption and associated CO
2
emissions, the contribution to
total global GHG emissions may be more modest as the large majority
of CO
2
emissions from land-use change, N
2
O emissions, and CH
4
emis-
sions take place outside urban areas.
Figure 12.4 | Estimates of urban CO
2
emissions shares of total emissions across world
regions. Grubler etal. (2012) estimates are based on estimates of final urban and total
final energy use in 2005. Marcotullio etal. (2013) estimates are based on emissions
attributed to urban areas as share of regional totals reported by EDGAR. Scope 2 emis-
sions allocate all emissions from thermal power plants to urban areas.
0 20 40 60 80 100
Urban CO
2
Emission Share by Region [%]
Total
CPA
SSA
EEU
FSU
LAM
MNA
NAM
POECD
PAS
SAS
WEU
Marcotullio et al., 2013 (Scope 1+2)
Marcotullio et al., 2013 (Scope 1)
Grübler et al., 2012

936936
Human Settlements, Infrastructure, and Spatial Planning
12
Chapter 12
Figure 12.4 shows CO
2
estimates derived from Grubler etal. (2012)
and Marcotullio etal. (2013). It highlights that there are large varia-
tions in the share of urban CO
2
emissions across world regions. For
example, urban emission shares of final energy related CO
2
emissions
range from 58 % in China and Central Pacific Asia to 86 % in North
America. Ranges are from 31 % to 57 % in South Asia, if urban final
energy related CO
2
emissions are taken relative to primary energy
related CO
2
emissions in the respective region.
Although differences in definitions make it challenging to compare
across regional studies, there is consistent evidence that large varia-
tions exist (Parshall etal., 2010; Marcotullio etal., 2011, 2012). For
example, the International Energy Agency (IEA) (2008) estimates of the
urban primary energy related CO
2
emission shares are 69 % for the EU
(69 % for primary energy), 80 % for the United States (85 % for primary
energy, see also (Parshall etal., 2010), and 86 % for China (75 % for
primary energy, see also Dhakal, 2009). Marcotullio etal. (2013) high-
light that non-energy related sectors can lead to substantially different
urban emissions shares under consideration of a broader selection of
greenhouse gases (CO
2
, CH
4
, N
2
O, SF
6
). For example, while Africa tends
to have a high urban CO
2
emissions share (64 % – 74 %) in terms of
energy related CO
2
emissions, the overall contribution of urban areas
across all sectors and gases is estimated to range between 21 % and
30 % of all emissions (Marcotullio etal., 2013).
12.2.2.2 Emissions accounting for human settlements
Whereas the previous section discussed the urban proportion of total
global emissions, this section assesses emissions accounting meth-
ods for human settlements. A variety of emission estimates have
been published by different research groups in the scientific literature
(e. g.,Ramaswami et al., 2008; Kennedy et al., 2009, 2011; Dhakal,
2009; World Bank, 2010; Hillman and Ramaswami, 2010; Glaeser and
Kahn, 2010; Sovacool and Brown, 2010; Heinonen and Junnila, 2011a,
c; Hoornweg et al., 2011; Chavez and Ramaswami, 2011; Chavez
etal., 2012; Grubler etal., 2012; Yu etal., 2012; Chong etal., 2012).
The estimates of GHG emissions and energy consumption for human
settlements are very diverse. Comparable estimates are usually only
available across small samples of human settlements, which currently
limit the insights that can be gained from an assessment of these esti-
mates. The limited number of comparable estimates is rooted in the
absence of commonly accepted GHG accounting standards and a lack
of transparency over data availabilities, as well as choices that have
been made in the compilation of particular estimates:
• Choice of physical urban boundaries. Human settlements are
open systems with porous boundaries. Depending on how physi-
cal boundaries are defined, estimates of energy consumption and
GHG emissions can vary significantly (see Box 12.1).
• Choice of accounting approach / reporting scopes. There is
widespread acknowledgement in the literature for the need to
report beyond the direct GHG emissions released from within a
settlement’s territory. Complementary accounting approaches
have therefore been proposed to characterize different aspects of
the GHG performance of human settlements (see Box 12.2). Cit-
ies and other human settlements are increasingly adopting dual
approaches (Baynes et al., 2011; Ramaswami et al., 2011; ICLEI
etal., 2012; Carbon Disclosure Project, 2013; Chavez and Ramas-
wami, 2013).
• Choice of calculation methods. There are differences in the
methods used for calculating emissions, including differences in
emission factors used, methods for imputing missing data, and
methods for calculating indirect emissions (Heijungs and Suh, 2010;
Ibrahim etal., 2012).
A number of organizations have started working towards standardiza-
tion protocols for emissions accounting (Carney et al., 2009; ICLEI,
2009; Covenant of Mayors, 2010; UNEP etal., 2010; Arikan, 2011). Fur-
ther progress has been achieved recently when several key efforts
joined forces to create a more broadly supported reporting framework
(ICLEI et al., 2012). Ibrahim et al. (2012) show that the differences
across reporting standards explains significant cross-sectional variabil-
ity in reported emission estimates. However, while high degrees of
cross-sectional comparability are crucial in order to gain further insight
into the emission patterns of human settlements across the world,
many applications at the settlement level do not require this. Cities
and other localities often compile these data to track their own perfor-
mance in reducing energy consumption and / or greenhouse gas emis-
sions (see Section 12.7). This makes a substantial body of evidence dif-
ficult to use for scientific inquiries.
Beyond the restricted comparability of the available GHG estimates,
six other limitations of the available literature remain. First, the growth
in publications is restricted to the analysis of energy consumption and
GHG emissions from a limited set of comparable emission estimates.
New estimates do not emerge at the same pace. Second, available
evidence is particularly scarce for medium and small cities as well as
rural settlements (Grubler etal., 2012). Third, there is a regional bias
in the evidence. Most studies focus on emissions from cities in devel-
oped countries with limited evidence from a few large cities in the
developing world (Kennedy etal., 2009, 2011; Hoornweg etal., 2011;
Sugar etal., 2012). Much of the most recent literature provides Chi-
nese evidence (Dhakal, 2009; Ru etal., 2010; Chun etal., 2011; Wang
etal., 2012a, b; Chong etal., 2012; Yu etal., 2012; Guo etal., 2013;
Lin etal., 2013; Vause etal., 2013; Lu etal., 2013), but only limited
new emission estimates are emerging from that. Evidence on human
settlements in least developed countries is almost non-existent with
some notable exceptions in the non peer-reviewed literature (Lwasa,
2013). Fourth, most of the available emission estimates are focus-
ing on energy related CO
2
rather than all GHG emissions. Fifth, while
there is a considerable amount of evidence for territorial emissions,
studies that include Scope 2 and 3 emission components are grow-
ing but remain limited (Ramaswami etal., 2008, 2012b; Kennedy etal.,
Box 12.2 | Emission accounting at the local scale
Three broad approaches have emerged for GHG emissions
accounting for human settlements, each of which uses different
boundaries and units of analysis.
1) Territorial or production-based emissions accounting
includes all GHG emissions from activities within a city or settle-
ment’s territory (see Box 12.1). This is also referred to as Scope
1 accounting (Kennedy etal., 2010; ICLEI etal., 2012). Territo-
rial emissions accounting is, for example, commonly applied by
national statistical offices and used by countries under the United
Nations Framework Convention on Climate Change (UNFCCC) for
emission reporting (Ganson, 2008; DeShazo and Matute, 2012;
ICLEI etal., 2012).
However, human settlements are typically smaller than the
infrastructure in which they are embedded, and important emis-
sion sources may therefore be located outside the city’s territorial
boundary. Moreover, human settlements trade goods and services
that are often produced in one settlement but are consumed else-
where, thus creating GHG emissions at different geographic loca-
tions associated with the production process of these consumable
items. Two further approaches have thus been developed in the
literature, as noted below.
2) Territorial plus supply chain accounting approaches start
with territorial emissions and then add a well defined set of
indirect emissions which take place outside the settlement’s ter-
ritory. These include indirect emissions from (1) the consumption
of purchased electricity, heat and steam (Scope 2 emissions), and
(2) any other activity (Scope 3 emissions). The simplest and most
frequently used territorial plus supply chain accounting approach
includes Scope 2 emissions (Hillman and Ramaswami, 2010; Ken-
nedy etal., 2010; Baynes etal., 2011; ICLEI etal., 2012).
3) Consumption-based accounting approaches include all
direct and indirect emissions from final consumption activities
associated with the settlement, which usually include consump-
tion by residents and government (Larsen and Hertwich, 2009,
2010a, b; Heinonen and Junnila, 2011a, b; Jones and Kammen,
2011; Minx etal., 2013). This approach excludes all emissions
from the production of exports in the settlement territory and
includes all indirect emissions occurring outside the settlement
territory in the production of the final consumption items.

937937
Human Settlements, Infrastructure, and Spatial Planning
12
Chapter 12
2009; Larsen and Hertwich, 2009, 2010a, b; Hillman and Ramaswami,
2010; White et al., 2010; Petsch et al., 2011; Heinonen and Junnila,
2011a, b; Heinonen etal., 2011; Chavez etal., 2012; Paloheimo and
Salmi, 2013; Minx etal., 2013). Finally, the comparability of available
evidence of GHG emissions at the city scale is usually restricted across
studies. There prevails marked differences in terms of the accounting
methods, scope of covered sectors, sector definition, greenhouse gas
covered, and data sources used (Bader and Bleischwitz, 2009; Kennedy
etal., 2010; Chavez and Ramaswami, 2011; Grubler etal., 2012; Ibra-
him etal., 2012).
Across cities, existing studies point to a large variation in the magni-
tude of total and per capita emissions. For this assessment, emission
estimates for several hundred individual cities were reviewed. Reported
emission estimates for cities and other human settlements in the lit-
erature range from 0.5 tCO
2
/ cap to more than 190 tCO
2
/ cap (Carney
etal., 2009; Kennedy etal., 2009; Dhakal, 2009; Heinonen and Junnila,
2011a, c; Wright etal., 2011; Sugar etal., 2012; Ibrahim etal., 2012;
Ramaswami etal., 2012b; Carbon Disclosure Project, 2013; Chavez and
Ramaswami, 2013; Department of Energy & Climate Change, 2013).
Local emission inventories in the UK for 2005 – 2011 show that end
use activities and industrial processes of both rural and urban localities
vary from below 3 to 190 tCO
2
/ cap and more (Department of Energy &
Climate Change, 2013). The total CO
2
emissions from end use activities
for ten global cities range (reference year ranges 2003 – 2006) between
4.2 and 21.5 tCO
2
eq / cap (Kennedy etal., 2009; Sugar et al., 2012),
while there is variation reported in GHG estimates from 18 European
city regions from 3.5 to 30 tCO
2
eq / cap in 2005 (Carney etal., 2009).
In many cases, a large part of the observed variability will be related to
the underlying drivers of emissions such as urban economic structures
(balance of manufacturing versus service sector), local climate and
geography, stage of economic development, energy mix, state of pub-
lic transport, urban form and density, and many others (Carney etal.,
2009; Kennedy et al., 2009, 2011; Dhakal, 2009, 2010; Glaeser and
Kahn, 2010; Shrestha and Rajbhandari, 2010; Gomi etal., 2010; Par-
shall etal., 2010; Rosenzweig etal., 2011; Sugar etal., 2012; Grubler
etal., 2012; Wiedenhofer etal., 2013). Normalizing aggregate city-level
emissions by population therefore does not necessarily result in robust
cross-city comparisons, since each city’s economic function, trade
typology, and imports-exports balance can differ widely. Hence, using
different emissions accounting methods can lead to substantial differ-
ences in reported emissions (see Figure 12.4). Therefore, understand-
ing differences in accounting approaches is essential in order to draw
meaningful conclusions from cross-city comparisons of emissions.
Evidence from developed countries such as the United States, Fin-
land, or the United Kingdom suggests that consumption-based
emission estimates for cities and other human settlements tend to
be higher than their territorial emissions. However, in some cases,
report beyond the direct GHG emissions released from within a
settlement’s territory. Complementary accounting approaches
have therefore been proposed to characterize different aspects of
the GHG performance of human settlements (see Box 12.2). Cit-
ies and other human settlements are increasingly adopting dual
approaches (Baynes et al., 2011; Ramaswami et al., 2011; ICLEI
etal., 2012; Carbon Disclosure Project, 2013; Chavez and Ramas-
wami, 2013).
• Choice of calculation methods. There are differences in the
methods used for calculating emissions, including differences in
emission factors used, methods for imputing missing data, and
methods for calculating indirect emissions (Heijungs and Suh, 2010;
Ibrahim etal., 2012).
A number of organizations have started working towards standardiza-
tion protocols for emissions accounting (Carney et al., 2009; ICLEI,
2009; Covenant of Mayors, 2010; UNEP etal., 2010; Arikan, 2011). Fur-
ther progress has been achieved recently when several key efforts
joined forces to create a more broadly supported reporting framework
(ICLEI et al., 2012). Ibrahim et al. (2012) show that the differences
across reporting standards explains significant cross-sectional variabil-
ity in reported emission estimates. However, while high degrees of
cross-sectional comparability are crucial in order to gain further insight
into the emission patterns of human settlements across the world,
many applications at the settlement level do not require this. Cities
and other localities often compile these data to track their own perfor-
mance in reducing energy consumption and / or greenhouse gas emis-
sions (see Section 12.7). This makes a substantial body of evidence dif-
ficult to use for scientific inquiries.
Beyond the restricted comparability of the available GHG estimates,
six other limitations of the available literature remain. First, the growth
in publications is restricted to the analysis of energy consumption and
GHG emissions from a limited set of comparable emission estimates.
New estimates do not emerge at the same pace. Second, available
evidence is particularly scarce for medium and small cities as well as
rural settlements (Grubler etal., 2012). Third, there is a regional bias
in the evidence. Most studies focus on emissions from cities in devel-
oped countries with limited evidence from a few large cities in the
developing world (Kennedy etal., 2009, 2011; Hoornweg etal., 2011;
Sugar etal., 2012). Much of the most recent literature provides Chi-
nese evidence (Dhakal, 2009; Ru etal., 2010; Chun etal., 2011; Wang
etal., 2012a, b; Chong etal., 2012; Yu etal., 2012; Guo etal., 2013;
Lin etal., 2013; Vause etal., 2013; Lu etal., 2013), but only limited
new emission estimates are emerging from that. Evidence on human
settlements in least developed countries is almost non-existent with
some notable exceptions in the non peer-reviewed literature (Lwasa,
2013). Fourth, most of the available emission estimates are focus-
ing on energy related CO
2
rather than all GHG emissions. Fifth, while
there is a considerable amount of evidence for territorial emissions,
studies that include Scope 2 and 3 emission components are grow-
ing but remain limited (Ramaswami etal., 2008, 2012b; Kennedy etal.,
Box 12.2 | Emission accounting at the local scale
Three broad approaches have emerged for GHG emissions
accounting for human settlements, each of which uses different
boundaries and units of analysis.
1) Territorial or production-based emissions accounting
includes all GHG emissions from activities within a city or settle-
ment’s territory (see Box 12.1). This is also referred to as Scope
1 accounting (Kennedy etal., 2010; ICLEI etal., 2012). Territo-
rial emissions accounting is, for example, commonly applied by
national statistical offices and used by countries under the United
Nations Framework Convention on Climate Change (UNFCCC) for
emission reporting (Ganson, 2008; DeShazo and Matute, 2012;
ICLEI etal., 2012).
However, human settlements are typically smaller than the
infrastructure in which they are embedded, and important emis-
sion sources may therefore be located outside the city’s territorial
boundary. Moreover, human settlements trade goods and services
that are often produced in one settlement but are consumed else-
where, thus creating GHG emissions at different geographic loca-
tions associated with the production process of these consumable
items. Two further approaches have thus been developed in the
literature, as noted below.
2) Territorial plus supply chain accounting approaches start
with territorial emissions and then add a well defined set of
indirect emissions which take place outside the settlement’s ter-
ritory. These include indirect emissions from (1) the consumption
of purchased electricity, heat and steam (Scope 2 emissions), and
(2) any other activity (Scope 3 emissions). The simplest and most
frequently used territorial plus supply chain accounting approach
includes Scope 2 emissions (Hillman and Ramaswami, 2010; Ken-
nedy etal., 2010; Baynes etal., 2011; ICLEI etal., 2012).
3) Consumption-based accounting approaches include all
direct and indirect emissions from final consumption activities
associated with the settlement, which usually include consump-
tion by residents and government (Larsen and Hertwich, 2009,
2010a, b; Heinonen and Junnila, 2011a, b; Jones and Kammen,
2011; Minx etal., 2013). This approach excludes all emissions
from the production of exports in the settlement territory and
includes all indirect emissions occurring outside the settlement
territory in the production of the final consumption items.
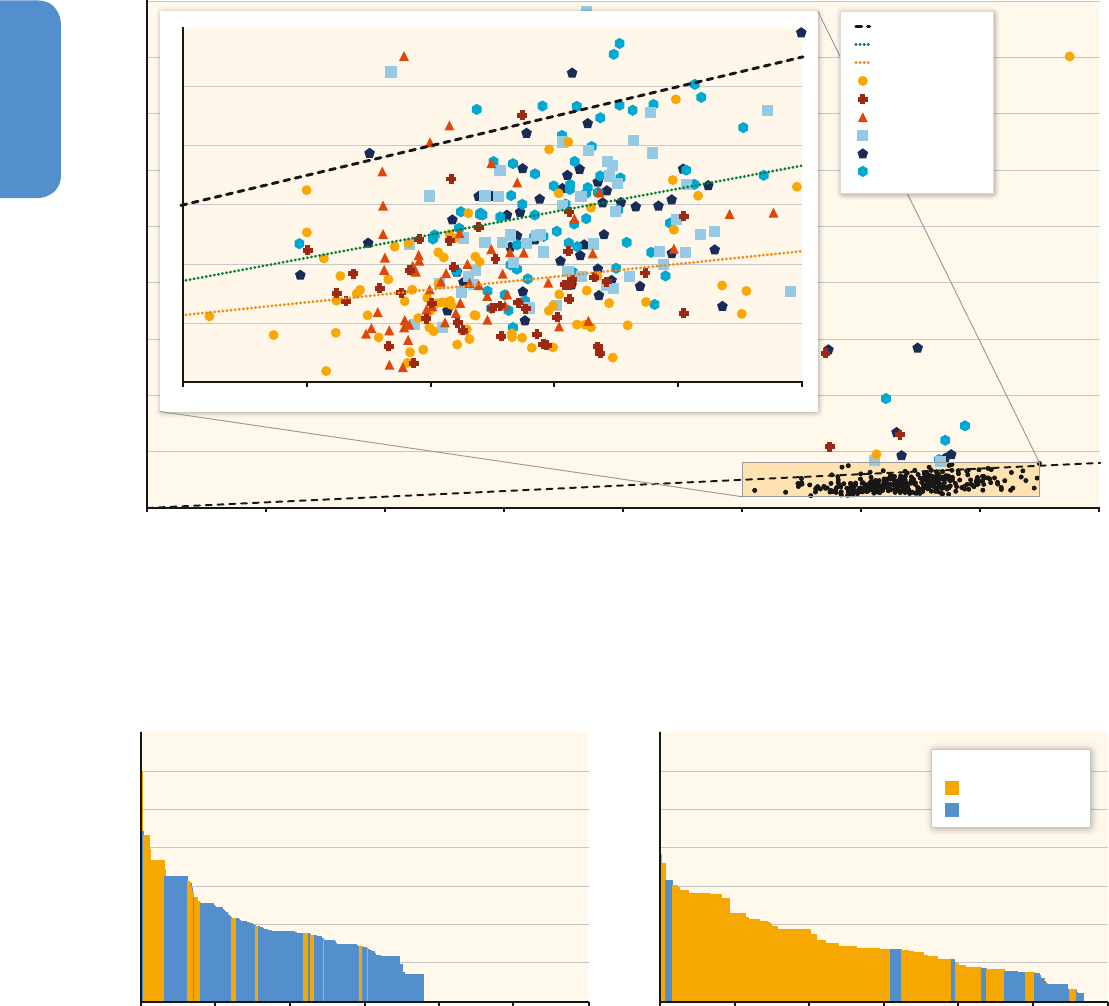
938938
Human Settlements, Infrastructure, and Spatial Planning
12
Chapter 12
2009; Aumnad, 2010; Kennedy et al., 2010; Sovacool and Brown,
2010). Moreover, the literature suggests that differences in per capita
energy consumption and CO
2
emission patterns of cities in AnnexI
and non-AnnexI countries have converged more than their national
emissions (Sovacool and Brown, 2010; Sugar etal., 2012). For con-
sumption-based CO
2
emissions, initial evidence suggests that urban
areas tend to have much higher emissions than rural areas in non-
AnnexI countries, but the evidence is limited to a few studies on
India and China (Parikh and Shukla, 1995; Guan etal., 2008, 2009;
Pachauri and Jiang, 2008; Minx etal., 2011). For AnnexI countries,
studies suggest that using consumption based CO
2
emission account-
ing, urban areas can, but do not always, have higher emissions than
rural settlements (Lenzen etal., 2006; Heinonen and Junnila, 2011c;
Minx etal., 2013).
There are only a few downscaled estimates of CO
2
emissions from
human settlements and urban as well as rural areas, mostly at
regional and national scales for the EU, United States, China, and
India (Parshall etal., 2010; Raupach etal., 2010; Marcotullio etal.,
2011, 2012; Gurney etal., 2012). However, these studies provide little
to no representation of intra-urban features and therefore cannot
be substitutes for place-based emission studies from cities. Recent
studies have begun to combine downscaled estimates of CO
2
emis-
sions with local urban energy consumption information to gener-
ate fine-scale maps of urban emissions (see Figure 12.7 and Gurney
Figure 12.6 | Per capita (direct) total final consumption (TFC) of energy (GJ) versus cumulative population (millions) in urban areas. Source: Grubler etal. (2012).
Below National Average
Above National Average
Per Capita Final Energy
Annex-I Non-Annex-I
Cumulative Population [Million Persons]
0 50 100 150 200 250 300
Total Final Consumption [GJ/Capita]
50
100
150
200
250
300
Cumulative Population [Million Persons]
0 50 100 150 200 250 300
Total Final Consumption [GJ/Capita]
50
100
150
200
250
300
0
0
n=68n=132
Figure 12.7 | Total fossil fuel emissions of Marion County, Indiana, USA, for the year 2002. Left map: Top-down view with numbered zones. Right four panels: Blow ups of num-
bered zones. Box height units: Linear. Source: Gurney etal. (2012).
3
3
1
2
4
4
1
2
0.015 230,000 3,600,00015,000920593.70.24
0 5 10 15 20 25 30 km
[tCO
2
/yr]
territorial or extended territorial emission estimates (Scope 1 and
Scope 2 emissions) can be substantially higher. This is mainly due to
the large fluctuations in territorial emission estimates that are highly
dependent on a city’s economic structure and trade typology. Con-
sumption-based estimates tend to be more homogenous (see Figure
12.5).
Based on a global sample of 198 cities by the Global Energy Assess-
ment, Grubler et al. (2012) found that two out of three cities in
Annex I countries have a lower per capita final energy use than
national levels. In contrast, per capita final energy use for more than
two out of three cities in non-Annex I countries have higher than
national averages (see Figure 12.6). There is not sufficient compara-
ble evidence available for this assessment to confirm this finding for
energy related CO
2
emissions, but this pattern is suggested by the
close relationship between final energy use and energy related CO
2
emissions. Individual studies for 35 cities in China, Bangkok, and 10
global cities provide additional evidence of these trends (Dhakal,
Figure 12.5 | Extended territorial and consumption-based per capita CO
2
emissions for 354 urban (yellow / orange / red) and rural (blue) municipalities in England in 2004. The
extended territorial CO
2
emissions accounts assign CO
2
emissions from electricity consumption to each municipality’s energy use. The consumption-based carbon footprint accounts
assign all emissions from the production of goods and services in the global supply chain to the municipality where final consumption takes place. At the 45° line, per capita
extended territorial and consumption-based CO
2
emissions are of equal size. Below the 45° line, consumption-based CO
2
emission estimates are larger than extended territorial
emissions. Above the 45° line, estimates of extended territorial CO
2
emissions are larger than consumption-based CO
2
emissions. Robust regression lines are shown for the rural
(blue) and urban (yellow / orange / red) sub-samples. In the inset, the x-axis shows 10 – 15 tonnes of CO
2
emissions per capita and the y-axis shows 4 – 16 tonnes of CO
2
emissions
per capita. Source: Minx etal. (2013).
4
6
8
10
12
14
16
Extended Territorial CO
2
Emissions [tCO
2
/cap/yr]
0
161412108640 2
20
40
60
80
100
120
140
160
180
Consumption-Based Carbon Footprint [tCO
2
/cap/yr]
151413121110
Regression Urban
Regression Rural
45° Line
Rural-80 (6)
Rural-50 (5)
Significant Rural (4)
Other Urban (3)
Large Urban (2)
Major Urban (1)
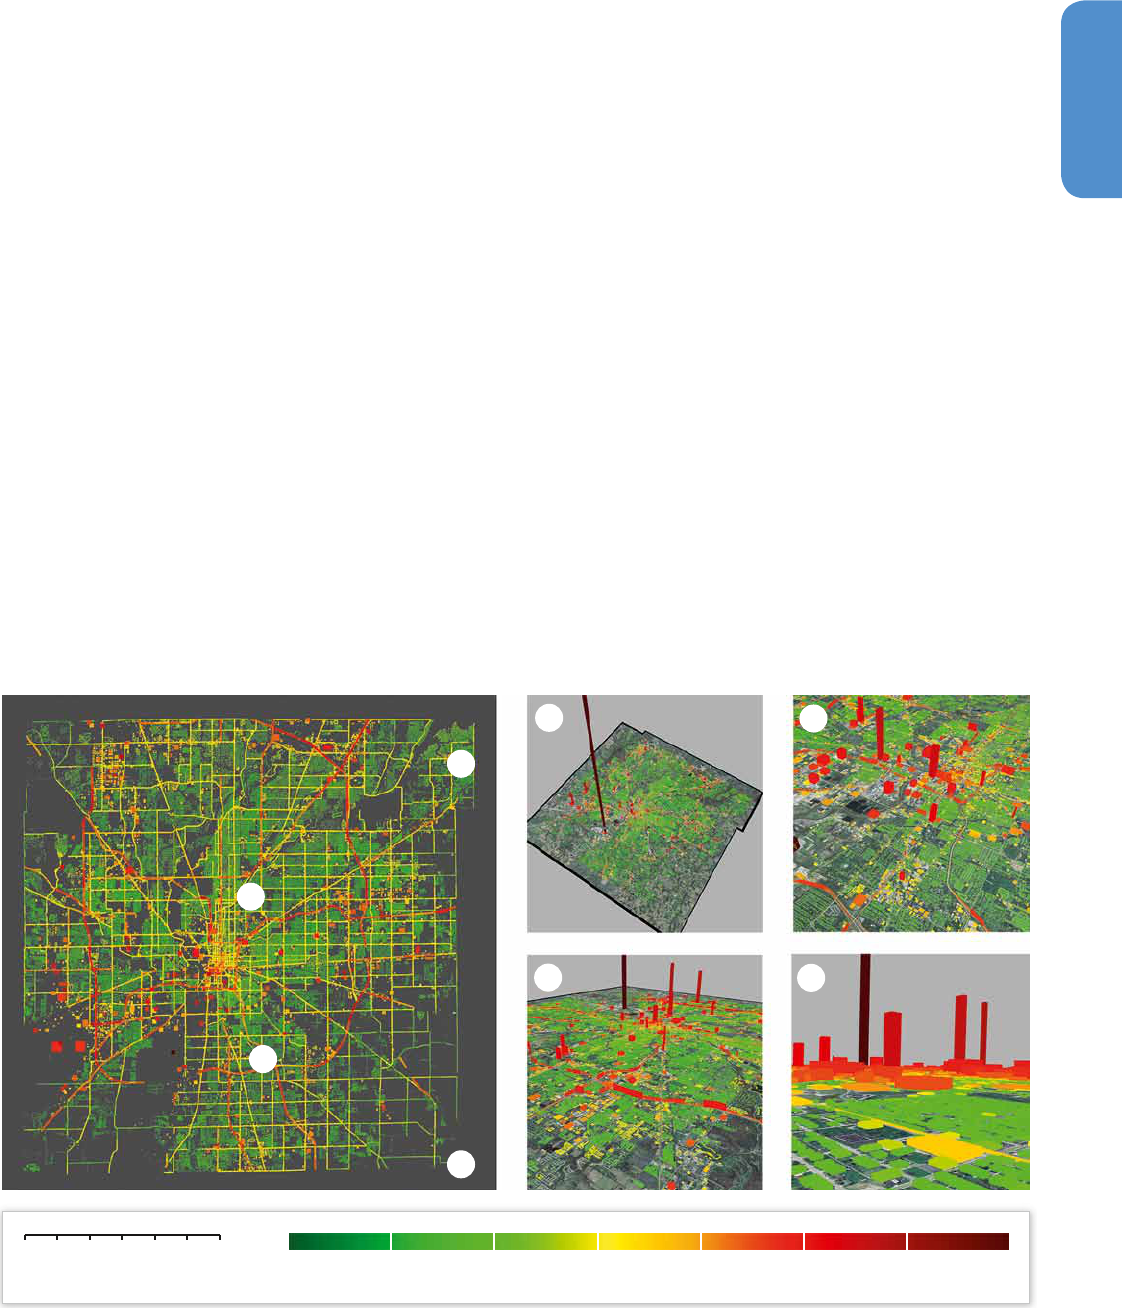
939939
Human Settlements, Infrastructure, and Spatial Planning
12
Chapter 12
2009; Aumnad, 2010; Kennedy et al., 2010; Sovacool and Brown,
2010). Moreover, the literature suggests that differences in per capita
energy consumption and CO
2
emission patterns of cities in AnnexI
and non-AnnexI countries have converged more than their national
emissions (Sovacool and Brown, 2010; Sugar etal., 2012). For con-
sumption-based CO
2
emissions, initial evidence suggests that urban
areas tend to have much higher emissions than rural areas in non-
AnnexI countries, but the evidence is limited to a few studies on
India and China (Parikh and Shukla, 1995; Guan etal., 2008, 2009;
Pachauri and Jiang, 2008; Minx etal., 2011). For AnnexI countries,
studies suggest that using consumption based CO
2
emission account-
ing, urban areas can, but do not always, have higher emissions than
rural settlements (Lenzen etal., 2006; Heinonen and Junnila, 2011c;
Minx etal., 2013).
There are only a few downscaled estimates of CO
2
emissions from
human settlements and urban as well as rural areas, mostly at
regional and national scales for the EU, United States, China, and
India (Parshall etal., 2010; Raupach etal., 2010; Marcotullio etal.,
2011, 2012; Gurney etal., 2012). However, these studies provide little
to no representation of intra-urban features and therefore cannot
be substitutes for place-based emission studies from cities. Recent
studies have begun to combine downscaled estimates of CO
2
emis-
sions with local urban energy consumption information to gener-
ate fine-scale maps of urban emissions (see Figure 12.7 and Gurney
et al., 2012). Similarly, geographic-demographic approaches have
been used for downscaling consumption-based estimates (Druckman
and Jackson, 2008; Minx etal., 2013). Such studies may allow more
detailed analyses of the drivers of urban energy consumption and
emissions in the future.
12.2.3 Future trends in urbanization and GHG
emissions from human settlements
This section addresses two issues concerning future scenarios of
urbanization. It summarizes projected future urbanization dynamics in
multiple dimensions. It assesses and contextualizes scenarios of urban
population growth, urban expansion, and urban emissions.
12.2.3.1 Dimension 1: Urban population
Worldwide, populations will increasingly live in urban settlements. By
the middle of the century, the global urban population is expected
to reach between 5.6 to 7.1 billion, with trends growth varying sub-
stantially across regions (Table 12.2). While highly urbanized North
America, Europe, Oceania, and Latin America will continue to urbanize,
the increase in urbanization levels in these regions is relatively small.
Urbanization will be much more significant in Asia and Africa where
Figure 12.6 | Per capita (direct) total final consumption (TFC) of energy (GJ) versus cumulative population (millions) in urban areas. Source: Grubler etal. (2012).
Below National Average
Above National Average
Per Capita Final Energy
Annex-I Non-Annex-I
Cumulative Population [Million Persons]
0 50 100 150 200 250 300
Total Final Consumption [GJ/Capita]
50
100
150
200
250
300
Cumulative Population [Million Persons]
0 50 100 150 200 250 300
Total Final Consumption [GJ/Capita]
50
100
150
200
250
300
0
0
n=68n=132
Figure 12.7 | Total fossil fuel emissions of Marion County, Indiana, USA, for the year 2002. Left map: Top-down view with numbered zones. Right four panels: Blow ups of num-
bered zones. Box height units: Linear. Source: Gurney etal. (2012).
3
3
1
2
4
4
1
2
0.015 230,000 3,600,00015,000920593.70.24
0 5 10 15 20 25 30 km
[tCO
2
/yr]
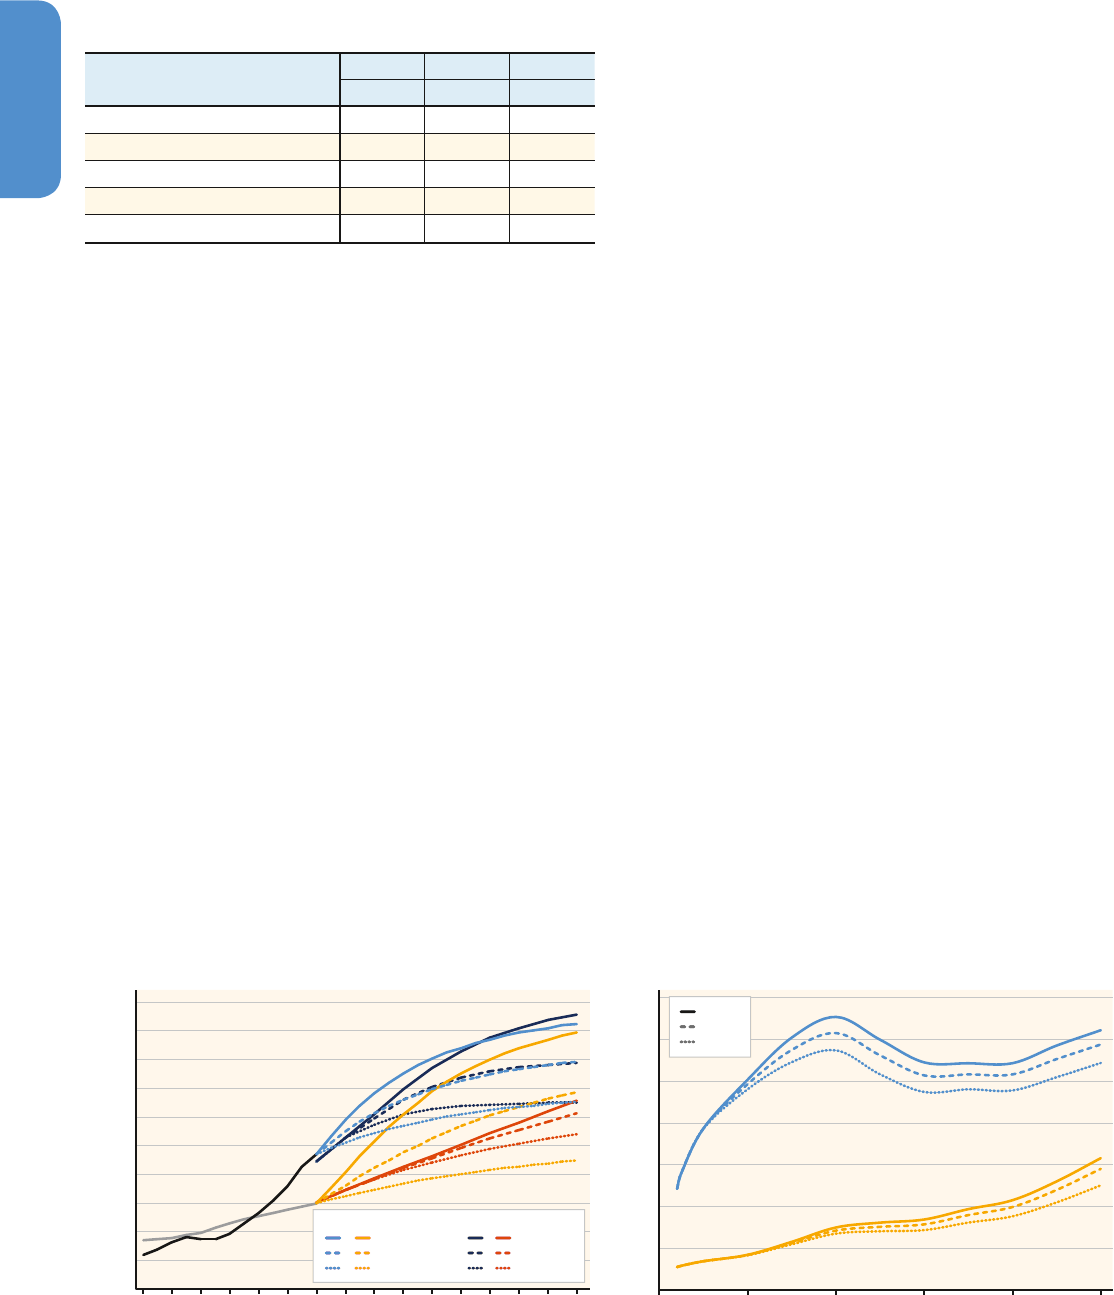
940940
Human Settlements, Infrastructure, and Spatial Planning
12
Chapter 12
the majority of the population is still rural. Urban population growth
will also largely occur in the less developed Africa, Asia, and Latin
America. The proportion of rural population in the developed regions
have declined from about 60 % in 1950 to less than 30 % in 2010, and
will continue to decline to less than 20 % by 2050.
Uncertainties in future global urbanization trends are large, due in
part to different trajectories in economic development and population
growth. While the United Nations Development Programme (UNPD)
produces a single urbanization scenario for each country through 2050,
studies suggests that urbanization processes in different countries and
different periods of time vary remarkably. Moreover, past UN urbaniza-
tion projections have contained large errors and have tended to overes-
timate urban growth, especially for countries at low and middle urban-
ization levels (Bocquier, 2005; Montgomery, 2008; Alkema etal., 2011).
Given these limitations, recent studies have begun to explore a range of
urban population growth scenarios. A study undertaken at International
Institute for Applied Systems Analysis (IIASA) extrapolates UN scenarios
to 2100 and develops three alternative scenarios by making assump-
tions about long-term maximum urbanization levels (Grubler et al.,
2007). However, missing from these scenarios is the full range of uncer-
tainty over the next twenty to thirty years, the period when the majority
of developing countries will undergo significant urban transitions. For
instance, variation across different urbanization scenarios before 2030
is negligible (0.3 %) for India and also very small (<4 %) for China (see
Figure 12.8, dashed lines). By 2050, urbanization levels could realisti-
cally reach between 38 – 69 % in India, and 55 – 78 % in China (O’Neill
etal., 2012). In other words, there are large uncertainties in urbaniza-
tion trajectories for both countries. The speed (fast or slow) as well as
the nature (an increase in industrialization) of urbanization could lead
to significant effects on future urban energy use and emissions.
12.2.3.2 Dimension 2: Urban land cover
Recently, global forecasts of urban expansion that take into account
population and economic factors have become available (Nelson etal.,
2010; Angel etal., 2011; Seto etal., 2011, 2012). These studies vary in
their baseline urban extent, model inputs, assumptions about future
trends in densities, economic and population growth, and modelling
methods. They forecast that between 2000 and 2030, urban areas will
expand between 0.3 million to 2.3 million km
2
, corresponding to an
increase between 56 % to 310 % (see Table 12.3 and Angel etal., 2011;
Seto etal., 2011, 2012). It is important to note that these studies fore-
cast changes in urban land cover (features of Earth’s surface) and not
changes in the built environment and infrastructure (e. g., buildings,
roads). However, these forecasts of urban land cover can be useful to
project infrastructure development and associated emissions. Given
worldwide trends of declining densities, the zero population density
decline scenario and associated urban growth forecast (0.3 million)
is unlikely, as is the Special Report on Emissions Scenarios (SRES) A1
scenario of very rapid economic growth and a peak in global popula-
tion mid-century. According to the studies, the most likely scenarios
are SRES B2 (Seto etal., 2011), >75 % probability (Seto etal., 2012),
and 2 % decline (Angel etal., 2011), which reduces the range of fore-
cast estimates to between 1.1 to 1.5 million km
2
of new urban land.
This corresponds to an increase in urban land cover between 110 %
to 210 % over the 2000 global urban extent. Hurtt etal. (2011) report
Figure 12.8 | Projected urban population growth for India and China under fast, central, and slow growth scenarios (left) and associated growth in CO
2
emissions (right). Sources:
O’Neill etal. (2012), Grubler etal. (2007).
Historic
0
2
4
6
8
10
12
14
210020802060204020202000
Fast
Central
Slow
CO
2
Emissions [GtCO
2
/yr]
China
India
0
10
20
30
40
50
60
70
80
90
100
2080206020402000 202019801960 2100
China
India
Urban Population Share [%]
A2r (Grubler)
B2 (Grubler)
B1 (Grubler)
Fast (O'Neill)
Central (O'Neill)
Slow (O'Neill)
India
India
China
China
Table 12.2 | Global urban population in 2050 (mid-year)
Source
Total Pop. % Urban Pop.
in billions Urban in billions
IIASA Greenhouse Gas Index, A2R Scenario 10.245 69 7.069
World Bank 9.417 67 6.308
United Nations 9.306 67 6.252
IIASA Greenhouse Gas Index, B2 Scenario 9.367 66 6.182
IIASA Greenhouse Gas Index, B1 Scenario 8.721 64 5.581
Sources: IIASA (2009), UN DESA (2012), World Bank (2013).

941941
Human Settlements, Infrastructure, and Spatial Planning
12
Chapter 12
projected land-use transitions including urbanization, out to 2100, for
the intended use in Earth System Models (ESMs). However, they do not
give a detailed account of the projected urban expansion in different
parts of the world.
Depending on the scenario and forecast, 55 % of the total urban land in
2030 is expected to be built in the first three decades of the 21st century.
Nearly half of the global growth in urban land cover is forecasted to occur
in Asia, and 55 % of the regional growth will take place in China and
India (Seto etal., 2012). China’s urban land area is expected to expand by
almost 220,000 km
2
by 2030, and account for 18 % of the global increase
in urban land cover (Seto etal., 2012). These forecasts provide first-order
estimates of the likelihood that expansion of urban areas will occur in
areas of increasing vulnerability to extreme climate events including
floods, storm surges, sea level rise, droughts, and heat waves (see WGII
AR5 Chapter 8). Urban expansion and associated land clearing and loss
of aboveground biomass carbon in the pan-tropics is expected to be 1.38
PgC between 2000 and 2030, or 0.05 PgC / yr (Seto etal., 2012).
12.2.3.3 Dimension 3: GHG emissions
Recent developments in integrated models are beginning to capture the
interdependence among urban population, urban land cover, and GHG
emissions. Some integrated models have found that changes in urban-
ization in China and India have a less than proportional effect on aggre-
gate emissions and energy use (O’Neill etal., 2012). These studies find
that income effects due to economic growth and urbanization result
in household consumption shifts toward cleaner cooking fuels (O’Neill
etal., 2012). In India, the urbanization level in 2050 will be 16 percent-
age points lower under the slow urbanization scenario than under the
central scenario, or 15 percentage points higher under the fast scenario
than under the central scenario. However, these large differences in
potential urbanization levels in India lead to relatively small differences
in emissions: 7 % between the slow and central urbanization scenarios,
and 6 % between the fast and central urbanization scenarios (O’Neill
etal., 2012). The relatively small effect of urbanization on emissions is
likely due to relatively small differences in per capita income between
rural and urban areas (O’Neill etal., 2012). In contrast, large differences
in per capita income between urban and rural areas in China result in
significant differences in household consumption, including for energy
(O’Neill etal., 2012). Differences in urbanization pathways also reflect
different speeds of transition away from the use of traditional fuels
toward modern fuels such as electricity and natural gas (Krey etal.,
2012). Slower rates of urbanization result in slower transitions away
from traditional to modern fuels (Jiang and O’Neill, 2004; Pachauri and
Jiang, 2008). A large share of solid fuels or traditional biomass in the
final energy mix can have adverse health impacts due to indoor air pol-
lution (Bailis etal., 2005; Venkataraman etal., 2010).
Accounting for uncertainties in urban population growth, the scenarios
show that urbanization as a demographic process does not lead to a
Table 12.3 | Forecasts of global urban land expansion to 2030. Sources: Angel etal. (2011), Seto etal. (2011, 2012).
Study Scenario
Projected Urban Expansion to 2030 (km
2
)
% of projected
urban land in
2030 to be
built between
2000 – 2030
Urban Land
2000 (km
2
)
Africa Asia Europe
Latin
America
North
America
Oceania
Total (%
increase from
2000)
Seto etal.
(2011)
SRES A1 726,943 107,551 1,354,001 296,638 407,214 73,176 16,996 2,255,576
(310)
76
SRES A2 726,943 113,423 702,772 162,179 122,438 49,487 15,486 1,165,785
(160)
62
SRES B1 726,943 107,551 1,238,267 232,625 230,559 86,165 18,106 1,913,273
(263)
72
SRES B2 726,943 136,419 989,198 180,265 131,016 74,572 15,334 1,526,805
(210)
68
Seto etal.
(2012)
>75 %
probability
652,825 244,475 585,475 77,575 175,075 118,175 9,700 1,210,475 65
Urban Land
2000 (km
2
)
Africa Asia
East Asia
and the
Pacific
Europe and
Japan
Latin America
and the
Caribbean
Land Rich
Developed
Countries
Total (%
increase from
2000)
Angel etal.
(2011)
0 % density
decline
602,864 58,132 120,757 43,092 9,772 49,348 54,801 335,902 (56) 36
1 % density
decline
602,864 92,002 203,949 75,674 74,290 98,554 119,868 664,337 (110) 52
2 % density
decline
602,846 137,722 316,248 119,654 161,379 164,975 207,699 1,107,677
(184)
65

942942
Human Settlements, Infrastructure, and Spatial Planning
12
Chapter 12
corresponding growth in emissions and energy use (Figure 12.8b). In
China, for example, under the central scenario (similar to UN projec-
tions) the country will reach 70 % urban population by 2050 and the
total carbon emissions will reach 11 GtC / yr. Under the slow urbaniza-
tion scenario, the urbanization level is 13 % lower than the central
urbanization scenario, but results in emissions that are 9 % lower than
under the central urbanization scenario. Similarly, the fast urbanization
scenario results in emissions that are 7 % higher than under the central
scenario, but with urbanization levels that are 11 % higher.
Studies of the effects of demographic change on GHG emissions come to
contradicting conclusions (Dalton etal., 2008; Kronenberg, 2009). Many
of the forecasts on urbanization also do not explicitly account for the
infrastructure for which there is a separate set of forecasts (Davis etal.,
2010; Kennedy and Corfee-Morlot, 2013; Müller etal., 2013) including
those developed by the IEA (IEA, 2013) and the Organisation for Eco-
nomic Co-operation and Development (OECD) (OECD, 2006b, 2007).
However these infrastructure forecasts, typically by region or country,
do not specify the portion of the forecasted infrastructure in urban areas
and other settlements. One study finds that both ageing and urbaniza-
tion can have substantial impacts on emissions in certain world regions
such as the United States, the EU, China, and India. Globally, a 16 – 29 %
reduction in the emissions by 2050 (1.4 – 2.5 GtC / yr) could be achieved
through slowing population growth (O’Neill etal., 2010).
12.3 Urban systems:
Activities, resources,
and performance
How does urbanization influence global or regional CO
2
emissions? This
section discusses drivers of urban GHG emissions, how they affect differ-
ent sectors, and their interaction and interdependence. The magnitude
of their impact on urban GHG emissions is also discussed qualitatively
and quantitatively to provide context for a more detailed assessment of
urban form and infrastructure (12.4) and spatial planning (12.5).
12.3.1 Overview of drivers of urban GHG
emissions
Urban areas and nations share some common drivers of GHG emis-
sions. Other drivers of urban GHG emissions are distinct from national
drivers and are locally specific. The previous section discussed impor-
tant accounting issues that affect the estimation of urban-scale GHG
emissions. (For a more comprehensive review, see Kennedy et al.,
2009; ICLEI et al., 2012; Ramaswami et al., 2012b; Steinberger and
Weisz, 2013). Another characteristic of urban areas is that their physi-
cal form and structure in terms of land-use mix and patterns, density,
and spatial configuration of infrastructure can strongly influence GHG
emissions (see discussion below and in 12.4). The basic constituent
elements of cities such as streets, public spaces, buildings, and their
design, placement, and function reflect their socio-political, economic,
and technological histories (Kostof, 1992; Morris, 1994; Kostof and
Tobias, 1999). Hence, cities often portray features of ‘path dependency’
(Arthur, 1989), a historical contingency that is compounded by the
extent of pre-existing policies and market failures that have lasting
impacts on emissions (see Section 12.6 below).
The following sections group and discuss urban GHG emission drivers
into four clusters that reflect both the specificity of urban scale emis-
sions as well as their commonality with national-scale drivers of GHG
emissions addressed in the other chapters of this assessment:
• Economic geography and income
• Socio-demographic factors
• Technology
• Infrastructure and urban form
Economic geography refers to the function of a human settlement
within the global hierarchy of places and the international division of
labour, as well as the resulting trade flows of raw materials, energy,
manufactured goods, and services. Income refers to the scale of eco-
nomic activity, often expressed through measures of Gross Regional
Product (GRP) (i. e., the GDP equivalent at the scale of human settle-
ments), calculated either as an urban (or settlement) total, or normal-
ized on a per capita basis.
Socio-demographic drivers of urban GHG emissions include popula-
tion structure and dynamics (e. g., population size, age distribution,
and household characteristics) (O’Neill etal., 2010) as well as cultural
norms (e. g., consumption and lifestyle choices) and distributional and
equity factors (e. g., access or lack thereof to basic urban infrastruc-
ture). Unequal access to housing and electricity is a significant social
problem in many rapidly growing cities of the Global South (Grubler
and Schulz, 2013) and shapes patterns of urban development. Here,
‘technology’ refers to macro-level drivers such as the technology of
manufacturing and commercial activities. ‘Infrastructure’ and ‘urban
form’ refer to the patterns and spatial arrangements of land use, trans-
portation systems, and urban design elements (Lynch, 1981; Handy,
1996) and are discussed in greater detail in Section 12.4.
12.3.1.1 Emission drivers decomposition via IPAT
Explaining GHG emission growth trends via decomposition analy-
sis is a widely used technique in the scientific literature and within
IPCC assessments ever since Kaya (1990). The so-called IPAT identity
(for a review, see Chertow, 2000) is a multiplicative identity in which
Impacts (e. g., emissions) are described as being the product of Popula-
tion x Affluence x Technology. First derivatives (growth rates) of the
components of this identity become additive, thus allowing a first
analysis on the relative weight of different drivers. The IPAT identity is
Figure 12.9 | Decomposition of urban-scale CO
2
emissions (absolute difference over time period specified (dark blue) and renormalized to index 1 (other colours)) for four Chinese
cities 1985 to 2006. Source: Grubler etal. (2012) based on Dhakal (2009). Note the ‘economic effect’ in the graph corresponds to an income effect as discussed in the text. For
comparison, per capita CO
2
emissions for these four cities range between 11.7 (Shanghai), 11.1 (Tianjin), 10.1 (Beijing), and 3.7 (Chongqing) tCO
2
/ cap (Hoornweg etal., 2011).
0
50
100
Total CO
2
Emissions [Mt]
Total CO
2
Emissions [Mt] Total CO
2
Emissions [Mt]
Total CO
2
Emissions [Mt]
0
50
100
0
50
100
0
30
11.7
6.9
21.8
1.2
19.1
49.8
36.3
31.3
93.6
26
67.5
48.9
16.2
24.2
Economic Effect
Population Effect
Energy Intensity Effect
Carbon Intensity Effect CO
2
Changes
-8
-6
-4
-2
0
2
4
6
8
1985-1990 1990-1995 1995-2000 2000-2006
Contribution to Change of CO
2
Emissions (Total Change=1)
Contribution to Change of CO
2
Emissions (Total Change=1)
Contribution to Change of CO
2
Emissions (Total Change=1)
Contribution to Change of CO
2
Emissions (Total Change=1)
Beijing
-1.5
-1.0
-0.5
0.0
0.5
1.0
1.5
2.0
1985-1990 1990-1995 1995-2000 2000-2006
Shanghai
-2.0
-1.5
-1.0
-0.5
0.0
0.5
1.0
1.5
2.0
1985-1990 1990-1995 1995-2000 2000-2006
-3
-2
-1
0
1
2
3
Tianjin
Chongqing
1997-2000 2000-2006
no Data
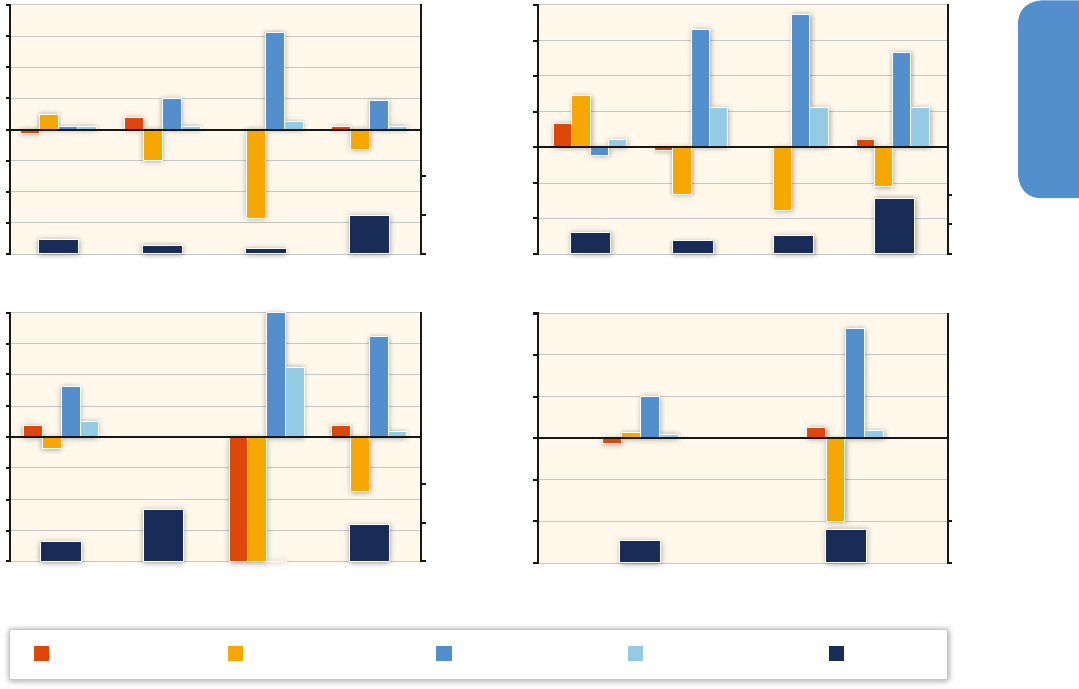
943943
Human Settlements, Infrastructure, and Spatial Planning
12
Chapter 12
a growth accounting framework and does not lend itself to explaining
differences between urban settlements in terms of absolute GHG emis-
sion levels and their driving forces (see discussion below).
There is great interest in understanding the drivers of China’s urban
GHG emissions, which has resulted in a large literature on the decom-
position of GHG emissions for Chinese megacities. With approximately
10 tonnes of CO
2
per urban capita — three times the national aver-
age — China approaches and in some cases, surpasses levels for Annex-
I countries and cities (Dhakal, 2009). Studies have used national emis-
sion inventory methods following the IPCC / OECD guidelines (Dhakal,
2009; Chong etal., 2012) or input-output techniques (Wang etal., 2013)
and thus have used both production and consumption accounting per-
spectives. Studies have also gone beyond the simple IPAT accounting
framework, such as using index decomposition (Donglan etal., 2010).
Together, these studies show considerable variation in per capita GHG
emissions across Chinese cities (see, for example, Figure 12.9). Although
the relative contribution of different drivers of emissions varies across
cities and time periods, one study of several Chinese cities found that
income is the most important driver of increases in urban carbon emis-
sions, far surpassing population growth, with improvements in energy
efficiency serving as a critical counterbalancing factor to income
growth (Dhakal, 2009). The importance of economic growth as a driver
of urban CO
2
emissions in China has been consistently corroborated in
other studies, including those that examine relatively smaller cities and
with the use of alternative types of data and methods (Li etal., 2010;
Liu etal., 2012; Chong etal., 2012; Jiang and Lin, 2012).
However, the evidence on whether the gains in efficiency can counterbal-
ance the scale of infrastructure construction and income growth in China
is less conclusive. Several studies implemented at different spatial scales
have found that the scale of urbanization and associated consumption
growth in China have outpaced gains from improvements in efficiency
(Peters etal., 2007; Feng etal., 2012; Güneralp and Seto, 2012). Other
studies have found that improvements in efficiency offset the increase
in consumption (Liu etal., 2007; Zhang etal., 2009; Minx etal., 2011).
The literature on drivers of urban GHG emissions in other non-AnnexI
countries is more sparse, often focusing on emission drivers at the sec-
toral level such as transport (Mraihi etal., 2013) or household energy
use (Ekholm etal., 2010). In these sectoral studies, income and other
factors (that are highly correlated with income) such as vehicle owner-
ship and household discount rates, are also shown as important deter-
mining variables.
emissions (see discussion below and in 12.4). The basic constituent
elements of cities such as streets, public spaces, buildings, and their
design, placement, and function reflect their socio-political, economic,
and technological histories (Kostof, 1992; Morris, 1994; Kostof and
Tobias, 1999). Hence, cities often portray features of ‘path dependency’
(Arthur, 1989), a historical contingency that is compounded by the
extent of pre-existing policies and market failures that have lasting
impacts on emissions (see Section 12.6 below).
The following sections group and discuss urban GHG emission drivers
into four clusters that reflect both the specificity of urban scale emis-
sions as well as their commonality with national-scale drivers of GHG
emissions addressed in the other chapters of this assessment:
• Economic geography and income
• Socio-demographic factors
• Technology
• Infrastructure and urban form
Economic geography refers to the function of a human settlement
within the global hierarchy of places and the international division of
labour, as well as the resulting trade flows of raw materials, energy,
manufactured goods, and services. Income refers to the scale of eco-
nomic activity, often expressed through measures of Gross Regional
Product (GRP) (i. e., the GDP equivalent at the scale of human settle-
ments), calculated either as an urban (or settlement) total, or normal-
ized on a per capita basis.
Socio-demographic drivers of urban GHG emissions include popula-
tion structure and dynamics (e. g., population size, age distribution,
and household characteristics) (O’Neill etal., 2010) as well as cultural
norms (e. g., consumption and lifestyle choices) and distributional and
equity factors (e. g., access or lack thereof to basic urban infrastruc-
ture). Unequal access to housing and electricity is a significant social
problem in many rapidly growing cities of the Global South (Grubler
and Schulz, 2013) and shapes patterns of urban development. Here,
‘technology’ refers to macro-level drivers such as the technology of
manufacturing and commercial activities. ‘Infrastructure’ and ‘urban
form’ refer to the patterns and spatial arrangements of land use, trans-
portation systems, and urban design elements (Lynch, 1981; Handy,
1996) and are discussed in greater detail in Section 12.4.
12.3.1.1 Emission drivers decomposition via IPAT
Explaining GHG emission growth trends via decomposition analy-
sis is a widely used technique in the scientific literature and within
IPCC assessments ever since Kaya (1990). The so-called IPAT identity
(for a review, see Chertow, 2000) is a multiplicative identity in which
Impacts (e. g., emissions) are described as being the product of Popula-
tion x Affluence x Technology. First derivatives (growth rates) of the
components of this identity become additive, thus allowing a first
analysis on the relative weight of different drivers. The IPAT identity is
Figure 12.9 | Decomposition of urban-scale CO
2
emissions (absolute difference over time period specified (dark blue) and renormalized to index 1 (other colours)) for four Chinese
cities 1985 to 2006. Source: Grubler etal. (2012) based on Dhakal (2009). Note the ‘economic effect’ in the graph corresponds to an income effect as discussed in the text. For
comparison, per capita CO
2
emissions for these four cities range between 11.7 (Shanghai), 11.1 (Tianjin), 10.1 (Beijing), and 3.7 (Chongqing) tCO
2
/ cap (Hoornweg etal., 2011).
0
50
100
Total CO
2
Emissions [Mt]
Total CO
2
Emissions [Mt] Total CO
2
Emissions [Mt]
Total CO
2
Emissions [Mt]
0
50
100
0
50
100
0
30
11.7
6.9
21.8
1.2
19.1
49.8
36.3
31.3
93.6
26
67.5
48.9
16.2
24.2
Economic Effect
Population Effect
Energy Intensity Effect
Carbon Intensity Effect CO
2
Changes
-8
-6
-4
-2
0
2
4
6
8
1985-1990 1990-1995 1995-2000 2000-2006
Contribution to Change of CO
2
Emissions (Total Change=1)
Contribution to Change of CO
2
Emissions (Total Change=1)
Contribution to Change of CO
2
Emissions (Total Change=1)
Contribution to Change of CO
2
Emissions (Total Change=1)
Beijing
-1.5
-1.0
-0.5
0.0
0.5
1.0
1.5
2.0
1985-1990 1990-1995 1995-2000 2000-2006
Shanghai
-2.0
-1.5
-1.0
-0.5
0.0
0.5
1.0
1.5
2.0
1985-1990 1990-1995 1995-2000 2000-2006
-3
-2
-1
0
1
2
3
Tianjin
Chongqing
1997-2000 2000-2006
no Data

944944
Human Settlements, Infrastructure, and Spatial Planning
12
Chapter 12
Decomposition analyses are available for cities in the United States
(Glaeser and Kahn, 2010), the UK (Minx etal., 2013), Japan (Makido
etal., 2012), and Australia (Wiedenhofer etal., 2013). These studies
show that income is an important driver of urban GHG emissions.
Studies using more disaggregated emission accounts complement
these findings by also identifying other significant influencing fac-
tors including automobile dependence, household size, and education
(Minx etal., 2013) or additional variables such as climate represented
by heating- or cooling-degree days (Wiedenhofer etal., 2013). The lat-
ter two studies are of particular interest as they provide an in-depth
analysis of the determining variables of urban GHG emissions using
both production and consumption-based accounting approaches. In
both accounting approaches, income emerges as an important deter-
minant of urban GHG emissions.
12.3.1.2 Interdependence between drivers
The drivers outlined above vary in their ability to be influenced by local
decision making. It is difficult to isolate the individual impact of any of
these factors on urban energy use and GHG emissions since they are
linked and often interact across different spatial and temporal scales.
The interaction among the factors and the relative importance of each
will vary from place to place. Moreover, many of these factors change
over time and exhibit path dependence.
A legitimate concern with the IPAT decomposition approach is that
the analysis assumes variable independence, thus ignoring variable
interdependence and co-variance. For instance, a study of 225 cities
suggests a robust negative correlation between per capita income
levels and energy intensity (Grubler etal., 2012) that holds for both
high-income as well as low-income cities. Income growth has the
potential to drive investment in technology, changing investment in
newer and more efficient technologies, as higher income segments
have lower discount rates or higher tolerance to longer payback
times (Hausman, 1979).
12.3.1.3 Human settlements, linkages to sectors, and
policies
The major drivers discussed above affect urban GHG emissions through
their influence on energy demand in buildings, transport, industry, and
services. These can be mitigated through demand-side management
options. As such, human settlements cut across the assessment of miti-
gation options in sector-specific chapters of this Assessment (see Table
12.4). The drivers also affect the demand for urban energy, water, and
waste infrastructure systems, whose GHG emissions can be mitigated
via technological improvements within each individual infrastructure
system (e. g., methane recovery from municipal wastewater treatment
plants and landfills) as well as through improved system integration
(e. g., using urban waste as an energy source). Given the interdepen-
dence between drivers and across driver groups discussed above,
independent sectoral assessments have limitations and risk omitting
important mitigation potentials that arise from systems integration.
On one hand, governance and institutions for addressing mitigation
options at the urban scale are more dispersed (see 12.6) and face
a legacy of inadequately addressing a range of market failures (see
Box 12.3). On the other hand, the urban scale also provides unique
opportunities for policy integration between urban form and density,
infrastructure planning, and demand management options. These are
key, especially in the domain of urban transport systems. Lastly, gov-
ernance and institutional capacity are scale and income dependent,
i. e., tend to be weaker in smaller scale cities and in low income / rev-
enue settings. In so far as the bulk of urban growth momentum is
expected to unfold in small- to medium-size cities in non-Annex I
countries (see Section 12.2), mitigation of GHG emissions at the scale
of human settlements faces a new type of ‘governance paradox’
(Grubler et al., 2012): the largest opportunities for GHG emission
reduction (or avoidance of unfettered emission growth) might be pre-
cisely in urban areas where governance and institutional capacities
to address them are weakest (Bräutigam and Knack, 2004; Rodrik
etal., 2004).
12.3.2 Weighing of drivers
This section assesses the relative importance of the GHG drivers in dif-
ferent urban contexts such as size, scale, and age, and examines the
differences between cities in developed and developing countries.
12.3.2.1 Qualitative weighting
In the previous discussion of the respective role of different emission
drivers, the emphasis was placed on the role of drivers in terms of
emission growth. That perspective is complemented in this section by a
consideration of the absolute level of emissions, and the issue of urban
size / scale. This section also differentiates the role of emission drivers
between mature versus growing human settlements.
Importance of size and scaling
Given the significance of human settlements for global resource use,
an improved understanding of their size distribution and likely growth
dynamics is crucial. For many physical, biological, social, and techno-
logical systems, robust quantitative regularities like stable patterns of
rank distributions have been observed. Examples of such power law-
scaling patterns include phenomena like the frequency of vocabulary
in languages, the hierarchy of urban population sizes across the world
(Zipf, 1949; Berry and Garrison, 1958; Krugman, 1996) or the allome-
tric scaling patterns in biology, such as Kleiber’s Law, which observes
the astonishing constancy in the relation between body mass and
metabolic rates: for living organisms across many orders of magnitude
in size that metabolic rate scales to the ¾ power of the body mass
(Kleiber, 1961). There is a vigorous debate in many fields, including

945945
Human Settlements, Infrastructure, and Spatial Planning
12
Chapter 12
Geography (Batty, 2007, 2008), Ecology (Levin, 1992; West etal., 1999;
Brown etal., 2004), Architecture (Weinstock, 2011), and Physics (Car-
valho and Penn, 2004) about the extent to which underlying hierarchi-
cal networks of metabolic systems or transportation networks are the
ultimate causes of the size, shape and rank-distribution of entities, be
they organisms or urban systems (Decker etal., 2000, 2007).
With the scale of urbanization trends currently underway, whether the
relationship between city size and GHG emissions is linear (i. e., one to
one, or proportional increase), super-linear (i. e., increasing returns to
scale) or sub-linear (i. e., economies of scale such as efficiency gains
through shared infrastructure) will be critical for understanding future
urban GHG emissions. Super-linear scaling has been observed for many
urban phenomena: as a city’s population increases, there is a greater
than one to one increase in productivity, wages, and innovation as well
as crime (Bettencourt et al., 2007, 2010). If cities exhibit sub-linear
scaling with respective to energy and GHG emissions, it suggests that
larger cities are more efficient than smaller ones. While there are many
studies of urban scaling, few studies explicitly examine city size and
GHG emissions or energy use, and the limited empirical evidence on
the scaling relationship is inconclusive. A study of 930 urban areas in
the United States — nearly all the urban settlements — shows a barely
sub-linear relationship (coefficient=0.93) between urban population
size and GHG emissions (Fragkias etal., 2013).
In a study of 225 cities across both AnnexI and non-AnnexI countries,
Grubler and Schulz (2013) find non-uniform scaling for urban final
energy use, with a distribution characterized by threshold effects
across an overall convex distribution (Figure 12.10). In terms of final
energy use, which is an important determinant of urban GHG emis-
sions, increasing the urban scale in terms of energy use has different
implications as a function of three different urban energy scale classes.
Small cities with low levels of final energy use — below 30 PJ — pres-
ent the steepest growth in energy use with respect to increasing city
size: a doubling of rank position tends to increase the urban energy
use by a factor of 6.1. For medium-sized cities with moderate energy
Table 12.4 | Examples of policies across sectors and mitigation options at the scale of human settlements.
ENERGY SYSTEMS
(Chapter 7)
TRANSPORT
(Chapter 8)
BUILDINGS
(Chapter 9)
INDUSTRY
(Chapter 10)
AFOLU
(Chapter 11)
Carbon Sinks /
Sequestration
Tradable Credits,
EQ Policies
Enegy
Efficiency
Taxes,
Credits / Permits
Subsidies for Fuel Efficiency,
Standards,
Targets
Taxes,
Preferential Lending,
Codes,
Standards
Taxes, Standards,
Emissions Trading,
Target-setting
Fuel /
Energy Switching /
Renewables
Taxes,
EQ Policies,
Ren Energy Portfolio Stds,
Energy Security Policies
Taxes,
Biofuel Incentives,
Standards
Taxes,
Targets,
Subsidies
High-
Performance /
Passive Design
Bike sharing,
Urban Planning
Codes,
Standards,
Integrated Planning,
Certification
Improved
Planning /
Management
Demand Response Measures Integrated Planning Commissioning,
Audits,
Education
Land Planning,
Protected Areas
Materials
Efficiency
Codes,
Standards, Taxes,
LCA, Certification
Standards Taxes
New /
Improved Technology
B & D Policies,
Low Carbon Tech Targets
Subsidies for Fuel Efficiency,
Bike Sharing,
Real-time Information
Real-time Information Bioenergy Targets
Recycling /
Reducing Waste
Taxes,
Target-setting,
Education
Education
Reduced Demand /
Behavior Change
Tolls,
Congestion Pricing
Taxes,
Subsidies,
Education
Education,
Standards
Urban Form / Density
Smart Growth,
Urban Planning,
Growth Management
Certification,
Urban Planning

946946
Human Settlements, Infrastructure, and Spatial Planning
12
Chapter 12
use (between 30 and 500 PJ final energy use per city), a doubling of
city rank corresponds to an increase in energy consumption only by a
factor of 1.6. For the largest urban energy users in the dataset, cities
with greater than 500 PJ of final energy use per year, a doubling of
urban rank is associated with an increase in urban energy use by a fac-
tor of only 0.5. This indicates considerable positive agglomeration
economies of bigger cities with respect to energy use. Only four urban
agglomerations of the entire sample of 225 have an annual final
energy use significantly greater than one EJ: Shanghai (2EJ), Moscow
(1.6 EJ), Los Angeles (1.5 EJ), and Beijing (1.2 EJ). With urban growth
anticipated to be the most rapid in the smaller cities of fewer than
500,000 inhabitants (UN DESA, 2010), the patterns observed by
(Grubler and Schulz, 2013) suggest very high elasticities of energy
demand growth with respect to future increases in urban population.
Mature versus growing cities
The relative impacts of the four drivers on emissions differ depending
upon whether urban areas are established and mature versus growing
and developing.
Economic geography and income have high impact for both mature
and growing cities. Mature cities in developed countries often have
high income, high consumption, and are net consumers of goods and
services, with a large share of imports. These cities have high emis-
sions, depending upon the energy supply mix. Many imported goods
are produced in growing cities in developing countries. The resulting
differentiation within the international division of labour and corre-
sponding trade flows can be categorized into three types of cities: Net
Producers, Trade Balanced, and Net Consumers (Chavez and Ramas-
wami, 2013). As a result, differences in reported urban GHG emissions
are pronounced for Net Producer and Net Consumer cities, illustrat-
ing the critical importance of taking economic geography and inter-
national trade into account when considering urban GHG emission
inventory frameworks. The degree to which economic growth drives
GHG emissions includes the type of economic specialization of urban
activities and the energy supply mix (Brownsword etal., 2005; Ken-
nedy et al., 2012). Cities with energy intensive industries are likely
to contribute higher total and per capita GHG emissions than those
whose economic base is in the service sector (Dhakal, 2009, 2010).
Figure 12.10 | Rank size distribution of 225 cities in terms of their final energy use (in EJ) regrouped into 3 subsamples (>0.5EJ, 0.03 – 0.5EJ, <0.03EJ) and corresponding sample
statistics. The rank of a city is its position in the list of all cities sorted by size, measured in terms of final energy use. Note the different elasticities of energy use with respect to
changes in urban size rank. The factors (slopes) shown in the figure detail the increase of energy use when doubling the rank for the respective groups. Source: Grubler et al. (2012)
based on Grubler and Schulz (2013).
Slope = -0.46 EJ
Slope = -1.6 EJ
Slope = -6.1 EJ
0.05
0.01
0.5
5
0.1
1
10
5
1
5010 300100
Rank
GDP [Billion USD
2010
]Population [Million cap]
321321
00
3
6
9
12
15
100
200
300
400
500
600
0.03 EJ
0.5 EJ
Final Energy Use [EJ/yr]
Final Energy Use Classes

947947
Human Settlements, Infrastructure, and Spatial Planning
12
Chapter 12
Specialization in energy-intensive sectors creates a strong correlation
between economic growth and GHG emissions growth. This relation-
ship is further strengthened if the energy supply mix is carbon inten-
sive (Parikh and Shukla, 1995; Sugar etal., 2012).
Higher urban incomes are correlated with higher consumption of
energy and GHG emissions (Kahn, 2009; Satterthwaite, 2009; Kennedy
et al., 2009; Weisz and Steinberger, 2010; Zheng et al., 2010; Hoo-
rnweg etal., 2011; Marcotullio etal., 2012). At the household level,
studies in a variety of different countries (Netherland, India, Brazil,
Denmark, Japan, and Australia) have also noted positive correlations
between income and energy use (Vringer and Blok, 1995; Cohen etal.,
2005; Lenzen et al., 2006; Pachauri and Jiang, 2008; Sahakian and
Steinberger, 2011). As such, income exerts a high influence on GHG
emissions. The Global Energy Assessment concluded that cities in non-
Annex I countries generally have much higher levels of energy use
compared to the national average, in contrast to cities in AnnexI coun-
tries, which generally have lower energy use per capita than national
averages (see Figure 12.6 and Grubler etal., 2012). One reason for
this inverse pattern is due to the significantly higher urban to rural
income gradient in cities in non-AnnexI countries compared to AnnexI
countries. That is, per capita incomes in non-AnnexI cities tend to be
several fold higher than rural per capita incomes, thus leading to much
higher energy use and resulting emissions.
Socio-demographic drivers are of medium importance in rapidly
growing cities, further mediated as growth rates decline, incomes
increase and lifestyle choices change. Social demographic drivers are
of relatively small importance in mature cities, where growth is slow
and populations are ageing. Household size, defined as the number
of persons in a household, has been steadily declining over the last
fifty years. Worldwide, average household size declined from 3.6 to
2.7 between 1950 to 1990, and this trend is occurring in both devel-
oped and developing countries although at different rates (MacKellar
et al., 1995; Bongaarts, 2001). Smaller household size is correlated
with higher per capita emissions, whereas larger household size can
take advantage of economies of scale. Evidence on the relationship
between urban population size and per capita emissions is inconclu-
sive. Scale effects have been shown for cities in Asia (Marcotullio etal.,
2012) but little to no scaling effect for GHG emissions in the United
States (Fragkias etal., 2013).
Infrastructure and urban form are of medium to high impor-
tance as drivers of emissions. In rapidly growing cities, infrastruc-
ture is of high importance where the largest share of infrastructure
construction is occurring. In mature cities, urban form drivers are of
high importance as they set in place patterns of transport and other
energy use behaviour. In mature cities, infrastructure is of medium
importance, as they are largely established, and thus refurbishing or
repurposing of old infrastructures offers primary mitigation opportu-
nities. The global expansion of infrastructure used to support urban-
ization is a key driver of emissions across multiple sectors. Due to
the high capital costs, increasing returns, and network externalities
related to infrastructures that provide fundamental services to cit-
ies, emissions associated with infrastructure systems are particularly
prone to lock-in (Unruh and Carrillo-Hermosilla, 2006; Unruh, 2002,
2000). The committed emissions from energy and transportation
infrastructures are especially high, with respective ranges of commit-
ted CO
2
of 127 – 336 and 63 – 132 Gt (Davis etal., 2010). For example,
the GHG emissions from primary production alone for new infrastruc-
ture development for non-AnnexI countries are projected to be 350
Gt CO
2
(Müller etal., 2013). For a detailed discussion see Sections
12.4 and 12.5.
Technology is a driver of high importance. Income and scale exert
important influences on the mitigation potential for technologies.
While lock-in may limit the rate of mitigation in mature cities, the
opportunity exists in rapidly growing cities to leapfrog to new technol-
ogies. For mature cities, technology is important due to agglomeration
externalities, Research and Development (R&D) and knowledge con-
centration, and access to capital that facilitate the development and
early deployment of low-carbon technologies (Grubler et al., 2012).
For rapidly growing cities, the importance of technology as a driver
may be low for systems with high capital requirements but high for
less capital-intensive (e. g., some demand-side efficiency or distributed
supply) systems. The influence of all drivers depends upon governance,
institutions, and finance (Section 12.6).
12.3.2.2 Relative weighting of drivers for sectoral
mitigation options
Drivers affect GHG emissions via influence on energy demand (includ-
ing demand management) in buildings (households and services),
transport, and industry, as well as on energy supply, water, and waste
systems. Over time, structural transitions change both the shares of
emissions by sectors — with industrial, then services and transport
shares of final energy increasing with development (Schäfer, 2005;
Hofman, 2007) — as well as the relative importance of drivers. Eco-
nomic geography has a large influence on emissions from the industry
and service sectors (Ramaswami, 2013) plus international transport
(bunkers fuels). These influences are particularly pronounced in urban
agglomerations with very porous economies. For example Schulz
(2010) analyzed Singapore and found that GHG emission embodied
in the imports and exports of the city are five to six times larger than
the emissions from the direct primary energy use of the city’s popula-
tion. Similarly, Grubler etal. (2012) examined New York and London,
which are global transportation hubs for international air travel and
maritime commerce. As a result, international aviation and maritime
fuels (bunker fuels) make up about one-third of the total direct energy
use of these cities, even if associated emissions are often excluded in
inventories, following a practice also used in national GHG emission
inventories (Macknick, 2011).
Income has a large influence on direct emissions due to energy use
in buildings by influencing the floor area of residential dwellings,

948948
Human Settlements, Infrastructure, and Spatial Planning
12
Chapter 12
the amount of commercial floor space and services purchased, and
buildings’ energy intensities (see Table 9.2), and also on transport,
including increasing vehicle ownership, activity, energy intensity and
infrastructure (see Chapter 8.2). Income also has large indirect effects
on emissions, for example influencing the number of products pur-
chased (e. g., increasing sales of electronics) (see Chapter 10.2) and
their energy intensity (e. g., consumables like food) (see Chapter 11.4),
perhaps produced by the industrial and services sectors somewhere
else, and transported to the consumers (increasing freight transport
activity).
Social demographic drivers have a large effect on emissions, particu-
larly in buildings (e. g., number of households, persons per household,
see Chapter 9.2.2) and transport sectors (see Chapter 8.2.1). Infrastruc-
ture and urban form have a large impact on transport (Chapter 8.4)
and medium impact on energy systems (grid layout and economics)
(see Chapter 7.6). Technology has a large impact in all sectors. Income
interacts with technology, increasing both innovative (e. g., R&D) and
adoptive capacity (purchases and replacement rate of products, which
in turn can increase energy efficiency). In demand sectors, mitigation
from efficiency may be mediated by behaviours impacting consump-
tion (e. g., more efficient yet larger televisions or refrigerators, or more
efficient but larger or more powerful vehicles). See the sectoral Chap-
ters 7 – 11 for further discussion of these issues.
12.3.2.3 Quantitative modelling to determine driver
weights
An inherent difficulty in any assessment of emission drivers at the
urban scale is that both mitigation options as well as policy levers
are constrained by the legacy of past decisions as reflected in existing
urban spatial structures and infrastructures, the built environment, and
economic structures. Modelling studies that simulate alternative devel-
opment strategies, even the entire evolution of a human settlement, or
that explore the effects of policy integration across sectors can shed
additional light on the relative weight of drivers as less constrained or
entirely unconstrained by the existing status quo or by more limited
sectoral assessment perspectives.
For instance, large-scale urban simulation models have been used to
study the joint effects of policy integration such as pursuing smart-
growth planning that restricts urban sprawl with market-based pric-
ing mechanisms. One study of metropolitan regions in OECD countries
concludes that policies such as those that encourage higher urban
densities and road tolls such as congestion charges have lower sta-
bilization costs than economy-wide approaches such as a carbon tax
(Crassous etal., 2006; OECD, 2010a) . Models suggest that adding
substantially upgraded urban services to the mix of bundled strate-
gies yields even greater benefits. A meta-analysis of 14 urban simula-
tions of scenarios with varying degrees of urban containment, road
pricing, and transit services upgrades forecasted median transporta-
tion demand volumes (VKT, vehicle-kilometre-travelled) reductions of
3.9 % within 10 years, rising to 15.8 % declines over 40 years (Rodier,
2009). Estimates from a review of published studies of U. S. cities fore-
casted a 5 % to 12 % VKT reduction from doubling residential densi-
ties and as high as 25 % reductions when combined with other strate-
gies, including road pricing (National Research Council, 2009a). GHG
emissions were estimated to decline 11 % from the most aggressive
combination of densification and market-based pricing. The combina-
tion of introducing VKT charges, upgrading transit, and more compact
development from simulation studies in Helsinki, Dortmund, Edin-
burgh, and Sacramento yielded simulation-model estimates of 14.5 %
reductions in VKT within 10 years and 24.1 % declines over 40 years
(Rodier, 2009).
A more holistic modelling strategy with a much larger system bound-
ary was followed with the Sincity model, a combined engineering-
type systems-optimization model that integrates agent-based and
spatially explicit modelling of urban form and density with transport
and energy infrastructure planning to simulate the entire evolution of
a ‘synthetic’ city (Keirstead and Shah, 2013; Steinberger and Weisz,
2013) or of large scale new urban developments (Hao etal., 2011).
Using an illustrative European city of 20,000 inhabitants and with a
service dominated economy (i. e., holding the economic geography and
income variables constant), alternative urban designs were explored to
separate out the various effects of different policy measures in deter-
mining urban energy use. The results suggest that compared to a base-
line (sprawl city with current practice technologies), improvements by
a factor of two each were possible by either a combination of energy
efficiency measures for the urban building stock and the vehicle fleet,
versus modifying urban form and density. Conversely energy systems
optimization through cogeneration and distributed energy systems
were found to yield improvements of between 15 – 30 % (Keirstead and
Shah, 2013; Steinberger and Weisz, 2013). The largest improvements of
a factor of three were found through an integration of policy measures
across all domains.
12.3.2.4 Conclusions on drivers of GHG emissions at the
urban scale
Perhaps the most significant conclusion emerging from Section 12.2
and above discussion of urban GHG emission drivers is the realiza-
tion that the traditional distinction between AnnexI and non-AnnexI
becomes increasingly blurred at the urban scale. There is an increas-
ing number of cities, particularly in the rapidly growing economies of
Asia, where per capita resource use, energy consumption, and asso-
ciated GHG emissions are not different from the ones in developed
economies. A second important conclusion is that economic geog-
raphy and income by themselves are often such important drivers
of urban GHG emissions that they dwarf the effects of technology
choices or of place-based policy variables of urban form and infra-
structures. However, the latter policy options are those for which
urban-scale decision making can make the largest impact on GHG
emissions.

949949
Human Settlements, Infrastructure, and Spatial Planning
12
Chapter 12
A more detailed discussion on the different leverage effects of urban
scale policy options using the example of urban energy use is provided
in the Global Energy Assessment, Chapter 18 (Grubler etal., 2012),
which can be combined with above assessment on the relative weight
of emission drivers to derive a categorization of urban policy interven-
tion levels as a function of potential impacts on emissions as well as
the degree to which policy interventions can be implemented by
urban-scale decision making processes by local governments, firms,
and individuals (Figure 12.11).
The categorization in Figure 12.11 is necessarily stylized. It will vary
across local contexts, but it helps to disentangle the impacts of
macro- from micro-drivers. For instance, urban GHG emission levels
will be strongly influenced by differences in urban function, such as
the role of a city as a manufacturing centre for international markets,
versus a city providing service functions to its regional or national
hinterlands. Conversely, the emissions impact from smaller-scale
decisions such as increasing local and urban-scale renewable energy
flows — which has been assessed to be very limited, particularly for
larger and more dense cities (Grubler etal., 2012) — is much smaller.
The largest leverage on urban GHG emissions from urban scale deci-
sion making thus is at the ‘meso’ scale level of the energy / emissions
and urban policy hierarchy: improving the efficiency of equipment
used in a city, improving and integrating urban infrastructure, and
shaping urban form towards low carbon pathways. Pursuing multi-
ple strategies simultaneously at this scale may be most effective at
reducing the urban-related emissions. This conclusion echoes con-
cepts such as integrated community-energy-management strategies
(Jaccard etal., 1997).
12.3.3 Motivation for assessment of spatial
planning, infrastructure, and urban form
drivers
Urban form and infrastructure significantly affect direct (operational)
and indirect (embodied) GHG emissions, and are strongly linked to the
throughput of materials and energy in a city, the waste that it gen-
erates, and system efficiencies of a city. Mitigation options vary by
city type and development levels. The options available for rapidly
developing cities include shaping their urbanization and infrastruc-
ture development trajectories. For mature, built-up cities, mitigation
options lie in urban regeneration (compact, mixed-use development
that shortens journeys, promotes transit / walking / cycling, adaptive
reuse of buildings) and rehabilitation / conversion to energy-efficient
building designs. Urban form and infrastructure are discussed in detail
in Section 12.4. A combination of integrated sustainable infrastructure
(Section 12.4), spatial planning (Section 12.5), and market-based and
regulatory instruments (Section 12.6) can increase efficiencies and
reduce GHG emissions in already built-up cities and direct urban and
infrastructure development to reduce the growth of GHG emissions in
rapidly expanding cities in developing countries.
12.4 Urban form and
infrastructure
Urban form and structure are the patterns and spatial arrangements of
land use, transportation systems, and urban design elements, including
the physical urban extent, layout of streets and buildings, as well as
the internal configuration of settlements (Lynch, 1981; Handy, 1996).
Infrastructure comprises services and built-up structures that support
the functions and operations of cities, including transport infrastruc-
ture, water supply systems, sanitation and wastewater management,
solid waste management, drainage and flood protection, telecom-
munications, and power generation and distribution. There is a strong
connection between infrastructure and urban form (Kelly, 1993; Guy
and Marvin, 1996), but the causal order is not fully resolved (Handy,
2005). Transport, energy, and water infrastructure are powerful instru-
ments in shaping where urban development occurs and in what forms
(Hall, 1993; Moss, 2003; Muller, 2004). The absence of basic infrastruc-
ture often — but not always — inhibits urban development.
This section assesses the literature on urban form and infrastructure
drivers of GHG emissions, details what data exist, the ranges, effects
on emissions, and their interplay with the drivers discussed in Sec-
tion12.3. Based on this assessment, conclusions are drawn on the
diversity of favourable urban forms and infrastructure highlighting
caveats and conflicting goals. This literature is dominated by case
studies of cities in developed countries. The literature on conditions
in developing country cities, especially for large parts of Africa, is
Figure 12.11 | Stylized hierarchy of drivers of urban GHG emissions and policy lever-
ages by urban scale decision making. Cities have little control over some of the most
important drivers of GHG emissions and have large control over comparatively smaller
drivers of emissions. Source: Synthesized from Jaccard etal. (1997), Grubler etal. (2012)
and this assessment.
Level of Urban
Policy Leverage
Impact on GHG
Emissions
High
Low
High
Low
Economic Geography
(Trade, Industry Structure, Bunkers)
Income (Consumption)
•
•
Technology: Efficiency of Energy End-Use
(Buildings, Processes, Vehicles, Appliances)
Urban Form and its Interactions with
Urban Infrastructures
•
•
Fuel Substitution (Imports)
Energy Systems Integration
(Co-Generation, Heat-Cascading)
Urban Renewables, Urban Afforestation
•
•
•
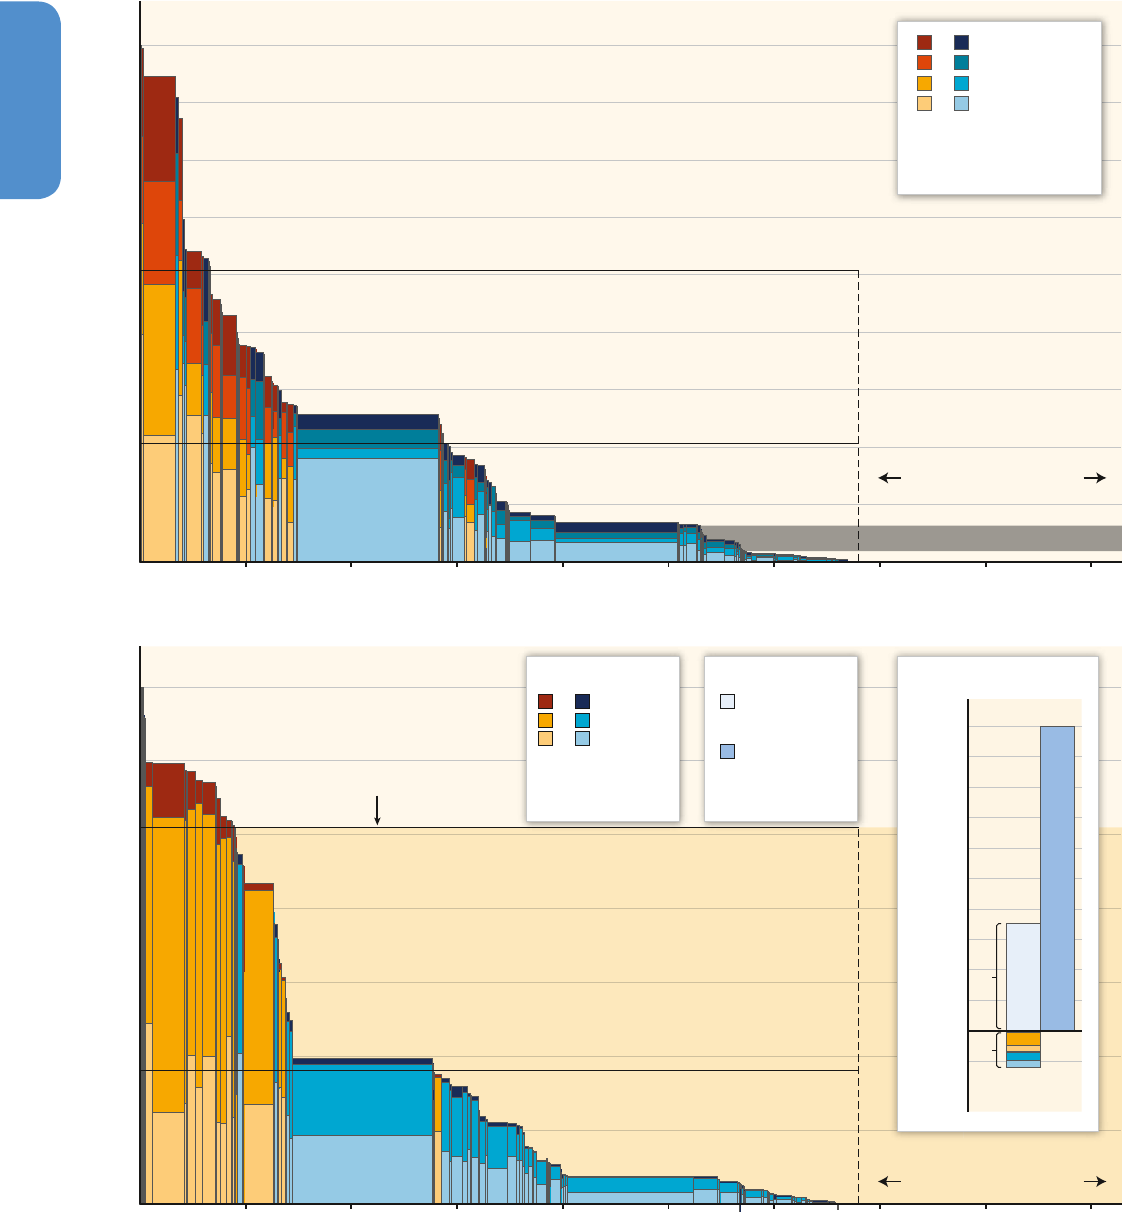
950950
Human Settlements, Infrastructure, and Spatial Planning
12
Chapter 12
Figure 12.12 | (a) Total fuel-related per-capita CO
2
emissions in 2008 by country (red / orange / yellow and blue bars) compared to the global per-capita emission level in 2050 to reach
the 2 °C target with a 50 – 75 % probability; (b) Carbon Replacement Value (CRV
2008
) per capita of existing stocks by country (red / orange and blue) and as yet unbuilt stocks if develop-
ing countries converge on the current average AnnexI level (light yellow background area); (c) comparison with emission budget for the period 2000 – 2050 to reach the 2 °C target
with a 75 % probability. Of this emission budget (1000 Gt CO
2
), approximately 420 GtCO2 was already emitted during the period from 2000 to 2011.Source: Müller etal. (2013).
Annex I average
Global average
Per Capita CO
2
Emissions by Sector [tCO
2
/cap/yr]
Global average
Annex I average
Annex I
Non-Annex I
Other Sectors
Residential Buildings
Transport
Industry
2008
2050 Average Emissions Quota for 2°C Target
Population Growth 2008-2050
0
1
2
3
4
5
6
7
8
9
0
2
4
6
8
10
12
14
16
18
Light Orange Area:
Future Carbon
Replacement Value (CRV)
Scenario
Cumulative Population [Billion Persons]
Population Growth 2008-2050
Austria, Belgium, CH
Italy
USA, Netherlands, Germany
France, Japan
Australia, Sweden
UK, Spain
Canada
Portugal
Russia, Ukraine
Hungary
Romania
Poland
Turkey
South Korea
Saudi Arabia
Malaysia
China
Iran, Mexico
Thailand, South Africa
Brazil, Egypt
Philippines
India
Indonesia, Pakistan
Ethiopia
Bangladesh
Congo, Nigeria
Australia
USA
Canada
Russia, Netherlands
Belgium
Germany
Japan
Austria, UK, Poland
Italy, Spain
France, Ukraine, CH
Portugal, Hungary
Sweden
Romania, Turkey
Saudi Arabia
South Korea
South Africa, Iran
Malaysia
China
Mexico
Thailand
Egypt
Brazil, Indonesia
India
Pakistan, Philippines
Congo,
Bangladesh,
Nigeria,
Ethiopia
Carbon Replacement Value (CRV
2008
) of In-Use Stocks [tCO
2
eq/cap]
0
1
2
3
4
5
6
7
8
9
0
10
20
30
40
50
60
70
Aluminum
Steel
Cement
CRV
2008
of 2008 Stocks
Future Emissions
CRV
2008
Future Stocks
if Convergence to
Annex I Level
Emissions Budget
2000-2050 for
2°C Target
Annex I
Non-Annex I
a)
b)
Cumulative Emissions [GtCO
2
]
200
100
0
100
200
300
400
500
600
700
350 Gt
1000 Gt
800
900
1000
CRV 2008
CRV
Future
c)
Cumulative Population [Billion Persons]

951951
Human Settlements, Infrastructure, and Spatial Planning
12
Chapter 12
particularly limited. This assessment reflects this limitation in the lit-
erature.
12.4.1 Infrastructure
Infrastructure affects GHG emissions primarily during three phases in
its lifecycle: 1) construction, 2) use / operation, and 3) end-of-life. The
production of infrastructure materials such as concrete and metals is
energy and carbon intensive (Cole, 1998; Horvath, 2004). For example,
the manufacturing of steel and cement, two of the most common infra-
structure materials, contributed to nearly 9 % and 7 %, respectively, of
global carbon emissions in 2006 (Allwood etal., 2010). Globally, the
carbon emissions embodied in built-up infrastructure as of 2008 was
estimated to be 122 (−20 / +15) Gt CO
2
(Müller etal., 2013). Much of
the research on the mitigation potential of infrastructure focuses on
the use / operation phase and increasing the efficiency of the technol-
ogy. Estimating emissions from urban infrastructure such as electricity
grids and transportation networks is challenging because they often
extend beyond a city’s administrative boundaries (Ramaswami etal.,
2012b) (see Section 12.2 for detailed discussion). Several studies show
that the trans-boundary emissions of infrastructure can be as large as
or even larger than the direct GHG emissions within city boundaries
(Ramaswami etal., 2008; Kennedy etal., 2009; Hillman and Ramas-
wami, 2010; Chavez and Ramaswami, 2013). Thus, a full accounting of
GHG emissions from urban infrastructure would need to include both
primary and embodied energy of infrastructure materials, as well as
energy from the use / operation phase and end-of-life, including reuse
and recycling.
Rates of infrastructure construction in mature versus rapidly devel-
oping cities lead to fundamentally different impacts on GHG emis-
sions. Infrastructure growth is hypothesized to follow an S-shaped
curve starting with an early development phase, continuing with a
rapid growth and expansion phase, and ending with a saturation
phase (Ausubel and Herman, 1988). The build-up of infrastructure
that occurs during early phases of urbanization is particularly emis-
sions intensive. Currently, the average per capita emissions embod-
ied in the infrastructure of industrialized countries is 53 (± 6) t CO
2
(see Figure 12.12) which is more than five times larger than that in
developing countries (10 (± 1) t CO
2
) (Müller etal., 2013). While there
have been energy efficiency improvements in the industrial sector,
especially steel and cement production, the scale and pace of urban-
ization can outstrip efficiency gains and lead to continued growth in
emissions (Levine and Aden, 2008; Güneralp and Seto, 2012). China
accounts for roughly 37 % of the global emissions commitments in
part due to its large-scale urbanization – the United States adds 15 %;
Europe 15 %, and Japan 4 %, together representing 71 % of total
global emissions commitments by 2060 (Davis etal., 2010).
Emissions related to infrastructure growth are therefore tied to exist-
ing urban energy systems, investment decisions, and regulatory poli-
cies that shape the process of urban growth. The effects of these deci-
sions are difficult to reverse: high fixed costs, increasing returns, and
network externalities make emissions intensive infrastructure systems
particularly prone to lock-in (Unruh and Carrillo-Hermosilla, 2006;
Unruh, 2002, 2000). Furthermore, the long lifespan of infrastructure
affects the turnover rate of the capital stock, which can limit the speed
at which emissions in the use / operation phase can be reduced (Jaccard
and Rivers, 2007).
The build-up of infrastructure in developing countries as part of the
massive urbanization currently underway will result in significant
future emissions. Under one scenario, if the global population increases
to 9.3 billion by 2050 and developing countries expand their built envi-
ronment and infrastructure to the current global average levels using
available technology today, the production of infrastructure materials
alone would generate approximately 470 Gt of CO
2
emissions (see Fig-
ure 12.12). This is in addition to the “committed emissions” from exist-
ing energy and transportation infrastructure, estimated to be in the
range of 282 to 701 Gt of CO
2
between 2010 and 2060 (Davis etal.,
2010).
The links between infrastructure and urban form are well established,
especially among transportation infrastructure provision, travel
demand, and VKT. In developing countries in particular, the growth of
transport infrastructure and resulting urban forms are playing impor-
tant roles in affecting long-run emissions trajectories (see Chapter 8).
The committed emissions from existing energy and transportation
infrastructure are high, with ranges of CO
2
of 127 – 336 and 63 – 132
Gt, respectively (see Figure 12.13 and Davis etal., 2010). Transport
infrastructure affects travel demand and emissions in the short-run
by reducing the time cost of travel, and in the long-run by shaping
land-use patterns (Vickrey, 1969; Downs, 2004). Development of
transport infrastructure tends to promote ‘sprawl’, characterized by
low-density, auto-dependent, and separated land uses (Brueckner,
2000; Ewing etal., 2003). Consistent evidence of short-run effects
show that the demand elasticities range between 0.1 – 0.2. That is,
a doubling of transport infrastructure capacity increases VKT by
10 – 20 % in the short-run (Goodwin, 1996; Hymel etal., 2010). Other
studies suggest larger short-run elasticities of 0.59 (Cervero and Han-
sen, 2002) and a range of 0.3 – 0.9 (Noland and Lem, 2002). Differ-
ences in short-run elasticities reflect fundamental differences in the
methodologies underlying the studies (see Chapter 15.4 on policy
evaluation). In the long-run, the elasticities of VKT with respect to
road capacity are likely to be in the range 0.8 – 1.0 as land-use pat-
terns adjust (Hansen and Huang, 1997; Noland, 2001; Duranton and
Turner, 2011). While the links between transport infrastructure, urban
form, and VKT are well studied, there are few studies that extend the
analysis to estimate emissions due to transport-induced increases
in VKT. One exception is a study that concludes that freezing United
States highway capacity at 1996 levels would reduce emissions by 43
Mt C / yr by 2012, compared to continuing construction at historical
rates (Noland, 2001).
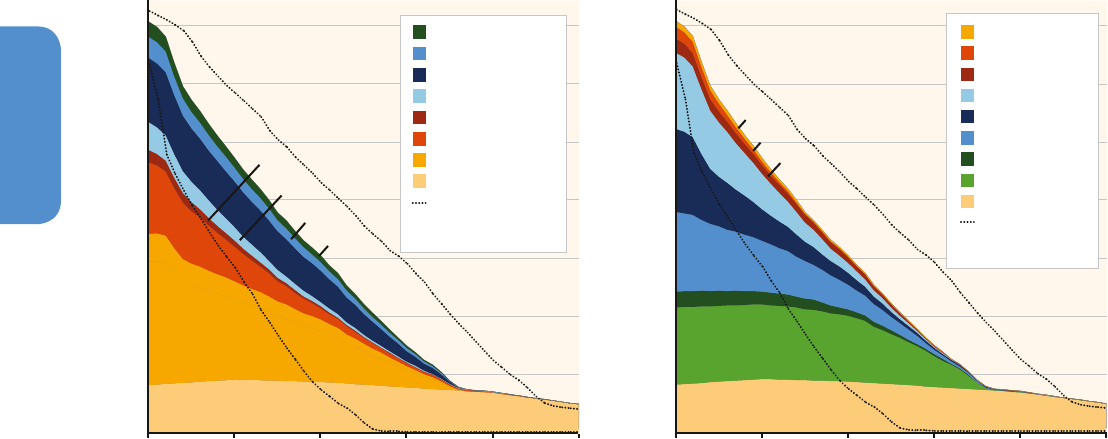
952952
Human Settlements, Infrastructure, and Spatial Planning
12
Chapter 12
12.4.2 Urban form
Urban form can be characterized using four key metrics: density, land
use mix, connectivity, and accessibility. These dimensions are not inde-
pendent from one another. Rather, they measure different aspects of
urban form and structure, and each dimension impacts greenhouse
gas emissions differently (Figure 12.14). The urban form drivers of GHG
emissions do not work in isolation.
Impacts of changes in urban form on travel behaviour are commonly esti-
mated using elasticities, which measure the effect of a 1 % change in an
urban form metric on the percent change in vehicle kilometres travelled
(see Chapter 15.4 on policy evaluation). This allows for a comparison
of magnitudes across different factors and metrics. A large share of the
existing evidence is limited to studies of North American cities. Moreover,
much of this work is focused on larger cities (for an extensive discussion
of methodological considerations see National Research Council, 2009b).
12.4.2.1 Density
Urban density is the measure of an urban unit of interest (e. g., popula-
tion, employment, and housing) per area unit (e. g., block, neighbour-
hood, city, metro area, and nation) (Figure 12.14). There are many
measures of density, and three common measures are population den-
sity (i. e., population per unit area), built-up area density (i. e., buildings
or urban land cover per unit area), and employment density (i. e., jobs
per unit area) (for a comprehensive review on density measures see
Boyko and Cooper, 2011). Urban density affects GHG emissions in two
primary ways. First, separated and low densities of employment, com-
merce, and housing increase the average travel distances for both
work and shopping trips (Frank and Pivo, 1994; Cervero and Kockel-
man, 1997; Ewing and Cervero, 2001; Brownstone and Golob, 2009).
These longer travel distances translate into higher VKT and emissions.
Conversely, higher population densities, especially when co-located
with high employment densities are strongly correlated with lower
GHG emissions (Frank and Pivo, 1994; Kenworthy and Laube, 1999;
Glaeser and Kahn, 2010; Clark, 2013). In the United States, households
located in relatively low density areas (0 – 19 households / km
2
) produce
twice as much GHG emissions as households located in relatively high
density areas (1,900 – 3,900 households / km
2
) (U. S. Department of
Transportation, 2009).
Second, low densities make it difficult to switch over to less energy
intensive and alternative modes of transportation such as public trans-
portation, walking, and cycling because the transit demand is both too
dispersed and too low (Bunting etal., 2002; Saelens etal., 2003; For-
syth etal., 2007). In contrast, higher population densities at places of
origin (e. g., home) and destination (e. g., work, shopping) concentrate
demand that is necessary for mass transit alternatives. The density
thresholds required for successful transit are not absolute, and vary by
type of transit (e. g., bus, light rail, metro), their frequency, and charac-
teristics specific to each city. One of the most comprehensive studies
of density and emission estimates that a doubling of residential densi-
ties in the United States can reduce VKT by 5 – 12 % in the short run,
and if coupled with mixed land use, higher employment densities, and
improvements in transit, can reduce VKT as much as 25 % over the
long run (National Research Council, 2009a). Urban density is thus a
necessary — but not a sufficient — condition for low-carbon cities.
Comparable and consistent estimates of urban densities and changes
in urban densities are difficult to obtain in part because of different
methodologies to calculate density. However, multiple studies using
multiple lines of evidence including satellite data (Deng etal., 2008;
Figure 12.14 | Four key aspects of urban form and structure (density, land use mix, connectivity, and accessibility), their Vehicle Kilometre Travelled (VKT) elasticities, commonly
used metrics, and stylized graphics. The dark blue row segments under the VKT elasticities column provide the range of elasticities for the studies included.
Sources: Numbers from Ewing and Cervero (2010), National Research Council (2009a), and Salon et al (2012) are based on the following original sources: Density (Schimek,
1996; Kockelman, 1997; Sun etal., 1998; Pickrell and Schimek, 1999; Ewing and Cervero, 2001; Holtzclaw etal., 2002; Bhatia, 2004; Boarnet etal., 2003; Bento etal., 2005;
Zhou and Kockelman, 2008; Fang, 2008; Kuzmyak, 2009a; Brownstone and Golob, 2009; Ewing etal., 2009; Greenwald, 2009; Heres-Del-Valle and Niemeier, 2011); Land Use
(Kockelman, 1997; Sun etal., 1998; Pushkar etal., 2000; Ewing and Cervero, 2001, 2010; Chapman and Frank, 2007; Frank and Engelke, 2005; Kuzmyak etal., 2006; Vance and
Hedel, 2007; Brownstone and Golob, 2009; Kuzmyak, 2009b; Frank etal., 2009); Connectivity (Ewing and Cervero, 2001; Boarnet etal., 2003; Chapman and Frank, 2007; Frank
and Engelke, 2005; Ewing etal., 2009; Greenwald, 2009; Frank etal., 2009); Accessibility (Goodwin, 1996; Ewing etal., 1996, 2009; Kockelman, 1997; Cervero and Kockelman,
1997; Sun etal., 1998; Pushkar etal., 2000; Ewing and Cervero, 2001, 2010; Boarnet etal., 2003; Næss, 2005; Cervero and Duncan, 2006; Zegras, 2007; Greenwald, 2009;
Kuzmyak, 2009a, b; Frank etal., 2009; Zegras, 2010; Hymel etal., 2010).
Low CarbonHigh Carbon
Density
Land Use
Connectivity
Accessibility
Metrics to Measure
Co-Variance
With Density
RangesVKT Elasticities
- Household / Population
- Building /Floor-Area Ratio
- Job / Commercial
- Block / Parcel
- Dwelling Unit
- Population Centrality
- Distance to CBD
- Job Accessibility by Auto
and/or Transit
- Accessibility to Shopping
- Intersection Density
- Proportion of Quadrilateral
Blocks
- Sidewalk Dimension
- Street Density
- Land Use Mix
- Job Mix
- Job-Housing Balance
- Job-Population Balance
- Retail Store Count
- Walk Opportunities
–
1.00
0.16
0.39
Population and Job
Residential
Household
Job
Population
Regional Accessibility
Distance to CBD
Job Access by Auto
Job Access by Transit
Road-Induced Access (Short-Run)
Road-Induced Access (Long-Run)
Combined Design Metrics
Intersection Density
Diversity and Entropy Index
Land Use Mix
-0.4 -0.2 0.0 0.2
0.4 0.6 0.8 1.0
Road-Induced Access (short-run)
Road-Induced Access (long-run)
Figure 12.13 | Scenario of CO
2
emissions from existing energy and transportation infrastructure by industry sector (left) and country / region (right). Numbers in panels show the
cumulated CO
2
emissions from 2010 to 2060 in Gt. Source: Davis etal. (2010).
5
10
15
20
25
30
35
CO
2
Emissions [GtCO
2
/yr]
CO
2
Emissions [GtCO
2
/yr]
0
Australia
Russia
Japan
EU-27
United States
Rest of World
India
China
Non-Energy
Commercial
Residential
Industry
International Transport
Other Transport
Road Transport
Primary Energy
Minimum/Maximum
Emissions over All
Scenarios
Non-Energy
5
10
15
20
25
30
35
0
74
13
224
198
29
74
31
106
104
74
22
182
19
198
26
6
9
2020
2030
2040
2050 2060
2010
2020
2030
2040
2050 2060
2010
Minimum/Maximum
Emissions over All
Scenarios
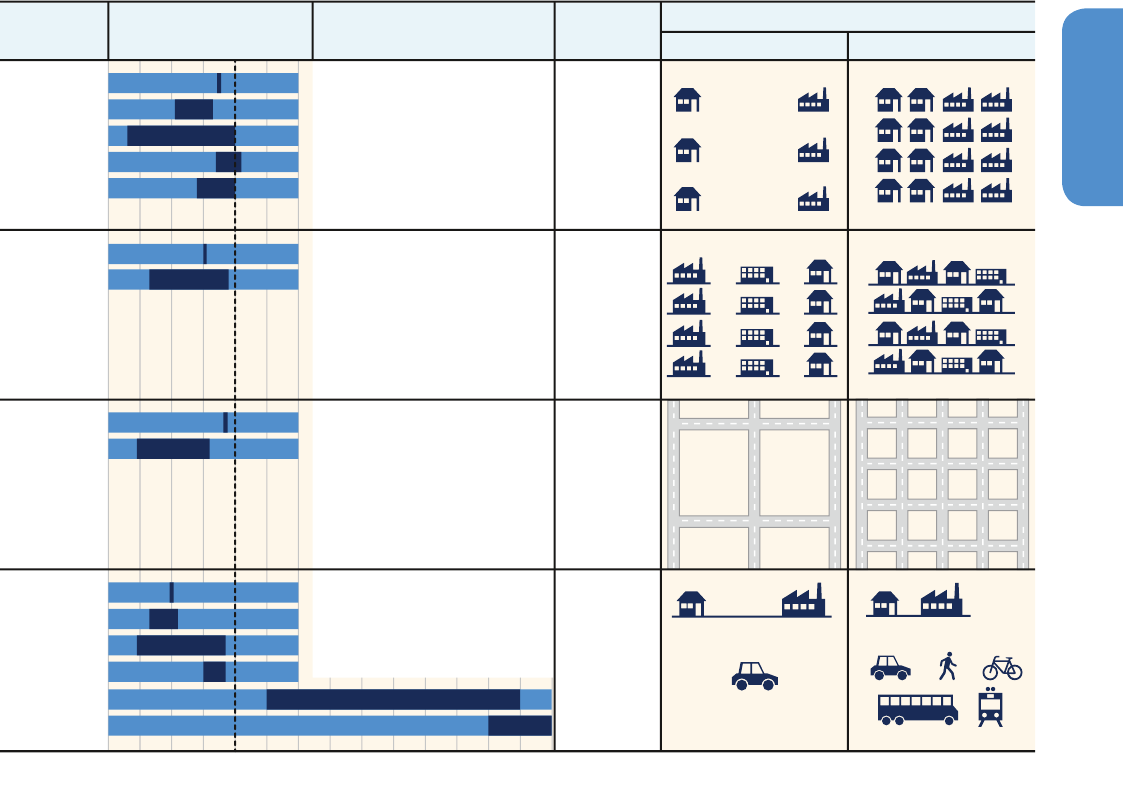
953953
Human Settlements, Infrastructure, and Spatial Planning
12
Chapter 12
Angel etal., 2010, 2011; Seto etal., 2011) and economic and census
data (Burchfield etal., 2006) show that both population and built-up
densities are declining across all regions around the world (see Sec-
tion 12.2 for details). Although there is substantial variation in mag-
nitudes and rates of density decline across income groups, city sizes,
and regions, the overarching trend is a persistent decline in densities
(Angel etal., 2010). The dominant trend is declining density, however
there are some exceptions. Analyses of 100 large cities worldwide
using a microwave scatterometer show significant vertical expansion
of built-up areas in East Asian cities, notably those in China (see Figure
12.15 and Frolking etal., 2013).
A common misconception about density is that it can only be achieved
through high-rise buildings configured in close proximity. However,
the same level of density can be achieved through multiple land use
configurations (Figure 12.16). Population density is strongly correlated
with built density, but high population density does not necessarily
imply high-rise buildings (Cheng, 2009; Salat, 2011).
Medium-rise
(less than seven floors) urban areas with a high building
footprint ratio can have a higher built density than high-rise urban areas
with a low building footprint. These different configurations of high-den-
sity development involve important energy tradeoffs. Often, high-rise,
man, 1997; Ewing and Cervero, 2001; Brownstone and Golob, 2009).
These longer travel distances translate into higher VKT and emissions.
Conversely, higher population densities, especially when co-located
with high employment densities are strongly correlated with lower
GHG emissions (Frank and Pivo, 1994; Kenworthy and Laube, 1999;
Glaeser and Kahn, 2010; Clark, 2013). In the United States, households
located in relatively low density areas (0 – 19 households / km
2
) produce
twice as much GHG emissions as households located in relatively high
density areas (1,900 – 3,900 households / km
2
) (U. S. Department of
Transportation, 2009).
Second, low densities make it difficult to switch over to less energy
intensive and alternative modes of transportation such as public trans-
portation, walking, and cycling because the transit demand is both too
dispersed and too low (Bunting etal., 2002; Saelens etal., 2003; For-
syth etal., 2007). In contrast, higher population densities at places of
origin (e. g., home) and destination (e. g., work, shopping) concentrate
demand that is necessary for mass transit alternatives. The density
thresholds required for successful transit are not absolute, and vary by
type of transit (e. g., bus, light rail, metro), their frequency, and charac-
teristics specific to each city. One of the most comprehensive studies
of density and emission estimates that a doubling of residential densi-
ties in the United States can reduce VKT by 5 – 12 % in the short run,
and if coupled with mixed land use, higher employment densities, and
improvements in transit, can reduce VKT as much as 25 % over the
long run (National Research Council, 2009a). Urban density is thus a
necessary — but not a sufficient — condition for low-carbon cities.
Comparable and consistent estimates of urban densities and changes
in urban densities are difficult to obtain in part because of different
methodologies to calculate density. However, multiple studies using
multiple lines of evidence including satellite data (Deng etal., 2008;
Figure 12.14 | Four key aspects of urban form and structure (density, land use mix, connectivity, and accessibility), their Vehicle Kilometre Travelled (VKT) elasticities, commonly
used metrics, and stylized graphics. The dark blue row segments under the VKT elasticities column provide the range of elasticities for the studies included.
Sources: Numbers from Ewing and Cervero (2010), National Research Council (2009a), and Salon et al (2012) are based on the following original sources: Density (Schimek,
1996; Kockelman, 1997; Sun etal., 1998; Pickrell and Schimek, 1999; Ewing and Cervero, 2001; Holtzclaw etal., 2002; Bhatia, 2004; Boarnet etal., 2003; Bento etal., 2005;
Zhou and Kockelman, 2008; Fang, 2008; Kuzmyak, 2009a; Brownstone and Golob, 2009; Ewing etal., 2009; Greenwald, 2009; Heres-Del-Valle and Niemeier, 2011); Land Use
(Kockelman, 1997; Sun etal., 1998; Pushkar etal., 2000; Ewing and Cervero, 2001, 2010; Chapman and Frank, 2007; Frank and Engelke, 2005; Kuzmyak etal., 2006; Vance and
Hedel, 2007; Brownstone and Golob, 2009; Kuzmyak, 2009b; Frank etal., 2009); Connectivity (Ewing and Cervero, 2001; Boarnet etal., 2003; Chapman and Frank, 2007; Frank
and Engelke, 2005; Ewing etal., 2009; Greenwald, 2009; Frank etal., 2009); Accessibility (Goodwin, 1996; Ewing etal., 1996, 2009; Kockelman, 1997; Cervero and Kockelman,
1997; Sun etal., 1998; Pushkar etal., 2000; Ewing and Cervero, 2001, 2010; Boarnet etal., 2003; Næss, 2005; Cervero and Duncan, 2006; Zegras, 2007; Greenwald, 2009;
Kuzmyak, 2009a, b; Frank etal., 2009; Zegras, 2010; Hymel etal., 2010).
Low CarbonHigh Carbon
Density
Land Use
Connectivity
Accessibility
Metrics to Measure
Co-Variance
With Density
RangesVKT Elasticities
- Household / Population
- Building /Floor-Area Ratio
- Job / Commercial
- Block / Parcel
- Dwelling Unit
- Population Centrality
- Distance to CBD
- Job Accessibility by Auto
and/or Transit
- Accessibility to Shopping
- Intersection Density
- Proportion of Quadrilateral
Blocks
- Sidewalk Dimension
- Street Density
- Land Use Mix
- Job Mix
- Job-Housing Balance
- Job-Population Balance
- Retail Store Count
- Walk Opportunities
–
1.00
0.16
0.39
Population and Job
Residential
Household
Job
Population
Regional Accessibility
Distance to CBD
Job Access by Auto
Job Access by Transit
Road-Induced Access (Short-Run)
Road-Induced Access (Long-Run)
Combined Design Metrics
Intersection Density
Diversity and Entropy Index
Land Use Mix
-0.4 -0.2 0.0 0.2
0.4 0.6 0.8 1.0
Road-Induced Access (short-run)
Road-Induced Access (long-run)
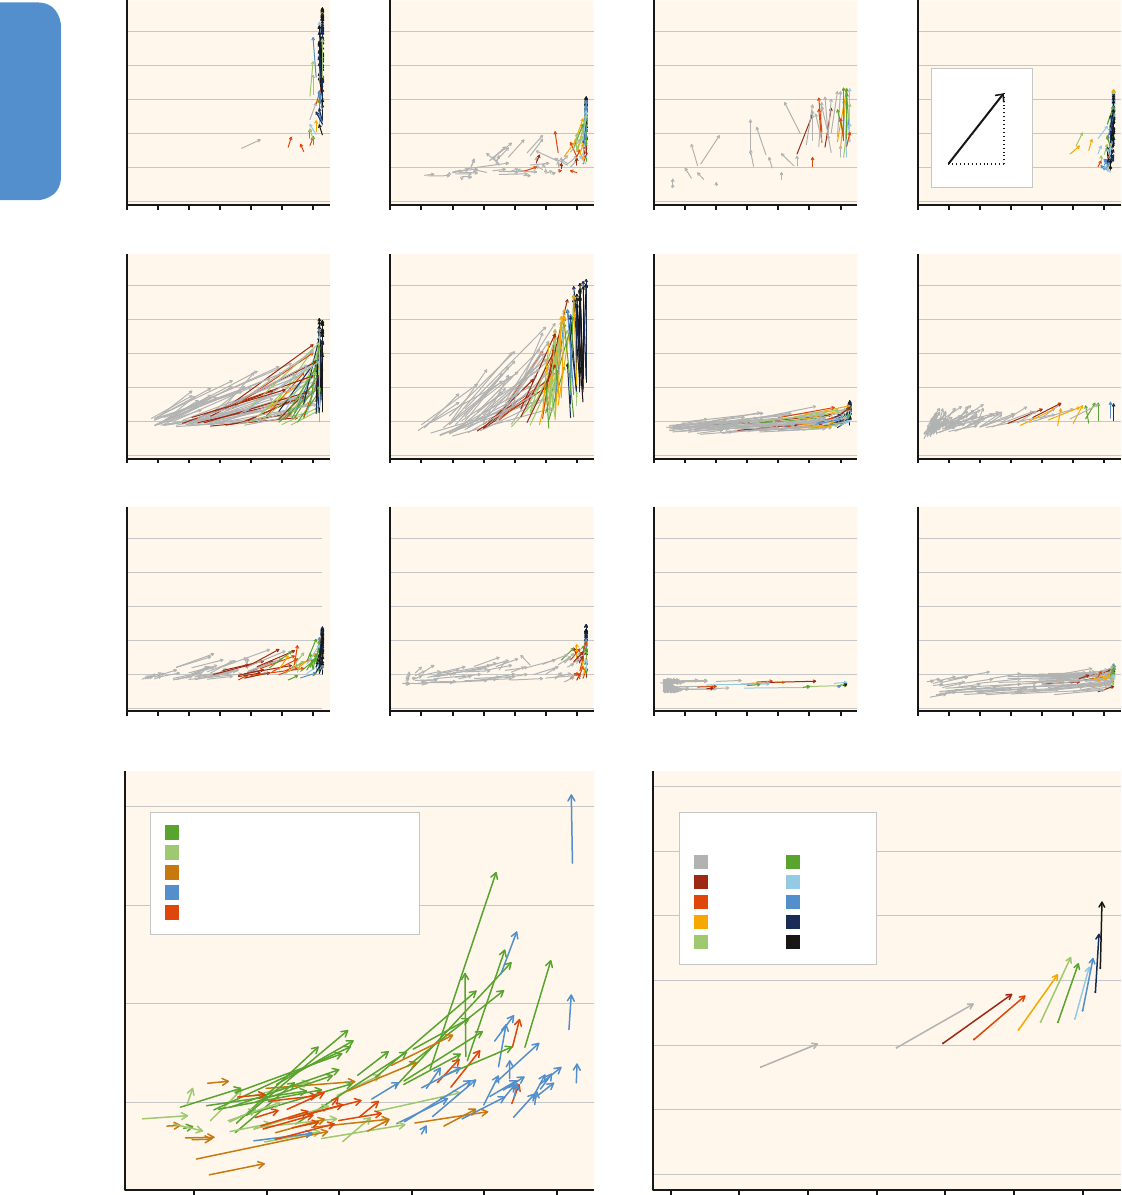
954954
Human Settlements, Infrastructure, and Spatial Planning
12
Chapter 12
Figure 12.15 | Changes in Urban Structure, 1999 – 2009 using backscatter and night time lights. The top 12 panels show changes in vertical structure of major urban areas as
characterized by backscatter power ratio (PR) and horizontal growth as measured by night time lights brightness (NL) for 12 large cities. Coloured arrows represent non-water,
0.05° cells in an 11x11 grid around each city’s centre; tail and head are at 1999 and 2009 coordinates of cell PR and NL, respectively (see inset in top right panel). Arrow colour
corresponds to percent urban cover circa 2001 (see legend in bottom right panel). Bottom right panel shows mean change of a total of 100 cities mapping into the respective urban
cover categories. Bottom left panel shows change for 100 cities colour coded by world regions. Source: Frolking etal. (2013).
1999
2009
∆PR
∆NL
0-9.9%
10-19.9%
100%
90-99.9%
80-89.9%
70-79.9%
60-69.9%
50-59.9%
40-49.9%
30-39.9%
20-29.9%
0-19.9%
Urban Cover
South America and Mexico
Canada, USA, Europe, Australia and Japan
Africa and Near East
South Asia
East and Southeast Asia
0 10 20 30 40 50 60
0.0
0.1
0.2
0.3
0.4
0.5
Tokyo
Night Time Lights Brightness [max=63]Night Time Lights Brightness [max=63]Night Time Lights Brightness [max=63]Night Time Lights Brightness [max=63]
Night Time Lights Brightness [max=63]Night Time Lights Brightness [max=63]Night Time Lights Brightness [max=63]Night Time Lights Brightness [max=63]
Night Time Lights Brightness [max=63]Night Time Lights Brightness [max=63]Night Time Lights Brightness [max=63]Night Time Lights Brightness [max=63]
Backscatter Power Ratio
0 10 20 30 40 50 60
0.0
0.1
0.2
0.3
0.4
0.5
London
Backscatter Power Ratio
0 10 20 30 40 50 60
0.00
0.05
0.10
0.15
0.20
0.25
0.30
Night Time Lights Brightness [max=63]
Backscatter Power Ratio
Backscatter Power Ratio
10 20 30 40 50 60
0.1
0.2
0.3
0.4
Shanghai
Tokyo
Night Time Lights Brightness [max=63]
0 10 20 30 40 50 60
0.0
0.1
0.2
0.3
0.4
0.5
Beijing
Backscatter Power Ratio
0 10 20 30 40 50 60
0.0
0.1
0.2
0.3
0.4
0.5
São Paulo
Backscatter Power Ratio
0 10 20 30 40 50 60
0.0
0.1
0.2
0.3
0.4
0.5
Hong Kong
Backscatter Power Ratio
0 10 20 30 40 50 60
0.0
0.1
0.2
0.3
0.4
0.5
New York
Backscatter Power Ratio
0 10 20 30 40 50 60
0.0
0.1
0.2
0.3
0.4
0.5
Mexico-City
Backscatter Power Ratio
0 10 20 30 40 50 60
0.0
0.1
0.2
0.3
0.4
0.5
Shanghai
Backscatter Power Ratio
0 10 20 30 40 50 60
0.0
0.1
0.2
0.3
0.4
0.5
Delhi
Backscatter Power Ratio
0 10 20 30 40 50 60
0.0
0.1
0.2
0.3
0.4
0.5
Kinshasa
Backscatter Power Ratio
0 10 20 30 40 50 60
0.0
0.1
0.2
0.3
0.4
0.5
Dhaka
Backscatter Power Ratio
0 10 20 30 40 50 60
0.0
0.1
0.2
0.3
0.4
0.5
Cairo
Backscatter Power Ratio
Seoul
NYC
Khartoum
Kabul

955955
Human Settlements, Infrastructure, and Spatial Planning
12
Chapter 12
high-density urban areas involve a tradeoff between building height and
spacing between buildings — higher buildings have to be more spaced
out to allow light penetration. High-rise buildings imply higher energy
costs in terms of vertical transport and also in heating, cooling, and light-
ing due to low passive volume ratios (Ratti etal., 2005; Salat, 2009).
Medium-rise, high-density urban areas can achieve similar levels of den-
sity as high-rise, high density developments but require less materials
and embodied energy (Picken and Ilozor, 2003; Blackman and Picken,
2010). Their building operating energy levels are lower due to high pas-
sive volume ratio (Ratti et al., 2005; Salat, 2009). Single storey, free-
standing housing units are more GHG emissions intensive than multi-
family, semi-detached buildings (Myors etal., 2005; Perkins etal., 2009).
Thus, while the effect of building type on energy use may be relatively
small, the combination of dwelling type, design, location, and orientation
together can generate significant energy savings (Rickwood etal., 2008).
12.4.2.2 Land use mix
Land use mix refers to the diversity and integration of land uses (e. g.,
residential, park, commercial) at a given scale (Figure 12.17). As with
density, there are multiple measures of land use mix, including: (1) the
ratio of jobs to residents; (2) the variety and mixture of amenities and
activities; and (3) the relative proportion of retail and housing. Histori-
cally, the separation of land uses, especially of residential from other
uses, was motivated by the noxious uses and pollution of the industrial
city. However, as cities transition from industrial to service economies,
resulting in a simultaneous reduction in air pollution and other nui-
sances, the rationale for such separation of land uses diminishes.
In general, when land uses are separated, the distance between origin
(e. g., homes) and destination (e. g., work or shopping) will be longer
(Kockelman, 1997). Hence, diverse and mixed land uses can reduce travel
distances and enable both walking and the use of non-motorized modes
of travel (Kockelman, 1997; Permana et al., 2008), thereby reducing
aggregate amounts of vehicular movement and associated greenhouse
gas emissions (Lipper etal., 2010). Several meta-analyses estimate the
elasticity of land use mix related VKT from – 0.02 to – 0.10 (Ewing and
Cervero, 2010; Salon etal., 2012) while simultaneously increasing walk-
ing. The average elasticity between walking and diversity of land uses
is reported to be between 0.15 – 0.25 (Ewing and Cervero, 2010). The
effects of mixed land use on VKT and GHG emissions can applied at
three spatial scales; city-regional, neighbourhood, and block.
At the city-scale, a high degree of land use mix can result in signifi-
cant reductions in VKT by increasing the proximity of housing to office
developments, business districts, shops, and malls (Cervero and Duncan,
2006). In service-economy cities with effective air pollution controls,
mixed land use can also have a beneficial impact on citizen health and
well-being by enabling walking and cycling (Saelens etal., 2003; Heath
etal., 2006; Sallis etal., 2009). For cities with lower mixed land use, such
as often found in North American cities and in many new urban develop-
Figure 12.16 | Same densities in three different layouts: low-rise single-story homes (left); multi-story medium-rise (middle); high-rise towers (right). Adapted from Cheng (2009).
Commercial
Park
Residental
Figure 12.17 | Three different land use mixes (Manaugh and Kreider, 2013).

956956
Human Settlements, Infrastructure, and Spatial Planning
12
Chapter 12
ments in Asia, large residential developments are separated from jobs or
retail centres by long distances. A number of studies of such single-use
zoning show strong tendencies for residents to travel longer overall dis-
tances and to carry out a higher proportion of their travel in private vehi-
cles than residents who live in mixed land use areas in cities (Mogridge,
1985; Fouchier, 1998; Næss, 2005; Zhou and Kockelman, 2008).
Mixed use at the neighbourhood scale refers to a ‘smart’ mix of resi-
dential buildings, offices, shops, and urban amenities (Bourdic etal.,
2012). Similar to the city-scale case, such mixed uses can decrease
average travel distances (McCormack etal., 2001). However, on the
neighbourhood scale, the reduced travel is primarily related to non-
work trips, e. g., for shopping, services, and leisure. Research on US
cities indicates that the presence of shops and workplaces near resi-
dential areas is associated with relatively low vehicle ownership rates
(Cervero and Duncan, 2006), and can have a positive impact on trans-
portation patterns (Ewing and Cervero, 2010). The impacts of mixed
use on non-motorized commuting such as cycling and walking and the
presence or absence of neighbourhood shops can be even more impor-
tant than urban density (Cervero, 1996).
At the block and building scale, mixed use allows space for small-
scale businesses, offices, workshops, and studios that are intermixed
with housing and live-work spaces. Areas with a high mix of land uses
encourages a mix of residential and retail activity and thus increases
the area’s vitality, aesthetic interest, and neighbourhood (Hoppenbrou-
wer and Louw, 2005).
12.4.2.3 Connectivity
Connectivity refers to street density and design. Common measures of
connectivity include intersection density or proportion, block size, or
intersections per road kilometre (Cervero and Kockelman, 1997; Push-
kar etal., 2000; Chapman and Frank, 2007; Lee and Moudon, 2006;
Fan, 2007). Where street connectivity is high — characterized by finer
grain systems with smaller blocks that allow frequent changes in direc-
tion — there is typically a positive correlation with walking and thereby
lower GHG emissions. Two main reasons for this are that distances
tend to be shorter and the system of small blocks promotes conve-
nience and walking (Gehl, 2010).
Improving connectivity in areas where it is low (and thus associated
with higher GHG emissions) requires varying amounts of street recon-
struction. Many street features, such as street size, four-way intersec-
tions or intersection design, sidewalk width, the number of traffic lanes
(or street width) and street medians are designed at the time of the
construction of the city. As the infrastructure already exists, increas-
ing connectivity requires investment either to redevelop the site or to
retrofit it to facilitate walking and biking. In larger redevelopment proj-
ects, street patterns may be redesigned for smaller blocks with high
connectivity. Alternatively, retrofitting often involves widening side-
walks, constructing medians, and adding bike lanes, as well as reduc-
ing traffic speeds, improving traffic signals, and providing parking for
bikes (McCann and Rynne, 2010). Other features, such as street furni-
ture (e. g., benches, transit stops, and shelters), street trees, and traffic
signals, can be added after the initial design without much disruption
or large costs.
Systematic reviews show that transport network connectivity has a
larger impact on VKT than density or land use mix, between – 0.06
and – 0.26 (Ewing and Cervero, 2010; Salon etal., 2012). For North
American cities, the elasticity of walking with respect to sidewalk cov-
erage or length is between 0.09 to 0.27 (Salon etal., 2012). There are
typically higher elasticities in other OECD countries than in the United
States.
12.4.2.4 Accessibility
Accessibility can be defined as access to jobs, housing, services, shop-
ping, and in general, to people and places in cities (Hansen, 1959;
Ingram, 1971; Wachs and Kumagai, 1973). It can be viewed as a
combination of proximity and travel time, and is closely related to
land use mix. Common measures of accessibility include population
centrality, job accessibility by auto or transit, distance to the city cen-
tre or central business district (CBD), and retail accessibility. Meta-
analyses show that VKT reduction is most strongly related to high
accessibility to job destinations (Ewing and Cervero, 2001, 2010).
Highly accessible communities (e. g., compact cities in Europe such as
Copenhagen) are typically characterized by low daily commuting dis-
tances and travel times, enabled by multiple modes of transportation
(Næss, 2006). Measures to increase accessibility that are accompa-
nied by innovative technologies and alternative energies can reduce
VKT and associated GHG emissions in the cities of both developed
and developing countries (Salomon and Mokhtarian, 1998; Axhau-
sen, 2008; Hankey and Marshall, 2010; Banister, 2011). However,
it should be noted that at least one study has shown that in cities
where motorization is already mature, changing accessibility no lon-
ger influences automobile-dependent lifestyles and travel behaviours
(Kitamura etal., 2001).
Countries and regions undergoing early stages of urbanization may
therefore have a unique potential to influence accessibility, particu-
larly in cases where income levels, infrastructure, and motorization
trends are rapidly changing (Kumar, 2004; Chen etal., 2008; Perkins
etal., 2009; Reilly etal., 2009; Zegras, 2010; Hou and Li, 2011; Adey-
inka, 2013). In Shanghai, China, new transportation projects have
influenced job accessibility and have thereby reduced commute times
(Cervero and Day, 2008). In Chennai, India, differences in accessibil-
ity to the city centre between low-income communities have been
shown to strongly affect transport mode choice and trip frequency
(Srinivasan and Rogers, 2005). In the rapidly motorizing city of San-
tiago de Chile, proximity to the central business district as well as
metro stations has a relatively strong association with VKT (Zegras,
2010). The typical elasticity between job accessibility and VKT across

957957
Human Settlements, Infrastructure, and Spatial Planning
12
Chapter 12
North American cities ranges from – 0.10 to – 0.30 (Ewing and Cer-
vero, 2010; Salon etal., 2012).
12.4.2.5 Effects of combined options
While individual measures of urban form have relatively small effects
on vehicle miles travelled, they become more effective when com-
bined. For example, there is consistent evidence that the combination
of co-location of increased population and job densities, substantial
investments in public transit, higher mix of land uses, and transporta-
tion or mobility demand management strategiescan reduce VKT and
travel-related carbon emissions (National Research Council, 2009a;
Ewing and Cervero, 2010; Salon etal., 2012). The spatial concentration
of population, coupled with jobs-housing balance, have a significant
impact VKT by households. At the same time, urban form and the den-
sity of transportation networks also affect VKT (Bento etal., 2005). The
elasticity of VKT with respect to each of these factors is relatively small,
between 0.10 and 0.20 in absolute value. However, changing several
measures of form simultaneously can reduce annual VKT significantly.
Moving the sample households from a city with the characteristics of
a low-density, automobile-centric city to a city with high public transit,
connectivity, and mixed land use reduced annual VKT by 25 %. While in
practice such change is highly unlikely in a mature city, it may be more
relevant when considering cities at earlier stages of development.
A growing body of literature shows that traditional neighbourhood
designs are associated with reduced travel and resource conservation
(Krizek, 2003; Ewing and Cervero, 2010). A US study found those liv-
ing in neo-traditional neighbourhoods made as many daily trips as
those in low-density, single-family suburban neighbourhoods, how-
ever the switch from driving to walking and the shortening of trip
distances resulted in a 20 % less VKT per household (Khattak and
Rodriguez, 2005). Empirical research shows that the design of streets
have even stronger influences than urban densities on incidences of
walking and reduced motorized travel in traditional neighbourhoods
of Bogota, Tehran, Taipei, and Hong Kong SAR (China) (Zhang, 2004;
Cervero etal., 2009; Lin and Yang, 2009; Lotfi and Koohsari, 2011). A
study in Jinan, China, found the energy use of residents living in
mixed-use and grid street enclaves to be one-third that of similar
households in superblock, single-use developments (Calthorpe,
2013).
Box 12.3 | Urban expansion: drivers, markets, and policies
While the literature that examines the impacts of changes in
urban spatial structure and infrastructure on urban GHG emis-
sions is sparse, there is a well-established body of literature that
discusses the drivers of urban development, and policies that aim
to alter its pace and shape.
Drivers of Urban Expansion — The drivers of urban development
can be broadly defined into the following categories: Economic
Geography, Income, Technology (see Section 12.3.1), as well as
Market Failures (see Chapter 15), and Pre-Existing Conditions,
which are structured by Policies and Regulations (see Section
12.5.2) that in turn shape Urban Form and Infrastructure (see Sec-
tion 12.4 and Box 12.4).
Primary drivers of urban spatial expansion unfold under the
influence of economic conditions and the functioning of markets.
These are however strongly affected by Market Failures and
Pre-Existing Policies and Regulations that can exacerbate or
alleviate the effect of the primary drivers on urban growth.
Market Failures are the result of individuals and firms ignoring
the external costs and benefits they impose on others when mak-
ing economic decisions (see Chapter 15). These include:
• Failure to account for the social costs of GHG (and local) emis-
sions that result from production and consumption activities
in cities.
• Failure to account for the social costs of traffic congestion (see
Chapter 8).
• Failure to assign property rights and titles for land.
• Failure to account for the social benefits of spatial amenities
and mix land uses (see Section 12.5.2.3).
• Failure to account for the social benefits of agglomeration
that result from the interactions of individuals and firms in
cities.
Although not precisely quantified in the literature, by altering the
location of individuals and firms in space (and resulting travelling
patterns and consumption of space), these market failures can
lead to excessive growth (see Box 12.4).
For each failure, there is a policy solution, either in the form of
regulations or market-based instruments (see Section 12.5.2)
Pre-Existing Policies and Regulations can also lead to exces-
sive growth. These include:
• Hidden Pre-Existing Subsidies — including the failure to
charge new development for the infrastructure costs it gener-
ates (see Section 12.5.3 and Box 12.4).
• Outdated or Poorly Designed Pre-Existing Policies and
Regulations — including zoning, building codes, ordinances,
and property taxes that can distort real estate markets (see
Section 12.5.2 and Box 12.4).

958958
Human Settlements, Infrastructure, and Spatial Planning
12
Chapter 12
12.5 Spatial planning and
climate change mitigation
Spatial planning is a broad term that describes systematic and coordi-
nated efforts to manage urban and regional growth in ways that promote
well-defined societal objectives such as land conservation, economic
development, carbon sequestration, and social justice. Growth manage-
ment is a similar idea, aimed at guiding “the location, quality, and timing
of development” (Porter, 1997) to minimize ‘sprawl’ (Nelson and Duncan,
1995), which is characterized by low density, non-contiguous, automo-
bile-dependent development that prematurely or excessively consumes
farmland, natural preserves, and other valued resources (Ewing, 1997).
This section reviews the range of spatial planning strategies that may
reduce emissions through impacts on most if not all of the elements
of urban form and infrastructure reviewed in Section 12.4. It begins
with an assessment of key spatial planning strategies that can be
implemented at the macro, meso, and micro geographic scales. It then
assesses the range of regulatory, land use, and market-based policy
instruments that can be employed to achieve these strategic objectives.
Given evidence of the increased emissions reduction potential associ-
ated with affecting the collective set of spatial factors driving emissions
(see Section 12.4), emphasis is placed on assessing the efficacy of strat-
egies or bundles that simultaneously impact multiple spatial outcomes
(see Chapter 15.4 and 15.5 on policy evaluation and assessment).
The strategies discussed below aim to reduce sprawl and automobile
dependence – and thus energy consumption, VKT, and GHG emissions – to
varying degrees. Evidence on the energy and emission reduction bene-
fits of these strategies comes mainly from case studies in the developed
world even though their greatest potential for reducing future emissions
lies in developing countries undergoing early stages of urbanization.
The existing evidence highlights the importance of an integrated infra-
structure development framework that combines analysis of mitigation
reduction potentials alongside the long-term public provision of services.
12.5.1 Spatial planning strategies
Spatial planning occurs at multiple geographic scales: (1) Macro — regions
and metropolitan areas; (2) Meso — sub-regions, districts, and corridors;
and (3) Micro — neighbourhoods, streets, blocks. At each scale, some
form of comprehensive land-use and transportation planning provides
a different opportunity to envision and articulate future settlement pat-
terns, backed by zoning ordinances, subdivision regulations, and capital
improvements programmes to implement the vision (Hack etal., 2009).
Plans at each scale must also be harmonized and integrated to maxi-
mize effectiveness and efficiency (Hoch etal., 2000). Different strategy
bundles invite different policy tools, adapted to the unique political, insti-
tutional, and cultural landscapes of cities in which they are applied (see
Table 12.5). Successful implementation requires that there be in place
the institutional capacity and political wherewithal to align the right
policy instruments to specific spatial planning strategies.
12.5.1.1 Macro: Regions and metropolitan areas
Macro-scale strategies are regional in nature, corresponding to the
territories of many economic transactions (e. g., laboursheds and
tradesheds) and from where natural resources are drawn (e. g., water
tributaries) or externalities are experienced (e. g., air basins).
Regional Plan. A regional plan shows where and when different types
of development are allowed, and where and when they are not. In poly-
centric plans, sub-centres often serve as building blocks for designing
regional rail-transit networks (Calthorpe and Fulton, 2001). Regional
strategies can minimize environmental spillovers and economize on
large-scale infrastructure investments (Calthorpe and Fulton, 2001;
Seltzer and Carbonell, 2011). Polycentric metropolises like Singapore,
Tokyo, and Paris have successfully linked sub-centres with high-qual-
ity, synchronized metro-rail and feeder bus services (Cervero, 1998;
Gakenheimer, 2011). Spatial plans might be defined less in terms of a
specific urban-form vision and more with regard to core development
principles. In its ‘Accessible Ahmedabad’ plan, the city of Ahmedabad,
India, embraced the principle of creating a city designed for accessibility
rather than mobility, without specific details on the siting of new growth
(Suzuki etal., 2013).
Urban containment. Urban containment encourages cities and their
peripheries to grow inwards and upwards, not outwards (Pendall etal.,
2002). Urban containment can also contribute to climate change mitiga-
tion by creating more compact, less car-oriented built form as well as by
preserving the carbon sequestration capacity of natural and agricultural
areas in the surrounding areas (Daniels, 1998). The impact of develop-
ment restrictions is uncertain and varies with the geographic and regula-
tory context (Pendall, 1999; Dawkins and Nelson, 2002; Han etal., 2009;
Woo and Guldmann, 2011). In the United States, regional measures such
as the Portland urban growth boundary have been more effective at con-
taining development than local initiatives (DeGrove and Miness, 1992;
Nelson and Moore, 1993; Boyle and Mohamed, 2007). In the UK, urban
containment policies may have pushed growth to leapfrog the greenbelt
to more distant locations and increased car commuting (Amati, 2008). In
Seoul and in Swiss municipalities, greenbelts have densified the core city
but made the metropolitan area as a whole less compact; in Seoul, com-
muting distances also increased by 5 % (Jun and Bae, 2000; Bae and Jun,
2003; Bengston and Youn, 2006; Gennaio etal., 2009).
Regional jobs-housing balance. Separation of workers from job sites
creates long-haul commutes and thus worsens traffic and environmental
conditions (Cervero, 1996). Jobs-housing imbalances are often a product
of insufficient housing in jobs-rich cities and districts (Boarnet and Crane,
2001; Wilson, 2009; Pendall etal., 2012). One view holds that the market
will eventually work around such problems – developers will build more
housing near jobs because more profit can be made from such housing

959959
Human Settlements, Infrastructure, and Spatial Planning
12
Chapter 12
Table 12.5 | Matching spatial planning strategies and policy instruments. Summary of the types of policy instruments that can be applied to different spatial planning strategies
carried out at different geographic scales. Unless otherwise noted, references can be found in the relevant chapter sections.
SPATIAL STRATEGY
POLICY INSTRUMENTS / IMPLEMENTATION TOOLS
Government Regulations Government Incentives Market-Based Strategies
Land
Regulation / Zoning
(see 12.5.2.1)
Taxation / Finance
Strategies
(see 12.5.2.3)
Land Management
(see 12.5.2.2)
Targeted Infrastruc-
ture / Services
(see 12.5.1)
Pricing
(see 12.5.2.3)
Public-Private
Partnerships
(see 12.5.2.3)
Metropolitan / Regional
Urban containment Development restrictions;
UGBs
Sprawl taxes Urban Service
Boundaries
Park improvements; trail
improvements
Balanced growth Affordable housing
mandates
Tax-bases sharing Extraterritorial zoning Farm Tax
Credits
1
Self-contained
communities / new towns
Mixed-use zoning Greenbelts Utilities; urban services Joint ventures
2
Corridor / District
Corridor growth
management
Zoning Impact fees;
Exactions
3
Service Districts
4
Transit-oriented corridors Transfer of development
rights
Urban rail; Bus rapid
transit investments
Joint Powers Authorities
Neighbourhood / Community
Urban Regeneration / Infill Mix-use zoning / small lot
designations
Split-Rate Property Taxes;
Tax increment finance
5
Redevelopment districts Highway conversions;
Context-sensitive
design standards
Congestion charges
(see Ch. 8)
Traditional
Neighbourhood Designs;
New urbanism
Zoning overlays; form-
based codes
Sidewalks; cycle tracks;
bike stations
6
Transit oriented
Development
Design codes; flexible
parking
Impact Fees; Betterment
Taxes
7
Station siting; station
access
Joint development
2
Eco-Communities Mixed-use zoning District Heating / Cooling;
co-generation (see
Ch. 9.4)
Peak-load pricing Joint venture
2
Site / Streetscape
Pedestrian Zones / Car-
Free Districts
Street code revisions
8
Special Improvement
Districts
7
Road entry restrictions;
sidewalks
8
Parking surcharges
Traffic Calming / Context-
Sensitive Design
Street code revisions
8
Benefit Assessment
7
Property owner self-
assessments
Complete Streets Design standards Bike infrastructure;
Pedestrian facilities
Design competitions
Additional sources referenced in table: 1: Nelson (1992), Alterman (1997); 2: Sagalyn (2007), Yescombe (2007); 3: Hagman and Misczynski (1978), Bauman and Ethier (1987); 4:
Rolon (2008); 5: Dye and Sundberg (1998), Dye and Merriman (2000), Brueckner (2001b); 6: Sælensminde (2004), McAndrews et al. (2010); 7: Rolon (2008); 8: Brambilla and
Longo (1977).
(Gordon etal., 1991; Downs, 2004). There is evidence of co-location in
US cities like Boston and Atlanta (Weitz, 2003). Even in the developing
world, co-location occurs as a means to economize on travel, such as the
peri-urban zones of Dar es Salaam and Lagos where infill and densifica-
tion, often in the form of informal settlements and shantytowns, occurs
in lieu of extended growth along peripheral radial roads (Pirie, 2011).
Research on balanced growth strategies provides mixed signals on
mobility and environmental impacts. Studies of Atlanta estimate that
jobs-housing balance can reduce traffic congestion, emissions, and
related externalities (Weitz, 2003; Horner and Murray, 2003). In the
San Francisco Bay Area, jobs-housing balance has reduced travel more
than intermixing housing and retail development (Cervero and Duncan,
2006). Other studies, however, suggest that jobs-housing balance has
little impact on travel and traffic congestion since many factors besides
commuting condition residential location choices (Levine, 1998).
Self-contained, ‘complete’ communities — wherein the jobs, retail com-
modities and services needed by workers and households exist within
a community — is another form of balanced growth. Many master-
planned new towns in the United States, France, South Korea, and the
UK were designed as self-contained communities, however their physi-
cal isolation and economic dependence on major urban centres resulted
in high levels of external motorized travel (Cervero, 1995b; Hall, 1996).

960960
Human Settlements, Infrastructure, and Spatial Planning
12
Chapter 12
How new towns are designed and the kinds of transport infrastructure
built, experiences show, have strongly influenced travel and environ-
mental outcomes (Potter, 1984). In the UK, new towns designed for
good transit access (e. g., Runcorn and Redditch) averaged far higher
transit ridership and less VKT per capita than low-density, auto-oriented
communities like Milton Keynes and Washington, UK (Dupree, 1987).
Telecommunities are a more contemporary version of self-contained
communities, combining information and communication technologies
(ICTs) with traditional neighbourhood designs in remote communities
on the edges of cities like Washington, DC and Seattle (Slabbert, 2005;
Aguilera, 2008). Until such initiatives scale up, their contributions to
VKT and GHG reductions will likely remain miniscule (Choo et al.,
2005; Andreev etal., 2010; Mans etal., 2012).
12.5.1.2 Meso: Sub-regions, corridors, and districts
The corridor or district scale captures the spatial context of many day-to-
day activities, such as going to work or shopping for common household
items. Significant challenges are often faced in coordinating transporta-
tion and land development across multiple jurisdictions along a corridor.
Corridor growth management. Corridor-level growth management
plans aim to link land development to new or expanded infrastructure
investments (Moore etal., 2007). Both land development and transport
infrastructure need years to implement, so coordinated and strategic
long-range planning is essential (Gakenheimer, 2011). Once a transport
investment is committed and land use policies are adopted, the two can
co-evolve over time. A good example of coordinated multi-jurisdictional
management of growth is the 20 km Paris-Pike corridor outside of
Lexington, Kentucky in the United States (Schneider, 2003). There, two
county governments reached an agreement and created a new extra-ter-
ritorial authority to zone land parcels for agricultural activities within a
0.5 km radius of a newly expanded road to preserve the corridor’s rural
character, prevent sprawl, and maintain the road’s mobility function.
Transit-oriented corridors. Corridors also present a spatial context
for designing a network of Transit Oriented Developments (TODs), tra-
ditional (e. g., compact, mixed-use, and pedestrian-friendly) develop-
ment that is physically oriented to a transit station. TODs are expected
to reduce the need to drive, and thus reduce VKT. Some global cities
have directed land uses typically scattered throughout suburban devel-
opments (e. g., housing, offices, shops, restaurants, and strip malls) to
transit-served corridors (Moore etal., 2007; Ferrell etal., 2011). Scan-
dinavian cities like Stockholm, Helsinki, and Copenhagen have created
‘necklace of pearls’ built form not only to induce transit riding but also
to produce balanced, bi-directional flows and thus more efficient use
of infrastructure (Cervero, 1998; Suzuki etal., 2013).
Curitiba, Brazil, is often heralded as one of the world’s most sustain-
able cities and is a successful example of the use of Transit Oriented
Corridors (TOCs) to shape and direct growth (Cervero, 1998; Duarte
and Ultramari, 2012). The city has evolved along well-defined radial
axes (e. g., lineal corridors) that are served by dedicated busways.
Along some transportation corridors, double-articulated buses transport
about 16,000 passengers per hour, which is comparable to the capacity
of more expensive metro-rail systems (Suzuki etal., 2013). To ensure
a transit-oriented built form, Curitiba’s government mandates that all
medium- and large-scale urban development be sited along a Bus Rapid
Transit (BRT) corridor (Cervero, 1998; Hidalgo and Gutiérrez, 2013). High
transit use has appreciably shrunk the city’s environmental footprint. In
2005, Curitiba’s VKT per capita of 7,900 was half as much as in Bra-
zil’s national capital Brasilia, a city with a similar population size and
income level but a sprawling, auto-centric built form (Santos, 2011).
12.5.1.3 Micro: communities, neighbourhoods,
streetscapes
The neighbourhood scale is where activities like convenience shopping,
socializing with neighbours, and walking to school usually take place,
and where urban design approaches such as gridded street patterns
and transit-oriented development are often targeted. While smaller
scale spatial planning might not have the energy conservation or
emission reduction benefits of larger scale planning strategies, devel-
opment tends to occur parcel-by-parcel and urbanized areas are ulti-
mately the products of thousands of individual site-level development
and design decisions.
Urban Regeneration and Infill Development. The move to curb
urban sprawl has spawned movements to revitalize and regenerate
long-standing traditional urban centres (Oatley, 1995). Former indus-
trial sites or economically stagnant urban districts are often fairly close
to central business districts, offering spatial proximity advantages.
However, brownfield redevelopment (e. g., tearing down and replacing
older buildings, remediating contaminated sites, or upgrading worn
out or obsolete underground utilities) can often be more expensive
than building anew on vacant greenfield sites (Burchell etal., 2005).
In recent decades, British planners have turned away from building
expensive, master-planned new towns in remote locations to creating
‘new towns / in town’, such as the light-rail-served Canary Wharf brown-
field redevelopment in east London (Gordon, 2001). Recycling former
industrial estates into mixed-use urban centres with mixed-income
housing and high-quality transit services have been successful models
(Foletta and Field, 2011). Vancouver and several other Canadian cities
have managed to redirect successfully regional growth to their urban
cores by investing heavily in pedestrian infrastructure and emphasizing
an urban milieu that is attractive to families. In particular, Vancouver has
invested in developing attractive and inviting urban spaces, high quality
and dedicated cycling and walking facilities, multiple and reliable pub-
lic transit options, and creating high-density residential areas that are
integrated with public and cooperative housing (Marshall, 2008). Seoul,
South Korea, has sought to regenerate its urban core through a mix
of transportation infrastructure investments and de-investments, along

961961
Human Settlements, Infrastructure, and Spatial Planning
12
Chapter 12
with urban renewal (Jun and Bae, 2000; Jun and Hur, 2001). Reclaiming
valuable inner-city land in the form of tearing down an elevated free-
way and expropriating roadway lanes, replaced by expanded BRT ser-
vices and pedestrian infrastructure has been the centrepiece of Seoul’s
urban regeneration efforts (Kang and Cervero, 2009).
Traditional neighbourhood design and new urbanism. Another
movement, spearheaded by reform-minded architects and environ-
mental and sustainability planners, has been to return communities
to their designs and qualities of yesteryear, before the ascendency of
the private automobile (Nasar, 2003). Referred to as ‘compact cities’ in
much of Europe and ‘New Urbanism’ in the United States, the move-
ment takes on features of traditional, pre-automobile neighbourhoods
that feature grid iron streets and small rectilinear city blocks well
suited to walking, narrow lots and building setbacks, prominent civic
spaces that draw people together (and thus help build social capital),
tree-lined narrow streets with curbside parking and back-lot alleys that
slow car traffic, and a mix of housing types and prices (Kunstler, 1998;
Duany etal., 2000; Talen, 2005).
In the United States, more than 600 New Urbanism neighbourhoods
have been built, are planned, or are under construction (Trudeau,
2013). In Europe, a number of former brownfield sites have been rede-
veloped since the 1980s based on traditional versus modernist design
principles (Fraker, 2013). In developing countries, recent examples of
neighbourhood designs and redevelopment projects that follow New
Urbanism principles to varying degrees are found in Belize, Jamaica,
Bhutan, and South Africa (Cervero, 2013).
Transit Oriented Development (TOD). TODs can occur at a corridor
scale, as discussed earlier for cities like Curitiba and Stockholm, or as
is more common, take on a nodal, neighbourhood form. Besides being
the ‘jumping off’ point for catching a train or bus, TODs also serve other
community purposes. Scandinavian TODs often feature a large civic
square that functions as a community’s hub and human-scale entry-
way to rail stations (Bernick and Cervero, 1996; Curtis etal., 2009).
In Stockholm and Copenhagen, TOD has been credited with reducing
VKT per capita to among the lowest levels anywhere among high-
income cities (Newman and Kenworthy, 1999). In the United States,
studies show that TODs can decrease per capita use of cars by 50 %. In
turn, this could save households about 20 % of their income (Arrington
and Cervero, 2008). TOD residents in the United States typically com-
mute by transit four to five times more than the average commuter in a
region (Lund etal., 2006). Similar ridership bonuses have been recorded
for TOD projects in Toronto, Vancouver, Singapore, and Tokyo (Chorus,
2009; Yang and Lew, 2009). In China, a recent study found smaller dif-
ferentials of around 25 % in rail commuting between those living near,
versus away from suburban rail stations (Day and Cervero, 2010).
Many cities in the developing world have had long histories of being
transit oriented, and feature fine-grain mixes of land uses, abundant
pathways that encourage and enable walking and biking, and ample
transit options along major roads (Cervero, 2006; Cervero etal., 2009;
Curtis etal., 2009). In Latin America, TOD is being planned or has taken
form to varying degrees around BRT stations in Curitiba, Santiago,
Mexico City, and Guatemala City. TOD is also being implemented in
Asian cities, such as in Kaohsiung, Qingdao and Jiaxing, China, and
Kuala Lumpur, Malaysia (Cervero, 2013). Green TODs that feature low-
energy / low-emission buildings and the replacement of surface parking
with community gardens are being built (Teriman etal., 2010; Cervero
and Sullivan, 2011). A number of Chinese cities have embraced TOD for
managing growth and capitalizing upon massive rail and BRT invest-
ments. For example, Beijing and Guangzhou adopted TOD as a guiding
design principle in their most recent long-range master plans (Li and
Huang, 2010). However, not all have succeeded. TOD efforts in many
Chinese cities have been undermined by a failure to articulate densities
(e. g., tapering building heights with distances from stations), the siting
of stations in isolated superblocks, poor pedestrian access, and a lack of
co-benefiting mixed land uses (Zhang, 2007; Zhang and Wang, 2013).
Pedestrian zones / car-restricted districts. Many European cities have
elevated liveability and pedestrian safety to the top of transportation
planning agendas, and have invested in programmes that reduce depen-
dence on and use of private automobiles (Banister, 2005, 2008; Dupuy,
2011). One strategy for this is traffic calming, which uses speed humps,
realigned roads, necked down intersections along with planted trees and
other vegetation in the middle of streets to slow down traffic (Ewing
and Brown, 2009). With these traffic calming approaches, automobile
passage becomes secondary. A related concept is ‘complete streets,’
which — through dedicated lanes and traffic-slowing designs — provide
safe passage for all users of a street, including drivers as well as pedes-
trians, cyclists, and transit patrons (McCann and Rynne, 2010).
An even bolder urban-design / traffic-management strategy has been
the outright banning of cars from the cores of traditional neighbour-
hoods and districts, complemented by an upgrading and beautification
of pedestrian spaces. This practice has become commonplace in many
older European cities whose narrow and winding inner-city street were
never designed for motorized traffic (Hass-Klau, 1993). Multi-block car-
free streets and enhanced pedestrian zones are also found in cities of
the developing world, including Curitiba, Buenos Aires, Guadalajara,
and Beirut (Cervero, 2013).
Empirical evidence reveals a host of benefits from street redesigns and
auto-restraint measures like these. The traffic-calming measures imple-
mented in Heidelberg, Germany during the early 1990s lead to a 31 %
decline in car-related accidents, 44 % fewer casualties, and less central-
city traffic (Button, 2010). A study of pedestrianization in German cit-
ies recorded increases in pedestrian flows, transit ridership, land values,
and retail transactions, as well as property conversions to more inten-
sive land uses, matched by fewer traffic accidents and fatalities (Hass-
Klau, 1993). Research on over 100 case studies in Europe, North Amer-
ica, Japan, and Australia, found that road-capacity reductions including
car-free zones, creation of pedestrian streets, and street closures, results
in an overall decline in motorized traffic of 25 % (Goodwin etal., 1998).

962962
Human Settlements, Infrastructure, and Spatial Planning
12
Chapter 12
12.5.2 Policy instruments
Spatial planning strategies rely on a host of policy instruments and
levers (see Chapter 15.3 for a classification of policy instruments). Some
instruments intervene in markets, aimed at correcting market failures
(e. g., negative externalities). Others work with markets, aimed at shap-
ing behaviours through price signals or public-private partnerships.
Interventionist strategies can discourage or restrict growth through
government fiat but they can also incentivize development, such as
through zoning bonuses or property tax abatements (Bengston etal.,
2004). Policy instruments can be applied to different spatial planning
strategies and carried out at different geographic scales (see Table
12.5). Different strategy bundles can be achieved through a mix of dif-
ferent policy tools, adapted to the unique political, institutional, and cul-
tural landscapes of cities in which they are applied. Successful imple-
mentation requires institutional capacity and political wherewithal to
align the right policy instruments to specific spatial planning strategies.
The effectiveness of particular instruments introduced depends on legal
and political environments. For example, cities in the Global South can
lack the institutional capacity to regulate land or to enforce develop-
ment regulations and tax incentives may have little impact on develop-
ment in the informal sector (Farvacque and McAuslan, 1992; Sivam,
2002; Bird and Slack, 2007; UN-Habitat, 2013). Infrastructure provision
and market-based instruments such as fuel taxes will more likely affect
development decisions in the informal sectors, although there is little
direct empirical evidence. The impact of instruments on urban form
and spatial outcomes can be difficult to assess since regulations like
land-use zoning are often endogenous. That is, they codify land use
patterns that would have occurred under the free market rather than
causing changes in urban form (Pogodzinski and Sass, 1994).
12.5.2.1 Land use regulations
Land-use regulations specify the use, size, mass and other aspects
of development on a particular parcel of land. They are also known
as development controls or zoning regulations. In countries like the
United States and India, land-use regulations usually promote low-
density, single-use developments with large amounts of parking that
increase car dependence and emissions (Talen 2012; Levine 2005;
Glaeser, 2011). For example, densities in the United States are often
lower than developers would choose under an unregulated system
(Fischel, 1999; Levine and Inam, 2004). Thus, regulatory reforms that
relax or eliminate overly restrictive land-use controls could contribute
to climate change mitigation. In Europe, by contrast, land-use regula-
tions have been used to promote more compact, mixed-use, transit-
friendly cities (Beatley, 2000). The following are the primary land-use
regulations to reduce urban form-related GHG emissions.
Use restrictions specify which land uses, such as residential, retail or
office, or a mix of uses, may be built on a particular parcel. Single-
use zoning regulations which rigidly separate residential and other
uses are prevalent in the United States, although some cities such as
Miami have recently adopted form-based codes which regulate physi-
cal form and design rather than use (Parolek etal., 2008; Talen, 2012).
Use restrictions are rare in European countries such as Germany and
France, where mixed-use development is permitted or encouraged
(Hirt, 2007, 2012).
Density regulations specify minimum and / or maximum permissible
densities in terms of the number of residential units, floor area on a
parcel, or restrictions on building height or mass. Density regulations
can provide incentives for open space or other public benefits by allow-
ing higher density development in certain parts of a city. In India, densi-
ties or heights are capped in many cities, creating a pattern of mid-rise
buildings horizontally spread throughout the city and failing to allow
TOD to take form around BRT and urban rail stations (Glaeser, 2011;
Brueckner and Sridhar, 2012; Suzuki et al., 2013). In Europe, by con-
trast, land-use regulations have been used to promote more compact,
mixed-use, transit-friendly cities (Beatley, 2000; Parolek et al., 2008;
Talen, 2012). In Curitiba, Brazil, density bonuses provide incentives for
mixed-use development (Cervero, 1998; Duarte and Ultramari, 2012). A
density bonus (Rubin and Seneca, 1991) is an option where an incentive
is created for the developer to set aside land for open spaces or other
benefits by being allowed to develop more densely, typically in CBDs.
One challenge with density bonus is that individuals may have prefer-
ences for density levels (high, low) and adjust their location accordingly.
Urban containment instruments include greenbelts or urban growth
boundaries and have been employed in London, Berlin, Portland, Bei-
jing, and Singapore. In the UK and in South Korea, greenbelts delineate
the edges of many built-up and rural areas (Hall, 1996; Bengston and
Youn, 2006). In many European cities, after the break-up of the city
walls in the 18th and 19th centuries, greenbelts were used to delineate
cities (Elson, 1986; Kühn, 2003). Some US states have passed growth
management laws that hem in urban sprawl through such initiatives
as creating urban growth boundaries, geographically restricting utility
service districts, enacting concurrency rules to pace the rate of land
development and infrastructure improvements, and tying state aid
to the success of local governments in controlling sprawl (DeGrove
and Miness, 1992; Nelson et al., 2004). The mixed evidence on the
impacts of urban containment instruments on density and compact-
ness (decreases in some cases and increases in others) indicates the
importance of instrument choice and particularities of setting.
Building codes provide a mechanism to regulate the energy effi-
ciency of development. Building codes affect the energy efficiency of
new development, and cities provide enforcement of those regula-
tions in some countries (Chapter 9). City policies influence emissions
through energy use in buildings in several other ways, which can influ-
ence purchases and leasing of commercial and residential real estate
properties. Some cities participate in energy labelling programmes for
buildings (see Chapter 9.10.2.6) or have financing schemes linked to
property taxes (see Property Assess Clean Energy (PACE) in Chapter
9.10.3.1). Energy efficient equipment in buildings can further reduce

963963
Human Settlements, Infrastructure, and Spatial Planning
12
Chapter 12
energy consumption and associated emissions, including electronics,
appliances, and equipment (see Table 9.3). Cities that operate utilities
can influence energy usage directly by using smart meters and infor-
mation infrastructures (see 9.4.1.3).
Parking regulations specify minimum and / or maximum numbers
of parking spaces for a particular development. Minimum parking
standards are ubiquitous in much of the world, including cities in the
United States, Mexico, Saudi Arabia, Malaysia, China, and India (Bar-
ter, 2011; Al-Fouzan, 2012; Wang and Yuan, 2013). Where regulations
require developers to provide more parking than they would have oth-
erwise, as in place like New York and Los Angeles (McDonnell etal.,
2011; Cutter and Franco, 2012), they induce car travel by reducing the
cost of driving. Minimum parking requirements also have an indirect
impact on emissions through land-use, as they reduce the densities
that are physically or economically feasible on a site, by 30 % – 40 % or
more in typical cases in the United States (Willson, 1995; Talen, 2012).
Maximum parking standards, in contrast, have been used in cities such
as San Francisco, London, and Zurich (Kodransky and Hermann, 2011)
to reduce the costs of development, use urban land efficiently, and
encourage alternate transportation modes. In London, moving from
minimum to maximum residential parking standards reduced parking
supply by 40 %, with most of the impact coming through the elimina-
tion of parking minimums (Guo and Ren, 2013).
Design regulations can be used to promote pedestrian and bicycle
travel. For example, site-design requirements may require buildings to
face the street or prohibit the placement of parking between build-
ing entrances and street rights-of-way (Talen, 2012). Design regula-
tions can also be used to increase albedo or reduce urban heat island
effects, through requiring light-coloured or green roofs or regulating
impervious surfaces (Stone etal., 2012), as in Montreal and Toronto
(Richardson and Otero, 2012).
Affordable housing mandates can reduce the spatial mismatch
between jobs and housing (Aurand, 2010). Incentives, such as floor
area ratios and credits against exactions and impact fee obligations,
can be arranged for developers to provide social housing units within
their development packages (Cervero, 1989; Weitz, 2003).
12.5.2.2 Land management and acquisition
The previous section discussed regulatory instruments that are primar-
ily used to shape the decisions of private landowners. Land manage-
ment and acquisition include parks, lease air rights, utility corridors,
transfer development rights, and urban service districts. Urban govern-
ments can also directly shape urban form through land that is publicly
owned — particularly around public transport nodes, where municipali-
ties and public transport agencies have acquired land, assembled par-
cels, and taken the lead on development proposals (Cervero etal., 2004;
Curtis etal., 2009; Curtis, 2012). In Hong Kong SAR, China, the ‘Rail +
Property’ development programme, which emphasizes not only density
but also mixed uses and pedestrian linkages to the station, increases
patronage by about 35,000 weekday passengers at the average sta-
tion. In addition to supporting ridership, an important aim of many
agencies is to generate revenue to fund infrastructure, as in Istanbul,
Sao Paulo, and numerous Asian cities (Peterson, 2009; Sandroni, 2010).
Transfer of Development Rights (TDR) allows the voluntary transfer
or sale of development from one region or parcel where less develop-
ment is desired to another region or parcel where more development is
desired. They can be used to protect heritage sites from redevelopment
or to redistribute urban growth to transit station areas. The parcels that
‘send’ development are protected through restrictive covenants or per-
manent conservation easements. TDR effectively redirects new growth
from areas where current development is to be protected (historical
Box 12.4 | What drives declining densities?
The global phenomenon of declining densities (Angel etal., 2010)
is the combined result of (1) fundamental processes such as popu-
lation growth, rising incomes, and technological improvements in
urban transportation systems (LeRoy and Sonstelie, 1983; Miesz-
kowski and Mills, 1993; Bertaud and Malpezzi, 2003; Glaeser and
Kahn, 2004); (2) market failures that distort urban form during the
process of growth (Brueckner, 2001a; Bento etal., 2006, 2011);
and (3) regulatory policies that can have unintended impacts on
density (Sridhar, 2007, 2010). A range of externalities can result in
lower densities, such as the failure to adequately account for the
cost of traffic congestion and infrastructure development and the
failure to account for the social value of open space (Brueckner,
2000).
Regulatory policies, such as zoning and Floor Area Ratio (FAR)
restrictions, as well as subsidies to particular types of transporta-
tion infrastructures can have large impacts on land development,
which lead to leapfrog development (Mieszkowski and Mills, 1993;
Baum-Snow, 2007; Brueckner and Sridhar, 2012). The emissions
impacts of these interventions are often not fully understood.
Finally, the spatial distribution of amenities and services can shape
urban densities through housing demand (Brueckner etal., 1999).
In the United States, deteriorating conditions in city centres have
been an important factor in increased suburbanization (Bento etal.,
2011; Brueckner and Helsley, 2011). Conversely, the continued
consolidation of amenities, services, and employment opportunities
in the cores of European and Chinese cities has kept households in
city centres (Brueckner etal., 1999; Zheng etal., 2006, 2009).

964964
Human Settlements, Infrastructure, and Spatial Planning
12
Chapter 12
sites or protected areas) to areas where more development is desired
(e. g., transit station areas).
Increasing green space and urban carbon sinks can sequester
carbon and reduce energy consumption for cooling. Increasing green
space offers co-benefits such as increased property values, regulat-
ing stormwater, reduced air pollution, increased recreational space,
provision of shade and cooling, rainwater interception and infiltra-
tion, increased biodiversity support, and enhancement of well-being
(Heynen etal., 2006; Gill etal., 2007; McDonald, 2008). However, many
studies show that significantly increasing urban green space would
have negligible effects on offsetting total urban carbon emissions,
especially when emissions generated by fuel combustion, fertilizer use,
and irrigation are also considered (Pataki etal., 2009; Jim and Chen,
2009; Townsend-Small and Czimczik, 2010). Globally, urban soils could
sequester 290Mtcarbon per year if designed with calcium-rich miner-
als (Renforth etal., 2009). Annual carbon uptake varies significantly by
location and plant species. Carbon uptake per hectare for temperate
urban green spaces is estimated to be 0.15 – 0.94 t / yr for seven cit-
ies in the United States: Atlanta, Baltimore, Boston, Jersey City, New
York, Philadelphia, and Syracuse (Nowak and Crane, 2002); 0.38 t / yr
in Beijing, China (Yang and Gakenheimer, 2007); and 0.53 – 0.8 t / yr in
the South Korean cities of Chuncheon, Kangleung (Gangneung) and
Seoul (Jo, 2002). United States cities in semi-tropical areas have higher
levels of per hectare annual C sequestration, of 3.2 t / yr in Gainesville
and 4.5 t / yr in Miami-Dade (Escobedo etal., 2010). Urban forests are
estimated to sequester 1.66 t C / ha / yr in Hangzhou, China
(Zhao etal.,
2010). The variation in estimates across cities can be partly ascribed to
differences in tree species, sizes, and densities of planting (Zhao etal.,
2010), as well as land use (Whitford etal., 2001) and tree life span
(Strohbach etal., 2012; Raciti etal., 2012).
12.5.2.3 Market-based instruments
Market-based instruments use taxation and pricing policies to shape
urban form (see Chapter 15.5.2 for more in-depth discussion of mar-
ket-based instruments). Because much low-density, single-use urban
development stems from market failures or pre-existing distorted poli-
cies or regulations, a variety of market-based instruments can be intro-
duced that correct these failures (Brueckner and Fansler, 1983; Brueck-
ner and Kim, 2003; Brueckner, 2000; Bento etal., 2006, 2011).
Property taxes. The property tax, a local tax widely used to fund local
urban services and infrastructure, typically taxes both land and struc-
tures. A variant of the property tax, a land tax or split-rate tax, levies
a higher rate of tax on the value of the land, and a lower or zero rate
on the value of the buildings and other improvements. This variant of
the property tax can promote compact urban form through increasing
the capital to land ratio, i. e., the intensity of development. There are
numerous examples of the land or split-rate tax worldwide, including
Jamaica, Kenya, Denmark, parts of Australia, the United States, and
South Africa (Bird and Slack, 2002, 2007; Franzsen and Youngman,
2009; Banzhaf and Lavery, 2010) — although in these places, tax reform
was not necessarily implemented with the aim of reducing sprawl.
In principle, moving from a standard property tax to a land or split-
rate tax has ambiguous effects on urban form. The capital to land
ratio could rise through an increase in dwelling size — promoting
sprawl — and / or through an increase in density or units per acre — pro-
moting compact urban form (Brueckner and Kim, 2003). In practice,
however, the density effect seems to dominate. Most of the empirical
evidence supporting the role of property tax reform in promoting com-
pact urban form comes from the U. S. state of Pennsylvania, where the
most thorough study found that the split-rate tax led to a 4 – 5 % point
increase per decade in the number of housing units per hectare, with
a minimal increase in unit size (for other evidence from Pennsylvania,
see Oates and Schwab, 1997; Plassmann and Tideman, 2000; Banzhaf
and Lavery, 2010).
Prospective or simulation studies also tend to find that land or split-
rate taxes have the potential to promote compact urban form at least
to some extent (many earlier studies are summarized in Roakes, 1996;
Needham, 2000; for more recent work see Junge and Levinson, 2012).
However, studies of land taxes in Australia have tended to find no effect
on urban form (Skaburskis, 2003), although with some exceptions (e. g.
Edwards, 1984; Lusht, 1992). There are several suggestions to tailor
land or property taxes to explicitly support urban planning objectives.
For example, the property tax could vary by use or by impervious area
(Nuissl and Schroeter-Schlaack, 2009), or the tax could be on greenfield
development only (Altes, 2009). However, there are few examples of
these approaches in practice, and little or no empirical evidence of their
impacts.
Moving from a standard property tax to a land or split-rate tax can
yield efficiency and equity benefits (see Chapter 3 for definitions). The
efficiency effect stems from the fact that the land tax is less distortion-
ary than a tax on improvements, as the supply of land is fixed (Brueck-
ner and Kim, 2003). The equity argument stems from the view that
land value accrues because of the actions of the wider community, for
example through infrastructure investments, rather than the actions of
the landowner (Roakes, 1996). Indeed, some variants of the land tax in
countries such as Colombia (Bird and Slack, 2007) take an explicit
‘value capture’ approach, and attempt to tax the incremental increase
in land value resulting from transport projects.
Development impact fees are imposed per unit of new development
to finance the marginal costs of new infrastructure required by the
development, and are levied on a one-time basis. The effects of impact
fees on urban form will be similar to a property tax. The main dif-
ference is that impact fees are more likely to be used by urban gov-
ernments as a financing mechanism for transport infrastructure. For
example, San Francisco and many British cities have impact fees dedi-
cated to public transport (Enoch etal., 2005), and other cities such as
Santiago have fees that are primarily dedicated to road infrastructure
(Zegras, 2003).
Box 12.5 | Singapore: TOD and Road Pricing
The island-state of Singapore has over the years introduced a series
of cross-cutting, reinforcing spatial planning and supportive strate-
gies that promote sustainable urbanism and mobility (Suzuki etal.,
2013). Guided by its visionary Constellation Plan, Singapore built a
series of new master-planned towns that interact with each other
because they each have different functional niches. Rather than
being self-contained entities, these new towns function together
(Cervero, 1998). All are interlinked by high-capacity, high-quality
urban rail and bus services, and correspondingly the majority of
trips between urban centres are by public transport. Congestion
charges and quota controls on vehicle registrations through an
auctioning system also explain why Singapore’s transit services are
so heavily patronized and not un-related, why new land develop-
ment is occurring around rail stations (Lam and Toan, 2006).
Figure 12.18 | Singapore’s Constellation Plan. Source: Suzuki etal. (2013).
Central
Area
Serangoon
Tampines
Bishan
Wood
lands
Jurong
East
Buona
Vista
Paya
Lebar
Marine
Parade
Central Area
Regional Centres
Sub-Regional Centres
Radial
Orbital

965965
Human Settlements, Infrastructure, and Spatial Planning
12
Chapter 12
Development taxes. To the extent that excessive urban development
reflects the failure to charge developers for the full costs of infra-
structure and the failure to account for the social benefits of spatially
explicit amenities or open space, some economists argue that develop-
ment taxes, a tax per unit of land converted to residential uses, are
the most direct market-based instruments to correct for such failures
(Brueckner, 2000; Bento et al., 2006). According to these studies, in
contrast to urban growth boundaries, development taxes can control
urban growth at lower economic costs. Urban sprawl occurs in part
because the costs associated with development are not fully accounted
for. Development taxes could make up for the difference between the
private costs and the social costs of development, and coupled with
urban growth boundaries could be effective at reducing sprawl.
Fuel prices and transportation costs. Increases in fuel taxes or
transportation costs more generally have a direct effect on reducing
VKT (see Chapter 8 and Chapter 15). They are also likely to have a
long-run mitigation effect as households adjust their location choices
to reduce travel distances, and urban form responds accordingly. An
urban area that becomes more compact as households bid up the price
of centrally located land is a core result from standard theoretical eco-
nomic models of urban form (Romanos, 1978; Brueckner, 2001a, 2005;
Bento etal., 2006).
Empirically, evidence for this relationship comes from cities in the United
States, where a 10 % increase in fuel prices leads to a 10 % decrease in
construction on the urban periphery (Molloy and Shan, 2013); Canada,
2009; Banzhaf and Lavery, 2010) — although in these places, tax reform
was not necessarily implemented with the aim of reducing sprawl.
In principle, moving from a standard property tax to a land or split-
rate tax has ambiguous effects on urban form. The capital to land
ratio could rise through an increase in dwelling size — promoting
sprawl — and / or through an increase in density or units per acre — pro-
moting compact urban form (Brueckner and Kim, 2003). In practice,
however, the density effect seems to dominate. Most of the empirical
evidence supporting the role of property tax reform in promoting com-
pact urban form comes from the U. S. state of Pennsylvania, where the
most thorough study found that the split-rate tax led to a 4 – 5 % point
increase per decade in the number of housing units per hectare, with
a minimal increase in unit size (for other evidence from Pennsylvania,
see Oates and Schwab, 1997; Plassmann and Tideman, 2000; Banzhaf
and Lavery, 2010).
Prospective or simulation studies also tend to find that land or split-
rate taxes have the potential to promote compact urban form at least
to some extent (many earlier studies are summarized in Roakes, 1996;
Needham, 2000; for more recent work see Junge and Levinson, 2012).
However, studies of land taxes in Australia have tended to find no effect
on urban form (Skaburskis, 2003), although with some exceptions (e. g.
Edwards, 1984; Lusht, 1992). There are several suggestions to tailor
land or property taxes to explicitly support urban planning objectives.
For example, the property tax could vary by use or by impervious area
(Nuissl and Schroeter-Schlaack, 2009), or the tax could be on greenfield
development only (Altes, 2009). However, there are few examples of
these approaches in practice, and little or no empirical evidence of their
impacts.
Moving from a standard property tax to a land or split-rate tax can
yield efficiency and equity benefits (see Chapter 3 for definitions). The
efficiency effect stems from the fact that the land tax is less distortion-
ary than a tax on improvements, as the supply of land is fixed (Brueck-
ner and Kim, 2003). The equity argument stems from the view that
land value accrues because of the actions of the wider community, for
example through infrastructure investments, rather than the actions of
the landowner (Roakes, 1996). Indeed, some variants of the land tax in
countries such as Colombia (Bird and Slack, 2007) take an explicit
‘value capture’ approach, and attempt to tax the incremental increase
in land value resulting from transport projects.
Development impact fees are imposed per unit of new development
to finance the marginal costs of new infrastructure required by the
development, and are levied on a one-time basis. The effects of impact
fees on urban form will be similar to a property tax. The main dif-
ference is that impact fees are more likely to be used by urban gov-
ernments as a financing mechanism for transport infrastructure. For
example, San Francisco and many British cities have impact fees dedi-
cated to public transport (Enoch etal., 2005), and other cities such as
Santiago have fees that are primarily dedicated to road infrastructure
(Zegras, 2003).
Box 12.5 | Singapore: TOD and Road Pricing
The island-state of Singapore has over the years introduced a series
of cross-cutting, reinforcing spatial planning and supportive strate-
gies that promote sustainable urbanism and mobility (Suzuki etal.,
2013). Guided by its visionary Constellation Plan, Singapore built a
series of new master-planned towns that interact with each other
because they each have different functional niches. Rather than
being self-contained entities, these new towns function together
(Cervero, 1998). All are interlinked by high-capacity, high-quality
urban rail and bus services, and correspondingly the majority of
trips between urban centres are by public transport. Congestion
charges and quota controls on vehicle registrations through an
auctioning system also explain why Singapore’s transit services are
so heavily patronized and not un-related, why new land develop-
ment is occurring around rail stations (Lam and Toan, 2006).
Figure 12.18 | Singapore’s Constellation Plan. Source: Suzuki etal. (2013).
Central
Area
Serangoon
Tampines
Bishan
Wood
lands
Jurong
East
Buona
Vista
Paya
Lebar
Marine
Parade
Central Area
Regional Centres
Sub-Regional Centres
Radial
Orbital

966966
Human Settlements, Infrastructure, and Spatial Planning
12
Chapter 12
where a 1 % increase in gas prices is associated with a 0.32 % increase in
the population living in the inner city (Tanguay and Gingras, 2012); and
cross-national datasets of 35 world cities (Glaeser etal., 2001; Glaeser
and Kahn, 2004). However, another cross-national study using a larger
dataset found no statistically significant link, which the authors attribute
to noisiness in their (national-level) fuel price data (Angel etal., 2005).
Similar impacts on urban form would be expected from other pricing
instruments that increase the cost of driving. While there is clear evi-
dence that road and parking pricing schemes reduce emissions through
direct impacts on mode and travel choices (see Chapter 8.10.1), there
is more limited data on the indirect impacts through land-use patterns.
One of the few simulation studies found that optimum congestion pric-
ing would reduce the radius of the Paris metropolitan area by 34 %,
and the average travel distance by 15 % (De Lara etal., 2013).
12.5.3 Integrated spatial planning and
implementation
A characteristic of effective spatial planning is interlinked and coor-
dinated efforts that are synergistic, and the sum of which are greater
than each individual part incrementally or individually (Porter, 1997).
Relying on a single instrument or one-size-fits-all approach can be
ineffective or worse, have perverse, unintended consequences. Singa-
pore is a textbook example of successfully bundling spatial planning
and supportive pricing strategies that reinforce and strengthen the
influences of each other (see Box 12.5). Bundling spatial strategies in
ways that produce positive synergies often requires successful insti-
tutional coordination and political leadership from higher levels of
government (Gakenheimer, 2011). The U. S. state of Oregon has man-
aged to protect farmland and restrict urban sprawl through a com-
bination of measures, including urban growth boundaries (required
for all metropolitan areas above 50,000 inhabitants), farm tax credit
programmes, tax abatements for infill development, and state grants
that have helped fund investments in high-quality transit, such as light
rail and tramways in Portland and BRT in Eugene (Moore etal., 2007).
Enabling legislation introduced by the state prompted cities like Port-
land to aggressively curb sprawl through a combination of urban con-
tainment, targeted infrastructure investments, aggressive expansion of
pedestrian and bikeway facilities, and commercial-rate pricing of park-
ing (Nelson etal., 2004).
Empirical evidence on the environmental benefits of policies that
bundle spatial planning and market strategies continues to accumu-
late. A 2006 experiment in Portland, Oregon, replaced gasoline taxes
with VKT charges, levied on 183 households that volunteered for the
experiment. Some motorists paid a flat VKT charge while others paid
considerably higher rates during the peak than non-peak. The largest
VKT reductions were recorded among households in compact, mixed-
use neighbourhoods that paid congestion charges matched by little
change in travel among those living in lower density areas and pay-
ing flat rates (Guo etal., 2011). Another study estimated that compact
development combined with technological improvements (e. g., more
efficient vehicle fleets and low-carbon fuels) could reduce GHG emis-
sions by 15 % to 20 % (Hankey and Marshall, 2010). A general equilib-
rium model of urban regions in the OECD concluded that “urban den-
sity policies and congestion charges reduce the overall cost of meeting
GHG emissions reduction targets more than economy-wide policies,
such as a carbon tax, introduced by themselves” (OECD, 2010d).
12.6 Governance, institutions,
and finance
The feasibility of spatial planning instruments for climate change
mitigation depends greatly upon each city’s governance and finan-
cial capacities. Even if financial capacities are present, a number of
other obstacles need to be surmounted. For example, many local gov-
ernments are disinclined to support compact, mixed-use, and dense
development. Even in cases where there is political support for low-
carbon development, institutions may be ineffective in developing,
implementing, or regulating land use plans. This section assesses the
governance, institutional, and financial challenges and opportuni-
ties for implementing the mitigation strategies outlined in Section
12.5. It needs to be emphasized that both the demand for energy
and for urban infrastructure services, as well as the efficiency of ser-
vice delivery, is also influenced by behaviour and individual choices.
Cultural and lifestyle norms surrounding comfort, cleanliness, and con-
venience structure expectations and use of energy, water, waste, and
other urban infrastructure services (Miller, 1998; Shove, 2003, 2004;
Bulkeley, 2013). Individual and household choices and behaviour can
also strongly affect the demand for, and the delivery efficiency of, pub-
lic infrastructure services, for instance by lowering or increasing load
factors (utilization rates) of public transport systems (Sammer, 2013).
Governance and institutions are necessary for the design and imple-
mentation of effective policy frameworks that can translate theoreti-
cal emission reduction potentials of a range of mitigation options into
actual improved emission outcomes.
12.6.1 Institutional and governance constraints
and opportunities
The governance and institutional requirements most relevant to chang-
ing urban form and integrated infrastructure in urban areas relate to
spatial planning. The nature of spatial planning varies significantly
across countries, but in most national contexts, a framework for plan-
ning is provided by state and local governments. Within these frame-
works, municipal authorities have varying degrees of autonomy and
authority. Furthermore, there are often divisions between land use
planning, where municipalities have the authority for land regula-
tion within their jurisdiction, and transportation planning (which is

967967
Human Settlements, Infrastructure, and Spatial Planning
12
Chapter 12
either centrally organized or done in a cross-cutting manner), in which
municipal responsibilities are often more limited. Thus, spatial planning
is one area where municipalities have both the authority and the insti-
tutions to address GHG emissions.
However, the best plans for advancing sustainable urbanization and
low-carbon development, especially in fast-growing parts of the world,
will not become a reality unless there is both the political will and
institutional capacity to implement them. The ability to manage and
respond to escalating demands for urban services and infrastructure is
often limited in developing country cities. Multiple institutional short-
comings exist, such as an insufficiently trained and undereducated civil
service talent pool or the absence of a transparent and corruption-free
procurement process for providing urban infrastructure (UN-Habitat,
2013). For example, limited experience with urban management, bud-
geting and accounting, urban planning, finance, and project supervi-
sion have thwarted Indonesia’s decentralization of infrastructure pro-
grammes from the central to local governments over the past decade
(Cervero, 2013).
Although lack of coordination among local land management and
infrastructure agencies is also a common problem in cities of industri-
alized countries (Kennedy etal., 2005), in developing cities institutional
fragmentation undermines the ability to coordinate urban services
within and across sectors (Dimitriou, 2011). Separating urban sector
functions into different organizations — each with its own boards,
staff, budgets, and by-laws — often translates into uni-sectoral actions
and missed opportunities, such as the failure to site new housing proj-
ects near public transport stations. In addition, ineffective bureaucra-
cies are notorious for introducing waste and delays in the deployment
of urban transport projects.
In rapidly urbanizing cities, limited capacities and the need to respond
to everyday crises often occupy most of the available time in trans-
portation and public utility departments, with little attention left to
strategically plan for prevention of such crises in the first place. As
a result, strategic planning and coordination of land use and trans-
portation across different transport modes is practically non-existent.
Institutions rarely have sufficient time or funds to expand transport
infrastructure fast enough to accommodate the exponential growth in
travel. Public utilities for water and sanitation face similar challenges,
and most local agencies operate constantly in the catch-up mode.
Water utilities in southeast Asian cities, for example, are so preoccu-
pied with fixing leaks, removing illegal connections, and meeting water
purity standards that there is little time to strategically plan ahead for
expanding trunk-line capacities in line with urban population growth
projections. The ability to advance sustainable transport programmes,
provide clean water connections, or introduce efficient pricing schemes
implies the presence of conditions that rarely exist, namely a well-
managed infrastructure authority that sets clear, measurable objectives
and rigorously appraises the expenditure of funds in a transparent and
accountable way (Cervero, 2013). Lack of local institutional capacity
among developing cities is a major barrier to achieving the full poten-
tial that such cities have to reduce GHG emissions (UN-Habitat, 2013).
This highlights the urban institutional climate conundrum that rapidly
urbanizing cities — cities with the greatest potential to reduce future
GHG emissions — are the cities where the current lack of institutional
capacity will most obstruct mitigation efforts.
Curitiba, Brazil, regarded as one of the world’s most sustainable cit-
ies, is a product of not only visionary spatial planning but also strong
institutions and political leadership (see Box 12.6.). Other global cit-
ies are striving to follow Curitiba’s lead. Bangkok recently announced
a paradigm shift in planning that emphasizes redesigning the city to
eliminate or shorten trips, creating complete streets, and making the
city more liveable (Bangkok Metropolitan Administration, 2013). The
Amman, Jordan, Master Plan of 2008 promotes high-density, mixed-
use development through the identification of growth centres, intensi-
fication along select corridors across the city, and the provision of safe
and efficient public transportation (Beauregard and Marpillero-Colo-
mina, 2011). Similar transit-oriented master plans have been prepared
for Islamabad, Delhi, Kuala Lumpur, and Johannesburg in recent years.
Mexico City has aggressively invested in BRT and bicycle infrastruc-
ture to promote both a culture and built form conducive to sustainable
mobility (Mejía-Dugand etal., 2013).
In addition to the internal institutional challenges outlined above, cities
face the problem of coordinating policies across jurisdictional boundar-
ies as their populations grow beyond the boundaries of their jurisdic-
tions. Effective spatial planning and infrastructure provision requires an
integrated metropolitan approach that transcends traditional municipal
boundaries, especially to achieve regional accessibility. The fragmented
local government structure of metropolitan areas facilitates the conver-
sion of agricultural, forested, or otherwise undeveloped land to urban
uses. These expanding urban areas also exhibit fiscal weaknesses, face
heightened challenges of metropolitan transportation, and deficiencies
in critical physical and social infrastructures (Rusk, 1995; Norris, 2001;
Orfield, 2002; McCarney and Stren, 2008; Blanco etal., 2011; McCar-
ney etal., 2011). Several efforts to address urban climate change miti-
gation at a metropolitan scale are emerging. The U. S. state of Califor-
nia, for example, is requiring metropolitan transportation agencies to
develop climate change mitigation plans in concert with municipalities
in their region. California’s 2008 Sustainable Communities and Climate
Protection Act, or SB 375, was the first legislation in the United States
to link transportation and land use planning with climate change (State
of California, 2008; Barbour and Deakin, 2012).
In order for integrated planning development to be successful, it must
be supported at national levels (Gakenheimer, 2011). A recent example
is India’s National Urban Transport Policy of 2006, which embraces
integrated transport and land use planning as its top priority. In this
policy, the central government covers half the costs of preparing inte-
grated transport and land use plans in Indian cities. Another example
is that for the past 25 years, Brazil has had a national urban trans-
port policy that supports planning for sustainable transport and urban
growth in BRT-served cities like Curitiba and Belo Horizonte.
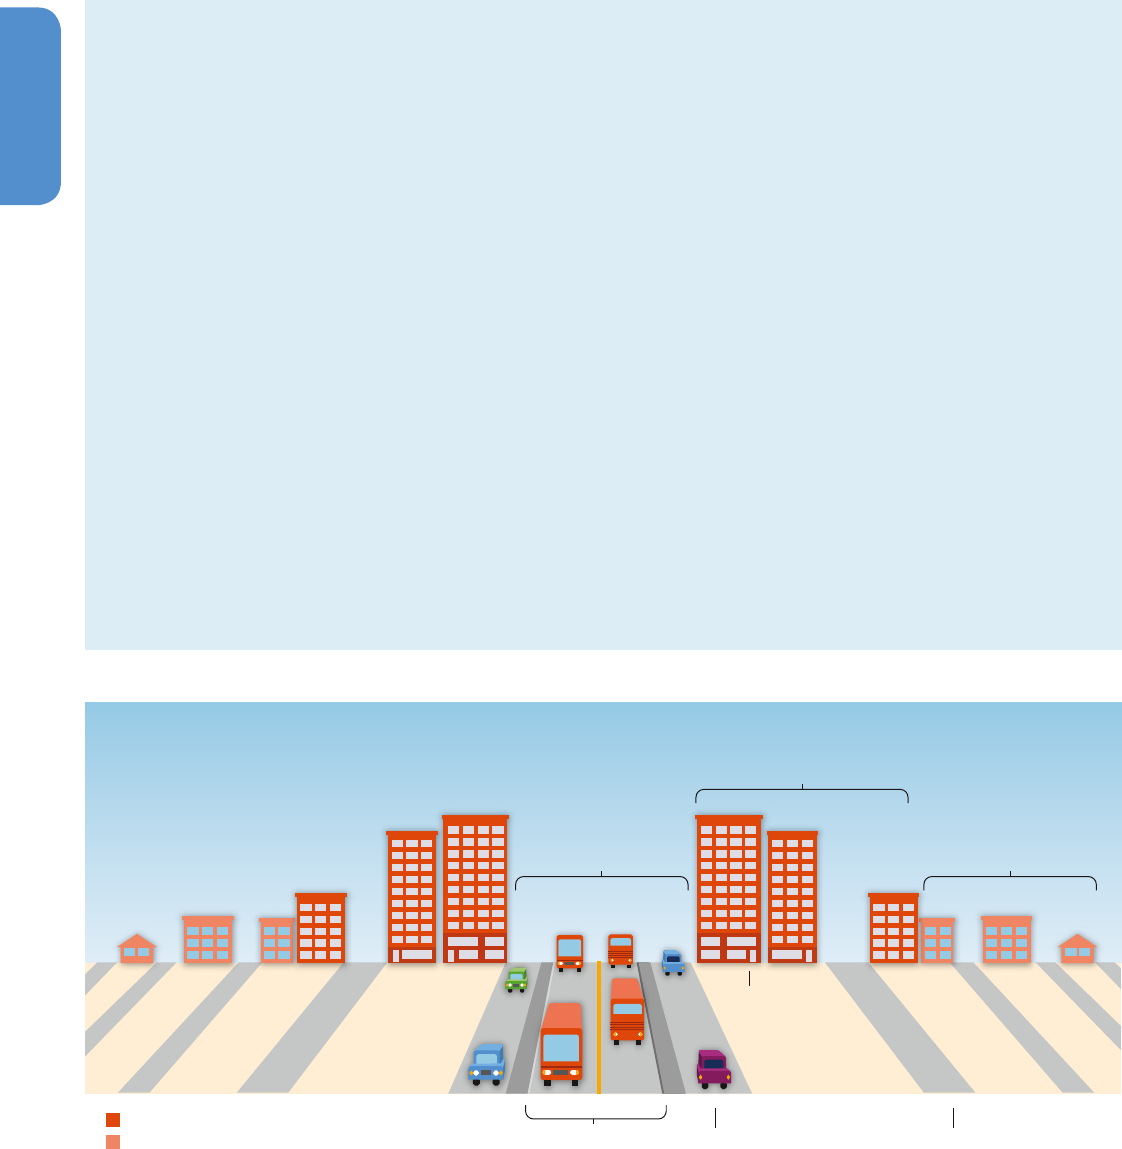
968968
Human Settlements, Infrastructure, and Spatial Planning
12
Chapter 12
Box 12.6 | Sustainable Curitiba: Visionary planning and strong institutions
Developing cities such as Curitiba, Brazil, well-known for advancing
sustainable transport and urbanism, owe part of their success to
strong governance and institutions (Cervero, 2013). Early in Curi-
tiba’s planning process, the Instituto de Pesquisa e Planejamento
Urbano de Curitiba (IPPUC) was formed and given the responsibility
of ensuring the integration of all elements of urban growth. Cre-
ative design elements, such as the trinary corridors (shown in Figure
12.19) that concentrate vertically mixed development along high-
capacity dedicated busways and systematically taper densities away
from transit corridors, were inventions of IPPUC’s professional staff.
As an independent planning and research agency with dedicated
funding support, IPPUC is insulated from the whims of day-to-day
politics and able to cost effectively coordinate urban expansion and
infrastructure development. Sustained political commitment has
been another important element of Curitiba’s success. The harmoni-
zation of transport and urban development took place over 40 years,
marked by a succession of progressive, forward-looking, like-minded
mayors who built on the work of their predecessors. A cogent long-
term vision and the presence of a politically insulated regional plan-
ning organization, IPPUC, to implement the vision have been crucial
in allowing the city to chart a sustainable urban pathway.
However, urban governance of land use and transport planning
is not the sole province of municipal authorities or other levels of
government. Increasingly, private sector developers are creating
their own strategies to govern the nature of urban development
that exceed codes and established standards. These strategies can
relate both to the physical infrastructure being developed (e. g.,
the energy rating of housing on a particular development) or take
the form of requirements and guides for those who will occupy
new or refurbished developments (e. g., age limits, types of home
appliance that can be used, energy contracts, and education about
how to reduce GHG emissions). Non-governmental organizations
(NGOs) aimed at industry groups, such as the U. S. Green Build-
ing Council, the Korea Green Building Certification Criteria, and
UK’s Building Research Establishment Environmental Assessment
Method (BREEAM) have also become important in shaping urban
development, particularly in terms of regeneration and the refur-
bishment or retrofitting of existing buildings. For example, this is
the case in terms of community-based organizations in informal
settlements, as well as in the redevelopment of brownfield sites in
Europe and North America.
Figure 12.19 | Curitiba’s stylized trinary road system. The inclusion of mixed land uses and affordable housing allows developers to increase building heights, adding density to the
corridor. Source: Suzuki etal. (2013).
Structural Axis
Bus Rapid Transit Faster Traffic
Slower Traffic
Higher Densities
Lower Densities
Higher Densities: Commercial, Business, Residential Uses
Lower Densities: Mainly Residental Uses
Lower Floors:
Shops,
Businesses
12.6.2 Financing urban mitigation
Urban infrastructure financing comes from a variety of sources, some
of which may already be devoted to urban development. Some of these
include direct central government budgetary investments, intergovern-
mental transfers to city and provincial governments, revenues raised
by city and provincial governments, the private sector or public-private
partnerships, resources drawn from the capital markets via municipal

969969
Human Settlements, Infrastructure, and Spatial Planning
12
Chapter 12
bonds or financial intermediaries, risk management instruments, and
carbon financing. Such sources provide opportunities for urban mitiga-
tion initiatives (OECD, 2010b), but access to these financial resources
varies from one place to another.
In many industrialized countries, national and supra-national poli-
cies and programmes have provided cities with the additional financ-
ing and facilitations for urban climate change mitigation. Where the
national commitment is lacking, state and municipal governments
can influence mitigation initiatives at the city scale. Cities in emerging
economies are also increasingly engaging in mitigation, but they often
rely on international sources of funding. GHG abatement is generally
pursued as part of the urban development efforts required to improve
access to infrastructure and services in the fast-growing cities of devel-
oping countries, and to increase the liveability of largely built-out cities
in industrialized countries. Incorporating mitigation into urban devel-
opment has important financial implications, as many of the existing or
planned urban investments can be accompanied through requirements
to meet certain mitigation standards (OECD, 2010b). As decentraliza-
tion has progressed worldwide (the average share of sub-national
expenditure in OECD countries reached 33 % in 2005), regional and
local governments increasingly manage significant resources.
Local fiscal policy itself can restrict mitigation efforts. When local bud-
gets rely on property taxes or other taxes imposed on new develop-
ment, there is a fiscal incentive to expand into rural areas or sprawl
instead of pursuing more compact city strategies (Ladd, 1998; Song
and Zenou, 2006). Metropolitan transportation policies and taxes
also affect urban carbon emissions. Congestion charges reduce GHG
emissions from transport by up to 19.5 % in London where proceeds
are used to finance public transport, thus combining global and local
benefits very effectively (Beevers and Carslaw, 2005). Parking charges
have led to a 12 % decrease of vehicle miles of commuters in U. S. cit-
ies, a 20 % reduction in single car trips in Ottawa, and a 38 % increase
of carpooling in Portland (OECD, 2010c).
Another way to think about the policy instruments available to gov-
ernments for incentivizing GHG abatement is to consider each instru-
ment’s potential to generate public revenues or demand for govern-
ment expenditures, and the administrative scale at which it can be
applied (Figure 12.20). Here, the policy instruments discussed earlier
(Table 12.5) are categorized into four groups: (1) regulation; (2) taxa-
tion / charge; (3) land-based policy; and (4) capital investment. Many
of these are applicable to cities in both the developed and developing
countries, but they vary in degree of implementation due to limited
institutional or governance capacities. Overcoming the lack of politi-
cal will, restricted technical capacities, and ineffective institutions for
regulating or planning land use will be central to attaining low-carbon
development at a city-scale.
Fiscal crises along with public investment, urban development, and
environmental policy challenges in both developed and developing
counties have sparked interest in innovative financial instruments to
affect spatial development, including a variety of land-based tech-
niques (Peterson, 2009). One of these key financial / economic mecha-
nisms is land value capture. Land value capture consists of financing
the construction of new transit infrastructures using the profits gen-
erated by the land value price increase associated with the presence
of new infrastructure (Dewees, 1976; Benjamin and Sirmans, 1996;
Batt, 2001; Fensham and Gleeson, 2003; Smith and Gihring, 2006).
Also called windfall recapture, it is a local financing option based on
recouping a portion or all of public infrastructure costs from private
land betterments under the ‘beneficiary’ principle. In contrast, value
compensation, or wipeout mitigation, is commonly viewed as a policy
tool to alleviate private land worsements — the deterioration in the
value or usefulness of a piece of real property — resulting from public
regulatory activities (Hagman and Misczynski, 1978; Callies, 1979).
The majority of the value capture for transit literature use U. S. cities as
case studies in part because of the prevalence of low-density, automo-
bile-centred development. However, there is an emerging literature on
value capture financing that focus on developing country cities, which
tend to be denser than those in OECD countries, and where there are
more even shares of distinct travel modes (Cervero etal., 2004). Value
capture typically is used for public transit projects. There are various
ways to implement value capture, including: land and property taxes,
special assessment or business improvement districts, tax increment
financing, development impact fees, public land leasing and develop-
ment right sales, land readjustment programmes, joint developments
and cost / benefit sharing, connection fees (Johnson and Hoel, 1985;
Landis etal., 1991; Bahl and Linn, 1998; Enoch etal., 2005; Smith and
Gihring, 2006). There is much evidence that public transit investments
often increase land values around new and existing stations (Du and
Mulley, 2006; Debrezion etal., 2007).
In summary, the following are key factors for successful urban climate
governance: (1) institutional arrangements that facilitate the inte-
gration of mitigation with other high-priority urban agendas; (2) an
enabling multilevel governance context that empowers cities to pro-
mote urban transformations; (3) spatial planning competencies and
political will to support integrated land-use and transportation plan-
ning; and (4) sufficient financial flows and incentives to adequately
support mitigation strategies.
12.7 Urban climate
mitigation: Experiences
and opportunities
This section identifies the scale and range of mitigation actions being
planned by municipal governments and assesses the evidence of
successful implementation of the plans as well as barriers to further
implementation. The majority of studies reviewed pertain to large
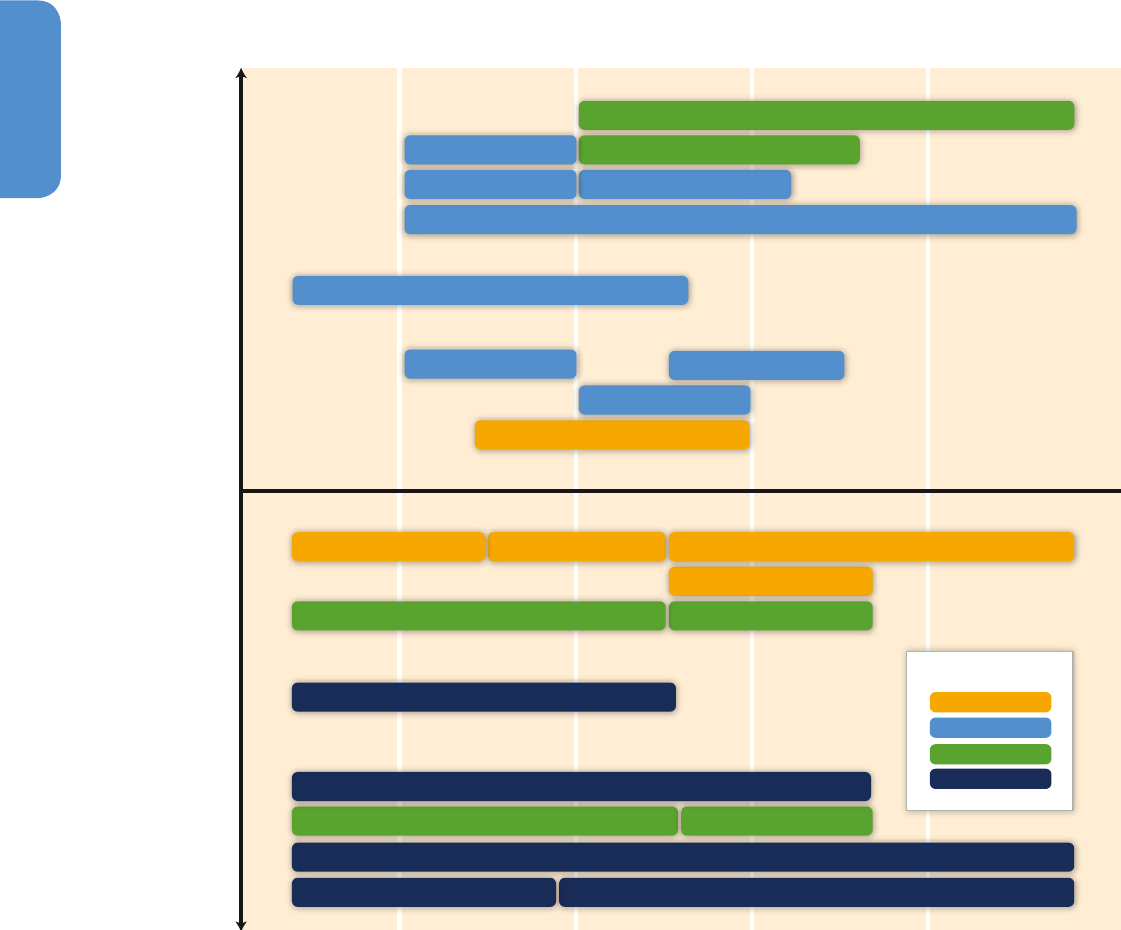
970970
Human Settlements, Infrastructure, and Spatial Planning
12
Chapter 12
cities in North America, Japan, and Europe, although there are some
cross-city comparisons and case studies that include smaller cities in
industrialized economies (Yalçın and Lefèvre, 2012; Dierwechter and
Wessells, 2013) and cities in developing countries and emerging econ-
omies (Romero Lankao, 2007; Pitt, 2010).
Addressing climate change has become part of the policy landscape in
many cities, and municipal authorities have begun to implement poli-
cies to reduce GHG emissions generated from within their administra-
tive boundaries (Acuto, 2013; OECD, 2010a). The most visible way in
which cities undertake mitigation is under the auspices of a climate
action plan — a policy document created by a local government agency
that sets out a programme of action to mitigate greenhouse gas emis-
sions. Usually such plans include a GHG emissions inventory and an
emissions reduction target, as well as a series of mitigation policies.
This section focuses on such climate action plans, as they provide the
most comprehensive and consistent, albeit limited, evidence available
regarding urban mitigation efforts. However, there is not a one-to-one
correspondence between climate action plans and urban mitigation
Figure 12.20 | Key spatial planning tools and effects on government revenues and expenditures across administrative scales. Figure shows four key spatial planning tools (coded in
colours) and the scale of governance at which they are administered (x-axis) as well as how much public revenue or expenditure the government generates by implementing each
instrument (y-axis).
Sources: Bahl and Linn (1998); Bhatt (2011); Cervero (2004); Deng (2005); Fekade (2000); Rogers (1999); Hong and Needham (2007); Peterson (2009); Peyroux (2012); Sandroni
(2010); Suzuki etal. (2013); Urban LandMark (2012); U. S. EPA (2013); Weitz (2003).
Project
Country
District
City
Metropolis
Neutral
Revenue
Expenditures
Government Revenue Minus Expenditure
Government Scale
Public Transit Investment and Station Improvement
Zoning Change
Public Land Leasing/Sale (Land Bank)
Cordon Pricing
Property Tax
Air Right Sale/Tradable Development Rights
Parking Restriction
Sidewalk, Bikeway and Amenity Improvement
Public Housing Provision and Affordable Housing Program
Special Economic Zone
Business Improvement District
Land Acquisition & Assemblage Eminent Domain
Impact Fee and Connection Fee
Tax Increment Financing
Growth Boundary
Green Belt
Land Policy
Regulation
Investment
Taxation/Charge
Betterment Levy
Utility, IT & Access Road Improvement
Toll Lane
Public Campaign and Social Education Design Guideline
Local Feeder Service
Urban Green Preservation/Restoration
Tool Categories

971971
Human Settlements, Infrastructure, and Spatial Planning
12
Chapter 12
efforts. Even when included in climate action plans, mitigation mea-
sures may well have been implemented in the plan’s absence, whether
for climate-related or other reasons (Millard-Ball, 2012b). Conversely,
climate action plans are only one framework under which cities plan
for mitigation policies, and similar recommendations may also occur as
part of a municipal sustainability, land-use, or transport plan (Bulkeley
and Kern, 2006; GTZ, 2009; Bassett and Shandas, 2010). In these other
types of plans, climate change may be one motivation, but mitigation
measures are often pursued because of co-benefits such as local air
quality (Betsill, 2001; Kousky and Schneider, 2003).
12.7.1 Scale of urban mitigation efforts
The number of cities that have signed up to voluntary frameworks for
GHG emission reductions has increased from fewer than 50 at the start
of the 1990s to several hundred by the early 2000s (Bulkeley and Bet-
sill, 2005), and several thousand by 2012 (Kern and Bulkeley, 2009;
Pitt, 2010; Krause, 2011a). These voluntary frameworks provide techni-
cal assistance and political visibility. They include the C40 Cities Cli-
mate Leadership Group (C40), which by October 2013 counted most of
the world’s largest cities among its 58 affiliates (C40 Cities, 2013), the
Cities for Climate Protection (CCP) Campaign, and the 2013 European
Covenant of Mayors, which had over 5,200 members representing over
170 million people, or roughly one-third of the European population
(The Covenant of Mayors, 2013). In the United States, nearly 1,100
municipalities, representing approximately 30 % of the country’s popu-
lation, have joined the U. S. Conference of Mayors Climate Protection
Agreement, thus committing to reduce their local GHG emissions to
below 1990 levels (Krause, 2011a).
Such estimates represent a lower bound, as cities may complete a
climate action plan or undertake mitigation outside one of these vol-
untary frameworks. In California in 2009, 72 % of cities responding
Box 12.7 Urban climate change mitigation in less developed countries
The majority of future population growth and demand for new
infrastructure will take place in urban areas in developing coun-
tries. Africa and Asia will absorb the bulk of the urban population
growth, and urbanization will occur at lower levels of economic
development than the urban transitions that occurred in AnnexI
countries. There are currently multiple urban transitions taking
place in developing countries, with differences in part due to their
development histories, and with different impacts on energy use
and greenhouse gas emissions.
Urban areas in developing and least developed countries can
have dual energy systems (Martinot etal., 2002; Berndes etal.,
2003). That is, one segment of the population may have access
to modern energy and associated technology for heating and
cooking. Another segment of the population — mainly those
living in informal settlements — may rely mainly on wood-
based biomass. Such non-commercial biomass is a prominent
source in the urban fuel mix in Sub-Saharan Africa (50 %) and
in South Asia (23 %). In other regions, Latin America and the
Caribbean (12 %), Pacific Asia (8 %) and China (7 %) traditional,
non-commercial energy is not negligible but a relatively smaller
proportion of overall energy portfolio (Grubler etal., 2012). The
traditional energy system operates informally and inefficiently,
using out-dated technology. It can be associated with signifi-
cant health impacts (see Section 9.7.3 in this report as well as
Chapters 2 and 9 in IPCC, 2011). The unsustainable harvesting of
woodfuels to supply large urban and industrial markets is signifi-
cantly contributing to forest degradation and coupled with other
land-use changes to deforestation (see Chapter 11). However,
recent technological advances suggest that energy production
from biomass can be an opportunity for low carbon develop-
ment (Zeng etal., 2007; Fargione etal., 2008; Hoekman, 2009;
Azar etal., 2010). Projections of significant growth in woodfuel
demand (Mwampamba, 2007; Zulu, 2010; Agyeman etal., 2012)
make it vital that this sector is overhauled and modernized using
new technologies, approaches, and governance mechanisms.
Additionally, informal urbanization may not result in an increase
in the provision of infrastructure services. Rather, unequal access
to infrastructure, especially housing and electricity, is a significant
problem in many rapidly growing urban centres in developing
countries and shapes patterns of urban development. Mitigation
options vary by development levels and urbanization trajecto-
ries. The rapid urbanization and motorization occurring in many
developing and least developed countries is constrained by limited
infrastructure and deteriorating transport systems. Integrated
infrastructure development in these areas can have greater effects
on travel demands and low-emission modal choices than in high-
income countries, where infrastructure is largely set in place (see
Chapter 8.9). The scale of new building construction in developing
countries follows a similar path. An estimated 3 billion people
worldwide rely on highly polluting and unhealthy traditional solid
fuels for household cooking and heating (Pachauri etal., 2012;
IEA, 2012)and shifting their energy sources to electricity and clean
fuels could strongly influence building-related emissions reduc-
tions (see Box 9.1 and Section 14.3.2.1). Thus, it is in developing
and least developed country cities where opportunities for inte-
grated infrastructure and land-use planning may be most effective
at shaping development and emissions trajectories, but where a
‘governance paradox’ exists (see Section 12.3.1).
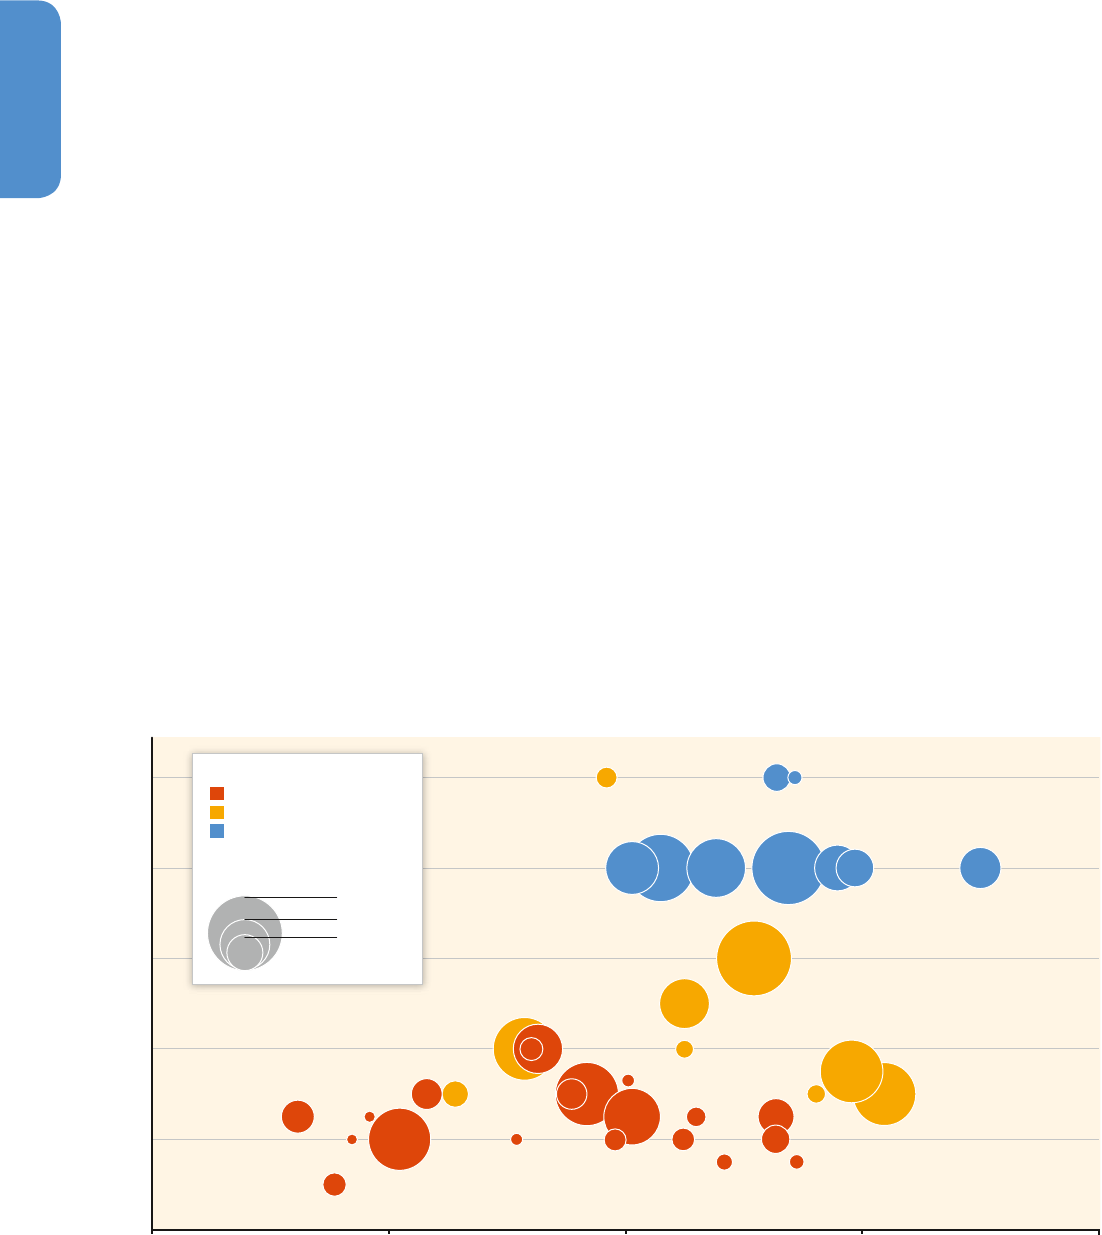
972972
Human Settlements, Infrastructure, and Spatial Planning
12
Chapter 12
to a survey stated they had adopted policies and / or programmes to
address climate change, but only 14 % had adopted a GHG reduction
target (Wang, 2013). In some countries, climate action plans are man-
datory for local governments, further adding to the total. For exam-
ple, in Japan, the Global Warming Law and the Kyoto Protocol Target
Achievement Plan mandate that 1,800 municipal governments and 47
Prefectures prepare climate change mitigation action plans (Sugiyama
and Takeuchi, 2008). In France, climate action plans are mandatory for
cities with populations larger than 50,000 (Yalçın and Lefèvre, 2012).
Climate action planning has been most extensive in cities in AnnexI
countries, particularly those in Europe and Japan. This presents a mis-
match between the places with mitigation planning efforts and the
places where most urban growth will occur — and where the greatest
mitigation potential exists — largely in developing countries that are
rapidly urbanizing.
12.7.2 Targets and timetables
One way to assess the scale of planned mitigation is through the emis-
sion reduction targets set by cities, typically as part of their climate
action plans. A central feature of municipal climate change responses
is that targets and timetables have frequently exceeded national and
international ambitions for emissions reduction. In Germany, nearly
75 % of cities with a GHG target established their emissions goals
based on national or international metrics rather than on a local analy-
sis of mitigation options and the average city reduction target of 1.44 %
per year exceeds the national target (Sippel, 2011). In the United States,
signatories to the Mayors Climate Protection Agreement have pledged
to reduce GHG emissions by 7 % below 1990 levels by 2012, in line
with the target agreed upon in the Kyoto Protocol for the United States
(Krause, 2011b). Lutsey and Sperling (2008) find that these and other
targets in 684 U. S. cities would reduce total emissions in the United
States by 7 % below the 2020 business-as-usual (BAU) baseline.
In Europe and Australia, several municipalities have adopted targets of
reducing GHG emissions by 20 % by 2020 and long-term targets for
radically reducing GHG emissions, including ‘zero-carbon’ targets in
the City of Melbourne and Moreland (Victoria), and a target of 80 %
reduction over 1990 levels by 2050 in London (Bulkeley, 2009). This
approach has not been limited to cities in developed economies. For
example, the city of Cape Town has set a target of increasing energy
efficiency within the municipality by 12 % by 2010 (Holgate, 2007),
and Mexico City has implemented and achieved a target of reducing 7
million tons of GHG from 2008 to 2012 (Delgado-Ramos, 2013). Data
compiled for this assessment, although illustrative rather than system-
atic, indicate an average reduction of 2.74 t CO
2
eq / cap if cities were to
achieve their targets, with percentage targets ranging from 10 % to
100 %. In general, percentage reduction targets are larger for more dis-
tant years and in more affluent cities. However, the absolute level of
the targeted reductions depends primarily on the city’s population and
other determinants of baseline emissions (Figure 12.21.).
Figure 12.22 | Mitigation measures in climate action plans. Sources: Compiled for this assessment from self-reported data submitted to Carbon Disclosure Project (2013).
Efficiency / Retrofit Measures
Building Codes
On-Site Renewables
Building Performance Rating
Financing Mechanisms for Retrofit
Fuel Switching
Non-Motorized Transport
Accessibility to Public Transit
Vehicle Fuel Economy
Transport Demand Management
Bus / Light Rail Fuel Economy
Improve Bus Transit Times
Freight System Efficiency
Greenspace and/or Bio-Diversity
Compact Cities
Urban Agriculture
Brownfield Redevelopment
Transit-Oriented Development
Eco-District Development Strategy
Limiting Urban Sprawl
Building Energy Demand
Cities Undertaking this Mitigation Activity [%]
Transport
Waste
Energy Supply
Urban Land Use
Education
Water
Outdoor Lighting
0 100
908070605040302010
11
47
11
44
9
34
3
34
3
33
8
15
13
2
5
12
Absolute Number of Cities
Non-Annex I
Annex I
Figure 12.21 | Mitigation targets for 42 cities. Sources: Baseline emissions, reduction targets, and population from self-reported data submitted to Carbon Disclosure Project
(2013). GDP data from Istrate & Nadeau (2012). Note that the figure is illustrative only; data are not representative, and physical boundaries, emissions accounting methods and
baseline years vary between cities. Many cities have targets for intermediate years (not shown).
0 20,000 40,000 60,000 80,000
0
20
40
60
80
100
GDP (PPP) per Capita [USD
2010
]
GHG Reduction Target [%]
Greater London
Chicago
New York
Los Angeles
Santiago
Hamburg
Tokyo
Yokohama
Rotterdam
Washington, DC
Portland
Paris
Durban
Philadelphia
Stockholm
Cape Town
Warsaw
Madrid
St. Louis
Amsterdam
Atlanta
Baltimore
Vancouver
Lisbon
Naples
Belo Horizonte
Buenos Aires
Sao Paulo
Seoul
Berlin
Copenhagen
Montreal
Oslo
Toronto
Turin
San
Diego
Kaohsiung
Minneapolis
2020 or Before
2025 to 2030
2050
27,000,000
12,000,000
6,250,000
Target Reduction (tCO
2
eq)
Target Year
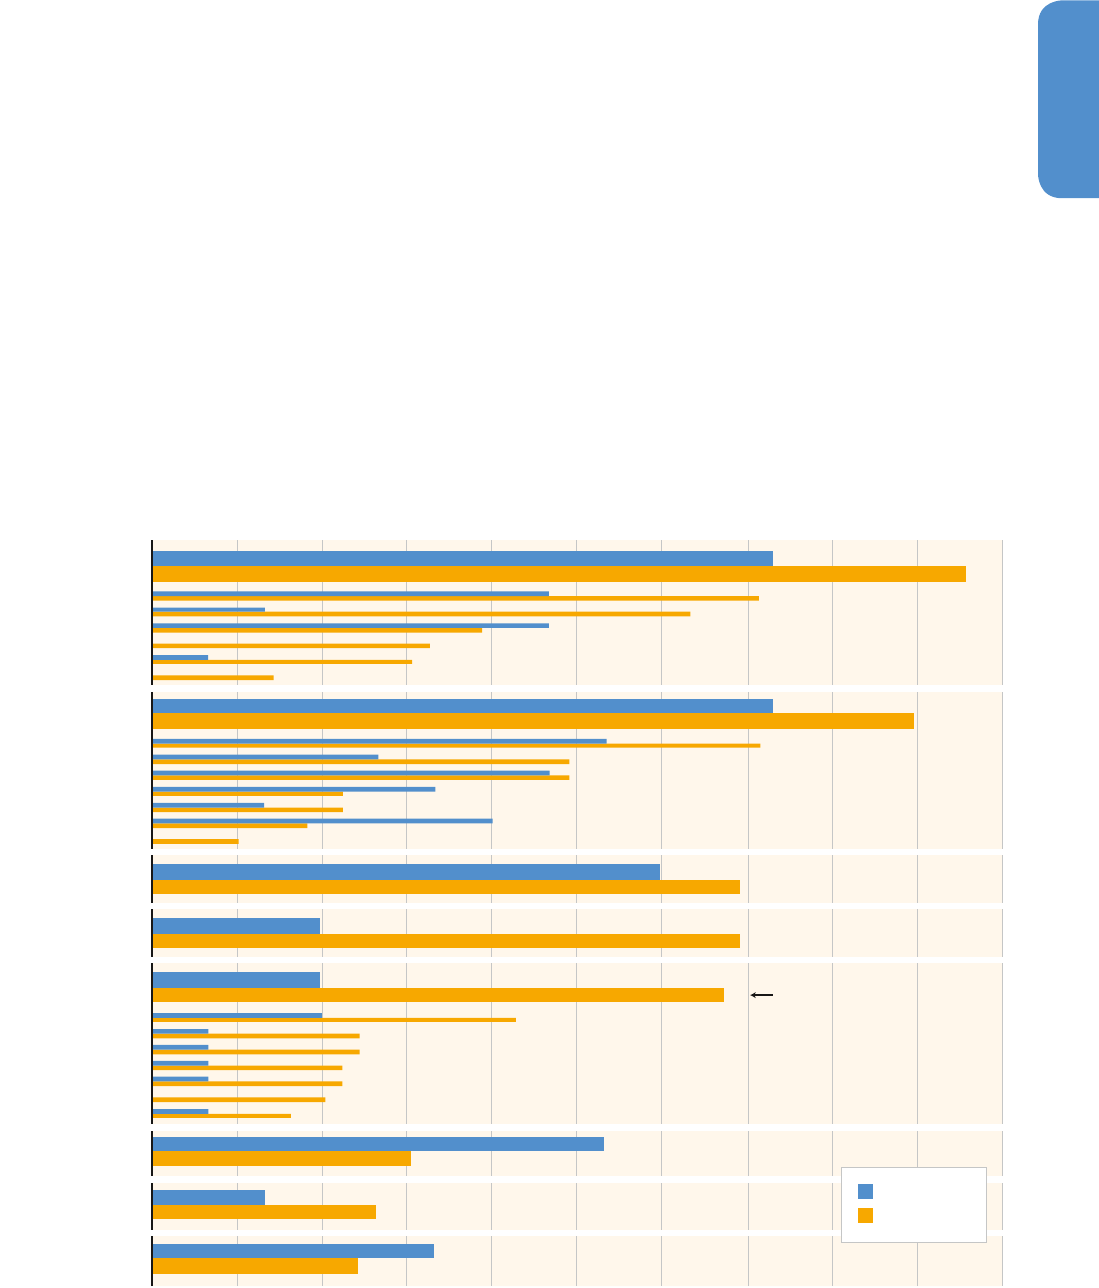
973973
Human Settlements, Infrastructure, and Spatial Planning
12
Chapter 12
In some cases, targets may reflect patterns of potential mitigation.
Targets are often arbitrary or aspirational, and reflect neither mitiga-
tion potential nor implementation. How targets translate into mitiga-
tion effort also depends on how they are quantified, e. g., whether fuel
economy and similar improvements mandated at the national level are
claimed by cities as part of their own reductions (Boswell etal., 2010;
DeShazo and Matute, 2012). Mitigation targets are often set in abso-
lute terms, which may be less meaningful than per-capita reductions in
assessing mitigation potential at the metropolitan scale. This is a particu-
larly important issue for central cities and inner suburbs, where popu-
lation and emissions may increase within the city boundary if policies
to increase density and compactness are successful (see Section 12.4;
Ganson, 2008; Salon etal., 2010).
Many cities, particularly those in developing countries, do not set tar-
gets at all. For example, the Delhi Climate Change Agenda only reports
Delhi’s CO
2
emissions from power, transport, and domestic sectors as
22.49 MtCO
2
for 2007 — 2008 (Government of NCT of Delhi, 2010),
while the contributions from commercial sectors and industries com-
prise a larger share of the city’s total emissions. Furthermore, Delhi’s
climate action plan lacks clear GHG reduction targets, an analysis of
the total carbon reductions projected under the plan, and a strategy for
how to achieve their emissions goals. Similar limitations are apparent
in mitigation plans for other global cities such as Bangkok and Jakarta
(Dhakal and Poruschi, 2010). For many cities in developing countries, a
reliable city GHG inventory may not exist, making the climate change
actions largely symbolic. However, these city action plans provide a
foundation for municipal engagement in mitigation initiatives while
building momentum for collective action on a global scale.
12.7.3 Planned and implemented mitigation
measures
Limited information is available on the extent to which targets are
being achieved or emissions reduced. Some cities have already
achieved their initial GHG reduction targets, e. g., Seattle (Boswell
etal., 2011), or are on track to do so, e. g. Stockholm (City of Stock-
sis of mitigation options and the average city reduction target of 1.44 %
per year exceeds the national target (Sippel, 2011). In the United States,
signatories to the Mayors Climate Protection Agreement have pledged
to reduce GHG emissions by 7 % below 1990 levels by 2012, in line
with the target agreed upon in the Kyoto Protocol for the United States
(Krause, 2011b). Lutsey and Sperling (2008) find that these and other
targets in 684 U. S. cities would reduce total emissions in the United
States by 7 % below the 2020 business-as-usual (BAU) baseline.
In Europe and Australia, several municipalities have adopted targets of
reducing GHG emissions by 20 % by 2020 and long-term targets for
radically reducing GHG emissions, including ‘zero-carbon’ targets in
the City of Melbourne and Moreland (Victoria), and a target of 80 %
reduction over 1990 levels by 2050 in London (Bulkeley, 2009). This
approach has not been limited to cities in developed economies. For
example, the city of Cape Town has set a target of increasing energy
efficiency within the municipality by 12 % by 2010 (Holgate, 2007),
and Mexico City has implemented and achieved a target of reducing 7
million tons of GHG from 2008 to 2012 (Delgado-Ramos, 2013). Data
compiled for this assessment, although illustrative rather than system-
atic, indicate an average reduction of 2.74 t CO
2
eq / cap if cities were to
achieve their targets, with percentage targets ranging from 10 % to
100 %. In general, percentage reduction targets are larger for more dis-
tant years and in more affluent cities. However, the absolute level of
the targeted reductions depends primarily on the city’s population and
other determinants of baseline emissions (Figure 12.21.).
Figure 12.22 | Mitigation measures in climate action plans. Sources: Compiled for this assessment from self-reported data submitted to Carbon Disclosure Project (2013).
Efficiency / Retrofit Measures
Building Codes
On-Site Renewables
Building Performance Rating
Financing Mechanisms for Retrofit
Fuel Switching
Non-Motorized Transport
Accessibility to Public Transit
Vehicle Fuel Economy
Transport Demand Management
Bus / Light Rail Fuel Economy
Improve Bus Transit Times
Freight System Efficiency
Greenspace and/or Bio-Diversity
Compact Cities
Urban Agriculture
Brownfield Redevelopment
Transit-Oriented Development
Eco-District Development Strategy
Limiting Urban Sprawl
Building Energy Demand
Cities Undertaking this Mitigation Activity [%]
Transport
Waste
Energy Supply
Urban Land Use
Education
Water
Outdoor Lighting
0 100
908070605040302010
11
47
11
44
9
34
3
34
3
33
8
15
13
2
5
12
Absolute Number of Cities
Non-Annex I
Annex I

974974
Human Settlements, Infrastructure, and Spatial Planning
12
Chapter 12
holm, 2013). In other places such as western Germany, few if any cit-
ies are likely to meet their targets (Sippel, 2011). Further data come
from comparison of ‘before’ and ‘after’ GHG inventories. One study of
six major cities found that emissions are falling by an average 0.27 t
CO
2
eq / cap per year (Kennedy etal., 2012). Overall, however, the avail-
able data are usually incomplete, self-reported, and subject to various
biases. More fundamentally, changes in aggregate emissions do not
necessarily reflect the success or failure to implement mitigation mea-
sures, because so many drivers of emissions — including the electricity
generation mix and fuel taxation — are normally beyond the control of
cities (DeShazo and Matute, 2012). Whether a city achieves its target
has less to do with its own actions and more to do with external driv-
ers of emissions.
An alternative way to gauge the extent of planned and implemented
mitigation measures is through a bottom-up analysis of individual poli-
cies (Ramaswami etal., 2012a) or sector-specific data on green build-
ings, transport, or waste production (Millard-Ball, 2012a). However,
there are no data from a large number of cities using these methods.
Instead, available data are usually in the form of self-reported planned
or implemented policies (Krause, 2011c; Castán Broto and Bulkeley,
2012; Stone etal., 2012; Bedsworth and Hanak, 2013). While these
data do not reveal aggregate emission reductions, they indicate the
sectoral breadth of city climate action plans and the types of measures
that cities are planning. No single sector dominates mitigation plans,
although transportation and building efficiency are the most common
self-reported measures (Figure 12.22). Here it is worth noting that the
relative contribution of sectors to total urban emissions varies greatly
by city (see Section 12.3).
The types of land-use strategies discussed in Section 12.5, such as
compact development, are sometimes included in municipal efforts
or plans, but the popularity of such land-use measures varies con-
siderably by context. In California, 80 % of municipal survey respon-
dents reported that they had policies for high-density or mixed-use
development in place or under consideration, and the adoption of
such land-use policies rose substantially between 2008 and 2010
(Bedsworth and Hanak, 2013). In the United States, 70 % of climate
action plans reviewed in one study include compact development
strategies (Bassett and Shandas, 2010). In contrast, municipal cli-
mate plans in Norway and Germany focus on energy, transport and
building efficiency, with little attention given to land use (Aall etal.,
2007; Sippel, 2011). At a global level, self-reported data from a small
sample of cities (Figure 12.22) suggests that land-use measures are
relatively uncommon in climate action plans — particularly outside
Annex I countries. Moreover, where land-use strategies exist, they
focus on urban greenspace and / or biodiversity, rather than on the
cross-sectoral measures to reduce sprawl and promote TOD that were
discussed in Section 12.5.
Even if land use measures are listed in climate action plans, implemen-
tation has focused on win-win energy efficiency measures that lead to
cost savings, rather than larger changes to land use, buildings or trans-
port. This is a consistent message from qualitative studies (Kousky and
Schneider, 2003; Rutland and Aylett, 2008; Kern and Bulkeley, 2009),
and some larger surveys of city efforts (Wang, 2013). There has been
less engagement by municipalities with sectors such as energy and
water supply that often lie outside of their jurisdiction (Bulkeley and
Kern, 2006; ARUP, 2011) or with the GHG emissions embodied in pres-
ent patterns of urban resource use and consumption. More broadly,
there is considerable variation in the nature and quality of climate
change plans, particularly when it comes to specifying the detail of
actions and approaches to implementation (Wheeler, 2008; Tang etal.,
2011; Bulkeley and Schroeder, 2012).
Despite the implementation of comprehensive climate action plans
and policies, progress for cities in developed countries is slow and the
achievability of emissions targets remains uncertain. Although munic-
ipalities often highlight progress on mitigation projects, the impacts
of these initiatives are not often evaluated (see Chapter 15 on policy
evaluation). Cities’ mitigation reduction performance is largely cor-
related to the national performance in mitigation reduction.
12.8 Sustainable development,
co-benefits, trade-offs,
and spill-over effects
Sustainable development (SD) is, and has always been, closely associ-
ated with human settlements. In fact, the very document that coined
the phrase, the World Commission on Environment and Development
(WCED) Report (WCED 1987), devoted a chapter to ‘the urban chal-
lenge’. While averting the adverse social and environmental effects of
climate change remains at the core of the urban challenge today, cities
throughout the world also continue to struggle with a host of other
critical challenges, including, for instance, ensuring access to clean,
reliable and affordable energy services for their citizens (particularly
for the urban poor); limiting congestion, noise, air and water pollu-
tion, and health and ecosystem damages; and maintaining sufficient
employment opportunities and competitiveness in an increasingly glo-
balized world.
Efforts to mitigate climate change will have important side-effects
for these various policy objectives, as discussed in Sections 5.7, 6.6,
7.9, 8.7, 9.7, 10.8, 11.7 and 11.A.6. To the extent these side-effects
are positive, they can be deemed ‘co-benefits’; if adverse, they imply
‘risks’.
3
As such side-effects are likely to materialize first in urban set-
tings since these are the hubs of activity, commerce, and culture in
3
Co-benefits and adverse side-effects describe co-effects without yet evaluating
the net effect on overall social welfare. Please refer to the respective sections in
the framing chapters as well as to the glossary in AnnexI for concepts and defini-
tions — particularly Sections 2.4, 3.6.3, and 4.8.2.

975975
Human Settlements, Infrastructure, and Spatial Planning
12
Chapter 12
the modern world: this section will focus on the literature specifically
linked to urban settings and refer to other sections of the report where
appropriate.
Action on climate change mitigation often depends on the ability to
‘reframe’ or ‘localize’ climate change with respect to the co-benefits
that could be realized (Betsill, 2001). For example, in Canada “actions
to reduce GHG emissions are also deeply connected to other goals and
co-benefits such as human health improvements through improved air
quality, cost savings, adaptability to real or potential vulnerabilities due
to climate change, and overall improvements in short, medium and long-
term urban sustainability” (Gore etal., 2009). Sometimes called ‘local-
izing’ or ‘issue bundling’ (Koehn, 2008), these reframing strategies have
proven to be successful in marshalling local support and action in devel-
oping country cities, and will continue to be an important component of
developing local capacity for mitigation (Puppim de Oliveira, 2009).
12.8.1 Urban air quality co-benefits
Worldwide, only 160 million people live in cities with truly clean
air — that is, in compliance with World Health Organization (WHO)
guidelines (Grubler etal., 2012) (Figure 12.23). Oxides of sulfur and
nitrogen (SO
x
and NO
x
) and ozone (O
3
) — i. e., outdoor air pollut-
ants — are particularly problematic in cities because of high concen-
trations and exposures (Smith etal., 2012) (see Section 9.7 for a dis-
cussion of mitigation measures in the buildings sector on indoor air
pollution and Section 7.9.2). Transport remains one of the biggest
emitting sectors in the industrialized world. In developing countries, a
wider range of sources is to blame, with vehicle emissions playing an
ever increasing role also due to continuing urbanization trends (Kin-
ney etal., 2011; Smith etal., 2012; see also Sections 5.3.5.1 and 8.2).
In a study of four Indian megacities, for instance, gasoline and diesel
vehicle emissions already comprise 20 – 50 % of fine particulate mat-
ter (PM
2.5
) emissions (Chowdhury etal., 2007). The associated health
burdens are particularly high in low-income communities due to high
exposures and vulnerabilities (Campbell-Lendrum and Corvalán, 2007;
Morello-Frosch etal., 2011).
Major air quality co-benefits can be achieved through mitigation
actions in the urban context, especially in megacities in developing
countries where outdoor air pollution tends to be higher than in urban
centres in industrialized countries (Molina and Molina, 2004 and sec-
tion 5.7). Urban planning strategies and other policies that promote
cleaner fuels, transport mode shifting, energy cogeneration and waste
heat recycling, buildings, transport and industry efficiency standards
can all contribute to lower rates of respiratory and cardiovascular
disease (improved human health) as well as decreased impacts on
urban vegetation (enhanced ecosystems) via simultaneous reductions
in co-emitted air pollutant species (Campbell-Lendrum and Corvalán,
2007; Creutzig and He, 2009; Milner etal., 2012; Puppim de Oliveira
etal., 2013 and Sections 7.9, 8.7, 9.7, 10.8 as well as WGII AR5 Chap-
ter 11.9).
4
Even an action like shading parking lots, which is generally
thought of in the context of limiting the urban heat-island effect, can
bring air pollution co-benefits through reductions in volatile organic
compounds (VOC) and, thus, low-level ozone formation from parked
vehicles (Scott etal., 1999).
4
Monetized health co-benefits are found to be larger in developing countries than
industrialized countries, a finding that results from the currently higher pollution
levels of the former and, thus, the greater potential for improving health, particu-
larly in the transport and household energy demand sectors (Markandya et al.,
2009; Nemet et al., 2010; West et al., 2013 and Section 5.7).
Table 12.6 | Potential co-benefits (green arrows) and adverse side-effects (orange arrows) of urban mitigation measures. Arrows pointing up / down denote a positive / negative
effect on the respective objective or concern. The effects depend on local circumstances and the specific implementation strategy. For an assessment of macroeconomic, cross-
sectoral effects associated with mitigation policies (e. g., on energy prices, consumption, growth, and trade), see Sections 3.9, 6.3.6, 13.2.2.3 and 14.4.2. Numbers correspond to
references listed below the table.
Mitigation
measures
Effect on additional objectives / concerns
Economic Social (including health) Environmental
Compact development
and infrastructure
↑
↑ ↑
↑
Innovation and productivity
1
Higher rents & residential property values
2
Efficient resource use and delivery
5
↑
Health from increased physical activity
3
↑
Preservation of open space
4
Increased accessibility
↑
Commute savings
6
↑
↑
Health from increased physical activity
3
Social interaction and mental health
7
↑
Air quality and reduced ecosystem and health
impacts
8
Mixed land use
↑
↑ ↑
Commute savings
6
Higher rents & residential property values
2
↑
↑
Health from increased physical activity
3
Social interaction and mental health
7
↑
Air quality and reduced ecosystem and health
impacts
8
References: 1: Ciccone and Hall (1996), Carlino etal. (2007); 2: Mayer and Somerville (2000), Quigley and Raphael (2005), Glaeser etal. (2006), Koster and Rouwendal (2012);
3: Handy etal. (2002), Frank etal. (2004, 2009), Heath etal. (2006), Forsyth etal. (2007), Owen etal. (2007); 4: Brueckner (2000), Bengston etal. (2004), 5: Speir and Stephenson
(2002), Guhathakurta and Gober (2007); 6: Krizek (2003), Cervero and Duncan (2006), Ma and Banister (2006), Day and Cervero (2010); 7: Galea etal. (2005), Berke etal. (2007),
Duncan etal. (2013); 8: Campbell-Lendrum and Corvalán (2007), Creutzig and He (2009), Milner etal. (2012), Puppim de Oliveira etal. (2013).
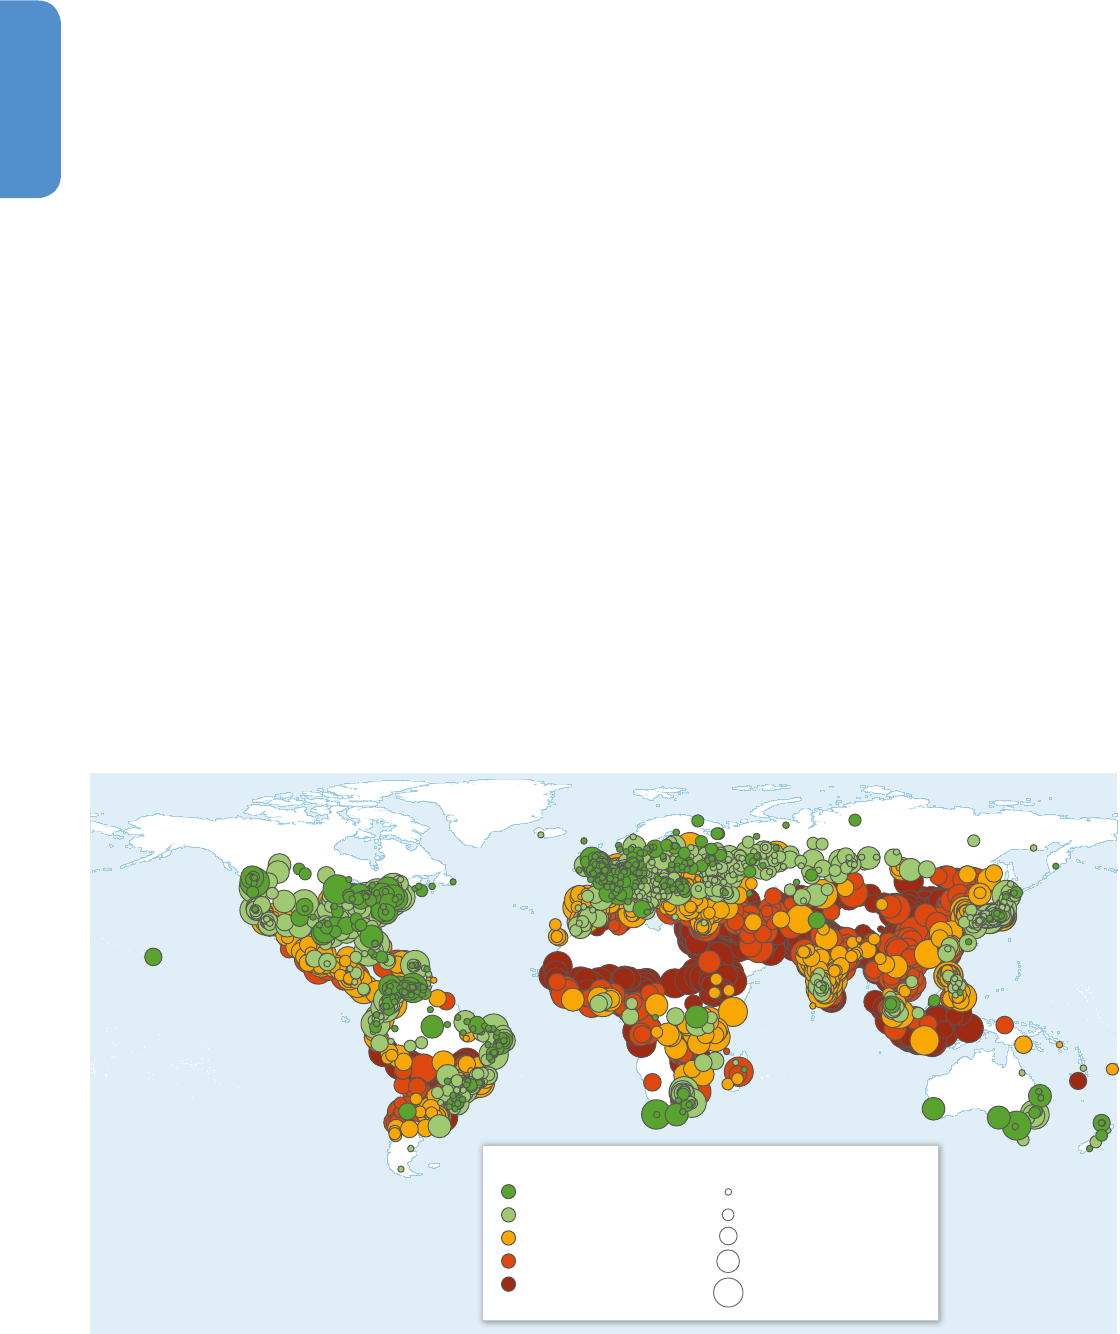
976976
Human Settlements, Infrastructure, and Spatial Planning
12
Chapter 12
In the near-term (2030), air quality co-benefits of stringent mitigation
actions (i. e., in line with achieving 450 ppm CO
2
eq by 2100) can be
quite substantial in a highly urbanized region like Europe; decarboniza-
tion and energy efficiency (largely in transport) could reduce aggregate
NO
x
emissions by a further 38 % relative to a baseline scenario that
includes current and planned air quality legislation by 2030 but does
not consider climate policies (Colette etal., 2012). Similar co-benefits
have been reported for other pollutants in other regions (Rao etal.,
2013), particularly in developing Asia (Doll and Balaban, 2013; Puppim
de Oliveira etal., 2013) (see Section 6.6). The potential for realizing
these co-benefits depends on institutional frameworks and policy
agendas at both the local and national level, as well as the interplay
between the two (see Doll et al., 2013, and Jiang et al., 2013, for
reviews of India and China). At the same time, the increasing role of
decentralized power generation could lead to adverse air quality side-
effects if this trend is not coupled with a more intensive use of low-
carbon energy supply (Milner etal., 2012).
12.8.2 Energy security side-effects for urban
energy systems
Mitigating climate change could have important side-effects for urban
energy security (sufficient resources and resilient supply) — concerns
that have re-emerged in many cities throughout the world in recent
years (see Sections 6.6.2.1 and 7.9.1 for a broader discussion of energy
security concerns). Perhaps the greatest energy-related vulnerability
in this context is the fact that urban transport systems are at present
almost entirely dependent on oil (Cherp etal., 2012). This is especially
true in low-density areas where reliance on private vehicles is high
(Levinson and Kumar, 1997). Therefore, any mitigation activities leading
to a diversification of the transport sector away from oil could poten-
tially also contribute to a security co-benefit (see Jewell etal., 2013 and
other references in Chapter 8.7.1). Such measures might range from
technology standards (e. g., for vehicles and their fuels) to integrated
infrastructure, spatial planning, and mass transit policies (Sections 12.5
and 8.10). Energy efficiency regulations for buildings and industrial facil-
ities (both existing and new) can also help to enhance the resilience of
fuel and electricity distribution networks (see Chapters 9.7 and 10.8).
12.8.3 Health and socioeconomic co-benefits
Spatial planning and TOD can yield other positive side-effects that may
enhance a city’s liveability. For example, mass transit requires consid-
erably less physical space than private automobiles (transit: 0.75 – 2.5
m
2
/ cap; auto: 21 – 28 m
2
/ cap) and generally emits less noise (Grubler
etal., 2012), with health co-benefits in terms of cardiovascular disease
and sleep disturbance (Kawada, 2011; Ndrepepa and Twardella, 2011
see also 8.7; Milner etal., 2012).
Neighbourhoods with walkable characteristics such as connectivity
and proximity of destinations are correlated with higher frequency
of physical activity among residents (Frank etal., 2004; Owen etal.,
2007), which is correlated with lower symptoms and incidences of
depression (Galea etal., 2005; Berke etal., 2007; Duncan etal., 2013).
Figure 12.23 | Human risk exposure to PM
10
pollution in 3200 cities worldwide. Source: Grubler etal.(2012) based on Doll (2009) and Doll and Pachauri (2010).
38,746,313 - 2,538,095,144
15,898,968 - 38,746,313
7,939,338 - 15,898,968
4,050,173 - 7,939,338
85,741 - 4,050,173
PM
10
Concentrations [µg/m
3
]
(Above Target 1)
(Target 1)
(Target 2)
(Target 3)
(WHO Air Quality Guideline)
>70
50-70
30-50
20-30
<20
Exposure Quintiles [Capita*μg/m
3
]

977977
Human Settlements, Infrastructure, and Spatial Planning
12
Chapter 12
Compact neighbourhoods with more diversified land uses are cor-
related with higher housing prices and rents (Mayer and Somerville,
2000; Quigley and Raphael, 2005; Glaeser et al., 2006; Koster and
Rouwendal, 2012). In a study of the Netherlands, neighbourhoods
with more diverse land uses had a 2.5 % higher housing prices (Koster
and Rouwendal, 2012).
12.8.4 Co-benefits of reducing the urban heat
island effect
The urban heat island (UHI) effect presents a major challenge to urban
sustainability (see WG II AR5 Chapter 8). Not only does UHI increase
the use of energy for cooling buildings (and thus increasing the miti-
gation challenge) and thermal discomfort in urban areas, but UHI
also increases smoggy days in urban areas, with smog health effects
present above 32 °C (Akbari etal., 2001; O’Neill and Ebi, 2009; Mav-
rogianni etal., 2011; Rydin etal., 2012). Proven methods for cooling
the urban environment include urban greening, increasing openness
to allow cooling winds (Smith and Levermore, 2008), and using more
‘cool’ or reflective materials that absorb less solar radiation, i. e.,
increasing the albedo of the surfaces (Akbari etal, 2008; Akbari and
Matthews, 2012). Reducing UHI is most effective when considered in
conjunction with other environmental aspects of urban design, includ-
ing solar / daylight control, ventilation and indoor environment, and
streetscape (Yang etal., 2010). On a global scale, increasing albedos
of urban roofs and paved surfaces is estimated to induce a negative
radiative forcing equivalent to offsetting about 44 Gt of CO
2
emissions
(Akbari etal., 2008).
Reducing summer heat in urban areas has several co-benefits. Electric-
ity use in cities increases 2 – 4 % for each 1 °C increase in temperature,
due to air conditioning use (Akbari etal., 2001). Lower temperatures
reduce energy requirements for air conditioning (which may result in
decreasing GHG emissions from electricity generation, depending upon
the sources of electricity), reduce smog levels (Rosenfeld etal., 1998),
and reduce the risk of morbidity and mortality due to heat and poor air
quality (Harlan and Ruddell, 2011). Cool materials decrease the tem-
perature of surfaces and increase the lifespan of building materials and
pavements (Santero and Horvath, 2009; Synnefa etal., 2011).
The projected global mean surface temperature increases under cli-
mate change will disproportionally impact cities already affected by
UHI, thereby increasing the energy requirements for cooling buildings
and increasing urban carbon emissions, as well as air pollution (Mick-
ley etal., 2004; Jacob and Winner, 2009). In addition, it is likely that cit-
ies will experience an increase in UHI as a result of projected increases
in global mean surface temperature under climate change, which will
result in additional global urban energy use, GHG emissions, and local
air pollution. As reviewed here, studies indicate that several strategies
are effective for decreasing the UHI. An effective strategy to mitigate
UHI through increasing green spaces, however, can potentially con-
flict with a major urban climate change mitigation strategy, which is
increasing densities to create more compact cities (Milner etal., 2012).
This conflict illustrates the complexity of developing integrated and
effective climate change policies for urban areas.
More generally, reducing UHI effects — either through mitigation
measures (e. g., improved waste heat recycling, co-generation, use of
reflective building materials, increased vegetation) or through miti-
gation — can have co-benefits for urban water supplies (e. g., cooling
water for thermal or industrial plants, drinking water), given that evap-
oration losses rise as water bodies warm (Grubler etal., 2012).
12.9 Gaps in knowledge
and data
This assessment highlights a number of key knowledge gaps:
• Lack of consistent and comparable emissions data at local
scales. Although some emissions data collection efforts are under-
way, they have been undertaken primarily in large cities in devel-
oped countries. The lack of baseline data makes it particularly chal-
lenging to assess the urban share of global GHG emissions as well
as develop urbanization and typologies and their emission path-
ways. Given the small number of city based estimates, more city
data and research are needed, especially an urban emissions data
system.
• Little scientific understanding of the magnitude of the emis-
sions reduction from altering urban form, and the emissions
savings from integrated infrastructure and land use plan-
ning. Furthermore, there is little understanding of how different
aspects of urban form interact and affect emissions. The existing
research on the impact of policies designed to achieve emissions
reductions through urban form do not conform to the standards of
policy evaluation and assessment defined in Chapter 15.
• Lack of consistency and thus comparability on local emis-
sions accounting methods. Different accounting protocols yield
significantly different results, making cross-city comparisons of
emissions or climate action plans difficult. There is a need for stan-
dardized methodologies for local- or urban-level carbon account-
ing.
• Few evaluations of urban climate action plans and their
effectiveness. There is no systematic accounting to evaluate
the efficacy of city climate action plans (Zimmerman and Faris,
2011). Studies that have examined city climate action plans con-
clude that they are unlikely to have significant impact on reducing
overall emissions (Stone etal., 2012; Millard-Ball, 2012a). Another
major limitation to local or city climate action plans is their limited

978978
Human Settlements, Infrastructure, and Spatial Planning
12
Chapter 12
coordination across city sectors and administrative / hierarchical
levels of governance and lack of explicitly incorporating land-
based mitigation strategies. Successful local climate action plans
will require coordination, integration, and partnerships among
community organizations, local government, state and federal
agencies, and international organizations (Yalçın and Lefèvre,
2012; Zeemering, 2012).
• Lack of scientific understanding of how cities can prioritize
climate change mitigation strategies, local actions, invest-
ments, and policy responses that are locally relevant. Some
cities will be facing critical vulnerability challenges, while other will
be in the ‘red zone’ for their high levels of emissions. Local decision-
makers need clarity on where to focus their actions, and to avoid
spending resources and efforts on policies and investments that are
not essential. There is little scientific basis for identifying the right
mix of policy responses to address local and urban level mitiga-
tion and adaptation. Policy packages will be determined based on
the characteristics of individual cities and their urbanization and
development pathways, as well as on forecasts of future climate
and urbanization. They will be aimed at flexing the urban- and set-
tlement-related ‘drivers’ of emissions and vulnerability in order to
ensure a less carbon-intensive and more resilient future for cities.
• Large uncertainties as to how cities will develop in the future.
There is robust scientific evidence that emissions vary across cities
and that urban form and infrastructure play large roles in determin-
ing the relationship between urbanization and emissions.
12.10 Frequently Asked
Questions
FAQ 12.1 Why is the IPCC including a new chapter
on human settlements and spatial plan-
ning? Isn’t this covered in the individual
sectoral chapters?
Urbanization is a global megatrend that is transforming societies.
Today, more than 50 % of the world population lives in urban areas. By
2050, the global urban population is expected to increase by between
2.5 to 3 billion, corresponding to 64 % to 69 % of the world popula-
tion. By mid-century, more urban areas and infrastructure will be built
than currently exist. The kinds of towns, cities, and urban agglomera-
tions that ultimately emerge over the coming decades will have a criti-
cal impact on energy use and carbon emissions. The Fourth Assessment
Report (AR4) of the IPCC did not have a chapter on human settlements
or urban areas. Urban areas were addressed through the lens of indi-
vidual sector chapters. Since the publication of AR4, there has been a
growing recognition of the significant contribution of urban areas to
GHG emissions, their potential role in mitigating them, and a multi-
fold increase in the corresponding scientific literature.
FAQ 12.2 What is the urban share of global energy
and GHG emissions?
The exact share of urban energy and GHG emissions varies with emis-
sion accounting frameworks and definitions. Urban areas account for
67 – 76 % of global energy use and 71 – 76 % of global energy-related
CO
2
emissions. Using Scope1 accounting, urban share of global CO
2
emissions is about 44 %.
Urban areas account for between 53 % and 87 % (central estimate,
76 %) of CO
2
emissions from global final energy use and between 30 %
and 56 % (central estimate, 43 %) of global primary energy related CO
2
emissions.
FAQ 12.3 What is the potential of human
settlements to mitigate climate change?
Drivers of urban GHG emissions can be categorized into four major
groups: economic geography and income, socio-demographic factors,
technology, and infrastructure and urban form. Of these, the first three
groups have been examined in greatest detail, and income is consis-
tently shown to exert a high influence on urban GHG emissions. Socio-
demographic drivers are of medium importance in rapidly growing cit-
ies, technology is a driver of high importance, and infrastructure and
urban form are of medium to high importance as drivers of emissions.
Key urban form drivers of GHG emissions are density, land use mix,
connectivity, and accessibility. These factors are interrelated and inter-
dependent. As such, none of them in isolation are sufficient for lower
emissions.

979979
Human Settlements, Infrastructure, and Spatial Planning
12
Chapter 12
References
Aall C., K. Groven, and G. Lindseth (2007). The Scope of Action for Local Cli-
mate Policy: The Case of Norway. Global Environmental Politics 7, 83 – 101. doi:
10.1162 / glep.2007.7.2.83.
Acuto M. (2013). The new climate leaders? Review of International Studies 39,
835 – 857. doi: 10.1017 / S0260210512000502.
Adeyinka A. M. (2013). Spatial Distribution, Pattern and Accessibility of Urban
Population to Health Facilities in Southwestern Nigeria: The Case Study of Ilesa.
Mediterranean Journal of Social Sciences 4, 425 – 436. ISSN: 2039-2117. doi:
10.5901 / mjss.2013.v4n2p425
Aguilar, A. G., P. M. Ward, and C. B. Smith (2003). Globalization, regional develop-
ment, and mega-city expansion in Latin America: Analyzing Mexico City’s peri-
urban hinterland. Cities 20, 3 – 21. doi: 10.1016 / S0264-2751(02)00092-6, ISSN:
0264-2751.
Aguilera A. (2008). Business travel and mobile workers. Transportation Research
Part A: Policy and Practice 42, 1109 – 1116. doi: 10.1016 / j.tra.2008.03.005,
ISSN: 0965-8564.
Agyeman K. O., O. Amponsah, I. Braimah, and S. Lurumuah (2012). Commercial
Charcoal Production and Sustainable Community Development of the Upper
West Region, Ghana. Journal of Sustainable Development 5, 149 – 164. doi:
10.5539 / jsd.v5n4p149, ISSN: 1913-9071.
Akbari, H. and H. D. Matthews (2012). Global cooling updates: Reflec-
tive roofs and pavements. Energy and Buildings 55, 2 – 6. doi: 10.1016 / j.
enbuild.2012.02.055
Akbari H., S. Menon, and A. Rosenfeld (2008). Global cooling: increasing
world-wide urban albedos to offset CO
2
. Climatic Change 94, 275 – 286. doi:
10.1007 / s10584-008-9515-9.
Akbari H., M. Pomerantz, and H. Taha (2001). Cool surfaces and shade trees
to reduce energy use and improve air quality in urban areas. Solar Energy 70,
295 – 310. doi: 10.1016 / S0038-092X(00)00089-X, ISSN: 0038-092X.
Alkema L., A. E. Raftery, P. Gerland, S. J. Clark, F. Pelletier, T. Buettner, and
G. K. Heilig (2011). Probabilistic Projections of the Total Fertility Rate for All
Countries. Demography 48, 815 – 839. doi: 10.1007 / s13524-011-0040-5, ISSN:
0070-3370, 1533 – 7790.
Allwood J. M., J. M. Cullen, and R. L. Milford (2010). Options for Achieving a
50 % Cut in Industrial Carbon Emissions by 2050. Environmental Science &
Technology 44, 1888 – 1894. doi: 10.1021 / es902909k, ISSN: 0013-936X.
Alterman R. (1997). The Challenge of Farmland Preservation: Lessons from a
Six-Nation Comparison. Journal of the American Planning Association 63,
220 – 243. doi: 10.1080 / 01944369708975916, ISSN: 0194-4363, 1939 – 0130.
Altes W. K. K. (2009). Taxing land for urban containment: Reflections on a Dutch
debate. Land Use Policy 26, 233 – 241. doi: 10.1016 / j.landusepol.2008.01.006,
ISSN: 02648377.
Amati M. (2008). Green belts: a twentieth-century planning experiment. In: Urban
green belts in the twenty-first century. M. Amati, (ed.), Ashgate, pp. 1 – 17. ISBN:
978-0-7546-4959-5.
Andreev P., I. Salomon, and N. Pliskin (2010). Review: State of teleactivi-
ties. Transportation Research Part C: Emerging Technologies 18, 3 – 20. doi:
10.1016 / j.trc.2009.04.017, ISSN: 0968-090X.
Angel S., J. Parent, D. L. Civco, and A. M. Blei (2010). The persistent decline
in urban densities: Global and historical evidence of sprawl. Lincoln
Institute of Land Policy Working Paper. Available at: http: / / urb.iiedlist.
org / sites / default / files / Angel%202010-declineinurbandensities.pdf.
Angel S., J. Parent, D. L. Civco, A. Blei, and D. Potere (2011). The dimensions of
global urban expansion: Estimates and projections for all countries, 2000 – 2050.
Progress in Planning 75, 53 – 107. doi: 10.1016 / j.progress.2011.04.001, ISSN:
0305-9006.
Angel S., S. C. Sheppard, D. L. Civco, R. Buckley, A. Chabaeva, L. Gitlin, A.
Kraley, J. Parent, and M. Perlin (2005). The Dynamics of Global Urban
Expansion. Transport and Urban Development Department, World Bank,
Washington, D. C., 207 pp. Available at: http: / / siteresources.worldbank.org /
INTURBANDEVELOPMENT / Resources / dynamics_urban_expansion.pdf.
Arbesman S., J. M. Kleinberg, and S. H. Strogatz (2009). Superlinear scaling
for innovation in cities. Physical Review E 79, 016115. doi: 10.1103 / Phys-
RevE.79.016115.
Arikan Y. (2011). Carbonn Cities Climate Registry 2011 Annual Report. Bonn
Center for Local Climate Action and Reporting, Bonn. Available at: http: / /
citiesclimateregistry.org / resources / newsletters-and-reports/.
Arrington G. B., and R. Cervero (2008). Effects of TOD on Housing, Parking,
and Travel. Transit Cooperative Research Program, Washington, D. C., ISBN:
9780309117487, 0309117488. Available at: http: / / www.reconnectingamerica.
org / assets / Uploads / finalreporttcrp128.pdf.
Arthur W. B. (1989). Competing Technologies, Increasing Returns, and Lock-In by
Historical Events. The Economic Journal 99, 116 – 131. doi: 10.2307 / 2234208,
ISSN: 0013-0133.
ARUP (2011). Climate Action in Megacities: C40 Cities Baseline and Opportunities.
C40 Cities, Available at: http: / / www. arup. com / Publications / Climate_Action_
in_Megacities.aspx.
Aumnad P. (2010). Integrated energy and carbon modeling with a decision support
system: Policy scenarios for low-carbon city development in Bangkok. Energy
Policy 38, 4808 – 4817. doi: 10.1016 / j.enpol.2009.10.026, ISSN: 0301-4215.
Aurand A. (2010). Density, Housing Types and Mixed Land Use: Smart
Tools for Affordable Housing? Urban Studies 47, 1015 – 1036. doi:
10.1177 / 0042098009353076, ISSN: 0042-0980.
Ausubel J. H., and R. Herman (1988). Cities and Their Vital Systems: Infrastructure
Past, Present, and Future. National Academies Press, Washington, D. C., 368 pp.
ISBN: 0309555167.
Axhausen K. (2008). Accessibility Long Term Perspectives. Journal of Transport and
Land Use 1, 5 – 22. doi: 10.5198 / jtlu.v1i2.66, ISSN: 1938-7849.
Azar C., K. Lindgren, M. Obersteiner, K. Riahi, D. P. van Vuuren, K. M. G. J. den
Elzen, K. Möllersten, and E. D. Larson (2010). The feasibility of low CO
2
con-
centration targets and the role of bio-energy with carbon capture and storage
(BECCS). Climatic Change 100, 195 – 202. doi: 10.1007 / s10584-010-9832-7,
ISSN: 0165-0009, 1573 – 1480.
Bader N., and R. Bleischwitz (2009). Measuring Urban Greenhouse Gas Emis-
sions: The Challenge of Comparability. S. A. P. I.EN.S 2, 1 – 15. ISSN: 1993-3800.
Bae C.-H. C., and M.-J. Jun (2003). Counterfactual Planning What if there had
been No Greenbelt in Seoul? Journal of Planning Education and Research 22,
374 – 383. doi: 10.1177 / 0739456X03022004004, ISSN: 0739-456X, 1552 – 6577.
Bahl R. W., and J. F. Linn (1998). Urban Public Finance in Developing Countries.
Oxford University Press, New York, ISBN: 9780195211221.

980980
Human Settlements, Infrastructure, and Spatial Planning
12
Chapter 12
Bailis R., M. Ezzati, and D. M. Kammen (2005). Mortality and Greenhouse Gas
Impacts of Biomass and Petroleum Energy Futures in Africa. Science 308,
98 – 103. doi: 10.1126 / science.1106881, ISSN: 0036-8075, 1095 – 9203.
Bangkok Metropolitan Administration (2013). Bangkok, The Green City.
Banister D. (2005). Unsustainable Transport: City Transport in the New Century.
Routledge, Oxfordshire, England, 292 pp. ISBN: 978415357829.
Banister D. (2008). The sustainable mobility paradigm. Transport Policy 15, 73 – 80.
doi: 10.1016 / j.tranpol.2007.10.005, ISSN: 0967-070X.
Banister D. (2011). Cities, mobility and climate change. Journal of Transport Geog-
raphy 19, 1538 – 1546. doi: 10.1016 / j.jtrangeo.2011.03.009, ISSN: 0966-6923.
Banzhaf H. S., and N. Lavery (2010). Can the land tax help curb urban sprawl?
Evidence from growth patterns in Pennsylvania. Journal of Urban Economics
67, 169 – 179. doi: 10.1016 / j.jue.2009.08.005, ISSN: 00941190.
Barbour E., and E. A. Deakin (2012). Smart Growth Planning for Climate
Protection. Journal of the American Planning Association 78, 70 – 86. doi:
10.1080 / 01944363.2011.645272, ISSN: 0194-4363.
Barter P. A. (2011). Parking Requirements in Some Major Asian Cities. Transpor-
tation Research Record: Journal of the Transportation Research Board 2245,
79 – 86. doi: 10.3141 / 2245-10, ISSN: 0361-1981.
Bassett E., and V. Shandas (2010). Innovation and Climate Action Planning: Per-
spectives from Muncipal Plans. Journal of the American Planning Association
76, 435 – 450. doi: 10.1080 / 01944363.2010.509703, ISSN: 0194-4363.
Batt H. W. (2001). Value Capture as a Policy Tool in Transportation Economics: An
Exploration in Public Finance in the Tradition of Henry George. American Jour-
nal of Economics and Sociology 60, 195 – 228. doi:10.1111 / 1536-7150.00061.
Batty M. (2007). Cities and Complexity: Understanding Cities Through Cellular
Automata, Agent-Based Models and Fractals. The MIT Press, Cambridge, MA,
565 pp. ISBN: 0262025833.
Batty M. (2008). The Size, Scale, and Shape of Cities. Science 319, 769 – 771. doi:
10.1126 / science.1151419, ISSN: 0036-8075, 1095 – 9203.
Bauman G., and W. H. Ethier (1987). Development Exactions and Impact Fees: A
Survey of American Practices. Land Use Law & Zoning Digest 39, 3 – 11. doi: 10.
1080 / 00947598.1987.10395091, ISSN: 0094-7598.
Baum-Snow N. (2007). Did Highways Cause Suburbanization? The Quarterly
Journal of Economics 122, 775 – 805. doi: 10.1162 / qjec.122.2.775, ISSN: 0033-
5533, 1531 – 4650.
Baynes T., M. Lenzen, J. K. Steinberger, and X. Bai (2011). Comparison of house-
hold consumption and regional production approaches to assess urban energy
use and implications for policy. Energy Policy 39, 7298 – 7309. ISSN: 0301-4215.
doi: 10.1016 / j.enpol.2011.08.053.
Beatley T. (2000). Green Urbanism: Learning From European Cities. Island Press,
Washington, D. C., 514 pp. ISBN: 9781610910132.
Beauregard R. A., and A. Marpillero-Colomina (2011). More than a master plan:
Amman 2025. Cities 28, 62 – 69. doi: 10.1016 / j.cities.2010.09.002, ISSN: 0264-
2751.
Bedsworth L. W., and E. Hanak (2013). Climate policy at the local level: Insights
from California. Global Environmental Change 23, 664 – 677. doi: 10.1016 / j.
gloenvcha.2013.02.004, ISSN: 09593780.
Beevers S., and D. Carslaw (2005). The impact of congestion charging on vehi-
cle emissions in London. Atmospheric Environment 39, 1 – 5. doi: 10.1016 / j.
atmosenv.2004.10.001, ISSN: 13522310.
Benediktsson J. A., M. Pesaresi, and K. Amason (2003). Classification and fea-
ture extraction for remote sensing images from urban areas based on morpho-
logical transformations. IEEE Transactions on Geoscience and Remote Sensing
41, 1940 – 1949. doi: 10.1109 / TGRS.2003.814625, ISSN: 0196-2892.
Bengston D. N., J. O. Fletcher, and K. C. Nelson (2004). Public policies for manag-
ing urban growth and protecting open space: policy instruments and lessons
learned in the United States. Landscape and Urban Planning 69, 271 – 286. doi:
10.1016 / j.landurbplan.2003.08.007, ISSN: 0169-2046.
Bengston D. N., and Y.-C. Youn (2006). Urban containment policies and the pro-
tection of natural areas: the case of Seoul’s greenbelt. Ecology and Society 11,
1 – 15. Available at: http: / / www. ecologyandsociety. org / vol11 / iss1 / art3 / .
Benjamin J. D., and G. S. Sirmans (1996). Mass Transportation, Apartment Rent
and Property Values. Journal of Real Estate Research 12, 1 – 8. Available at:
http: / / ares.metapress.com / content / 3t94up166n288076/.
Bento A. M., M. L. Cropper, A. M. Mobarak, and K. Vinha (2005). The Effects
of Urban Spatial Structure on Travel Demand in the United States. Review of
Economics and Statistics 87, 466 – 478. doi: 10.1162 / 0034653054638292, ISSN:
0034-6535.
Bento A. M., S. F. Franco, and D. Kaffine (2006). The Efficiency and Distributional
Impacts of Alternative Anti-sprawl Policies. Journal of Urban Economics 59,
121 – 141. doi: 10.1016 / j.jue.2005.09.004, ISSN: 00941190.
Bento A. M., S. F. Franco, and D. Kaffine (2011). Is there a double-dividend from
anti-sprawl policies? Journal of Environmental Economics and Management
61, 135 – 152. doi: 10.1016 / j.jeem.2010.09.002, ISSN: 00950696.
Berke E. M., L. M. Gottlieb, A. V. Moudon, and E. B. Larson (2007). Protective
Association Between Neighborhood Walkability and Depression in Older Men.
Journal of the American Geriatrics Society 55, 526 – 533. doi: 10.1111 / j.1532-
5415.2007.01108.x, ISSN: 1532-5415.
Berndes G., M. Hoogwijk, and R. van den Broek (2003). The contribution of
biomass in the future global energy supply: a review of 17 studies. Biomass and
Bioenergy 25, 1 – 28. doi: 10.1016 / S0961-9534(02)00185-X, ISSN: 0961-9534.
Bernick M., and R. Cervero (1996). Transit Villages in the 21st Century. McGraw-
Hill, New York, 387 pp. ISBN: 978-0070054752.
Bernt M. (2009). Partnerships for Demolition: The Governance of Urban Renewal
in East Germany’s Shrinking Cities. International Journal of Urban and Regional
Research 33, 754 – 769. doi: 10.1111 / j.1468-2427.2009.00856.x, ISSN: 1468-
2427.
Berry B. J. L. (1973). The Human Consequences of Urbanisation: Divergent Paths
in the Urban Experience of the Twentieth Century. Macmillan, London, 205 pp.
ISBN: 9780312398651.
Berry B. J. L., and W. L. Garrison (1958). Alternate Explanations of Urban
Rank – Size Relationships. Annals of the Association of American Geographers
48, 83 – 90. doi: 10.1111 / j.1467-8306.1958.tb01559.x, ISSN: 0004-5608.
Berry B. J. L., F. E. Horton, and J. O. Abiodun (1970). Geographic Perspectives on
Urban Systems with Integrated Readings. Prentice-Hall, Englewood Cliffs, N. J.,
564 pp. ISBN: 9780133513127.
Bertaud A., and S. Malpezzi (2003). The Spatial Distribution of Population in 48
World Cities: Implications for Economies in Transition. University of Wisconsin,
Madison, 102 pp. Available at: http: / / alain-bertaud.com / AB_Files / Spatia_%20
Distribution_of_Pop_%2050_%20Cities.pdf.
Betsill M. M. (2001). Mitigating Climate Change in US Cities: Opportunities and
obstacles. Local Environment 6, 393 – 406. doi: 10.1080 / 13549830120091699,
ISSN: 1354-9839.

981981
Human Settlements, Infrastructure, and Spatial Planning
12
Chapter 12
Bettencourt L. M. A., J. Lobo, D. Helbing, C. Kühnert, and G. B. West
(2007). Growth, innovation, scaling, and the pace of life in cities. Pro-
ceedings of the National Academy of Sciences 104, 7301 – 7306. doi:
10.1073 / pnas.0610172104, ISSN: 0027-8424, 1091 – 6490.
Bettencourt L. M. A., J. Lobo, D. Strumsky, and G. B. West (2010). Urban Scaling
and Its Deviations: Revealing the Structure of Wealth, Innovation and Crime
across Cities. PLoS ONE 5, e13541. doi: 10.1371 / journal.pone.0013541.
Bhatia R. (2004). Land use: A key to livable transportation. In: The Square in North
America. International Making Cities Livable Council, London. Available at:
http: / / www. livablecities. org / conferences / 40th-conference-london / program.
Bhatt K. (2011). Congestion Pricing: An Overview of Experience and Impacts. In:
Climate Change and Land Policies. G. K. Ingram, Y.-H. Hong, (eds.), Lincoln Insti-
tute of Land Policy, Cambridge, MA, pp. 247 – 271.
Bird R. M., and E. Slack (2002). Land and property taxation around the world: a
review. Journal of Property Tax Assessment and Administration 7, 31 – 80.
Bird R. M., and E. Slack (2007). Taxing Land and Property in Emerging Econo-
mies: Raising Revenue . . . and More? In: Land Policies and Their Outcomes. G. K.
Ingram, Y.-H. Hong, (eds.), Lincoln Institute of Land Policy, Cambridge, MA, pp.
204 – 233.
Blackman I. Q., and D. H. Picken (2010). Height and Construction Costs of Resi-
dential High-Rise Buildings in Shanghai. Journal of Construction Engineering
and Management 136, 1169 – 1180. ISSN: 0733-9364. doi: 10.1061 / (ASCE)
CO.1943-7862.0000226.
Blanco H., P. L. McCarney, S. Parnell, M. Schmidt, and K. C. Seto (2011). The
Role of Urban Land in Climate Change. In: Climate Change and Cities: First
Assessment Report of the Urban Climate Change Research Network. C. Rosen-
zweig, W. D. Solecki, S. A. Hammer, S. Mehrotra, (eds.), Cambridge University
Press, Cambridge, UK, pp. 217 – 248. ISBN: 9781107004207.
Boarnet M. G., and R. Crane (2001). Travel by Design: The Influence of Urban Form
on Travel. Oxford University Press, New York, NY, 238 pp. ISBN: 9780195352467.
Boarnet M. G., K. S. Nesamani, and C. S. Smith (2003). Comparing the influ-
ence of land use on nonwork trip generation and vehicle distance travelled:
An analysis using travel diary data. In: Paper presented at the 83rd annual
meeting of the Transportation Research Board, Washington, DC. Available at:
https: / / escholarship.org / uc / item / 4xf6r519
Bocquier P. (2005). World Urbanization Prospects: an alternative to the UN model
of projection compatible with the mobility transition theory. Demographic
Research 12, 197 – 236. doi: 10.4054 / DemRes.2005.12.9, ISSN: 1435-9871.
Bongaarts J. (2001). Household Size and Composition in the Developing World in
the 1990s. Population Studies 55, 263 – 279. doi: 10.1080 / 00324720127697,
ISSN: 0032-4728.
Bontje M. (2005). Facing the challenge of shrinking cities in East Germany: The
case of Leipzig. GeoJournal 61, 13 – 21. doi: 10.1007 / s10708-005-0843-2, ISSN:
0343-2521, 1572 – 9893.
Boswell M. R., A. I. Greve, and T. L. Seale (2010). An Assessment of the
Link Between Greenhouse Gas Emissions Inventories and Climate Action
Plans. Journal of the American Planning Association 76, 451 – 462. doi:
10.1080 / 01944363.2010.503313, ISSN: 0194-4363.
Boswell M. R., A. I. Greve, and T. L. Seale (2011). Local Climate Action Planning.
Island Press, Washington, DC. 304pp, ISBN: 9781597269629.
Bourdic L., S. Salat, and C. Nowacki (2012). Assessing cities: a new system of
cross-scale spatial indicators. Building Research & Information 40, 592 – 605.
doi: 10.1080 / 09613218.2012.703488, ISSN: 0961-3218.
Boyko C. T., and R. Cooper (2011). Clarifying and re-conceptualising density.
Progress in Planning 76, 1 – 61. doi: 10.1016 / j.progress.2011.07.001, ISSN:
0305-9006.
Boyle R., and R. Mohamed (2007). State growth management, smart growth
and urban containment: A review of the US and a study of the heartland.
Journal of Environmental Planning and Management 50, 677 – 697. doi:
10.1080 / 09640560701475337, ISSN: 0964-0568, 1360 – 0559.
Brambilla R., and G. Longo (1977). For Pedestrians Only: Planning, Design and
Management of Traffic-Free Zones. Whitney Library of Design, New York, 208
pp.
Bräutigam D. A., and S. Knack (2004). Foreign Aid, Institutions, and Governance in
Sub-Saharan Africa. Economic Development and Cultural Change 52, 255 – 285.
doi: 10.1086 / 380592, ISSN: 0013-0079.
Brown J. H., J. F. Gillooly, A. P. Allen, V. M. Savage, and G. B. West (2004). Toward
a Metabolic Theory of Ecology. Ecology 85, 1771 – 1789. doi: 10.1890 / 03-9000,
ISSN: 0012-9658.
Brown L. A., and J. Holmes (1971). The Delimitation of Functional Regions,
Nodal Regions, and Hierarchies by Functional Distance Approaches. Journal of
Regional Science 11, 57 – 72. doi: 10.1111 / j.1467-9787.1971.tb00240.x, ISSN:
1467-9787.
Brownstone D., and T. F. Golob (2009). The impact of residential density on vehi-
cle usage and energy consumption. Journal of Urban Economics 65, 91 – 98. doi:
10.1016 / j.jue.2008.09.002.
Brownsword R. A., P. D. Fleming, J. C. Powell, and N. Pearsall (2005). Sustain-
able cities — modelling urban energy supply and demand. Applied Energy 82,
167 – 180. doi: 10.1016 / j.apenergy.2004.10.005, ISSN: 03062619.
Brueckner J. K. (2000). Urban Sprawl: Diagnosis and Remedies. International
Regional Science Review 23, 160 – 171. doi: 10.1177 / 016001700761012710,
ISSN: 0160-0176, 1552 – 6925.
Brueckner J. K. (2001a). Urban Sprawl: Lessons from Urban Economics. Brookings-
Wharton Papers on Urban Affairs 2001, 65 – 97. doi: 10.1353 / urb.2001.0003,
ISSN: 1533-4449.
Brueckner J. K. (2001b). Tax increment financing: a theoretical inquiry. Journal of
Public Economics 81, 321 – 343. doi: 10.1016 / S0047-2727(00)00123-7, ISSN:
0047-2727.
Brueckner J. K. (2005). Transport subsidies, system choice, and urban sprawl.
Regional Science and Urban Economics 35, 715 – 733. doi: 10.1016 / j.regsciur-
beco.2005.01.001, ISSN: 0166-0462.
Brueckner J. K., and D. A. Fansler (1983). The Economics of Urban Sprawl: Theory
and Evidence on the Spatial Sizes of Cities. The Review of Economics and Statis-
tics 65, 479 – 482. doi: 10.2307 / 1924193, ISSN: 0034-6535.
Brueckner J. K., and R. W. Helsley (2011). Sprawl and blight. Journal of Urban
Economics 69, 205 – 213. doi: 10.1016 / j.jue.2010.09.003, ISSN: 0094-1190.
Brueckner J. K., and H.-A. Kim (2003). Urban Sprawl and the Property Tax. Inter-
national Tax and Public Finance 10, 5 – 23. Kluwer Academic Publishers, doi:
10.1023 / A:1022260512147, ISSN: 1573-6970.
Brueckner J. K., and K. S. Sridhar (2012). Measuring welfare gains from relax-
ation of land-use restrictions: The case of India’s building-height limits.
Regional Science and Urban Economics 42, 1061 – 1067. doi: 10.1016 / j.regsci-
urbeco.2012.08.003, ISSN: 0166-0462.
Brueckner J. K., J.-F. Thisse, and Y. Zenou (1999). Why is central Paris rich and
downtown Detroit poor?: An amenity-based theory. European Economic
Review 43, 91 – 107. doi: 10.1016 / S0014-2921(98)00019-1, ISSN: 0014-2921.

982982
Human Settlements, Infrastructure, and Spatial Planning
12
Chapter 12
Buisseret D. (Ed.) (1998). Envisioning the City: Six Studies in Urban Cartography.
University of Chicago Press, Chicago, IL, 196 pp. ISBN: 978-0226079936.
Bulkeley H. (2013). Cities and Climate Change. Routledge, New York, NY, 344 pp.
ISBN: 9781135130114.
Bulkeley H., and M. M. Betsill (2005). Cities and Climate Change: Urban Sustain-
ability and Global Environmental Governance. Psychology Press, 250 pp. ISBN:
9780415273794.
Bulkeley H., and K. Kern (2006). Local government and the governing of cli-
mate change in Germany and the UK. Urban Studies 43, 2237 – 2259. doi:
10.1080 / 00420980600936491, ISSN: 00420980.
Bulkeley H., and H. Schroeder (2012). Beyond state / non-state divides: Global
cities and the governing of climate change. European Journal of International
Relations 18, 743 – 766. doi: 10.1177 / 1354066111413308, ISSN: 13540661.
Bunting T., P. Filion, and H. Priston (2002). Density Gradients in Cana-
dian Metropolitan Regions, 1971 – 96: Differential Patterns of Central Area
and Suburban Growth and Change. Urban Studies 39, 2531 – 2552. doi:
10.1080 / 0042098022000027095.
Burchell R., A. Downs, B. McCann, and S. Mukherji (2005). Sprawl Costs: Eco-
nomic Impacts of Unchecked Development. Island Press, Washington, D. C., 209
pp. ISBN: 9781597262507.
Burchfield M., H. G. Overman, D. Puga, and M. A. Turner (2006). Causes
of Sprawl: A Portrait from Space. The Quarterly Journal of Economics 121,
587 – 633. doi: 10.1162 / qjec.2006.121.2.587, ISSN: 0033-5533, 1531 – 4650.
Button K. (2010). Transport Economics. Edward Elgar, Cheltenham, 528 pp. ISBN:
978-1840641912.
C40 Cities (2013). C40 Cities Climate Leadership Group. Available at: http: / / www.
c40cities. org / c40cities.
Callies D. L. (1979). A Hypothetical Case: Value Capture / Joint Development Tech-
niques to Reduce the Public Costs of Public Improvements. Urban Law Annual
16, 155 – 192. Available at: http: / / heinonline.org / HOL / LandingPage?handle=he
in.journals / waucl16&div=5.
Calthorpe P. (2013). Urbanism in the Age of Climate Change. Island Press, Wash-
ington, D. C., 176 pp. ISBN: 9781597267212.
Calthorpe P., and W. Fulton (2001). The Regional City: Planning for the End of
Sprawl. Island Press, Washington, D. C., 298 pp. ISBN: 9781597266215.
Campbell-Lendrum D., and C. Corvalán (2007). Climate Change and Developing-
Country Cities: Implications For Environmental Health and Equity. Journal of
Urban Health: Bulletin of the New York Academy of Medicine 84, 109 – 117. doi:
10.1007 / s11524-007-9170-x, ISSN: 1099-3460.
Carbon Disclosure Project (2013). CDP Cities 2013: Summary Report on
110 Global Cities. Carbon Disclosure Project, London, 35 pp. Available at:
http: / / www. cdpcities2013. net / doc / CDP-Summary-Report.pdf.
Carlino G. A., S. Chatterjee, and R. M. Hunt (2007). Urban density and the
rate of invention. Journal of Urban Economics 61, 389 – 419. doi: 10.1016 / j.
jue.2006.08.003, ISSN: 00941190.
Carney S., N. Green, R. Wood, and R. Read (2009). Greenhouse Gas Emissions
Inventories for 18 European Regions: EU CO
2
80 / 50 Project Stage 1: Inventory
Formation. The Greenhouse Gas Regional Inventory Protocol (GRIP). Centre for
Urban and Regional Ecology, School of Environment and Development, The Uni-
versity of Manchester, Manchester.
Carvalho R., and A. Penn (2004). Scaling and universality in the micro-structure
of urban space. Physica A: Statistical Mechanics and Its Applications 332,
539 – 547. doi: 10.1016 / j.physa.2003.10.024, ISSN: 0378-4371.
Castán Broto V., and H. Bulkeley (2012). A survey of urban climate change exper-
iments in 100 cities. Global Environmental Change 23, 92 – 102. doi: 10.1016 / j.
gloenvcha.2012.07.005, ISSN: 0959-3780.
Cervero R. (1989). Jobs-Housing Balancing and Regional Mobil-
ity. Journal of the American Planning Association 55, 136 – 150. doi:
10.1080 / 01944368908976014, ISSN: 0194-4363.
Cervero R. (1995a). Sustainable new towns: Stockholm’s rail-served satellites. Cit-
ies 12, 41 – 51. doi: 10.1016 / 0264-2751(95)91864-C, ISSN: 0264-2751.
Cervero R. (1995b). Planned Communities, Self-containment and Commut-
ing: A Cross-national Perspective. Urban Studies 32, 1135 – 1161. doi:
10.1080 / 00420989550012618, ISSN: 0042-0980, 1360 – 063X.
Cervero R. (1996). Mixed land-uses and commuting: Evidence from the Ameri-
can Housing Survey. Transportation Research Part A: Policy and Practice 30,
361 – 377. doi: 10.1016 / 0965-8564(95)00033-X, ISSN: 09658564.
Cervero R. (1998). The Transit Metropolis: A Global Inquiry. Island Press, Washing-
ton, D. C., 480 pp. ISBN: 1559635916, 9781559635912.
Cervero R. (2006). Public Transport and Sustainable Urbanism: Global Lessons.
University of California Transportation Center, 1 – 10. http: / / escholarship.
org / uc / item / 4fp6x44f.
Cervero R. (2013). Linking urban transport and land use in developing countries.
Journal of Transport and Land Use 6, 7 – 24. doi: 10.5198 / jtlu.v6i1.425, ISSN:
1938-7849.
Cervero R., and J. Day (2008). Suburbanization and transit-oriented development
in China. Transport Policy 15, 315 – 323. doi: 10.1016 / j.tranpol.2008.12.011,
ISSN: 0967-070X.
Cervero R., and M. Duncan (2006). Which Reduces Vehicle Travel More: Jobs-
Housing Balance or Retail-Housing Mixing? Journal of the American Planning
Association 72, 475 – 490. doi: 10.1080 / 01944360608976767, ISSN: 0194-
4363.
Cervero R., and M. Hansen (2002). Induced travel demand and induced
road investment: a simultaneous equation analysis. Journal of Transport
Economics and Policy 36, 469 – 490. Available at: http: / / www. jstor. org /
stable / 10.2307 / 20053915.
Cervero R., and K. Kockelman (1997). Travel demand and the 3Ds: Density, diver-
sity, and design. Transportation Research Part D: Transport and Environment 2,
199 – 219. doi: 10.1016 / S1361-9209(97)00009-6, ISSN: 1361-9209.
Cervero R., S. Murphy, C. Ferrell, N. Goguts, Y.-H. Tsai, G. B. Arrington, J.
Boroski, J. Smith-Heimer, R. Golem, P. Peninger, E. Nakajima, E. Chui, R.
Dunphy, M. Myers, S. McKay, and N. Witenstein (2004). Transit-Oriented
Development in the United States: Experiences, Challenges, and Prospects.
Transportation Research Board, Washington, D. C., 481 pp. http: / / www.
worldtransitresearch.info / research / 3066/.
Cervero R., O. L. Sarmiento, E. Jacoby, L. F. Gomez, and A. Neiman (2009).
Influences of Built Environments on Walking and Cycling: Lessons from
Bogotá. International Journal of Sustainable Transportation 3, 203 – 226. doi:
10.1080 / 15568310802178314, ISSN: 1556-8318.
Cervero R., and C. Sullivan (2011). Green TODs: marrying transit-oriented devel-
opment and green urbanism. International Journal of Sustainable Development
& World Ecology 18, 210 – 218. doi: 10.1080 / 13504509.2011.570801, ISSN:
1350-4509, 1745 – 2627.
Chandler T. (1987). Four Thousand Years of Urban Growth: An Historical Census. St.
David’s University Press, Lewiston, NY, 656 pp. ISBN: 9780889462076.

983983
Human Settlements, Infrastructure, and Spatial Planning
12
Chapter 12
Chapman J., and L. Frank (2007). Integrating Travel Behavior and Urban Form
Data to Address Transportation and Air Quality Problems in Atlanta. Georgia
Institute of Technology, Atlanta, 302 pp. Available at: http: / / atl.sites.olt.ubc.
ca / files / 2011 / 06 / GDOT_final_report.pdf.
Chavez A., and A. Ramaswami (2011). Progress toward low carbon cities:
approaches for transboundary GHG emissions’ footprinting. Carbon Manage-
ment 2, 471 – 482. doi: 10.4155 / cmt.11.38, ISSN: 1758-3004.
Chavez A., and A. Ramaswami (2013). Articulating a trans-boundary infrastruc-
ture supply chain greenhouse gas emission footprint for cities: Mathematical
relationships and policy relevance. Energy Policy 54, 376 – 384. doi: 10.1016 / j.
enpol.2012.10.037, ISSN: 0301-4215.
Chavez A., A. Ramaswami, D. Nath, R. Guru, and E. Kumar (2012). Imple-
menting Trans-Boundary Infrastructure-Based Greenhouse Gas Accounting for
Delhi, India. Journal of Industrial Ecology 16, 814 – 828. doi: 10.1111 / j.1530-
9290.2012.00546.x, ISSN: 1530-9290.
Chen H., B. Jia, and S. S. Y. Lau (2008). Sustainable urban form for Chinese com-
pact cities: Challenges of a rapid urbanized economy. Habitat International 32,
28 – 40. doi: 10.1016 / j.habitatint.2007.06.005, ISSN: 0197-3975.
Chen N., P. Valente, and H. Zlotnik (1998). What do we know about recent trends
in urbanization? In: Migration, Urbanization, and Development: New Directions
and Issues. R. E. Bilsborrow, (ed.), UNFPA-Kluwer Academic Publishers, Norwell,
MA, pp. 59 – 88.
Cheng V. (2009). Understanding density and high density. In: Designing High-
Density Cities for Social and Environmental Sustainability.. Earthscan, London;
Sterling, VA, pp. 3 – 17. ISBN: 9781844074600.
Cherp A., A. Adenikinju, A. Goldthau, F. Hernandez, L. Hughes, J. Jansen, J. Jew-
ell, M. Olshanskaya, R. Soares de Oliveira, B. Sovacool, and S. Vakulenko
(2012). Energy and Security. In: Global Energy Assessment: Toward a Sustainable
Future. Cambridge University Press, Cambridge, UK and New York, NY, USA and
the International Institute for Applied Systems Analysis, Laxenburg, Austria, pp.
325 – 383. Available at: http: / / www. iiasa. ac. at / web / home / research / Flagship-
Projects / Global-Energy-Assessment / GEA_Chapter5_security_lowres.pdf.
Chertow M. R. (2000). The IPAT Equation and Its Variants. Journal of Industrial
Ecology 4, 13 – 29. doi: 10.1162 / 10881980052541927, ISSN: 1530-9290.
Chong W. H. B., D. Guan, and P. Guthrie (2012). Comparative Analysis of Car-
bonization Drivers in China’s Megacities. Journal of Industrial Ecology 16,
564 – 575. doi: 10.1111 / j.1530-9290.2012.00519.x, ISSN: 10881980.
Choo S., P. L. Mokhtarian, and I. Salomon (2005). Does telecommuting reduce
vehicle-miles traveled? An aggregate time series analysis for the U. S. Trans-
portation 32, 37 – 64. doi: 10.1007 / s11116-004-3046-7, ISSN: 0049-4488,
1572 – 9435.
Chorus P. (2009). Transit Oriented Development in Tokyo: The Public Sector Shapes
Favourable Conditions, the Private Sector Makes it Happen. In: Transit Oriented
Development: Making it Happen. C. Curtis, J. L. Renne, L. Bertolini, (eds.), Ash-
gate, Surrey, England, pp. 225 – 238. ISBN: 9780754673156.
Chowdhury Z., M. Zheng, J. J. Schauer, R. J. Sheesley, L. G. Salmon, G. R. Cass,
and A. G. Russell (2007). Speciation of ambient fine organic carbon particles
and source apportionment of PM
2.5
in Indian cities. Journal of Geophysical
Research 112, 1 – 14. doi: 10.1029 / 2007JD008386, ISSN: 0148-0227.
Zegras P. C. (2007). As if Kyoto mattered: The clean development mecha-
nism and transportation. Energy Policy 35, 5136 – 5150. doi: 10.1016 / j.
enpol.2007.04.032, ISSN: 0301-4215.
Chun M., J. Mei-ting, Z. Xiao-chun, and L. Hong-yuan (2011). Energy consump-
tion and carbon emissions in a coastal city in China. Procedia Environmental
Sciences 4, 1 – 9. doi: 10.1016 / j.proenv.2011.03.001, ISSN: 1878-0296.
Churchill R. R. (2004). Urban Cartography and the Mapping of Chicago. Geograph-
ical Review 94, 1 – 22. doi: 10.1111 / j.1931-0846.2004.tb00155.x, ISSN: 1931-
0846.
Ciccone A., and R. E. Hall (1996). Productivity and the Density of Economic Activ-
ity. American Economic Review 86, 54 – 70. Available at: http: / / ideas.repec.org /
a / aea / aecrev / v86y1996i1p54 – 70.html.
City of Stockholm (2013). A sustainable city. Available at: http: / / international.
stockholm.se / Politics-and-organisation / A-sustainable-city / .
Clark T. A. (2013). Metropolitan density, energy efficiency and carbon emissions:
Multi-attribute tradeoffs and their policy implications. Energy Policy 53,
413 – 428. doi: 10.1016 / j.enpol.2012.11.006, ISSN: 0301-4215.
Cohen C., M. Lenzen, and R. Schaeffer (2005). Energy requirements of house-
holds in Brazil. Energy Policy 33, 555 – 562. doi: 10.1016 / j.enpol.2003.08.021,
ISSN: 0301-4215.
Cole R. J. (1998). Energy and greenhouse gas emissions associated with the con-
struction of alternative structural systems. Building and Environment 34,
335 – 348. doi: 10.1016 / S0360-1323(98)00020-1, ISSN: 0360-1323.
Colette A., C. Granier, Ø. Hodnebrog, H. Jakobs, A. Maurizi, A. Nyiri, S. Rao,
M. Amann, B. Bessagnet, A. D’Angiola, M. Gauss, C. Heyes, Z. Klimont,
F. Meleux, M. Memmesheimer, A. Mieville, L. Rouïl, F. Russo, S. Schucht,
D. Simpson, F. Stordal, F. Tampieri, and M. Vrac (2012). Future air quality
in Europe: a multi-model assessment of projected exposure to ozone. Atmos.
Chem. Phys. 12, 10613 – 10630. doi: 10.5194 / acp-12-10613-2012, ISSN: 1680-
7324.
Covenant of Mayors (2010). How to Develop a Sustainable Energy Action Plan
(SEAP) — Guidebook. Publications Office of the European Union, Luxembourg,
Available at: http: / / www. eumayors. eu / IMG / pdf / seap_guidelines_en.pdf.
Crassous R., J.-C. Hourcade, and O. Sassi (2006). Endogenous Structural Change
and Climate Targets Modeling Experiments with Imaclim-R. The Energy Journal
27, 259 – 276. doi: 10.2307 / 23297067, ISSN: 01956574.
Creutzig F., and D. He (2009). Climate change mitigation and co-benefits of
feasible transport demand policies in Beijing. Transportation Research Part D:
Transport and Environment 14, 120 – 131. doi: 10.1016 / j.trd.2008.11.007, ISSN:
1361-9209.
Curtis C. (2012). Delivering the ’D’ in transit-oriented development: Examining
the town planning challenge. Journal of Transport and Land Use 5, 83 – 99. doi:
10.5198 / jtlu.v5i3.292.
Curtis C., J. L. Renne, and L. Bertolini (Eds.) (2009). Transit Oriented Development:
Making It Happen. Ashgate, Surrey, England, 291 pp. ISBN: 9780754673156.
Cutter W. B., and S. F. Franco (2012). Do parking requirements significantly
increase the area dedicated to parking? A test of the effect of parking require-
ments values in Los Angeles County. Transportation Research Part A: Policy and
Practice 46, 901 – 925. doi: 10.1016 / j.tra.2012.02.012.
Dalton M., B. O’Neill, A. Prskawetz, L. Jiang, and J. Pitkin (2008). Population
aging and future carbon emissions in the United States. Energy Economics 30,
642 – 675. doi: 10.1016 / j.eneco.2006.07.002.
Daniels T. (1998). When City and Country Collide: Managing Growth In The Metro-
politan Fringe. Island Press, 361 pp. ISBN: 9781610913478.
Davis K. (1955). The Origin and Growth of Urbanization in the World. American
Journal of Sociology 60, 429 – 437. doi: 10.2307 / 2772530, ISSN: 0002-9602.

984984
Human Settlements, Infrastructure, and Spatial Planning
12
Chapter 12
Davis S. J., K. Caldeira, and H. D. Matthews (2010). Future CO
2
Emissions and
Climate Change from Existing Energy Infrastructure. Science 329, 1330 – 1333.
doi: 10.1126 / science.1188566, ISSN: 0036-8075, 1095 – 9203.
Davis J. C., and J. V. Henderson (2003). Evidence on the political economy
of the urbanization process. Journal of Urban Economics 53, 98 – 125. doi:
10.1016 / S0094-1190(02)00504-1, ISSN: 0094-1190.
Dawkins C. J., and A. C. Nelson (2002). Urban containment policies and housing
prices: an international comparison with implications for future research. Land
Use Policy 19, 1 – 12. doi: 10.1016 / S0264-8377(01)00038-2.
Day J., and R. Cervero (2010). Effects of Residential Relocation on Household and
Commuting Expenditures in Shanghai, China. International Journal of Urban
and Regional Research 34, 762 – 788. doi: 10.1111 / j.1468-2427.2010.00916.x,
ISSN: 1468-2427.
Debrezion G., E. Pels, and P. Rietveld (2007). The Impact of Railway Stations
on Residential and Commercial Property Value: A Meta-analysis. The Journal of
Real Estate Finance and Economics 35, 161 – 180. doi: 10.1007 / s11146-007-
9032-z, ISSN: 0895-5638, 1573 – 045X.
Decker E. H., S. Elliott, F. A. Smith, D. R. Blake, and F. S. Rowland (2000). Energy
and Material Flow Through the Urban Ecosystem. Annual Review of Energy and
the Environment 25, 685 – 740. doi: 10.1146 / annurev.energy.25.1.685.
Decker E. H., A. J. Kerkhoff, and M. E. Moses (2007). Global Patterns of City
Size Distributions and Their Fundamental Drivers. PLoS ONE 2, e934. doi:
10.1371 / journal.pone.0000934.
DeGrove J. M., and D. A. Miness (1992). The New Frontier for Land Policy: Plan-
ning and Growth Management in the States. Lincoln Institute of Land Policy,
192 pp. ISBN: 9781558441217.
Delgado-Ramos, G. C. (2013). Climate change and metabolic dynamics in Latin
American major cities, in: Zubir, S.S. and Brebbia, C.A. Sustainable City VIII. WIT
Press. Southampton, UK. pp. 39 – 53. ISBN. 978-1-84564-746-9
Deng F. F. (2005). Public land leasing and the changing roles of local govern-
ment in urban China. The Annals of Regional Science 39, 353 – 373. doi:
10.1007 / s00168-005-0241-1, ISSN: 0570-1864, 1432 – 0592.
Deng X., J. Huang, S. Rozelle, and E. Uchida (2008). Growth, population and
industrialization, and urban land expansion of China. Journal of Urban Econom-
ics 63, 96 – 115. doi: 10.1016 / j.jue.2006.12.006, ISSN: 0094-1190.
Department of Energy & Climate Change (2013). Local Authority CO
2
Emission
Estimates 2011. Department of Energy & Climate Change, London, 38 pp.
DeShazo J. R., and J. Matute (2012). The Local Regulation of Climate Change.
In: The Oxford Handbook of Urban Planning. R. Crane, R. Weber, (eds.), Oxford
University Press, New York, pp. 455 – 476. ISBN: 9780195374995.
Dewees D. N. (1976). The effect of a subway on residential property values
in Toronto. Journal of Urban Economics 3, 357 – 369. doi: 10.1016 / 0094-
1190(76)90035-8, ISSN: 00941190.
Dhakal S. (2009). Urban energy use and carbon emissions from cities in China
and policy implications. Energy Policy 37, 4208 – 4219. doi: 10.1016 / j.
enpol.2009.05.020, ISSN: 0301-4215.
Dhakal S. (2010). GHG emissions from urbanization and opportunities for urban
carbon mitigation. Current Opinion in Environmental Sustainability 2, 277 – 283.
doi: 10.1016 / j.cosust.2010.05.007, ISSN: 1877-3435.
Dhakal S., and L. Poruschi (2010). Low Carbon City Initiatives: Experiences and
lessons from Asia. Prepared for Consensus Panel on Low Carbon Cities, Acad-
emy of Sciences of South Africa.
Dierwechter Y., and A. T. Wessells (2013). The Uneven Localisation of Cli-
mate Action in Metropolitan Seattle. Urban Studies 50, 1368 – 1385. doi:
10.1177 / 0042098013480969
Dimitriou H. T. (2011). Transport and city development: Understanding the funda-
mentals. In: Urban Transport in the Developing World: A Handbook of Policy
and Practice. H. T. Dimitriou, R. Gakenheimer, (eds.), Edward Elgar Publishing,
Cheltenham ISBN: 9781849808392.
Doll C. N. H. (2009). Spatial Analysis of the World Bank’s Global Urban Air Pollu-
tion Dataset. International Institute for Applied Systems Analysis, Laxenburg,
Austria.
Doll C. N. H., and S. Pachauri (2010). Estimating rural populations without access
to electricity in developing countries through night-time light satellite imagery.
Energy Policy 38, 5661 – 5670. doi: 10.1016 / j.enpol.2010.05.014, ISSN: 0301-
4215.
Doll C.N., M. Dreyfus, S. Ahmad, O. Balaban (2013). Institutional framework for
urban development with co-benefits: the Indian experience. Journal of Cleaner
Production 58, 121 – 129. doi: 10.1016 / j.jclepro.2013.07.029.
Donglan Z., Z. Dequn, and Z. Peng (2010). Driving forces of residential CO
2
emis-
sions in urban and rural China: An index decomposition analysis. Energy Policy
38, 3377 – 3383. doi: 10.1016 / j.enpol.2010.02.011, ISSN: 03014215.
Dorélien A., D. Balk, and M. Todd (2013). What is Urban? Comparing a satel-
lite view with the demographic and health surveys. Population and Develop-
ment Review 39, 413 – 439. doi: 10.1111 / j.1728-4457.2013.00610.x, ISSN:
00987921.
Douglass M. (2000). Mega-urban Regions and World City Formation: Globalisation,
the Economic Crisis and Urban Policy Issues in Pacific Asia. Urban Studies 37,
2315 – 2335. doi: 10.1080 / 00420980020002823, ISSN: 0042-0980, 1360 – 063X.
Downs A. (2004). Still Stuck in Traffic: Coping with Peak-Hour Traffic Congestion.
Brookings Institution Press, Washington, D. C., 455 pp. ISBN: 9780815796558.
Droege P. (Ed.) (2008). Urban Energy Transition from Fossil Fuels to Renewable
Power. Elsevier, Amsterdam; Boston; London, 664 pp. ISBN: 9780080453415.
Druckman A., and T. Jackson (2008). Household energy consumption in the UK:
A highly geographically and socio-economically disaggregated model. Energy
Policy 36, 3177 – 3192. doi: 10.1016 / j.enpol.2008.03.021, ISSN: 0301-4215.
Du H., and C. Mulley (2006). Relationship Between Transport Accessibility and
Land Value: Local Model Approach with Geographically Weighted Regression.
Transportation Research Record: Journal of the Transportation Research Board
1977, 197 – 205. doi: 10.3141 / 1977-25.
Duany A., E. Plater-Zyberk, and J. Speck (2000). Suburban Nation: The Rise of
Sprawl and the Decline of the American Dream. North Point Press, New York,
NY, 324 pp. ISBN: 9780865476066.
Duarte F., and C. Ultramari (2012). Making Public Transport and Housing Match:
Accomplishments and Failures of Curitba’s BRT. Journal of Urban Planning and
Development 138, 183 – 194. doi: 10.1061 / (ASCE)UP.1943-5444.0000107,
ISSN: 0733-9488, 1943 – 5444.
Duncan D. T., G. Piras, E. C. Dunn, R. M. Johnson, S. J. Melly, and B. E. Molnar
(2013). The built environment and depressive symptoms among urban youth:
A spatial regression study. Spatial and Spatio-Temporal Epidemiology 5, 11 – 25.
doi: 10.1016 / j.sste.2013.03.001, ISSN: 1877-5845.
Dupree H. (1987). Urban Transportation: The New Town Solution. Gower, Alder-
shot, U. K., 292 pp. ISBN: 9780566008399.
Dupuy G. (2011). Towards Sustainable Transport: The Challenge of Car Dependence.
John Libbey Eurotext Limited, Montrouge, France, 66 pp. ISBN: 9782742007936.

985985
Human Settlements, Infrastructure, and Spatial Planning
12
Chapter 12
Duranton G., and D. Puga (2004). Micro-foundations of urban agglomeration
economies. In: Handbook of Regional and Urban Economics. J. V. Henderson, J.-F.
Thisse, (eds.), Elsevier, pp. 2063 – 2117. ISBN: 9780444509673.
Duranton G., and M. A. Turner (2011). The Fundamental Law of Road Congestion:
Evidence from US Cities. American Economic Review 101, 2616 – 2652. doi:
10.1257 / aer.101.6.2616, ISSN: 0002-8282.
Dye R. F., and D. F. Merriman (2000). The Effects of Tax Increment Financing
on Economic Development. Journal of Urban Economics 47, 306 – 328. doi:
10.1006 / juec.1999.2149, ISSN: 0094-1190.
Dye R. F., and J. O. Sundberg (1998). A Model of Tax Increment Financing Adoption
Incentives. Growth and Change 29, 90 – 110. doi: 10.1111 / 1468-2257.00077,
ISSN: 1468-2257.
Edwards M. E. (1984). Site Value Taxation on Australia. American Journal of Eco-
nomics and Sociology 43, 481 – 495. doi: 10.1111 / j.1536-7150.1984.tb01876.x,
ISSN: 0002-9246.
Ekholm T., V. Krey, S. Pachauri, and K. Riahi (2010). Determinants of household
energy consumption in India. Energy Policy 38, 5696 – 5707. doi: 10.1016 / j.
enpol.2010.05.017, ISSN: 03014215.
Elliot J. (1987). The City in Maps: Urban Mapping to 1900. British Library, London,
92 pp. ISBN: 9780712301343.
Elson M. J. (1986). Green Belts: Conflict Mediation in the Urban Fringe. Heinemann,
Portsmouth, NH, 344 pp. ISBN: 9780434905324.
Enoch M., S. Potter, and S. Ison (2005). A Strategic Approach to Financing Public
Transport Through Property Values. Public Money & Management 25, 147 – 154.
doi: 10.1111 / j.1467-9302.2005.00467.x.
Escobedo F., S. Varela, M. Zhao, J. E. Wagner, and W. Zipperer (2010). Ana-
lyzing the efficacy of subtropical urban forests in offsetting carbon emissions
from cities. Environmental Science & Policy 13, 362 – 372. doi: 10.1016 / j.
envsci.2010.03.009, ISSN: 1462-9011.
Ewing R. H. (1997). Transportation & Land Use Innovations: When You Can’t Pave
Your Way out of Congestion. American Planning Association, Chicago, Ill., 106
pp. ISBN: 9781884829123.
Ewing R., and S. J. Brown (2009). U. S. Traffic Calming Manual. American Planning
Association, Chicago, IL, 236 pp. ISBN: 9781932364613.
Ewing R., and R. Cervero (2001). Travel and the Built Environment: A Synthesis.
Transportation Research Record 1780, 87 – 114. doi: 10.3141 / 1780-10, ISSN:
0361-1981.
Ewing R., and R. Cervero (2010). Travel and the Built Environment: A Meta-
analysis. Journal of the American Planning Association 76, 265 – 294. doi:
10.1080 / 01944361003766766.
Ewing R., M. Deanna, and S.-C. Li (1996). Land Use Impacts on Trip Generation
Rates. Transportation Research Record: Journal of the Transportation Research
Board 1518, 1 – 6. doi: 10.3141 / 1518-01.
Ewing R., M. Greenwald, M. Zhang, J. Walters, M. Feldman, R. Cervero, and
J. Thomas (2009). Measuring the Impact of Urban Form and Transit Access on
Mixed Use Site Trip Generation rates — Portland Pilot Study. U. S. Environmental
Protection Agency, Washington, DC.
Ewing R., R. Pendall, and D. Chen (2003). Measuring Sprawl and Its Transpor-
tation Impacts. Transportation Research Record: Journal of the Transportation
Research Board 1831, 175 – 183. doi: 10.3141 / 1831-20.
Fan Y. (2007). The built environment, activity space, and time allocation: An activity-
based framework for modeling the land use and travel connection. University
of North Carolina, Chapel Hill, NC, 189 pp.
Fang H. A. (2008). A discrete-continuous model of households’ vehicle choice and
usage, with an application to the effects of residential density. Transportation
Research Part B: Methodological 42, 736 – 758. ISSN: 0191-2615.
Fargione J., J. Hill, D. Tilman, S. Polasky, and P. Hawthorne (2008). Land Clear-
ing and the Biofuel Carbon Debt. Science 319, 1235 – 1238. doi: 10.1126 / sci-
ence.1152747, ISSN: 0036-8075, 1095 – 9203.
Farvacque C., and P. McAuslan (1992). Reforming Urban Land Policies and Insti-
tutions in Developing Countries. World Bank, Washington, D. C., 105 pp. ISBN:
9786610015894.
Fekade W. (2000). Deficits of formal urban land management and informal
responses under rapid urban growth, an international perspective. Habitat
International 24, 127 – 150. doi: 10.1016 / S0197-3975(99)00034-X, ISSN:
01973975.
Feldman M. P., and D. B. Audretsch (1999). Innovation in cities: Science-based
diversity, specialization and localized competition. European Economic Review
43, 409 – 429. doi: 10.1016 / S0014-2921(98)00047-6, ISSN: 00142921.
Feng K., Y. L. Siu, D. Guan, and K. Hubacek (2012). Analyzing Drivers of Regional
Carbon Dioxide Emissions for China. Journal of Industrial Ecology 16, 600 – 611.
doi: 10.1111 / j.1530-9290.2012.00494.x, ISSN: 1530-9290.
Fensham P., and B. Gleeson (2003). Capturing Value for Urban Management:
A New Agenda for Betterment. Urban Policy and Research 21, 93 – 112. doi:
10.1080 / 0811114032000062164, ISSN: 0811-1146.
Ferrell C., M. Carroll, B. Appleyard, D. Reinke, R. Dowling, H. S. Levinson, E.
Deakin, and R. Cervero (2011). Reinventing the Urban Interstate: A New
Paradigm for Multimodal Corridors. Transportation Research Board, Washing-
ton, D. C., 148 pp. Available at: http: / / onlinepubs.trb.org / onlinepubs / tcrp / tcrp_
rpt_145.pdf.
Fischel W. (1999). Does the American Way of Zoning Cause the Suburbs of Met-
ropolitan Areas to Be Too Spread Out? In: Governance and Opportunity in
Metropolitan America. A. A. Altshuler, W. Morrill, H. Wolman, F. Mitchell, (eds.),
National Academies Press, Washington, D. C., pp. 151 – 191. ISBN: 0-309-51967-
5.
Foletta N., and S. Field (2011). Europe’s Vibrant New Low Car(bon) Communities.
Institute of Transportation and Development Policy, New York, 116 pp. Available
at: http: / / www. gwl-terrein. nl / files / artikelen / low%20carbon%20communities
%20GWL%20only.pdf.
Forsyth A., J. M. Oakes, K. H. Schmitz, and M. Hearst (2007). Does Residen-
tial Density Increase Walking and Other Physical Activity? Urban Studies 44,
679 – 697. doi: 10.1080 / 00420980601184729, ISSN: 0042-0980, 1360 – 063X.
Fouchier V. (1998). Urban Density and Mobility in the Isle-de-France. In: Ministe-
rio de Fomento, Proceedings of the Eight Conference on Urban and Regional
Research. Madrid, España. 285 – 300 pp.
Al-Fouzan S. A. (2012). Using car parking requirements to promote sustainable
transport development in the Kingdom of Saudi Arabia. Cities 29, 201 – 211.
doi: 10.1016 / j.cities.2011.08.009, ISSN: 02642751.
Fragkias M., J. Lobo, D. Strumsky, and K. C. Seto (2013). Does Size Matter? Scal-
ing of CO
2
Emissions and U. S. Urban Areas (M. Convertino, Ed.). PLOS ONE 8,
e64727. doi: 10.1371 / journal.pone.0064727, ISSN: 1932-6203.
Fraker H. (2013). The Hidden Potential of Sustainable Neighborhoods: Lessons
from Low-Carbon Communities. Island Press, Washington, D. C., 248 pp. ISBN:
9781610914093.

986986
Human Settlements, Infrastructure, and Spatial Planning
12
Chapter 12
Frank L. D., M. A. Andresen, and T. L. Schmid (2004). Obesity relationships with
community design, physical activity, and time spent in cars. American Journal
of Preventive Medicine 27, 87 – 96. doi: 10.1016 / j.amepre.2004.04.011, ISSN:
0749-3797.
Frank L. D., and P. Engelke (2005). Multiple Impacts of the Built Environment on
Public Health: Walkable Places and the Exposure to Air Pollution. International
Regional Science Review 28, 193 – 216. doi: 10.1177 / 0160017604273853,
ISSN: 0160-0176, 1552 – 6925.
Frank L. D., and G. Pivo (1994). Impacts of mixed use and density on utiliza-
tion of three modes of travel: single-occupant vehicle, transit, and walking.
Transportation Research Record 1466, 44 – 52. Available at: http: / / www.
reconnectingamerica. org / assets / Uploads / Frank-and-Pivo.pdf.
Frank L. D., J. F. Sallis, B. E. Saelens, L. Leary, K. Cain, T. L. Conway, and P. M.
Hess (2009). The Development of a Walkability Index: Application To the
Neighborhood Quality of Life Study. British Journal of Sports Medicine 44, 924-
33. doi: 10.1136 / bjsm.2009.058701, ISSN: , 14730480.
Franzsen R. C. D., and J. M. Youngman (2009). Mapping Property Taxes in Africa.
Land Lines, pp.8 – 13. Lincoln Institute of Land Policy, Cambridge, MA. Available
at: http: / / www.lincolninst.edu / pubs / 1648_Mapping-Property-Taxes-in-Africa
Frolking S., T. Milliman, K. C. Seto, and M. A. Friedl (2013). A global fingerprint
of macro-scale changes in urban structure from 1999 to 2009. Environmental
Research Letters 8, 024004. doi: 10.1088 / 1748-9326 / 8 / 2 / 024004, ISSN: 1748-
9326.
Fujita M., and J.-F. Thisse (1996). Economics of agglomeration. Journal of the Jap-
anese and International Economies 10, 339 – 378. doi: 10.1006 / jjie.1996.0021,
ISSN: 08891583.
Gakenheimer R. (2011). Land use and transport in rapidly motorizing cities: con-
texts of controversy. In: Urban Transport in the Developing World: A Handbook
of Policy and Practice. H. T. Dimitriou, R. Gakenheimer, (eds.), Edward Elgar Pub-
lishing, Cheltenham, pp. 40 – 68. ISBN: 9781849808392.
Galea S., J. Ahern, S. Rudenstine, Z. Wallace, and D. Vlahov (2005). Urban built
environment and depression: a multilevel analysis. Journal of Epidemiology
and Community Health 59, 822 – 827. doi: 10.1136 / jech.2005.033084, ISSN: ,
1470 – 2738.
Ganson C. (2008). The Transportation Greenhouse Gas Inventory: A First Step
Toward City- Driven Emissions Rationalization. University of California
Transportation Center, Berkeley, CA, 15 pp. Available at: http: / / www. uctc.
net / research / papers / 879.pdf.
GEA (2012). Global Energy Assessment — Toward a Sustainable Future. Cambridge
University Press, Cambridge, UK and New York, NY, USA and the International
Institute for Applied Systems Analysis, Laxenburg, Austria, 1802 pp. ISBN: 9781
10700 5198.
Gehl J. (2010). Cities for People. Island Press, Washington D. C., 288 pp. ISBN:
9781597269841.
Gennaio M.-P., A. M. Hersperger, and M. Bürgi (2009). Containing urban
sprawl — Evaluating effectiveness of urban growth boundaries set by the
Swiss Land Use Plan. Land Use Policy 26, 224 – 232. doi: 10.1016 / j.landuse-
pol.2008.02.010, ISSN: 02648377.
Gill S. E., J. F. Handley, A. R. Ennos, and S. Pauleit (2007). Adapting Cities for
Climate Change: The Role of the Green Infrastructure. Built Environment 33,
115 – 133. doi: 10.2148 / benv.33.1.115.
Glaeser E. (2011). Triumph of the City: How Our Greatest Invention Makes Us
Richer, Smarter, Greener, Healthier and Happier. Penguin, New York, 352 pp.
ISBN: 0143120549.
Glaeser E. L., J. Gyourko, and R. E. Saks (2006). Urban growth and housing sup-
ply. Journal of Economic Geography 6, 71 – 89. doi: 10.1093 / jeg / lbi003, ISSN:
1468-2702, 1468 – 2710.
Glaeser E. L., and M. E. Kahn (2004). Sprawl and Urban Growth. In: Handbook
of Regional and Urban Economics. J. V. Henderson, J. F. Thisse, (eds.), Elsevier,
pp. 2481 – 2527. doi: 10.1016 / S1574-0080(04)80013-0, ISBN: 9780444509673.
Glaeser E. L., and M. E. Kahn (2010). The greenness of cities: Carbon dioxide emis-
sions and urban development. Journal of Urban Economics 67, 404 – 418. doi:
10.1016 / j.jue.2009.11.006, ISSN: 0094-1190.
Glaeser E. L., J. Kolko, and A. Saiz (2001). Consumer city. Journal of Economic
Geography 1, 27 – 50. doi: 10.1093 / jeg / 1.1.27, ISSN: 1468-2702.
Gomi K., K. Shimada, and Y. Matsuoka (2010). A low-carbon scenario creation
method for a local-scale economy and its application in Kyoto city. Energy Pol-
icy 38, 4783 – 4796. doi: 10.1016 / j.enpol.2009.07.026, ISSN: 0301-4215.
Goodwin P. B. (1996). Empirical evidence on induced traffic. Transportation 23,
35 – 54. doi: 10.1007 / BF00166218.
Goodwin P., C. Hass-Klau, and S. Cairns (1998). Evidence on the Effects of
Road Capacity Reductions on Traffic Levels. Traffic Engineering and Control 39,
348 – 354. ISSN: 0041-0683.
Gordon D. L. A. (2001). The Resurrection of Canary Wharf. Planning Theory & Prac-
tice 2, 149 – 168. doi: 10.1080 / 14649350120068777, ISSN: 1464-9357.
Gordon P., H. W. Richardson, and M.-J. Jun (1991). The Commuting Paradox Evi-
dence from the Top Twenty. Journal of the American Planning Association 57,
416 – 420. doi: 10.1080 / 01944369108975516, ISSN: 0194-4363.
Gore C., P. Robinson, and R. Stren (2009). Governance and Climate Change:
Assessing and Learning from Canadian Cities. In: Hoornweg D, ed. In: Cities
and Climate Change: Responding to an Urgent Agenda. World Bank, Marseille.
498 – 523 pp.
Government of NCT of Delhi (2010). State of Environment Report for Delhi,
2010. Department of Environment and Forests, Government of NCT of Delhi,
New Delhi, 126 pp. Available at: http: / / www.indiaenvironmentportal.org.
in / files / SoEDelhi2010.pdf.
Greenwald M. J. (2009). SACSIM modeling-elasticity results: Draft.
Grubler A., X. Bai, T. Buettner, S. Dhakal, D. Fisk, T. Ichinose, J. Keirstead, G.
Sammer, D. Satterthwaite, N. Schulz, N. Shah, J. Steinberger, and H. Weisz
(2012). Urban Energy Systems. In: Global Energy Assessment: Toward a Sus-
tainable Future. Cambridge University Press, Cambridge, UK and New York, NY,
USA and the International Institute for Applied Systems Analysis, Laxenburg,
Austria, pp. 1307 – 1400.
Grubler A., B. O’Neill, K. Riahi, V. Chirkov, A. Goujon, P. Kolp, I. Prommer, S.
Scherbov, and E. Slentoe (2007). Regional, national, and spatially explicit
scenarios of demographic and economic change based on SRES. Techno-
logical Forecasting and Social Change 74, 980 – 1029. doi: 10.1016 / j.tech-
fore.2006.05.023, ISSN: 0040-1625.
Grubler A., and N. Schulz (2013). Urban energy use. In: Energizing Sustainable
Cities: Assessing Urban Energy. A. Grubler, D. Fisk, (eds.), Routledge, Oxford, UK;
New York, USA, pp. 57 – 70. ISBN: 9781849714396.
GTZ (2009). Urban Transport and Climate Change Action Plans. An Overview. Fed-
eral Ministry for Economic Cooperation and Development, Germany, 20 pp.

987987
Human Settlements, Infrastructure, and Spatial Planning
12
Chapter 12
Guan D., K. Hubacek, C. L. Weber, G. P. Peters, and D. M. Reiner (2008). The driv-
ers of Chinese CO
2
emissions from 1980 to 2030. Global Environmental Change
18, 626 – 634. doi: 10.1016 / j.gloenvcha.2008.08.001, ISSN: 0959-3780.
Guan D., G. P. Peters, C. L. Weber, and K. Hubacek (2009). Journey to world top
emitter: An analysis of the driving forces of China’s recent CO
2
emissions surge.
Geophysical Research Letters 36, 1 – 5. doi: 10.1029 / 2008GL036540, ISSN:
1944-8007.
Guhathakurta S., and P. Gober (2007). The Impact of the Phoenix Urban Heat
Island on Residential Water Use. Journal of the American Planning Association
73, 317 – 329. doi: 10.1080 / 01944360708977980, ISSN: 0194-4363.
Güneralp B., and K. C. Seto (2012). Can gains in efficiency offset the resource
demands and CO
2
emissions from constructing and operating the built envi-
ronment? Applied Geography 32, 40 – 50. doi: 10.1016 / j.apgeog.2010.11.011,
ISSN: 01436228.
Guo Z., A. W. Agrawal, and J. Dill (2011). Are Land Use Planning and Congestion
Pricing Mutually Supportive? Journal of the American Planning Association 77,
232 – 250. doi: 10.1080 / 01944363.2011.592129, ISSN: 0194-4363.
Guo J., H. Liu, Y. Jiang, D. He, Q. Wang, F. Meng, and K. He (2013). Neighborhood
form and CO
2
emission: evidence from 23 neighborhoods in Jinan, China. Fron-
tiers of Environmental Science & Engineering 8, 79 – 88. doi: 10.1007 / s11783-
013-0516-1, ISSN: 2095-2201, 2095 – 221X.
Guo Z., and S. Ren (2013). From Minimum to Maximum: Impact of the London
Parking Reform on Residential Parking Supply from 2004 to 2010? Urban Stud-
ies 50, 1183 – 1200. doi: 10.1177 / 0042098012460735.
Gurney K. R., I. Razlivanov, Y. Song, Y. Zhou, B. Benes, and M. Abdul-Massih
(2012). Quantification of Fossil Fuel CO
2
Emissions on the Building / Street Scale
for a Large U. S. City. Environmental Science & Technology 46, 12194 – 12202.
doi: 10.1021 / es3011282, ISSN: 0013-936X.
Gutman P. (2007). Ecosystem services: Foundations for a new rural – urban com-
pact. Ecological Economics 62, 383 – 387. doi: 10.1016 / j.ecolecon.2007.02.027,
ISSN: 0921-8009.
Guy S., and S. Marvin (1996). Transforming urban infrastructure provision — The
emerging logic of demand side management. Policy Studies 17, 137 – 147. doi:
10.1080 / 01442879608423701, ISSN: 0144-2872.
Hack G., E. Birch, P. H. Sedway, and M. Silver (Eds.) (2009). Local Planning:
Contemporary Principles and Practice. International City / County Management
Association, Washington, D. C., 496 pp. ISBN: 9780873261487.
Hagman D. G., and D. J. Misczynski (1978). Windfalls for Wipeouts: Land Value
Capture and Compensation. American Society Planning Association, Chicago,
660 pp. ISBN: 9780918286116.
Hall P. (1993). Forces Shaping Urban Europe. Urban Studies 30, 883 – 898. doi:
10.1080 / 00420989320080831, ISSN: 0042-0980, 1360 – 063X.
Hall P. G. (1996). Cities of Tomorrow: An Intellectual History of Urban Planning and
Design in the Twentieth Century. Blackwell Publishers, Oxford, UK ; Cambridge,
MA, 502 pp. ISBN: 063119942X.
Han H., S.-K. Lai, A. Dang, Z. Tan, and C. Wu (2009). Effectiveness of urban con-
struction boundaries in Beijing: an assessment. Journal of Zhejiang University
SCIENCE A 10, 1285 – 1295. doi: 10.1631 / jzus.A0920317, ISSN: 1673-565X,
1862 – 1775.
Handy S. (1996). Methodologies for exploring the link between urban form and
travel behavior. Transportation Research Part D: Transport and Environment 1,
151 – 165. doi: 10.1016 / S1361-9209(96)00010-7, ISSN: 1361-9209.
Handy S. (2005). Smart Growth and the Transportation-Land Use Connection: What
Does the Research Tell Us? International Regional Science Review 28, 146 – 167.
doi: 10.1177 / 0160017604273626, ISSN: 0160-0176, 1552 – 6925.
Handy S., M. G. Boarnet, R. Ewing, and R. E. Killingsworth (2002). How the
built environment affects physical activity: Views from urban planning.
American Journal of Preventive Medicine 23, 64 – 73. doi: 10.1016 / S0749-
3797(02)00475-0, ISSN: 0749-3797.
Hankey S., and J. D. Marshall (2010). Impacts of urban form on future US pas-
senger-vehicle greenhouse gas emissions. Energy Policy 38, 4880 – 4887. doi:
10.1016 / j.enpol.2009.07.005, ISSN: 0301-4215.
Hansen W. G. (1959). How Accessibility Shapes Land Use. Journal of the Ameri-
can Institute of Planners 25, 73 – 76. doi: 10.1080 / 01944365908978307, ISSN:
0002-8991.
Hansen M., and Y. Huang (1997). Road supply and traffic in California urban
areas. Transportation Research Part A: Policy and Practice 31, 205 – 218. doi:
10.1016 / S0965-8564(96)00019-5.
Hao L., J. Keirstead, N. Samsatli, W. Shah, and W. Long (2011). Application of
a novel, optimisation-based toolkit (“syncity”) for urban energy system design
in Shanghai Lingang New City. Energy Education Science and Technology A:
Energy Science and Research 28, 311 – 318.
Harlan S. L., and D. M. Ruddell (2011). Climate change and health in cities:
impacts of heat and air pollution and potential co-benefits from mitigation and
adaptation. Current Opinion in Environmental Sustainability 3, 126 – 134. doi:
10.1016 / j.cosust.2011.01.001, ISSN: 1877-3435.
Harris J. R., and M. P. Todaro (1970). Migration, Unemployment & Development:
A Two-Sector Analysis. American Economic Review 60, 126 – 42. Available at:
http: / / www.jstor.org / stable / 1807860.
Hartshorne R. (1933). Geographic and Political Boundaries in Upper Sile-
sia. Annals of the Association of American Geographers 23, 195 – 228. doi:
10.1080 / 00045603309357073, ISSN: 0004-5608.
Hass-Klau C. (1993). Impact of pedestrianization and traffic calming on retailing:
A review of the evidence from Germany and the UK. Transport Policy 1, 21 – 31.
doi: 10.1016 / 0967-070X(93)90004-7.
Hausman J. A. (1979). Individual Discount Rates and the Purchase and Utiliza-
tion of Energy-Using Durables. The Bell Journal of Economics 10, 33 – 54. doi:
10.2307 / 3003318, ISSN: 0361-915X.
Heath G. W., R. C. Brownson, J. Kruger, R. Miles, K. E. Powell, and L. T. Ramsey
(2006). The effectiveness of urban design and land use and transport poli-
cies and practices to increase physical activity: a systematic review. Journal
of Physical Activity & Health 3, S55 – S76. Available at: http: / / www.aapca3.
org / resources / archival / 060306 / jpah.pdf
Heijungs R., and S. Suh (2010). The Computational Structure of Life Cycle Assess-
ment. Springer, Dordrecht, NL; Boston, US, 256 pp. ISBN: 9789048160419.
Heinonen J., and S. Junnila (2011a). Implications of urban structure on carbon
consumption in metropolitan areas. Environmental Research Letters 6, 014018.
doi: 10.1088 / 1748-9326 / 6 / 1 / 014018, ISSN: 1748-9326.
Heinonen J., and S. Junnila (2011b). Case study on the carbon consumption of
two metropolitan cities. The International Journal of Life Cycle Assessment 16,
569 – 579. doi: 10.1007 / s11367-011-0289-3, ISSN: 0948-3349.
Heinonen J., and S. Junnila (2011c). A Carbon Consumption Comparison of Rural
and Urban Lifestyles. Sustainability 3, 1234 – 1249. doi: 10.3390 / su3081234,
ISSN: 2071-1050.

988988
Human Settlements, Infrastructure, and Spatial Planning
12
Chapter 12
Heinonen J., R. Kyrö, and S. Junnila (2011). Dense downtown living more car-
bon intense due to higher consumption: a case study of Helsinki. Environmental
Research Letters 6, 034034. doi: 10.1088 / 1748-9326 / 6 / 3 / 034034, ISSN: 1748-
9326.
Henderson V. (2003). The Urbanization Process and Economic Growth:
The So-What Question. Journal of Economic Growth 8, 47 – 71. doi:
10.1023 / A:1022860800744, ISSN: 1381-4338, 1573 – 7020.
Henderson J. V., A. Kuncoro, and M. Turner (1995). Industrial Development in Cit-
ies. Journal of Political Economy 103, 1067 – 1090. doi: 10.1086 / 262013, ISSN:
0022-3808.
Heres-Del-Valle D., and D. Niemeier (2011). CO
2
emissions: Are land-use changes
enough for California to reduce VMT? Specification of a two-part model with
instrumental variables. Transportation Research Part B: Methodological 45,
150 – 161. doi: 10.1016 / j.trb.2010.04.001, ISSN: 0191-2615.
Heynen N., H. A. Perkins, and P. Roy (2006). The Political Ecology of Uneven Urban
Green Space. Urban Affairs Review 42, 3 – 25. doi: 10.1177 / 1078087406290729.
Hidalgo D., and L. Gutiérrez (2013). BRT and BHLS around the world: Explosive
growth, large positive impacts and many issues outstanding. Research in Trans-
portation Economics 39, 8 – 13. doi: 10.1016 / j.retrec.2012.05.018, ISSN: 0739-
8859.
Hidle K., A. A. Farsund, and H. K. Lysgård (2009). Urban – Rural Flows and
the Meaning of Borders Functional and Symbolic Integration in Norwe-
gian City-Regions. European Urban and Regional Studies 16, 409 – 421. doi:
10.1177 / 0969776409340863, ISSN: 0969-7764, 1461 – 7145.
Hillman T., and A. Ramaswami (2010). Greenhouse Gas Emission Footprints and
Energy Use Benchmarks for Eight U. S. Cities. Environmental Science & Technol-
ogy 44, 1902 – 1910. doi: 10.1021 / es9024194, ISSN: 0013-936X.
Hirt S. (2007). The Devil Is in the Definitions: Contrasting American and German
Approaches to Zoning. Journal of the American Planning Association 73,
436 – 450. doi: 10.1080 / 01944360708978524, ISSN: 0194-4363, 1939 – 0130.
Hirt S. (2012). Mixed Use by Default: How the Europeans (Don’t) Zone. Journal
of Planning Literature 27, 375 – 393. doi: 10.1177 / 0885412212451029, ISSN:
0885-4122, 1552 – 6593.
Hoch C., L. C. Dalton, and F. S. So (Eds.) (2000). The Practice of Local Govern-
ment Planning. Published for the ICMA Training Institute by the International
City / County Management Association, Washington, D. C., ISBN: 0873261712
9780873261715.
Hoekman S. K. (2009). Biofuels in the U. S. — Challenges and Opportunities. Renew-
able Energy 34, 14 – 22. doi: 10.1016 / j.renene.2008.04.030, ISSN: 0960-1481.
Hofman P. S. (2007). Transition paths for the electricity system. Three alternative
electricity futures based upon the sociotechnical scenario methodology. In:
Visions on the Development of the Electricity System. Eindhoven.
Holgate C. (2007). Factors and Actors in Climate Change Mitigation: A
Tale of Two South African Cities. Local Environment 12, 471 – 484. doi:
10.1080 / 13549830701656994, ISSN: 1354-9839.
Holtzclaw J., R. Clear, H. Dittmar, D. Goldstein, and P. Haas (2002). Loca-
tion Efficiency: Neighborhood and Socio-Economic Characteristics Deter-
mine Auto Ownership and Use — Studies in Chicago, Los Angeles and
San Francisco. Transportation Planning and Technology 25, 1 – 27. doi:
10.1080 / 03081060290032033, ISSN: 0308-1060, 1029 – 0354.
Hong Y., and B. Needham (2007). Analyzing Land Readjustment: Economics, Law,
and Collective Action. Lincoln Institute of Land Policy, Cambridge, MA, 203 pp.
ISBN: 9781558441644.
Hoornweg D., L. Sugar, and C. L. T. Gómez (2011). Cities and greenhouse gas
emissions: moving forward. Environment and Urbanization 23, 207 – 227. doi:
10.1177 / 0956247810392270, ISSN: 0956-2478, 1746 – 0301.
Hoppenbrouwer E., and E. Louw (2005). Mixed-use development: Theory and
practice in Amsterdam’s Eastern Docklands. European Planning Studies 13,
967 – 983. doi: 10.1080 / 09654310500242048, ISSN: 0965-4313.
Horner M., and A. Murray (2003). A Multi-objective Approach to Improv-
ing Regional Jobs-Housing Balance. Regional Studies 37, 135 – 146. doi:
10.1080 / 0034340022000057514, ISSN: 0034-3404, 1360 – 0591.
Horvath A. (2004). Construction Materials and the Environment. Annual
Review of Environment and Resources 29, 181 – 204. doi: 10.1146 / annurev.
energy.29.062403.102215.
Hou Q., and S.-M. Li (2011). Transport infrastructure development and changing
spatial accessibility in the Greater Pearl River Delta, China, 1990 – 2020. Journal
of Transport Geography 19, 1350 – 1360. doi: 10.1016 / j.jtrangeo.2011.07.003,
ISSN: 09666923.
Hurtt G., L. Chini, S. Frolking, R. Betts, J. Feddema, G. Fischer, J. Fisk, K. Hib-
bard, R. Houghton, A. Janetos, C. Jones, G. Kindermann, T. Kinoshita,
K. Klein Goldewijk, K. Riahi, E. Shevliakova, S. Smith, E. Stehfest, A.
Thomson, P. Thornton, D. van Vuuren, and Y. Wang (2011). Harmonization
of land-use scenarios for the period 1500 – 2100: 600 years of global gridded
annual land-use transitions, wood harvest, and resulting secondary lands. Cli-
matic Change 109, 117 – 161. doi: 10.1007 / s10584-011-0153-2, ISSN: 0165-
0009.
Hymel K. M., K. A. Small, and K. V. Dender (2010). Induced demand and rebound
effects in road transport. Transportation Research Part B: Methodological 44,
1220 – 1241. doi: 10.1016 / j.trb.2010.02.007, ISSN: 01912615.
Ibrahim N., L. Sugar, D. Hoornweg, and C. Kennedy (2012). Greenhouse gas
emissions from cities: comparison of international inventory frameworks. Local
Environment 17, 223 – 241. doi: 10.1080 / 13549839.2012.660909, ISSN: 1354-
9839.
ICLEI (2009). International Local Government GHG Emission Analysis Protocol
(IEAP): Version 1.0. ICLEI — Local Governments for Sustainability, Bonn, Ger-
many, 56 pp. Available at: http: / / carbonn.org / fileadmin / user_upload / carbonn /
Standards / IEAP_October2010_color.pdf.
ICLEI, C40, and WRI (2012). Global Protocol for Community-Scale GHG Emis-
sions. World Resources Institute and World Business Council for Sustainable
Development, Washington, D. C. Conches-Geneva, Switzerland, 14 pp. Avail-
able at: http: / / www. ghgprotocol. org / files / ghgp / GPC_PilotVersion_1.0_
May2012_20120514.pdf.
IEA (2008). World Energy Outlook 2008 Edition. International Energy Agency,
Paris, France, 578 pp. ISBN: 9789264045606. Available at: http: / / www.
worldenergyoutlook.org / media / weowebsite / 2008-1994 / weo2008.pdf.
IEA (2010). Energy Poverty: How to Make Modern Energy Access Universal?
OECD / IEA, Paris, France, 52 pp. Available at: http: / / www.se4all.org / wp-content /
uploads / 2013 / 09 / Special_Excerpt_of_WEO_2010.pdf.
IEA (2012). World Energy Outlook 2012. OECD Publishing, Paris, Available at:
http: / / www. iea. org / publications / freepublications / publication / English.pdf.
IEA (2013). Redrawing the Energy Climate Map. International Energy Agency
(IEA), Paris, France, 132 pp. Available at: http: / / www.worldenergyoutlook.org /
energyclimatemap/.
IIASA (2009). GGI Scenario Database Version 2.0.1. Available at: http: / / www. iiasa.
ac. at / Research / GGI / DB.

989989
Human Settlements, Infrastructure, and Spatial Planning
12
Chapter 12
Inglehart R. (1997). Modernization and Postmodernization: Cultural, Economic,
and Political Change in 43 Societies. Princeton University Press, Princeton, N. J.,
ISBN: 9780691011806.
Ingram D. R. (1971). The concept of accessibility: A search for an operational form.
Regional Studies 5, 101 – 107. doi: 10.1080 / 09595237100185131, ISSN: 0034-
3404, 1360 – 0591.
IPCC (2011). IPCC Special Report on Renewable Energy Sources and Climate
Change Mitigation. Prepared by Working Group III of the Intergovernmen-
tal Panel on Climate Change [O. Edenhofer, R. Pichs-Madruga, Y. Sokona,
K. Seyboth, P. Matschoss, S. Kadner, T. Zwickel, P. Eickemeier, G. Hansen, S.
Schlömer, C. von Stechow (eds.)]. Cambridge University Press, Cambridge,
United Kingdom and New York, NY, USA, 1075 pp.
Istrate E., and C. A. Nadeau (2012). Global MetroMonitor 2012:
Slowdown, Recovery, and Interdependence. Brookings Institu-
tion, Washington, D. C., 52 pp. Available at: http: / / www. brookings.
edu / ~ / media / research / files / reports / 2012 / 11 / 30 %20global%20metro%20
monitor / 30 %20global%20monitor.
Jaccard M., L. Failing, and T. Berry (1997). From equipment to infrastructure:
community energy management and greenhouse gas emission reduction.
Energy Policy 25, 1065 – 1074. doi: 10.1016 / S0301-4215(97)00091-8, ISSN:
0301-4215.
Jaccard M., and N. Rivers (2007). Heterogeneous capital stocks and the optimal
timing for CO
2
abatement. Resource and Energy Economics 29, 1 – 16. doi:
10.1016 / j.reseneeco.2006.03.002, ISSN: 0928-7655.
Jacob D. J., and D. A. Winner (2009). Effect of climate change on air quality. Atmo-
spheric Environment 43, 51 – 63. doi: 10.1016 / j.atmosenv.2008.09.051, ISSN:
1352-2310.
Jewell J., A. Cherp, V. Vinichenko, N. Bauer, T. Kober, D. McCollum, D. van
Vuuren, and B. vander Zwaan (2013). Energy security of China, India, the EU,
and the US under long-term low-carbon scenarios: Results from six IAMs. In:
Climate Change Economics. Paris, France.
Jiang Z., and B. Lin (2012). China’s energy demand and its characteristics in the
industrialization and urbanization process. Energy Policy 49, 608 – 615. doi:
10.1016 / j.enpol.2012.07.002, ISSN: 03014215.
Jiang L., and B. C. O’Neill (2004). The energy transition in rural China. Inter-
national Journal of Global Energy Issues 21, 2 – 26. Available at: http: / /
inderscience.metapress.com / content / 16KPY22M4U3K56VW.
Jiang L., and B. C. O’Neill (2007). Impacts of Demographic Trends on US House-
hold Size and Structure. Population and Development Review 33, 567 – 591.
ISSN: 0098-7921.
Jim C. Y., and W. Y. Chen (2009). Ecosystem services and valuation of urban forests
in China. Cities 26, 187 – 194. doi: 10.1016 / j.cities.2009.03.003, ISSN: 0264-
2751.
Jo H. (2002). Impacts of urban greenspace on offsetting carbon emissions for
middle Korea. Journal of Environmental Management 64, 115 – 126. doi:
10.1006 / jema.2001.0491, ISSN: 03014797.
Johnson G. T., and L. A. Hoel (1985). An Inventory of Value Capture Techniques for
Transportation. University of Virginia, Charlottesville, VA, 39 pp.
Jones D. W. (2004). Urbanization and Energy. In: Encyclopedia of Energy. C. J. Cleve-
land, (ed.), Elsevier, Amsterdam, pp. 329 – 335. ISBN: 9780121764807.
Jones C. M., and D. M. Kammen (2011). Quantifying Carbon Footprint Reduc-
tion Opportunities for U. S. Households and Communities. Environmental Sci-
ence & Technology 45, 4088 – 4095. doi: 10.1021 / es102221h, ISSN: 0013-936X,
1520 – 5851.
Jun M.-J., and C.-H. C. Bae (2000). Estimating the Commuting Costs of Seoul’s
Greenbelt. International Regional Science Review 23, 300 – 315.
Jun M.-J., and J.-W. Hur (2001). Commuting costs of “leap-frog” newtown devel-
opment in Seoul. Cities 18, 151 – 158. doi: 10.1016 / S0264-2751(01)00007-5,
ISSN: 0264-2751.
Junge J. R., and D. Levinson (2012). Financing transportation with land value
taxes: Effects on development intensity. Journal of Transport and Land Use 5,
49 – 63. doi: 10.5198 / jtlu.v5i1.148, ISSN: 1938-7849.
Kahn M. E. (2009). Urban Growth and Climate Change. Annual Review of Resource
Economics 1, 333 – 350. doi: 10.1146 / annurev.resource.050708.144249.
Kang C. D., and R. Cervero (2009). From Elevated Freeway to Urban Greenway:
Land Value Impacts of the CGC Project in Seoul, Korea. Urban Studies 46,
2771 – 2794.
Kawada T. (2011). Noise and Health — Sleep Disturbance in Adults. Journal of
Occupational Health 53, 413 – 416. doi: 10.1539 / joh.11-0071-RA.
Kaya Y. (1990). Impact of Carbon Dioxide Emission Control on GNP Growth: Inter-
pretation of Proposed Scenarios. In: Response Strategies Working Group. Paris.
Keirstead J., and N. Shah (2013). Urban energy systems planning, design and
implementation. In: Energizing Sustainable Cities: Assessing Urban Energy. A.
Grubler, D. Fisk, (eds.), Routledge, pp. 155 – 162. ISBN: 9781849714396.
Kelly E. D. (1993). Planning, Growth, and Public Facilities: A Primer for Local Offi-
cials. American Planning Association, Planning Advisory Service, Chicago, IL, 30
pp.
Kennedy C., and J. Corfee-Morlot (2013). Past performance and future needs for
low carbon climate resilient infrastructure — An investment perspective. Energy
Policy 59, 773 – 783. doi: j.enpol.2013.04.031.
Kennedy C., S. Demoullin, and E. Mohareb (2012). Cities reducing their
greenhouse gas emissions. Energy Policy 49, 774 – 777. doi: 10.1016 / j.
enpol.2012.07.030, ISSN: 0301-4215.
Kennedy C., E. Miller, A. Shalaby, H. Maclean, and J. Coleman (2005). The Four
Pillars of Sustainable Urban Transportation. Transport Reviews 25, 393 – 414.
doi: 10.1080 / 01441640500115835, ISSN: 0144-1647, 1464 – 5327.
Kennedy C., A. Ramaswami, S. Carney, and S. Dhakal (2011). Greenhouse gas
emission baselines for global cities and metropolitan regions. Urban Develop-
ment Series. In: Cities and Climate Change: Responding to an Urgent Agenda.
D. Hoornweg, M. Freire, M. J. Lee, P. Bhada-Tata, B. Yuen, (eds.), The World Bank,
Washington, D. C., USISBN: 978-0-8213-8493-0.
Kennedy C., J. Steinberger, B. Gasson, Y. Hansen, T. Hillman, M. Havránek, D.
Pataki, A. Phdungsilp, A. Ramaswami, and G. V. Mendez (2009). Green-
house Gas Emissions from Global Cities. Environmental Science & Technology
43, 7297 – 7302. doi: 10.1021 / es900213p, ISSN: 0013-936X.
Kennedy C., J. Steinberger, B. Gasson, Y. Hansen, T. Hillman, M. Havránek, D.
Pataki, A. Phdungsilp, A. Ramaswami, and G. V. Mendez (2010). Methodol-
ogy for inventorying greenhouse gas emissions from global cities. Energy Policy
38, 4828 – 4837. doi: 10.1016 / j.enpol.2009.08.050, ISSN: 0301-4215.
Kenworthy J. R., and F. B. Laube (1999). Patterns of automobile dependence in
cities: an international overview of key physical and economic dimensions with
some implications for urban policy. Transportation Research Part A: Policy and
Practice 33, 691 – 723. doi: 10.1016 / S0965-8564(99)00006-3.

990990
Human Settlements, Infrastructure, and Spatial Planning
12
Chapter 12
Kern K., and H. Bulkeley (2009). Cities, Europeanization and multi-level gover-
nance: Governing climate change through transnational municipal networks.
Journal of Common Market Studies 47, 309 – 332. doi: 10.1111 / j.1468-
5965.2009.00806.x, ISSN: 00219886.
Keyfitz N. (1980). Do Cities Grow by Natural Increase or by Migration? Geographi-
cal Analysis 12, 142 – 156. doi: 10.1111 / j.1538-4632.1980.tb00024.x, ISSN:
1538-4632.
Khattak A. J., and D. Rodriguez (2005). Travel behavior in neo-traditional neigh-
borhood developments: A case study in USA. Transportation Research Part A:
Policy and Practice 39, 481 – 500. doi: 10.1016 / j.tra.2005.02.009, ISSN: 0965-
8564.
Kinney P. L., M. G. Gichuru, N. Volavka-Close, N. Ngo, P. K. Ndiba, A. Law, A.
Gachanja, S. M. Gaita, S. N. Chillrud, and E. Sclar (2011). Traffic Impacts
on PM2.5 Air Quality in Nairobi, Kenya. Environmental Science & Policy 14,
369 – 378. doi: 10.1016 / j.envsci.2011.02.005, ISSN: 1462-9011.
Kitamura R., T. Akiyama, T. Yamamoto, and T. Golob (2001). Accessibility in a
Metropolis: Toward a Better Understanding of Land Use and Travel. Transporta-
tion Research Record 1780, 64 – 75. doi: 10.3141 / 1780-08, ISSN: 0361-1981.
Kleiber M. (1961). The Fire of Life: An Introduction to Animal Energetics. Wiley,
New York, NY, 454 pp.
Knudsen B., R. Florida, K. Stolarick, and G. Gates (2008). Density and Creativ-
ity in U. S. Regions. Annals of the Association of American Geographers 98,
461 – 478. doi: 10.1080 / 00045600701851150, ISSN: 0004-5608, 1467 – 8306.
Kockelman K. (1997). Travel Behavior as Function of Accessibility, Land Use Mix-
ing, and Land Use Balance: Evidence from San Francisco Bay Area. Transpor-
tation Research Record: Journal of the Transportation Research Board 1607,
116 – 125. doi: 10.3141 / 1607-16.
Kodransky M., and G. Hermann (2011). Europe’s Parking U-Turn: From Accom-
modation to Regulation. Institute for Transport and Development Policy, New
York, USA, 84 pp. Available at: http: / / www. itdp. org / library / publications /
european-parking-u-turn-from-accommodation-to-regulation.
Koehn P. H. (2008). Underneath Kyoto: emerging subnational government initia-
tives and incipient issue-bundling opportunities in China and the United States.
Global Environmental Politics 8, 53 – 77. doi: 10.1162 / glep.2008.8.1.53.
Kondratieff N. D., and W. F. Stolper (1935). The Long Waves in Economic Life. The
Review of Economics and Statistics 17, 105 – 115. doi: 10.2307 / 1928486, ISSN:
0034-6535.
Koster H. R. A., and J. Rouwendal (2012). The Impact Of Mixed Land Use On Resi-
dential Property Values. Journal of Regional Science 52, 733 – 761. Available at:
http: / / ideas.repec.org / a / bla / jregsc / v52y2012i5p733 – 761.html.
Kostof S. (1992). The City Assembled: The Elements of Urban Form Through History.
Little, Brown, Boston, 320 pp. ISBN: 0821219308 9780821219300.
Kostof S., and R. Tobias (1999). The City Shaped: Urban Patterns and Meanings
Through History. Thames & Hudson, New York, 352 pp. ISBN: 0821220160
9780821220160.
Kousky C., and S. H. Schneider (2003). Global climate policy: will cities lead
the way? Climate Policy 3, 359 – 372. Available at: http: / / search.ebscohost.
com / login.aspx?direct=true&db=egh&AN=17053210&site=ehost-live.
Krause R. M. (2011a). Symbolic or substantive policy? Measuring the extent of
local commitment to climate protection. Environment and Planning C: Govern-
ment and Policy 29, 46 – 62. doi: 10.1068 / c09185, ISSN: 0263774X.
Krause R. M. (2011b). Policy Innovation, Intergovernmental Relations, and the
Adoption of Climate Protection Initiatives by U. S. Cities. Journal of Urban Affairs
33, 45 – 60. doi: 10.1111 / j.1467-9906.2010.00510.x, ISSN: 1467-9906.
Krause R. M. (2011c). An assessment of the greenhouse gas reducing activi-
ties being implemented in US cities. Local Environment 16, 193 – 211. doi:
10.1080 / 13549839.2011.562491, ISSN: 1354-9839.
Krey V., B. C. O’Neill, B. van Ruijven, V. Chaturvedi, V. Daioglou, J. Eom, L. Jiang,
Y. Nagai, S. Pachauri, and X. Ren (2012). Urban and rural energy use and car-
bon dioxide emissions in Asia. Energy Economics 34, S272 – S283. Available at:
http: / / www. scopus. com / inward / record.url?eid=2-s2.0 – 84870553992&partner
ID=40&md5=000fc5bd314e96ec58bf9aceb09d78ec.
Krizek K. J. (2003). Residential Relocation and Changes in Urban Travel: Does
Neighborhood-Scale Urban Form Matter? Journal of the American Planning
Association 69, 265 – 281. doi: 10.1080 / 01944360308978019, ISSN: 0194-
4363, 1939 – 0130.
Kronenberg T. (2009). The impact of demographic change on energy use and
greenhouse gas emissions in Germany. Ecological Economics 68, 2637 – 2645.
doi: 10.1016 / j.ecolecon.2009.04.016, ISSN: 0921-8009.
Krugman P. (1996). Confronting the Mystery of Urban Hierarchy. Journal of the Jap-
anese and International Economies 10, 399 – 418. doi: 10.1006 / jjie.1996.0023,
ISSN: 0889-1583.
Kühn M. (2003). Greenbelt and Green Heart: separating and integrating landscapes
in European city regions. Landscape and Urban Planning 64, 19 – 27. Available
at: http: / / www. sciencedirect. com / science / article / pii / S0169204602001986.
Kumar N. (2004). Changing geographic access to and locational efficiency of
health services in two Indian districts between 1981 and 1996. Social Science &
Medicine 58, 2045 – 2067. doi: 10.1016 / j.socscimed.2003.08.019, ISSN: 0277-
9536.
Kunstler J. H. (1998). Home from Nowhere: Remaking Our Everyday World For the
21st Century. Simon and Schuster, New York, US, 326 pp. ISBN: 0684837374.
Kuzmyak R. (2009a). Estimating the travel benefits of blueprint land use concepts.
Unpublished Manuscript, Southern California Association of Governments, Los
Angeles, CA.
Kuzmyak R. (2009b). Estimates of Point Elasticities. Maricopa Association of Gov-
ernments, Phoenix, AZ.
Kuzmyak J., C. Baber, and D. Savory (2006). Use of Walk Opportunities Index
to Quantify Local Accessibility. Transportation Research Record: Journal of the
Transportation Research Board 1977, 145 – 153. doi: 10.3141 / 1977-19.
Ladd H. (1998). Effects of taxes on economic activity. In: Local government tax and
land use policies in the U. S.: Understanding the links. Edward Elgar, Northamp-
ton, MA, pp. 82 – 101. ISBN: 1-85898-657-5.
Lam S. H., and T. D. Toan (2006). Land Transport Policy and Public Transport in Sin-
gapore. Transportation 33, 171 – 188. doi: 10.1007 / s11116-005-3049-z, ISSN:
0049-4488, 1572 – 9435.
Landis J., R. Cervero, and P. Hall (1991). Transit joint development in the USA:
an inventory and policy assessment. Environment and Planning C: Government
and Policy 9, 431 – 452. doi: 10.1068 / c090431.
de Lara M., A. de Palma, M. Kilani, and S. Piperno (2013). Congestion pricing
and long term urban form: Application to Paris region. Regional Science and
Urban Economics 43, 282 – 295. doi: 10.1016 / j.regsciurbeco.2012.07.007, ISSN:
01660462.

991991
Human Settlements, Infrastructure, and Spatial Planning
12
Chapter 12
Larsen H. N., and E. G. Hertwich (2009). The case for consumption-based account-
ing of greenhouse gas emissions to promote local climate action. Environmen-
tal Science & Policy 12, 791 – 798. doi: 10.1016 / j.envsci.2009.07.010, ISSN:
1462-9011.
Larsen H. N., and E. G. Hertwich (2010a). Identifying important characteristics of
municipal carbon footprints. Ecological Economics 70, 60 – 66. doi: 10.1016 / j.
ecolecon.2010.05.001, ISSN: 0921-8009.
Larsen H. N., and E. G. Hertwich (2010b). Implementing Carbon-Footprint-Based
Calculation Tools in Municipal Greenhouse Gas Inventories. Journal of Industrial
Ecology 14, 965 – 977. doi: 10.1111 / j.1530-9290.2010.00295.x, ISSN: 1530-
9290.
Lee C., and A. V. Moudon (2006). The 3Ds+R: Quantifying land use and urban
form correlates of walking. Transportation Research Part D: Transport and Envi-
ronment 11, 204 – 215. doi: 10.1016 / j.trd.2006.02.003, ISSN: 1361-9209.
Lenzen M., M. Wier, C. Cohen, H. Hayami, S. Pachauri, and R. Schaeffer (2006).
A comparative multivariate analysis of household energy requirements in Aus-
tralia, Brazil, Denmark, India and Japan. Energy 31, 181 – 207. doi: 10.1016 / j.
energy.2005.01.009, ISSN: 0360-5442.
LeRoy S. F., and J. Sonstelie (1983). Paradise lost and regained: Transportation
innovation, income, and residential location. Journal of Urban Economics 13,
67 – 89. doi: 10.1016 / 0094-1190(83)90046-3, ISSN: 0094-1190.
Levin S. A. (1992). The Problem of Pattern and Scale in Ecology: The Robert H.
MacArthur Award Lecture. Ecology 73, 1943 – 1967. doi: 10.2307 / 1941447,
ISSN: 0012-9658.
Levine J. (1998). Rethinking Accessibility and Jobs-Housing Balance.
Journal of the American Planning Association 64, 133 – 149. doi:
10.1080 / 01944369808975972, ISSN: 0194-4363, 1939 – 0130.
Levine J. (2005). Zoned Out: Regulation, Markets, and Choices in Transportation
and Metropolitan Land Use. Resources for the Future, Washington D. C., 223 pp.
ISBN: 9781933115153.
Levine M. D., and N. T. Aden (2008). Global Carbon Emissions in the Coming
Decades: The Case of China. Annual Review of Environment and Resources 33,
19 – 38. doi: 10.1146 / annurev.environ.33.012507.172124.
Levine J., and A. Inam (2004). The Market for Transportation-Land Use Integration:
Do Developers Want Smarter Growth than Regulations Allow? Transportation
31, 409 – 427. doi: 10.1023 / B:PORT.0000037086.33893.9f, ISSN: 0049-4488,
1572 – 9435.
Li L., C. Chen, S. Xie, C. Huang, Z. Cheng, H. Wang, Y. Wang, H. Huang, J. Lu,
and S. Dhakal (2010). Energy demand and carbon emissions under different
development scenarios for Shanghai, China. Energy Policy 38, 4797 – 4807. doi:
10.1016 / j.enpol.2009.08.048, ISSN: 0301-4215.
Li W., and J. Huang (2010). The Conception of Transit Metropolis in Guang-
zhou. Institute of Electrical and Electronics Engineers (IEEE), Singa-
pore. 817 – 820 pp. Available at: http: / / ieeexplore.ieee.org / stamp / stamp.
jsp?tp=&arnumber=5535305.
Lin J., Y. Liu, F. Meng, S. Cui, and L. Xu (2013). Using hybrid method to evalu-
ate carbon footprint of Xiamen City, China. Energy Policy 58, 220 – 227. doi:
10.1016 / j.enpol.2013.03.007, ISSN: 0301-4215.
Lin J.-J., and A.-T. Yang (2009). Structural Analysis of How Urban Form Impacts
Travel Demand: Evidence from Taipei. Urban Studies 46, 1951 – 1967. doi:
10.1177 / 0042098009106017, ISSN: 0042-0980, 1360 – 063X.
Liu L.-C., Y. Fan, G. Wu, and Y.-M. Wei (2007). Using LMDI method to analyze the
change of China’s industrial CO
2
emissions from final fuel use: An empirical
analysis. Energy Policy 35, 5892 – 5900. doi: 10.1016 / j.enpol.2007.07.010, ISSN:
0301-4215.
Liu Z., S. Liang, Y. Geng, B. Xue, F. Xi, Y. Pan, T. Zhang, and T. Fujita (2012).
Features, trajectories and driving forces for energy-related GHG emissions from
Chinese mega cites: The case of Beijing, Tianjin, Shanghai and Chongqing.
Energy 37, 245 – 254. doi: 10.1016 / j.energy.2011.11.040, ISSN: 03605442.
Lotfi S., and M. Koohsari (2011). Neighborhood Walkability in a City within a
Developing Country. Journal of Urban Planning and Development 137,
402 – 408. doi: 10.1061 / (ASCE)UP.1943-5444.0000085, ISSN: 0733-9488.
Lu W., C. Chen, M. Su, B. Chen, Y. Cai, and T. Xing (2013). Urban energy con-
sumption and related carbon emission estimation: a study at the sector scale.
Frontiers of Earth Science 7, 480 – 486. doi: 10.1007 / s11707-013-0363-1, ISSN:
2095-0195, 2095 – 0209.
Lund H., R. W. Willson, and R. Cervero (2006). A Re-Evaluation of Travel Behavior
in California Tods. Journal of Architectural & Planning Research 23, 247 – 263.
ISSN: 07380895.
Lusht K. M. (1992). The Site Value Tax and Residential Development. Lincoln Insi-
tute for Land Policy, Washington, D. C., 22 pp.
Lutsey N., and D. Sperling (2008). America’s bottom-up climate change mitiga-
tion policy. Energy Policy 36, 673 – 685. doi: 10.1016 / j.enpol.2007.10.018, ISSN:
0301-4215.
Lwasa S. (2013). Planning innovation for better urban communities in sub-Saharan
Africa: The education challenge and potential responses. Town and Regional
Planning 60, 38 – 48. ISSN: 1012-280X.
Lynch K. (1981). A Theory of Good City Form. MIT Press, ISBN: 9780262120852.
Ma K.-R., and D. Banister (2006). Extended Excess Commuting: A Measure of
the Jobs-Housing Imbalance in Seoul. Urban Studies 43, 2099 – 2113. doi:
10.1080 / 00420980600945245, ISSN: 0042-0980, 1360 – 063X.
MacKellar F. L., W. Lutz, C. Prinz, and A. Goujon (1995). Population, Households,
and CO
2
Emissions. Population and Development Review 21, 849 – 865. doi:
10.2307 / 2137777, ISSN: 0098-7921.
Macknick J. (2011). Energy and CO
2
emission data uncertainties. Carbon Manage-
ment 2, 189 – 205. doi: 10.4155 / cmt.11.10, ISSN: 1758-3004.
Makido Y., S. Dhakal, and Y. Yamagata (2012). Relationship between urban form
and CO
2
emissions: Evidence from fifty Japanese cities. Urban Climate 2, 55 – 67.
doi: 10.1016 / j.uclim.2012.10.006, ISSN: 22120955.
Manaugh K., and T. Kreider (2013). What is mixed use? Presenting an interac-
tion method for measuring land use mix. Journal of Transport and Land Use 6,
63 – 72. ISSN: 1938-7849.
Mans J., E. Interrante, L. Lem, J. Mueller, and M. Lawrence (2012). Next Gen-
eration of Travel Behavior. Journal of the Transportation Research Board 2323,
90 – 98. doi: 10.3141 / 2323-11, ISSN: 0361-1981.
Marcotullio P. J., J. Albrecht, and A. Sarzynski (2011). The geography of
greenhouse gas emissions from within urban areas of India: a preliminary
assessment. Journal of Resources, Energy and Development 8, 11 – 35. doi:
10.3233 / RED-120079.
Marcotullio P. J., A. Sarzynski, J. Albrecht, and N. Schulz (2012). The geography
of urban greenhouse gas emissions in Asia: A regional analysis. Global Envi-
ronmental Change 22, 944 – 958. doi: 10.1016 / j.gloenvcha.2012.07.002, ISSN:
0959-3780.

992992
Human Settlements, Infrastructure, and Spatial Planning
12
Chapter 12
Marcotullio P. J., A. Sarzynski, J. Albrecht, N. Schulz, and J. Garcia (2013). The
geography of global urban greenhouse gas emissions: an exploratory analysis.
Climatic Change, 121, 621 – 634. doi: 10.1007 / s10584-013-0977-z, ISSN: 0165-
0009, 1573 – 1480.
Markandya A., B. G. Armstrong, S. Hales, A. Chiabai, P. Criqui, S. Mima, C.
Tonne, and P. Wilkinson (2009). Public health benefits of strategies to reduce
greenhouse-gas emissions: low-carbon electricity generation. The Lancet 374,
2006 – 2015. doi: 10.1016 / S0140-6736(09)61715-3, ISSN: 01406736.
Marshall J. D. (2008). Energy-efficient urban form. Environmental Science & Tech-
nology 42, 3133 – 3137.
Martinez-Fernandez C., I. Audirac, S. Fol, and E. Cunningham-Sabot (2012).
Shrinking Cities: Urban Challenges of Globalization. International Jour-
nal of Urban and Regional Research 36, 213 – 225. doi: 10.1111 / j.1468-
2427.2011.01092.x, ISSN: 1468-2427.
Martinot E., A. Chaurey, D. Lew, J. R. Moreira, and N. Wamukonya (2002).
Renewable Energy Markets in Developing Countries. Annual Review
of Energy and the Environment 27, 309 – 348. doi: 10.1146 / annurev.
energy.27.122001.083444.
Mavrogianni A., M. Davies, M. Batty, S. E. Belcher, S. I. Bohnenstengel, D. Car-
ruthers, Z. Chalabi, B. Croxford, C. Demanuele, S. Evans, R. Giridharan,
J. N. Hacker, I. Hamilton, C. Hogg, J. Hunt, M. Kolokotroni, C. Martin, J.
Milner, I. Rajapaksha, I. Ridley, J. P. Steadman, J. Stocker, P. Wilkinson,
and Z. Ye (2011). The comfort, energy and health implications of London’s
urban heat island. Building Services Engineering Research and Technology 32,
35 – 52. doi: 10.1177 / 0143624410394530, ISSN: 0143-6244, 1477 – 0849.
Mayer C. J., and C. T. Somerville (2000). Land use regulation and new con-
struction. Regional Science and Urban Economics 30, 639 – 662. Available at:
http: / / www. sciencedirect. com / science / article / pii / S0166046200000557.
McAndrews C., E. Deakin, and L. Schipper (2010). Climate Change and Urban
Transportation in Latin America. Transportation Research Record: Journal of the
Transportation Research Board 2191, 128 – 135. doi: 10.3141 / 2191-16.
McCann B., and B. Rynne (Eds.) (2010). Complete Streets: Best Policy Implementa-
tion Practices. American Planning Association, Chicago, 141 pp. Available at:
http: / / www. planning. org / pas / brochure / pdf / report.pdf.
McCarney P. L., H. Blanco, J. Carmin, and M. Colley (2011). Cities and Climate
Change: The Challenges for Governance. In: Climate Change and Cities: First
Assessment Report of the Urban Climate Change Research Network. C. Rosen-
zweig, W. D. Solecki, S. A. Hammer, S. Mehrotra, (eds.), Cambridge University
Press, Cambridge, UK, pp. 249 – 269. ISBN: 978-110-700-420-7.
McCarney P. L., and R. E. Stren (2008). Metropolitan Governance: Governing in
a city of cities. In: State of the World’s Cities 2008 / 2009 – Harmonious Cities..
UN-HABITAT, Nairobi, Kenya, pp. 226 – 237. ISBN: 978-92-1-132010-7.
McCormack E., G. Scott Rutherford, and M. Wilkinson (2001). Travel Impacts
of Mixed Land Use Neighborhoods in Seattle, Washington. Transportation
Research Record 1780, 25 – 32. doi: 10.3141 / 1780-04, ISSN: 0361-1981.
McDonald R. I. (2008). Global urbanization: can ecologists identify a sustain-
able way forward? Frontiers in Ecology and the Environment 6, 99 – 104. doi:
10.1890 / 070038, ISSN: 1540-9295.
McDonnell S., J. Madar, and V. Been (2011). Minimum parking requirements and
housing affordability in New York City. Housing Policy Debate 21, 45 – 68. DOI:1
0.1080 / 10511482.2011.534386.
McKinsey Global Institute (2011). Urban World: Mapping the Economic Power of
Cities. McKinsey Global Institute, 62 pp.
Mejía-Dugand S., O. Hjelm, L. Baas, and R. A. Ríos (2013). Lessons from the
spread of Bus Rapid Transit in Latin America. Journal of Cleaner Production 50,
82 – 90. doi: 10.1016 / j.jclepro.2012.11.028, ISSN: 0959-6526.
Melosi M. V. (2000). The Sanitary City: Urban Infrastructure in America from Colo-
nial Times to the Present. Johns Hopkins University Press, Baltimore, 578 pp.
ISBN: 0801861527, 9780801861529.
Mickley L. J., D. J. Jacob, B. D. Field, and D. Rind (2004). Effects of future climate
change on regional air pollution episodes in the United States. Geophysical
Research Letters 31, 1 – 4. doi: 10.1029 / 2004GL021216, ISSN: 1944-8007.
Mieszkowski P., and E. S. Mills (1993). The causes of metropolitan suburban-
ization. The Journal of Economic Perspectives 7, 135 – 147. Available at:
http: / / www. jstor. org / stable / 10.2307 / 2138447.
Millard-Ball A. (2012a). Do city climate plans reduce emissions? Journal of Urban
Economics 71, 289 – 311. doi: 10.1016 / j.jue.2011.12.004, ISSN: 00941190.
Millard-Ball A. (2012b). The Limits to Planning: Causal Impacts of City Climate
Action Plans. Journal of Planning Education and Research 33, 5 – 19. doi:
10.1177 / 0739456X12449742, ISSN: 0739-456X, 1552 – 6577.
Miller D. (1998). Material Cultures: Why Some Things Matter. University of Chi-
cago Press, Chicago, US, 243 pp. Available at: http: / / www. press. uchicago.
edu / ucp / books / book / chicago / M / bo3631823.html.
Milner J., M. Davies, and P. Wilkinson (2012). Urban energy, carbon manage-
ment (low carbon cities) and co-benefits for human health. Current Opinion
in Environmental Sustainability 4, 398 – 404. doi: 10.1016 / j.cosust.2012.09.011,
ISSN: 18773435.
Minx J. C., G. Baiocchi, G. P. Peters, C. L. Weber, D. Guan, and K. Hubacek (2011).
A “Carbonizing Dragon”: China’s Fast Growing CO
2
Emissions Revisited. Envi-
ronmental Science and Technology 45, 9144 – 9153. doi: 10.1021 / es201497m,
ISSN: 0013-936X.
Minx J., G. Baiocchi, T. Wiedmann, J. Barrett, F. Creutzig, K. Feng, M. Förster,
P.-P. Pichler, H. Weisz, and K. Hubacek (2013). Carbon footprints of cities
and other human settlements in the UK. Environmental Research Letters 8,
035039. doi: 10.1088 / 1748-9326 / 8 / 3 / 035039, ISSN: 1748-9326.
Mogridge M. J. H. (1985). Transport, Land Use and Energy Interaction. Urban Stud-
ies 22, 481 – 492.
Molina M. J., and L. T. Molina (2004). Megacities and Atmospheric Pollution. Jour-
nal of the Air & Waste Management Association 54, 644 – 680. doi: 10.1080 / 10
473289.2004.10470936, ISSN: 1096-2247.
Molloy R., and H. Shan (2013). The Effect of Gasoline Prices on House-
hold Location. Review of Economics and Statistics 95, 1212 – 1221. doi:
10.1162 / REST_a_00331, ISSN: 0034-6535.
Montgomery M. R. (2008). The Urban Transformation of the Developing World.
Science 319, 761 – 764. doi: 10.1126 / science.1153012.
Moore T., P. Thorsnes, B. Appleyard, and American Planning Association
(2007). The Transportation / land Use Connection. American Planning Asso-
ciation, Planning Advisory Service, Chicago, 409 pp. ISBN: 9781932364422
1932364420.
Morello-Frosch R., M. Zuk, M. Jerrett, B. Shamasunder, and A. D. Kyle (2011).
Understanding the cumulative impacts of inequalities in environmental
health: implications for policy. Health Affairs (Project Hope) 30, 879 – 887. doi:
10.1377 / hlthaff.2011.0153, ISSN: 1544-5208.
Morris A. E. J. (1994). A History of Urban Form: Before the Industrial Revolu-
tion. Longman Scientific & Technical, Harlow, Essex, UK, 444 pp. ISBN:
9780582301542.

993993
Human Settlements, Infrastructure, and Spatial Planning
12
Chapter 12
Moss T. (2003). Utilities, land-use change, and urban development: brownfield sites
as “cold-spots” of infrastructure networks in Berlin. Environment and Planning
A 35, 511 – 529. doi: 10.1068 / a3548.
Mraihi R., K. ben Abdallah, and M. Abid (2013). Road transport-related energy
consumption: Analysis of driving factors in Tunisia. Energy Policy 62, 247 – 253.
doi: 10.1016 / j.enpol.2013.07.007, ISSN: 03014215.
Muller P. O. (2004). Transportation and Urban Form — Stages in the Spatial Evolu-
tion of the American Metropolis. In: The Geography of Urban Transportation. S.
Hanson, G. Guiliano, (eds.), Guilford Publications, New York, pp. 444. Available
at: http: / / trid.trb.org / view.aspx?id=756060.
Müller D. B., G. Liu, A. N. Løvik, R. Modaresi, S. Pauliuk, F. S. Steinhoff, and
H. Brattebø (2013). Carbon Emissions of Infrastructure Development. Envi-
ronmental Science & Technology 47, 11739-11746. doi: 10.1021 / es402618m,
ISSN: 0013-936X.
Mwampamba T. H. (2007). Has the woodfuel crisis returned? Urban charcoal con-
sumption in Tanzania and its implications to present and future forest avail-
ability. Energy Policy 35, 4221 – 4234. doi: 10.1016 / j.enpol.2007.02.010, ISSN:
0301-4215.
Myors P., R. O’Leary, and R. Helstroom (2005). Multi-Unit Residential Build-
ings Energy and Peak Demand Study. Energy News 23, 113 – 116. Available at:
http: / / www. aie. org. au / Content / NavigationMenu / Publications / Energy_News_
Archive.htm.
Næss P. (2005). Residential location affects travel behavior — but how and why?
The case of Copenhagen metropolitan area. Progress in Planning 63, 167 – 257.
doi: 10.1016 / j.progress.2004.07.004, ISSN: 03059006.
Næss P. (2006). Accessibility, Activity Participation and Location of Activities:
Exploring the Links between Residential Location and Travel Behaviour. Urban
Studies 43, 627 – 652. doi: 10.1080 / 00420980500534677, ISSN: 0042-0980,
1360 – 063X.
Nasar J. L. (2003). Does Neotraditional Development Build Community? Journal of
Planning Education and Research 23, 58 – 68. doi: 10.1177 / 0739456X03256224,
ISSN: 0739456X, 00000000.
National Research Council (2003). Cities Transformed: Demographic Change
and Its Implications in the Developing World (M. R. Montgomery, R. Stren, B.
Cohen, and H. E. Reed, Eds.). National Academies Press, Washington, D. C., 529
pp. ISBN: 9780309088626.
National Research Council (2009a). Driving and the Built Environment: The
Effects of Compact Development on Motorized Travel, Energy Use and CO
2
Emissions. The National Academies Press, Washington, D. C., 257 pp. Available
at: http: / / www. nap. edu / catalog.php?record_id=12747.
National Research Council (2009b). Impacts of Land Use Patterns on Vehicle
Miles Traveled. In: Driving and the Built Environment: The Effects of Compact
Development on Motorized Travel, Energy Use and CO
2
Emissions. The National
Academies Press, Washington, D. C., pp. 50 – 105. ISBN: 9780309142557.
Ndrepepa A., and D. Twardella (2011). Relationship between noise annoyance
from road traffic noise and cardiovascular diseases: A meta-analysis. Noise and
Health 13, 251 – 259. doi: 10.4103 / 1463-1741.80163, ISSN: 1463-1741.
Needham B. (2000). Land taxation, development charges, and the effects
on land-use. Journal of Property Research 17, 241 – 257. Routledge, doi:
10.1080 / 09599910050120000, ISSN: 0959-9916.
Nelson A. C. (1992). Preserving Prime Farmland in the Face of Urbanization: Les-
sons from Oregon. Journal of the American Planning Association 58, 467 – 488.
doi: 10.1080 / 01944369208975830, ISSN: 0194-4363.
Nelson A. C., R. J. Burby, E. Feser, C. J. Dawkins, E. E. Malizia, and R. Quercia
(2004). Urban containment and central-city revitalization. Journal of the Amer-
ican Planning Association 70, 411 – 425. Available at: http: / / www. tandfonline.
com / doi / abs / 10.1080 / 01944360408976391.
Nelson A. C., and J. B. Duncan (1995). Growth Management Principles and Prac-
tices. APA Planners Press, Chicago, 172 pp. ISBN: 9780918286925.
Nelson A. C., and T. Moore (1993). Assessing urban growth management: The case
of Portland, Oregon, the USA’s largest urban growth boundary. Land Use Policy
10, 293 – 302. Available at: http: / / www. sciencedirect. com / science / article /
pii / 026483779390039D.
Nelson E., H. Sander, P. Hawthorne, M. Conte, D. Ennaanay, S. Wolny, S. Man-
son, and S. Polasky (2010). Projecting global land-use change and its effect
on ecosystem service provision and biodiversity with simple models. PLOS ONE
5, doi: 10.1371 / journal.pone.0014327.
Nemet G. F., T. Holloway, and P. Meier (2010). Implications of incorporating air-
quality co-benefits into climate change policymaking. Environmental Research
Letters 5, 014007. doi: 10.1088 / 1748-9326 / 5 / 1 / 014007, ISSN: 1748-9326.
Newman P., and J. Kenworthy (1999). Sustainability and Cities: Overcom-
ing Automobile Dependence. Island Press, Washington, D. C., 468 pp. ISBN:
9781559636605.
Noland R. B. (2001). Relationships between highway capacity and induced vehicle
travel. Transportation Research Part A: Policy and Practice 35, 47 – 72. Available
at: http: / / www. sciencedirect. com / science / article / pii / S0965856499000476.
Noland R. B., and L. L. Lem (2002). A review of the evidence for induced travel
and changes in transportation and environmental policy in the US and the UK.
Transportation Research Part D: Transport and Environment 7, 1 – 26. Available
at: http: / / www. sciencedirect. com / science / article / pii / S1361920901000098.
Norris D. F. (2001). Whither Metropolitan Governance? Urban Affairs Review 36,
532 – 550. doi: 10.1177 / 10780870122184984, ISSN: 1078-0874, 1552 – 8332.
Nowak D. J., and D. E. Crane (2002). Carbon storage and sequestration by urban
trees in the USA. Environmental Pollution 116, 381 – 389. doi: 10.1016 / S0269-
7491(01)00214-7, ISSN: 0269-7491.
Nuissl H., and C. Schroeter-Schlaack (2009). On the economic approach to
the containment of land consumption. Environmental Science & Policy 12,
270 – 280. doi: 10.1016 / j.envsci.2009.01.008, ISSN: 14629011.
O’Neill B. C., M. Dalton, R. Fuchs, L. Jiang, S. Pachauri, and K. Zigova
(2010). Global demographic trends and future carbon emissions. Pro-
ceedings of the National Academy of Sciences 107, 17521 – 17526. doi:
10.1073 / pnas.1004581107, ISSN: 0027-8424, 1091 – 6490.
O’Neill M. S., and K. L. Ebi (2009). Temperature extremes and health: impacts of
climate variability and change in the United States. Journal of Occupational and
Environmental Medicine 51, 13 – 25. doi: 10.1097 / JOM.0b013e318173e122.
O’Neill B. C., X. Ren, L. Jiang, and M. Dalton (2012). The effect of urbanization
on energy use in India and China in the iPETS model. Energy Economics 34,
S339 – S345. Available at: http: / / www. scopus. com / inward / record.url?eid=2-
s2.0 – 84870500779&partnerID=40&md5=2246a009568f1dca91083df6a71f
dfd9.
Oates W. E., and R. M. Schwab (1997). The impact of urban land taxation: the
Pittsburgh experience. National Tax Journal 50, 1 – 21.
Oatley N. (1995). Urban Regeneration. Planning Practice and Research 10,
261 – 270. doi: 10.1080 / 02697459509696277, ISSN: 0269-7459, 1360 – 0583.

994994
Human Settlements, Infrastructure, and Spatial Planning
12
Chapter 12
OECD (2006a). OECD Territorial Reviews: Competitive Cities in the Global Econ-
omy. Organisation for Economic Co-Operation and Development, Paris, France,
446 pp. Available at: http: / / www. oecd. org / gov / regional-policy / oecdterritorial
reviewscompetitivecitiesintheglobaleconomy.htm.
OECD (2006b). Infrastructure to 2030: Telecom, Land Transport, Water and Elec-
tricity (Volume 1). Organisation for Economic Co-Operation and Development
(OECD), France, 355 pp. ISBN: 9264023984.
OECD (2007). Infrastructure to 2030: Mapping Policy for Electricity, Water and
Transport (Volume 2). Organisation for Economic Co-Operation and Develop-
ment (OECD), France, 505 pp.
OECD (2010a). Eco-Innovation in Industry: Enabling Green Growth. Organisa-
tion for Economic Co-operation and Development, Paris, 276 pp. Available at:
http: / / www. oecd. org / sti / ind / eco-innovationinindustryenablinggreengrowth.
htm.
OECD (2010b). Cities and Climate Change. Organisation for Economic Co-opera-
tion and Development Publishing, Paris, France, 276 pp. ISBN: 9789264091375.
OECD (2010c). OECD Territorial Reviews: Guangdong, China 2010. Organisa-
tion for Economic Co-operation and Development Publishing, 311 pp. ISBN:
9789264090088.
OECD (2010d). Financial Instruments and Funding New Expenditure Needs. In: Cit-
ies and Climate Change. Organisation for Economic Co-operation and Develop-
ment, pp. 227 – 249. Available at: http: / / www. oecd-ilibrary. org / content / chapter /
9789264091375 – 14-en.
Orfield M. (2002). American Metropolitics: The New Suburban Reality. Brookings
Institution Press, Washington, D. C., 333 pp. ISBN: 0815705441.
Owen N., E. Cerin, E. Leslie, L. duToit, N. Coffee, L. D. Frank, A. E. Bauman, G.
Hugo, B. E. Saelens, and J. F. Sallis (2007). Neighborhood Walkability and the
Walking Behavior of Australian Adults. American Journal of Preventive Medi-
cine 33, 387 – 395. doi: 10.1016 / j.amepre.2007.07.025, ISSN: 0749-3797.
Pachauri S., A. Brew-Hammond, D. F. Barnes, D. H. Bouille, S. Gitonga, V. Modi,
G. Prasad, A. Rath, and H. Zerriffi (2012). Chapter 19 — Energy Access for
Development. In: Global Energy Assessment — Toward a Sustainable Future.
Cambridge University Press, Cambridge, UK and New York, NY, USA and the
International Institute for Applied Systems Analysis, Laxenburg, Austria, pp.
1401 – 1458. ISBN: 9781 10700 5198 hardback 9780 52118 2935 paperback.
Pachauri S., and L. Jiang (2008). The household energy transition in India and
China. Energy Policy 36, 4022 – 4035. doi: 10.1016 / j.enpol.2008.06.016, ISSN:
0301-4215.
Paloheimo E., and O. Salmi (2013). Evaluating the carbon emissions of the
low carbon city: A novel approach for consumer based allocation. Cities 30,
233 – 239. doi: 10.1016 / j.cities.2012.04.003, ISSN: 0264-2751.
Parikh J., and V. Shukla (1995). Urbanization, energy use and greenhouse effects
in economic development: Results from a cross-national study of develop-
ing countries. Global Environmental Change 5, 87 – 103. doi: 10.1016 / 0959-
3780(95)00015-G, ISSN: 0959-3780.
Parolek D. G., K. Parolek, and P. C. Crawford (2008). Form-Based Codes. A Guide
for Planners, Urban Designers, Municipalities, and Developers. John Wiley &
Sons, Hoboken, NJ, 332 pp.
Parshall L., K. Gurney, S. A. Hammer, D. Mendoza, Y. Zhou, and S. Geethaku-
mar (2010). Modeling energy consumption and CO
2
emissions at the urban
scale: Methodological challenges and insights from the United States. Energy
Policy 38, 4765 – 4782. doi: 10.1016 / j.enpol.2009.07.006, ISSN: 0301-4215.
Pataki D. E., P. C. Emmi, C. B. Forster, J. I. Mills, E. R. Pardyjak, T. R. Peterson,
J. D. Thompson, and E. Dudley-Murphy (2009). An integrated approach to
improving fossil fuel emissions scenarios with urban ecosystem studies. Ecolog-
ical Complexity 6, 1 – 14. doi: 10.1016 / j.ecocom.2008.09.003, ISSN: 1476-945X.
Pendall R. (1999). Do land-use controls cause sprawl? Environment & Plan-
ning B: Planning & Design 26, 555 – 571. Available at: http: / / www. envplan.
com / abstract.cgi?id=b260555.
Pendall R., J. Martin, and W. Fulton (2002). Holding the Line: Urban
Containment in the United States. Brookings Institution Center on
Urban and Metropolitan Policy. Available at: http: / / www. brookings.
edu / ~ / media / research / files / reports / 2002 / 8 / metropolitanpolicy%20pendall /
pendallfultoncontainment.
Pendall R., B. Theodos, and K. Franks (2012). The Built Environment and
Household Vulnerability in a Regional Context. Urban Institute, Washington,
D. C., 10 pp. Available at: http: / / www. urban. org / UploadedPDF / 412609-The-
Built-Environment-and-Household-Vulnerability-in-a-Regional-Context.
pdf?RSSFeed=UI_CitiesandNeighborhoods.xml.
Perkins A., S. Hamnett, S. Pullen, R. Zito, and D. Trebilcock (2009). Transport,
Housing and Urban Form: The Life Cycle Energy Consumption and Emissions of
City Centre Apartments Compared with Suburban Dwellings. Urban Policy and
Research 27, 377 – 396. doi: 10.1080 / 08111140903308859, ISSN: 0811-1146.
Permana A. S., R. Perera, and S. Kumar (2008). Understanding energy consump-
tion pattern of households in different urban development forms: A compara-
tive study in Bandung City, Indonesia. Energy Policy 36, 4287 – 4297.
Peters G. P., C. L. Weber, D. Guan, and K. Hubacek (2007). China’s Growing CO
2
Emissions — A Race between Increasing Consumption and Efficiency Gains.
Environmental Science & Technology 41, 5939 – 5944. doi: 10.1021 / es070108f,
ISSN: 0013-936X.
Peterson G. E. (2009). Unlocking Land Values to Finance Urban Infrastructure.
World Bank, Washington, D. C., 128 pp. ISBN: 9780821377093.
Petsch S., S. Guhathakurta, L. Heischbourg, K. Müller, and H. Hagen
(2011). Modeling, Monitoring, and Visualizing Carbon Footprints at the
Urban Neighborhood Scale. Journal of Urban Technology 18, 81 – 96. doi:
10.1080 / 10630732.2011.648436, ISSN: 1063-0732.
Peyroux E. (2012). Legitimating Business Improvement Districts in Johannesburg:
a discursive perspective on urban regeneration and policy transfer. European
Urban and Regional Studies 19, 181 – 194. doi: 10.1177 / 0969776411420034,
ISSN: 0969-7764, 1461 – 7145.
Picken D. H., and B. D. Ilozor (2003). Height and construction costs of buildings in
Hong Kong. Construction Management and Economics 21, 107 – 111.
Pickrell D., and P. Schimek (1999). Growth in motor vehicle ownership and use:
evidence from the nationwide personal transportation survey. Journal of Trans-
portation and Statistics 2, 1 – 18. ISSN: 1094-8848.
Pirie G. (2011). Sustainable Urban Mobility in “Anglophone” Sub-Saharan Africa.
UN-Habitat, Nairobi, 53 pp. Available at: http: / / www. unhabitat. org / downloads /
docs / GRHS.2013.Regional.Anglophone.Africa.pdf.
Pitt D. (2010). The impact of internal and external characteristics on the adoption
of climate mitigation policies by US municipalities. Environment and Planning
C-Government and Policy 28, 851 – 871. doi: 10.1068 / c09175, ISSN: 0263-774X.
Plassmann F., and T. N. Tideman (2000). A Markov Chain Monte Carlo Analysis of
the Effect of Two-Rate Property Taxes on Construction. Journal of Urban Eco-
nomics 47, 216 – 247. doi: 10.1006 / juec.1999.2140, ISSN: 00941190.

995995
Human Settlements, Infrastructure, and Spatial Planning
12
Chapter 12
Pogodzinski J. M., and T. R. Sass (1994). The Theory and Estimation of Endoge-
nous Zoning. Regional Science and Urban Economics 24, 601 – 630. Available
at: http: / / www. elsevier. com / wps / find / journaldescription.cws_home / 505570 / d
escription#description http: / / search.ebscohost.com / login.aspx?direct=true&db
=ecn&AN=0346226&site=ehost-live.
Porter D. R. (1997). Managing Growth in America’s Communities. Island Press,
Washington, D. C., 311 pp. ISBN: 9781559634427.
Potter S. (1984). Transport and New Towns: The Transport Assumptions Underlying
the Design of Britain’s New Towns, 1946 – 1976. Open University, New Towns
Study Unit, 9 pp.
Puga D. (2010). The magnitude and causes of agglomeration economies. Journal of
Regional Science 50, 203 – 219. doi: 10.1111 / j.1467-9787.2009.00657.x, ISSN:
00224146, 14679787.
Puppim de Oliveira J. A. (2009). The implementation of climate change related
policies at the subnational level: An analysis of three countries. Habitat Inter-
national 33, 253 – 259. doi: 10.1016 / j.habitatint.2008.10.006, ISSN: 0197-3975.
Puppim de Oliveira J. A., C. N. H. Doll, T. A. Kurniawan, Y. Geng, M. Kapshe,
and D. Huisingh (2013). Promoting win – win situations in climate change
mitigation, local environmental quality and development in Asian cities
through co-benefits. Journal of Cleaner Production 58, 1 – 6. doi: 10.1016 / j.
jclepro.2013.08.011, ISSN: 0959-6526.
Pushkar A. O., B. J. Hollingworth, and E. J. Miller (2000). A multivariate regression
model for estimating greenhouse gas emissions from alternative neighborhood
designs. In: 79th annual meeting of the Transportation Research Board, Washing-
ton, DC. Available at: http: / / www. civ. utoronto. ca / sect / traeng / ilute / downloads /
conference_papers / pushkar-etal_trb-00.pdf.
PwC and Partnership for New York City (2012). Cities of Opportunity 2012.
PriceWaterhouseCoopers LLP, Delaware, USA, 96 pp. Available at: http: / / www.
pwc. es / es_ES / es / publicaciones / sector-publico / assets / cities-of-opportunity-
2012.pdf.
Quigley J. M., and S. Raphael (2005). Regulation and the High Cost of Housing
in California. The American Economic Review 95, 323 – 328. ISSN: 0002-8282.
Raciti S. M., L. R. Hutyra, P. Rao, and A. C. Finzi (2012). Inconsistent definitions of
“urban” result in different conclusions about the size of urban carbon and nitro-
gen stocks. Ecological Applications 22, 1015 – 1035. doi: 10.1890 / 11-1250.1,
ISSN: 1051-0761.
Ramaswami A. (2013). Understanding Infrastructure Impacts on Urban Green-
house Gas Emissions and Key Mitigation Strategies. In: Infrastructure and Land
Polices. Lincoln Institute of Land Policy, Cambridge, MA, pp. 296 – 317. ISBN:
9781558442511.
Ramaswami A., M. Bernard, A. Chavez, T. Hillman, M. Whitaker, G. Thomas,
and M. Marshall (2012a). Quantifying Carbon Mitigation Wedges in U. S. Cit-
ies: Near-Term Strategy Analysis and Critical Review. Environmental Science &
Technology 46, 3629 – 3642. doi: 10.1021 / es203503a, ISSN: 0013-936X.
Ramaswami A., A. Chavez, and M. Chertow (2012b). Carbon Footprinting of Cit-
ies and Implications for Analysis of Urban Material and Energy Flows. Journal of
Industrial Ecology 16, 783 – 785. doi: 10.1111 / j.1530-9290.2012.00569.x, ISSN:
1530-9290.
Ramaswami A., A. Chavez, J. Ewing-Thiel, and K. E. Reeve (2011). Two
approaches to greenhouse gas emissions foot-printing at the city scale. Envi-
ronmental Science & Technology 45, 4205 – 4206. doi: 10.1021 / es201166n,
ISSN: 1520-5851.
Ramaswami A., T. Hillman, B. Janson, M. Reiner, and G. Thomas (2008). A
Demand-Centered, Hybrid Life-Cycle Methodology for City-Scale Greenhouse
Gas Inventories. Environmental Science & Technology 42, 6455 – 6461. doi:
10.1021 / es702992q, ISSN: 0013-936X.
Rao S., S. Pachauri, F. Dentener, P. Kinney, Z. Klimont, K. Riahi, and W. Scho-
epp (2013). Better air for better health: Forging synergies in policies for energy
access, climate change and air pollution. Global Environmental Change 23,
1122 – 1130. doi: 10.1016 / j.gloenvcha.2013.05.003, ISSN: 0959-3780.
Rashed T., J. R. Weeks, D. Roberts, J. Rogan, and R. Powell (2003). Measur-
ing the physical composition of urban morphology using multiple endmember
spectral mixture models. Photogrammetric Engineering and Remote Sensing
69, 1011 – 1020. ISSN: 0099-1112.
Ratti C., N. Baker, and K. Steemers (2005). Energy consumption and urban tex-
ture. Energy and Buildings 37, 762 – 776.
Raupach M. R., P. J. Rayner, and M. Paget (2010). Regional variations in spa-
tial structure of nightlights, population density and fossil-fuel CO
2
emissions.
Energy Policy 38, 4756 – 4764. doi: 10.1016 / j.enpol.2009.08.021, ISSN: 0301-
4215.
Reilly M. K., M. P. O’Mara, and K. C. Seto (2009). From Bangalore to the Bay
Area: Comparing transportation and activity accessibility as drivers of urban
growth. Landscape and Urban Planning 92, 24 – 33. doi: 10.1016 / j.landurb-
plan.2009.02.001, ISSN: 01692046.
Renforth P., D. A. C. Manning, and E. Lopez-Capel (2009). Carbonate precipita-
tion in artificial soils as a sink for atmospheric carbon dioxide. Applied Geo-
chemistry 24, 1757 – 1764. doi: 10.1016 / j.apgeochem.2009.05.005, ISSN: 0883-
2927.
Richardson G. R. A., and J. Otero (2012). Land Use Planning Tools for Local
Adaptation to Climate Change. Government of Canada, Ottawa, 23 pp. Avail-
able at: http: / / publications.gc.ca / collections / collection_2013 / rncan-nrcan /
M4 – 106 – 2012-eng.pdf.
Rickwood P., G. Glazebrook, and G. Searle (2008). Urban Structure
and Energy — A Review. Urban Policy and Research 26, 57 – 81. doi:
10.1080 / 08111140701629886.
Roakes S. L. (1996). Reconsidering land value taxation. Land Use Policy 13,
261 – 272. doi: 10.1016 / 0264-8377(96)84556-X, ISSN: 02648377.
Rodier C. J. (2009). A Review of the International Modeling Literature: Transit,
Land Use, and Auto Pricing Strategies to Reduce Vehicle Miles Traveled and
Greenhouse Gas Emissions. Institute of Transportation Studies, University of
California, Davis, Davis, California, 32 pp. Available at: http: / / www. its. ucdavis.
edu / wp-content / themes / ucdavis / pubs / download_pdf.php?id=1350.
Rodrik D., A. Subramanian, and F. Trebbi (2004). Institutions Rule: The Primacy
of Institutions Over Geography and Integration in Economic Development. Jour-
nal of Economic Growth 9, 131 – 165. doi: 10.1023 / B:JOEG.0000031425.72248.
85, ISSN: 1381-4338, 1573 – 7020.
Rogers R. G. (1999). Towards an Urban Renaissance. Spon Press, London, 328 pp.
ISBN: 185112165X.
Rolon A. (2008). Evaluation of Value Capture Mechanisms from Linkage Capture
to Special Assessment Districts. Transportation Research Record: Journal of the
Transportation Research Board 2079, 127 – 135. doi: 10.3141 / 2079-16.
Romanos M. C. (1978). Energy-price effects on metropolitan spatial structure and
form. Environment & Planning A 10, 93 – 104. Available at: http: / / envplan.
com / abstract.cgi?id=a100093.

996996
Human Settlements, Infrastructure, and Spatial Planning
12
Chapter 12
Romero Lankao P. (2007). How do Local Governments in Mexico City
Manage Global Warming? Local Environment 12, 519 – 535. doi:
10.1080 / 13549830701656887, ISSN: 1354-9839.
Rosenfeld A. H., H. Akbari, J. J. Romm, and M. Pomerantz (1998). Cool com-
munities: strategies for heat island mitigation and smog reduction. Energy and
Buildings 28, 51 – 62. doi: 10.1016 / S0378-7788(97)00063-7, ISSN: 0378-7788.
Rosenthal S. S., and W. C. Strange (2004). Evidence on the nature and sources of
agglomeration economies. In: Handbook of Regional and Urban Economics 4,
2119 – 2171 J. V. Henderson, J.-F. Thisse, (eds.), Elsevier, Amsterdam ; New York:
North-Holland ; New York, N. Y., U. S. A. ISBN: 9780444509673.
Rosenzweig C., W. D. Solecki, S. A. Hammer, and S. Mehrotra (2011). Climate
Change and Cities: First Assessment Report of the Urban Climate Change
Research Network. Cambridge University Press, Cambridge, UK, 312 pp.
Ru G., C. Xiaojing, Y. Xinyu, L. Yankuan, J. Dahe, and L. Fengting (2010). The
strategy of energy-related carbon emission reduction in Shanghai. Energy Policy
38, 633 – 638. doi: 10.1016 / j.enpol.2009.06.074, ISSN: 0301-4215.
Rubin J. I., and J. J. Seneca (1991). Density bonuses, exactions, and the supply of
affordable housing. Journal of Urban Economics 30, 208 – 223. ISSN: 00941190.
Rusk D. (1995). Cities without Suburbs. Woodrow Wilson Center Press, Princeton,
NJ, 180 pp. ISBN: 9780943875743.
Rutland T., and A. Aylett (2008). The work of policy: Actor networks, governmen-
tality, and local action on climate change in Portland, Oregon. Environment
and Planning D: Society and Space 26, 627 – 646. doi: 10.1068 / d6907, ISSN:
02637758.
Rydin Y., A. Bleahu, M. Davies, J. D. Dávila, S. Friel, G. De Grandis, N. Groce,
P. C. Hallal, I. Hamilton, P. Howden-Chapman, K.-M. Lai, C. Lim, J. Martins,
D. Osrin, I. Ridley, I. Scott, M. Taylor, P. Wilkinson, and J. Wilson (2012).
Shaping cities for health: complexity and the planning of urban environ-
ments in the 21st century. The Lancet 379, 2079 – 2108. doi: 10.1016 / S0140-
6736(12)60435-8, ISSN: 01406736.
Saelens B. E., J. F. Sallis, and L. D. Frank (2003). Environmental correlates
of walking and cycling: Findings from the transportation, urban design,
and planning literatures. Annals of Behavioral Medicine 25, 80 – 91. doi:
10.1207 / S15324796ABM2502_03, ISSN: 0883-6612, 1532 – 4796.
Sælensminde K. (2004). Cost – benefit analyses of walking and cycling track net-
works taking into account insecurity, health effects and external costs of motor-
ized traffic. Transportation Research Part A: Policy and Practice 38, 593 – 606.
doi: 10.1016 / j.tra.2004.04.003, ISSN: 0965-8564.
Sagalyn L. B. (2007). Public / Private Development : Lessons from History, Research,
and Practice. Journal of the American Planning Association 73, 7 – 22. doi:
10.1080 / 01944360708976133, ISSN: 0194-4363.
Sahakian M. D., and J. K. Steinberger (2011). Energy Reduction Through a Deeper
Understanding of Household Consumption. Journal of Industrial Ecology 15,
31 – 48. doi: 10.1111 / j.1530-9290.2010.00305.x, ISSN: 1530-9290.
Salat S. (2009). Energy loads, CO
2
emissions and building stocks: morphologies,
typologies, energy systems and behaviour. Building Research & Information 37,
598 – 609. doi: 10.1080 / 09613210903162126, ISSN: 0961-3218, 1466 – 4321.
Salat S. (2011). Cities and Forms: On Sustainable Urbanism. Hermann, 544 pp.
ISBN: 2705681116.
Sallis J. F., B. E. Saelens, L. D. Frank, T. L. Conway, D. J. Slymen, K. L. Cain,
J. E. Chapman, and J. Kerr (2009). Neighborhood built environment and
income: Examining multiple health outcomes. Social Science & Medicine 68,
1285 – 1293. doi: 10.1016 / j.socscimed.2009.01.017, ISSN: 0277-9536.
Salomon I., and P. L. Mokhtarian (1998). What happens when mobility-inclined
market segments face accessibility-enhancing policies? Transportation
Research Part D: Transport and Environment 3, 129 – 140. doi: 10.1016 / S1361-
9209(97)00038-2, ISSN: 1361-9209.
Salon D., M. G. Boarnet, S. Handy, S. Spears, and G. Tal (2012). How do local
actions affect VMT? A critical review of the empirical evidence. Transporta-
tion Research Part D: Transport and Environment 17, 495 – 508. doi: 10.1016 / j.
trd.2012.05.006, ISSN: 1361-9209.
Salon D., D. Sperling, A. Meier, S. Murphy, R. Gorham, and J. Barrett (2010).
City carbon budgets: A proposal to align incentives for climate-friendly commu-
nities. Energy Policy 38, 2032 – 2041.
Sammer G. (2013). Transport Systems. In: Energizing Sustainable Cities: Assessing
Urban Energy. A. Grubler, D. Fisk, (eds.), Routledge, Abingdon, Oxon, UK, pp.
135 – 154. ISBN: 9781849714396.
Sandroni P. (2010). A New Financial Instrument of Value Capture in São Paulo. In:
Municipal Revenues and Land Policies. G. K. Ingram, Y.-H. Hong, (eds.), Lincoln
Institute of Land Policy., Cambridge, MA, pp. 218 – 236.
Santero N. J., and A. Horvath (2009). Global warming potential of pave-
ments. Environmental Research Letters 4, 034011. doi: 10.1088 / 1748-
9326 / 4 / 3 / 034011, ISSN: 1748-9326.
Santos E. (2011). Curitiba, Brazil: Pioneering in Developing Bus Rapid Transit and
Urban Planning Solutions. Lap Lambert Academic Publishing, Saarbrücken,
Deutschland, 221 pp. ISBN: 3844332995 9783844332995.
Satterthwaite D. (2007). The Transition to a Predominantly Urban World
and Its Underpinnings. IIED, London, 99 pp. Available at: http: / / pubs.iied.
org / 10550IIED.html?k=Urban-change&s=HSWP&b=d.
Satterthwaite D. (2009). The implications of population growth and urbaniza-
tion for climate change. Environment and Urbanization 21, 545 – 567. doi:
10.1177 / 0956247809344361, ISSN: 0956-2478.
Schäfer A. (2005). Structural change in energy use. Energy Policy 33, 429 – 437. doi:
10.1016 / j.enpol.2003.09.002, ISSN: 0301-4215.
Schimek P. (1996). Household Motor Vehicle Ownership and Use: How Much Does
Residential Density Matter? Transportation Research Record: Journal of the
Transportation Research Board 1552, 120 – 125. doi: 10.3141 / 1552-17.
Schneider K. (2003). The Paris-Lexington Road: Community-Based Planning And
Context Sensitive Highway Design. Island Press, Washington, D. C., 106 pp.
ISBN: 9781597263009.
Schneider A., M. A. Friedl, and D. Potere (2009). A new map of global urban
extent from MODIS satellite data. Environmental Research Letters 4, 044003.
doi: 10.1088 / 1748-9326 / 4 / 4 / 044003, ISSN: 1748-9326.
Schulz N. B. (2010). Delving into the carbon footprints of Singapore — comparing
direct and indirect greenhouse gas emissions of a small and open economic
system. Energy Policy 38, 4848 – 4855. doi: 10.1016 / j.enpol.2009.08.066, ISSN:
0301-4215.
Scott K. I., J. R. Simpson, and E. G. McPherson (1999). Effects of tree cover on
parking lot microclimate and vehicle emissions. Journal of Arboriculture 25,
129 – 142. Available at: http: / / www. fs. fed. us / psw / programs / uesd / uep / prod-
ucts / 11 / psw_cufr68_EffectsTreeCoverOnEmissions.pdf.
Seltzer E., and A. Carbonell (2011). Regional Planning in America: Practice
and Prospect. Lincoln Institute of Land Policy, Cambridge, MA, 288 pp. ISBN:
9781558442153.

997997
Human Settlements, Infrastructure, and Spatial Planning
12
Chapter 12
Seto K. C., M. Fragkias, B. Güneralp, and M. K. Reilly (2011). A Meta-Analysis
of Global Urban Land Expansion. PLOS ONE 6, e23777. doi: 10.1371 / journal.
pone.0023777.
Seto K. C., B. Güneralp, and L. R. Hutyra (2012). Global forecasts of urban
expansion to 2030 and direct impacts on biodiversity and carbon pools. Pro-
ceedings of the National Academy of Sciences 109, 16083 – 16088. doi:
10.1073 / pnas.1211658109, ISSN: 0027-8424, 1091 – 6490.
Seto K. C., R. Sánchez-Rodríguez, and M. Fragkias (2010). The New Geogra-
phy of Contemporary Urbanization and the Environment. Annual Review
of Environment and Resources 35, 167 – 194. doi: 10.1146 / annurev-envi-
ron-100809-125336.
Shove E. (2003). Users, technologies and expectations of comfort, cleanliness and
convenience. Innovation 16, 193 – 206. doi: 10.1080 / 13511610304521, ISSN:
13511610.
Shove E. (2004). Comfort, Cleanliness and Convenience: The Social Organization of
Normality. Berg Publishers, New York, USA, 221 pp. ISBN: 1859736300.
Shrestha R. M., and S. Rajbhandari (2010). Energy and environmental implica-
tions of carbon emission reduction targets: Case of Kathmandu Valley, Nepal.
Energy Policy 38, 4818 – 4827. doi: 10.1016 / j.enpol.2009.11.088, ISSN: 0301-
4215.
Sippel M. (2011). Urban GHG inventories, target setting and mitigation achieve-
ments: how German cities fail to outperform their country. Greenhouse Gas
Measurement and Management 1, 55 – 63. doi: 10.3763 / ghgmm.2010.0001,
ISSN: 2043-0779.
Sivam A. (2002). Constraints affecting the efficiency of the urban residential land
market in developing countries: a case study of India. Habitat International 26,
523 – 537.
Skaburskis A. (2003). Pricing city form: development cost charges and simu-
lated markets. Planning Practice and Research 18, 197 – 211. Routledge, doi:
10.1080 / 0269745032000168250, ISSN: 0269-7459.
Slabbert N. (2005). Telecommunities. Urban Land 64, pp.86 – 92. Available at:
http: / / www. virtualadjacency. com / wp-content / uploads / 2008 / 01 / 9-uli-tele-
communities-may2005.pdf.
Smith K. R., K. Balakrishnan, C. Butler, Z. Chafe, I. Fairlie, P. Kinney, T. Kjell-
strom, D. L. Mauzerall, T. McKone, A. McMichael, M. Schneider, and
P. Wilkinson (2012). Energy and Health. In: Global Energy Assessment:
Toward a Sustainable Future. Cambridge University Press; International
Institute for Applied Systems Analysis, Cambridge, UK and New York, NY,
USA; Laxenburg, Austria, pp. 255 – 324. Available at: http: / / www. iiasa.
ac. at / web / home / research / Flagship-Projects / Global-Energy-Assessment / GEA_
Chapter4_health_lowres.pdf.
Smith J. J., and T. A. Gihring (2006). Financing Transit Systems Through Value Cap-
ture: An Annotated Bibliography. The American Journal of Economics and Soci-
ology 65, 751 – 786.
Smith C., and G. Levermore (2008). Designing urban spaces and buildings to
improve sustainability and quality of life in a warmer world. Energy Policy 36,
4558 – 4562. doi: 10.1016 / j.enpol.2008.09.011, ISSN: 0301-4215.
Song Y., and Y. Zenou (2006). Property tax and urban sprawl: Theory and implica-
tions for US cities. Journal of Urban Economics 60, 519 – 534. doi: 10.1016 / j.
jue.2006.05.001, ISSN: 00941190.
Sovacool B. K., and M. A. Brown (2010). Twelve metropolitan carbon footprints: A
preliminary comparative global assessment. Energy Policy 38, 4856 – 4869. doi:
10.1016 / j.enpol.2009.10.001, ISSN: 0301-4215.
Speir C., and K. Stephenson (2002). Does Sprawl Cost Us All? Isolating the
Effects of Housing Patterns on Public Water and Sewer Costs. Journal of the
American Planning Association 68, 56 – 70. doi: 10.1080 / 01944360208977191,
ISSN: 0194-4363.
Sridhar K. S. (2007). Density gradients and their determinants: Evidence from India.
Regional Science and Urban Economics 37, 314 – 344. doi: 10.1016 / j.regsciur-
beco.2006.11.001, ISSN: 01660462.
Sridhar K. S. (2010). Impact of Land Use Regulations: Evidence from India’s Cities.
Urban Studies 47, 1541 – 1569. doi: 10.1177 / 0042098009353813, ISSN: 0042-
0980, 1360 – 063X.
Srinivasan S., and P. Rogers (2005). Travel behavior of low-income residents:
studying two contrasting locations in the city of Chennai, India. Journal of
Transport Geography 13, 265 – 274. doi: 10.1016 / j.jtrangeo.2004.07.008, ISSN:
0966-6923.
State of California (2008). Sustainable Communities and Climate Protection Act
of 2008, Senate Bill No. 375. Chapter 728. Available at: http: / / www. leginfo. ca.
gov / pub / 07 – 08 / bill / sen / sb_0351 – 0400 / sb_375_bill_20080930_chaptered.
pdf.
Steinberger J., and H. Weisz (2013). City walls and urban hinterlands: the impor-
tance of system boundaries. In: Energizing Sustainable Cities: Assessing Urban
Energy. A. Grubler, D. Fisk, (eds.), Routledge, pp. 41 – 56. ISBN: 9781849714396.
Stone B., J. Vargo, and D. Habeeb (2012). Managing climate change in cities:
Will climate action plans work? Landscape and Urban Planning 107, 263 – 271.
Strohbach M. W., E. Arnold, and D. Haase (2012). The carbon footprint of urban
green space — A life cycle approach. Landscape and Urban Planning 104,
220 – 229. doi: 10.1016 / j.landurbplan.2011.10.013, ISSN: 01692046.
Sugar L., C. Kennedy, and E. Leman (2012). Greenhouse Gas Emissions from
Chinese Cities. Journal of Industrial Ecology 16, 552 – 563. doi: 10.1111 / j.1530-
9290.2012.00481.x, ISSN: 1530-9290.
Sugiyama N., and T. Takeuchi (2008). Local Policies for Climate Change in
Japan. The Journal of Environment & Development 17, 424 – 441. doi:
10.1177 / 1070496508326128.
Sun X., C. Wilmot, and T. Kasturi (1998). Household Travel, Household Charac-
teristics, and Land Use: An Empirical Study from the 1994 Portland Activity-
Based Travel Survey. Transportation Research Record 1617, 10 – 17. doi:
10.3141 / 1617-02, ISSN: 0361-1981.
Suzuki H., R. Cervero, and K. Iuchi (2013). Transforming Cities with Tran-
sit: Transit and Land-Use Integration for Sustainable Urban Development.
World Bank, Washington, D. C., 205 pp. ISBN: 9780821397459, 0821397451,
9780821397503, 0821397508.
Synnefa A., T. Karlessi, N. Gaitani, M. Santamouris, D. N. Assimakopoulos,
and C. Papakatsikas (2011). Experimental testing of cool colored thin layer
asphalt and estimation of its potential to improve the urban microclimate.
Building and Environment 46, 38 – 44. doi: 10.1016 / j.buildenv.2010.06.014,
ISSN: 0360-1323.
Talen E. (2005). New Urbanism and American Planning: The Conflict of Cultures.
Routledge, New York, US, 329 pp. ISBN: 9780203799482.
Talen E. (2012). City Rules: How Regulations Affect Urban Form. Island Press, Wash-
ington D. C., 236 pp.
Tang Z., Z. Wang, and T. Koperski (2011). Measuring local climate change
response capacity and bridging gaps between local action plans and land use
plans. International Journal of Climate Change Strategies and Management 3,
74 – 100. doi: 10.1108 / 17568691111107952, ISSN: 17568692.

998998
Human Settlements, Infrastructure, and Spatial Planning
12
Chapter 12
Tanguay G. A., and I. Gingras (2012). Gas price variations and urban sprawl: An
empirical analysis of the twelve largest Canadian metropolitan areas. Environ-
ment and Planning A 44, 1728 – 1743. doi: 10.1068 / a44259, ISSN: 0308518X.
Tarr J. A. (1984). The Search for the Ultimate Sink: Urban Air, Land, and Water Pol-
lution in Historical Perspective. Records of the Columbia Historical Society 51,
1 – 29. doi: 10.2307 / 40067842, ISSN: 0897-9049.
Teriman S., T. Yigitcanlar, and S. Mayere (2010). Sustainable Urban Infrastruc-
ture Development in South East Asia: Evidence from Hong Kong, Kuala Lumpur
and Singapore. In: Sustainable Urban and Regional Infrastructure Development:
Technologies, Applications and Management. T. Yigitcanlar, (ed.), IGI Global,
Hershey, PA, pp. 152 – 164. ISBN: 978-1-61520-775-6.
The Covenant of Mayors (2013). The Covenant of Mayors. Available at:
http: / / www. covenantofmayors. eu / index_en.html.
Tisdale, H. (1942) The process of urbanization. Social Forces 20 (3), 311 pp
Townsend-Small A., and C. I. Czimczik (2010). Carbon sequestration and green-
house gas emissions in urban turf. Geophysical Research Letters 37, 5 PP. doi:
201010.1029 / 2009GL041675.
Trudeau D. (2013). A typology of New Urbanism neighborhoods. Journal of
Urbanism: International Research on Placemaking and Urban Sustainability 6,
113 – 138. doi: 10.1080 / 17549175.2013.771695, ISSN: 1754-9175.
U. S. Department of Transportation (2009). 2009 National Household Travel
Survey. U. S. Department of Transportation, Washinton, D. C. Available at:
http: / / nhts.gov / index.shtml.
U. S. EPA (2013). Infrastructure Financing Options for Transit-Oriented Develop-
ment. Office of Sustainable Communities Smart Growth Program, Washington,
D. C., 251 pp.
UN DESA (2010). World Urbanization Prospects: The 2009 Revision. United Nations,
Department of Economic and Social Affairs, Population Division, New York.
UN DESA (2012). World Urbanization Prospects: The 2011 Revision. United Nations,
Department of Economic and Social Affairs, Population Division, New York.
UN DESA (2013). Population Density and Urbanization. Available at: http: / / unstats.
un.org / unsd / demographic / sconcerns / densurb / densurbmethods.htm.
UNEP, UN Habitat, and The World Bank (2010). International Standard for
Determining Greenhouse Gas Emissions for Cities, version 2.1. United Nations
Environment Programme. Available at: http: / / www. unep. org / urban_environ-
ment / PDFs / InternationalStd-GHG.pdf.
UN-Habitat (2008). State of the World’s Cities 2008 / 2009: Harmonious Cit-
ies. UN-Habitat; Earthscan, London, 224 pp. ISBN: 9789211320107,
9211320100, 9789211320114, 9211320119, 9781844076963, 1844076962,
9781844076956, 1844076954.
UN-Habitat (2012). State of the World’s Cities 2012 / 2013. Routledge, New York,
184 pp. ISBN: 978-0-415-83888-7.
UN-Habitat (2013). Planning and Design for Sustainable Urban Mobility:
Global Report on Human Settlements 2013. Earthscan / UN HABITAT, Abing-
don, Oxon. Available at: http: / / mirror.unhabitat.org / pmss / listItemDetails.
aspx?publicationID=3503.
United Nations (2011). National Accounts Main Aggregates Database. National
Accounts Main Aggregates Database (United Nations Statistics Division). Avail-
able at: https: / / unstats.un.org / unsd / snaama / Introduction.asp.
Unruh G. C. (2000). Understanding carbon lock-in. Energy Policy 28, 817 – 830. doi:
10.1016 / S0301-4215(00)00070-7, ISSN: 0301-4215.
Unruh G. C. (2002). Escaping carbon lock-in. Energy Policy 30, 317 – 325. doi:
10.1016 / S0301-4215(01)00098-2, ISSN: 0301-4215.
Unruh G. C., and J. Carrillo-Hermosilla (2006). Globalizing carbon lock-in. Energy
Policy 34, 1185 – 1197. doi: 10.1016 / j.enpol.2004.10.013, ISSN: 0301-4215.
Urban LandMark (2012). Improving Access to the City through Value Capture: An
Overview of Capturing and Allocating Value Created through the Development
of Transport Infrastructure in South Africa. UK Department for International
Development, London, 60 pp.
Vance C., and R. Hedel (2007). The impact of urban form on automobile travel:
disentangling causation from correlation. Transportation 34, 575 – 588. doi:
10.1007 / s11116-007-9128-6, ISSN: 0049-4488, 1572 – 9435.
Vause J., L. Gao, L. Shi, and J. Zhao (2013). Production and consumption account-
ing of CO
2
emissions for Xiamen, China. Energy Policy 60, 697 – 704. doi:
10.1016 / j.enpol.2013.04.069, ISSN: 0301-4215.
Venkataraman C., A. D. Sagar, G. Habib, N. Lam, and K. R. Smith (2010). The
Indian National Initiative for Advanced Biomass Cookstoves: The benefits
of clean combustion. Energy for Sustainable Development 14, 63 – 72. doi:
10.1016 / j.esd.2010.04.005, ISSN: 0973-0826.
Vickrey W. S. (1969). Congestion theory and transport investment. The American
Economic Review 59, 251 – 260. Available at: http: / / www. jstor. org / stable /
10.2307 / 1823678.
Vringer K., and K. Blok (1995). The direct and indirect energy requirements of
households in the Netherlands. Energy Policy 23, 893 – 910. doi: 10.1016 / 0301-
4215(95)00072-Q, ISSN: 0301-4215.
Wachs M., and T. G. Kumagai (1973). Physical accessibility as a social indi-
cator. Socio-Economic Planning Sciences 7, 437 – 456. doi: 10.1016 / 0038-
0121(73)90041-4, ISSN: 00380121.
Wang R. (2013). Adopting Local Climate Policies: What Have Califor-
nia Cities Done and Why? Urban Affairs Review 49, 593 – 613. doi:
10.1177 / 1078087412469348, ISSN: 1078-0874.
Wang W., L. Ren, Q. Guo, and T. Chen (2012a). Predicating Energy Demand and
Carbon Emissions of the Yellow River Delta High-efficiency Eco-economic Zone.
Energy Procedia 14, 229 – 234. doi: 10.1016 / j.egypro.2011.12.922, ISSN: 1876-
6102.
Wang R., and Q. Yuan (2013). Parking practices and policies under rapid motoriza-
tion: The case of China. Transport Policy 30, 109 – 116. doi: j.tranpol.2013.08.006.
Wang H., R. Zhang, M. Liu, and J. Bi (2012b). The carbon emissions of Chinese
cities. Atmospheric Chemistry and Physics 12, 6197 – 6206. doi: 10.5194 / acp-
12-6197-2012, ISSN: 1680-7324.
Wang Y., H. Zhao, L. Li, Z. Liu, and S. Liang (2013). Carbon dioxide emission
drivers for a typical metropolis using input – output structural decomposition
analysis. Energy Policy 58, 312 – 318. doi: 10.1016 / j.enpol.2013.03.022, ISSN:
03014215.
Weber M. (1966). The City. The Free Press, New York, 242 pp. ISBN: 0029342104
9780029342107.
Weinstock M. (2011). The Metabolism of the City: The Mathematics of Networks
and Urban Surfaces. Architectural Design 81, 102 – 107. doi: 10.1002 / ad.1275,
ISSN: 1554-2769.
Weisz H., and J. K. Steinberger (2010). Reducing energy and material flows in cit-
ies. Current Opinion in Environmental Sustainability 2, 185 – 192. doi: 10.1016 / j.
cosust.2010.05.010, ISSN: 18773435.
Weitz J. (2003). Jobs-Housing Balance. American Planning Association, Washing-
ton, D. C., 41 pp.

999999
Human Settlements, Infrastructure, and Spatial Planning
12
Chapter 12
West G. B., J. H. Brown, and B. J. Enquist (1999). The Fourth Dimension of Life: Frac-
tal Geometry and Allometric Scaling of Organisms. Science 284, 1677 – 1679.
doi: 10.1126 / science.284.5420.1677, ISSN: 0036-8075, 1095 – 9203.
West J. J., S. J. Smith, R. A. Silva, V. Naik, Y. Zhang, Z. Adelman, M. M. Fry, S.
Anenberg, L. W. Horowitz, and J.-F. Lamarque (2013). Co-benefits of
mitigating global greenhouse gas emissions for future air quality and human
health. Nature Climate Change 3, 885 – 889. doi: 10.1038 / nclimate2009, ISSN:
1758-678X.
Wheeler S. M. (2008). State and Municipal Climate Change Plans: The First Gen-
eration. Journal of the American Planning Association 74, 481 – 496. doi:
10.1080 / 01944360802377973, ISSN: 0194-4363.
White P., J. S. Golden, K. P. Biligiri, and K. Kaloush (2010). Modeling climate
change impacts of pavement production and construction. Resources, Conser-
vation and Recycling 54, 776 – 782. doi: 10.1016 / j.resconrec.2009.12.007, ISSN:
09213449.
Whitford V., A. R. Ennos, and J. F. Handley (2001). “City form and natural pro-
cess” — indicators for the ecological performance of urban areas and their
application to Merseyside, UK. Landscape and Urban Planning 57, 91 – 103. doi:
10.1016 / S0169-2046(01)00192-X, ISSN: 0169-2046.
Wiedenhofer D., M. Lenzen, and J. K. Steinberger (2013). Energy requirements
of consumption: Urban form, climatic and socio-economic factors, rebounds
and their policy implications. Energy Policy 63, 696 – 707. doi: 10.1016 / j.
enpol.2013.07.035, ISSN: 03014215.
Willson R. W. (1995). Suburban Parking Requirements: A Tacit Policy for Automobile
Use and Sprawl. Journal of the American Planning Association 61, 29 – 42. doi:
10.1080 / 01944369508975617, ISSN: 0194-4363, 1939 – 0130.
Wilson E. (2009). Multiple Scales for Environmental Intervention: Spatial Planning
and the Environment under New Labour. Planning Practice and Research 24,
119 – 138. doi: 10.1080 / 02697450902742205, ISSN: 0269-7459.
Wirth L. (1938). Urbanism as a Way of Life. American Journal of Sociology 44,
1 – 24. doi: 10.2307 / 2768119, ISSN: 0002-9602.
Woo M., and J.-M. Guldmann (2011). Impacts of Urban Containment Policies on
the Spatial Structure of US Metropolitan Areas. Urban Studies 48, 3511 – 3536.
doi: 10.1177 / 0042098011399594, ISSN: 0042-0980, 1360 – 063X.
World Bank (2005). Dynamics of Urban Expansion. Available at: http: / / sitere-
sources.worldbank.org / INTURBANDEVELOPMENT / Resources / dynamics_
urban_expansion.pdf.
World Bank (2009). World Development Report 2009: Reshaping Economic Geog-
raphy. World Bank, Washington, D. C., 383 pp. ISBN 9978-0-8213-7607-2.
World Bank (2010). Cities and Climate Change: An Urgent Agenda. The World
Bank, Washington, D. C., 306 pp. Available at: http: / / siteresources.worldbank.
org / INTUWM / Resources / 340232-1205330656272 / CitiesandClimateChange.
pdf.
World Bank (2013). Health Nutrition and Population Statistics. Available at:
http: / / data.worldbank.org / data-catalog / health-nutrition-and-population-
statistics.
Wright L. A., J. Coello, S. Kemp, and I. Williams (2011). Carbon footprinting for
climate change management in cities. Carbon Management 2, 49 – 60. doi:
10.4155 / cmt.10.41, ISSN: 1758-3004.
Yalçın M., and B. Lefèvre (2012). Local Climate Action Plans in France: Emergence,
Limitations and Conditions for Success. Environmental Policy and Governance
22, 104 – 115.
Yang J., and R. Gakenheimer (2007). Assessing the transportation consequences
of land use transformation in urban China. Habitat International 31, 345 – 353.
doi: 10.1016 / j.habitatint.2007.05.001, ISSN: 0197-3975.
Yang F., S. S. Y. Lau, and F. Qian (2010). Summertime heat island intensities in
three high-rise housing quarters in inner-city Shanghai China: Building layout,
density and greenery. Building and Environment 45, 115 – 134. doi: 10.1016 / j.
buildenv.2009.05.010, ISSN: 0360-1323.
Yang P. P.-J., and S. H. Lew (2009). An Asian Model of TOD: The Planning Integra-
tion in Singapore. In: Transit Oriented Development: Making It Happen. C. Cur-
tis, J. L. Renne, L. Bertolini, (eds.), Ashgate, Surrey, England, pp. 91 – 106. ISBN:
9780754673156.
Yescombe E. R. (2007). Public-Private Partnerships: Principles of Policy and Finance.
Elsevier; Butterworth-Heinemann, Amsterdam; Boston: Burlington, Mass, 350
pp. ISBN: 9780750680547.
Yu W., R. Pagani, and L. Huang (2012). CO
2
emission inventories for Chinese cit-
ies in highly urbanized areas compared with European cities. Energy Policy 47,
298 – 308. doi: 10.1016 / j.enpol.2012.04.071, ISSN: 0301-4215.
Zeemering E. (2012). Recognising interdependence and defining multi-level
governance in city sustainability plans. Local Environment 17, 409 – 424. doi:
10.1080 / 13549839.2012.678315, ISSN: 1354-9839.
Zegras C. (2003). Financing transport infrastructure in developing country cit-
ies: Evaluation of and lessons from nascent use of impact fees in San-
tiago de Chile. Transportation Research Record: Journal of the Transpor-
tation Research Board 1839, 81 – 88. Available at: http: / / trb.metapress.
com / index / 9366673J23868L03.pdf.
Zegras C. (2010). The Built Environment and Motor Vehicle Ownership and
Use: Evidence from Santiago de Chile. Urban Studies 47, 1793 – 1817. doi:
10.1177 / 0042098009356125, ISSN: 0042-0980, 1360 – 063X.
Zeng X., Y. Ma, and L. Ma (2007). Utilization of straw in biomass energy in China.
Renewable and Sustainable Energy Reviews 11, 976 – 987. doi: 10.1016 / j.
rser.2005.10.003, ISSN: 1364-0321.
Zhang M. (2004). The role of land use in travel mode choice: Evidence from Boston
and Hong Kong. Journal of the American Planning Association 70, 344 – 360.
Zhang M. (2007). Chinese edition of transit-oriented development. Journal of the
Transportation Research Board 2038, 120 – 127. doi: 10.3141 / 2038-16.
Zhang M., H. Mu, and Y. Ning (2009). Accounting for energy-related CO
2
emis-
sion in China, 1991 – 2006. Energy Policy 37, 767 – 773. doi: 10.1016 / j.
enpol.2008.11.025, ISSN: 0301-4215.
Zhang M., and L. Wang (2013). The impacts of mass transit on land develop-
ment in China: The case of Beijing. Research in Transportation Economics 40,
124 – 133. doi: 10.1016 / j.retrec.2012.06.039, ISSN: 0739-8859.
Zhao M., Z. Kong, F. J. Escobedo, and J. Gao (2010). Impacts of urban forests
on offsetting carbon emissions from industrial energy use in Hangzhou, China.
Journal of Environmental Management 91, 807 – 813. doi: 10.1016 / j.jenv-
man.2009.10.010, ISSN: 0301-4797.
Zheng S., Y. Fu, and H. Liu (2006). Housing-choice hindrances and urban spa-
tial structure: Evidence from matched location and location-preference data
in Chinese cities. Journal of Urban Economics 60, 535 – 557. doi: 10.1016 / j.
jue.2006.05.003, ISSN: 0094-1190.

10001000
Human Settlements, Infrastructure, and Spatial Planning
12
Chapter 12
Zheng S., Y. Fu, and H. Liu (2009). Demand for Urban Quality of Living in China:
Evolution in Compensating Land-Rent and Wage-Rate Differentials. The Journal
of Real Estate Finance and Economics 38, 194 – 213. doi: 10.1007 / s11146-008-
9152-0, ISSN: 0895-5638, 1573 – 045X.
Zheng S., R. Wang, E. L. Glaeser, and M. E. Kahn (2010). The greenness of China:
household carbon dioxide emissions and urban development. Journal of Eco-
nomic Geography 11, 761 – 792. doi: 10.1093 / jeg / lbq031, ISSN: 1468-2702,
1468 – 2710.
Zhou B. B., and K. M. Kockelman (2008). Self-selection in home choice: Use of
treatment effects in evaluating relationship between built environment and
travel behavior. Transportation Research Record: Journal of the Transportation
Research Board 2077, 54 – 61. doi: 10.3141 / 2077-08.
Zimmerman R., and C. Faris (2011). Climate change mitigation and adaptation
in North American cities. Current Opinion in Environmental Sustainability 3,
181 – 187. doi: 10.1016 / j.cosust.2010.12.004, ISSN: 1877-3435.
Zipf G. K. (1949). Human Behavior and the Principle of Least Effort. Addison-Wes-
ley Press, Oxford, England, 573 pp.
Zulu L. C. (2010). The forbidden fuel: Charcoal, urban woodfuel demand and sup-
ply dynamics, community forest management and woodfuel policy in Malawi.
Energy Policy 38, 3717 – 3730. doi: 10.1016 / j.enpol.2010.02.050, ISSN: 0301-
4215.
