
1207
16
Cross-cutting Investment
and Finance Issues
Coordinating Lead Authors:
Sujata Gupta (India / Philippines), Jochen Harnisch (Germany)
Lead Authors:
Dipal Chandra Barua (Bangladesh), Lloyd Chingambo (Zambia), Paul Frankel (USA), Raúl Jorge
Garrido Vázquez (Cuba), Luis Gómez-Echeverri (Austria / Colombia), Erik Haites (Canada), Yongfu
Huang (Finland / China), Raymond Kopp (USA), Benoit Lefèvre (France / USA), Haroldo de Oliveira
Machado-Filho (Brazil), Emanuele Massetti (Italy)
Contributing Authors:
Katrin Enting (Germany), Martin Stadelmann (Switzerland), Murray Ward (New Zealand / Canada),
Silvia Kreibiehl (Germany)
Review Editors:
Carlo Carraro (Italy), Mohammed Said Karrouk (Morocco), Ignacio Pérez-Arriaga (Spain)
Chapter Science Assistant:
Katrin Enting (Germany)
This chapter should be cited as:
Gupta S., J. Harnisch, D. C. Barua, L. Chingambo, P. Frankel, R. J. Garrido Vázquez, L. Gómez-Echeverri, E. Haites, Y. Huang,
R. Kopp, B. Lefèvre, H. Machado-Filho, and E. Massetti, 2014: Cross-cutting Investment and Finance Issues. In: Climate
Change 2014: Mitigation of Climate Change. Contribution of Working Group III to the Fifth Assessment Report of the Inter-
governmental Panel on Climate Change [Edenhofer, O., R. Pichs-Madruga, Y. Sokona, E. Farahani, S. Kadner, K. Seyboth, A.
Adler, I. Baum, S. Brunner, P. Eickemeier, B. Kriemann, J. Savolainen, S. Schlömer, C. von Stechow, T. Zwickel and J.C. Minx
(eds.)]. Cambridge University Press, Cambridge, United Kingdom and New York, NY, USA.

12081208
Cross-cutting Investment and Finance Issues
16
Chapter 16
Contents
Executive Summary � � � � � � � � � � � � � � � � � � � � � � � � � � � � � � � � � � � � � � � � � � � � � � � � � � � � � � � � � � � � � � � � � � � � � � � � � � � � � � � � � � � � � � � � � � � � � � � � � � � � � � � � � � � � � � 1210
16�1 Introduction � � � � � � � � � � � � � � � � � � � � � � � � � � � � � � � � � � � � � � � � � � � � � � � � � � � � � � � � � � � � � � � � � � � � � � � � � � � � � � � � � � � � � � � � � � � � � � � � � � � � � � � � � 1211
16�2 Scale of financing at national, regional, and international level in the short-, mid-, and long-
term
� � � � � � � � � � � � � � � � � � � � � � � � � � � � � � � � � � � � � � � � � � � � � � � � � � � � � � � � � � � � � � � � � � � � � � � � � � � � � � � � � � � � � � � � � � � � � � � � � � � � � � � � � � � � � � � � � � � � 1213
16�2�1 Current financial flows and sources
� � � � � � � � � � � � � � � � � � � � � � � � � � � � � � � � � � � � � � � � � � � � � � � � � � � � � � � � � � � � � � � � � � � � � � � � 1213
16.2.1.1 Estimates of current climate finance
. . . . . . . . . . . . . . . . . . . . . . . . . . . . . . . . . . . . . . . . . . . . . . . . . . . . . . . . . . . . . . . . . 1214
16.2.1.2 Current sources of climate finance
. . . . . . . . . . . . . . . . . . . . . . . . . . . . . . . . . . . . . . . . . . . . . . . . . . . . . . . . . . . . . . . . . . 1216
16.2.1.3 Recent developments
. . . . . . . . . . . . . . . . . . . . . . . . . . . . . . . . . . . . . . . . . . . . . . . . . . . . . . . . . . . . . . . . . . . . . . . . . . . . . . . . 1217
16�2�2 Future low-carbon investment
� � � � � � � � � � � � � � � � � � � � � � � � � � � � � � � � � � � � � � � � � � � � � � � � � � � � � � � � � � � � � � � � � � � � � � � � � � � � 1217
16.2.2.1 Investment needs
. . . . . . . . . . . . . . . . . . . . . . . . . . . . . . . . . . . . . . . . . . . . . . . . . . . . . . . . . . . . . . . . . . . . . . . . . . . . . . . . . . . . 1217
16.2.2.2 Incremental costs
. . . . . . . . . . . . . . . . . . . . . . . . . . . . . . . . . . . . . . . . . . . . . . . . . . . . . . . . . . . . . . . . . . . . . . . . . . . . . . . . . . . . 1221
16�2�3 Raising public funding by developed countries for climate finance in developing countries
� � � � � � � � � � � � 1221
16�3 Enabling environments � � � � � � � � � � � � � � � � � � � � � � � � � � � � � � � � � � � � � � � � � � � � � � � � � � � � � � � � � � � � � � � � � � � � � � � � � � � � � � � � � � � � � � � � � � � � 1223
16�4 Financing low-carbon investments, opportunities, and key drivers � � � � � � � � � � � � � � � � � � � � � � � � � � � � � � � � 1223
16�4�1 Capital managers and investment decisions
� � � � � � � � � � � � � � � � � � � � � � � � � � � � � � � � � � � � � � � � � � � � � � � � � � � � � � � � � � � � � � � 1223
16�4�2 Challenges for low-carbon investment
� � � � � � � � � � � � � � � � � � � � � � � � � � � � � � � � � � � � � � � � � � � � � � � � � � � � � � � � � � � � � � � � � � � � 1224
16�4�3 Financial instruments
� � � � � � � � � � � � � � � � � � � � � � � � � � � � � � � � � � � � � � � � � � � � � � � � � � � � � � � � � � � � � � � � � � � � � � � � � � � � � � � � � � � � � � � 1226
16.4.3.1 Reducing investment risks
. . . . . . . . . . . . . . . . . . . . . . . . . . . . . . . . . . . . . . . . . . . . . . . . . . . . . . . . . . . . . . . . . . . . . . . . . . . 1226
16.4.3.2 Reducing cost of and facilitating access to capital
. . . . . . . . . . . . . . . . . . . . . . . . . . . . . . . . . . . . . . . . . . . . . . . . . . 1227
16.4.3.3 Enhancing cash flow
. . . . . . . . . . . . . . . . . . . . . . . . . . . . . . . . . . . . . . . . . . . . . . . . . . . . . . . . . . . . . . . . . . . . . . . . . . . . . . . . . 1228
16�5 Institutional arrangements for mitigation financing � � � � � � � � � � � � � � � � � � � � � � � � � � � � � � � � � � � � � � � � � � � � � � � � � � � � � 1228
16�5�1 International arrangements
� � � � � � � � � � � � � � � � � � � � � � � � � � � � � � � � � � � � � � � � � � � � � � � � � � � � � � � � � � � � � � � � � � � � � � � � � � � � � � � � 1228
16�5�2 National and sub-national arrangements
� � � � � � � � � � � � � � � � � � � � � � � � � � � � � � � � � � � � � � � � � � � � � � � � � � � � � � � � � � � � � � � � � 1229
16�5�3 Performance in a complex institutional landscape
� � � � � � � � � � � � � � � � � � � � � � � � � � � � � � � � � � � � � � � � � � � � � � � � � � � � � � � � 1230
16�6 Synergies and tradeoffs between financing mitigation and adaptation � � � � � � � � � � � � � � � � � � � � � � � � � � 1231
16�6�1 Optimal balance between mitigation and adaptation and time dimension
� � � � � � � � � � � � � � � � � � � � � � � � � � � � � � 1231

12091209
Cross-cutting Investment and Finance Issues
16
Chapter 16
16�6�2 Integrated financing approaches � � � � � � � � � � � � � � � � � � � � � � � � � � � � � � � � � � � � � � � � � � � � � � � � � � � � � � � � � � � � � � � � � � � � � � � � � � � 1232
16�7 Financing developed countries’ mitigation activities � � � � � � � � � � � � � � � � � � � � � � � � � � � � � � � � � � � � � � � � � � � � � � � � � � � � 1233
16�8 Financing mitigation activities in and for developing countries including for technology deve-
lopment, transfer, and diffusion
� � � � � � � � � � � � � � � � � � � � � � � � � � � � � � � � � � � � � � � � � � � � � � � � � � � � � � � � � � � � � � � � � � � � � � � � � � � � � � � � 1234
16�9 Gaps in knowledge and data � � � � � � � � � � � � � � � � � � � � � � � � � � � � � � � � � � � � � � � � � � � � � � � � � � � � � � � � � � � � � � � � � � � � � � � � � � � � � � � � � � � 1237
16�10 Frequently Asked Questions � � � � � � � � � � � � � � � � � � � � � � � � � � � � � � � � � � � � � � � � � � � � � � � � � � � � � � � � � � � � � � � � � � � � � � � � � � � � � � � � � � � � � 1238
References � � � � � � � � � � � � � � � � � � � � � � � � � � � � � � � � � � � � � � � � � � � � � � � � � � � � � � � � � � � � � � � � � � � � � � � � � � � � � � � � � � � � � � � � � � � � � � � � � � � � � � � � � � � � � � � � � � � � � � � � � 1239

12101210
Cross-cutting Investment and Finance Issues
16
Chapter 16
Executive Summary
For the first time, an assessment report by the Intergovernmental Panel
on Climate Change (IPCC) contains a chapter dedicated to investment
and finance. These are the chapter’s key findings:
Scientific literature on investment and finance to address cli-
mate change is still very limited and knowledge gaps are sub-
stantial; there are no agreed definitions for climate investment
and climate finance� Quantitative data are limited, relate to different
concepts, and are incomplete. Accounting systems are highly imperfect.
Estimates are available for current total climate finance, total climate
finance provided to developing countries, public climate finance pro-
vided to developing countries, and climate finance under the United
Nations Framework Convention on Climate Change (UNFCCC), as well
as future incremental investment and incremental cost for mitigation
measures. Climate finance relates both to adaptation and mitigation,
while under the scope of this chapter, estimates of future investment
needs are presented only for mitigation. [Section16.1]
Total climate finance for mitigation and adaptation is estimated
at 343 to 385 billion USD (2010 / 11 / 12 USD) per year using a
mix of 2010, 2011, and 2012 data, almost evenly being invested
in developed and developing countries (medium confidence). The
figures reflect the total financial flow for the underlying investments,
not the incremental investment, i. e., the portion attributed to the emis-
sion reductions. Around 95 % of reported total climate finance is for
mitigation (medium confidence). [16.2.1.1]
The total climate finance currently flowing to developing
countries is estimated to be between 39 to 120 billion USD
per year using a mix of 2009, 2010, 2011, and 2012 data
(2009 / 2010 / 2011 / 2012 USD) (medium confidence). This range
covers public and private flows for mitigation and adaptation. Public
climate finance is estimated at 35 – 49 billion USD (2011 / 2012 USD)
(medium confidence). Most public climate finance provided to devel-
oping countries flows through bilateral and multilateral institutions,
usually as concessional loans and grants. Climate finance under the
UNFCCC is funding provided to developing countries by AnnexII Par-
ties. The climate finance reported by AnnexII Parties averaged nearly
10 billion USD per year from 2005 to 2010 (2005 – 2010 USD) (medium
confidence). Between 2010 and 2012, the ‘fast-start finance’ (FSF) pro-
vided by some developed countries amounted to over 10 billion USD
per year (2010 / 2011 / 2012 USD) (medium confidence). Estimates of
international private climate finance flowing to developing countries
range from 10 to 72 billion USD (2009 / 2010 USD) per year, including
foreign direct investment as equity and loans in the range of 10 to
37 billion USD (2010 USD and 2008 USD) per year over the period of
2008 – 2011 (medium confidence). [16.2.1.1]
Emission patterns that limit temperature increase from pre-
industrial level to no more than 2 °C require considerably differ-
ent patterns of investment� A limited number of studies have exam-
ined the investment needs to transform the economy to limit warming
to 2 °C. Information is largely restricted to energy use with global total
annual investment in the energy sector at about 1200 billion USD. In
the results for these scenarios, which are consistent to keeping carbon
dioxide equivalent (CO
2
eq) concentration in the interval 430 – 530 ppm
until 2100, annual investment in fossil-fired power plants without car-
bon dioxide capture and storage (CCS) would decline by 30 (median:
– 20 % compared to 2010) (2 to 166) billion USD during the period
2010 – 2029, compared to the reference scenarios (limited evidence,
medium agreement). Investment in low-emissions generation tech-
nologies (renewable, nuclear, and electricity generation with CCS)
would increase by 147 (median: +100 % compared to 2010) (31 to
360) billion USD per year during the same period (limited evidence,
medium agreement) in combination with an increase by 336 (1 to 641)
billion USD in energy-efficiency investments in the building, trans-
port, and industry sector (limited evidence, medium agreement), fre-
quently involving modernization of existing equipment. Higher energy
efficiency and the shift to low-emission energy sources contribute to
a reduction in the demand for fossil fuels, thus causing a decline in
investment in fossil fuel extraction, transformation, and transportation.
Scenarios suggest that the average annual reduction of investment in
fossil fuel extraction in 2010 – 2029 would be 116 (– 8 to 369) billion
USD (limited evidence, medium agreement). Such ‘spillover’ effects
could yield adverse effects on economies, especially of countries that
rely heavily on exports of fossil fuels. Model results suggest that defor-
estation could be reduced against current deforestation trends by 50 %
with an investment of 21 to 35 billion USD per year (low confidence).
Information on investment needs in other sectors in addition to energy
efficiency, e. g., to abate process or non-CO
2
emissions is virtually
unavailable. [16.2.2]
Resources to address climate change need to be scaled up con-
siderably over the next few decades both in developed and
developing countries (medium evidence, high agreement). Increased
financial support by developed countries for mitigation (and adapta-
tion) measures in developing countries will be needed to stimulate the
increased investment. Developed countries have committed to a goal
of jointly mobilizing 100 billion USD per year by 2020 in the context
of meaningful mitigation action and transparency on implementation.
The funding could come from a variety of sources — public and private,
bilateral and multilateral, including alternative sources of finance.
Studies of how 100 billion USD per year could be mobilized by 2020
conclude that it is challenging but feasible. [16.2]
Public revenues can be raised by collecting carbon taxes and
by auctioning carbon allowances (high confidence). Putting a
price on greenhouse gas (GHG) emissions, through a carbon tax or
emissions trading, alters the rate of return on high- and low-carbon
investments. It makes low-emission technologies attract more invest-
ment and at the same time it raises a considerable amount of revenue
that can be used for a variety of purposes, including climate finance.
These carbon-related sources are already sizeable in some countries

12111211
Cross-cutting Investment and Finance Issues
16
Chapter 16
[16.2.1.2]. The consideration of alternative sources of public revenue
like taxes on international bunker fuels has the potential to generate
significant funds but is still in its infancy. Reducing fossil fuel subsi-
dies would lower emissions and release public funds for other pur-
poses [16.2.3].
Within appropriate enabling environments, the private sec-
tor, along with the public sector, can play an important role in
financing mitigation (medium evidence, high agreement). Its con-
tribution is estimated at 267 billion USD per year in 2010 and 2011
(2010 / 2011 USD) and at 224 billion USD (2011 / 2012 USD) per year
in 2011 and 2012 on average, which represents around 74 % and
62 % of overall climate finance, respectively (limited evidence, medium
agreement) [16.2.1]. In a range of countries, a large share of private
sector climate investment relies on low-interest and long-term loans
as well as risk guarantees provided by public sector institutions to
cover the incremental costs and risks of many mitigation investments.
In many countries, therefore, the role of the public sector is crucial in
helping these private investments happen. The quality of a country’s
enabling environment — including the effectiveness of its institutions,
regulations and guidelines regarding the private sector, security of
property rights, credibility of policies and other factors — has a sub-
stantial impact on whether private firms invest in new technologies
and infrastructures. Those same broader factors will probably have a
big impact on whether and where investment occurs in response to
mitigation policies [16.3]. By the end of 2012, the 20 largest emitting
developed and developing countries with lower risk country grades
for private sector investments covered 70 % of global energy-related
CO
2
emissions (low confidence). This makes them attractive for inter-
national private sector investment in low-carbon technologies. In many
other countries, including most least developed countries, low-carbon
investment will often have to rely mainly on domestic sources or inter-
national public finance [16.4.2].
A main barrier to the deployment of low-carbon technolo-
gies is a low risk-adjusted rate of return on investment vis-
à-vis high-carbon alternatives often resulting in higher cost
of capital (medium evidence, high agreement). This is true in both
developed and developing countries. Dedicated financial instruments
to address these barriers exist and include inter alia credit insurance
to decrease risk, renewable energy premiums to increase return, and
concessional finance to decrease the cost of capital. Governments can
also alter the relative rates of return of low-carbon investments in
different ways and help to provide an enabling environment. [16.3,
16.4]
Appropriate governance and institutional arrangements at the
national, regional, and international level need to be in place
for efficient, effective, and sustainable financing of mitigation
measures (high confidence). They are essential to ensure that financ-
ing to mitigate and adapt to climate change responds to national
needs and priorities and that national and international activities are
linked and do not contradict each other. An enabling environment at
the national level ensures efficient implementation of funds and risk
reduction using international resources, national funds, as well as
national development and financial institutions. [16.5]
Important synergies and tradeoffs between financing mitiga-
tion and adaptation exist (medium confidence). Available estimates
show that adaptation projects get only a minor fraction of interna-
tional climate finance. Current analyses do not provide conclusive
results on the most efficient temporal distribution of funding on adap-
tation vis-à-vis mitigation. While the uncertainties about specific path-
ways and relationships remain, and although there are different con-
siderations on its optimal balance, there is a general agreement that
funding for both mitigation and adaptation is needed. Moreover, there
is an increasing interest in promoting integrated financing approaches,
addressing both adaptation and mitigation activities in different sec-
tors and at different levels. [16.6]
Increasing access to modern energy services for meeting basic
cooking and lighting needs could yield substantial improve-
ments in human welfare at relatively low cost (medium confi-
dence). Shifting the large populations that rely on traditional solid fuels
(such as unprocessed biomass, charcoal, and coal) to modern energy
systems and expanding electricity supply for basic human needs could
yield substantial improvements in human welfare for a relatively low
cost; 72 – 95 billion USD per year until 2030 to achieve nearly universal
access. [16.8]
16.1 Introduction
This is the first time an assessment report by the Intergovernmen-
tal Panel on Climate Change (IPCC) contains a chapter dedicated to
investment and finance to address climate change. This reflects the
growing awareness of the relevance of these issues for the design of
efficient and effective climate policies.
The assessment of this topic is complicated by the absence of agreed
definitions, sparse data from disparate sources, and limited peer-
reviewed literature. Equity, burden sharing, and gender consider-
ations related to climate change are discussed in other chapters, inter
alia Sections 3.3 and 4.6.2. This chapter does not include a separate
discussion of these considerations in relation to climate finance.
There is no agreed definition of climate finance (Haites, 2011; Stadel-
mann etal., 2011b; Buchner etal., 2011; Forstater and Rank, 2012).
The term ‘climate finance’ is applied both to the financial resources
devoted to addressing climate change globally and to financial flows
to developing countries to assist them in addressing climate change.
The literature includes multiple concepts within each of these broad
categories (Box 1.1). The specific mitigation and adaptation measures
whose costs qualify as ‘climate finance’ also are not agreed. The mea-

12121212
Cross-cutting Investment and Finance Issues
16
Chapter 16
Box 16�1 | Different concepts, different numbers
Different concepts of climate finance are found in the literature.
The corresponding values differ significantly.
Financial resources devoted to addressing climate change
globally:
Total climate finance includes all financial flows whose expected
effect is to reduce net GHG emissions and / or to enhance resilience
to the impacts of climate variability and the projected climate
change. This covers private and public funds, domestic and inter-
national flows, expenditures for mitigation and adaptation to cur-
rent climate variability as well as future climate change. It covers
the full value of the financial flow rather than the share associated
with the climate change benefit; e. g., the entire investment in a
wind turbine rather than the portion attributed to the emission
reductions. The estimate by Buchner etal. (2012, 2013b) of current
climate finance of 343 to 385 billion USD (2010 / 2011 / 2012 USD)
per year using a mix of 2010, 2011, and 2012 data, corresponds
roughly to this concept.
The incremental investment is the extra capital required for
the initial investment for a mitigation or adaptation project in
comparison to a reference project. For example, the investment in
wind turbines less the investment that would have been required
for the coal or natural gas-generating unit displaced. Since the
value depends on the unknown investment in a hypothetical
alternative, the incremental investment is uncertain. Incremen-
tal investment for mitigation and adaptation measures is not
regularly estimated and reported, but estimates are available
from models. It can be positive or negative. Many agriculture and
reducing emissions from deforestation and forest degradation
(REDD+) mitigation options that involve ongoing expenditures
for labour and other operating costs rather than investments are
excluded.
The incremental costs reflect the cost of capital of the incremental
investment and the change of operating and maintenance costs
for a mitigation or adaptation project in comparison to a reference
project. It can be calculated as the difference of the net present
values of the two projects. Many mitigation measures — such as
energy efficiency, renewables, and nuclear — have a higher capi-
tal cost and lower operating costs than the measures displaced.
Frequently the incremental costs are lower than the incremental
investment. Values depend on the incremental investment as well
as projected operating costs, including fossil fuel prices, and the
discount rate. Models can estimate the incremental costs of energy
supply and demand but data are not immediately available and
aggregate estimates cannot be provided. Estimates are available
for single-mitigation options (see, e. g., Chapter7).
The macroeconomic costs of mitigation policy are the reductions
of aggregate consumption or gross domestic product induced by
the reallocation of investments and expenditures induced by cli-
mate policy. These costs do not account for the benefit of reduc-
ing anthropogenic climate change and should thus be assessed
against the economic benefit of avoided climate change impacts.
Models have traditionally provided estimates of the macroeco-
nomic costs of climate policy (see Chapter 6).
Financial flows to developing countries to assist them in
addressing climate change:
The total climate finance flowing to developing countries is the
amount of the total climate finance invested in developing coun-
tries that comes from developed countries. This covers private and
public funds for mitigation and adaptation. Estimates from a few
studies suggest the current flow is between 39 and 120 billion USD
per year (2009 – 2012 USD).
Public climate finance provided to developing countries is the
finance provided by developed countries’ governments and bilat-
eral institutions as well as multilateral institutions for mitigation
and adaptation activities in developing countries. Most of the
funds provided are concessional loans and grants. Estimates sug-
gest that public climate finance flows to developing countries were
at 35 to 49 billion USD per year in 2011 and 2012 (2011 / 2012
USD).
Private climate finance flowing to developing countries is finance
and investment by private actors in / from developed countries
for activities in developing countries whose expected effect is to
reduce net GHG emissions and / or to enhance resilience to the
impacts of climate variability and the projected climate change.
Under the United Nations Framework Convention on Climate
Change (UNFCCC), climate finance is not well-defined. Annex II
Parties provide and mobilize funding for climate related activities
in developing countries. Most of the funds provided are conces-
sional loans and grants. The climate finance provided to devel-
oping countries reported by AnnexII Parties averaged nearly 10
billion USD per year from 2005 to 2010 (2005 – 2010 USD). In addi-
tion, some developed countries promised FSF amounting to over
10 billion USD per year between 2010 and 2012 (2010 / 2011 / 2012
USD).
12131213
Cross-cutting Investment and Finance Issues
16
Chapter 16
sures included vary across studies and often are determined by the
data available
1
.
The rest of the chapter is structured as follows: Section 16.2 reviews
estimates of current climate finance corresponding to the different
concepts in Box 1, projections of global incremental investment and
incremental costs for energy-related mitigation measures to 2030,
and options for raising public funds for climate finance. Enabling fac-
tors that influence the ability to efficiently generate and implement
climate finance are discussed in Section 16.3. Section 16.4 considers
opportunities and key drivers for low-carbon investments. Institutional
arrangements for mitigation finance are addressed in Section 16.5.
Synergies and tradeoffs between financing mitigation and adapta-
tion are discussed in Section 16.6. The chapter concludes with sections
devoted to financing mitigation activities in developed (Section16.7)
and developing countries (Section 16.8) and a review of important
gaps of knowledge (Section 16.9).
1
Most of the financial flow data in this chapter originate from 2010, 2011, and 2012
and were published in USD. The exchange rates used by each source to convert
other currencies to USD are not specified in the published sources. In these cases,
the published USD figure has been maintained and the base year is similar to the
year the commitment / investment / flow was announced / reported. If no base year is
indicated, as for most monetary values in Section 16.2.2, the base year is 2010.
16.2 Scale of financing at
national, regional, and
international level in the
short-, mid-, and long-term
16�2�1 Current financial flows and sources
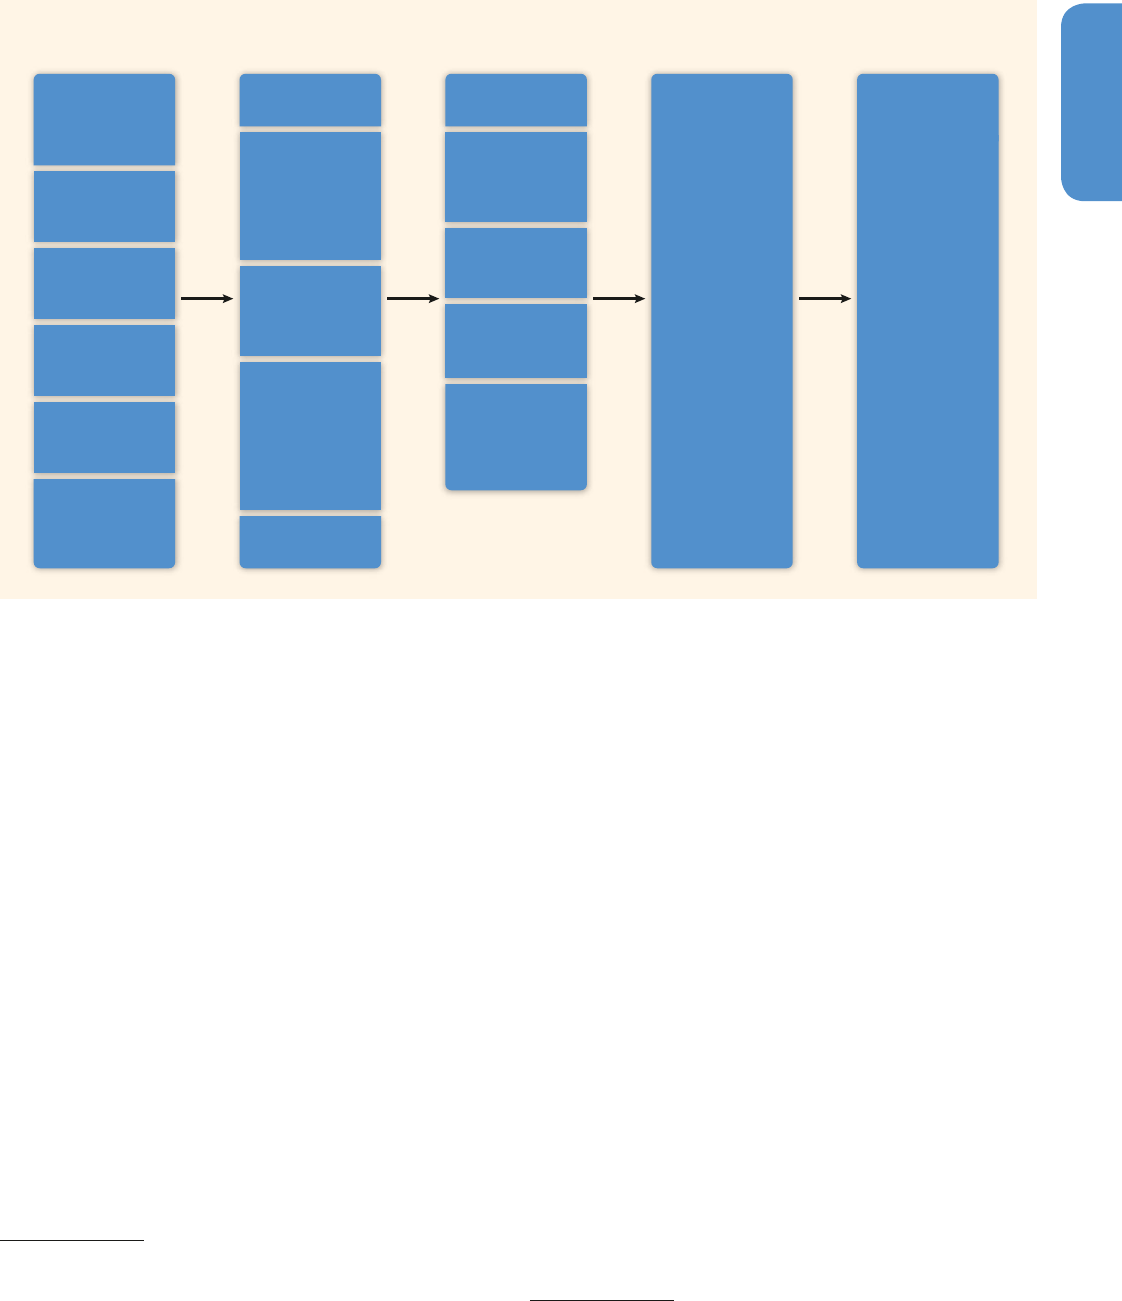
Figure 16.1 provides an overview of climate finance and the terms
used in this chapter. The term ‘capital’ is used because most climate
finance involves an investment, but it should be understood to include
all relevant financial flows
2
. One or more capital managers mobilize
the required capital and invest it in an adaptation or mitigation proj-
ect. Project owners or sponsors — governments, corporations, or
households — implement a project using their own and other sources
of capital. However, projects often obtain capital from multiple capital
managers (Buchner etal., 2011, 2012; Jürgens etal., 2012). An instru-
ment defines the financial agreement between a project owner / spon-
sor and a manager of capital. A project that obtains capital from sev-
2
Terms that cover both capital and operating costs, such as ‘financial resources’ or
‘funds’ are cumbersome (sources / managers of financial resources) or potentially
confusing (‘funds’ can also be institutions).
Figure 16�1 | Overview of climate finance flows. Note: Capital should be understood to include all relevant financial flows. The size of the boxes is not related to the magnitude of
the financial flow.
Source of Capital
Carbon Taxes
and Auction of
Allowances
General Tax
Revenue
International
Levies
Funds from
Capital Markets
Corporate
Cash Flow
Household
Income
Manager of Capital
Governments
National,
Bilateral and
Multilateral
Financial
Institutions
Commercial
Financial
Institutions
Corporate
Actors and
Institutional
Investors
(Private and
Public)
Households
Financial Instrument
Grants
Project Debt
(Market Based/
Concessional)
Project Level
Equity
Balance Sheet
Financing
Credit
Enhancement /
Risk
Management
Project Owner/Sponsor
Governments,
Corporations,
and Households
(Developed and
Developing
Countries)
Project
Adaptation
Mitigation
(incl. REDD)

12141214
Cross-cutting Investment and Finance Issues
16
Chapter 16
eral managers would use multiple instruments. The size of the boxes is
not related to the magnitude of the financial flow.
Data on current climate finance, summarized below, indicate that most
capital deployed is private — private corporations and households. That
is not surprising since they dominate the economy in most countries.
Domestically, government funds are disbursed directly as financial
incentives or tax credits, or through national financial institutions.
Climate finance under the UNFCCC currently is provided mainly by
the national governments of Annex II Parties. Climate finance from
the budgets of these government flows through bilateral institutions
being a national public entity, such as Japan International Coopera-
tion Agency (JICA), Agence Française de Développement (AFD), Kredi-
tanstalt für Wiederaufbau (KfW), or through multilateral institutions
having several countries as shareholders, such as the World Bank,
regional development banks, and multilateral climate funds.
There is no internationally agreed definition of mitigation and adapta-
tion projects; for example, whether a high-efficiency gas-fired gener-
ating unit is a mitigation project or which capacity building activities
help to address climate change. The relevant projects, and hence the
scale of climate finance, depend upon the definition of mitigation and
adaptation projects adopted. In practice, the definition varies across
studies and is often determined by the data available.
16�2�1�1 Estimates of current climate finance
This section reviews estimates of current global total climate finance,
total climate finance flowing to developing countries, public climate
finance provided to developing countries and climate finance under
the UNFCCC.
There is no comprehensive system for tracking climate finance (Clapp
etal., 2012; Tirpak etal., 2012), therefore, estimates must be compiled
from disparate sources of variable quality and timeliness, sources that
use different assumptions and methodologies and have gaps and
may occasionally duplicate coverage. Available data typically relate to
commitments rather than disbursements, so the amount reported may
not equal the amount received by the project owner during a given
year. Changes in exchange rates further complicate the picture. For
these and other reasons, estimates of current climate finance exhibit
considerable uncertainties.
Global total climate finance is estimated at 343 to 385 billion
USD per year for 2010 / 11 (2010 / 11 USD) and 356 to 363 billion USD
per year for 2011 / 12 (2011 / 12 USD), with mitigation accounting for
approximately 95 % of this amount (350 billion USD and 337 billion
USD, respectively) (Buchner etal., 2012, 2013b). This estimate includes
a mix of instruments, e. g., grants, concessional loans, commercial
loans and equity, as well as the full investment in mitigation measures
such as renewable energy generation technologies that also produce
other goods or services
3
. The figures reflect new commitments by capi-
tal managers using a mix of 2010 / 11 and 2011 / 12 data, respectively.
Private finance dominates the total, but its share declined from 74 %
(267billion USD) on average in 2010 and 2011 to 62 % (224 billion
USD) on average in 2011 and 2012 (2010 / 2011 USD and 2011 / 2012
USD) (Buchner et al., 2012, 2013b). Investment in renewable gen-
eration technologies dominates the mitigation investment (Frankfurt
School-UNEP Centre and BNEF, 2012).
Reasonably robust estimates of total climate finance for individual
countries are available for only a few cases, for instance, for Germany
(Jürgens etal., 2012). However, some institutions report on their financ-
ing commitments for climate and environment. Data from 19 develop-
ment banks indicate that commitments of mitigation finance increased
from 51 billion USD in 2011 to 65 billion USD in 2012 with commit-
ments of adaptation finance rising from 6 to 14 billion USD over the
same period (2011 / 2012 USD). Concessional funding provided by pub-
lic development banks plays an important role in financing domestic
climate projects, e. g., in Brazil, China, and Germany.
A growing number of developed and developing countries, including
Bangladesh, Colombia, Indonesia, Nepal, Samoa, Tanzania, Uganda,
and the United States as well as the European Commission, calculates
the share of their annual budget devoted to climate change mitiga-
tion and adaptation often using a methodology known as a Climate
Public Expenditure and Institutional Review (UNDP, 2013a). Country
estimates range from 3 – 15 % of the national budget.
A few estimates of total climate finance flowing to developing coun-
tries are available. Clapp etal. (2012) estimate the total at 70 – 120
billion USD per year based on 2009 – 2010 data (2009 / 2010 USD). Data
from Buchner etal. (2013a) suggest a net flow to developing countries
of the order of 40 to 60billion USD for 2010 and 2011 (2010 / 2011
USD).
4
For 2011 and 2012, North-South flows are estimated at 39
to 62 billion USD (2011 / 2012 USD) (Buchner et al., 2013b). Clapp
et al. (2012) estimate the private investment at 37 – 72 billion USD
(2009 / 2010 USD) per year based on 2009 – 2010 data and Stadelmann
3
Methodology used by Buchner et al. (2012, 2013b): Finance flows are limited to
‘climate-specific finance’, capital flows targeting low-carbon, and climate-resilient
development with direct or indirect mitigation or adaptation objectives / outcomes.
The focus is on current financial flows (upfront capital investment costs and grants
expressed as commitments, so risk management instruments are excluded). Data
are for total rather than incremental investment because incremental investment
requires assumptions on the baseline on a project-by-project basis. The data are
for ‘gross’ investment, the full value of the investment, and reflect commitments
because disbursement data is not widely available. The data are a mix of 2010
and 2011 data, and 2011 and 2012 data, respectively.
4
Buchner et al. (2013) estimate that developed countries mobilized 213 to 255 bil-
lion USD climate finance per year during 2010 and 2011 while 160 to 208 billion
USD climate finance had been committed to climate change projects in developed
countries. Developing countries mobilized 120 to 141 billion USD climate finance
per year during 2010 and 2011 and 162 to 202 billion USD had been commit-
ted to climate change projects in developing countries. Those figures suggest a
net flow to developing countries of the order of 40 to 60 billion USD per year
(2010 / 2011 USD).

12151215
Cross-cutting Investment and Finance Issues
16
Chapter 16
etal. (2013) estimate foreign direct investment as equity and loans in
the range of 10 to 37 billion USD per year based on 2008 – 2011 data
(2010 USD and 2008 USD).
The investment in registered Clean Development Mechanism
(CDM) projects is estimated at over 400 billion USD over the period
2004 to 2012 (2004 – 2012 USD) (UNEP Risø, 2013). Of that amount
almost 80 billion USD was for projects registered during 2011 and
195 billion USD for projects registered during 2012 (2011 USD and
2012 USD). The majority of the investment in CDM projects is private.
Renewable energy projects account for over 70 % of the total invest-
ment. The share of CDM renewable energy projects with some foreign
investment has grown over time, representing almost 25 billion USD in
2011 (2011 USD) (Kirkman etal., 2013).
5
Since 1999 almost 100 carbon funds with a capitalization of 14.2
billion USD have been established (Alberola and Stephan, 2010).
6
Carbon funds are investment vehicles that raise capital to purchase
carbon credits (52 %) and / or invest in emission reduction projects
(23 %). A fund may have only private investors (48 %), only public
investors (29 %) or a mix of both (23 %) (Alberola and Stephan, 2010).
Investment may be restricted to a specific region or project type (e. g.,
REDD+). Financial data, especially for private funds, is often confiden-
tial so the amount of finance provided to developing countries via
carbon funds is not available. Scaling up data from 29 funds on the
amount invested in projects suggests a maximum cumulative invest-
ment of 18 billion USD (1999 – 2009 USD) (Kirkman etal., 2013).
Public climate finance provided to developing countries was esti-
mated at 35 to 49 billion USD per year in 2011 and 2012 (2011 / 2012
USD) (Buchner etal., 2013b).
7
These public funds flow mainly through
bilateral and multilateral institutions
8
. Most of the climate finance is
implemented by development banks, frequently involving the blend-
ing of government resources with their own funds. There are two main
reporting systems for public support in place that are not fully compa-
rable due to differences in respective methodologies.
The Organisation for Economic Co-operation and Development (OECD)
Development Assistance Committee (DAC) reports the amount of offi-
cial development assistance (ODA) committed bilaterally for projects
5
CDM projects sell emission reduction credits, Certified Emission Reductions (CERs),
to developed country buyers, which provide a return to developed country inves-
tors.
6
United Nations Environment Program (UNDP) estimates that in addition up to
6000 private equity funds have been established for the purpose of funding
climate change-related activities (UNDP, 2011).
7
Buchner et al. (2013b) count climate finance provided by bilateral finance institu-
tions, multilateral finance institutions, government bodies, and climate funds as
public flows. The difference between lower- and upper-bound results when taking
the ownership structure of multilateral institutions into account and excluding all
bilateral flows marked as having climate as ‘significant’ objective.
8
Ryan et al. (2012) estimate the annual average finance provided to developing
countries for energy efficiency at 18.9 billion USD in 2010 from bilateral financial
institutions and 4.9 billion USD from multilateral financial institutions over the
period 2008 – 2011.
that have climate change mitigation or adaptation as a ‘principal’ or
‘significant’ objective by its 23 member countries and the European
Commission. The DAC defines ODA as those flows to countries on the
DAC List of ODA Recipients and to multilateral institutions provided
by official agencies or by their executive agencies. Resources must be
used to promote the economic development and welfare of develop-
ing countries as a main objective and they must be concessional in
character, meaning as grants or as concessional loans including a grant
element of at least 25 %, calculated at a rate of discount of 10 %. The
amount is the total funding committed to each project, not the share
of the project costs attributable to climate change (OECD, 2013a).
Researchers have questioned the accuracy of the project classification
(Michaelowa and Michaelowa, 2011; Junghans and Harmeling, 2013).
Bilateral commitments averaged 20 billion USD per year in 2010 and
2011 (2010 / 2011 USD) (OECD, 2013a) and were implemented by
bilateral development banks or other bilateral agencies, provided to
national government directly or to dedicated multilateral climate funds
(Buchner etal., 2012, 2013b).
Seven multilateral development banks (MDBs)
9
reported climate
finance commitments of about 24.1 and 26.8 billion USD in 2011 and
2012, respectively (2011 / 2012 USD). The reporting is activity-based
allowing counting entire projects but also project components. Recipi-
ent countries include developing countries and 13 European Union
(EU) member states. It covers grant, loan, guarantee, equity, and per-
formance-based instruments, not requiring a specific grant element.
The volume covers MDBs’ own resources as well as external resources
managed by the MDBs that are also reported to OECD DAC (such as
contributions to the Global Environment Facility (GEF), Climate Invest-
ment Funds (CIFs), and Carbon Funds) (AfDB etal., 2012a; b, 2013).
Under the UNFCCC, climate finance is not well-defined. Annex II
Parties committed to provide new and additional financial resources
to cover the “agreed full incremental costs” of agreed mitigation mea-
sures implemented by developing countries (Article 4.3), to “assist
the developing country Parties that are particularly vulnerable to the
adverse effects of climate change in meeting costs of adaptation”
(Article 4.4) and to cover the agreed full costs incurred by developing
countries for the preparation of their national communications (Article
4.3) (UNFCCC, 1992). None of these terms are operationally defined
(Machado-Filho, 2011). These commitments are reaffirmed by the Kyoto
Protocol (UNFCCC, 1998, Art. 11). The Conference of Parties (COP) has
agreed that funds provided to developing country Parties may come
from a wide variety of sources, public, and private, bilateral and multi-
lateral, including alternative sources (UNFCCC, 2010, para. 99).
AnnexII Parties report the financial resources they provide to develop-
ing countries through bilateral and multilateral channels for climate
9
African Development Bank (AfDB), the Asian Development Bank (ADB), the Euro-
pean Bank for Reconstruction and Development (EBRD), the European Investment
Bank (EIB), the Inter-American Development Bank (IDB), the World Bank (WB) and
the International Finance Corporation (IFC).

12161216
Cross-cutting Investment and Finance Issues
16
Chapter 16
change action to increase transparency about public flows of climate
finance vis-à-vis expectations and needs. The latest summary of the
AnnexII reports on their provided climate finance indicates that they
provided a total of 58.4 billion USD for the period 2005 through
2010, an average of nearly 10 billion USD per year (2005 – 2010 USD)
(UNFCCC, 2011a).
10
Most of the funds provided are concessional loans
and grants. In addition, a range of developed countries promised FSF
of about 10 billion USD per year from 2010 to 2012 (2010 / 2011 / 2012
USD) (see Section16.2.1.3).
11
Operating entities of the financial mechanism of the UNFCCC deal
with less than 10 % of the climate finance reported under the Conven-
tion, although that could change once the Green Climate Fund (GCF)
becomes operational. AnnexII Party contributions to the Trust Fund of
the GEF, the Special Climate Change Fund (SCCF) and the Least Devel-
oped Countries Fund (LDCF) amounted to about 3.3billion USD for
2005 through 2010, an average of less than 0.6 billion USD per year
(2005 – 2010USD) (UNFCCC, 2011a). Most of the funds are used for
mitigation. The Adaptation Fund derives most of its funds from the sale
of its share of the CERs issued for CDM projects
12
.
16�2�1�2 Current sources of climate finance
Climate finance comes from the sources of capital shown in Figure
16.1 including capital markets, carbon markets, and government bud-
gets. Most government funding comes from general revenue but some
governments also raise revenue from sources — carbon taxes and auc-
tioned GHG-emission allowances — that have mitigation benefits. Most
corporate funding comes from corporate cash flow including corporate
borrowing, often called balance-sheet finance (Frankfurt School-UNEP
Centre, 2013).
13
Household funding comes from household income from
wages, investments, and other sources. Governments, corporations, and
households can all access capital markets to mobilize additional funds.
10
Although there is an agreed reporting format, the UNFCCC Secretariat notes
that many data gaps and inconsistencies persist in the reporting approaches of
AnnexII Parties. The information is compiled by the UNFCCC Secretariat from
AnnexII national communications. The figures represent ‘as committed’ or ‘as
spent’ currency over the 6 years. The procedures used by different countries and
the Secretariat to convert currencies into USD are not known.
11
Although COP took note of the ´fast start finance’ (FSF) commitment in paragraph
95 of Decision 1 / CP.16 (UNFCCC, 2010) and the funds committed have been
reported annually to the UNFCCC, the FSF is not formally climate finance under
the UNFCCC.
12
Currently the only international levy is the 2 % of the CERs issued for most CDM
projects provided to the Adaptation Fund. The Fund sells the CERs and uses the
proceeds for adaptation projects in developing countries. Sale of CERs gener-
ated revenue of over 90 million USD for FY 2010 (2010 / 2011 USD) and over 50
million USD for FY 2011 (World Bank, 2012a). In December 2012 Parties agreed
to extend the share of proceeds levy to the issuance of emission reduction unit
(ERUs) and the first international transfers of AAUs (UNFCCC, 2012a, para. 21).
13
General revenue includes revenue collected from all taxes and charges imposed
by a government. Balance sheet finance means that a new investment is financed
by the firm rather than as a separate project. The firm may seek external funding
(debt and / or equity) but that funding is secured by the operations of the firm
rather than the new investment.
This section summarizes estimates of the revenue currently generated
by carbon taxes and auctioned GHG-emission allowances. Fuel taxes,
fossil fuel royalties, and electricity charges can be converted to CO
2
eq
charges but they are excluded here because they are usually imple-
mented for different policy goals.
Carbon taxes generate about 7 billion USD in revenue annually
mainly in European countries (2010 / 2011 USD).
14
Denmark, Finland,
Germany, Ireland, Italy, Netherlands, Norway, Slovenia, Sweden, Swit-
zerland, and the United Kingdom — generated about 6.8 billion USD in
2010 (2010 USD) and 7.3 billion USD (2011 USD) in 2011. India
15
, Aus-
tralia, and Japan introduced carbon taxes in July 2010, July 2012, and
October 2012, respectively. In some countries, part or all of the rev-
enue is dedicated to environmental purposes or reducing other taxes;
none is earmarked for international climate finance.
Auctioned allowances, fixed price compliance options, and the interna-
tional sale of surplus Assigned Amount Units (AAUs) generate about
2 billion USD per year for national governments (2010 / 2011 USD).
Among the 30 countries participating in the EU emissions trading
scheme, Austria, Germany, Hungary, Ireland, the Netherlands, Norway,
and the United Kingdom auctioned some emission allowances during
the second (2008 – 2012) phase (European Commission, 2012). Buch-
ner etal. (2011, 2012) estimate auction revenue at 1.4 and 1.6 bil-
lion USD for 2010 and 2011 (2010 / 2011 USD). Germany has so far
earmarked a portion of its auction revenue for international climate
finance (Germany Federal Ministry for the Environment Nature Con-
servation and Nuclear Safety, 2012). New Zealand collected 1.25 and
1.42 million USD for 2010 (6 months) and 2011, respectively, from its
fixed price compliance option of 10.8 USD per tonne of CO
2
(15 NZD)
(New Zealand Ministry for the Environment, 2012).
Several eastern European countries (Estonia, Czech Republic, Poland,
and Russia) sell surplus AAUs to generate revenue. Others such as Bul-
garia, Latvia, Lithuania, Slovakia, and Ukraine, sell their surplus AAUs
to fund Green Investment Schemes that support domestic emission
reduction measures (Linacre etal., 2011).
16
Revenue rose from 276 mil-
lion USD in 2008 (2008 USD) to 2 billion USD in 2009 (2009 USD) and
then declined to less than 1.1 billion USD in 2010 (2010 USD) (Kossoy
and Ambrosi, 2010; Linacre etal., 2011; Tuerk etal., 2013). Buchner at
al. (2011, 2012) estimate the revenue at 580 and 240 million USD for
2010 and 2011, respectively (2010 and 2011 USD).
14
Revenue from taxes explicitly named carbon taxes in the OECD database of
environmentally related taxes, available at http: / / www2. oecd. org / ecoinst /
queries / index.htm.
15
In India, the carbon tax is on coal only.
16
The Green Investment Schemes are a source of climate finance for these countries.

12171217
Cross-cutting Investment and Finance Issues
16
Chapter 16
16�2�1�3 Recent developments
Climate finance has been affected by the financial crisis of late 2008,
the subsequent stimulus packages and the FSF commitment of 30 bil-
lion USD for 2010 – 2012 made by developed countries in December
2009 for climate action in developing countries.
The financial crisis in late 2008 reduced investment in renewable
energy (Hamilton and Justice, 2009). In late 2008 and early 2009,
investment in renewable generation fell disproportionately more than
that in other types of generating capacity (IEA, 2009). Global invest-
ment in renewable energy fell 3 % during 2009 but rebounded strongly
in 2010 and 2011. In developed countries, where the financial crisis hit
hardest, investment dropped 14 % while renewable energy investment
continued to grow in developing countries (Frankfurt School-UNEP
Centre and BNEF, 2012).
In response to the financial crisis, Group of Twenty Finance Ministers
(G20) governments implemented economic stimulus packages
amounting to 2.6 trillion USD. Of that amount, 180 to 242 billion USD
was low-carbon funding (2008 and 2009 USD) (IEA, 2009; REN21,
2010). The stimulus spending supported the rapid recovery of renewable
energy investment by compensating for reduced financing from banks.
Some countries facing large public sector deficits scaled down green
spending when the economy started recovering (Eyraud etal., 2011).
At the UNFCCC in Copenhagen in 2009, developed countries committed
to provide new and additional resources approaching 30 billion USD of
FSF to support mitigation and adaptation action in developing countries
during 2010 – 2012 (UNFCCC, 2009a). The sum of the announced com-
mitments exceeds 33 billion USD (UNFCCC, 2011b, 2012b; c, 2013a)
17
.
Japan, United States, United Kingdom, Norway, and Germany being the
five biggest donors have reported commitments amounting to 27 billion
USD (2010 / 2011 / 2012 USD). Nakooda et al. (2013) finds that around
45 % have been provided as grants and around 47 % in the form of
loans, guarantees, and insurance. Approximately 61 % of the funds had
been committed for mitigation, 10 % for REDD+, ,18 % for adaptation,
9 % for multiple objectives and for 2 % of the funding the purpose is
unknown. The funders reported commitments to recipient country gov-
ernments via bilateral channels (33 %), multilateral climate funds (20 %),
recipient countries companies (12 %), and multilateral institutions (9 %).
Data on actual disbursements is not available to date because of the
multi-year time lag between commitment and disbursement.
The announced pledges triggered questions as to whether they were
‘new and additional’ as promised (Fallasch and De Marez, 2010; BNEF,
2011). Some countries explain the basis on which they consider their
pledge to be ‘new and additional’. Criteria have been proposed that
17
The information is compiled by the UNFCCC Secretariat from national reports
on FSF. The figures represent ‘as committed’ currency over the three years. The
procedures used by different countries and the Secretariat to convert currencies
into USD are not known.
indicate, when applied to the pledges, that proportions ranging from
virtually none to almost all are new and additional (Brown etal., 2010;
Stadelmann etal., 2010, 2011b). For Germany, Japan, the United King-
dom, and the United States annual FSF contributions were significantly
higher than the 2009 expenditure related to climate activities in devel-
oping countries (Nakooda etal., 2013).
16�2�2 Future low-carbon investment
As noted in Chapter 6, the stabilization of GHG concentrations will ulti-
mately require dramatic changes in the world’s energy system, includ-
ing a dramatic expansion in the deployment of low-carbon energy
sources. This change will require significant shifts in global investment
in the energy, land use, transportation, and infrastructure sector. The
future investment flows summarized in this section are based on sev-
eral large-scale analyses conducted over the past few years. For the
most part these analyses explore scenarios to achieve specified tem-
perature or concentration goals. Hence, the estimates of investment
flows drawn from these studies should not be interpreted as forecasts,
but rather, as some probable future states of the world.
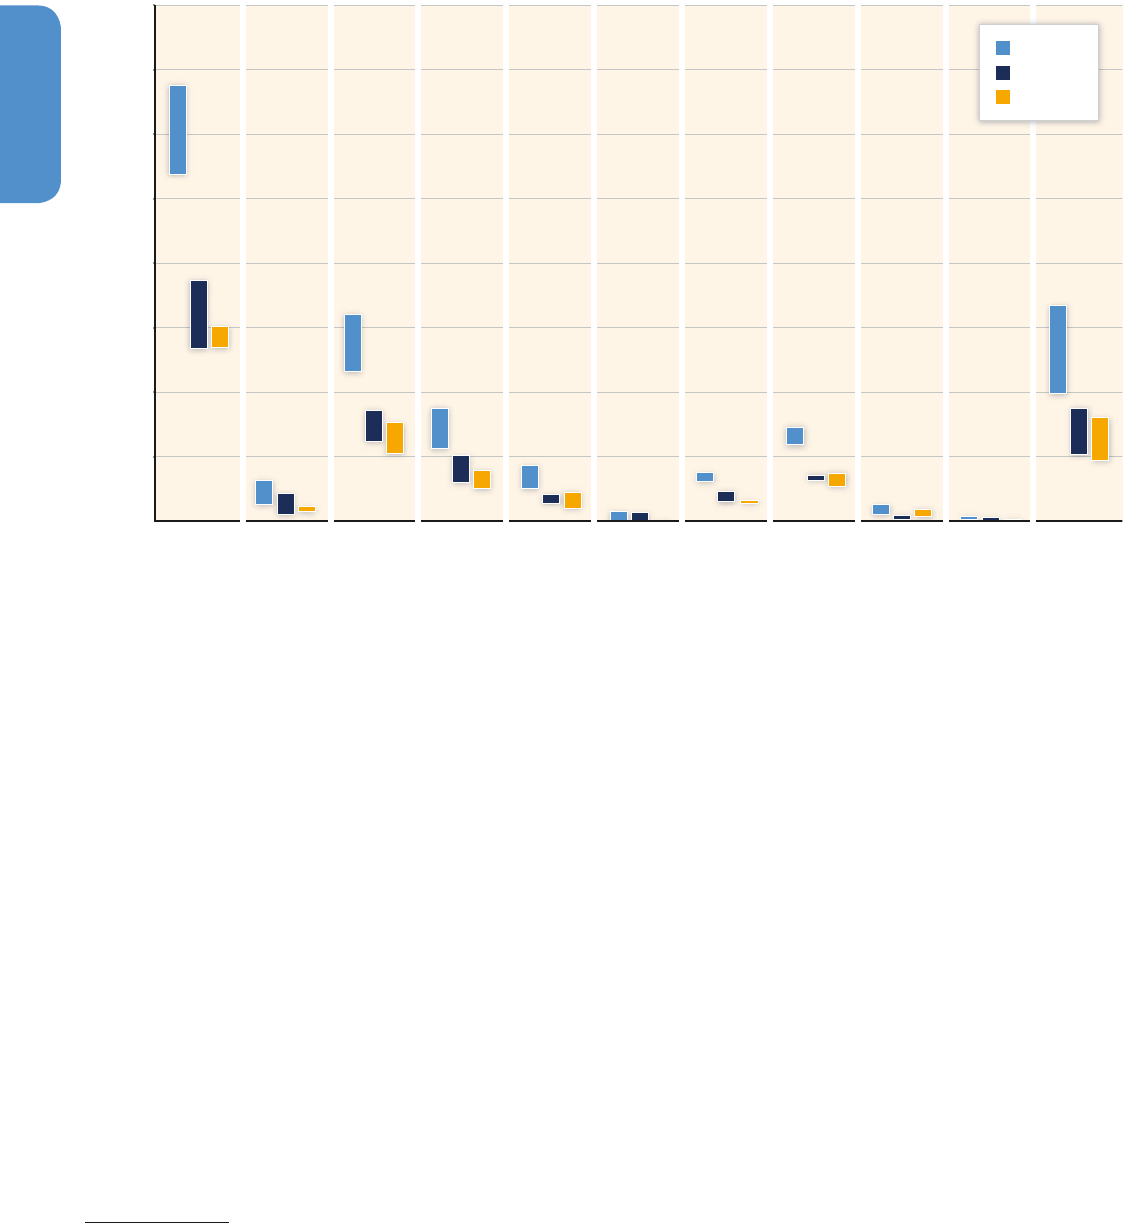
Figure 16.2 presents estimates of baseline, i. e., current investment
in energy supply sub-sectors as a reference for the following consid-
erations. It illustrates the very substantial nature of investments in
today’s energy sector with global total annual investment at about
USD
2010
1200 billion and very strong roles for investments in fossil fuel
extraction, transmission and distribution (T&D), and electricity genera-
tion.
16�2�2�1 Investment needs
While a large number of studies and many modelling comparison
exercises have assessed technological transformation pathways and
the macroeconomic costs of transforming the global economy, only a
handful of studies estimate the associated investment needs. Section
16.2.2.2 summarizes available estimates of investment needs under
climate policy between 2010 – 2029 and 2030 – 2049, for the world as
a whole and for non-OECD and OECD countries. Models and scenarios
differ so the focus is on incremental investment, i. e., the differences in
the estimated investment between the reference and mitigation sce-
narios.
18
It must also be noted that the model estimates crucially rely
on assumptions about the future costs of technologies and of subsi-
dies, on the possibility of nuclear phaseout in some countries, and on
the mitigation policies already included in the reference scenarios.
Without climate policy, investments in the power sector would
mainly be directed towards fossil fuels, especially in non-OECD coun-
tries that rely on low-cost coal power plants to supply their growing
18
Adaptation costs and economic losses from future climate change are not consid-
ered in any of these estimates.
12181218
Cross-cutting Investment and Finance Issues
16
Chapter 16
demand for electricity. At the global level, fossil fuel-based power
generation would require an average annual investment of 182 (95
to 234) billion USD in 2010 – 2029 and 287 (158 to 364) billion USD
in 2030 – 2049;
19
the bulk of investments (roughly 80 %) goes to non-
OECD countries.
20
There is greater uncertainty in models about the
future of renewable and nuclear power without climate policy. Mod-
elled global investment in renewable power generation is expected
to increase over time from 123 (31 to 180) billion USD per year in
2010 – 2029 to 233 (131 to 336) billion USD over 2030 – 2049. Nuclear
power generation would attract 55 (11 to 131) billion USD annually in
2010 – 2029 and 90 (0 to 155) billion USD per year in 2030 – 2049.
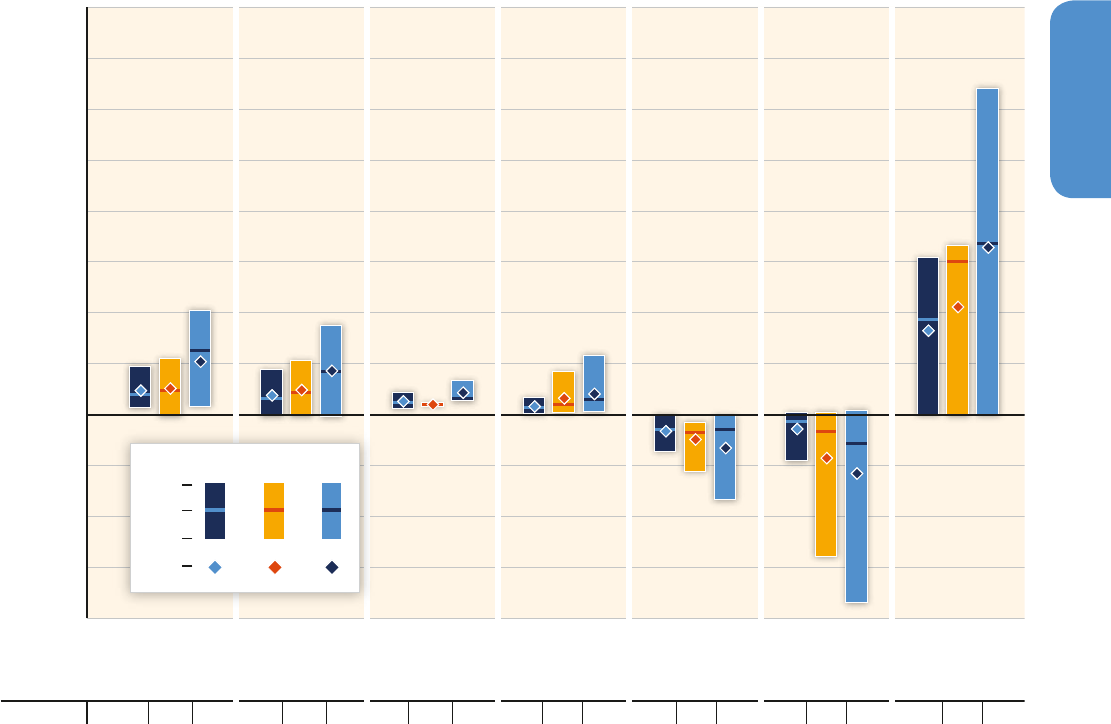
The introduction of an emission reduction target in the models
abruptly changes the investment pattern. Figures 16.3 and 16.4 report
the investment change for major power generation technologies,
fossil fuel extraction, and for end-use energy efficiency, for emission
scenarios compatible with a long-term target of keeping mean global
temperature increase below 2 °C in 2100.
21
Although the policy targets
19
The mean should not be considered as an expected value. It is not possible to
attribute any probability distribution to models’ outcomes. Therefore policymakers
face pure uncertainty in face of future investment needs. The range is presented to
provide information on the degree of uncertainty in the literature.
20
See captions of Figures 16.3 and 16.4 for a list of the studies surveyed.
21
Also in this case, the mean and median are used as synthetic indicators having no
predictive power.
are not identical, they are close enough to allow a broad comparison
of results. The dispersion across estimated emission reductions over
2010 – 2029 and 2010 – 2049 is mainly due to differences in reference
scenario emissions and because models choose different optimal emis-
sion trajectories among the many compatible with the long-term cli-
mate goal.
The results of an analysis of investment estimates in Figures 16.3 and
16.4 show that climate policy is expected to induce a major reallo-
cation of investments in the power sector. Investments in fossil-fired
power plants (without CCS) were equal to about 137 billion USD per
year in 2010. Investment would decline by 30 (2 to 166) billion USD
per year (about – 20 % for the median) during the period 2010 – 2029,
compared to the reference scenarios. Investment in low-emissions
generation technologies (renewable, nuclear, and electricity genera-
tion with CCS) would increase by 147 (31 to 360) billion USD per year
(about 100 % for the median) during the same period.
Based on a limited number of studies (McKinsey, 2009; IEA, 2011; Riahi
et al., 2012), annual incremental investments until 2030 in energy-
efficiency investments in the building, transport, and industry sector
increase by 336 (1 to 641) billion USD. The only three studies with sec-
toral detail in end-use technologies show an increase of investments
of 153 (57 to 228) billion USD for the building sector, 198 (98 to 344)
billion USD for the transport sector, 80 (40 to 131) billion USD for the
Present Level of Investment in Energy Supply [Billion USD
2010
/yr]
0
200
400
600
800
1000
1200
1400
1600
Total Energy
Sector
Other Energy
Technologies
Total Electricity
Sector
Total Electricity
Generation
Renewables Nuclear Total Fossil
Power Plants
Electricity
T&D
Fossil Liquid
Fuels
Liquid Biofuels Extraction of
Fossil Fuels
World
OECD
Non-OECD
Figure 16�2 | Present level of investment in energy supply. Note: The bars indicate the minimum and maximum level of investments found in the literature. Ranges result from
different sources of market information and differing definitions of the investment components to be included. Source: From McCollum etal. (2013) based on data from IEA World
Energy Outlook 2011 (IEA, 2011) and GEA (Riahi etal., 2012).
12191219
Cross-cutting Investment and Finance Issues
16
Chapter 16
industry sector. Incremental investments in end-use technologies are
particularly hard to estimate and the number of studies is limited
(Riahi etal., 2012). Results should therefore be taken with caution.
While models tend to agree on the relative importance of investments
in fossil and non-fossil power generation, they differ with respect to
the mix of low-emission power generation technologies and the over-
all incremental investment. This is mainly due to different reference
scenarios (e. g., population, economic growth, exogenous technologi-
cal progress), and assumptions about (1) the structure of the energy
system and the costs of reducing the energy intensity of the economy
versus reducing the carbon intensity of energy, (2) the investment costs
of alternative technologies over time, and (3) technological or politi-
cal constraints on technologies. Limits to the deployment of some key
technology options or the presence of policy constraints (e. g., delayed
action, limited geographical participation) would increase investment
needs (Riahi etal., 2012; McCollum etal., 2013).
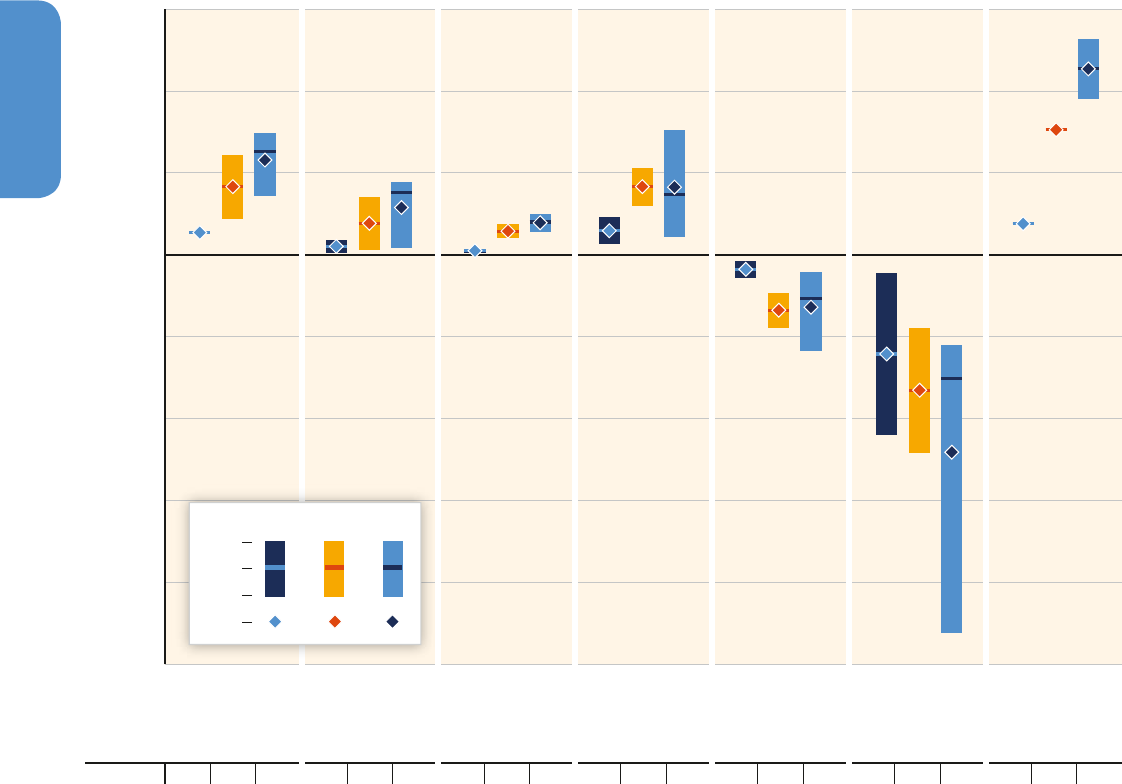
Higher energy efficiency, technological innovation in transport, and
the shift to low-emission generation technologies — all contribute to
a drastic reduction in the demand for fossil fuels, thus causing a sharp
decline in investment in fossil fuel extraction, transformation, and
transportation. Scenarios from a limited number of models suggest
that average annual investment reduction in 2010 – 2029 would be
equal to 56 (– 8 to 369) billion USD. The contraction would be sharper
in 2030 – 2049, in the order of 451 (332 to 1385) billion USD per year.
Figure 16�3 | Change of average annual investment in mitigation scenarios (2010 – 2029). Investment changes are calculated by a limited number of model studies and model
comparisons for mitigation scenarios that stabilize concentrations within the range of 430 – 530 ppm CO
2
eq by 2100 compared to respective average baseline investments. Note:
The vertical bars indicate the range between minimum and maximum estimate of investment changes; the horizontal bar indicates the median of model results. Proximity to this
median value does not imply higher likelihood because of the different degree of aggregation of model results, low number of studies available, and different assumptions in the
different studies considered. The numbers in the bottom row show the total number of studies available in the literature. Sources: UNFCCC (2008). IEA (2011): 450 Scenario (450)
relative to the Constant Policies Scenario (CPS). The CPS investment in CCS is also included under Coal and Gas (retrofitting); World investment in biofuels includes international
bunkers; investment in solar photovoltaic (PV) in buildings is attributed to power plants in supply-side investment. Riahi etal. (2012): the Global Energy Assessment Mix scenario
(GEA-Mix) relative to the GEA reference scenario. Carraro etal. (2012): 460 ppm CO
2
eq in 2100 (t460) relative to reference scenario. McCollum etal. (2013): the Low Climate
Impact Scenarios and Implications of Required Tight Emission Control Strategies (LIMITS), RefPol-450 scenario (2.8 W / m
2
in 2100) relative to the reference scenarios, mean of six
models. McKinsey (2009): data obtained from Climate Desk, S2015 scenario with full technological potential, 100 % success rate, negative lever of costs, beginning of policy in
2015 | Regions: OECD, non-OECD, and World.
-400
-300
-200
-100
0
100
200
300
400
500
600
700
800
Power Plants
with CCS
Renewables Energy Efficiency
Across Sectors
Extraction of
Fossil Fuels
Fossil Fuel
Power Plants
without CCS
NuclearTotal Electricity
Generation
# of Studies: 43444444 3545
4545455 44
Changes in Annual Investment Flows 2010-2029 [USD
2010
Billion /yr]
Max
Median
Mean
Min
Non-OECD
WorldOECD
12201220
Cross-cutting Investment and Finance Issues
16
Chapter 16
All models that provide data on investments for fossil fuel extraction
show that overall investments in energy supply would decrease against
the baseline trends in scenarios consistent with the 2 °C limit (IEA,
2011; Carraro etal., 2012; Riahi etal., 2012; McCollum etal., 2013).
According to a range of models, climate policy would thus substan-
tially change the allocation of baseline energy investments rather than
increase overall demand for energy investment.
Models with a separate consideration of energy-efficiency measures fore-
see the need for significant incremental investment in energy efficiency
in the building, transport, and industry sector in addition to the realloca-
tion of investment from high-carbon to low-carbon power supply.
There is wide agreement among model results on the necessity to
ramp up investments in research and development (R&D) to increase
end-use energy efficiency and to improve low-emission generation
energy carriers and energy transformation technologies. Estimates of
the additional funding needed for energy-related R&D range from
4.5 to 78 billion USD per year during 2010 – 2029 (UNFCCC, 2007;
Carraro etal., 2012; McCollum etal., 2013) and from 115 to 126
billion USD per year in 2030 – 2049 (Carraro etal., 2012; Marangoni
and Tavoni, 2013; McCollum etal., 2013). Because of the need for
new low-carbon alternatives, investments in R&D are higher in case
of nuclear phaseout and other technological constraints (Bosetti
etal., 2011).
Figure 16�4 | Change of average annual investment in mitigation scenarios (2030 – 2049). Investment changes are calculated by a limited number of model studies and model
comparisons for mitigation scenarios that stabilize concentrations within the range of 430 – 530 ppm CO
2
eq by 2100 compared to respective average baseline investments. Note:
The vertical bars indicate the range between minimum and maximum estimate of investment changes; the horizontal bar indicates the median of model results. Proximity to this
median value does not imply higher likelihood because of the different degree of aggregation of model results, low number of studies available, and different assumptions in the
different studies considered. The numbers in the bottom row show the total number of studies available in the literature. Sources: Riahi etal. (2012): the Global Energy Assessment
Mix scenario (GEA-Mix) relative to the GEA reference scenario. Carraro etal. (2012): 460 ppm CO
2
eq in 2100 (t460) relative to reference scenario. McCollum etal. (2013): the Low
Climate Impact Scenarios and Implications of Required Tight Emission Control Strategies (LIMITS), RefPol-450 scenario (2.8 W / m
2
in 2100) relative to the reference scenarios, mean
of six models. Regions: OECD, non-OECD, and World.
# of Studies: 21222222 1323
2323
233 22
Max
Median
Mean
Min
Non-OECD
WorldOECD
Power Plants
with CCS
Fossil Fuel
Power Plants
without CCS
-1500
-1200
-900
-600
-300
0
300
600
900
Total Electricity
Generation
Renewables Energy Efficiency
Across Sectors
Extraction of
Fossil Fuels
Nuclear
Changes in Annual Investment Flows 2030-2049 [Billion USD
2010
/yr]

12211221
Cross-cutting Investment and Finance Issues
16
Chapter 16
Land-use is the second largest source of GHG emissions and within
land use, tropical deforestation is by far the largest source (see Chap-
ters 5 and 11). Efforts to stabilize atmospheric concentrations of GHGs
will require investments in land use change (LUC) as well as in the
energy sector.
Kindermann etal. (2008) use three global forestry and land use models
to examine the costs of reduced emissions through avoided deforesta-
tion over the 25 year period from 2005 – 2030.
22
The models’ results
suggest substantial emission reductions can be achieved. The mod-
els estimate that 1.6 to 4.3 GtCO
2
per year could be reduced for 20
USD tCO
2
with the greatest reductions coming from Africa followed
by Central and South America and Southeast Asia. They also use the
models to estimate the costs to reduce deforestation by between 10 %
and 50 % of the baseline. Deforestation could be reduced by 10 %
(0.3 – 0.6 GtCO
2
per year) over the 25-year period for an investment
of 0.5 to 2.1 billion USD per year in forest preservation activities, and
a 50 % reduction (1.5 – 2.7 GtCO
2
per year) could be achieved for an
investment of 21.2 to 34.9 billion USD per year. This is comparable to
what has been found by UNFCCC (2008) and McCollum etal. (2013).
Investment needs in other sectors commonly relate to energy-effi-
ciency measures included above. Information on global or regional
investment needs to abate process emissions or non-CO
2
emissions in
sectors like the waste, petroleum, gas, cement, or the chemical industry
is virtually unavailable. For instance, McKinsey (2009) does not pro-
vide information that could be separated from energy-efficiency mea-
sures in the sectors. An indicative estimate for the waste sector can
be derived from Pfaff-Simoneit (2012) suggesting investment needs of
approximately 10 – 20 billon USD per year if access to a modern waste
management system were to be provided for an additional 100million
people per year.
16�2�2�2 Incremental costs
Incremental costs can be calculated for an individual project, a pro-
gramme, a sector, a country, or the world as a whole. The incremental
costs reflect the incremental investment and the change of operating
and maintenance costs for a mitigation or adaptation project in com-
parison to a reference project. It can be calculated as the difference of
the net present values of the two projects. Estimates of the incremen-
tal costs of mitigation measures for key sectors or the entire economy
have been prepared for over 20 developing countries (Olbrisch etal.,
2011). When estimates of both the incremental costs and the incre-
mental investment are available, the former is generally lower because
of the annualization of incremental investments for the calculation of
incremental costs.
22
The models used are the Dynamic Integrated Model of Forestry and Alternative
Land Use (DIMA) (Roktiyanskiy et al., 2007), the Generalized Comprehensive
Mitigation Assessment Process Model (GCOMAP) (Sathaye et al., 2006), and the
Global Timber Model (GTM) (Sohngen and Mendelsohn, 2003).
From an economic perspective, macroeconomic incremental costs can
be defined as the lost gross domestic product (GDP). This measure
provides an aggregate cost of the mitigation actions (estimates pro-
vided in Chapter 6), but it does not provide information on the specific
micro-economic investments that must be made and costs incurred to
meet the mitigation commitments. This distinction is important if inter-
national climate finance commitments will be implemented through
institutions designed to provide financial support for specific invest-
ments and costs rather than macro-level compensation.
Other than on the project-level, investment needs are thus frequently
only a fraction of incremental costs on the level of the macro-economy.
This difference is largely due to reduced growth of carbon-constrained
economies in many models. Adaptation costs and economic losses
from future climate change, which are not considered in these esti-
mates, should be lower for climate policy scenarios than in the refer-
ence scenario.
16�2�3 Raising public funding by developed
countries for climate finance in
developing countries
Comparison of the model estimates of future mitigation investment
(Section 16.2.2) with the current level of global total climate finance
(Section 16.2.1.1) indicates that global climate finance needs to be
scaled up. Increased financial support by developed countries for
mitigation (and adaptation) in developing countries will be needed
to stimulate the increased investment. This section reviews possible
sources of additional funds that could be implemented by developed
country governments to finance mitigation in developing countries.
In December 2009, developed countries committed to a goal of mobi-
lizing jointly 100 billion USD a year by 2020 to address the needs of
developing countries in the context of meaningful mitigation actions
and transparency on implementation. This funding will come from a
wide variety of sources, public and private, bilateral and multilateral,
including alternative sources of finance (UNFCCC, 2009a).
23
This goal
has been recognized by the COP (UNFCCC, 2010, para. 98). This rec-
ognition does not change the commitments of AnnexII Parties speci-
fied in Article 4 of the Convention to provide financial resources for
climate-related costs incurred by developing countries.
Studies by the High-level Advisory Group on Climate Change Financ-
ing (AGF) (AGF, 2010) and the World Bank Group etal. (2011) at the
request of G20 finance ministers have analyzed options for mobilizing
100 billion USD per year by 2020. The AGF concluded that it is chal-
lenging but feasible to reach the goal of mobilizing 100 billion USD
23
There is currently no definition of which ‘climate’ activities count toward the 100
billion USD, what ‘mobilizing’ means, or even which countries are covered by this
commitment (Caruso and Ellis, 2013).
12221222
Cross-cutting Investment and Finance Issues
16
Chapter 16
annually for climate actions in developing countries. Both reports con-
clude that a mix of sources is likely to be required to reach the goal.
Both reports estimate the revenue that could be mobilized in 2020 by
various options to finance climate action in developing countries in the
context of a carbon price of 25 USD per tonne of CO
2
eq
in AnnexII
countries. The feasibility of the options was not assessed. For some
options, only a fraction of the revenue was assumed to be available for
international climate finance. Their estimates of the international cli-
mate finance that could be generated by each option, together with
other estimates, where available, are summarized in Table 16.1. Only
options to mobilize public funds and that yield mitigation benefits are
included in the table; options for increased borrowing by multilateral
institutions and mobilizing more private finance are excluded.
Virtually all of the options put a price on GHG emissions thus providing
a mitigation benefit in addition to generating revenue. The options are
grouped into the following categories (Haites and Mwape, 2013):
1. Options that contribute to developed countries national budgets,
dependent on national decisions;
2. Options that contribute to national budgets, dependent on interna-
tional agreements; and
3. Funds collected internationally pursuant to an international agree-
ment.
Funds mobilized by options in the first two categories flow into
national budgets, so the amount allocated for international climate
finance depends on national decisions. In contrast, funds mobilized by
options in the third category go directly to an international fund.
The AGF and G20 reports assume for many options that only small
fraction of the total revenue mobilized is dedicated to international
climate finance. Hence, these options would mobilize revenue to meet
the international climate finance goal and at the same time mobilize
substantial revenue for domestic use by Annex II governments. The
domestic share of the revenue could be used by AnnexII treasuries to
reduce deficits and debt, or to reduce existing distortionary taxes and
so help stimulate economic growth.
Global modelling estimates
Using integrated models, it is possible to estimate the potential car-
bon revenues when all emissions are taxed or all permits are auc-
tioned. These estimates reflect a scenario in which all world regions
commit to reduce GHG emissions using an efficient allocation of
abatement effort, i. e., globally equal marginal abatement costs.
Therefore, it should be used to gain insights rather than exact rev-
enue forecasts.
From the analysis of scenarios already presented in this chapter (Car-
raro etal., 2012; Calvin etal., 2012; McCollum etal., 2013) it is pos-
sible to derive the following messages:
Carbon revenues are potentially large, in the order of up to 200 billion
USD each in China, the European Union and the United States in 2030.
At the global level, they could top 1600 billion USD in 2030.
Table 16�1 | Summary of potential sources of public funds for climate finance in 2020.
Option Projected amount generated in 2020 (billion USD
2010
/ year) Share assumed to be dedicated to international climate finance
1) Options that contribute to developed country national budgets, dependent on national decisions
Domestic auctioned allowances AGF: 125 – 250
b
; G20: 250 AGF: 2 – 10 %; G20: 10 %
Domestic carbon tax
c
AGF: 250 AGF: 4 %
Phase out of fossil fuel subsidies AGF: 8; G20: 40 – 60 AGF: 100 %; G20: 15 – 25 %
Higher fossil fuel royalties AGF: 10 AGF: 100 %
Wires charge on electricity generation AGF: 5 AGF: 100 %
2) Options that contribute to national budgets, dependent on international agreements
Border carbon cost levelling Grubb 2011: 5*
Financial transactions tax AGF: 2 – 27 AGF: 25 – 50 %
3) Funds collected internationally pursuant to an international agreement
Extension of the ‘share of proceeds’ AGF: 38 – 50 AGF: 2 – 10 %
Auctioning a portion of AAUs AGF: 125 – 250
b
AGF: 2 – 10 %
Carbon pricing for international aviation***,
a
UNFCCC: 10 – 25**; AGF: 6; G20: 13 AGF: 25 – 50 %; G20: 33 – 50 %
Carbon pricing for international shipping***,
a
UNFCCC: 10 – 15**; AGF: 16 – 19; G20: 26 AGF: 25 – 50 %; G20: 33 – 50 %
Notes: AGF, G20, and UNFCCC refer to estimates from AGF (2010), World Bank Group etal. (2011) and UNFCCC (2007), respectively.* = Date not specified; ** = 2006 USD; ***
Could fall into category 2 depending upon the method of implementation;
a
The AGF and G20 estimates for international aviation and international shipping assume that a substan-
tial fraction (30 to 50 %) of the global revenue is allocated to developing countries.
b
The AGF combines auctioned AAUs and auctioned domestic allowances, here half of the total is
included in each category;
c
The AGF estimates revenue of 10 billion USD per 1 USD tax per tonne of CO
2
, that is equivalent to potential revenue of 250 billion USD and a 4 % share
for international climate finance as reported here. Sources: Compiled from AGF (2010), World Bank Group etal. (2011), UNFCCC (2007), and Grubb (2011).

12231223
Cross-cutting Investment and Finance Issues
16
Chapter 16
Carbon revenues may peak in the mid-term and decline in the long-
term, as decreasing emissions (the tax base) more than offset the
increase in the carbon price (Carraro et al., 2012). In regions with
lower marginal abatement costs, the tax base shrinks faster so carbon
revenues fall faster. Fast-growing regions may see growing carbon rev-
enues for several decades more.
Scenarios and / or regions in which absorption of emissions — e. g., by
means of bioenergy with CCS — plays an important role may exhibit
net negative emissions. This implies net reduction of carbon revenues
so governments must finance net negative emissions using either the
general budget or international funding (Carraro etal., 2012).
16.3 Enabling environments
This section highlights the importance of a supportive enabling
environment in facilitating low-carbon investments. The concept of
enabling environment is not clearly defined, so it has many different
interpretations. One is government policies that focus on “creating
and maintaining an overall macroeconomic environment” (UNCTAD,
1998).
24
Another (Bolger, 2000), interprets an ‘enabling environment’
as the wider context within which development processes take place,
i. e., the role of societal norms, rules, regulations, and systems. This
environment may either be supportive (enabling) or constraining.
According to Stadelmann and Michaelowa (2011), capacity build-
ing and enabling environment are separate but interrelated con-
cepts. Capacity building targets knowledge and skills gaps, while the
enabling environment for low-carbon business activities is “the overall
environment including policies, regulations and institutions that drive
the business sector to invest in and apply low-carbon technologies and
services.” According to this definition, the enabling environment has
three main components: (1) the core business environment, which is
relevant for all types of businesses, e. g., tax regime, labour market, and
ease of starting and operating a business; (2) the broader investment
climate, including education, financial markets, and infrastructure,
which is partially low-carbon related, e. g., via climate change educa-
tion or investments in electricity grids; and (3) targeted policies that
encourage the business sector to invest in low-carbon technologies.
Capacity building can also be seen as a subcomponent of an enabling
environment (UNFCCC, 2009b) as it aims to improve the enabling envi-
ronment by overcoming market, human, and institutional capacity bar-
riers. Support for capacity building can increase the probability that the
recipient country will succeed in implementing mitigation policies, and
hence may reduce the total funding needed (Urpelainen, 2010).
24
For enabling environments for technology transfer see McKenzie Hedger et al.
(2000).
Reliability and predictability are important elements of an enabling
environment. While stable and predictable government policies reduce
uncertainty about expected return on investment, frequent and unpre-
dictable changes to policies can undermine market efficiency (Blyth
etal., 2007; Brunner etal., 2012). Predictability and stability require
well-established legal institutions and rule of law. Institutional capac-
ity across sectors and at various levels is also important (Brinkerhoff,
2004).
In their econometric examination, Eyraud etal. (2011) found that low-
ering the cost of capital is particularly effective in boosting investment
in low-carbon activities. Hence, macro-economic factors and policy
regulatory frameworks that are good for private investment as a whole
are also important determinants of climate investment. Put differently,
obstacles that impede private investment also hamper investment
in low-carbon technologies. More elements related to the drivers of
low-carbon investments, which are part of enabling environments, are
found in the next sub-section.
16.4 Financing low-
carbon investments,
opportunities, and
key drivers
Financing mitigation projects is, in principle, similar to financing any
other investment. This section provides an overview of factors that
attract private capital for low-carbon investments. First, different
categories of capital managers and their key investment criteria are
introduced. Next, challenges that hamper investors, such as investment
risks and access to capital, are assessed. Finally, selected financial
instruments used in low-carbon transactions are presented and dis-
cussed.
16�4�1 Capital managers and investment
decisions
Mitigation measures often are financed through investments by sev-
eral different capital managers (see Figure 16.1). It is crucial to under-
stand the basic investment logic and the preferred financial instru-
ments of each type of capital manager.
25
Box 16.2 characterizes some
of the major types of capital managers.
Risk and return are crucial decision factors in any investment finance
decision, including low-carbon activities. The higher the perceived risk,
25
For the different types of financing typically used, i. e., required, in the different
stages of renewable technologies, such as R&D, commercialization, manufactur-
ing, and sales, see Mitchell et al.(2011).

12241224
Cross-cutting Investment and Finance Issues
16
Chapter 16
the higher the cost of capital and required return needing to be gener-
ated to cover the costs (i. e., higher risk results in a higher discount rate
for cash flow) (Romani, 2009).
Equity and debt are basically the two basic types of finance. Both
come at a certain cost, which is very sensitive to risk, i. e., risk premium
or risk margin. The type of finance required depends on the type of
activity, its development phase, and its application.
Project finance is usually the preferred financing approach for infra-
structure or energy projects worth more than 21.4 million USD (UNEP,
2005). In this financing structure, debt and equity are paid back
exclusively from the cash flows generated by the project and there
is no recourse to the balance sheet (also call non-recourse finance);
as opposed to balance-sheet financing, where all ‘on-balance sheet’
assets can be used as collateral. In 2012, around 70 billion USD of
project-level market rate debt went towards emission reduction (70 %
provided by the public sector). Project-level equity was estimated at
approximately 11 billion USD. However, the largest share of mitiga-
tion , 198billion USD, consisted of balance-sheet financing (2012 USD)
(Buchner etal., 2013b).
Risk profile, tenor (i. e., loan duration) and size are the primary crite-
ria to characterize the financing demand. The total financing demand
can be split into tranches with varying risk profiles (e. g., debt vs.
equity) and varying tenors that match the characteristics of existing
financing instruments. For renewable energy projects, higher cost of
capital will increase start-up costs, which are generally front-loaded
and higher per unit of capacity than for fossil fuel-based projects even
if financing conditions are identical (Brunnschweiler, 2010). Lenders
require a higher equity share if a project is perceived as risky. A typi-
cal project finance structure in an industrialized country consists of
10 – 30 % equity, whereas in developing countries this share tends to
be higher (UNEP, 2007). However, equity tends to be scarce in many
developing countries (see Section16.4.2.2).
16�4�2 Challenges for low-carbon investment
Factors that reduce the relative attractiveness of implementing a low-
carbon technology shall be considered as a challenge. Many factors
pertaining to the general investment environment can have an enabling
character or can act as a challenge (see Section16.3). However, there
Box 16�2 | Types of capital managers relevant for investment and finance in low-carbon activities
Governments commit to mitigation measures to comply with
international agreements and self-imposed targets. Their role as
capital managers is limited to mitigation measures where they
invest directly. In 2011 and 2012, the public sector provided on
average 135 billion USD per year (2011 / 2012 USD) of public fund-
ing for climate finance, thereof 12 billion USD provided directly by
government bodies
1
(Buchner etal., 2013b).
Public financial institutions include national, bilateral, multi-
lateral, and regional finance institutions, as well as UN agencies
and national cooperation agencies. These institutions invested
121 billion USD in mitigation and adaptation measures in 2012
(2012 USD), more than 50 % was provided as concessional loans
(Buchner etal., 2013b).
Commercial financial institutions, such as banks, pension
funds, life insurance companies, and other funds, manage
over 71 trillion USD in assets. They can have long-time horizon
investments diversified across asset classes with varying risk return
profiles and investment tenors, sectors, and geographies (Inderst
1
This estimate excludes financing by public financial institutions and by dedi-
cated climate fund, the latter providing approximately 1.6 billion USD (2012
USD) in 2012 (Buchner et al., 2013b).
etal., 2012). The ability of institutional investors to invest in mitiga-
tion measures depends on their investment strategy, restrictions
agreed upon with their clients, as well as the regulatory framework.
Life insurance and pension funds are especially constrained by the
latter (Glemarec, 2011). Their contribution was estimated at 22 bil-
lion USD in 2012 (2012 USD) (Buchner etal., 2013b).
Energy corporations including power and gas utilities, inde-
pendent power producers, energy companies, and independent
project developers can design, commission, and operate renew-
able energy projects. They provided approximately 102 billion USD
(2012 USD) for climate finance in 2012 (Buchner etal., 2013b).
Non-energy corporations invest in mitigation measures to
reduce their energy bills, meet voluntary commitments or comply
with emission trading schemes. Altogether, they provided around
66 billion USD in 2012 for low-carbon investment (2012 USD)
(Buchner etal., 2013b).
Households’ investments are funded by income and savings
supplemented by loans. In 2012, households provided around
33 billion USD for climate finance projects; 83 % of households’
contributions were in developed countries, especially in Germany,
Japan, and Italy (Buchner etal., 2013b).

12251225
Cross-cutting Investment and Finance Issues
16
Chapter 16
are also low-carbon specific factors — especially in absence of a clear
price signal for carbon emissions — that, if they remain, may keep the
market penetration of these technologies to low percentages (Gilling-
ham and Sweeney, 2011). The latter will be assessed in this subsection.
Challenges vary significantly within the different investment catego-
ries, dependent upon the investor and the type of activity. For instance,
each group is faced with some additional typical financial challenges.
Energy-efficiency measures, for instance, often face misaligned incen-
tives between the asset owner, user, and lender. It is more complex for
energy-efficiency projects to structure and share the underlying risks.
In addition, energy savings are intangible as collateral (Hamilton and
Justice, 2009; Ryan etal., 2012; Venugopal and Srivastava, 2012).
Investment risks: Investments in low-carbon activities face partly the
same risks as other investments in the same countries analogous to the
core and broader investment climate. These risks can be broadly grouped
into political risks (e. g., political instability, expropriation, transfer risk,
breach of contract, etc.) and macro-economic risks (e. g., currency risk,
financial risks, etc.). In some developing countries, political and macro-
economic risks represent a high barrier to investment (Ward etal., 2009;
World Bank, 2011a; Venugopal and Srivastava, 2012).
There are also types of risks characteristic for low-carbon investments:
Low-carbon policy risks are one type of these risks that concern the
predictability, longevity, and reliability of policy, e. g., low-carbon regu-
lations might change or not be enforced (Ward etal., 2009; Venugopal
and Srivastava, 2012; Frisari etal., 2013). Private capital will flow to
those countries, or markets, where regulatory frameworks and policies
provide confidence to investors over the time horizon of their invest-
ment (Carmody and Ritchie, 2007).
Mitigation activities also face specific technology and operational
risk. For relatively new technologies, these are related to performance
of the technology (i. e., initial production and long-term performance),
delay in the construction, and the risk of not being able to access
affordable capital (see Section16.4.2.2). Some low-carbon activities
also tend to depend on an expected future development, e. g., steep
learning curves for certain technologies. Operational risks include the
credit quality of the counterparties, off-take agreements, especially in
a scenario where the mitigation technology has a higher costs of pro-
duction, supply chain scalability, unreliable support infrastructure, and
maintenance costs (Jamison, 2010; Venugopal and Srivastava, 2012).
Moreover, risks may be overestimated due to limited information in
markets that are undergoing a technological and structural transition
(Sonntag-O’Brien and Usher, 2006) and the longer time frame used to
assess the risk increases uncertainty. A lack of quantitative analytical
methodologies for risk management may add to the perceived risk.
Return on investment: The basic challenge is to find a financing
package that provides the debt and equity investors with a reason-
able return on their investment given the perceived risks. Debt finan-
ciers have a strong interest in seeing that their loans are paid back
and hence provide funds to less risky, proven technologies and estab-
lished companies (Hamilton, 2010). It is estimated that in 2009 they
required an average internal rate of return (IRR) of around 3 to 7 %
above the London Interbank Offered Rate (LIBOR) reference interest
rate, for renewable energy projects in industrialized countries. Ven-
ture capitalists, angel investors, and some foundations (through so-
called programme-related investments) are situated on the other side
of the financing continuum. They typically invest in new companies
and technologies, and are willing to take higher risks while expect-
ing commensurately larger returns. These investors may require an IRR
of 50 % or higher because of the high chances that individual proj-
ects will fail. Private equity companies that invest in more established
companies and technologies may still require an IRR of about 35 %
(Hamilton and Justice, 2009). However, these typical IRRs have to be
considered with care since they may vary according to the prevail-
ing basis interest rates (i. e., the current LIBOR rate), perceived risks of
the investment category and the availability of alternative investment
opportunities. Many renewable energy projects, especially in develop-
ing countries where additional risk margins are added, are struggling
to reach returns of this level to satisfy the expectations of financiers
of equity and debt.
Cost of capital and access to capital: In many countries, there are
imperfections in the capital market restricting the access to affordable
long-term capital (Maclean etal., 2008). This is particularly the case
in many developing countries where local banks are not able to lend
for 15 – 25years due to their own balance sheet constraints (Hamilton,
2010), e. g., to match the maturity of assets and liabilities.
Attracting sufficient equity is often critical for low-carbon activi-
ties, especially for renewable energy projects in developing countries
(Glemarec, 2011). The equity base of a company is used to attract
(leverage) mezzanine or debt finance especially in project finance
investments. Since equity is last in the risk order and can be recov-
ered only by means of sale of shares of the asset or its liquidation,
return expectations are significantly higher than for debt or mezzanine
finance. Often, equity is also the key limiting factor in the expansion of
a low-carbon activity, e. g., through growth of a company, expansion
into new markets, R&D, or multiplication of a project approach (UNEP,
2005).
Market and project size: Since the pre-investment costs vary dis-
proportionally with the project size, smaller low-carbon projects incur
much higher transaction costs than larger ones of conventional energy
projects (Ward et al., 2009). These costs include feasibility and due
diligence work, legal and engineering fees, consultants, and permit-
ting costs. Hamilton (2010) finds that small low-carbon projects in
developing countries seeking less than 10 million USD of debt are
generally not attractive to an international commercial bank. Due to
the higher transaction costs, small projects might also generate lower
gross returns, even if the rate of return lies within the market stan-
dards (Sonntag-O’Brien and Usher, 2006).

12261226
Cross-cutting Investment and Finance Issues
16
Chapter 16
There is basically no secondary market to raise debt for low-carbon
projects. Hence, institutional investors, whose major asset class is
bonds, lack opportunities to invest in low-carbon energy projects
because they do not issue bonds or the issuance size is too small (Ham-
ilton and Justice, 2009; Kaminker and Stewart, 2012). The minimum
issuance size for investment grade bonds tends to be about 460 mil-
lion USD, so few projects can achieve this standard (Veys, 2010). Many
renewable energy projects need investment in the range of 70 – 700
million USD, with only a few big ones towards the upper end (Hamil-
ton and Justice, 2009). In 2011, clean energy bonds amounted to only
about 0.2 % of the global bond market (Kaminker and Stewart, 2012).
Tenor-risk combination: Capital markets tend to prefer a combina-
tion of long tenor with low risk and are willing to finance high risk only
in the short term. Due to higher political and macro-economic instabil-
ity in developing countries, investors are particularly reluctant to invest
in projects with such a long investment horizon. Although pension
funds and insurance companies are long-term investors, concerns
about quality and reliability of cash flow projections, credit ratings of
off-takers for power purchase agreements, short-term performance
pressures, and financial market regulations often inhibit them from
investing in long-term low-carbon assets (Kaminker and Stewart,
2012). Industrial firms also face constraints with extended payback
periods, since they typically operate with a short-term horizon that
requires rapid positive returns on investment (Della Croce etal., 2011).
A significant positive consideration, however, is that low-carbon proj-
ects like waste heat, geothermal, wind, and solar have zero or negligi-
ble fuel price volatility risk.
Human resources and institutional capacity: The lack of technical
and business capabilities at the firm, financial intermediary and regula-
tory level are significant barriers to harness low-carbon technologies,
especially in many developing economies (Ölz and Beerepoot, 2010). In
countries where private sector actors do not only own the low-carbon
technology but are also predominately responsible for the diffusion of
technologies in the market, capacity building efforts need to focus on
these actors’ ability to develop, fund, and deploy the respective tech-
nologies (Lall, 2002; Figueiredo, 2003; Mitchell etal., 2011).
16�4�3 Financial instruments
Policy instruments to incentivize mitigation activities are assessed in
depth in Chapters 13, 14, and 15. Evidently a missing price signal for
carbon emissions is a major obstacle for low-carbon investments. But
not only in absence of such a price signal, other important measures
can be applied to reduce critical barriers for low-carbon investment.
Basic financial instruments are illustrated in Figure 16.1 and introduced
in Section 16.4.1. This subsection focuses on three types of financial
instruments with the following purposes: reducing risk, reducing the
cost of capital, and providing access to capital, as well as enhancing
cash-flows. Figure 16.5 illustrates in a simplified manner how these
instruments can enhance market competitiveness of low-carbon proj-
ects. There is a growing literature on how the public sector can use
these instruments to mobilize additional private finance, and can help
to improve the risk-return profile of investments for low-carbon activi-
ties.
16�4�3�1 Reducing investment risks
Risk mitigation can play an essential part in helping to ensure that a
successful project financing structure is achieved by transferring risk
away from borrowers, lenders, and equity investors. Various instru-
ments provided by private insurers, and by means of public mecha-
nisms, can help to partially or fully reduce the exposure of investors to
Figure 16�5 | Instruments to enhance market competitiveness of low-carbon projects.
Decrease Risk
Credit Enhancement
Total Credit Insurance
Production/Savings
Guarantees
Local Currency Finance
Increase Return
Premiums for PPAs
Feed-in Tariffs
Carbon Price Signal
Decrease Cost
Grants and Rebates
Tax Credits/Deductions
Soft Loans
Government Equity
Cost Risk Adjusted Return

12271227
Cross-cutting Investment and Finance Issues
16
Chapter 16
political risk, exchange rate fluctuations, business interruption, short-
falls in output, delays or damage during fabrication, construction, and
operation of a product, project, and company (Marsh, 2006).
There is a wide portfolio of proven commercial- and government-sup-
ported risk mitigation products that can be instrumental in efficiently
expanding low-carbon investment. Their allocation and application
requires a substantial level of expertise, experience, and resources
available in specialized insurance companies, export credit agencies,
and selected commercial and development banks. Examples of such
products are highlighted below. They signal the potential for expanded
use of risk mitigation instruments to support low-carbon investment
(Frisari etal., 2013).
Credit enhancements / guarantees, such as commercial credit insur-
ance and government guarantees, usually cover part of the loan and
reduce the loss incurred by a lender if the borrower is unable to repay
a loan. The lender must still evaluate the creditworthiness and condi-
tions of the loan, but these instruments can reduce the interest rate
and improve the terms, thereby expanding the available credit or
reducing the costs (Stadelmann etal., 2011a).
Trade credit insurance provides partial protection against certain
commercial risks (e. g., counterparty default) and political risks (e. g.,
war and terrorism, expropriation, currency transfer, or conversion
limitations) and other risks like non-honouring of sovereign financial
obligations or breach of contract by sovereign actors (MIGA, 2012;
OPIC, 2012). Such insurance is provided by commercial insurance
companies and by governments to their manufacturers, exporters, or
financiers.
Production and savings guarantees are typically provided to their
clients by energy service companies (ESCOs) and large energy per-
formance contracting (EPC) contractors. Only proven practices and
technologies are eligible to receive these guarantees, covering both
technical risk (from customer payment default due to non-performance
attributable to the ESCO or EPC contractor), and comprehensive risk
(defaults due to technical and financial creditworthiness of the cus-
tomer) (IDB, 2011).
Local currency finance can be used if currency fluctuations are par-
ticularly risky for a project or company because a major investment is
made in foreign currency and revenues are in local currency. Loans in
local currency or risk management swaps to hedge foreign currency
liability back into respective local currency can be provided by develop-
ment finance institutions (IFC, 2013; TCX, 2013a). Structured funds like
the Currency Exchange Fund (TCX) are dedicated to hedge these cross-
border currency and interest rate mismatches (TCX, 2013b).
By the end of 2012, the 20 largest emitting developed and develop-
ing countries with lower risk country grades for private sector invest-
ments were producing 70 % of global energy-related CO
2
emissions
(Harnisch and Enting, 2013). In investment-grade countries, risk miti-
gation instruments and access to long-term finance can be provided
at reasonably low costs, and have the potential to mobilize substantial
additional private sector mitigation investments. In other countries,
low-carbon investment would have to rely mainly on domestic sources
or international public finance.
16�4�3�2 Reducing cost of and facilitating access to
capital
In many situations, mitigation measures imply additional or incre-
mental investments. Independent of the specific role of equity or debt
finance in these individual investments, and irrespective of potential
future reductions of operating and maintenance costs, the level of
these investments can be a severe barrier to the investment decisions
of different investors (as outlined in Section 16.4.2).
Concessional or ‘soft’ loans are repayable funds provided at terms
more favourable than those prevailing on the market including lower
interest rates, longer tenor, longer grace period, and reduced level of
collateral. Providers of concessional loans are typically development
banks on behalf of governments. In international cooperation, conces-
sional loans of varying degree and type have been established as main
financing instruments to support public sector entities and local banks
by bilateral and multilateral development banks (Maclean etal., 2008;
Birckenbach, 2010; UNEP, 2010, 2011, 2012). In 2011, bilateral finance
institutions, for instance, disbursed 73 % of their mitigation finance
as concessional loans (UNEP, 2012). National finance institutions pro-
vided around 87 % of their climate funding in 2010 / 2011 via soft loans
(Buchner etal., 2012).
Grants are non-repayable funds provided to a recipient for a specific
purpose by a government, public financial institution or charity. Grants
can play an important role in reducing up-front capital investment
costs, and meeting viability gaps for projects that are more expensive
than business-as-usual (Buchner etal., 2012).
Rebates provide immediate price reductions for purchase of an eligible
product. Rebates can be structured to decline over time, encouraging
early adopters and reflecting anticipated technology cost reductions
(de Jager and Rathmann, 2008). Rebates are typically administered
by retailers of respective products, in cooperation with a government
agency.
Tax deductions or tax credits increase the after-tax cash flow for a
specific investment. Hence, they can have a similar effect as soft loans
by reducing the net annual payments for the amortization of a capi-
tal investment. They can be useful in enticing profitable enterprises to
enter the market for renewable energies to reduce their tax liabilities.
However, they require to be embedded in a country’s tax system and
a base in the tax code. Additionally, the specific level cannot be easily
adapted to changed market conditions and will depend on the specific
tax burden of the taxed entity (Wohlgemuth and Madlener, 2000).

12281228
Cross-cutting Investment and Finance Issues
16
Chapter 16
Equity plays a critical role in financing a project and it is potentially
attractive for governments to provide equity to companies or projects
to support desirable activities. At the same time, limited expertise of
the public sector in allocating capital in risky operations and in man-
agement of companies, and problems arising from the relationships of
owners and regulators, are frequently cited as reasons against a broad
public engagement as equity investor. In support of emission mitiga-
tion activities, a number of approaches have been successfully dem-
onstrated. Because of the challenges discussed above, some public
sector investors have decided to limit their equity investment to minor-
ity stakes and apply clear investment criteria to avoid crowding-out of
private investors and to use defined exit strategies (IFC, 2009).
16�4�3�3 Enhancing cash flow
Nationally agreed feed-in tariffs (FITs) or third-party guaranteed
renewable energy premiums for individual power purchase agree-
ments provide a secure long-term cash-flow to operators of renewable
energy systems — based on technology, system size, and project loca-
tion. Debt and equity for a project can hence be secured due to the
long duration, the guaranteed off-take of the electricity generated, and
the grid access. Consequently, FITs do not only increase and stabilize
the return, but also reduce the risks for developers, lenders, and inves-
tors. As a result, the cost of capital and required rate of return can
be reduced as well (Cory etal., 2009; Kubert and Sinclair, 2011). The
FITs for renewable energy have been implemented in a broad range
of industrialized and developing countries (Fulton et al., 2010). The
level of the FIT for a specific technology, region and time determines
the effectiveness and efficiency of the programme, but it is difficult to
establish the appropriate level up front and to adapt it as the market
evolves and the technology matures.
CO
2
Offset-Mechanisms can also provide additional cash flow via
the sales of credits to support the economics of a mitigation invest-
ment. Unlike renewable energy premiums, however, there is uncer-
tainty about the future level of this payment stream. This has made
many financiers hesitant to provide debt finance for these projects.
Some MDBs, like the ADB have a provision to buy credits upfront con-
tributing to investment capital and reducing uncertainty on the future
cash-flows from the sale of carbon credits (ADB, 2011; Asian Develop-
ment Bank, 2012).
16.5 Institutional arrangements
for mitigation financing
Institutions are essential to channel climate finance to mitigation
and adaptation measures (Stadelmann, 2013) and to ensure that the
actions funded respond to national needs and priorities in an efficient
and effective way.
26
Through institutions, knowledge is accumulated,
codified, and passed on in a way that is easily transferable and used to
build capacities, share knowledge, transfer technologies, help develop
markets, and build enabling environments for effective climate invest-
ments. Without proper institutions, some actions and investments may
remain simply as stand-alone projects with no lasting effects, or a one-
off capital equipment supply rather than a transaction with a transfer
of skills, know-how, full knowledge of the technology, and a contri-
bution to a broader system of innovation and technological change
(Ockwell etal., 2008).
16�5�1 International arrangements
Global arrangements for climate change mitigation finance are
essential for several reasons. Most commonly cited is the fact that
because the earth’s climate is a public good, investing within borders
is often not seen as beneficial to a particular country unless doing so
becomes a collective effort (Pfeiffer and Nowak, 2006). The UNFCCC,
among others, was established to address this dilemma and turn the
global effort on climate change into a collective action that would be
seen by all as beneficial to the whole (Burleson, 2007). Trusted institu-
tions are needed to channel and implement the funding in an orderly
and efficient process.
Funds that are part of the financial mechanism of the UNFCCC are
subject to guidance from the COP. Until recently, these included only
the GEF Trust Fund, the SCCF and the LDCF, all of which are adminis-
tered by the GEF (see Section 16.2.1.1) (UNFCCC, 2013b). In 2010, the
COP decided to establish the GCF to be designated as a new operating
entity of the Financial Mechanism (UNFCCC, 2010). The GCF, that is
currently being operationalized, is expected to become the main global
fund to support climate action in developing countries, but it has not
yet been capitalized. In addition, the Adaptation Fund has been estab-
lished under the Kyoto Protocol.
The UNFCCC recognizes that funding for mitigation may come from a
variety of sources and through a variety of channels beyond the finan-
cial mechanism, such as multilateral and bilateral institutions engaged
in official development assistance. There has been an expansion in
the number of public and private climate funds in the last decade. The
UNDP estimates that over the last decade some 50international public
funds, 45 carbon market funds, in addition to 6000 private equity funds
(set up largely independent of international climate policy) have been
established for the purpose of funding climate change-related activi-
ties (UNDP, 2011). Some of these, such as CIFs are multi-donor funds
administered by the World Bank but with their own governance and
26
The term ‘institution’ in this context is defined narrowly to mean an established
organization dedicated to facilitate, manage, or promote mitigation finance, as
opposed to the broader meaning of the term commonly used in the study of the
social sciences and used to mean a structure or mechanism of social order and
cooperation governing the behaviour of individuals in society, e. g., the institutions
of marriage or religion.

12291229
Cross-cutting Investment and Finance Issues
16
Chapter 16
organizational structure. The CIFs were designed as an interim measure
to demonstrate how scaled-up support can be provided and include
a sunset clause linked to progress on the financial architecture under
UNFCCC. They consist of two trust funds: the Clean Technology Fund
(CTF), which promotes scaled-up financing for demonstration, deploy-
ment, and transfer of low-carbon technologies with significant poten-
tial for long-term GHG emissions savings, and the Strategic Climate
Fund (SCF), under which are three separate initiatives for piloting trans-
formational, scaled-up action on climate change (World Bank, 2011b;
c). The pledges and contributions to the CIFs are recorded as ODA, and
therefore constitute a multi-bilateral arrangement (World Bank, 2010).
The CDM and carbon funds are directly linked to emission. Prior to the
decline of certificate prices, they played a central role in attracting cli-
mate investments. The CDM is one of three trading mechanisms cre-
ated by the Kyoto Protocol that a developed country can use to help
meet its national commitment. The CDM allows a developed country
to use credits issued for emission reductions in developing countries.
The other two mechanisms — Joint Implementation (JI) and Interna-
tional Emissions Trading (IET) — involve only developed countries with
national commitments. The CDM is the largest of the mechanisms
(UNFCCC, 2013c). Some of the carbon funds have been established by
multilateral financial institutions. The World Bank established the first
fund, the Prototype Carbon Fund, in 1999, and has since created sev-
eral additional funds (World Bank, 2013).
There are several institutions promoting mitigation finance by private
actors, which frequently combine financial power of up to several tril-
lions. However, their scope of work differs considerably. Some of the
major private sector institutions include inter alia the World Business
Council on Sustainable Development (WBCSD) (WBCSD, 2013), the
Climate Markets and Investment Association (CMIA) (CMIA, 2013),
and the Global Investor Coalition on Climate Change (Global Investor
Coalition on Climate Change, 2013).
Regional arrangements play an important role in fostering regional
cooperation and stimulating action and funding. These regional insti-
tutions include the regional multilateral development banks and the
regional economic commissions of the United Nations on the multilat-
eral side.27 They are increasingly engaging in the promotion of mitiga-
tion and adaptation activities in their respective regions and establish-
ing and helping to manage regional financing arrangements (Sharan,
2008). In the Asia and Pacific region, examples of regional financial
arrangements to promote funding for mitigation activities include
ADB´s Clean Energy Financing Partnership Facility, the Asia Pacific Car-
bon Fund, and the Future Carbon Fund. Other regional development
banks have been equally active (Asian Development Bank, 2013a; b; c).
27
Economic Commission for Latin America, Inter American Development Bank
(IDB), Economic Commission for Africa (ECA), African Development Bank (AfDB),
Economic Commission for Asia and the Pacific (ESCAP), Asian Development Bank
(ADB), Economic Commission for Europe (ECE), European Bank for Reconstruction,
and Development (EBRD).
Regional groupings such as the Economic Community for West African
States (ECOWAS), the Association of Southeast Asian Nations (ASEAN),
the Secretariat for Central American Economic Integration, Merco-
sur, Corporación Andina de Fomento, and the Andean Pact, to name
just a few, have been actively promoting sub-regional integration of
energy systems and cooperation in climate change activities in devel-
oping countries for some years. In the developed world, one of the best
examples of these regional political groupings is the European Union,
which has been very active in the area of climate change and in sup-
porting activities in developing countries.
Bilateral cooperation arrangements are widely used by donor
countries to provide funding to partner country governments and their
implementing organizations. They frequently involve development
banks and agencies with a proven track record in international coop-
eration. The three principal means to channel climate change fund-
ing bilaterally are (1) bilateral programmes for funding international
cooperation in the energy, water, transport, or forestry, (2) dedicated
funding windows established to target climate change funding open
to a wider range of implementing institutions, and (3) new funds
implemented by bilateral development institutions with their own
governance structure. The OECD has established a framework for the
implementation and reporting modalities that can be applied to all
climate-relevant ODA and partially for other official flows (see OECD,
(2013b) for agreed principles on statistics, effectiveness, evaluation,
and the like). Officially supported export credits provided by export
credit agencies on behalf of national governments are also covered by
a respective OECD arrangement (OECD, 2013c).
Triangular cooperation arrangements are defined by the OECD as
those involving a traditional donor, most likely a member of DAC, an
emerging donor in the south (providers of South-South Cooperation),
and the beneficiary countries or recipients of development aid (Forde-
lone, 2011). Although they have grown in number in recent years,
triangular arrangements, and particularly those for climate change
financing, are a relatively recent mode of development cooperation
(ECOSOC, 2008). These arrangements have attracted a number of coun-
tries particularly for technology cooperation across sectors or specified
industries. The rise of triangular arrangements has been driven by the
growing role of middle-income countries and their increasing presence
in providing development co-operation in addition to receiving it, and
by the desire to experiment with other types of cooperation where the
experience of developing countries can be brought to bear.
16�5�2 National and sub-national arrangements
The landscape of institutional arrangements for action on climate
change is diverse. In many countries, actions on climate change are not
clearly defined as such. Consequently, many of the national arrange-
ments that exist to promote programmes and activities that contribute
to mitigation do not appear in the literature as institutions dedicated
to support climate finance.

12301230
Cross-cutting Investment and Finance Issues
16
Chapter 16
In many countries, particularly in developed countries and in a few
larger developing countries, finance for mitigation comes mainly from
the private sector, often with public support through regulatory and
policy frameworks and / or specialized finance mechanisms. Institu-
tional arrangements and mechanisms that are successful in mobilizing
and leveraging private capital tend to be more cost-effective in climate
change mitigation, but some projects with low private investments
(e. g., projects reducing industrial GHGs or projects owned by state-
owned enterprises) are also among the most cost-effective (Stadel-
mann, 2013). The institutions and public finance mechanisms are
diverse, but all aim to help commercial financial institutions to do this
job effectively and efficiently. Many of the institutions support special-
ized public finance mechanisms such as dedicated credit lines, guaran-
tees to share the risks of investments and debt financing of projects,
microfinance or incentive funds, and schemes to mobilize R&D and
technical assistance funds to build capacities across the sectors, includ-
ing the private and commercial sectors (Maclean etal., 2008). National
development banks play an important role in financing domestic cli-
mate projects in many countries especially by providing concessional
funding (Smallridge etal., 2012; Höhne etal., 2012; IDFC, 2013).
Many developing countries, other than the larger ones, are trying to
cope with the multiplicity of sources, agents and channels offering cli-
mate finance (Glemarec, 2011). These efforts take two forms.
One form is coordination of national efforts to address climate change
by relevant government institutions. Very few developing countries
have an institution fully dedicated to climate finance (Gomez-Echeverri,
2010). Rather, climate finance decisions involve multiple ministries
and agencies often coordinated by the ministry of the environment.
Involvement of ministries of foreign affairs and ministries of finance
is becoming more common due to their engagement in international
negotiations and the promise of increased resources under UNFCCC.
The second form is the establishment of specialized national funding
entities designed specifically to mainstream climate change activities
in overall development strategies. These institutions blend interna-
tional climate funding with domestic public funds and private sector
resources (Flynn, 2011). Table 16.2 lists examples of national funding
entities. A common feature is the desire to allocate resources for activi-
ties that are fully mainstreamed to the national needs and priorities. To
do this, the national funding entities seek to tap the numerous interna-
tional sources of climate finance and supplement them with domestic
resources. They are also expected to develop the governance and
capacity requirements for ‘direct access’ to funds from the Adaptation
Fund and the GCF.
28
28
Direct access means that an accredited institution in the recipient country may
receive funds directly to implement a project. Currently, most international funding
institutions insist that projects be implemented by a multilateral development
bank or UN agency.
In many countries, sub-national arrangements are increasingly becom-
ing an effective vehicle for advancing energy and climate change
goals. These arrangements and the institutions that support them are
being established to advance regional collaboration in areas of com-
mon interest and to benefit from greater efficiency and effectiveness
through actions with greater geographical coverage (Setzer, 2009). For
example, because of their population densities and economic activi-
ties, cities are major contributors to global GHG emissions, and as such
they are major potential contributors to worldwide mitigation efforts
(Corfee-Morlot etal., 2009). In recent years, there has been an increase
in the number of networks and initiatives specifically dedicated to
enhance the role of cities in the fight against climate change. As a
result, these initiatives are potentially big contributors to mitigation
efforts, but because of the lack of clear processes linking these initia-
tives to national and international climate change policy, their impact
in broader policy frameworks is less certain (UN-Habitat, 2011). One
possible opportunity for enhancing this linkage is through the new
National Appropriate Mitigation Actions (NAMAs) being submitted by
developing countries within the context of UNFCCC. The NAMA pro-
cess agreed to at Bali provides an opportunity to incorporate sectoral
policies with relevance to their cities (Li, 2011).
16�5�3 Performance in a complex institutional
landscape
The institutional landscape for climate finance is becoming increas-
ingly complex as interest of actors to enter the field of climate change
finance and mitigation activities in developing countries increases. As
in other international cooperation, there are discussions about effec-
tiveness of climate finance (see OECD (2008) for politically agreed prin-
ciples on aid effectiveness). Concerns have been raised about divert-
ing attention and resources from development aid, i. e., ODA, such
as health and education, the additionality of expanded funding for
mitigation and adaptation (Michaelowa and Michaelowa, 2011), the
difficulty of defining and measuring comparable results and achieving
coherence with national priorities and development strategies, the lack
of transparency, the fragmentation and duplication of efforts, and that
the number of established funds may undermine the authority of the
operating entities of the financial mechanism of the UNFCCC (Poerter
etal., 2008). The proliferation of climate funds (HBF and ODI, 2013)
and funding channels with their own governance procedures can cre-
ate a substantial bureaucratic burden for recipients (Greene, 2004).
Compounding these problems is the fragmentation of governance
architectures that prevail in most developing countries (Biermann
etal., 2009). Climate finance may be more effective if the operation
of related institutions is streamlined and the capacity in developing
countries to cope with the increasing number of these institutions
is developed further. Evidence on the effectiveness of institutions to
mainstream climate change mitigation and adaptation activities is cur-
rently lacking.
Table 16�2 | A sample of national funding entities in developing countries. Sources: Adapted from Gomez-Echeverri (2010), updated based on UNDP and World Bank (2012),
Amazon Fund (2012), BCCRF (2012), CDMF (2012), ICCTF (2012), World Bank (2012b), UNDP (2013b).
Name, country,
establishment
Description Source of fund and operations Governance
Amazon Fund, Brazil
(2010)
Established to combat deforestation and promote
sustainable development in the Amazon. Focus:
adaptation and mitigation
Designed to attract national and private investment
for Amazon rainforest projects as well as donations
and earnings from non-reimbursable investments
made
Managed by the Brazilian Development Bank
(BNDES), a Guidance Committee composed of
federal and state governments and civil society, and
a Technical Committee
Bangladesh Climate
Change Resilience Fund
(BCCRF)
(2010)
Established to provide support for the
implementation of Bangladesh’s Climate
Change Strategy and Action Plan 2009 – 2018
and particularly vulnerable communities. Focus:
adaptation and mitigation
Designed to attract funds from UNFCCC finance
mechanisms, and direct donor support
Managed by a board composed of Ministers of
Environment, Finance, Agriculture, Foreign Affairs,
and Women and Children Affairs and disaster
management, as well as donors and civil society
organizations
China CDM Fund (CDMF)
(2007)
Established jointly by Ministries of Finance, Foreign
Affairs, Science and Technology, and National
Development and Reform Commission (NDRC).
Focus: mitigation
Funded by revenues generated from CDM projects
inChina, as well as grants from domestic and
international institutions
Governed by the Board of the China CDM Fund that
comprises representatives of seven line ministries,
and managed and operated by a management
centre affiliated with the Ministry of Finance
Indonesia Climate
Change Trust Fund
(ICCTF)
(2010)
Established jointly by the National Development
Planning Agency and Ministry of Finance to pool and
coordinate funds from various sources to finance
Indonesia’s climate change policies and programmes
Currently funded by grants from development
partners but designed for direct access to
international climate funding and to attract private
funding
The UNDP is an interim Trustee operating under
a Steering Committee headed by the National
Development Planning Agency that also includes
donors and other line ministries
Guyana REDD Investment
Fund (GRIF)
(2010)
Established to finance activities under the Low
Carbon Development Strategy of Guyana and to
create an innovative climate finance mechanism.
Focus: mitigation and adaptation
Designed to attract donor support. Operates under
a performance-based funding modality, based on an
independent verification of Guyana’s deforestation
and forest degradation rates and progress on REDD+
enabling activities
A Steering Committee with members of government
and financial contributors chaired by the
Government of Guyana, is the decision making
and oversight body. The International Development
Association (IDA) of the World Bank Group acts as
Trustee and the partner entities provide operational
services
Ethiopia
Climate Resilient Green
Economy Facility
(2012)
Established to support country’s vision of attaining a
middle-income economy with low-carbon growth by
2020. Focus: mitigation and adaptation
Designed to mobilize, access, and blend both local
and international public and private resources to
support Ethiopia’s Climate Resilience Green Economy
Strategy
Governed by a Ministerial Steering Committee
chaired by Ministry of Finance and Economic
Development with an advisory body composed of
development partners, multilateral organizations,
national non-governmental organizations (NGOs),
civil society, private sector, and academia

12311231
Cross-cutting Investment and Finance Issues
16
Chapter 16
16.6 Synergies and tradeoffs
between financing
mitigation and adaptation
This section introduces a conceptual framework linking adaptation
and mitigation in terms of financing and investment. Estimates of
investments needed for mitigation are provided in Section16.2.2, and
for adaptation investments in the sectoral chapters of the Working
GroupII report. First, this section addresses the interactions of financ-
ing adaptation and mitigation in terms of their specific effectiveness
and tradeoffs, as well as their competition for funding over time. Sec-
ond, it discusses examples of integrated financing approaches.
16�6�1 Optimal balance between mitigation
and adaptation and time dimension
Both mitigation and adaptation measures are necessary to effectively
avoid harmful climate impacts. However, an assessment on whether,
where, and which types of adaptation and mitigation measures and
policies are substitutes or complements requires theoretical analysis and
empirical evidence (Section 13.3.3). Investing in mitigation may reduce
the need to invest in adaptation, and vice versa. Several authors have
recognized that optimal mitigation and adaptation strategies should be
jointly determined (Schelling, 1992; Kane and Shogren, 2000; Dellink
etal., 2009; Bosello et al., 2010), including from the perspective of a
global decision maker. The optimal balance of mitigation and adaptation
depends on their relative costs, for any given profile of climate change
impacts. To avoid inefficiencies, the socially discounted rate of return on
resources invested in mitigation and adaptation should be equal. There-
fore, mitigation and adaptation compete to attract investments. From
the perspective of simple economic models, a reduction in the costs of
mitigation should lead to more mitigation and less adaptation, and,
according to this view, they are substitutes (Ingham etal., 2005).
From the perspective of development and climate studies (Tol, 2007;
Ayers and Huq, 2009), climate change in most cases will impact the
economy by reducing its production potential (part of the residual
damage), and the level of impacts will depend on its efficiency, diver-
sity, and vulnerability, as well as on how institutions are able to adapt.
In many countries, particularly in developed countries and in a few
larger developing countries, finance for mitigation comes mainly from
the private sector, often with public support through regulatory and
policy frameworks and / or specialized finance mechanisms. Institu-
tional arrangements and mechanisms that are successful in mobilizing
and leveraging private capital tend to be more cost-effective in climate
change mitigation, but some projects with low private investments
(e. g., projects reducing industrial GHGs or projects owned by state-
owned enterprises) are also among the most cost-effective (Stadel-
mann, 2013). The institutions and public finance mechanisms are
diverse, but all aim to help commercial financial institutions to do this
job effectively and efficiently. Many of the institutions support special-
ized public finance mechanisms such as dedicated credit lines, guaran-
tees to share the risks of investments and debt financing of projects,
microfinance or incentive funds, and schemes to mobilize R&D and
technical assistance funds to build capacities across the sectors, includ-
ing the private and commercial sectors (Maclean etal., 2008). National
development banks play an important role in financing domestic cli-
mate projects in many countries especially by providing concessional
funding (Smallridge etal., 2012; Höhne etal., 2012; IDFC, 2013).
Many developing countries, other than the larger ones, are trying to
cope with the multiplicity of sources, agents and channels offering cli-
mate finance (Glemarec, 2011). These efforts take two forms.
One form is coordination of national efforts to address climate change
by relevant government institutions. Very few developing countries
have an institution fully dedicated to climate finance (Gomez-Echeverri,
2010). Rather, climate finance decisions involve multiple ministries
and agencies often coordinated by the ministry of the environment.
Involvement of ministries of foreign affairs and ministries of finance
is becoming more common due to their engagement in international
negotiations and the promise of increased resources under UNFCCC.
The second form is the establishment of specialized national funding
entities designed specifically to mainstream climate change activities
in overall development strategies. These institutions blend interna-
tional climate funding with domestic public funds and private sector
resources (Flynn, 2011). Table 16.2 lists examples of national funding
entities. A common feature is the desire to allocate resources for activi-
ties that are fully mainstreamed to the national needs and priorities. To
do this, the national funding entities seek to tap the numerous interna-
tional sources of climate finance and supplement them with domestic
resources. They are also expected to develop the governance and
capacity requirements for ‘direct access’ to funds from the Adaptation
Fund and the GCF.
28
28
Direct access means that an accredited institution in the recipient country may
receive funds directly to implement a project. Currently, most international funding
institutions insist that projects be implemented by a multilateral development
bank or UN agency.
Table 16�2 | A sample of national funding entities in developing countries. Sources: Adapted from Gomez-Echeverri (2010), updated based on UNDP and World Bank (2012),
Amazon Fund (2012), BCCRF (2012), CDMF (2012), ICCTF (2012), World Bank (2012b), UNDP (2013b).
Name, country,
establishment
Description Source of fund and operations Governance
Amazon Fund, Brazil
(2010)
Established to combat deforestation and promote
sustainable development in the Amazon. Focus:
adaptation and mitigation
Designed to attract national and private investment
for Amazon rainforest projects as well as donations
and earnings from non-reimbursable investments
made
Managed by the Brazilian Development Bank
(BNDES), a Guidance Committee composed of
federal and state governments and civil society, and
a Technical Committee
Bangladesh Climate
Change Resilience Fund
(BCCRF)
(2010)
Established to provide support for the
implementation of Bangladesh’s Climate
Change Strategy and Action Plan 2009 – 2018
and particularly vulnerable communities. Focus:
adaptation and mitigation
Designed to attract funds from UNFCCC finance
mechanisms, and direct donor support
Managed by a board composed of Ministers of
Environment, Finance, Agriculture, Foreign Affairs,
and Women and Children Affairs and disaster
management, as well as donors and civil society
organizations
China CDM Fund (CDMF)
(2007)
Established jointly by Ministries of Finance, Foreign
Affairs, Science and Technology, and National
Development and Reform Commission (NDRC).
Focus: mitigation
Funded by revenues generated from CDM projects
inChina, as well as grants from domestic and
international institutions
Governed by the Board of the China CDM Fund that
comprises representatives of seven line ministries,
and managed and operated by a management
centre affiliated with the Ministry of Finance
Indonesia Climate
Change Trust Fund
(ICCTF)
(2010)
Established jointly by the National Development
Planning Agency and Ministry of Finance to pool and
coordinate funds from various sources to finance
Indonesia’s climate change policies and programmes
Currently funded by grants from development
partners but designed for direct access to
international climate funding and to attract private
funding
The UNDP is an interim Trustee operating under
a Steering Committee headed by the National
Development Planning Agency that also includes
donors and other line ministries
Guyana REDD Investment
Fund (GRIF)
(2010)
Established to finance activities under the Low
Carbon Development Strategy of Guyana and to
create an innovative climate finance mechanism.
Focus: mitigation and adaptation
Designed to attract donor support. Operates under
a performance-based funding modality, based on an
independent verification of Guyana’s deforestation
and forest degradation rates and progress on REDD+
enabling activities
A Steering Committee with members of government
and financial contributors chaired by the
Government of Guyana, is the decision making
and oversight body. The International Development
Association (IDA) of the World Bank Group acts as
Trustee and the partner entities provide operational
services
Ethiopia
Climate Resilient Green
Economy Facility
(2012)
Established to support country’s vision of attaining a
middle-income economy with low-carbon growth by
2020. Focus: mitigation and adaptation
Designed to mobilize, access, and blend both local
and international public and private resources to
support Ethiopia’s Climate Resilience Green Economy
Strategy
Governed by a Ministerial Steering Committee
chaired by Ministry of Finance and Economic
Development with an advisory body composed of
development partners, multilateral organizations,
national non-governmental organizations (NGOs),
civil society, private sector, and academia

12321232
Cross-cutting Investment and Finance Issues
16
Chapter 16
On the other hand, policies to address mitigation and / or adaptation
could promote the transfer of technologies and financial resources, and
strengthen institutions and markets, which could lead to the enhance-
ment of a country’s productive capacity (Halsnæs and Verhagen, 2007).
Combined mitigation and adaptation strategies taking into account
cost-effectiveness may involve economic tradeoffs. The optimal bal-
ance, including allocation of resources, should be determined taking
into account possible co-benefits, which may be difficult to assess.
Many actions that integrate mitigation and adaptation have enough
co-benefits to make obvious sense of their immediate implementation
(see Working Group II report), in spite of the fact that in many cases,
assessment of their effective combination, cost-effectiveness, and trad-
eoffs requires improved information, improved capacities for analysis
and action, and further policymaking (Wilbanks and Sathaye, 2007).
Modelling of any direct interaction between adaptation and mitiga-
tion in terms of their specific effectiveness and tradeoffs would also be
desirable (Wang and McCarl, 2011).
An analysis on the time composition (timing of mitigation and adap-
tation) of the optimal climate change strategy is also important to
assess how to best allocate climate change funds. Emerging frame-
works for assessing the tradeoffs between adaptation and mitigation
include those from the point of view of risks and costs. People invest
resources to reduce the risk they confront or create (Ehrlich and Becker,
1972; Lewis and Nickerson, 1989). Recent studies have used inte-
grated assessment models to numerically calculate the optimal alloca-
tion of investments between mitigation and adaptation. They confirm
the analytical insights of Kane and Shogren (2000) and suggest that
investments in mitigation should anticipate investments in adaptation
(Lecocq and Shalizi, 2007; de Bruin etal., 2009; Bosello etal., 2010).
The reason for this is because climate and economic systems have iner-
tia and delaying action increases the costs of achieving a given tem-
perature target. These studies suggest that the competition between
mitigation and adaptation funds extends over time.
By arguing “uncertainty on the location of damages reduces the benefits
of ‘targeted’ proactive adaptation with regard to mitigation and reactive
adaptation”, some authors reinforce the idea that it is optimal to wait to
invest in adaptation (Lecocq and Shalizi, 2007). For the above reasons,
Carraro and Massetti (2011) suggest that the greatest share of the GCF
should finance emissions reductions rather than adaptation in develop-
ing countries. Other authors propose a framework that could integrate
into an optimization model not only mitigation and adaptation, but also
climate change residual damages. In the light of the uncertain impacts of
climate change, prioritizing mitigation measures is justified, on the basis
of a precautionary approach. Adaptation actions “should be optimally
designed, consistently with mitigation, as a residual strategy addressing
the damage not accommodated by mitigation” (Bosello etal., 2010).
Wang and McCarl (2011) recognizes that, in terms of an overall invest-
ment shared between mitigation and adaptation, mitigation tackles
the long-run cause of climate change while adaptation tackles the
short-run reduction of damages and is preferred when damage stocks
are small. Contrary to Bosello etal. (2010), they advocate that, instead
of taking adaptation as a ‘residual’ strategy, well-planned adaptation
is an economically effective complement to mitigation since the begin-
ning and should occur in parallel. Thus, adaptation investment should
be considered as an important current policy option due to the near-
term nature of given benefits.
Moreover, the optimal balance of adaptation and mitigation measures
and investments should be determined in function of the magnitude
of climate change; “if mitigation can keep climate change to a moder-
ate level, then adaptation can handle a larger share of the resulting
impact vulnerabilities” (Wilbanks etal., 2007). While the uncertainties
about specific pathways remain, and although there are different con-
siderations on their optimal balance, there is a general agreement that
funding for both mitigation and adaptation is needed.
16�6�2 Integrated financing approaches
Despite the lack of modelling of any direct interaction between adapta-
tion and mitigation in terms of financing, there is an increasing interest
in promoting integrated financing approaches, addressing both adap-
tation and mitigation activities in different sectors and at different lev-
els. Although the GCF will have thematic funding windows for adapta-
tion and mitigation, an integrated approach will be used to allow for
cross-cutting projects and programmes (UNFCCC, 2011c, para 37).
The theoretical literature reviewed in Section 16.1.1 provides only gen-
eral guidance on financing mitigation and adaptation measures. Analy-
sis of specific adaptation and mitigation options in different sectors
reveals that adaptation and mitigation can positively and negatively
influence the effectiveness of each other (see also Working Group II
report). Particular opportunities for synergies exist in some sectors
(Klein etal., 2007), including agriculture (Niggli etal., 2009), forestry
(Ravindranath, 2007; Isenberg and Potvin, 2010), and buildings and
urban infrastructure (Satterthwaite, 2007).
Mitigation activities have global benefits while most adaptation
activities benefit a smaller geographical area or population. Funding
sources with a regional, national or sub-national perspective, therefore,
will increasingly favour adaptation over mitigation measures (Dowla-
tabadi, 2007; Wilbanks and Sathaye, 2007). Thus the sources of climate
finance available may yield a mix of mitigation and adaptation mea-
sures quite different from the global optimal mix. Additional studies
“to understand the complex way in which local adaptation aggregates
to the global level” are needed (Patt etal., 2009). Although the optimal
mix cannot be determined precisely, the availability of international cli-
mate finance for both mitigation and adaptation is necessary to coun-
teract such tendencies.
Taking into account the strong regional nature of climate change
impacts, a regional financing arrangement will be more responsive

12331233
Cross-cutting Investment and Finance Issues
16
Chapter 16
and relevant than a global one, and may play an important role in
adaptation (Sharan, 2008). Regional funding tools have made arrange-
ments for financing adaptation activities in complement to mitigation
measures: e. g., the Poverty and Environment Fund (PEF) of the Asian
Development Bank promotes the mainstreaming of environmental and
climate change considerations into development strategies, plans, pro-
grammes, and projects of the bank (ADB, 2003).
The AfDB acts as manager and coordinator of new funding for the
Congo Basin forest ecosystem conservation and sustainable manage-
ment (UNEP, 2008). According to the operational procedures by AfDB,
to be eligible for financing under the Congo Basin Forest Fund (CBFF),
project proposals and initiatives considered for funding should, among
other things, aim at slowing the rate of deforestation, contribute to
poverty alleviation, provide some contribution to climate stabiliza-
tion and GHG emissions reduction, and may show environment, eco-
nomic, and social risk assessment in addition to appropriate mitigation
measures, as well as be supported by national strategies to combat
deforestation while preserving biodiversity and promoting sustainable
development (AfDB, 2009). See Section 14.3.2 for additional informa-
tion on regional examples of cooperation schemes identifying syner-
gies between mitigation and adaptation financing.
Many ongoing bilateral and multilateral development activities address
mitigation and adaptation at the same time. A recent survey by Illmann
etal. (2013) discusses examples from agriculture (conversion of fallow
systems into continuously cultivated area; the reuse of wastewater for
irrigation), forestry (reforestation with drought-resistant varieties; man-
grove plantations), and from the energy sector (rural electrification with
renewable energy, production of charcoal briquettes from agricultural
waste). The study identifies significant potential to further mobilize
these synergies within existing development cooperation programmes.
Another point of debate regarding synergies and tradeoffs between
financing mitigation and adaptation relates to the conceptual frame-
work that suggests allocating responsibility for international financing
of adaptation based on the historical contribution of countries to climate
change in terms of GHG emissions and their capacity to pay for the costs
of adaptation at international level (Dellink etal., 2009). The provision of
international climate finance, of course, raises other issues of equity and
burden sharing, which are beyond the scope of this chapter.
16.7 Financing developed
countries’ mitigation
activities
This and the next section consider the manner in which developed and
developing countries may choose to finance the incremental invest-
ments and operating costs associated with GHG mitigation activities.
It is fully recognized that a country’s individual circumstances will in
large part determine how financing is accomplished, and further, that
individual national circumstances vary widely among members of the
developed and developing country groups.
The manner in which developed countries finance their mitigation
activities depends largely on the policies chosen to limit GHG emis-
sions and the ownership of the sources of emissions. Policies and
ownership also determine the distribution of the burdens posed by
the financing needs, i. e., if it will be financed by households and firms
through higher prices, taxes, or both.
In 2011 and 2012, on average, 177 billion USD of global climate
finances were invested in developed countries (49 % of the global
total climate finance) of which the vast majority (81 %) originated in
the same country as the investment was undertaken (2011 / 2012 USD)
(Buchner etal., 2013b). Due to the financial crisis investment in renew-
able energy in developed countries dropped 14 % in 2009 (Frankfurt
School-UNEP Centre and BNEF, 2012), but saw a rapid recovery due
to the green stimulus packages (IEA, 2009; REN21, 2010). The eight
development banks of OECD countries that are members of the
International Development Finance Club (IDFC) allocated 28 billion
USD (2011 USD) and 33 billion USD (2012 USD) ‘green’
29
finance to
domestic projects in 2011 and 2012, respectively (Höhne etal., 2012;
IDFC, 2013). Public climate finance was also directed to developing
countries at a range of 35 – 49 billion USD per year for 2011 and 2012
(2011 / 2012 USD) (Buchner etal., 2013b).
Without climate policy, an estimated 96 (70 – 126) billion USD per year
of investment in fossil power generation will occur in developed coun-
tries from 2010 – 2029; from 2030 to 2049, this figure increases to 131
(86 – 215) billion USD per year. In a climate policy scenario compatible
with a 2 °C warming limit in 2100, OECD countries are expected to
reduce investments in fossil power generation by 57 % (– 2 to – 89 %)
during 2010 – 2029, but investments will drop by 90 % (– 80 to – 98 %)
during 2030 – 2049. Investment in renewable power generation instead
will increase by 86 % (58 to 116 %) during 2010 – 2029 and by 200 %
(77 to 270 %) during 2030 – 2049 (based on IEA (2011), Carraro etal.
(2012), Calvin etal. (2012) and McCollum etal. (2013), used in Sec-
tion16.2.2).
To date, public sourcing for climate finance originates primarily from
general tax revenues. However, under ambitious stabilization targets,
financial sources that yield mitigation benefits have the potential to
generate high revenues that could be used for climate finance. Carbon
taxes and the auctioning of emissions allowances carry the highest
potential, a phaseout of fossil fuel subsidies, and a levy or emission
trading scheme for international aviation and shipping emissions are
29
‘Green’ finance as reported by IDFC includes projects with other environmental
benefits. Approximately 93 % (80 %) of the ‘green’ finance by IDFC in 2011
(2012) was climate finance (Höhne et al., 2012; IDFC, 2013).

12341234
Cross-cutting Investment and Finance Issues
16
Chapter 16
estimated to generate considerable revenues as well (UNFCCC, 2007;
AGF, 2010; World Bank Group etal., 2011).
Most developed countries offer a reasonably attractive core and
broader enabling environment for climate investments. Developed
countries, as do many emerging economies, combine substantial
energy-related GHG emission reduction potential with low country
risks. At the end of 2012, 29 out of 36 assessed developed countries
fell into the group of lower risk country grade, producing 39 % of
global fuel-related CO
2
emissions (Harnisch and Enting, 2013). Pri-
vate finance can thus be the main source of low-carbon investment in
these countries, however private actors are often dependent on public
support through regulatory and policy frameworks and / or specialized
finance mechanisms.
While macroeconomic and policy risk have been reasonably low in the
past, low-carbon policy risks have affected investments in developed
countries. In principle, risk-mitigation instruments and access to long-
term finance can be provided at reasonably low cost. Suitable insti-
tutions exist to implement specialized public finance mechanisms to
provide dedicated credit lines, guarantees to share the risks of invest-
ments, debt financing of projects, microfinance or incentive funds, and
schemes to mobilize R&D and technical assistance funds for build-
ing capacities across the sectors. The institutions and types of public
finance mechanisms in existence across countries are diverse but share
the common aim of helping commercial financial institutions to effec-
tively and efficiently perform this job (Maclean etal., 2008).
In 2012, the most widespread fiscal incentives were capital subsidies,
grants, and rebates. They were in place in almost 90 % of high-income
countries. In 70 % of the countries public funds were used to support
renewable energy, e. g., public investment loans and grants. Feed-in
tariffs were in place in 27 high-income countries at national or state
level (75 % of all countries analyzed) (REN21, 2012).
16.8 Financing mitigation activ-
ities in and for develop-
ing countries including for
technology development,
transfer, and diffusion
Analogous to the previous section, this section outlines key assess-
ment results for mitigation finance in and for developing countries, i. e.,
embracing domestic flows as well as financing provided by developed
countries.
An estimated 51 % of the total global climate finance in 2011 and
2012, namely on average 182billion USD per year, was invested in
developing countries (2011 / 2012 USD). Thereof, 72 % was originating
in the same country as it was invested) (Buchner etal., 2013b). The
total climate finance flowing from developed to developing countries
is estimated to be between 39 and 120 billion USD per year in 2011
and 2012 (2011 / 2012 USD). This range covers public and the more
uncertain flows of private funding for mitigation and adaptation. Clapp
etal. (2012) estimate the total at 70 – 120 billion USD per year based
on 2009 – 2010 data. Data from Buchner etal. (2013a) suggest a net
flow to developing countries for 2010 and 2011 of the order of 40 to
60 billion USD. North-South flows are estimated at 39 to 62 billion USD
per year for 2011 and 2012 (2011 / 2012 USD) (Buchner etal., 2013b).
Public climate finance provided by developed countries to developing
countries was estimated at 35 to 49 billion USD per year in 2011 and
2012 (2011 / 2012USD) (Buchner etal., 2013b). Multilateral and bilat-
eral institutions played an important role in delivering climate finance
to developing countries. Seven MDBs
30
reported climate finance com-
mitments of about 24.1 and 26.8billion USD in 2011 and 2012, respec-
tively
31
(2011 and 2012 USD) (AfDB etal., 2012a; b, 2013). These insti-
tutions manage a range of multi-donor trust climate funds, such as the
Climate Investment Funds, and the funds of the financial mechanism of
the Convention (GEF, SCCF, LDCF). The GCF is expected to become an
additional international mechanism to support climate activities in
developing countries. Bilateral climate-related ODA commitments were
at an average of 20 billion USD per year in 2010 and 2011 (2010 / 2011
USD) (OECD, 2013a)
32
and were implemented by bilateral development
banks or bilateral agencies, provided to national government directly
or to dedicated multilateral climate funds (Buchner etal., 2012). How-
ever, bilateral and multilateral commitments are not fully comparable
due to differences between methodologies.
Climate projects in developing countries showed a higher share of bal-
ance-sheet financing and concessional funding provided by national
and international development finance institutions than developed
countries (Buchner etal., 2012). Domestic public development banks
played an important role in this regard. The 11 non-OECD development
30
African Development Bank (AfDB), the Asian Development Bank (ADB), the Euro-
pean Bank for Reconstruction and Development (EBRD), the European Investment
Bank (EIB), the Inter-American Development Bank (IDB), the World Bank (WB),
and the International Finance Corporation (IFC).
31
The reporting is activity-based allowing counting entire projects but also project
components. Recipient countries include developing countries and 13 EU member
states. It covers grant, loan, guarantee, equity, and performance-based instru-
ments, not requiring a specific grant element. The volume covers MDBs’ own
resources as well as external resources managed by the MDBs that might also be
reported to OECD DAC (such as contributions to the GEF, CIFs, and Carbon Funds).
32
It covers total funding committed to projects that have climate change mitigation
or adaptation as a ‘principal’ or ‘significant’ objective. The ODA is defined as
those flows to countries on the DAC List of ODA Recipients and to multilateral
institutions provided by official agencies or by their executive agencies. Resources
must be used to promote the economic development and welfare of developing
countries as a main objective and they must be concessional in character (OECD,
2013a).
Box 16�3 | Least Developed Countries’ investment and finance for low-carbon activities
This box highlights key issues related to investment and
finance for Least Developed Countries (LDCs), however some
of these issues are certainly also relevant for other developing
countries.
Climate change increased the challenges LDCs are facing regard-
ing food, water, and energy that exacerbate sustainable develop-
ment. Most LDCs are highly exposed to climate change effects
as they are heavily reliant on climate-vulnerable sectors such as
agriculture (Harmeling and Eckstein, 2012). Most of the LDCs,
already overwhelmed by poverty, natural disasters, conflicts, and
geophysical constraints, are now at risk of further devastating
impacts of climate change. In turn, they contribute very little to
carbon emissions (Baumert etal., 2005; Fisher, 2013).
At the same time, LDCs are faced with a lack of access to energy
services and with an expected increase in energy demand due to
the population and GDP growth. Of the 1.2 billion people without
electricity in 2010, around 85 % live in rural areas and 87 % in
Sub-Saharan Africa and Southern Asia. For cooking, the access
deficit amounts to 2.8 billion people who primarily rely on solid
fuels. About 78 % of that population lives in rural areas, and 96 %
are geographically concentrated in Sub-Saharan Africa, Eastern
Asia, Southern Asia, and South-Eastern Asia (Sustainable Energy
for All, 2013) (see Section 14.3.2.1 for other estimates provided by
the literature). By investing in mitigation activities in the early and
interim stages, access to clean and sustainable energy can be pro-
vided and environmentally harmful technologies can potentially
be leapfrogged. Consequently, needs for finance and investment
are pressing both for adaptation and mitigation.
Regarding specific mitigation finance needs, there are no robust
data for LDCs. It is estimated that shifting the large populations
that rely on traditional solid fuels (such as unprocessed biomass,
charcoal, and coal) to modern energy systems and expanding
electricity supply for basic human needs could yield substantial
improvements in human welfare for a relatively low cost (72 – 95
billion USD per year until 2030 to achieve nearly universal access)
(Pachauri etal., 2013). For instance, in Bangladesh, the costs
to provide a minimum power from solar home system’s energy
source to off-grid areas was around 285 USD per household
(World Bank, 2012c). However, the very few country studies on
mitigation needs and costs are not representative of the whole
group of LDCs and are not comparable. Data on international and
domestic private sector activities in LDCs are also lacking, as are
data on domestic public flows. With respect to North-South flows,
the OECD DAC reported that developed countries provided 730
million USD in mitigation related ODA to LDCs in the year 2011.
Bangladesh received the highest share with 117 million USD,
followed by Uganda and Haiti with more than 70 million USD
(OECD, 2012).
Most LDCs have very few CDM projects that are also an impor-
tant vehicle for mitigation (UNFCCC, 2012d; UNEP Risø, 2013).
To improve the regional distribution of CDM projects, the CDM
Executive Board has promoted the regulatory reform of CDM
standards, procedures, and guidelines. Furthermore, stakeholder
interaction has been enhanced and a CDM loan scheme has been
established by UNFCCC to provide interest-free loans for CDM
project preparation in LDCs (UNFCCC, 2012e).
Some LDCs are starting to allocate public funds to mitigation and
adaptation activities, e. g., NAPAs or national climate funds (Khan
etal., 2012). However, pressing financial needs to combat poverty
favour other expenditures over climate-related activities.
Most LDCs struggle to provide an enabling environment for pri-
vate business activities, a very common general development issue
(Stadelmann and Michaelowa, 2011). It is noteworthy that among
the 30 lowest-ranking countries in the World Bank’s Doing Busi-
ness Index, 23 countries are LDCs (World Bank, 2011a). Obstacles
to general private business activities in turn hinder long-term
private climate investments (Hamilton and Justice, 2009). Due to
very high perceived risk in LDCs, risk premiums are very high. This
is particularly problematic as low-carbon investments are very
responsive to the cost of capital (Eyraud etal., 2011). In a chal-
lenging environment, it is difficult to implement targeted public
policies and financial instruments to mobilize private mitigation
finance. Moreover, the weakness of technological capabilities in
LDCs presents a challenge for successful development and transfer
of climate-relevant technologies (ICTSD, 2012).
To develop along a low-carbon growth path, LDCs rely on interna-
tional grant and concessional finance. It is especially important to
ensure the predictability and sustainability of climate finance for
LDCs, as these countries are inherently more vulnerable to eco-
nomic shocks due to their structural weaknesses (UNCTAD, 2010).
While all donors and development institutions provide mitigation
finance to LDCs, there are some dedicated institutional arrange-
ments, such as the LDCF and the SCCF under the Convention.
Some LDCs have also implemented national funding institutions,
e. g., Benin, Senegal, and Rwanda in the framework of the Adapta-
tion Fund, or the Bangladesh Climate Change Resilience Fund.
While knowledge and data gaps regarding mitigation finance are
generally higher in developing than in developed countries, they
are even more severe in LDCs.

12351235
Cross-cutting Investment and Finance Issues
16
Chapter 16
developing countries (2011 / 2012 USD). Thereof, 72 % was originating
in the same country as it was invested) (Buchner etal., 2013b). The
total climate finance flowing from developed to developing countries
is estimated to be between 39 and 120 billion USD per year in 2011
and 2012 (2011 / 2012 USD). This range covers public and the more
uncertain flows of private funding for mitigation and adaptation. Clapp
etal. (2012) estimate the total at 70 – 120 billion USD per year based
on 2009 – 2010 data. Data from Buchner etal. (2013a) suggest a net
flow to developing countries for 2010 and 2011 of the order of 40 to
60 billion USD. North-South flows are estimated at 39 to 62 billion USD
per year for 2011 and 2012 (2011 / 2012 USD) (Buchner etal., 2013b).
Public climate finance provided by developed countries to developing
countries was estimated at 35 to 49 billion USD per year in 2011 and
2012 (2011 / 2012USD) (Buchner etal., 2013b). Multilateral and bilat-
eral institutions played an important role in delivering climate finance
to developing countries. Seven MDBs
30
reported climate finance com-
mitments of about 24.1 and 26.8billion USD in 2011 and 2012, respec-
tively
31
(2011 and 2012 USD) (AfDB etal., 2012a; b, 2013). These insti-
tutions manage a range of multi-donor trust climate funds, such as the
Climate Investment Funds, and the funds of the financial mechanism of
the Convention (GEF, SCCF, LDCF). The GCF is expected to become an
additional international mechanism to support climate activities in
developing countries. Bilateral climate-related ODA commitments were
at an average of 20 billion USD per year in 2010 and 2011 (2010 / 2011
USD) (OECD, 2013a)
32
and were implemented by bilateral development
banks or bilateral agencies, provided to national government directly
or to dedicated multilateral climate funds (Buchner etal., 2012). How-
ever, bilateral and multilateral commitments are not fully comparable
due to differences between methodologies.
Climate projects in developing countries showed a higher share of bal-
ance-sheet financing and concessional funding provided by national
and international development finance institutions than developed
countries (Buchner etal., 2012). Domestic public development banks
played an important role in this regard. The 11 non-OECD development
30
African Development Bank (AfDB), the Asian Development Bank (ADB), the Euro-
pean Bank for Reconstruction and Development (EBRD), the European Investment
Bank (EIB), the Inter-American Development Bank (IDB), the World Bank (WB),
and the International Finance Corporation (IFC).
31
The reporting is activity-based allowing counting entire projects but also project
components. Recipient countries include developing countries and 13 EU member
states. It covers grant, loan, guarantee, equity, and performance-based instru-
ments, not requiring a specific grant element. The volume covers MDBs’ own
resources as well as external resources managed by the MDBs that might also be
reported to OECD DAC (such as contributions to the GEF, CIFs, and Carbon Funds).
32
It covers total funding committed to projects that have climate change mitigation
or adaptation as a ‘principal’ or ‘significant’ objective. The ODA is defined as
those flows to countries on the DAC List of ODA Recipients and to multilateral
institutions provided by official agencies or by their executive agencies. Resources
must be used to promote the economic development and welfare of developing
countries as a main objective and they must be concessional in character (OECD,
2013a).
Box 16�3 | Least Developed Countries’ investment and finance for low-carbon activities
This box highlights key issues related to investment and
finance for Least Developed Countries (LDCs), however some
of these issues are certainly also relevant for other developing
countries.
Climate change increased the challenges LDCs are facing regard-
ing food, water, and energy that exacerbate sustainable develop-
ment. Most LDCs are highly exposed to climate change effects
as they are heavily reliant on climate-vulnerable sectors such as
agriculture (Harmeling and Eckstein, 2012). Most of the LDCs,
already overwhelmed by poverty, natural disasters, conflicts, and
geophysical constraints, are now at risk of further devastating
impacts of climate change. In turn, they contribute very little to
carbon emissions (Baumert etal., 2005; Fisher, 2013).
At the same time, LDCs are faced with a lack of access to energy
services and with an expected increase in energy demand due to
the population and GDP growth. Of the 1.2 billion people without
electricity in 2010, around 85 % live in rural areas and 87 % in
Sub-Saharan Africa and Southern Asia. For cooking, the access
deficit amounts to 2.8 billion people who primarily rely on solid
fuels. About 78 % of that population lives in rural areas, and 96 %
are geographically concentrated in Sub-Saharan Africa, Eastern
Asia, Southern Asia, and South-Eastern Asia (Sustainable Energy
for All, 2013) (see Section 14.3.2.1 for other estimates provided by
the literature). By investing in mitigation activities in the early and
interim stages, access to clean and sustainable energy can be pro-
vided and environmentally harmful technologies can potentially
be leapfrogged. Consequently, needs for finance and investment
are pressing both for adaptation and mitigation.
Regarding specific mitigation finance needs, there are no robust
data for LDCs. It is estimated that shifting the large populations
that rely on traditional solid fuels (such as unprocessed biomass,
charcoal, and coal) to modern energy systems and expanding
electricity supply for basic human needs could yield substantial
improvements in human welfare for a relatively low cost (72 – 95
billion USD per year until 2030 to achieve nearly universal access)
(Pachauri etal., 2013). For instance, in Bangladesh, the costs
to provide a minimum power from solar home system’s energy
source to off-grid areas was around 285 USD per household
(World Bank, 2012c). However, the very few country studies on
mitigation needs and costs are not representative of the whole
group of LDCs and are not comparable. Data on international and
domestic private sector activities in LDCs are also lacking, as are
data on domestic public flows. With respect to North-South flows,
the OECD DAC reported that developed countries provided 730
million USD in mitigation related ODA to LDCs in the year 2011.
Bangladesh received the highest share with 117 million USD,
followed by Uganda and Haiti with more than 70 million USD
(OECD, 2012).
Most LDCs have very few CDM projects that are also an impor-
tant vehicle for mitigation (UNFCCC, 2012d; UNEP Risø, 2013).
To improve the regional distribution of CDM projects, the CDM
Executive Board has promoted the regulatory reform of CDM
standards, procedures, and guidelines. Furthermore, stakeholder
interaction has been enhanced and a CDM loan scheme has been
established by UNFCCC to provide interest-free loans for CDM
project preparation in LDCs (UNFCCC, 2012e).
Some LDCs are starting to allocate public funds to mitigation and
adaptation activities, e. g., NAPAs or national climate funds (Khan
etal., 2012). However, pressing financial needs to combat poverty
favour other expenditures over climate-related activities.
Most LDCs struggle to provide an enabling environment for pri-
vate business activities, a very common general development issue
(Stadelmann and Michaelowa, 2011). It is noteworthy that among
the 30 lowest-ranking countries in the World Bank’s Doing Busi-
ness Index, 23 countries are LDCs (World Bank, 2011a). Obstacles
to general private business activities in turn hinder long-term
private climate investments (Hamilton and Justice, 2009). Due to
very high perceived risk in LDCs, risk premiums are very high. This
is particularly problematic as low-carbon investments are very
responsive to the cost of capital (Eyraud etal., 2011). In a chal-
lenging environment, it is difficult to implement targeted public
policies and financial instruments to mobilize private mitigation
finance. Moreover, the weakness of technological capabilities in
LDCs presents a challenge for successful development and transfer
of climate-relevant technologies (ICTSD, 2012).
To develop along a low-carbon growth path, LDCs rely on interna-
tional grant and concessional finance. It is especially important to
ensure the predictability and sustainability of climate finance for
LDCs, as these countries are inherently more vulnerable to eco-
nomic shocks due to their structural weaknesses (UNCTAD, 2010).
While all donors and development institutions provide mitigation
finance to LDCs, there are some dedicated institutional arrange-
ments, such as the LDCF and the SCCF under the Convention.
Some LDCs have also implemented national funding institutions,
e. g., Benin, Senegal, and Rwanda in the framework of the Adapta-
tion Fund, or the Bangladesh Climate Change Resilience Fund.
While knowledge and data gaps regarding mitigation finance are
generally higher in developing than in developed countries, they
are even more severe in LDCs.

12361236
Cross-cutting Investment and Finance Issues
16
Chapter 16
bank members of IDFC provided 44 billion USD of domestic ‘green’
33
finance in 2011 and 2012 (2011 and 2012 USD) (Höhne etal., 2012;
IDFC, 2013).
According to UNFCCC (2011a), AnnexII countries provided an aver-
age of almost 10 billion USD per year of climate finance to develop-
ing countries. In 2009, developed countries committed to provide new
and additional resources approaching 30 billion USD of ‘FSF’ to sup-
port mitigation and adaptation action in developing countries during
2010 – 2012. The sum of the announced commitments exceeds 33 bil-
lion USD (UNFCCC, 2011b, 2012b; c, 2013a). Data on the amount actu-
ally disbursed is not available. Some analyses question whether these
funds were ‘new and additional’ (Brown etal., 2010; Stadelmann etal.,
2010, 2011b).
There is limited robust information on the current magnitude of private
flows from developed to developing countries. Clapp etal. (2012) esti-
mate the private investment at 37 – 72 billion USD per year based on
2009 – 2010 data (2008 / 2009 USD) and Stadelmann etal. (2013) esti-
mate foreign direct investment as equity and loans in the range of 10
to 37 billion USD (2010 and 2008 USD) per year based on 2008 – 2011
data.
In reference scenarios as well as in policy scenarios compatible with a
2 °C warming target in 2100, non-OECD countries absorb the greatest
share of incremental investments in power generation technologies.
Without climate policy, investments in the power sector are mainly
directed towards fossil fuels. About 73 % (65 % to 80 %) of global
investment in fossil power plants between 2010 – 2029, and 78 %
(76 to 80 %) between 2030 – 2049, would flow into in the non-OECD
because many developing countries rely on low-cost coal power plants
to supply an ever-growing demand of electricity in the scenarios exam-
ined (based on IEA (2011), Carraro etal. (2012), Calvin etal. (2012),
and McCollum etal. (2013) used in Section16.2.2). In a climate policy
scenario compatible with a 2 °C warming limit in 2100, non-OECD
countries are expected to absorb 51 % (34 % to 66 %) of incremental
average annual investment in renewables over 2010 – 2029, and 67 %
(61 % to 73 %) over 2030 – 2049.
In tackling climate change, developing countries face different types
and magnitudes of constraints. Out of the 149 assessed develop-
ing countries, only 37 were assigned lower risk country grades. These
countries, being attractive for international private sector investment
in low-carbon technologies, represent 38 % of global CO
2
emissions.
However, the majority of developing countries currently exhibits higher
country risk grades — reflecting less attractive international invest-
33
‘Green’ finance as reported by IDFC includes projects with other environmental
benefits. Approximately 93 % (80 %) of the ‘green’ finance by IDFC in 2011
(2012) was climate finance (Höhne et al., 2012; IDFC, 2013).
ment conditions — and finds it more difficult to attract foreign private
investment (Harnisch and Enting, 2013). Moreover, the lack of techni-
cal capacity and training systems is a significant barrier for low-carbon
investment in many developing economies (Ölz and Beerepoot, 2010).
Between 2005 and 2009, developed countries provided 2.5 billion
USD of ODA to support creation of general enabling environments in
developing countries (2005 – 2009 USD) (Stadelmann and Michaelowa,
2011).
Since investment risks for low-carbon projects in developing countries
are typically perceived to be higher than in developed countries, the
cost of capital and the return requirements of investors are respectively
higher. The IRR for general infrastructure in developing countries, for
instance, is a median of 20 % compared to about 12 % in developed
countries (Ward etal., 2009). Access to affordable long-term capital
is limited in many developing countries (Maclean etal., 2008), where
local banks are not able to lend for 15 – 25 years due to balance sheet
constraints (Hamilton, 2010), such as the mismatch in the maturity of
assets and liabilities. In addition, appropriate financing mechanism for
end-users’ up-take are also often missing (Derrick, 1998). Moreover,
equity finance is scarce in many developed countries, increasing the
dependence on project finance. Especially in low-income countries,
project sponsors frequently rely on external assistance to cover project
development costs for many investments because of their high risks
and non-commercial nature (World Bank, 2011d).
Many developing countries use a range of incentives for investments
in renewable energies (REs), especially fiscal incentives (OECD, 2013d).
Public financing instruments to stimulate RE, such as public invest-
ment, loans, or grants, were in place in 57 % of the countries analyzed
and FITs were established in 39 developing countries in 2012 (REN21,
2012). Carbon pricing has not yet widely been adopted by develop-
ing countries, apart from the non-perfect carbon price incentive via the
CDM. However, currently new ETS are set up, planned, or under con-
sideration in some developing countries such as China (provinces and
cities), Kazakhstan, Ukraine, Chile, Brazil, and South Korea, but it will
take time until such ETS will be fully operational and provide enough
investment certainty (Kossoy etal., 2013).
Regional groupings such as the ECOWAS, the ASEAN, and the Merco-
sur, have been actively promoting sub-regional integration of energy
systems and cooperation in climate change activities.
On the national level, there is an on-going attempt to cope with
the multiplicity of sources, agents, and channels offering financial
resources for climate action (Glemarec, 2011). Most developing coun-
tries rely on relevant ministries and agencies chaired by the ministry
of the environment or finance to coordinate climate change finance
(Gomez-Echeverri, 2010). Some developing countries are establishing
national implementing entities and funds that mainstream climate
change activities into overall development strategies. Often these insti-
tutions are designed to blend international funding with domestic and
private sector resources (Flynn, 2011).

12371237
Cross-cutting Investment and Finance Issues
16
Chapter 16
16.9 Gaps in knowledge
and data
Scientific literature on investment and finance for low-carbon activities
is still very limited and knowledge gaps are substantive.
• Common definitions and data availability. To date there are no
common definitions for central concepts related to climate finance
or financial accounting rules. Neither are there complete or rea-
sonably accurate data on current climate finance and its compo-
nents, namely developed country sources or commitments, devel-
oping country sources or commitments, international flows, and
private vs. public sources. The role of domestic and South-South
flows and domestic investments in developing countries is also not
adequately understood and documented. Frequently it is not pos-
sible to distinguish exactly between adaptation and development
finance, since they are closely interconnected. Another difficult
assessment is on the differences between funding under the ODA
and ‘new and additional’ funds available. Important metrics like
the high-carbon investment by sub-sector and region, the carbon
intensity of new investments, downward deviations from reference
emission pathways, or the cost-effectiveness of global mitigation
investments are not tracked systematically.
• Model outputs and approaches. Only very limited model results
exist for additional investments and incremental costs to abate
CO
2
emissions in sectors other than energy supply, e. g., via energy
efficiency in industry, buildings, and transport, as well as in other
sectors like forestry, agriculture, and waste, or to mitigate process
and non-CO
2
emissions in the petroleum and gas, cement, and
chemical industry, or from refrigeration and air conditioning. Very
limited analysis has been published that takes a globally consis-
tent perspective of incremental investments and costs at the level
of nation states and regions. This perspective could enrich the sci-
entific discussion because global and regional netting approaches
among sectors and sub-sectors may fall short of the complexity of
real political decision making processes.
• A comprehensive and transparent treatment of investment and
technology risks in energy models is not available. The impact of
fuel price volatility on low-carbon investments is generally not
considered. Reasonably robust quantitative results of the need for
additional R&D for low-carbon technologies and practices and on
the timing of these needs (infrastructure and technology deploy-
ment roadmaps) are not available. While there is literature on miti-
gation technology diffusion and transfer in general, it is not clear
whether specific financial requirements to this end are different
from finance for other mitigation activities.
• For the energy sector, there is no convergence on the order of mag-
nitude of net incremental investment costs across its sub-sectors.
Interactions of stringent climate policies with overall growth and
investment of individual economies and the world economy as a
whole are also not yet well understood.
• Effectiveness and efficiency of climate finance� Knowledge
about enabling environments for effective deployment of climate
finance in any country is insufficient. There is very limited empirical
evidence to relate the concept of low-carbon activities to macro
determinants from a cross-country perspective. More research is
especially needed regarding determinants for mitigation invest-
ment in LDCs.
• There is only case-specific knowledge by practitioners on the selec-
tion and combination of instruments that are most effective at
shifting (leveraging) private investment to mitigation and adapta-
tion. There is no general understanding of what are the efficient
levers to mobilize private investment and its potential in any coun-
try (since they will differ by investment and country).
• The effectiveness of different public climate finance channels in
driving low-carbon development is insufficiently analyzed. Esti-
mates of the incremental cost value of public guarantees, export
insurances, and non-concessional loans of development banks
would provide valuable insights. Little is known on determinants
for an economically efficient and effective allocation of public
climate finance. A comprehensive assessment of the interrelation
between private and public sector actors in sharing incremental
costs and risks of mitigation investments, for example, via conces-
sional loans or guarantee instruments has not been undertaken
yet.
• There is no agreement yet which institutional arrangements are
more effective at which level (international — national — local) and
for what investment in which sector. However, an understanding of
the key determinants of this efficiency and of the nature of a future
international climate policy agreement is needed first.
• Balance between mitigation and adaptation finance and
investment� The optimal balance, including its time dimension,
is a difficult exercise given the lack of modelling of any direct
interaction between adaptation and mitigation in terms of their
specific effectiveness and tradeoffs. A better-informed assessment
of the effective integration of mitigation and adaptation, includ-
ing tradeoffs and cost avoidance estimates, is needed. Moreover,
there is limited research and literature to assess synergies and
tradeoffs between and across sector-specific mitigation and adap-
tation measures from the specific financing and investment point
of view.

12381238
Cross-cutting Investment and Finance Issues
16
Chapter 16
16.10 Frequently Asked
Questions
FAQ 16�1 What is climate finance?
There is no agreed definition of climate finance. The term ‘climate
finance’ is applied both to the financial resources devoted to address-
ing climate change globally and to financial flows to developing
countries to assist them in addressing climate change. The literature
includes multiple concepts within each of these broad categories.
There are basically three types of metrics for financial resources
devoted to addressing climate change globally� Total climate
finance includes all financial flows whose expected effect is to reduce
net greenhouse gas emissions and / or to enhance resilience to the
impacts of climate variability and the projected climate change. This
covers private and public funds, domestic and international flows,
expenditures for mitigation and adaptation, and adaptation to current
climate variability as well as future climate change. It covers the full
value of the financial flow rather than the share associated with the
climate change benefit; e. g., the entire investment in a wind turbine
rather than the portion attributed to the emission reductions. The incre-
mental investment is the extra capital required for the initial invest-
ment to implement a mitigation or adaptation measure, for example,
the investment in wind turbines less the investment that would have
been required for a natural gas generating unit displaced. Since the
value depends on a hypothetical alternative, the incremental invest-
ment is uncertain. The incremental costs reflect the cost of capital of
the incremental investment and the change of operating and main-
tenance costs for a mitigation or adaptation project in comparison to
a reference project. It can be calculated as the difference of the net
present values of the two projects. Values depend on the incremental
investment as well as projected operating costs, including fossil fuel
prices, and the discount rate.
Financial flows to assist developing countries in addressing cli-
mate change typically cover the following three concepts. The total
climate finance flowing to developing countries is the amount of the
total climate finance invested in developing countries that comes from
developed countries. This covers private and public funds for mitiga-
tion and adaptation. Public climate finance provided to developing
countries is the finance provided by developed countries’ governments
and bilateral institutions as well as multilateral institutions for mitiga-
tion and adaptation activities in developing countries. Private climate
finance flowing to developing countries is finance and investment by
private actors in / from developed countries for activities in develop-
ing countries. Under the UNFCCC, climate finance is not well-defined.
AnnexII Parties provide and mobilize funding for climate related activ-
ities in developing countries. Most of the funds provided are conces-
sional loans and grants.
FAQ 16�2 How much investment and finance
is currently directed to projects that
contribute to mitigate climate change
and how much extra flows will be
required in the future to stay below the
2 °C limit?
Current climate finance was estimated at around 359 billion USD per
year of which 337 billion USD per year was invested in mitigation
using a mix of 2011 and 2012 data (2011 / 2012 USD). This covers the
full investment in mitigation measures, such as renewable energy gen-
eration technologies that also produce other goods or services. Climate
finance invested in developed countries amounted to 177 billion USD
and in developing countries 182 billion USD (2011 / 2012 USD).
Climate policy is expected to induce a significant change in invest-
ment pattern in all scenarios compatible with a 2 °C limit. Based on
data from a limited number of scenarios, there would need to hap-
pen a remarkable reallocation of investments in the power sector
from fossil fuels to low-emissions generation technologies (renew-
able power generation, nuclear, and electricity generation with CCS).
While annual investment in conventional fossil-fired power plants
without CCS is estimated to decline by about 30 billion USD per year
in 2010 – 2029 (i. e., by 20 % compared to 2010), annual investment
in low-emission generation technologies is expected to increase by
about 147 billion USD per year (i. e., by 100 % compared to 2010),
over the same period.
Investment in energy efficiency in the building, transport, and industry
sector would need to increase by several hundred billion USD per year
from 2010 – 2029. Information on investment needs in other sectors,
e. g., CO
2
to abatement processes or non-CO
2
emissions, is sparse.
Model results suggest that deforestation could be reduced against cur-
rent deforestation trends by 50 % with an investment of 21 to 35 bil-
lion USD annually.

12391239
Cross-cutting Investment and Finance Issues
16
Chapter 16
References
ADB (2003)� Poverty and Environment Fund. Asian Development Bank. Available at:
http: / / www. adb. org / sites / default / files / r123 – 03.pdf.
ADB (2011)� Carbon Market Program: Future Carbon Fund — Change in Fund
Regulations. Asian Development Bank. Available at: http: / / www. adb.
org / sites / default / files / cmp-carbon-fund-regulation-change.pdf.
AfDB (2009)� Congo Basin Forest Fund. Operational Procedures. African Development
Bank. Available at: http: / / www. afdb. org / fileadmin / uploads / afdb / Documents /
Policy-Documents / Congo%20Basin%20Forest%20Fund%20-%20Operational
%20Procedures%20EN.pdf.
AfDB, ADB, EBRD, EIB, IDB, IFC, and World Bank (2012a)� Joint MDB Report on
Adaptation Finance 2011. AfDB, ADB, EBRD, EIB, IDB, IFC, World Bank. Available
at: http: / / climatechange.worldbank.org / sites / default / files / Joint%20MDB%20
Report%20on%20Adaptation%20Finance%202011.pdf.
AfDB, ADB, EBRD, EIB, IDB, IFC, and World Bank (2012b)� Joint MDB Report on
Mitigation Finance 2011. AfDB, ADB, EBRD, EIB, IDB, IFC, World Bank. Available at:
http: / / climatechange.worldbank.org / sites / default / files / MMF_2011_version_
21.pdf.
AfDB, ADB, EBRD, EIB, IDB, IFC, and World Bank (2013)� Joint Report on MDB
Climate Finance 2012. AfDB, ADB, EBRD, EIB, IDB, IFC, World Bank. Available at:
http: / / www. ebrd. com / downloads / sector / sei / climate-finance-2012.pdf.
AGF (2010)� Report of the Secretary-General’s High-Level Advisory Group on Cli-
mate Change Financing (AGF). United Nations, New York, NY, USA, Available
at: http: / / www. un. org / wcm / webdav / site / climatechange / shared / Documents /
AGF_reports / AGF%20Report.pdf.
Alberola E�, and N� Stephan (2010)� Carbon Funds in 2010: Investment in Kyoto
Credits and Emissions Reductions. CDC Climate, Paris, France, Available at:
http: / / www. policymeasures. com / content / files / Carbon_Funds_2010.pdf.
Amazon Fund (2012)� Purpose and Management. Amazon Fund. Available at:
http: / / www. amazonfund. gov. br / FundoAmazonia / fam / site_en / Esquerdo /
Fundo / .
Asian Development Bank (2012)� Services. The Carbon Market Programme. Avail-
able at: http: / / adb-fcf.org / services / .
Asian Development Bank (2013a)� Asia Pacific Carbon Fund (APCF). Available at:
http: / / www. adb. org / site / funds / funds / asia-pacific-carbon-fund-apcf.
Asian Development Bank (2013b)� Future Carbon Fund (FCF). Available at:
http: / / www. adb. org / site / funds / funds / future-carbon-fund-fcf.
Asian Development Bank (2013c)� Clean Energy Financing Partnership Facility
(CEFPF). Available at: http: / / www. adb. org / site / funds / funds / clean-energy-
financing-partnership-facility.
Ayers J� M�, and S� Huq (2009)� Supporting Adaptation to Climate Change: What
Role for Official Development Assistance? Development Policy Review 27,
675 – 692. doi: 10.1111 / j.1467-7679.2009.00465.x, ISSN: 1467 – 7679.
Baumert K� A�, T� Herzog, and J� Pershing (2005)� Navigating the Numbers.
Greenhouse Gas Data and International Climate Policy. World Resources Insti-
tute (WRI), Washington, D. C., USA, ISBN: 1 – 56973 – 599 – 9.
BCCRF (2012)� About us. Bangladesh Climate Change Resilience Fund (BCCRF).
Available at: http: / / bccrf-bd.org / .
Biermann F�, O� Davies, and N� van der Grijp (2009)� Environmental policy inte-
gration and the architecture of global environmental governance. International
Environmental Agreements 9, 351 – 369. doi: DOI 10.1007 / s10784 – 009 – 9111
– 0.
Birckenbach F� (2010)� Instruments to Finance Climate Protection and Adaptation
Investments in Developing and Transition Countries. KfW Entwicklungsbank.
Available at: https: / / www. kfw-entwicklungsbank. de / Download-Center / PDF-
Dokumente-Positionspapiere / 2010_10_Klima_E.pdf.
Blyth W�, M� Yang, and R� Bradley (2007)� Climate Policy Uncertainty and Invest-
ment Risk. International Energy Agency, Paris, France, ISBN: 978-92-64-03014-
5-2007.
BNEF (2011)� Have developed nations broken their promise on $30bn? Bloomberg
New Energy Finance. Available at: http: / / bnef.com / WhitePapers / download / 47.
Bolger J� (2000)� Capacity Development: Why, What and How. Canadian Interna-
tional Development Agency, Gatineau, Quebec, Available at: http: / / portals.
wi.wur.nl / files / docs / SPICAD / 16.%20Why%20what%20and%20how%20
of%20capacity%20development%20-%20CIDA.pdf.
Bosello F�, C� Carraro, and E� De Cian (2010)� Climate Policy and the Optimal Bal-
ance Between Mitigation, Adaptation and Unavoided Damage. Climate Change
Economics 01, 71. doi: 10.1142 / S201000781000008X, ISSN: 2010 – 0078.
Bosetti V�, C� Carraro, R� Duval, and M� Tavoni (2011)� What should we expect
from innovation? A model-based assessment of the environmental and
mitigation cost implications of climate-related R&D. Energy Economics 33,
1313 – 1320. doi: 10.1016 / j.eneco.2011.02.010, ISSN: 0140 – 9883.
Brinkerhoff D� W� (2004)� The Enabling Environment for Implementing the Mil-
lennium Development Goals: Government Actions to Support NGOs. Research
Triangle Institute, Washington, DC, USA. 18 pp. Available at: http: / / www. rti.
org / pubs / Brinkerhoff_pub.pdf.
Brown J�, N� Bird, and L� Schalatek (2010)� Climate finance additionality: emerging
definitions and their implications. Heinrich Böll Foundation North America. Avail-
able at: http: / / www. odi. org. uk / sites / odi.org.uk / files / odi-assets / publications-
opinion-files / 6032.pdf.
De Bruin K�, R� Dellink, and S� Agrawala (2009)� Economic Aspects of Adaptation
to Climate Change: Integrated Assessment Modelling of Adaptation Costs and
Benefits. OECD Environment Working Papers No. 6, OECD ENV / WKP(2009)1.
doi: 10.1787 / 225282538105.
Brunner S�, C� Flachsland, and R� Marschinski (2012)� Credible commitment in car-
bon policy. Climate Policy 12, 255 – 271. doi: 10.1080 / 14693062.2011.582327.
Brunnschweiler C� N� (2010)� Finance for renewable energy: an empirical analysis
of developing and transition economies. Environment and Development Eco-
nomics 15, 241 – 274. doi: 10.1017 / S1355770X1000001X.
Buchner B�, A� Falconer, M� Hervé-Mignucci, and C� Trabacchi (2012)� The Land-
scape of Climate Finance 2012. Climate Policy Initiative, Venice, Italy, Available
at: http: / / climatepolicyinitiative.org / wp-content / uploads / 2012 / 12 / The-Land-
scape-of-Climate-Finance-2012.pdf.
Buchner B�, A� Falconer, M� Hervé-Mignucci, and C� Trabacchi (2013a)� The
landscape of climate finance. In: International Climate Finance. E. Haites, (ed.),
Earthscan, London, United KingdomISBN: forthcoming.
Buchner B�, A� Falconer, M� Hervé-Mignucci, C� Trabacchi, and M� Brinkmann
(2011)� The Landscape of Climate Finance. Climate Policy Initiative, Venice,
Italy, Available at: http: / / climatepolicyinitiative.org / sgg / files / 2011 / 10 / The-
Landscape-of-Climate-Finance-120120.pdf.

12401240
Cross-cutting Investment and Finance Issues
16
Chapter 16
Buchner B�, Hervé-Mignucci, C� Trabacchi, J� Wilkinson, M� Stadelmann, R�
Boyd, F� Mazza, A� Falconer, and V� Micale (2013b)� The Global Landscape
of Climate Finance 2013. Climate Policy Initiative (CPI), Venice, Italy, Available
at: http: / / climatepolicyinitiative.org / wp-content / uploads / 2013 / 10 / The-Global-
Landscape-of-Climate-Finance-2013.pdf.
Burleson E� (2007)� Multilateral Climate Change Mitigation. In: Climate Change
Symposium, University of San Francisco Law Review. University of San Fran-
cisco, San Francisco, CA, USA. 373 pp. Available at: http: / / papers.ssrn.
com / sol3 / papers.cfm?abstract_id=982763.
Calvin K�, L� Clarke, V� Krey, G� Blanford, K� Jiang, M� Kainuma, E� Kriegler,
G� Luderer, and P� R� Shukla (2012)� The role of Asia in mitigating climate
change: Results from the Asia modelling exercise. Energy Economics 34, Sup-
plement 3, S251 – S260. doi: 10.1016 / j.eneco.2012.09.003, ISSN: 0140 – 9883.
Carmody J�, and D� Ritchie (2007)� Investing in Clean Energy and Low Carbon
Alternatives in Asia. Asian Development Bank, Manila, Philippines, 114 pp.
Available at: http: / / www-personal. umich. edu / ~thoumi / Research / Carbon /
Issues / Best%20Practices / clean-energy-low-carbon-alternatives-in-asia.pdf.
Carraro C�, A� Favero, and E� Massetti (2012)� Investments and public finance in
a green, low carbon, economy. Energy Economics 34, Supplement 1, S15 – S28.
doi: 10.1016 / j.eneco.2012.08.036, ISSN: 0140 – 9883.
Carraro C�, and E� Massetti (2011)� Beyond Copenhagen: a realistic climate policy
in a fragmented world. Climatic Change 110, 523 – 542. doi: 10.1007 / s10584-
011-0125-6, ISSN: 0165 – 0009, 1573 – 1480.
Caruso R�, and J� Ellis (2013)� Comparing Definitions and Methods to Estimate
Mobilised Climate Finance. OECD, Paris, France, Available at: http: / / www. oecd-
ilibrary. org / environment / comparing-definitions-and-methods-to-estimate-
mobilised-climate-finance_5k44wj0s6fq2-en.
CDMF (2012)� About us. China Clean Development Mechanism Fund. Available at:
http: / / www. cdmfund. org / eng / about_us.aspx?m=20121025100609733502.
Clapp C�, J� Ellis, J� Benn, and J� Corfee-Morlot (2012)� Tracking Climate Finance:
What and How? Organization for Economic Cooperation and Development /
International Energy Agency, Paris, France, 44 pp. Available at: http: / / www.
oecd. org / env / climatechange / 50293494.pdf.
CMIA (2013)� Climate Market and Investment Association (CMIA). Available at:
http: / / www. cmia. net / .
Corfee-Morlot J�, L� Kamal-Chaoui, M� G� Donovan, I� Cochran, A� Robert, and
J� Teasdale (2009)� Cities, Climate Change and Multilevel Governance. Organi-
zation for Economic Cooperation and Development, Paris, France, Available at:
http: / / www. oecd. org / dataoecd / 30 / 35 / 44232263.pdf.
Cory K�, T� Couture, and C� Kreycik (2009)� Feed-in Tariff Policy: Design, Imple-
mentation, and RPS Policy Interactions. National Renewable Energy Labora-
tory, Golden, Colorado, USA, Available at: http: / / www. nrel. gov / docs / fy09osti /
45549.pdf.
Della Croce R�, F� Stewart, and J� Yermo (2011)� Promoting long-term invest-
ments by institutional investors. OECD Journal: Financial Market Trends 1,
145 – 164. doi: 10.1787 / fmt-2011-5kg55b0z1ktb.
Dellink R�, M� den Elzen, H� Aiking, E� Bergsma, F� Berkhout, T� Dekker, and
J� Gupta (2009)� Sharing the Burden of Financing Adaptation to Climate
Change. Global Environmental Change 19, 411 – 421. doi: 10.1016 / j.gloenv-
cha.2009.07.009, ISSN: 0959 – 3780.
Derrick A� (1998)� Financing mechanisms for renewable energy. Renewable Energy
15, 211 – 214.
Dowlatabadi H� (2007)� On Integration of Policies for Climate and Global Change.
Mitigation and Adaptation Strategies for Global Change 12, 651 – 663. doi:
10.1007 / s11027-007-9092-7.
ECOSOC (2008)� Trends in South-South and Triangular Development Cooperation.
Background Study for the Development Cooperation Forum. United Nations
Economic and Social Council, New York, NY, 58 pp. Available at: http: / / www. un.
org / en / ecosoc / docs / pdfs / south-south_cooperation.pdf.
Ehrlich I�, and G� S� Becker (1972)� Market Insurance, Self-Insurance, and Self-Pro-
tection. Journal of Political Economy 80, 623 – 648. ISSN: 0022 – 3808.
European Commission (2012)� Phase 2 auctions (2008 – 2012). Information by
Member States. Climate Change Directorate General-Policies-Emission Trading
Systemt-EU ETS 2005 – 2012. Available at: http: / / ec.europa.eu / clima / policies /
ets / pre2013 / second / index_en.htm.
Eyraud L�, A� A� Wane, C� Zhang, and B� Clements (2011)� Who’s Going Green
and Why? Trends and Determinants of Green Investment. International Mon-
etary Fund, Washington, D. C., USA, Available at: http: / / www. imf. org / external /
pubs / cat / longres.aspx?sk=25440.0.
Fallasch F�, and L� De Marez (2010)� New and Additional? An assessment of
fast-start finance commitments of the Copenhagen Accord. Climate Analytics.
Available at: http: / / www. climateanalytics. org / sites / default / files / attachments /
publications / 101201_additionality_final.pdf.
Figueiredo P� N� (2003)� Learning, capability accumulation and firms differences:
evidence from latecomer steel. Industrial and Corporate Change 12, 607 – 643.
doi: 10.1093 / icc / 12.3.607.
Fisher S� (2013)� Low carbon resilience in the least developed countries: a panacea
to address climate change? International Institute for Environment and Devel-
opment. Climate Change, Policy and Planning. Available at: http: / / www. iied.
org / low-carbon-resilience-least-developed-countries-panacea-address-climate-
change.
Flynn C� (2011)� Blending Climate Finance through National Climate Funds: A
Guidebook for the Design and Establishment of National Funds to Achieve
Climate Change Priorities. United Nations Development Programme, New
York, NY, USA, Available at: http: / / www. undp. org / content / dam / undp /
library / Environment%20and%20Energy / Climate%20Change / Capacity%20
Development / Blending_Climate_Finance_Through_National_Climate_Funds.pdf.
Fordelone T� Y� (2011)� Triangular Co-Operation and Aid Effectiveness. Can Triangular
Cooperation Make Aid More Effective? Organization for Economic Cooperation
and Development, Paris, France, Available at: http: / / www. oecd. org / dataoecd /
63 / 37 / 46387212.pdf.
Forstater M�, and R� Rank (2012)� Towards Climate Finance Transparency.
Aidinfo / Publish What You Fund, London, UK, Available at: http: / / www.
publishwhatyoufund. org / updates / news / towards-climate-finance-
transparency / .
Frankfurt School-UNEP Centre (2013)� Global Trends in Renewable Energy
Investment 2013. Frankfurt School-UNEP Centre / Bloomberg New Energy
Finance, Frankfurt, Germany, 88 pp. Available at: http: / / fs-unep-centre.
org / sites / default / files / attachments / gtr2013keyfindings.pdf.
Frankfurt School-UNEP Centre, and BNEF (2012)� Global Trends in Renew-
able Energy Investment 2012. United Nations Environment Programme, Paris,
France. Available at: http: / / fs-unep-centre.org / sites / default / files / publications /
globaltrendsreport2012final.pdf.

12411241
Cross-cutting Investment and Finance Issues
16
Chapter 16
Frisari G�, M� Hervé-Mignucci, V� Micale, and F� Mazza (2013)� Risk Gaps:
A Map of Risk Mitigation Instruments for Clean Investments. Climate Pol-
icy Initiative. Available at: http: / / climatepolicyinitiative.org / wp-content /
uploads / 2013 / 01 / Risk-Gaps-A-Map-of-Risk-Mitigation-Instruments-for-Clean-
Investments.pdf.
Fulton M�, B� M� Kahn, N� Mellquist, E� Soong, J� Baker, L� Cotter, and S�
Kreibiehl (2010)� GET FiT Program. Global Energy Transfer Feed-in Tariffs for
Developing Countries. DB Climate Change Advisors, Frankfurt, Germany. Avail-
able at: https: / / www. dbadvisors. com / content / _media / GET_FIT_-_042610_
FINAL.pdf.
Germany Federal Ministry for the Environment Nature Conservation and
Nuclear Safety (2012)� About the ICI. International Climate Initiative. Avail-
able at: http: / / www. bmu-klimaschutzinitiative. de / en / about_the_ici.
Gillingham K�, and J� Sweeney (2011)� Barriers to Implementing Low Carbon
Technologies. Stanford-RFF Climate Policy Conference. 27 pp. Available at:
http: / / www. yale. edu / gillingham / GillinghamSweeney_CCE12_BarriersLow
CarbonTechs.pdf.
Glemarec Y� (2011)� Catalyzing Climate Finance: A Guidebook on Policy and
Financing Options to Support Green, Low-Emission and Climate-Resilient Devel-
opment. United Nations Development Programme, New York, NY, USA, 160 pp.
Global Investor Coalition on Climate Change (2013)� Global Investor Coalition
on Climate Change. Available at: http: / / globalinvestorcoalition.org / .
Gomez-Echeverri L� (2010)� National Funding Entities. Their Role in the Transi-
tion to a New Paradigm of Global Cooperation on Climate Change. Climate
Strategies, European Capacity Building Initiative. Available at: http: / / www.
climatestrategies. org / component / reports / category / 55 / 266.html.
Greene W� (2004)� Aid fragmentation and proliferation: Can donors improve the
delivery of climate finance? IDS Bulletin 35, 66 – 75. doi: 10.1111 / j.1759-
5436.2004.tb00137.x.
Grubb M� (2011)� International Climate Finance from border cost levelling. Climate
Policy 11, 1050 – 1057.
Haites E� (2011)� Climate change finance. Climate Policy 11, 963 – 69.
Haites E�, and C� Mwape (2013)� Sources of long-term climate change finance. In:
International Climate Finance. E. Haites, (ed.), Routledge, Abingdon, UKISBN:
1849714053.
Halsnæs K�, and J� Verhagen (2007)� Development based climate change adapta-
tion and mitigation — conceptual issues and lessons learned in studies in devel-
oping countries. Mitigation and Adaptation Strategies for Global Change 12,
665 – 684. doi: 10.1007 / s11027-007-9093-6, ISSN: 1381 – 2386, 1573 – 1596.
Hamilton K� (2010)� Scaling up Renewable Energy in Developing Countries:
Finance and Investment Perspectives. Chatham House, London, United
Kingdom. Available at: http: / / www. chathamhouse. org / sites / default / files /
public / Research / Energy,%20Environment%20and%20Development / 0410pp_
hamilton.pdf.
Hamilton K�, and S� Justice (2009)� Private Financing of Renewable Energy: A
Guide for Policy Makers. United Nations Environment Programme-Sustain-
able Energy Finance Initiative, Bloomberg Renewable Energy Finance, Cha-
tham House, London, UK, 28 pp. Available at: http: / / sefi.unep.org / fileadmin /
media / sefi / docs / publications / Finance_guide_FINAL-.pdf.
Harmeling S�, and D� Eckstein (2012)� Global Climate Risk Index 2013: Who Suf-
fers Most from Extreme Weather Events? Weather-Related Loss Events in 2011
and 1992 to 2011. Germanwatch, Bonn, Germany, ISBN: 978 – 3-943704 – 04 – 4.
Harnisch J�, and K� Enting (2013)� Country risk levels and cost of political risk
of international greenhouse gas mitigation projects. Greenhouse Gas Measure-
ment and Management 3, 55 – 63. doi: 10.1080 / 20430779.2013.815088.
HBF, and ODI (2013)� Global Climate Finance Architecture. Available at:
http: / / www. climatefundsupdate. org / global-trends / global-finance-architecture.
Höhne N�, S� Khosla, H� Fekete, and A� Gilbert (2012)� Mapping of Green Finance
Delivered by IDFC Members in 2011. International Development Finance Club,
Frankfurt, Germany,
ICCTF (2012)� Background. Indonesia Climate Change Trust Fund (ICCTF). Available
at: http: / / www. icctf. or. id / about / background / .
ICTSD (2012)� Ways to promote enabling environment and to address barriers to
technology development and transfer. International Centre for Trade and Sus-
tainable Development (ICTSD). Available at: http: / / unfccc.int / ttclear / sunsetcms /
storage / contents / stored-file-20130422151335147 / ICTSD_EE.pdf.
IDB (2011)� The Energy Efficiency Guarantee Mechanism. Inter-American Devel-
opment Bank. Available at: http: / / idbdocs.iadb.org / wsdocs / getdocument.
aspx?docnum=36200782.
IDFC (2013)� Mapping of Green Finance Delivered by IDFC Members in 2012. Interna-
tional Development Finance Club (IDFC), Frankfurt, Germany, 33 pp. Available at:
http: / / www. idfc. org / Downloads / Publications / 01_green_finance_mappings /
IDFC_Green_Finance_Mapping_Report_2013_11 – 01 – 13.pdf.
IEA (2009)� World Energy Outlook 2009. International Energy Agency, Paris, France,
708 pp. ISBN: 978-92-64-06130-9.
IEA (2011)� World Energy Outlook 2011. OECD / IEA, Paris, France. ISBN: 978-92-64-
18084-0.
IFC (2009)� IFC’s role and additionality: A primer. International Finance Corporation.
Available at: http: / / www. ifc. org / wps / wcm / connect / e8b825004750cb4db38
7bfbae11ad97e / AdditionalityPrimer.pdf?MOD=AJPERES.
IFC (2013)� Overview of Local Currency Loans and Hedges. International Finance
Corporation Treasury.
Illmann J�, M� Halonen, P� Rinne, S� Huq, and S� Tveitdal (2013)� Scoping Study
Financing Adaptation-Mitigation Synergy Activities. Nordic Council of Ministers,
Copenhagen, Denmark, Available at: http: / / www. norden. org / en / publications /
publikationer / 2013 – 902.
Inderst G�, C� Kaminker, and F� Stewart (2012)� Defining and Measuring Green
Investments: Implications for Institutional Investors’ Asset Allocations. Organi-
zation for Economic Cooperation and Development, Paris, France, 55 pp. Avail-
able at: http: / / www. oecd. org / finance / privatepensions / WP_24_Defining_and_
Measuring_Green_Investments.pdf.
Ingham A�, J� Ma, and A� M� Ulph (2005)� Can Adaptation and Mitigation Be Com-
plements? Tyndall Centre for Climate Change Research, Norwich, UK, 15 pp.
Available at: http: / / www. tyndall. ac. uk / sites / default / files / wp79.pdf.
Isenberg J�, and C� Potvin (2010)� Financing REDD in developing countries: A sup-
ply and demand analysis. Climate Policy 10, 216 – 231.
De Jager D�, and M� Rathmann (2008)� Policy Instrument Design to Reduce
Financing Costs in Renewable Energy Technology Projects. International
Energy Agency / Implementing Agreement on Renewable Energy Technol-
ogy Deployment, Paris, France, 72 pp. Available at: http: / / iea-retd.org / wp-
content / uploads / 2011 / 10 / Policy_Main-Report.pdf.
Jamison E� (2010)� From Innovation to Infrastructure: Financing First Commercial
Clean Energy Projects. CalCEF Innovations, San Francisco, CA, USA, Available at:
http: / / calcef.org / files / 20100601_Jamison.pdf.

12421242
Cross-cutting Investment and Finance Issues
16
Chapter 16
Junghans L�, and S� Harmeling (2013)� Different Tales from Different Countries. A
first assessment of the OECD “Adaptation Marker.” Germanwatch. Available at:
http: / / germanwatch.org / en / download / 7083.pdf.
Jürgens I�, H� Amecke, R� Boyd, B� Buchner, A� Novikova, A� Rosenberg,
K� Stelmakh, and A� Vasa (2012)� The Landscape of Climate Finance in
Germany. Climate Policy Initiative (CPI), Berlin, Germany, Available at:
http: / / climatepolicyinitiative.org / wp-content / uploads / 2012 / 11 / Landscape-of-
Climate-Finance-in-Germany-Full-Report.pdf.
Kaminker C�, and F� Stewart (2012)� Role of Institutional Investors in Financing
Clean Energy. Organization for Economic Cooperation and Development Publish-
ing, Paris, France, Available at: http: / / www. oecd. org / insurance / privatepensions /
WP_23_TheRoleOfInstitutionalInvestorsInFinancingCleanEnergy.pdf.
Kane S�, and J� F� Shogren (2000)� Linking Adaptation and Mitigation in Climate
Change Policy. Climatic Change 45, 75 – 102. doi: 10.1023 / A:1005688900676.
Khan S� M� M�, S� Huq, and M� Shamsuddoha (2012)� The Bangladesh National
Climate Funds. International Institute for Environment and Development /
European Capacity Building Initiative, London / Oxford, Uk, Available at: http: / /
ldcclimate.wordpress.com / ldc-paper-series / .
Kindermann G�, M� Obersteiner, B� Sohngen, J� Sathaye, K� Andrasko, E�
Rametsteiner, B� Schlamadinger, S� Wunder, and R� Beach (2008)� Global
cost estimates of reducing carbon emissions through avoided deforestation.
Proceedings of the National Academy of Sciences of the United States 105,
10302 – 10307. doi: 10.1073 / pnas.0710616105.
Kirkman G� A�, S� Seres, and E� Haites (2013)� Renewable energy: Comparison
of CDM and Annex I projects. Energy Policy 63, 995 – 1001. doi: 10.10.16 / j.
enpol.2013.08.071.
Klein A�, A� Held, M� Ragwitz, G� Resch, and T� Faber (2007)� Evaluation of Dif-
ferent Feed-in Tariff Design Options: Best Practice Paper for the International
Feed-in Cooperation. Karlsruhe, Germany and Laxenburg, Austria: Fraunhofer
Institut Für Systemtechnik Und Innovationsforschung and Vienna University of
Technology Energy Economics Group.
Kossoy A�, R� C� Reddy, M� Bossi, and S� Boukerche (2013)� Mapping Carbon
Pricing Initiatives. Developments and Prospects 2013. World Bank, Wash-
ington, DC, USA, 98 pp. Available at: https: / / www. thepmr. org / system / files /
documents / Mapping%20Carbon%20Pricing%20Initiatives-%20Develop-
ments%20and%20Prospects.pdf.
Kubert C�, and M� Sinclair (2011)� State Support for Clean Energy Deployment:
Lessons Learned for Potential Future Policy. National Renewable Energy
Laboratory (NREL), Golden, Colorado, USA, 97 pp. Available at: http: / / www.
cleanenergystates. org / assets / 2011-Files / Renewable-Energy-Finance / 49340.
pdf.
Lall S� (2002)� Linking FDI and Technology Development for Capacity Building
and Strategic Competitiveness. Transnational Corporations 11, 39 – 88. ISSN:
1014 – 9562.
Lecocq F�, and Z� Shalizi (2007)� Balancing Expenditures on Mitigation of and
Adaptation to Climate Change: An Exploration of Issues Relevant to Devel-
oping Countries. World Bank Policy Research Working Paper WPS4299, 48.
Available at: http: / / www-wds. worldbank. org / external / default / WDSCon-
tentServer / WDSP / IB / 2007 / 08 / 02 / 000158349_20070802095523 / Rendered /
PDF / wps4299.pdf.
Lewis T�, and D� Nickerson (1989)� Self-insurance Against Natural Disasters.
Journal of Environmental Economics and Management 16, 209 – 223. doi:
10.1016 / 0095-0696(89)90010-7, ISSN: 0095 – 0696.
Li J� (2011)� Supporting greenhouse gas mitigation in developing cities: a synthe-
sis of financial instruments. Mitigation and Adaptation Strategies for Global
Change 16, 667 – 698. doi: 10.1007 / s11027-011-9288-8.
Linacre N�, A� Kossoy, and P� Ambrosi (2011)� State and Trends of the Carbon
Market 2011. World Bank, Washington DC, USA, 84 pp. Available at: http: / / sit-
eresources.worldbank.org / INTCARBONFINANCE / Resources / StateAndTrend_
LowRes.pdf.
Machado-Filho H� (2011)� Financial mechanisms under the climate regime.
In: Promoting Compliance in an Evolving Climate Regime. J. Brunnée, M.
Doelle, L. Rajamani (eds.), Cambridge University Press, pp. 216 – 239. ISBN:
9780521136136.
Maclean J�, J� Tan, D� Tirpak, V� Sonntag-O’Brien, and E� Usher (2008)� Pub-
lic Finance Mechanisms to Mobilize Investment in Climate Change Mitigation.
United Nations Environment Programme / Sustainable Energy Finance Initia-
tive. Available at: http: / / www. sefalliance. org / fileadmin / media / sefalliance /
docs / Resources / UNEP_Public_Finance_Report.pdf.
Marangoni G�, and M� Tavoni (2013)� The clean energy R&D gap to 2C. Cli-
mate Change Economics in press. Available at: http: / / www. feem. it / userfiles /
attach / 2013125184504NDL2013 – 093.pdf.
Marsh (2006)� Scoping Study on Financial Risk Management Instruments for
Renewable Energy Projects. United Nations Environment Programme / Sustain-
able Energy Finance Initiative, London, UK, 146 pp. Available at: http: / / www.
newenergyfrontier. com / references / Articles / Financing%20Risk%20Study.pdf.
McCollum D�, Y� Nagai, K� Riahi, G� Marangoni, K� Calvin, R� Pietzcker, J� van
Vliet, and B� van der Zwaan (2013)� Energy investments under climate pol-
icy: a comparison of global models. Climate Change Economics Forthcoming.
McKenzie Hedger M�, E� Martinot, T� Onchan, D� Ahuja, W� Chantanakome, M�
Grubb, J� Gupta, T� Heller, L� Junfeng, M� Mansley, C� Mehl, B� Natarajan,
T� Panayotou, J� Turkson, and D� Wallace (2000)� Enabling Environments
for Technology Transfer. Special Report. In: Methodological and Technological
Issues in Technology Transfer [D. Wallace, B. Metz, O. Davidson, J.-W. Martens,
S. van Rooijen, L. van Wie McGrory (eds)]. Intergovernmental Panel for Climate
Change, Geneva, Switzerland, pp. 107 – 141.
McKinsey (2009)� Pathways to a Low-Carbon Economy. Version 2 of the Global
Greenhouse Gas Abatement Cost Curve. McKinsey, New York, NY, USA. Avail-
able at: https: / / solutions.mckinsey.com / ClimateDesk / default.aspx.
Michaelowa A�, and K� Michaelowa (2011)� Coding Error or Statistical Embellish-
ment? The Political Economy of Reporting Climate Aid. World Development 39.
doi: 10.1016 / j.worlddev.2011.07.020.
MIGA (2012)� Annual Report 2012. Multilateral Investment Guarantee Agency
(MIGA), Washington, D. C., USA, ISBN: 978 – 0-8213 – 9735 – 0.
Mitchell C�, J� L� Sawin, G� R� Pokharei, D� Kammen, Z� Wang, S� Fifita, M� Jac-
card, O� Langniss, H� Lucas, A� Nadai, R� Trujillo Blanco, E� Usher, A� Ver-
bruggen, R� Wüstenhagen, and K� Yamaguchi (2011)� Policy, Financing and
Implementation. In: IPCC Special Report on Renewable Energy Sources and Cli-
mate Change Mitigation [O. Edenhofer, R. Pichs-Madruga, Y. Sokona, K. Seyboth,
P. Matschoss, S. Kadner, T. Zwickel, P. Eickemeier, G. Hansen, S. Schlömer, C. von
Stechow (eds)]. Cambridge University Press, Cambridge, United Kingdom and
New York, NY, USA, pp. 865 – 950. ISBN: 9781107607101.

12431243
Cross-cutting Investment and Finance Issues
16
Chapter 16
Nakooda S�, T� Fransen, T� Kuramochi, A� Caravani, A� Prizzon, N� Shimizu, H�
Tilley, A� Halimanjaya, and B� Welham (2013)� Mobilising International Cli-
mate Finance: Lessons from the Fast-Start Finance Period. Overseas Develop-
ment Institute, World Resources Institute, Institute for Global Environmental
Strategies, London, UK; Washington, D. C., USA; Kanagawa, Japan, Available
at: http: / / www. wri. org / sites / default / files / mobilising_international_climate_
finance.pdf.
New Zealand Ministry for the Environment (2012)� The New Zealand Emission
Trading Scheme. NZ ETS 2011- Facts and figure. Info 662. New Zealand Ministry for
the Environment. Available at: http: / / www. climatechange. govt. nz / emissions-
trading-scheme / building / reports / ets-report / nzets-2011-facts-and-figures-
2012.pdf.
Niggli U�, A� Fließbach, P� Hepperly, and N� Scialabba (2009)� Low Greenhouse
Gas Agriculture: Mitigation and Adaptation Potentials of Sustainable Farming
Systems. Food and Agriculture Organization of the United Nations, Rome, Italy,
Ockwell D� G�, J� Watson, G� MacKerron, P� Pal, and F� Yamin (2008)� Key Policy
Considerations for Facilitating Low-carbon Technology Transfer to Developing
Countries. Energy Policy 36, 4104 – 4115. doi: 10.1016 / j.enpol.2008.06.019.
OECD (2008)� The Paris Declaration on Aid Effectiveness and the Accra Agenda for
Action. Organization for Economic Cooperation and Development Publishing.
Available at: http: / / www. oecd. org / development / effectiveness / 34428351.pdf.
OECD (2012)� OECD.StatExtracts. Aid activities targeting global environmen-
tal objectives. Available at: http: / / stats.oecd.org / Index.aspx?DataSetCode=
RIOMARKERS.
OECD (2013a)� A Post 2015 Information System for International Development
and Climate Finance. Organization for Economic Cooperation and Develop-
ment Publishing, Paris, France, 18 pp. Available at: http: / / www. post2015hlp.
org / wp-content / uploads / 2013 / 05 / OECD_A-Post-2015-Information-
System-for-International-Development-and-Climate-Finance.pdf.
OECD (2013b)� Development Co-operation Directorate (DCD-DAC). Available at:
http: / / www. oecd. org / dac / .
OECD (2013c)� Arrangement on Officially Supported Export Credits. 1 October
2013. TAD / PG (2013) 11. Organization for Economic Cooperation and Devel-
opment Publishing. Available at: http: / / search.oecd.org / officialdocuments /
displaydocumentpdf / ?doclanguage=en&cote=tad / pg%282013 %2911.
OECD (2013d)� Policy Guidance for Investment in Clean Energy Infrastructure.
Expanding Access to Clean Energy for Green Growth and Development. Organi-
zation for Economic Cooperation and Development Publishing, Paris, France, 69
pp. Available at: http: / / www. oecd. org / daf / inv / investment-policy / CleanEnergy
Infrastructure.pdf.
Olbrisch S�, E� Haites, M� Savage, P� Dadhich, M� K� U� N� D� P�-E� Shrivastava,
and 304 East 45th Street Energy Group (2011)� Estimates of incremental
investment for and cost of mitigation measures in developing countries. Cli-
mate Policy 11, 970. ISSN: 1469 – 3062.
Ölz S�, and M� Beerepoot (2010)� Deploying Renewables in Southeast Asia: Trends
and Potentials. Organization for Economic Cooperation and Development Pub-
lishing; International Energy Agency, Paris, France, 164 pp.
OPIC (2012)� OPIC 2011 Annual Report. Investing with Impact for 40 Years. Overseas
Private Investment Corporation (OPIC), Washington, D. C., USA, 59 pp. Avail-
able at: http: / / www. opic. gov / sites / default / files / docs / 051912-annualreport-
FINAL.pdf.
Pachauri S�, B� J� van Ruijven, Y� Nagai, K� Riahi, D� P� Van Vuuren, A� Brew-Ham-
mond, and N� Nakicenovic (2013)� Pathways to achieve universal household
access to modern energy by 2030. Environmental Research Letters, 8. doi:
10.1088 / 1748-9326 / 8 / 2 / 024015.
Patt A� G�, D� P� van Vuuren, F� Berkhout, A� Aaheim, A� F� Hof, M� Isaac, and R�
Mechler (2009)� Adaptation in integrated assessment modeling: where do we
stand? Climatic Change 99, 383 – 402. doi: 10.1007 / s10584-009-9687-y, ISSN:
0165 – 0009, 1573 – 1480.
Pfaff-Simoneit W� (2012)� Entwicklung eines sektoralen Ansatzes zum Aufbau von
nachhaltigen Abfallwirtschaftssystemen in Entwicklungsländern vor dem Hinter-
grund von Klimawandel und Ressourcenverknappung. Universität Rostock, Ros-
tock, 249 pp. Available at: http: / / rosdok.uni-rostock.de / file / rosdok_derivate_
0000005003 / Dissertation_Pfaff-Simoneit_2013.pdf.
Pfeiffer T�, and M� A� Nowak (2006)� Climate Change: All in the Game. Nature
441, 583 – 584. doi: 10.1038 / 441583a.
Poerter G�, N� Bird, N� Kaur, and L� Peskett (2008)� New Finance for Climate
Change and the Environment. World Wide Fund for Nature, Heinrich Böll Stif-
tung, Washington, D. C., 57 pp. Available at: http: / / www. odi. org. uk / sites / odi.
org.uk / files / odi-assets / publications-opinion-files / 3882.pdf.
Ravindranath N� H� (2007)� Mitigation and adaptation synergy in forest sector.
Mitigation and Adaptation Strategies for Global Change 12, 843 – 853. doi:
10.1007 / s11027-007-9102-9, ISSN: 1381 – 2386, 1573 – 1596.
REN21 (2010)� Renewables 2010 — Global Status Report. REN21 Secretariat,
Paris, France, 80 pp. Available at: http: / / www. ren21. net / Portals / 0 / documents /
activities / gsr / REN21_GSR_2010_full_revised%20Sept2010.pdf.
REN21 (2012)� Renewables 2012. Global Status Report. REN21, Paris, France,
176 pp. Available at: http: / / www. ren21. net / Portals / 0 / documents / Resources /
GSR2012_low%20res_FINAL.pdf.
Riahi K�, F� Dentener, D� Gielen, A� Grubler, J� Jewell, Z� Klimont, V� Krey, D�
McCallum, S� Pachauri, S� Rao, B� van Ruijven, D� P� Van Vuuren, and C� Wil-
son (2012)� Energy Pathways for Sustainable Development. In: Global Energy
Assessment: Toward a Sustainable Future. Cambridge University Press and the
International Institute for Applied Systems Analysis, Cambridge, UK; Laxenburg,
Austria, pp. 1203 – 1306. ISBN: 9781107005198.
Roktiyanskiy D�, P� C� Benítez, F� Kraxner, I� McCallum, M� Obersteiner, E�
Rametsteiner, and Y� Yamagata (2007)� Geographically explicit global
modeling of land-use change, carbon sequestration, and biomass supply.
Technol Forecasting Social Change 74, 1057 – 1082. doi: 10.1016 / j.tech-
fore.2006.05.022.
Romani M� (2009)� Gobal architecture. In: Meeting the Climate Challenge: Using Pub-
lic Funds to Leverage Private Investment in Developing Countries. LSE Grantham
Research Institute on Climate Change and Environment, London, United Kingdom
Available at: http: / / www2. lse. ac. uk / GranthamInstitute / publications / Other /
Leveragedfunds / sectionfive.pdf.
Ryan L�, N� Semet, and A� Aasrud (2012)� Plugging the Energy Efficiency Gap
with Climate Finance. The Role of International Financial Institutions (IFIs) and
the Green Climate Fund to Realise the Potential of Energy Efficiency in Develop-
ing Countries. International Energy Agency, Paris, France, 72 pp. Available at:
http: / / www. iea. org / publications / freepublications / publication / PluggingEnergy
EfficiencyGapwithClimateFinance_WEB.pdf.

12441244
Cross-cutting Investment and Finance Issues
16
Chapter 16
Sathaye J�, W� Makundi, L� Dale, P� Chan, and K� Andrasko (2006)� GHG mitiga-
tion potential, costs, and benefits in global forests. Energy Journal 27, 127 – 162.
Satterthwaite D� (2007)� Adaptation Options for Infrastructure in Developing
Countries. A Report to the UNFCCC Financial and Technical Support Division.
United Nations Framework Convention on Climate Change, Bonn, Germany,
24 pp. Available at: http: / / unfccc.int / files / cooperation_and_support / financial_
mechanism / application / pdf / satterthwaite.pdf.
Schelling T� C� (1992)� Some Economics of Global Warming. The American Eco-
nomic Review 82, 1 – 14. ISSN: 0002 – 8282.
Setzer J� (2009)� Sub-national and Transnational Climate Change Gover-
nance: Evidence from the State and City of Sao Paulo, Brazil. In: Fifth Urban
Research Symposium. World Bank, Marseille, France. 15 pp. Available at:
http: / / siteresources.worldbank.org / INTURBANDEVELOPMENT / Resources /
336387 – 1256566800920 / 6505269 – 1268260567624 / Setzer.pdf.
Sharan D� (2008)� Financing Climate Change Mitigation and Adaptation Role of
Regional Financing Arrangements. Asian Development Bank, Manila, Philippines,
20 pp. Available at: http: / / www. adb. org / Documents / Papers / ADB-Working-
Paper-Series / ADB-WP04-Financing-Climate-Change-Mitigation.pdf.
Smallridge D�, B� Buchner, C� Trabacchi, M� Netto, J� J� Gomes Lorenzo, and L�
Serra (2012)� The Role of National Development Banks in Intermediating Inter-
national Climate Finance to Scale Up Private Sector Investments. International
Development Association, Washington, DC, USA. Available at: http: / / idbdocs.
iadb.org / wsdocs / getdocument.aspx?docnum=37292040.
Sohngen B�, and R� Mendelsohn (2003)� An optimal control model of forest car-
bon sequestration. American Journal of Agricultural Economics 85, 448 – 457.
Sonntag-O’Brien V�, and E� Usher (2006)� Mobilizing finance for renewable ener-
gies. In: Renewable Energy: A Global Review of Technologies, Policies and Mar-
kets. D. Aßmann, U. Laumanns, D. Uh, (eds.), Earthscan, Sterling, VA, USAISBN:
978 – 1-84407 – 261 – 3.
Stadelmann M� (2013)� The effectiveness of international climate finance in
enabling low-carbon development: Comparing public finance and carbon
markets. University of Zurich, Zurich, 215 pp. Available at: http: / / opac.nebis.
ch / ediss / 20131748.pdf.
Stadelmann M�, P� Castro, and A� Michaelowa (2011a)� Mobilizing Private Finance
for Low-Carbon Development. Climate Strategies, London, United Kingdom,
29 pp. Available at: http: / / www. climatestrategies. org / research / our-reports /
category / 71 / 334.html.
Stadelmann M�, and A� Michaelowa (2011)� How to Enable the Private Sector to
Mitigate? Climate Strategies Working Paper, London, UK, 50 pp.
Stadelmann M�, A� Michaelowa, and J� T� Roberts (2013)� Difficulties in account-
ing for private finance in international climate policy. Climate Policy 13,
718 – 737. doi: 10.1080 / 14693062.2013.791146.
Stadelmann M�, J� T� Roberts, and S� Huq (2010)� Baseline for Trust: Defining
“new and additional” Climate Funding. International Institute for Environ-
ment and Development (IIED), London, UK, 4 pp. Available at: http: / / pubs.iied.
org / pdfs / 17080IIED.pdf.
Stadelmann M�, J� T� Roberts, and A� Michaelowa (2011b)� New and additional
to what? Assessing options for baselines to assess climate finance pledges. Cli-
mate and Development 3, 175 – 192. doi: 10.1080 / 17565529.2011.599550.
Sustainable Energy for All (2013)� Chapter 2: Universal Access to Modern Energy
Services. In: Global Tracking Framework. United Nations, New York, NY, USA.
Available at: http: / / www. sustainableenergyforall. org / images / Global_Tracking /
7-gtf_ch2.pdf.
TCX (2013a)� Local Currency Matters. The Currency Exchange Fund. Available at:
https: / / www. tcxfund. com / sites / default / files / attachments / 160113_tcx_
overview_global_english_master.pdf.
TCX (2013b)� About TCX. Available at: https: / / www. tcxfund. com / about-tcx.
Tirpak D�, K� Stasio, and L� Tawney (2012)� Monitoring the Receipt of Interna-
tional CLimate Finance by Developing Countries. World Resources Institute.
Available at: http: / / pdf.wri.org / monitoring_receipt_of_international_climate_
finance_by_developing_countries.pdf.
Tol R� S� J� (2007)� The double trade-off between adaptation and mitigation for
sea level rise: an application of FUND. Mitigation and Adaptation Strategies
for Global Change 12, 741 – 753. doi: 10.1007 / s11027-007-9097-2, ISSN:
1381 – 2386, 1573 – 1596.
Tuerk A�, D� Fazekas, H� Schreiber, D� Frieden, C� Wolf (2013)� Green Invest-
ment Schemes: The AAU market between 2008 – 2012. Climate Strategies,
London, UK, 43pp. Available at: http: / / www. climatestrategies. org / component /
reports / category / 36 / 378.html.
UNCTAD (1998)� Report of the Expert Meeting on the Impact of Government
Policy and Government / Private Action in Stimulating Inter-Firm Partnerships
Regarding Technology, Production and Marketing, with Particular Emphasis on
North – South and South – South Linkages in Promoting Technology Transfers
(Know-How, Management Expertise) and Trade for SME Development. United
Nations Conference on Trade and Development, Geneva, Switzerland, 19 pp.
Available at: http: / / unctad.org / en / Docs / c3em4d3.en.pdf.
UNCTAD (2010)� The Least Developed Country Report 2010. Towards a New Inter-
national Architecture for LDCs. United Nations Conference on Trade and Devel-
opment, Geneva, Switzerland, 298 pp. ISBN: 978 – 92 – 1-112813 – 0.
UNDP (2011)� Blending Climate Finance Through National Climate Funds. United
Nations Development Programme, New York, NY, USA, 64 pp. Available at:
http: / / www. undp. org / content / dam / undp / library / Environment%20and%20
Energy / Climate%20Change / Capacity%20Development / Blending_Climate_
Finance_Through_National_Climate_Funds.pdf.
UNDP (2013a)� Country Reports on Climate Public Expenditures and Insti-
tutional Reviews (CPEIR). Available at: http: / / www. climatefinance-
developmenteffectiveness. org / publications.html.
UNDP (2013b)� Ethiopia Climate resilient Green Economy Facility. Available at:
http: / / mptf.undp.org / factsheet / fund / 3ET00.
UNEP (2005)� Public Finance Mechanism to Catalyze Sustainable Energy Sector
Growth. United Nations Environment Programme, Geneva, Switzerland, 68 pp.
ISBN: 92 – 807 – 2592 – 0.
UNEP (2007)� Guidebook to Financing CDM Projects. United Nations Environment
Programme, Geneva, Switzerland, 104 pp. ISBN: 978-87-550-3594-2.
UNEP (2008)� Study on Establishing the Congo Basin Forest Fund (CBFF). Gover-
nance Structure. United Nations Environment Programme, Geneva, Switzer-
land, 65 pp. Available at: http: / / www. cbfp. org / docs / rapports_act / UNEP%20
CBF%20study.pdf.
UNEP (2010)� Bilateral Finance Institutions and Climate Change. A Mapping of
2009 Climate Financial Flows to Developing Countries. United Nations Envi-
ronment Programme, Paris, France, 32 pp. Available at: http: / / www. unep.
org / pdf / dtie / BilateralFinanceInstitutionsCC.pdf.
UNEP (2011)� Bilateral Finance Institutions and Climate Change. A Mapping off
Public Financial Flows for Mitigation and Adaptation to Developing Countries
in 2010. United Nations Environment Programme, Paris, France, Available at:
http: / / www. unep. org / pdf / Mapping_report_final.pdf.

12451245
Cross-cutting Investment and Finance Issues
16
Chapter 16
UNEP (2012)� Bilateral Finance Institutions and Climate Change. A Mapping of 2011
Climate Finance Flows to Developing Countries. United Nations Environment
Programme, Paris, France. Available at: http: / / www. unep-fin. org / publications /
unep-bfi-ccwg.html.
UNEP Risø (2013)� UNEP Risø CDM / JI Pipeline Analysis and Database, September
2013. Available at: http: / / www. cdmpipeline. org / .
UNFCCC (1992)� United Nations Framework Convention on Climate Change. United
Nations Framework Convention on Climate Change, Bonn, Germany. Available
at: http: / / unfccc.int / resource / docs / convkp / conveng.pdf.
UNFCCC (1998)� Kyoto Protocol to the United Nations Framwork Convention on
Climate Change. United Nations Framework Convention on Climate Change,
Bonn, Germany. Available at: http: / / unfccc.int / resource / docs / convkp / kpeng.
pdf.
UNFCCC (2007)� Investment and Financial Flows to Address Climate Change.
UNFCCC, Bonn, Germany, ISBN: 92 – 9219 – 042 – 3.
UNFCCC (2008)� Investment and Financial Flows to Address Climate Change: An
Update. United Nations Framework Convention on Climate Change, Bonn, Ger-
many, 111 pp. Available at: http: / / unfccc.int / resource / docs / 2008 / tp / 07.pdf.
UNFCCC (2009a)� Copenhagen Accord (2 / CP.15). United Nations Framework Con-
vention on Climate Change. Available at: http: / / unfccc.int / resource / docs / 2009
/ cop15 / eng / 11a01.pdf.
UNFCCC (2009b)� Strategy paper for the long-term perspective beyond 2012,
including sectoral approaches, to facilitate the development, deployment, dif-
fusion and transfer of technologies under the Convention. Report by the Chair
of the Expert Group on Technology Transfer. FCCC / SB / 2009 / 3. United Nations
Framework Convention on Climate Change. Available at: http: / / unfccc.int / reso
urce / docs / 2009 / sb / eng / 03.pdf.
UNFCCC (2010)� The Cancun Agreements: Outcome of the work of the Ad Hoc
Working Group on Long-term Cooperative Action under the Convention
(1 / CP.16). United Nations Framework Convention on Climate Change. Available
at: http: / / unfccc.int / resource / docs / 2010 / cop16 / eng / 07a01.pdf.
UNFCCC (2011a)� Compilation and Synthesis of Fifth National Communications.
FCCC / SBI / 2011 / INF.1 / Add.2. United Nations Framework Convention on Cli-
mate Change. Available at: http: / / unfccc.int / resource / docs / 2011 / sbi / eng / inf0
1a02.pdf.
UNFCCC (2011b)� Submissions on information from developed country Parties on
the resources provided to fulfil the commitment referred to in decision 1 / CP.16,
paragraph 95. FCCC / CP / 2011 / INF.1. United Nations Framework Convention on
Climate Change. Available at: http: / / unfccc.int / resource / docs / 2011 / cop17 / eng
/ inf01.pdf.
UNFCCC (2011c)� Launching the Green Climate Fund (3 / CP.17).
FCCC / CP / 2011 / 9 / Add.1. United Nations Framework Convention on Climate
Change. Available at: http: / / unfccc.int / resource / docs / 2011 / cop17 / eng / 09a01.
pdf#page=55.
UNFCCC (2012a)� Outcome of the work of the Ad Hoc Working Group on Further
Commitments for AnnexI Parties under the Kyoto Protocol: Draft decision pro-
posed by the President. Draft decision - / CMP.8, Amendment to the Kyoto Pro-
tocol pursuant to its Article 3, paragraph 9. United Nations Framework Conven-
tion on Climate Change. Available at: http: / / unfccc.int / resource / docs / 2012 / cm
p8 / eng / l09.pdf.
UNFCCC (2012b)� Submissions on information from developed country Parties on
the resources provided to fulfil the commitment referred to in decision 1 / CP.16,
paragraph 95. FCCC / CP / 2012 / INF.1. United Nations Framework Convention on
Climate Change. Available at: http: / / unfccc.int / resource / docs / 2012 / cop18 / eng
/ inf01.pdf.
UNFCCC (2012c)� Submissions on information from developed country Parties on
the resources provided to fulfil the commitment referred to in decision 1 / CP.16,
paragraph 95. FCCC / CP / 2012 / INF.1 / Add.1. United Nations Framework Conven-
tion on Climate Change. Available at: http: / / unfccc.int / resource / docs / 2012 / co
p18 / eng / inf01a01.pdf.
UNFCCC (2012d)� Benefits of the Clean Development Mechanism 2012. United
Nations Framework Convention on Climate Change, Bonn, Germany, 102 pp.
ISBN: 92 – 9219 – 097 – 0.
UNFCCC (2012e)� Annual Report of the Executive Board of the Clean Develop-
ment Mechanism to the Conference of the Parties Serving as the Meeting of
the Parties to the Kyoto Protocol. FCCC / KP / CMP / 2012 / 3 (Part I). United Nations
Framework Convention on Climate Change, Bonn, Germany, 20 pp. Available
at: http: / / unfccc.int / resource / docs / 2012 / cmp8 / eng / 03p01.pdf.
UNFCCC (2013a)� Submissions on information from developed country Parties on
the resources provided to fulfil the commitment referred to in decision 1 / CP.16,
paragraph 95. FCCC / CP / 2013 / INF.1. United Nations Framework Convention on
Climate Change. Available at: http: / / unfccc.int / resource / docs / 2013 / cop19 / eng
/ inf01.pdf.
UNFCCC (2013b)� Finance — Introduction. Available at: http: / / unfccc.int / cooperation_
and_support / financial_mechanism / items / 2807.php.
UNFCCC (2013c)� The Mechanism under the Kyoto Protocol: Emission Trading,
the Clean Development Mechanism and Joint Implementation. Available at:
http: / / unfccc.int / kyoto_protocol / mechanisms / items / 1673.php.
UN-Habitat (2011)� Cities and Climate Change: Global Report on Human Settle-
ments 2011. Earthscan, Oxford, UK, 300 pp. ISBN: 978 – 92 – 1-131929 – 3.
Urpelainen J� (2010)� A Theory of North-South Climate Finance. New York
University, New York, NY, USA, 32 pp. Available at: http: / / politics.as.nyu.
edu / docs / IO / 16188 / north.pdf.
Venugopal S�, and A� Srivastava (2012)� Moving the Fulcrum: A Primer on Pub-
lic Climate Financing Instruments Used to Leverage Private Capital. World
Resources Institute (WRI), Washington, D. C., USA, Available at: http: / / pdf.wri.
org / moving_the_fulcrum.pdf.
Veys A� (2010)� The Sterling Bond Markets and Low Carbon or Green Bonds.
Third Generation Environmentalism (E3G), London, UK, 38 pp. Available at:
http: / / www. e3g. org / images / uploads / The_Sterling_Bond_Markets.pdf.
Wang W�, and B� A� McCarl (2011)� Inter-Temporal Investment in Climate Change
Adaptation and Mitigation. Department of Agricultural Economics, Texas A&M
University, Pittsburgh, Pennsylvania. 24 pp.
Ward J�, S� Frankhauser, C� Hepburn, and H� Jackson (2009)� Catalyzing Low-
Carbon Growth in Developing Economies. Public Finance Mechanisms to Scale
up Private Sector Investment in Climate Solutions. United Nations Environ-
ment Programme, Geneva, Switzerland, 28 pp. Available at: http: / / www. unep.
org / PDF / PressReleases / Public_financing_mechanisms_report.pdf.
WBCSD (2013)� Business Solutions for a Sustainable World. Available at:
http: / / www. wbcsd. org / home.aspx.

12461246
Cross-cutting Investment and Finance Issues
16
Chapter 16
Wilbanks T� J�, P� Leiby, R� Perlack, J� T� Ensminger, and S� B� Wright (2007)�
Toward an integrated analysis of mitigation and adaptation: some preliminary
findings. Mitigation and Adaptation Strategies for Global Change 12, 713 – 725.
doi: 10.1007 / s11027-007-9095-4.
Wilbanks T� J�, and J� Sathaye (2007)� Integrating mitigation and adaptation as
responses to climate change: a synthesis. Mitigation and Adaptation Strate-
gies for Global Change 12, 957 – 962. doi: 10.1007 / s11027-007-9108-3, ISSN:
1381 – 2386, 1573 – 1596.
Wohlgemuth N�, and R� Madlener (2000)� Financial support of renewable energy
systems: Investments vs operating cost subsidies. In: Proceedings of the Norwe-
gian Associations for Energy Economics (NAEE). Bergen, Norway. 10 pp.
World Bank (2010)� Monitoring Climate Finance and ODA. World Bank,
Washington, D. C., 8 pp. Available at: http: / / climatechange.worldbank.
org / sites / default / files / documents / DCFIB%231-web-June15.pdf.
World Bank (2011a)� Doing Business 2011: Making a Difference for Entrepreneurs.
World Bank, Washington, D. C., USA, 267 pp. ISBN: 978 – 0-8213 – 7960 – 8.
World Bank (2011b)� Climate Investment Funds. Governance Framework for the
Clean Technology Fund. Adopted November 2008 and amended December
2011. World Bank. Available at: http: / / www. climateinvestmentfunds. org / cif /
sites / climateinvestmentfunds.org / files / CTF%20Governance%20Framework-
FINAL.pdf.
World Bank (2011c)� Climate Investment Funds. Governance Framework for
the Strategic Climate Fund. Adopted November 2008 and amended Decem-
ber 2011. World Bank. Available at: https: / / www. climateinvestmentfunds.
org / cif / sites / climateinvestmentfunds.org / files / SCF%20Governance%20Frame-
work-FINAL.pdf.
World Bank (2011d)� Financing Renewable Energy. Options for Developing Financ-
ing Instruments Using Public Funds. World Bank, Washington, D. C., 50 pp. Avail-
able at: http: / / siteresources.worldbank.org / EXTENERGY2 / Resources / SREP_
financing_instruments_sk_clean2_FINAL_FOR_PRINTING.pdf.
World Bank (2012a)� Trustee Presentation: Update on Status of Resources and
CER Monetization. AFB / B.19 / Inf.4. Adaptation Fund. Available at: https: / / www.
adaptation-fund. org / sites / default / files / AFB.B.19.Inf_.4 %20CER%20
trustee%20presentation.pdf.
World Bank (2012b)� Guyana REDD+ Investment Fund (GRIF). Concessional
Finance and Global Partnerships. Available at: www. worldbank. org / grif.
World Bank (2012c)� Bangladesh Economic Update. Oktober 2012. World Bank.
Available at: http: / / www-wds. worldbank. org / external / default / WDSContent-
Server / WDSP / IB / 2012 / 10 / 19 / 000386194_20121019040128 / Rendered / PDF /
733020WP0Bangl0disclosed0100180120.pdf.
World Bank (2013)� Carbon Finance at the World Bank: List of Funds. Available at:
https: / / wbcarbonfinance.org / Router.cfm?Page=Funds&ItemID=24670.
World Bank Group, IMF, OECD, AfDB, ADB, EBRD, EIB, and IDB (2011)� Mobi-
lizing Climate Finance. Paper Prepared at the Request of G20 Finance Minis-
ters. World Bank, Washington, D. C., USA, 56 pp. Available at: http: / / www. imf.
org / external / np / g20 / pdf / 110411c.pdf.
World Bank, and UNDP (2012)� Funding Sources. Climate Finance Options. Avail-
able at: http: / / climatefinanceoptions.org / cfo / funding-sources.
