
SPM
Summary
for Policymakers
Coordinating Lead Authors:
Ottmar Edenhofer (Germany), Ramon Pichs-Madruga (Cuba),
Youba Sokona (Ethiopia/Mali), Kristin Seyboth (Germany/USA)
Lead Authors:
Dan Arvizu (USA), Thomas Bruckner (Germany), John Christensen (Denmark),
Helena Chum (USA/Brazil) Jean-Michel Devernay (France), Andre Faaij (The Netherlands),
Manfred Fischedick (Germany), Barry Goldstein (Australia), Gerrit Hansen (Germany),
John Huckerby (New Zealand), Arnulf Jäger-Waldau (Italy/Germany), Susanne Kadner (Germany),
Daniel Kammen (USA), Volker Krey (Austria/Germany), Arun Kumar (India),
Anthony Lewis (Ireland), Oswaldo Lucon (Brazil), Patrick Matschoss (Germany),
Lourdes Maurice (USA), Catherine Mitchell (United Kingdom), William Moomaw (USA),
José Moreira (Brazil), Alain Nadai (France), Lars J. Nilsson (Sweden), John Nyboer (Canada),
Atiq Rahman (Bangladesh), Jayant Sathaye (USA), Janet Sawin (USA), Roberto Schaeffer (Brazil),
Tormod Schei (Norway), Steffen Schlömer (Germany), Ralph Sims (New Zealand),
Christoph von Stechow (Germany), Aviel Verbruggen (Belgium), Kevin Urama (Kenya/Nigeria),
Ryan Wiser (USA), Francis Yamba (Zambia), Timm Zwickel (Germany
)
Special Advisor:
Jeffrey Logan (USA)
This chapter should be cited as:
IPCC, 2011: Summary for Policymakers. In: IPCC Special Report on Renewable Energy Sources and Climate Change Mitigation
[O. Edenhofer, R. Pichs-Madruga, Y. Sokona, K. Seyboth, P. Matschoss, S. Kadner, T. Zwickel, P. Eickemeier, G. Hansen,
S. Schlömer, C. von Stechow (eds)], Cambridge University Press, Cambridge, United Kingdom and New York, NY, USA.

4
Summary for Policymakers Summaries

Summaries Summary for Policymakers
5
Table of Contents
1. Introduction . . . . . . . . . . . . . . . . . . . . . . . . . . . . . . . . . . . . . . . . . . . . . . . . . . . . . . . . . . . . . . . . . . . . . . . . . . . . . . . . . . . . . . . . . . . . . . . . . . . . . . . . . . . . . . . . . . . . . . . . . . . . . . . . . . . . . . . . . . . . . 6
2. Renewable energy and climate change . . . . . . . . . . . . . . . . . . . . . . . . . . . . . . . . . . . . . . . . . . . . . . . . . . . . . . . . . . . . . . . . . . . . . . . . . . . . . . . . . . . . . . . . . . . . . . . 7
3. Renewable energy technologies and markets . . . . . . . . . . . . . . . . . . . . . . . . . . . . . . . . . . . . . . . . . . . . . . . . . . . . . . . . . . . . . . . . . . . . . . . . . . . . . . . . . . 7
4. Integration into present and future energy systems . . . . . . . . . . . . . . . . . . . . . . . . . . . . . . . . . . . . . . . . . . . . . . . . . . . . . . . . . . . . . . . . . . . . . . . 15
5. Renewable energy and sustainable development . . . . . . . . . . . . . . . . . . . . . . . . . . . . . . . . . . . . . . . . . . . . . . . . . . . . . . . . . . . . . . . . . . . . . . . . . . . . 18
6. Mitigation potentials and costs . . . . . . . . . . . . . . . . . . . . . . . . . . . . . . . . . . . . . . . . . . . . . . . . . . . . . . . . . . . . . . . . . . . . . . . . . . . . . . . . . . . . . . . . . . . . . . . . . . . . . . . . . . 20
7. Policy, implementation and fi nancing . . . . . . . . . . . . . . . . . . . . . . . . . . . . . . . . . . . . . . . . . . . . . . . . . . . . . . . . . . . . . . . . . . . . . . . . . . . . . . . . . . . . . . . . . . . . . . . . 24
8. Advancing knowledge about renewable energy . . . . . . . . . . . . . . . . . . . . . . . . . . . . . . . . . . . . . . . . . . . . . . . . . . . . . . . . . . . . . . . . . . . . . . . . . . . . . . 26

6
1. Introduction
The Working Group III Special Report on Renewable Energy Sources and Climate Change Mitigation (SRREN) presents
an assessment of the literature on the scientifi c, technological, environmental, economic and social aspects of the
contribution of six renewable energy (RE) sources to the mitigation of climate change. It is intended to provide policy
relevant information to governments, intergovernmental processes and other interested parties. This Summary for
Policymakers provides an overview of the SRREN, summarizing the essential fi ndings.
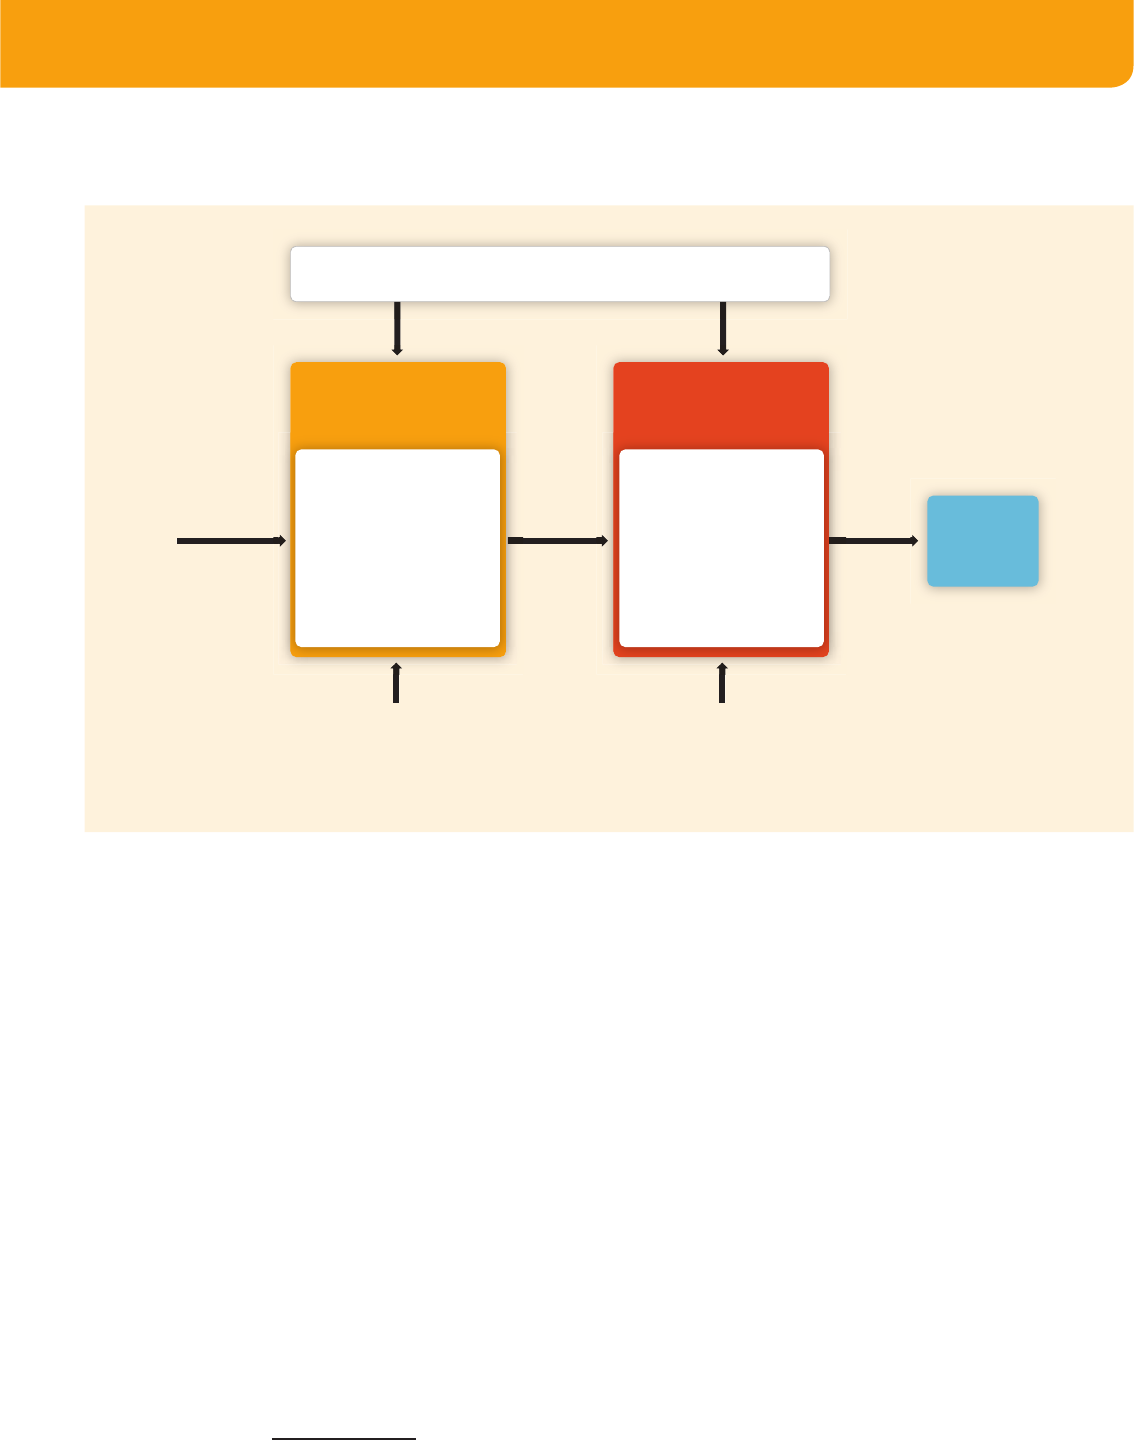
The SRREN consists of 11 chapters. Chapter 1 sets the context for RE and climate change; Chapters 2 through 7 provide
information on six RE technologies, and Chapters 8 through 11 address integrative issues (see Figure SPM.1).
2. Bioenergy
3. Direct Solar Energy
4. Geothermal Energy
5. Hydropower
6. Ocean Energy
7. Wind Energy
1. Renewable Energy and Climate Change
8. Integration of Renewable Energy into Present and Future Energy Systems
9. Renewable Energy in the Context of Sustainable Development
10. Mitigation Potential and Costs
11. Policy, Financing and Implementation
Integrative Chapters
Introductory Chapter
Technology Chapters
Special Report on Renewable Energy Sources and Climate Change Mitigation
Figure SPM.1 | Structure of the SRREN. [Figure 1.1, 1.1.2]
References to chapters and sections are indicated with corresponding chapter and section numbers in square brackets. An
explanation of terms, acronyms and chemical symbols used in this SPM can be found in the glossary of the SRREN (Annex I).
Conventions and methodologies for determining costs, primary energy and other topics of analysis can be found in Annex II
and Annex III. This report communicates uncertainty where relevant.
1
1 This report communicates uncertainty, for example, by showing the results of sensitivity analyses and by quantitatively presenting ranges in cost
numbers as well as ranges in the scenario results. This report does not apply formal IPCC uncertainty terminology because at the time of the
approval of this report, IPCC uncertainty guidance was in the process of being revised.
Summary for Policymakers Summaries

7
Summaries Summary for Policymakers
2. Renewable energy and climate change
Demand for energy and associated services, to meet social and economic development and improve human
welfare and health, is increasing. All societies require energy services to meet basic human needs (e.g., lighting,
cooking, space comfort, mobility and communication) and to serve productive processes. [1.1.1, 9.3.2] Since approxi-
mately 1850, global use of fossil fuels (coal, oil and gas) has increased to dominate energy supply, leading to a rapid
growth in carbon dioxide (CO
2
) emissions. [Figure 1.6]
Greenhouse gas (GHG) emissions resulting from the provision of energy services have contributed signifi -
cantly to the historic increase in atmospheric GHG concentrations. The IPCC Fourth Assessment Report (AR4)
concluded that “Most of the observed increase in global average temperature since the mid-20th century is very likely
2
due to the observed increase in anthropogenic greenhouse gas concentrations.”
Recent data confi rm that consumption of fossil fuels accounts for the majority of global anthropogenic GHG
emissions.
3
Emissions continue to grow and CO
2
concentrations had increased to over 390 ppm, or 39% above prein-
dustrial levels, by the end of 2010. [1.1.1, 1.1.3]
There are multiple options for lowering GHG emissions from the energy system while still satisfying the
global demand for energy services. [1.1.3, 10.1] Some of these possible options, such as energy conservation and
effi ciency, fossil fuel switching, RE, nuclear and carbon capture and storage (CCS) were assessed in the AR4. A com-
prehensive evaluation of any portfolio of mitigation options would involve an evaluation of their respective mitigation
potential as well as their contribution to sustainable development and all associated risks and costs. [1.1.6] This report
will concentrate on the role that the deployment of RE technologies can play within such a portfolio of mitigation
options.
As well as having a large potential to mitigate climate change, RE can provide wider benefi ts. RE may, if
implemented properly, contribute to social and economic development, energy access, a secure energy supply, and
reducing negative impacts on the environment and health. [9.2, 9.3]
Under most conditions, increasing the share of RE in the energy mix will require policies to stimulate
changes in the energy system. Deployment of RE technologies has increased rapidly in recent years, and their share
is projected to increase substantially under most ambitious mitigation scenarios [1.1.5, 10.2]. Additional policies would
be required to attract the necessary increases in investment in technologies and infrastructure. [11.4.3, 11.5, 11.6.1,
11.7.5]
3. Renewable energy technologies and markets
RE comprises a heterogeneous class of technologies (Box SPM.1). Various types of RE can supply electricity, ther-
mal energy and mechanical energy, as well as produce fuels that are able to satisfy multiple energy service needs [1.2].
Some RE technologies can be deployed at the point of use (decentralized) in rural and urban environments, whereas
others are primarily deployed within large (centralized) energy networks [1.2, 8.2, 8.3, 9.3.2]. Though a growing
number of RE technologies are technically mature and are being deployed at signifi cant scale, others are in an earlier
phase of technical maturity and commercial deployment or fi ll specialized niche markets [1.2]. The energy output of
2 According to the formal uncertainty language used in the AR4, the term ‘very likely’ refers to a >90% assessed probability of occurrence.
3 The contributions of individual anthropogenic GHGs to total emissions in 2004, reported in AR4, expressed as CO
2
eq were: CO
2
from fossil
fuels (56.6%), CO
2
from deforestation, decay of biomass etc. (17.3%), CO
2
from other (2.8%), methane (14.3%), nitrous oxide (7.9%) and
fl uorinated gases (1.1%) [Figure 1.1b, AR4, WG III, Chapter 1. For further information on sectoral emissions, including forestry, see also Figure
1.3b and associated footnotes.]

8
Summary for Policymakers Summaries
RE technologies can be (i) variable and—to some degree—unpredictable over differing time scales (from minutes to
years), (ii) variable but predictable, (iii) constant, or (iv) controllable. [8.2, 8.3]
Box SPM.1 | Renewable energy sources and technologies considered in this report.
Bioenergy can be produced from a variety of biomass feedstocks, including forest, agricultural and livestock residues; short-rotation
forest plantations; energy crops; the organic component of municipal solid waste; and other organic waste streams. Through a variety
of processes, these feedstocks can be directly used to produce electricity or heat, or can be used to create gaseous, liquid, or solid fuels.
The range of bioenergy technologies is broad and the technical maturity varies substantially. Some examples of commercially available
technologies include small- and large-scale boilers, domestic pellet-based heating systems, and ethanol production from sugar and starch.
Advanced biomass integrated gasifi cation combined-cycle power plants and lignocellulose-based transport fuels are examples of technol-
ogies that are at a pre-commercial stage, while liquid biofuel production from algae and some other biological conversion approaches are
at the research and development (R&D) phase. Bioenergy technologies have applications in centralized and decentralized settings, with
the traditional use of biomass in developing countries being the most widespread current application.
4
Bioenergy typically offers constant
or controllable output. Bioenergy projects usually depend on local and regional fuel supply availability, but recent developments show
that solid biomass and liquid biofuels are increasingly traded internationally. [1.2, 2.1, 2.3, 2.6, 8.2, 8.3]
Direct solar energy technologies harness the energy of solar irradiance to produce electricity using photovoltaics (PV) and concentrat-
ing solar power (CSP), to produce thermal energy (heating or cooling, either through passive or active means), to meet direct lighting
needs and, potentially, to produce fuels that might be used for transport and other purposes. The technology maturity of solar applica-
tions ranges from R&D (e.g., fuels produced from solar energy), to relatively mature (e.g., CSP), to mature (e.g., passive and active solar
heating, and wafer-based silicon PV). Many but not all of the technologies are modular in nature, allowing their use in both centralized
and decentralized energy systems. Solar energy is variable and, to some degree, unpredictable, though the temporal profi le of solar
energy output in some circumstances correlates relatively well with energy demands. Thermal energy storage offers the option to improve
output control for some technologies such as CSP and direct solar heating. [1.2, 3.1, 3.3, 3.5, 3.7, 8.2, 8.3]
Geothermal energy utilizes the accessible thermal energy from the Earth’s interior. Heat is extracted from geothermal reservoirs using
wells or other means. Reservoirs that are naturally suffi ciently hot and permeable are called hydrothermal reservoirs, whereas reservoirs
that are suffi ciently hot but that are improved with hydraulic stimulation are called enhanced geothermal systems (EGS). Once at the sur-
face, fl uids of various temperatures can be used to generate electricity or can be used more directly for applications that require thermal
energy, including district heating or the use of lower-temperature heat from shallow wells for geothermal heat pumps used in heating
or cooling applications. Hydrothermal power plants and thermal applications of geothermal energy are mature technologies, whereas
EGS projects are in the demonstration and pilot phase while also undergoing R&D. When used to generate electricity, geothermal power
plants typically offer constant output. [1.2, 4.1, 4.3, 8.2, 8.3]
Hydropower harnesses the energy of water moving from higher to lower elevations, primarily to generate electricity. Hydropower proj-
ects encompass dam projects with reservoirs, run-of-river and in-stream projects and cover a continuum in project scale. This variety gives
hydropower the ability to meet large centralized urban needs as well as decentralized rural needs. Hydropower technologies are mature.
Hydropower projects exploit a resource that varies temporally. However, the controllable output provided by hydropower facilities that
have reservoirs can be used to meet peak electricity demands and help to balance electricity systems that have large amounts of variable
RE generation. The operation of hydropower reservoirs often refl ects their multiple uses, for example, drinking water, irrigation, fl ood and
drought control, and navigation, as well as energy supply. [1.2, 5.1, 5.3, 5.5, 5.10, 8.2]
4 Traditional biomass is defi ned by the International Energy Agency (IEA) as biomass consumption in the residential sector in developing countries and refers to the
often unsustainable use of wood, charcoal, agricultural residues, and animal dung for cooking and heating. All other biomass use is defi ned as modern [Annex I].

9
Summaries Summary for Policymakers
Ocean energy derives from the potential, kinetic, thermal and chemical energy of seawater, which can be transformed to provide elec-
tricity, thermal energy, or potable water. A wide range of technologies are possible, such as barrages for tidal range, submarine turbines
for tidal and ocean currents, heat exchangers for ocean thermal energy conversion, and a variety of devices to harness the energy of
waves and salinity gradients. Ocean technologies, with the exception of tidal barrages, are at the demonstration and pilot project phases
and many require additional R&D. Some of the technologies have variable energy output profi les with differing levels of predictability
(e.g., wave, tidal range and current), while others may be capable of near-constant or even controllable operation (e.g., ocean thermal
and salinity gradient). [1.2, 6.1, 6.2, 6.3, 6.4, 6.6, 8.2]
Wind energy harnesses the kinetic energy of moving air. The primary application of relevance to climate change mitigation is to produce
electricity from large wind turbines located on land (onshore) or in sea- or freshwater (offshore). Onshore wind energy technologies are
already being manufactured and deployed on a large scale. Offshore wind energy technologies have greater potential for continued tech-
nical advancement. Wind electricity is both variable and, to some degree, unpredictable, but experience and detailed studies from many
regions have shown that the integration of wind energy generally poses no insurmountable technical barriers. [1.2, 7.1, 7.3, 7.5, 7.7, 8.2]
On a global basis, it is estimated that RE accounted for 12.9% of the total 492 Exajoules (EJ)
5
of primary
energy supply in 2008 (Box SPM.2 and Figure SPM.2). The largest RE contributor was biomass (10.2%), with the
majority (roughly 60%) being traditional biomass used in cooking and heating applications in developing countries
but with rapidly increasing use of modern biomass as well.
6
Hydropower represented 2.3%, whereas other RE sources
accounted for 0.4%. [1.1.5] In 2008, RE contributed approximately 19% of global electricity supply (16% hydropower,
3% other RE) and biofuels contributed 2% of global road transport fuel supply. Traditional biomass (17%), modern
biomass (8%), solar thermal and geothermal energy (2%) together fuelled 27% of the total global demand for heat. The
contribution of RE to primary energy supply varies substantially by country and region. [1.1.5, 1.3.1, 8.1]
Deployment of RE has been increasing rapidly in recent years (Figure SPM.3). Various types of government poli-
cies, the declining cost of many RE technologies, changes in the prices of fossil fuels, an increase of energy demand and
other factors have encouraged the continuing increase in the use of RE. [1.1.5, 9.3, 10.5, 11.2, 11.3] Despite global
fi nancial challenges, RE capacity continued to grow rapidly in 2009 compared to the cumulative installed capacity from
the previous year, including wind power (32% increase, 38 Gigawatts (GW) added), hydropower (3%, 31 GW added),
grid-connected photovoltaics (53%, 7.5 GW added), geothermal power (4%, 0.4 GW added), and solar hot water/heat-
ing (21%, 31 GW
th
added). Biofuels accounted for 2% of global road transport fuel demand in 2008 and nearly 3% in
2009. The annual production of ethanol increased to 1.6 EJ (76 billion litres) by the end of 2009 and biodiesel to 0.6 EJ
(17 billion litres). [1.1.5, 2.4, 3.4, 4.4, 5.4, 7.4]
Of the approximate 300 GW of new electricity generating capacity added globally over the two-year period from 2008
to 2009, 140 GW came from RE additions. Collectively, developing countries host 53% of global RE electricity genera-
tion capacity [1.1.5]. At the end of 2009, the use of RE in hot water/heating markets included modern biomass (270
GW
th
), solar (180 GW
th
), and geothermal (60 GW
th
). The use of decentralized RE (excluding traditional biomass) in
meeting rural energy needs at the household or village level has also increased, including hydropower stations, various
modern biomass options, PV, wind or hybrid systems that combine multiple technologies. [1.1.5, 2.4, 3.4, 4.4, 5.4]
5 1 Exajoule = 10
18
joules = 23.88 million tonnes of oil equivalent (Mtoe).
6 In addition to this 60% share of traditional biomass, there is biomass use estimated to amount to 20 to 40% not reported in offi cial primary
energy databases, such as dung, unaccounted production of charcoal, illegal logging, fuelwood gathering, and agricultural residue use. [2.1, 2.5]

10
Summary for Policymakers Summaries
The global technical potential
7
of RE sources will not limit continued growth in the use of RE. A wide range
of estimates is provided in the literature, but studies have consistently found that the total global technical potential
for RE is substantially higher than global energy demand (Figure SPM.4) [1.2.2, 10.3, Annex II]. The technical potential
for solar energy is the highest among the RE sources, but substantial technical potential exists for all six RE sources.
Even in regions with relatively low levels of technical potential for any individual RE source, there are typically sig-
nifi cant opportunities for increased deployment compared to current levels. [1.2.2, 2.2, 2.8, 3.2, 4.2, 5.2, 6.2, 6.4, 7.2,
8.2, 8.3, 10.3] In the longer term and at higher deployment levels, however, technical potentials indicate a limit to the
7 Defi nitions of technical potential often vary by study. ‘Technical potential’ is used in the SRREN as the amount of RE output obtainable by
full implementation of demonstrated technologies or practices. No explicit reference to costs, barriers or policies is made. Technical potentials
reported in the literature and assessed in the SRREN, however, may have taken into account practical constraints and when explicitly stated
they are generally indicated in the underlying report. [Annex I]
Figure SPM.2 | Shares of energy sources in total global primary energy supply in 2008 (492 EJ). Modern biomass contributes 38% of the total biomass share. [Figure 1.10, 1.1.5]
Note: Underlying data for fi gure have been converted to the ‘direct equivalent’ method of accounting for primary energy supply. [Box SPM.2, 1.1.9, Annex II.4]
Wind Energy 0.2%
Geothermal Energy 0.1%
Ocean Energy 0.002%
Direct Solar Energy 0.1%
Gas
22.1%
Coal
28.4%
RE
12.9%
Oil
34.6%
Nuclear
Energy 2.0%
Hydropower 2.3%
Bioenergy
10.2%
Box SPM.2 | Accounting for primary energy in the SRREN.
There is no single, unambiguous accounting method for calculating primary energy from non-combustible energy sources such as non-
combustible RE sources and nuclear energy. The SRREN adopts the ‘direct equivalent’ method for accounting for primary energy supply.
In this method, fossil fuels and bioenergy are accounted for based on their heating value while non-combustible energy sources, includ-
ing nuclear energy and all non-combustible RE, are accounted for based on the secondary energy that they produce. This may lead to an
understatement of the contribution of non-combustible RE and nuclear compared to bioenergy and fossil fuels by a factor of roughly 1.2
up to 3. The selection of the accounting method also impacts the relative shares of different individual energy sources. Comparisons in
the data and fi gures presented in the SRREN between fossil fuels and bioenergy on the one hand, and non-combustible RE and nuclear
energy on the other, refl ect this accounting method. [1.1.9, Annex II.4]
11
Summaries Summary for Policymakers
Biofuels (incl. Biogas)
Wind Energy
Geothermal Energy
Solar Thermal Energy
Municipal Solid Waste
(Renewable Share)
Primary Solid Biomass
for Heat and Electricity
Applications
Hydropower
Global Primary Energy Supply [EJ/yr]
0
10
20
30
40
50
60
0
1
2
3
4
5
Solar PV Energy
Ocean Energy
0.00
0.01
0.02
0.03
0.04
0
.
05
2008200620042002200019981996199419921990198819861984198219801978197619741972
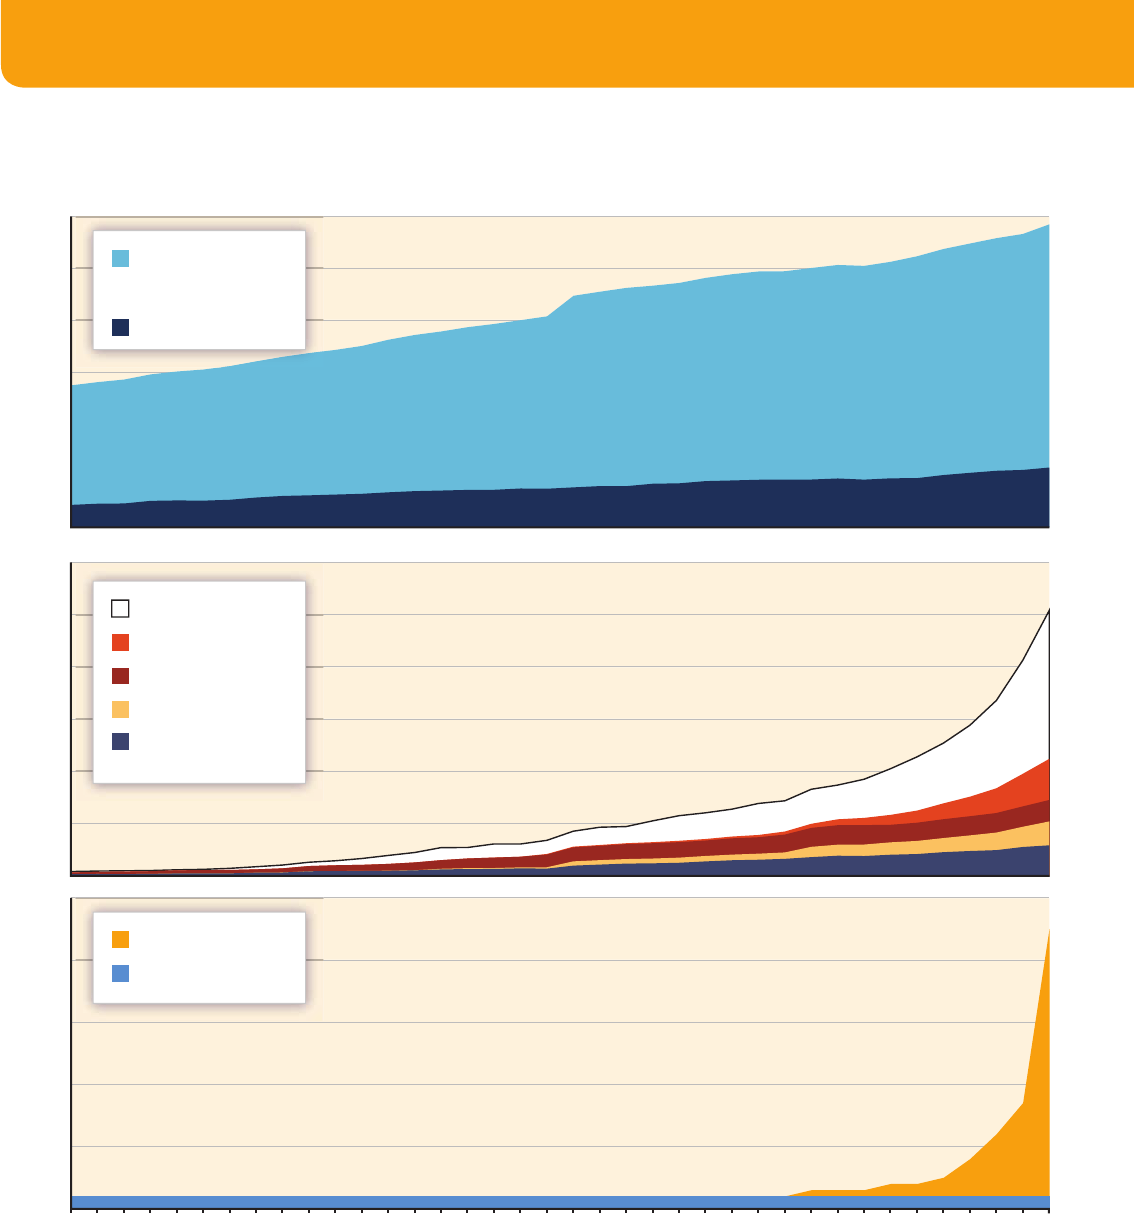
Figure SPM.3 | Historical development of global primary energy supply from renewable energy from 1971 to 2008. [Figure 1.12, 1.1.5]
Notes: Technologies are referenced to separate vertical units for display purposes only. Underlying data for fi gure has been converted to the ‘direct equivalent’ method of accounting
for primary energy supply [Box SPM.2, 1.1.9, Annex II.4], except that the energy content of biofuels is reported in secondary energy terms (the primary biomass used to produce the
biofuel would be higher due to conversion losses. [2.3, 2.4])
contribution of some individual RE technologies. Factors such as sustainability concerns [9.3], public acceptance [9.5],
system integration and infrastructure constraints [8.2], or economic factors [10.3] may also limit deployment of RE
technologies.
12
Summary for Policymakers Summaries
Climate change will have impacts on the size and geographic distribution of the technical potential for RE
sources, but research into the magnitude of these possible effects is nascent. Because RE sources are, in many
cases, dependent on the climate, global climate change will affect the RE resource base, though the precise nature and
magnitude of these impacts is uncertain. The future technical potential for bioenergy could be infl uenced by climate
change through impacts on biomass production such as altered soil conditions, precipitation, crop productivity and
other factors. The overall impact of a global mean temperature change of less than 2°C on the technical potential
of bioenergy is expected to be relatively small on a global basis. However, considerable regional differences could
be expected and uncertainties are larger and more diffi cult to assess compared to other RE options due to the large
number of feedback mechanisms involved. [2.2, 2.6] For solar energy, though climate change is expected to infl uence
the distribution and variability of cloud cover, the impact of these changes on overall technical potential is expected
to be small [3.2]. For hydropower the overall impacts on the global technical potential is expected to be slightly posi-
tive. However, results also indicate the possibility of substantial variations across regions and even within countries.
[5.2] Research to date suggests that climate change is not expected to greatly impact the global technical potential for
wind energy development but changes in the regional distribution of the wind energy resource may be expected [7.2].
Climate change is not anticipated to have signifi cant impacts on the size or geographic distribution of geothermal or
ocean energy resources. [4.2, 6.2]
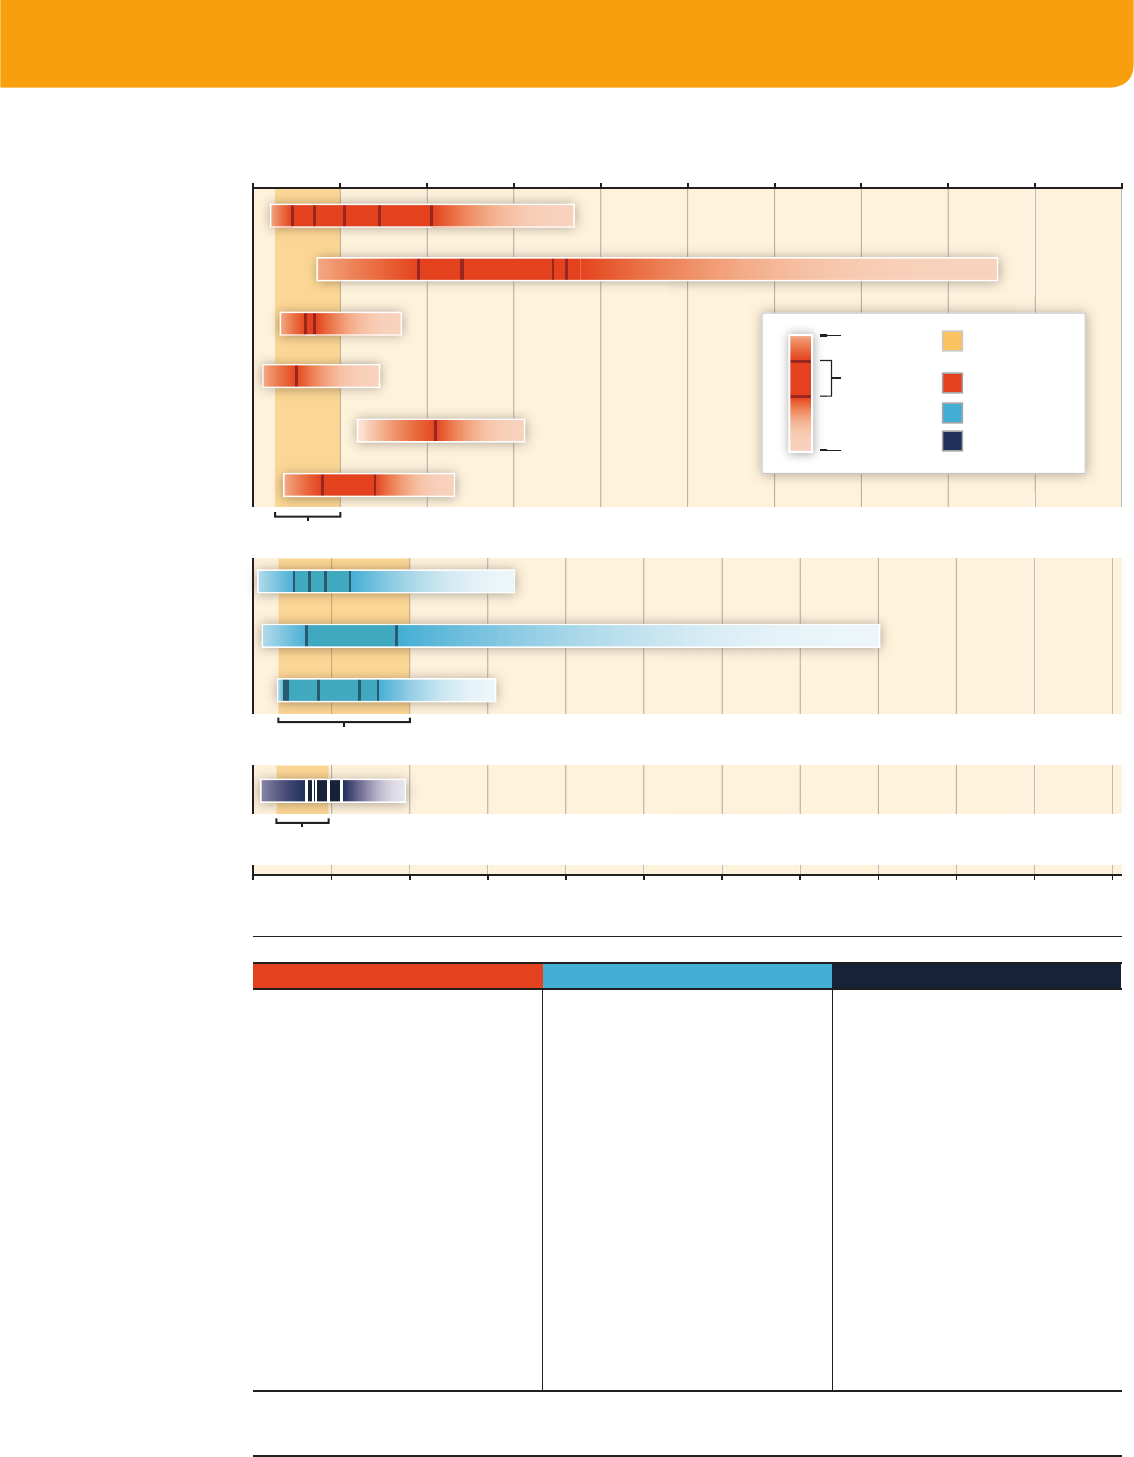
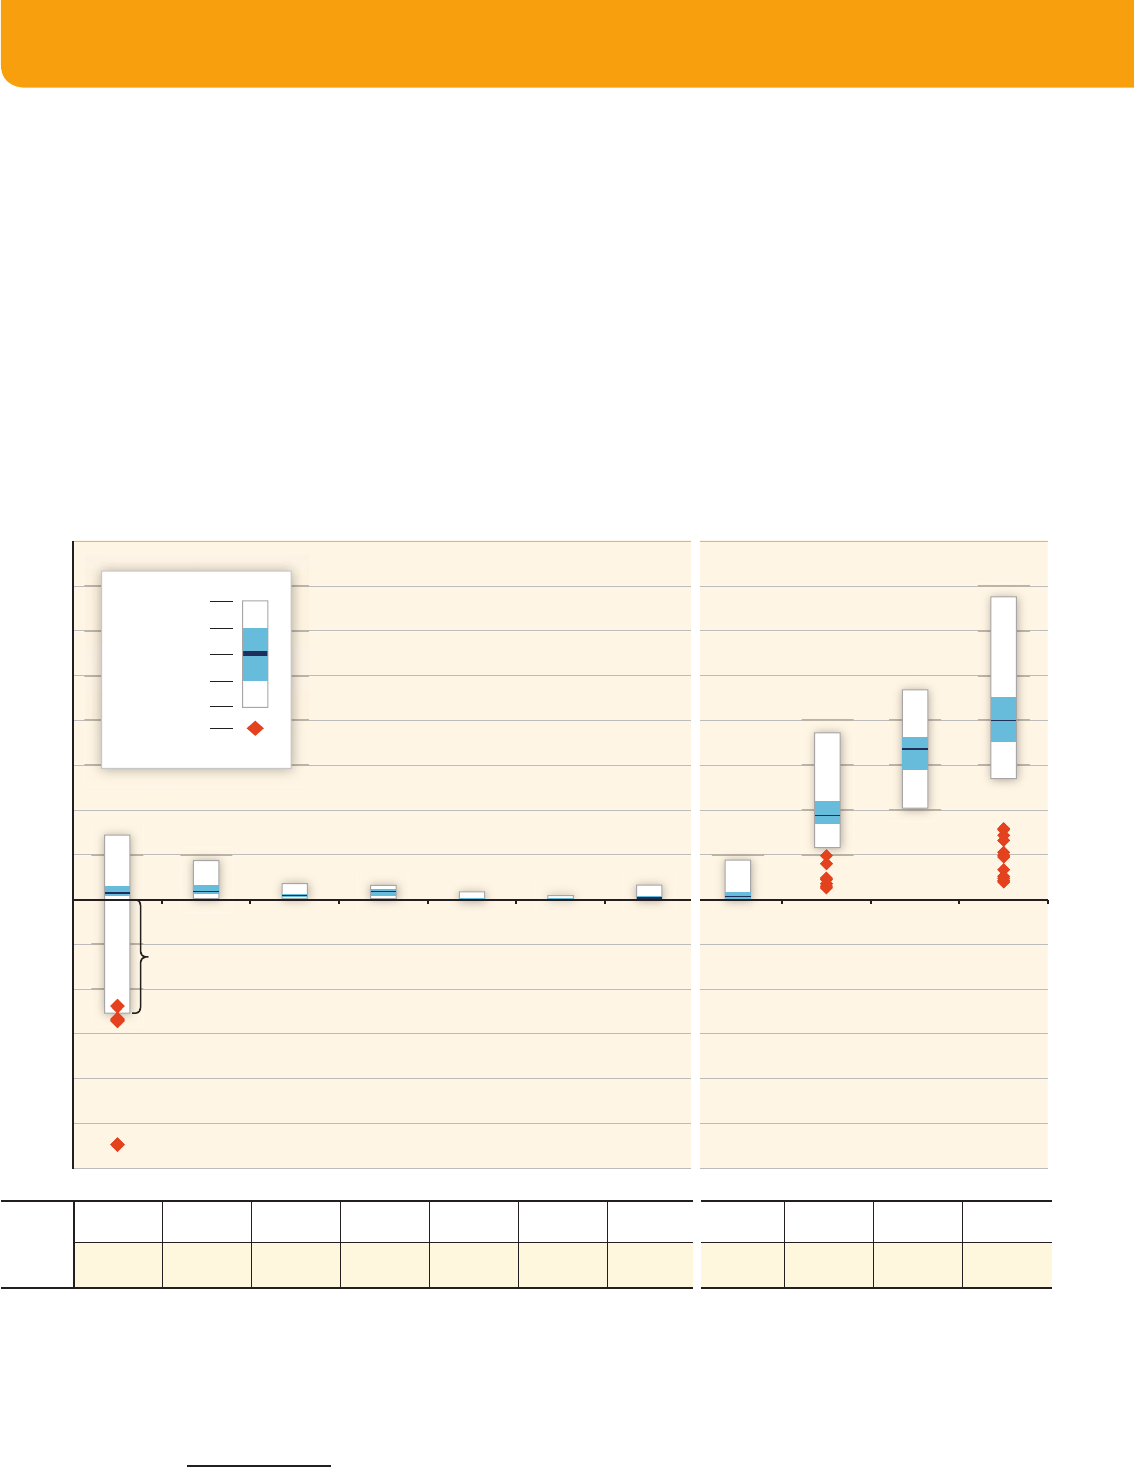
Figure SPM.4 | Ranges of global technical potentials of RE sources derived from studies presented in Chapters 2 through 7. Biomass and solar are shown as primary energy due to
their multiple uses; note that the fi gure is presented in logarithmic scale due to the wide range of assessed data. [Figure 1.17, 1.2.3]
Notes: Technical potentials reported here represent total worldwide potentials for annual RE supply and do not deduct any potential that is already being utilized. Note that RE elec-
tricity sources could also be used for heating applications, whereas biomass and solar resources are reported only in primary energy terms but could be used to meet various energy
service needs. Ranges are based on various methods and apply to different future years; consequently, the resulting ranges are not strictly comparable across technologies. For the
data behind Figure SPM.4 and additional notes that apply, see Chapter 1 Annex, Table A.1.1 (as well as the underlying chapters).
Global Electricity
Demand, 2008: 61 EJ
Global Primary Energy
Supply, 2008: 492 EJ
Global Heat
Demand, 2008: 164 EJ
0
10
100
1,000
10,000
100,000
Global Technical Potential [EJ/yr, log scale]
Direct Solar
Energy
BiomassGeothermal
Energy
Wind
Energy
Ocean
Energy
Primary EnergyHeatElectricity
HydropowerGeothermal
Energy
49837
1575
500
50
312
10
580
85
331
7
52
50
1109
118
Max (in EJ/yr)
Min (in EJ/yr)
Range of Estimates of Global Technical Potentials
Range of Estimates
Summarized in Chapters 2-7
Maximum
Minimum

13
Summaries Summary for Policymakers
The levelized cost of energy
8
for many RE technologies is currently higher than existing energy prices,
though in various settings RE is already economically competitive. Ranges of recent levelized costs of energy for
selected commercially available RE technologies are wide, depending on a number of factors including, but not limited
to, technology characteristics, regional variations in cost and performance, and differing discount rates (Figure SPM.5).
[1.3.2, 2.3, 2.7, 3.8, 4.8, 5.8, 6.7, 7.8, 10.5, Annex III] Some RE technologies are broadly competitive with existing
market energy prices. Many of the other RE technologies can provide competitive energy services in certain circum-
stances, for example, in regions with favourable resource conditions or that lack the infrastructure for other low-cost
energy supplies. In most regions of the world, policy measures are still required to ensure rapid deployment of many RE
sources. [2.3, 2.7, 3.8, 4.7, 5.8, 6.7, 7.8, 10.5]
Monetizing the external costs of energy supply would improve the relative competitiveness of RE. The same applies if
market prices increase due to other reasons (Figure SPM.5). [10.6] The levelized cost of energy for a technology is not
the sole determinant of its value or economic competitiveness. The attractiveness of a specifi c energy supply option
depends also on broader economic as well as environmental and social aspects, and the contribution that the technol-
ogy provides to meeting specifi c energy services (e.g., peak electricity demands) or imposes in the form of ancillary
costs on the energy system (e.g., the costs of integration). [8.2, 9.3, 10.6]
The cost of most RE technologies has declined and additional expected technical advances would result
in further cost reductions. Signifi cant advances in RE technologies and associated long-term cost reductions have
been demonstrated over the last decades, though periods of rising prices have sometimes been experienced (due
to, for example, increasing demand for RE in excess of available supply) (Figure SPM.6). The contribution of differ-
ent drivers (e.g., R&D, economies of scale, deployment-oriented learning, and increased market competition among
RE suppliers) is not always understood in detail. [2.7, 3.8, 7.8, 10.5] Further cost reductions are expected, resulting in
greater potential deployment and consequent climate change mitigation. Examples of important areas of potential
technological advancement include: new and improved feedstock production and supply systems, biofuels produced
via new processes (also called next-generation or advanced biofuels, e.g., lignocellulosic) and advanced biorefi ning
[2.6]; advanced PV and CSP technologies and manufacturing processes [3.7]; enhanced geothermal systems (EGS) [4.6];
multiple emerging ocean technologies [6.6]; and foundation and turbine designs for offshore wind energy [7.7]. Further
cost reductions for hydropower are expected to be less signifi cant than some of the other RE technologies, but R&D
opportunities exist to make hydropower projects technically feasible in a wider range of locations and to improve the
technical performance of new and existing projects. [5.3, 5.7, 5.8]
A variety of technology-specifi c challenges (in addition to cost) may need to be addressed to enable RE
to signifi cantly upscale its contribution to reducing GHG emissions. For the increased and sustainable use of
bioenergy, proper design, implementation and monitoring of sustainability frameworks can minimize negative impacts
and maximize benefi ts with regard to social, economic and environmental issues [SPM.5, 2.2, 2.5, 2.8]. For solar energy,
regulatory and institutional barriers can impede deployment, as can integration and transmission issues [3.9]. For geo-
thermal energy, an important challenge would be to prove that enhanced geothermal systems (EGS) can be deployed
economically, sustainably and widely [4.5, 4.6, 4.7, 4.8]. New hydropower projects can have ecological and social
impacts that are very site specifi c, and increased deployment may require improved sustainability assessment tools, and
regional and multi-party collaborations to address energy and water needs [5.6, 5.9, 5.10]. The deployment of ocean
energy could benefi t from testing centres for demonstration projects, and from dedicated policies and regulations that
encourage early deployment [6.4]. For wind energy, technical and institutional solutions to transmission constraints and
operational integration concerns may be especially important, as might public acceptance issues relating primarily to
landscape impacts. [7.5, 7.6, 7.9]
8 The levelized cost of energy represents the cost of an energy generating system over its lifetime; it is calculated as the per-unit price at which
energy must be generated from a specifi c source over its lifetime to break even. It usually includes all private costs that accrue upstream in the
value chain, but does not include the downstream cost of delivery to the fi nal customer; the cost of integration, or external environmental or
other costs. Subsidies and tax credits are also not included.
14
Summary for Policymakers Summaries
Figure SPM.5 | Range in recent levelized cost of energy for selected commercially available RE technologies in comparison to recent non-renewable energy costs. Technology sub-
categories and discount rates were aggregated for this fi gure. For related fi gures with less or no such aggregation, see [1.3.2, 10.5, Annex III].
Range of Oil and Gas
Based Heating Cost
Range of Non-Renewable
Electricity Cost
Range of Gasoline
and Diesel Cost
[UScent
2005
/kWh]
0 10 20 30 40 50 60 70 80 90 100
[USD
2005
/GJ]
Biofuels
Geothermal Heat
Solar Thermal Heat
Biomass Heat
Wind Electricity
Ocean Electricity
Hydropower
Geothermal Electricity
Solar Electricity
Biomass Electricity
2752502252001751501251007550025
Non-Renewables
Heat
Transport Fuels
Electricity
Lower Bound
Upper Bound
Medium Values
Biofuels:
1. Corn ethanol
2. Soy biodiesel
3. Wheat ethanol
4. Sugarcane ethanol
5. Palm oil biodiese
l
Biomass Heat:
1. Municipal solid waste based CHP
2. Anaerobic digestion based CHP
3. Steam turbine CHP
4. Domestic pellet heating system
Solar Thermal Heat:
1. Domestic hot water systems in China
2. Water and space heating
Geothermal Heat:
1. Greenhouses
2. Uncovered aquaculture ponds
3. District heating
4. Geothermal heat pumps
5. Geothermal building heating
Biomass:
1. Cofiring
2. Small scale combined heat and power, CHP
(Gasification internal combustion engine)
3. Direct dedicated stoker & CHP
4. Small scale CHP (steam turbine)
5. Small scale CHP (organic Rankine cycle)
Solar Electricity:
1. Concentrating solar power
2. Utility-scale PV (1-axis and fixed tilt)
3. Commercial rooftop PV
4. Residential rooftop PV
Geothermal Electricity:
1. Condensing flash plant
2. Binary cycle plant
Hydropower:
1. All types
Ocean Electricity:
1. Tidal barrage
Wind Electricity:
1. Onshore
2. Offshore
Transport FuelsHeatElectricity
Notes: Medium values are shown for the following subcategories, sorted in the order as they appear in the respective ranges (from left to right):
The lower range of the levelized cost of energy for each RE technology is based on a combination of the most favourable input-values, whereas the upper range is based on a
combination of the least favourable input values. Reference ranges in the figure background for non-renewable electricity options are indicative of the levelized cost of centralized
non-renewable electricity generation. Reference ranges for heat are indicative of recent costs for oil and gas based heat supply options. Reference ranges for transport fuels are
based on recent crude oil spot prices of USD 40 to 130/barrel and corresponding diesel and gasoline costs, excluding taxes.
15
Summaries Summary for Policymakers
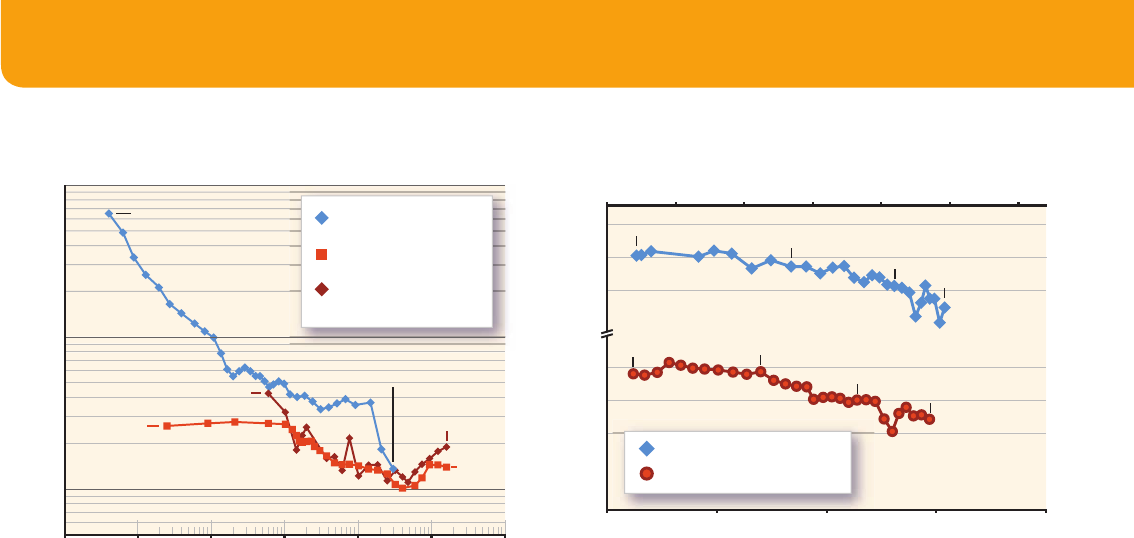
Figure SPM.6 | Selected experience curves in logarithmic scale for (a) the price of silicon PV modules and onshore wind power plants per unit of capacity; and (b) the cost of
sugarcane-based ethanol production [data from Figure 3.17, 3.8.3, Figure 7.20, 7.8.2, Figure 2.21, 2.7.2].
Notes: Depending on the setting, cost reductions may occur at various geographic scales. The country-level examples provided here derive from the published literature. No global
dataset of wind power plant prices or costs is readily available. Reductions in the cost or price of a technology per unit of capacity understate reductions in the levelized cost of energy
of that technology when performance improvements occur. [7.8.4, 10.5]
Onshore Wind Power Plants
(Denmark)
Onshore Wind Power Plants
(USA)
Produced Silicon PV Modules
(Global)
1
Cumulative Global Capacity [MW]
1
10
100
10 100 1,000 10,000 1,000,000 100,000
Average Price [USD
2005
/W]
1976
[65 USD/W]
2010
[1.4 USD/W]
(a)
0,5
50
5
1981
[2.6 USD/W]
1984
[4.3 USD/W]
2009
[1.4 USD/W]
2009
[1.9 USD/W]
Sugarcane
Ethanol Prod. Cost (excl. Feedstock)
Cumulative Sugarcane Production in Brazil [10
6
Tonnes of Sugarcane]
1,000 2,000 4,000 8,000 16,000
Average Production Cost of Ethanol [USD
2005
/m
3
]
and Sugarcane [USD
2005
/t]
10
20
40
200
400
800
10 20 40 80 160 320 640
Cumulative Ethanol Production in Brazil [10
6
m
3
]
2004
1975
1985
1995
2004
1975
1985
1995
(b)
4. Integration into present and future energy systems
Various RE resources are already being successfully integrated into energy supply systems [8.2] and into
end-use sectors [8.3] (Figure SPM.7).
The characteristics of different RE sources can infl uence the scale of the integration challenge. Some RE
resources are widely distributed geographically. Others, such as large-scale hydropower, can be more centralized but
have integration options constrained by geographic location. Some RE resources are variable with limited predictability.
Some have lower physical energy densities and different technical specifi cations from fossil fuels. Such characteristics
can constrain ease of integration and invoke additional system costs particularly when reaching higher shares of RE.
[8.2]
Integrating RE into most existing energy supply systems and end-use sectors at an accelerated rate—
leading to higher shares of RE—is technologically feasible, though will result in a number of additional
challenges. Increased shares of RE are expected within an overall portfolio of low GHG emission technologies [10.3,
Tables 10.4-10.6]. Whether for electricity, heating, cooling, gaseous fuels or liquid fuels, including integration directly
into end-use sectors, the RE integration challenges are contextual and site specifi c and include the adjustment of exist-
ing energy supply systems. [8.2, 8.3]
The costs and challenges of integrating increasing shares of RE into an existing energy supply system
depend on the current share of RE, the availability and characteristics of RE resources, the system character-
istics, and how the system evolves and develops in the future.
• RE can be integrated into all types of electricity systems, from large inter-connected continental-scale grids [8.2.1]
down to small stand-alone systems and individual buildings [8.2.5]. Relevant system characteristics include the
generation mix and its fl exibility, network infrastructure, energy market designs and institutional rules, demand
location, demand profi les, and control and communication capability. Wind, solar PV energy and CSP without
16
Summary for Policymakers Summaries
storage can be more diffi cult to integrate than dispatchable
9
hydropower, bioenergy, CSP with storage and geother-
mal energy.
As the penetration of variable RE sources increases, maintaining system reliability may become more challenging
and costly. Having a portfolio of complementary RE technologies is one solution to reduce the risks and costs of RE
integration. Other solutions include the development of complementary fl exible generation and the more fl exible
operation of existing schemes; improved short-term forecasting, system operation and planning tools; electricity
demand that can respond in relation to supply availability; energy storage technologies (including storage-based
hydropower); and modifi ed institutional arrangements. Electricity network transmission (including interconnections
between systems) and/or distribution infrastructure may need to be strengthened and extended, partly because of
the geographical distribution and fi xed remote locations of many RE resources. [8.2.1]
• District heating systems can use low-temperature thermal RE inputs such as solar and geothermal heat, or biomass,
including sources with few competing uses such as refuse-derived fuels. District cooling can make use of cold natu-
ral waterways. Thermal storage capability and fl exible cogeneration can overcome supply and demand variability
challenges as well as provide demand response for electricity systems. [8.2.2]
9 Electricity plants that can schedule power generation as and when required are classed as dispatchable [8.2.1.1, Annex I]. Variable RE
technologies are partially dispatchable (i.e., only when the RE resource is available). CSP plants are classifi ed as dispatchable when heat is
stored for use at night or during periods of low sunshine.
Figure SPM.7 | Pathways for RE integration to provide energy services, either into energy supply systems or on-site for use by the end-use sectors. [Figure 8.1, 8.1]
Fossil Fuels
and Nuclear
Energy Efficiency
Measures
Energy Efficiency
and Demand
Response Measures
Renewable Energy Resources
End-Use Sectors
(Section 8.3)
Energy Supply
Systems
(Section 8.2)
Electricity Generation and
Distribution
Heating and Cooling Networks
Gas Grids
Liquid Fuels Distribution
Autonomous Systems
Transport and Vehicles
Buildings and Households
Industry
Agriculture, Forests and
Fisheries
Energy
Carriers
Energy
Services
Energy
Consumers

17
Summaries Summary for Policymakers
• In gas distribution grids, injecting biomethane, or in the future, RE-derived hydrogen and synthetic natural gas, can
be achieved for a range of applications but successful integration requires that appropriate gas quality standards
are met and pipelines upgraded where necessary. [8.2.3]
• Liquid fuel systems can integrate biofuels for transport applications or for cooking and heating applications. Pure
(100%) biofuels, or more usually those blended with petroleum-based fuels, usually need to meet technical stan-
dards consistent with vehicle engine fuel specifi cations. [8.2.4, 8.3.1]
There are multiple pathways for increasing the shares of RE across all end-use sectors. The ease of integra-
tion varies depending on region, characteristics specifi c to the sector and the technology.
• For transport, liquid and gaseous biofuels are already and are expected to continue to be integrated into the fuel
supply systems of a growing number of countries. Integration options may include decentralized on-site or central-
ized production of RE hydrogen for fuel cell vehicles and RE electricity for rail and electric vehicles [8.2.1, 8.2.3]
depending on infrastructure and vehicle technology developments. [8.3.1] Future demand for electric vehicles could
also enhance fl exible electricity generation systems. [8.2.1, 8.3.1]
• In the building sector, RE technologies can be integrated into both new and existing structures to produce electric-
ity, heating and cooling. Supply of surplus energy may be possible, particularly for energy effi cient building designs.
[8.3.2] In developing countries, the integration of RE supply systems is feasible for even modest dwellings. [8.3.2,
9.3.2]
• Agriculture as well as food and fi bre process industries often use biomass to meet direct heat and power demands
on-site. They can also be net exporters of surplus fuels, heat, and electricity to adjacent supply systems. [8.3.3,
8.3.4] Increasing the integration of RE for use by industries is an option in several sub-sectors, for example through
electro-thermal technologies or, in the longer term, by using RE hydrogen. [8.3.3]
The costs associated with RE integration, whether for electricity, heating, cooling, gaseous or liquid fuels,
are contextual, site-specifi c and generally diffi cult to determine. They may include additional costs for network
infrastructure investment, system operation and losses, and other adjustments to the existing energy supply systems as
needed. The available literature on integration costs is sparse and estimates are often lacking or vary widely.
In order to accommodate high RE shares, energy systems will need to evolve and be adapted. [8.2, 8.3]
Long-term integration efforts could include investment in enabling infrastructure; modifi cation of institutional and
governance frameworks; attention to social aspects, markets and planning; and capacity building in anticipation of
RE growth. [8.2, 8.3] Furthermore, integration of less mature technologies, including biofuels produced through new
processes (also called advanced biofuels or next-generation biofuels), fuels generated from solar energy, solar cooling,
ocean energy technologies, fuel cells and electric vehicles, will require continuing investments in research, development
and demonstration (RD&D), capacity building and other supporting measures. [2.6, 3.7, 11.5, 11.6, 11.7]
RE could shape future energy supply and end-use systems, in particular for electricity, which is expected to attain higher
shares of RE earlier than either the heat or transport fuel sectors at the global level [10.3]. Parallel developments in
electric vehicles [8.3.1], increased heating and cooling using electricity (including heat pumps) [8.2.2, 8.3.2, 8.3.3], fl ex-
ible demand response services (including the use of smart meters) [8.2.1], energy storage and other technologies could
be associated with this trend.
As infrastructure and energy systems develop, in spite of the complexities, there are few, if any, funda-
mental technological limits to integrating a portfolio of RE technologies to meet a majority share of total

18
Summary for Policymakers Summaries
energy demand in locations where suitable RE resources exist or can be supplied. However, the actual rate
of integration and the resulting shares of RE will be infl uenced by factors such as costs, policies, environ-
mental issues and social aspects. [8.2, 8.3, 9.3, 9.4, 10.2, 10.5]
5. Renewable energy and sustainable development
Historically, economic development has been strongly correlated with increasing energy use and growth of
GHG emissions, and RE can help decouple that correlation, contributing to sustainable development (SD).
Though the exact contribution of RE to SD has to be evaluated in a country-specifi c context, RE offers the opportunity
to contribute to social and economic development, energy access, secure energy supply, climate change mitigation, and
the reduction of negative environmental and health impacts. [9.2] Providing access to modern energy services would
support the achievement of the Millennium Development Goals. [9.2.2, 9.3.2]
• RE can contribute to social and economic development. Under favorable conditions, cost savings in compari-
son to non-RE use exist, in particular in remote and in poor rural areas lacking centralized energy access. [9.3.1,
9.3.2.] Costs associated with energy imports can often be reduced through the deployment of domestic RE tech-
nologies that are already competitive. [9.3.3] RE can have a positive impact on job creation although the studies
available differ with respect to the magnitude of net employment. [9.3.1]
• RE can help accelerate access to energy, particularly for the 1.4 billion people without access to electric-
ity and the additional 1.3 billion using traditional biomass. Basic levels of access to modern energy services
can provide signifi cant benefi ts to a community or household. In many developing countries, decentralized grids
based on RE and the inclusion of RE in centralized energy grids have expanded and improved energy access. In
addition, non-electrical RE technologies also offer opportunities for modernization of energy services, for example,
using solar energy for water heating and crop drying, biofuels for transportation, biogas and modern biomass for
heating, cooling, cooking and lighting, and wind for water pumping. [9.3.2, 8.1] The number of people without
access to modern energy services is expected to remain unchanged unless relevant domestic policies are imple-
mented, which may be supported or complemented by international assistance as appropriate. [9.3.2, 9.4.2]
• RE options can contribute to a more secure energy supply, although specifi c challenges for integra-
tion must be considered. RE deployment might reduce vulnerability to supply disruption and market volatility if
competition is increased and energy sources are diversifi ed. [9.3.3, 9.4.3] Scenario studies indicate that concerns
regarding secure energy supply could continue in the future without technological improvements within the
transport sector. [2.8, 9.4.1.1, 9.4.3.1, 10.3] The variable output profi les of some RE technologies often necessitate
technical and institutional measures appropriate to local conditions to assure energy supply reliability. [8.2, 9.3.3]
• In addition to reduced GHG emissions, RE technologies can provide other important environmental
benefi ts. Maximizing these benefi ts depends on the specifi c technology, management, and site charac-
teristics associated with each RE project.
• Lifecycle assessments (LCA) for electricity generation indicate that GHG emissions from RE technolo-
gies are, in general, signifi cantly lower than those associated with fossil fuel options, and in a range
of conditions, less than fossil fuels employing CCS. The median values for all RE range from 4 to 46 g
CO
2
eq/kWh while those for fossil fuels range from 469 to 1,001 g CO
2
eq/kWh (excluding land use change emis-
sions) (Figure SPM.8).
• Most current bioenergy systems, including liquid biofuels, result in GHG emission reductions, and
most biofuels produced through new processes (also called advanced biofuels or next-generation
biofuels) could provide higher GHG mitigation. The GHG balance may be affected by land use
19
Summaries Summary for Policymakers
changes and corresponding emissions and removals. Bioenergy can lead to avoided GHG emissions from
residues and wastes in landfi ll disposals and co-products; the combination of bioenergy with CCS may provide
for further reductions (see Figure SPM.8). The GHG implications related to land management and land use
changes in carbon stocks have considerable uncertainties. [2.2, 2.5, 9.3.4.1]
• The sustainability of bioenergy, in particular in terms of lifecycle GHG emissions, is infl uenced by
land and biomass resource management practices. Changes in land and forest use or management that,
according to a considerable number of studies, could be brought about directly or indirectly by biomass produc-
tion for use as fuels, power or heat, can decrease or increase terrestrial carbon stocks. The same studies also
Figure SPM.8 | Estimates of lifecycle GHG emissions (g CO
2
eq/kWh) for broad categories of electricity generation technologies, plus some technologies integrated with CCS. Land use-
related net changes in carbon stocks (mainly applicable to biopower and hydropower from reservoirs) and land management impacts are excluded; negative estimates
10
for biopower
are based on assumptions about avoided emissions from residues and wastes in landfi ll disposals and co-products. References and methods for the review are reported in Annex II. The
number of estimates is greater than the number of references because many studies considered multiple scenarios. Numbers reported in parentheses pertain to additional references
and estimates that evaluated technologies with CCS. Distributional information relates to estimates currently available in LCA literature, not necessarily to underlying theoretical or
practical extrema, or the true central tendency when considering all deployment conditions. [Figure 9.8, 9.3.4.1]
10 ‘Negative estimates’ within the terminology of lifecycle assessments presented in the SRREN refer to avoided emissions. Unlike the case of bioen-
ergy combined with CCS, avoided emissions do not remove GHGs from the atmosphere.
Maximum
75
th
Percentile
Median
25
th
Percentile
Minimum
Single Estimates
with CCS
Electricity Generation Technologies Powered by Renewable Resources
Biopower
Photovoltaics
Concentrating Solar Power
Coal
Oil
Natural Gas
Geothermal Energy
Hydropower
Nuclear Energy
Ocean Energy
Wind Energy
-1,250
-1,500
-1,000
750
250
-250
-750
-500
0
500
1,750
1,250
1,000
1,500
2,000
Lifecycle Greenhouse Gas Emissions [g CO
2
eq / kWh]
Electricity Generation Technologies
Powered by Non-Renewable Resources
Avoided Emissions, no Removal of GHGs from the Atmosphere
*
*
169(+12)
50(+10)
24
10
83(+7)
36(+4)
125
32
126
49
10
5
28
11
8
6
42
13
124
26
222(+4)
52(+0)
Count of
Estimates
Count of
References

20
Summary for Policymakers Summaries
show that indirect changes in terrestrial carbon stocks have considerable uncertainties, are not directly observa-
ble, are complex to model and are diffi cult to attribute to a single cause. Proper governance of land use, zoning,
and choice of biomass production systems are key considerations for policy makers. [2.4.5, 2.5.1, 9.3.4, 9.4.4]
Policies are in place that aim to ensure that the benefi ts from bioenergy, such as rural development, overall
improvement of agricultural management and the contribution to climate change mitigation, are realized; their
effectiveness has not been assessed. [2.2, 2.5, 2.8]
• RE technologies, in particular non-combustion based options, can offer benefi ts with respect to air
pollution and related health concerns. [9.3.4.3, 9.4.4.1] Improving traditional biomass use can signifi cantly
reduce local and indoor air pollution (alongside GHG emissions, deforestation and forest degradation) and
lower associated health impacts, particularly for women and children in developing countries. [2.5.4, 9.3.4.4]
• Water availability could infl uence choice of RE technology. Conventional water-cooled thermal power
plants may be especially vulnerable to conditions of water scarcity and climate change. In areas where water
scarcity is already a concern, non-thermal RE technologies or thermal RE technologies using dry cooling can pro-
vide energy services without additional stress on water resources. Hydropower and some bioenergy systems are
dependent on water availability, and can either increase competition or mitigate water scarcity. Many impacts
can be mitigated by siting considerations and integrated planning. [2.5.5.1, 5.10, 9.3.4.4]
• Site-specifi c conditions will determine the degree to which RE technologies impact biodiversity.
RE-specifi c impacts on biodiversity may be positive or negative. [2.5, 3.6, 4.5, 5.6, 6.5, , 9.3.4.6]
• RE technologies have low fatality rates. Accident risks of RE technologies are not negligible, but their often
decentralized structure strongly limits the potential for disastrous consequences in terms of fatalities. However,
dams associated with some hydropower projects may create a specifi c risk depending on site-specifi c factors.
[9.3.4.7]
6. Mitigation potentials and costs
A signifi cant increase in the deployment of RE by 2030, 2050 and beyond is indicated in the majority of
the 164 scenarios reviewed in this Special Report.
11
In 2008, total RE production was roughly 64 EJ/yr (12.9% of
total primary energy supply) with more than 30 EJ/yr of this being traditional biomass. More than 50% of the scenarios
project levels of RE deployment in 2050 of more than 173 EJ/yr reaching up to over 400 EJ/yr in some cases (Figure
SPM.9). Given that traditional biomass use decreases in most scenarios, a corresponding increase in the production
level of RE (excluding traditional biomass) anywhere from roughly three-fold to more than ten-fold is projected. The
global primary energy supply share of RE differs substantially among the scenarios. More than half of the scenarios
show a contribution from RE in excess of a 17% share of primary energy supply in 2030 rising to more than 27% in
2050. The scenarios with the highest RE shares reach approximately 43% in 2030 and 77% in 2050. [10.2, 10.3]
RE can be expected to expand even under baseline scenarios. Most baseline scenarios show RE deployments
signifi cantly above the 2008 level of 64 EJ/yr and up to 120 EJ/yr by 2030. By 2050, many baseline scenarios reach
RE deployment levels of more than 100 EJ/yr and in some cases up to about 250 EJ/yr (Figure SPM.9). These baseline
deployment levels result from a range of assumptions, including, for example, continued demand growth for energy
services throughout the century, the ability of RE to contribute to increased energy access and the limited long-term
11 For this purpose a review of 164 global scenarios from 16 different large-scale integrated models was conducted. Although the set of scenarios
allows for a meaningful assessment of uncertainty, the reviewed 164 scenarios do not represent a fully random sample suitable for rigorous
statistical analysis and do not represent always the full RE portfolio (e.g., so far ocean energy is only considered in a few scenarios) [10.2.2]. For
more specifi c analysis, a subset of 4 illustrative scenarios from the set of 164 was used. They represent a span from a baseline scenario without
specifi c mitigation targets to three scenarios representing different CO
2
stabilization levels. [10.3]
21
Summaries Summary for Policymakers
availability of fossil resources. Other assumptions (e.g., improved costs and performance of RE technologies) render RE
technologies increasingly economically competitive in many applications even in the absence of climate policy. [10.2]
RE deployment signifi cantly increases in scenarios with low GHG stabilization concentrations. Low GHG stabi-
lization scenarios lead on average to higher RE deployment compared to the baseline. However, for any given long-term
GHG concentration goal, the scenarios exhibit a wide range of RE deployment levels (Figure SPM.9). In scenarios that
stabilize the atmospheric CO
2
concentrations at a level of less than 440 ppm, the median RE deployment level in 2050
is 248 EJ/yr (139 in 2030), with the highest levels reaching 428 EJ/yr by 2050 (252 in 2030). [10.2]
Many combinations of low-carbon energy supply options and energy effi ciency improvements can con-
tribute to given low GHG concentration levels, with RE becoming the dominant low-carbon energy supply
option by 2050 in the majority of scenarios. This wide range of results originates in assumptions about factors such
as developments in RE technologies (including bioenergy with CCS) and their associated resource bases and costs; the
comparative attractiveness of other mitigation options (e.g., end-use energy effi ciency, nuclear energy, fossil energy
with CCS); patterns of consumption and production; fundamental drivers of energy services demand (including future
population and economic growth); the ability to integrate variable RE sources into power grids; fossil fuel resources;
specifi c policy approaches to mitigation; and emissions trajectories towards long-term concentration levels. [10.2]
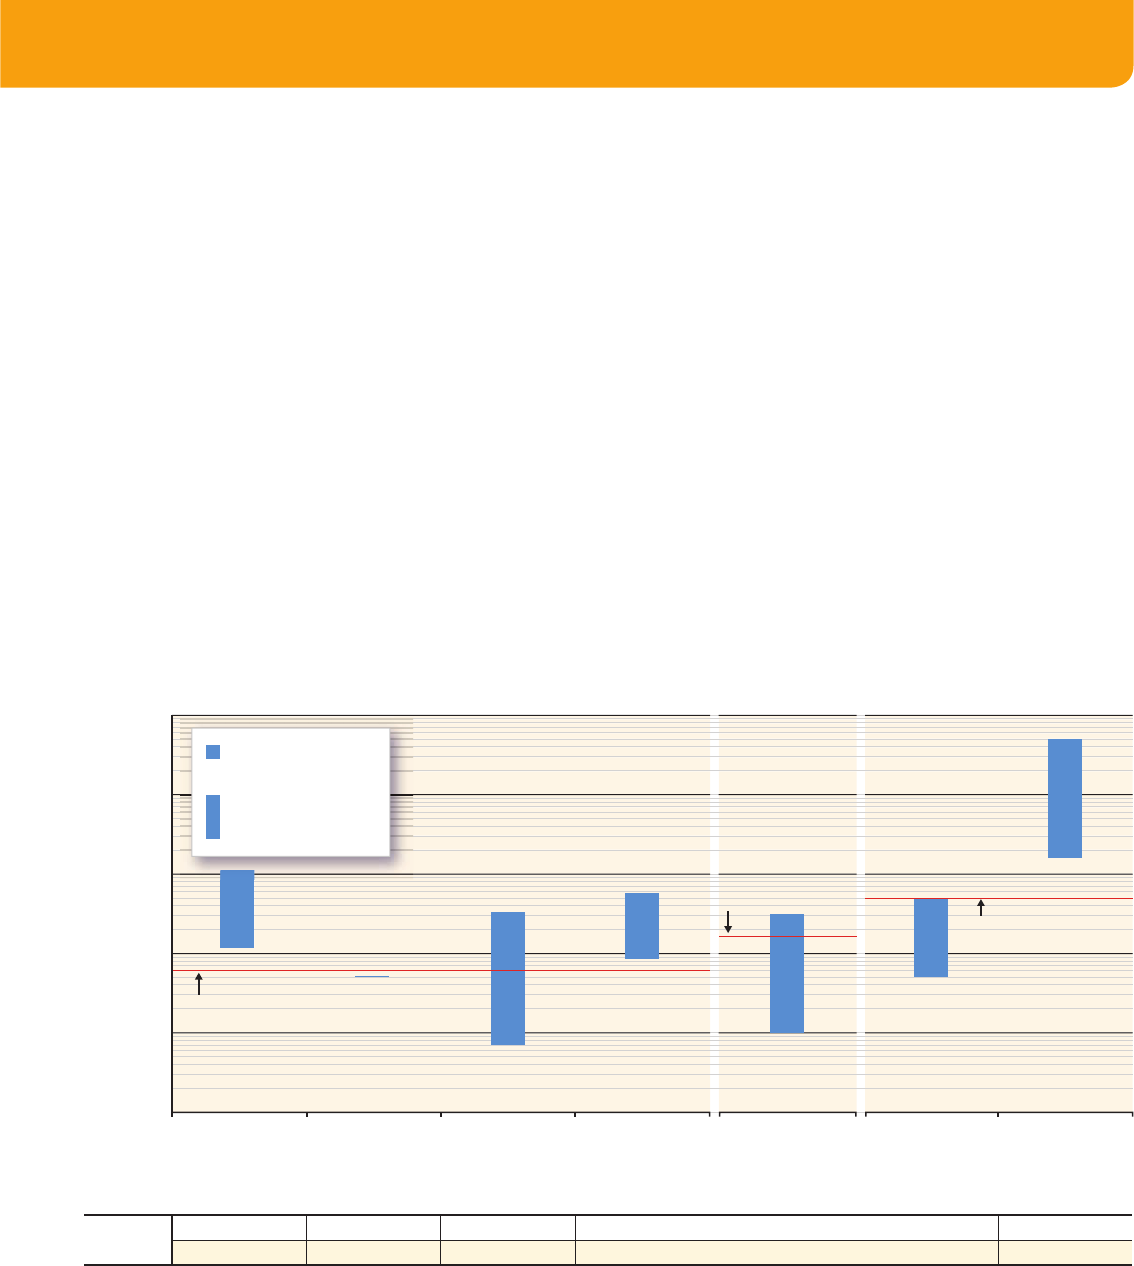
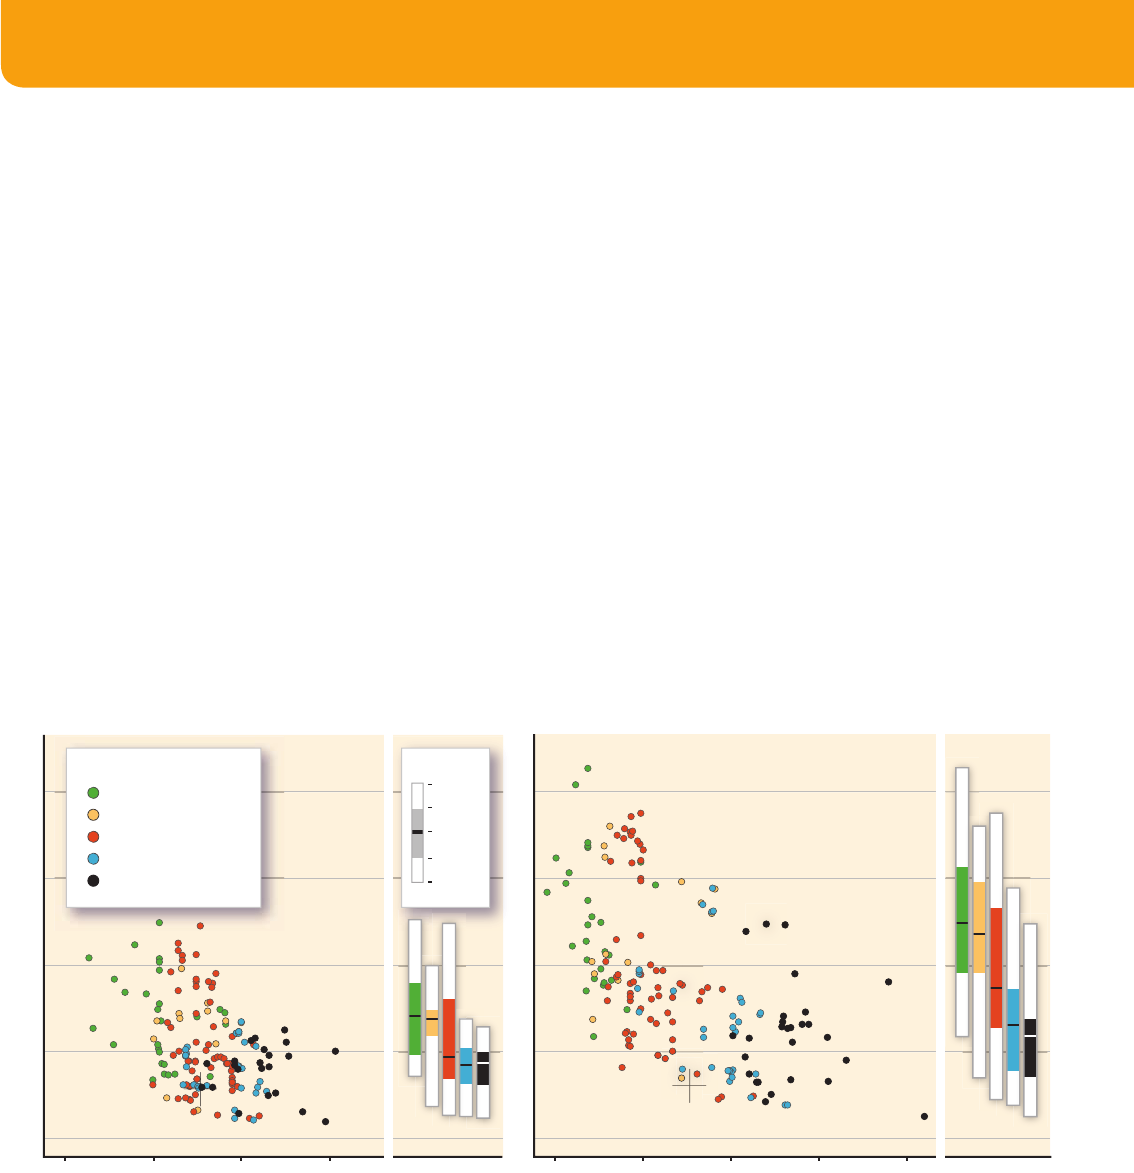
Figure SPM.9 | Global RE primary energy supply (direct equivalent) from 164 long-term scenarios versus fossil and industrial CO
2
emissions in 2030 and 2050. Colour coding is based
on categories of atmospheric CO
2
concentration stabilization levels that are defi ned consistently with those in the AR4. The panels to the right of the scatterplots show the deployment
levels of RE in each of the atmospheric CO
2
concentration categories. The thick black line corresponds to the median, the coloured box corresponds to the inter-quartile range (25th to
75th percentile) and the ends of the white surrounding bars correspond to the total range across all reviewed scenarios. The grey crossed lines show the relationship in 2007. [Figure
10.2, 10.2.2.2]
Notes: For data reporting reasons only 161 scenarios are included in the 2030 results shown here, as opposed to the full set of 164 scenarios. RE deployment levels below those of
today are a result of model output and differences in the reporting of traditional biomass. For details on the use of the ‘direct equivalent’ method of accounting for primary energy
supply and the implied care needed in the interpretation of scenario results, see Box SPM.2. Note that categories V and above are not included and category IV is extended to 600
ppm from 570 ppm, because all stabilization scenarios lie below 600 ppm CO
2
in 2100 and because the lowest baseline scenarios reach concentration levels of slightly more than
600 ppm by 2100.
CO
2
Concentration Levels
Category I (<400 ppm)
Category II (400-440 ppm)
Category III (440-485 ppm)
Category IV (485-600 ppm)
Baselines
20 40 60 80020 40 600
2030
0 100 200 300
400
0 100 200 300
400
N=161
2050
N=164
Renewable Primary Energy Supply [EJ/yr]
CO
2
Emissions from Fossil Fuels
and Industrial Processes [Gt CO
2
/yr]
CO
2
Emissions from Fossil Fuels
and Industrial Processes [Gt CO
2
/yr]
Category I
Category II
Category III
Category IV
Baselines
Category I
Category II
Category III
Category IV
Baselines
Maximum
75th
Median
25th
Minimum
22
Summary for Policymakers Summaries
The scenario review in this Special Report indicates that RE has a large potential to mitigate GHG emis-
sions. Four illustrative scenarios span a range of global cumulative CO
2
savings between 2010 and 2050, from about
220 to 560 Gt CO
2
compared to about 1,530Gt cumulative fossil and industrial CO
2
emissions in the IEA World Energy
Outlook 2009 Reference Scenario during the same period. The precise attribution of mitigation potentials to RE depends
on the role scenarios attribute to specifi c mitigation technologies, on complex system behaviours and, in particular, on
the energy sources that RE displaces. Therefore, attribution of precise mitigation potentials to RE should be viewed with
appropriate caution. [10.2, 10.3, 10.4]
Scenarios generally indicate that growth in RE will be widespread around the world. Although the precise
distribution of RE deployment among regions varies substantially across scenarios, the scenarios are largely consistent
in indicating widespread growth in RE deployment around the globe. In addition, the total RE deployment is higher over
the long term in the group of non-Annex I countries
12
than in the group of Annex I countries in most scenarios (Figure
SPM.10). [10.2, 10.3]
12 The terms ‘Annex I’ and ‘non-Annex I’ are categories of countries that derive from the United Nations Framework Convention on Climate
Change (UNFCCC).
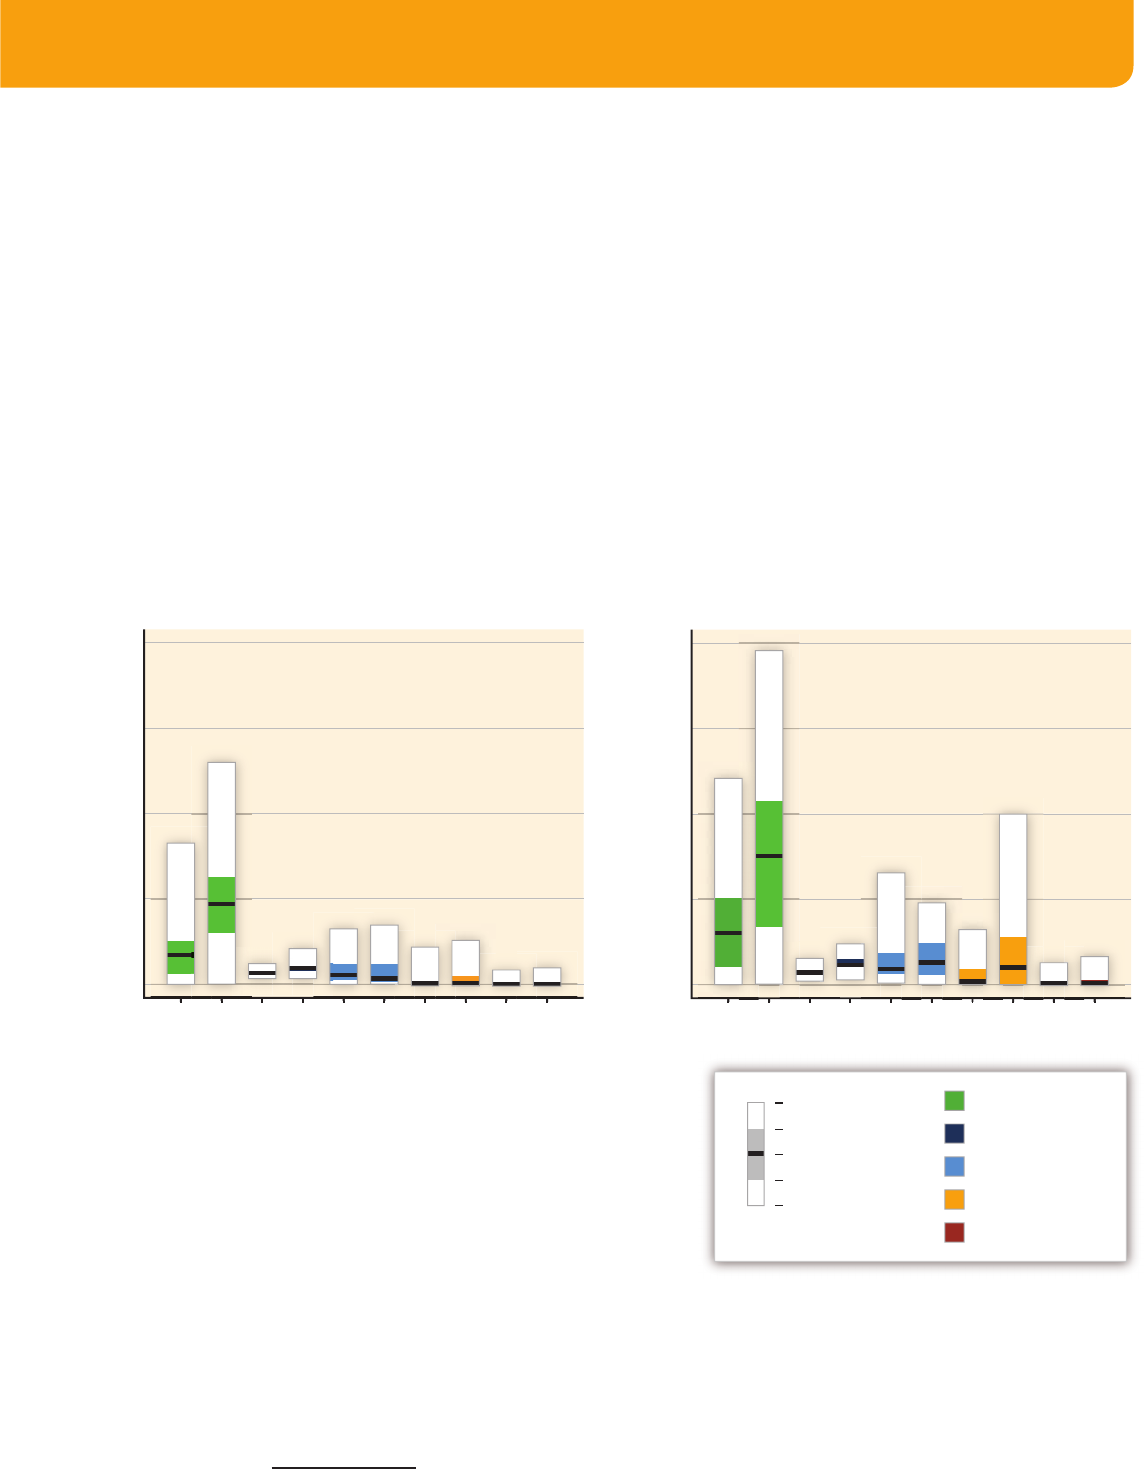
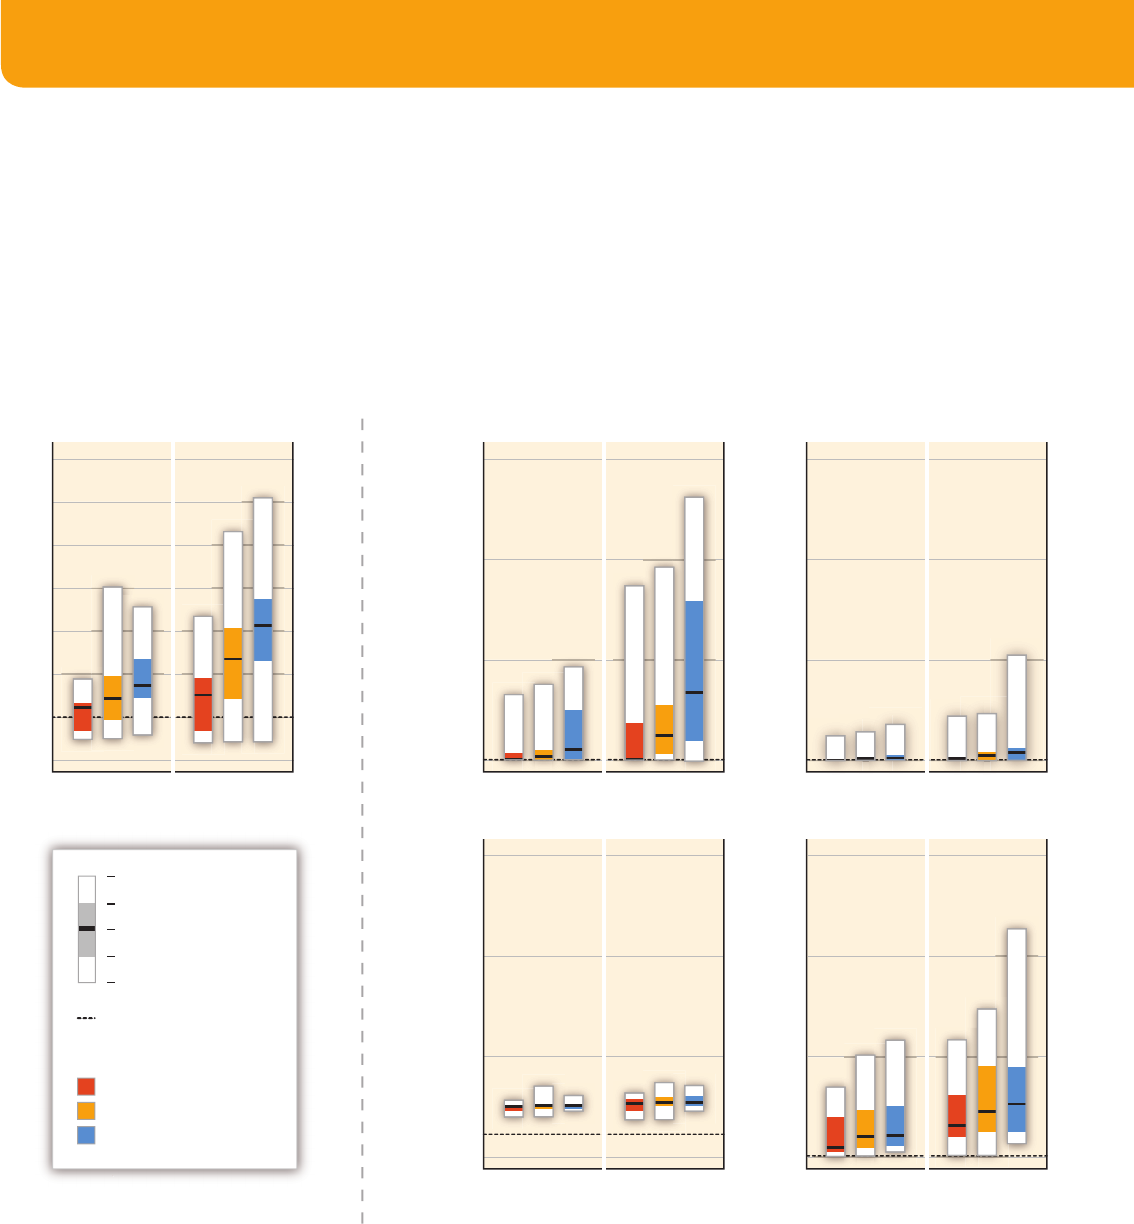
Figure SPM.10 | Global RE primary energy supply (direct equivalent) by source in the group of Annex I (AI) and the group of Non-Annex I (NAI) countries in 164 long-term scenarios
by 2030 and 2050. The thick black line corresponds to the median, the coloured box corresponds to the inter-quartile range (25th to 75th percentile) and the ends of the white
surrounding bars correspond to the total range across all reviewed scenarios. [Figure 10.8, 10.2.2.5]
Notes: For details on the use of the ‘direct equivalent’ method of accounting for primary energy supply and the implied care needed in the interpretation of scenario results, see Box
SPM.2. More specifi cally, the ranges of secondary energy provided from bioenergy, wind energy and direct solar energy can be considered of comparable magnitude in their higher
penetration scenarios in 2050. Ocean energy is not presented here as only very few scenarios consider this RE technology.
2030
AI NAI AI NAI AI NAI AI NAI AI NAI
[EJ/yr]
0
50
100
150
200
2050
[EJ/yr]
0
50
100
150
200
AI NAI AI NAI AI NAI AI NAI AI NAI
Bioenergy
Hydropower
Wind Energy
Direct Solar Energy
Geothermal Energy
Maximum
75th
Median
25th
Minimum
23
Summaries Summary for Policymakers
Scenarios do not indicate an obvious single dominant RE technology at a global level; in addition, the
global overall technical potentials do not constrain the future contribution of RE. Although the contribution of
RE technologies varies across scenarios, modern biomass, wind and direct solar commonly make up the largest contri-
butions of RE technologies to the energy system by 2050 (Figure SPM.11). All scenarios assessed confi rm that technical
potentials will not be the limiting factors for the expansion of RE at a global scale. Despite signifi cant technological and
regional differences, in the four illustrative scenarios less than 2.5% of the global available technical RE potential is
used. [10.2, 10.3]
Wind Energy
20502030
Primary Energy Supply [EJ/yr]
0
50
150
100
Direct Solar Energy
20502030
Hydropower
20502030
Geothermal Energy
20502030
20502030
Bioenergy
CO
2
Concentration Levels
Baselines
Cat. III + IV (440 - 600 ppm)
Cat. I + II (<440 ppm)
Primary Energy Supply is Accounted for Based on Secondary Energy ProducedBioenergy Supply is Accounted for Prior to Conversion
300
Primary Energy Supply [EJ/yr]
0
50
150
100
Primary Energy Supply [EJ/yr]
0
50
150
100
Primary Energy Supply [EJ/yr]
0
50
150
100
200
250
350
Primary Energy Supply [EJ/yr]
0
50
150
100
Deployment Level 2008
Maximum
75th
Median
25th
Minimum
Figure SPM.11 | Global primary energy supply (direct equivalent) of bioenergy, wind, direct solar, hydro, and geothermal energy in 164 long-term scenarios in 2030 and 2050,
and grouped by different categories of atmospheric CO
2
concentration level that are defi ned consistently with those in the AR4. The thick black line corresponds to the median, the
coloured box corresponds to the inter-quartile range (25th to 75th percentile) and the ends of the white surrounding bars correspond to the total range across all reviewed scenarios.
[Excerpt from Figure 10.9, 10.2.2.5]
Notes: For details on the use of the ‘direct equivalent’ method of accounting for primary energy supply and the implied care needed in the interpretation of scenario results, see Box
SPM.2. More specifi cally, the ranges of secondary energy provided from bioenergy, wind energy and direct solar energy can be considered of comparable magnitude in their higher
penetration scenarios in 2050. Ocean energy is not presented here as only very few scenarios consider this RE technology. Note that categories V and above are not included and
category IV is extended to 600 ppm from 570 ppm, because all stabilization scenarios lie below 600 ppm CO
2
in 2100 and because the lowest baselines scenarios reach concentra-
tion levels of slightly more than 600 ppm by 2100.

24
Summary for Policymakers Summaries
Individual studies indicate that if RE deployment is limited, mitigation costs increase and low GHG concen-
tration stabilizations may not be achieved. A number of studies have pursued scenario sensitivities that assume
constraints on the deployment of individual mitigation options, including RE as well as nuclear and fossil energy with
CCS. There is little agreement on the precise magnitude of the cost increase. [10.2]
A transition to a low-GHG economy with higher shares of RE would imply increasing investments in technol-
ogies and infrastructure. The four illustrative scenarios analyzed in detail in the SRREN estimate global cumulative RE
investments (in the power generation sector only) ranging fromUSD
2005
1,360 to 5,100 billion for the decade 2011to
2020, and from USD
2005
1,490 to 7,180 billion for the decade 2021 to 2030. The lower values refer to the IEA World
Energy Outlook 2009 Reference Scenario and the higher ones to a scenario that seeks to stabilize atmospheric CO
2
(only) concentration at 450 ppm. The annual averages of these investment needs are all smaller than 1% of the world’s
gross domestic product (GDP). Beyond differences in the design of the models used to investigate these scenarios,
the range can be explained mainly by differences in GHG concentrations assessed and constraints imposed on the set
of admissible mitigation technologies. Increasing the installed capacity of RE power plants will reduce the amount of
fossil and nuclear fuels that otherwise would be needed in order to meet a given electricity demand. In addition to
investment, operation and maintenance (O&M) and (where applicable) feedstock costs related to RE power plants, any
assessment of the overall economic burden that is associated with their application will have to consider avoided fuel
and substituted investment costs as well. Even without taking the avoided costs into account, the lower range of the
RE power investments discussed above is lower than the respective investments reported for 2009. The higher values of
the annual averages of the RE power sector investment approximately correspond to a fi ve-fold increase in the current
global investments in this fi eld. [10.5, 11.2.2]
7. Policy, implementation and fi nancing
An increasing number and variety of RE policies—motivated by many factors—have driven escalated
growth of RE technologies in recent years. [1.4, 11.2, 11.5, 11.6] Government policies play a crucial role in acceler-
ating the deployment of RE technologies. Energy access and social and economic development have been the primary
drivers in most developing countries whereas secure energy supply and environmental concerns have been most
important in developed countries [9.3, 11.3]. The focus of policies is broadening from a concentration primarily on RE
electricity to include RE heating and cooling and transportation. [11.2, 11.5]
RE-specifi c policies for research, development, demonstration and deployment help to level the playing fi eld for RE.
Policies include regulations such as feed-in-tariffs, quotas, priority grid access, building mandates, biofuel blending
requirements, and bioenergy sustainability criteria. [2.4.5.2, 2.ES, TS.2.8.1] Other policy categories are fi scal incentives
such as tax policies and direct government payments such as rebates and grants; and public fi nance mechanisms such
as loans and guarantees. Wider policies aimed at reducing GHG emissions such as carbon pricing mechanisms may also
support RE.
Policies can be sector specifi c, can be implemented at the local, state/provincial, national and in some cases regional
level, and can be complemented by bilateral, regional and international cooperation. [11.5]
Policies have promoted an increase in RE capacity installations by helping to overcome various barriers. [1.4,
11.1, 11.4, 11.5, 11.6] Barriers to RE deployment include:
• Institutional and policy barriers related to existing industry, infrastructure and regulation of the energy system;
• Market failures, including non-internalized environmental and health costs, where applicable;

25
Summaries Summary for Policymakers
• Lack of general information and access to data relevant to the deployment of RE, and lack of technical and knowl-
edge capacity; and
• Barriers related to societal and personal values and affecting the perception and acceptance of RE technologies.
[1.4, 9.5.1, 9.5.2.1]
Public R&D investments in RE technologies are most effective when complemented by other policy instru-
ments, particularly deployment policies that simultaneously enhance demand for new technologies. Together,
R&D and deployment policies create a positive feedback cycle, inducing private sector investment. Enacting deployment
policies early in the development of a given technology can accelerate learning by inducing private R&D, which in turn
further reduces costs and provides additional incentives for using the technology. [11.5.2]
Some policies have been shown to be effective and effi cient in rapidly increasing RE deployment. However,
there is no one-size-fi ts-all policy. Experience shows that different policies or combinations of policies can be more
effective and effi cient depending on factors such as the level of technological maturity, affordable capital, ease of inte-
gration into the existing system and the local and national RE resource base. [11.5]
• Several studies have concluded that some feed in tariffs have been effective and effi cient at promoting RE elec-
tricity, mainly due to the combination of long-term fi xed price or premium payments, network connections, and
guaranteed purchase of all RE electricity generated. Quota policies can be effective and effi cient if designed to
reduce risk; for example, with long-term contracts. [11.5.4]
• An increasing number of governments are adopting fi scal incentives for RE heating and cooling. Obligations to
use RE heat are gaining attention for their potential to encourage growth independent of public fi nancial support.
[11.5.5]
• In the transportation sector, RE fuel mandates or blending requirements are key drivers in the development of most
modern biofuel industries. Other policies include direct government payments or tax reductions. Policies have infl u-
enced the development of an international biofuel trade. [11.5.6]
The fl exibility to adjust as technologies, markets and other factors evolve is important. The details of design and imple-
mentation are critical in determining the effectiveness and effi ciency of a policy. [11.5]. Policy frameworks that are
transparent and sustained can reduce investment risks and facilitate deployment of RE and the evolution of low-cost
applications. [11.5, 11.6]
‘Enabling’ policies support RE development and deployment. A favourable, or enabling, environment for RE
can be created by addressing the possible interactions of a given policy with other RE policies as well as with energy
and non-energy policies (e.g., those targeting agriculture, transportation, water management and urban planning); by
easing the ability of RE developers to obtain fi nance and to successfully site a project; by removing barriers for access
to networks and markets for RE installations and output; by increasing education and awareness through dedicated
communication and dialogue initiatives; and by enabling technology transfer. In turn, the existence of an ‘enabling’
environment can increase the effi ciency and effectiveness of policies to promote RE. [9.5.1.1, 11.6]
Two separate market failures create the rationale for the additional support of innovative RE technologies
that have high potential for technological development, even if an emission market (or GHG pricing policy
in general) exists. The fi rst market failure refers to the external cost of GHG emissions. The second market failure is in
the fi eld of innovation: if fi rms underestimate the future benefi ts of investments into learning RE technologies or if they

26
Summary for Policymakers Summaries
cannot appropriate these benefi ts, they will invest less than is optimal from a macroeconomic perspective. In addition
to GHG pricing policies, RE-specifi c policies may be appropriate from an economic point of view if the related oppor-
tunities for technological development are to be addressed (or if other goals beyond climate mitigation are pursued).
Potentially adverse consequences such as lock-in, carbon leakage and rebound effects should be taken into account in
the design of a portfolio of policies. [11.1.1, 11.5.7.3]
The literature indicates that long-term objectives for RE and fl exibility to learn from experience would be
critical to achieve cost-effective and high penetrations of RE. This would require systematic development of
policy frameworks that reduce risks and enable attractive returns that provide stability over a time frame relevant to
the investment. An appropriate and reliable mix of policy instruments, including energy effi ciency policies, is even more
important where energy infrastructure is still developing and energy demand is expected to increase in the future. [11.5,
11.6, 11.7]
8. Advancing knowledge about renewable energy
Enhanced scientifi c and engineering knowledge should lead to performance improvements and cost reductions in RE
technologies. Additional knowledge related to RE and its role in GHG emissions reductions remains to be gained in a
number of broad areas including: [for details, see Table 1.1]
• Future cost and timing of RE deployment;
• Realizable technical potential for RE at all geographical scales;
• Technical and institutional challenges and costs of integrating diverse RE technologies into energy systems and
markets;
• Comprehensive assessments of socioeconomic and environmental aspects of RE and other energy technologies;
• Opportunities for meeting the needs of developing countries with sustainable RE services; and
• Policy, institutional and fi nancial mechanisms to enable cost-effective deployment of RE in a wide variety of
contexts.
Knowledge about RE and its climate change mitigation potential continues to advance. The existing scientifi c knowl-
edge is signifi cant and can facilitate the decision-making process. [1.1.8]
