
1039
19
Emergent Risks
and Key Vulnerabilities
Coordinating Lead Authors:
Michael Oppenheimer (USA), Maximiliano Campos (Costa Rica), Rachel Warren (UK)
Lead Authors:
Joern Birkmann (Germany), George Luber (USA), Brian O’Neill (USA), Kiyoshi Takahashi
(Japan)
Contributing Authors:
Franz Berkhout (Netherlands), Pauline Dube (Botswana), Wendy Foden (South Africa),
Stefan Greiving (Germany), Solomon Hsiang (USA), Matt Johnston (USA), Klaus Keller (USA),
Joan Kleypas (USA), Robert Kopp (USA), Rachel Licker (USA), Carlos Peres (UK), Jeff Price
(UK), Alan Robock (USA), Wolfram Schlenker (USA), John Richard Stepp (USA), Richard Tol
(UK), Detlef van Vuuren (Netherlands)
Review Editors:
Mike Brklacich (Canada), Sergey Semenov (Russian Federation)
Volunteer Chapter Scientists:
Rachel Licker (USA), Solomon Hsiang (USA)
This chapter should be cited as:
Oppenheimer
, M., M. Campos, R. Warren, J. Birkmann, G. Luber, B. O’Neill, and K. Takahashi, 2014: Emergent risks
and key vulnerabilities. In: Climate Change 2014: Impacts, Adaptation, and Vulnerability. Part A: Global and
Sectoral Aspects. Contribution of Working Group II to the Fifth Assessment Report of the Intergovernmental
Panel on Climate Change [Field, C.B., V.R. Barros, D.J. Dokken, K.J. Mach, M.D. Mastrandrea, T.E. Bilir,
M. Chatterjee, K.L. Ebi, Y.O. Estrada, R.C. Genova, B. Girma, E.S. Kissel, A.N. Levy, S. MacCracken,
P.R. Mastrandrea, and L.L. White (eds.)]. Cambridge University Press, Cambridge, United Kingdom and
New York, NY, USA, pp. 1039-1099.

19
1040
Executive Summary ......................................................................................................................................................... 1042
19.1. Purpose, Scope, and Structure of this Chapter ..................................................................................................... 1046
19.1.1. Historical Development of this Chapter .......................................................................................................................................... 1046
19.1.2. The Special Report on Managing the Risks of Extreme Events and Disasters to Advance Climate Change Adaptation .................. 1047
Box 19-1. Article 2 of the United Nations Framework Convention on Climate Change ........................................................... 1047
Box 19-2. Definitions ................................................................................................................................................................. 1048
19.1.3. New Developments in this Chapter ................................................................................................................................................ 1049
19.2. Framework for Identifying Key Vulnerabilities, Key Risks, and Emergent Risks ................................................... 1050
19.2.1. Risk and Vulnerability ..................................................................................................................................................................... 1050
19.2.2. Criteria for Identifying Key Vulnerabilities and Key Risks ................................................................................................................ 1050
19.2.2.1. Criteria for Identifying Key Vulnerabilities ....................................................................................................................... 1051
19.2.2.2. Criteria for Identifying Key Risks ...................................................................................................................................... 1051
19.2.3. Criteria for Identifying Emergent Risks ........................................................................................................................................... 1052
19.2.4. Identifying Key and Emergent Risks under Alternative Development Pathways .............................................................................. 1052
19.2.5. Assessing Key Vulnerabilities and Emergent Risks .......................................................................................................................... 1052
19.3. Emergent Risk: Multiple Interacting Systems and Stresses .................................................................................. 1053
19.3.1. Limitations of Previous Approaches Imply Key Risks Overlooked .................................................................................................... 1053
19.3.2. Examples of Emergent Risks ........................................................................................................................................................... 1053
19.3.2.1. Emergent Risks Arising from the Effects of Degradation of Ecosystem Services by Climate Change ............................... 1053
19.3.2.2. Emergent Risk Involving Non-Climate Stressors: The Management of Water, Land, and Energy ...................................... 1054
19.3.2.3. Emergent Risks Involving Health Effects ......................................................................................................................... 1056
19.3.2.4. Spatial Convergence of Multiple Impacts: Areas of Compound Risk ................................................................................ 1057
19.4. Emergent Risk: Indirect, Trans-boundary, and Long-Distance Impacts ................................................................. 1059
19.4.1. Crop Production, Prices, and Risk of Increased Food Insecurity ...................................................................................................... 1059
19.4.2. Indirect, Trans-boundary, and Long-Distance Impacts of Adaptation .............................................................................................. 1060
19.4.2.1. Risks Associated with Human Migration and Displacement ............................................................................................ 1060
19.4.2.2. Risk of Conflict and Insecurity ......................................................................................................................................... 1060
19.4.2.3. Risks Associated with Species Range Shifts ..................................................................................................................... 1061
19.4.3. Indirect, Trans-boundary, and Long-Distance Impacts of Mitigation Measures ............................................................................... 1061
19.5. Newly Assessed Risks ........................................................................................................................................... 1062
19.5.1. Risks from Large Global Temperature Rise >4°C above Preindustrial Levels .................................................................................. 1062
19.5.2. Risks from Ocean Acidification ....................................................................................................................................................... 1064
19.5.3. Risks from Carbon Dioxide Health Effects ....................................................................................................................................... 1064
19.5.4. Risks from Geoengineering (Solar Radiation Management) ........................................................................................................... 1065
Table of Contents

1041
Emergent Risks and Key Vulnerabilities Chapter 19
19
19.6. Key Vulnerabilities, Key Risks, and Reasons for Concern ...................................................................................... 1066
19.6.1. Key Vulnerabilities .......................................................................................................................................................................... 1066
19.6.1.1. Dynamics of Exposure and Vulnerability .......................................................................................................................... 1066
19.6.1.2. Differential Vulnerability and Exposure ........................................................................................................................... 1066
19.6.1.3. Trends in Exposure and Vulnerability ............................................................................................................................... 1067
19.6.1.4. Risk Perception ................................................................................................................................................................ 1068
19.6.2. Key Risks ......................................................................................................................................................................................... 1069
19.6.2.1. Assessing Key Risks ......................................................................................................................................................... 1069
19.6.2.2. The Role of Adaptation and Alternative Development Pathways ..................................................................................... 1072
19.6.3. Updating Reasons for Concern ....................................................................................................................................................... 1073
19.6.3.1. Variations in Reasons for Concern across Socioeconomic Pathways ............................................................................... 1074
19.6.3.2. Unique and Threatened Systems ...................................................................................................................................... 1075
19.6.3.3. Extreme Weather Events .................................................................................................................................................. 1076
19.6.3.4. Distribution of Impacts .................................................................................................................................................... 1077
19.6.3.5. Global Aggregate Impacts ............................................................................................................................................... 1078
19.6.3.6. Large-Scale Singular Events: Physical, Ecological, and Social System Thresholds and Irreversible Change ....................... 1079
19.7. Assessment of Response Strategies to Manage Risks .......................................................................................... 1080
19.7.1. Relationship between Adaptation Efforts, Mitigation Efforts, and Residual Impacts ....................................................................... 1080
19.7.2. Limits to Mitigation ........................................................................................................................................................................ 1083
19.7.3. Avoiding Thresholds, Irreversible Change, and Large-Scale Singularities in the Earth System ......................................................... 1084
19.7.4. Avoiding Tipping Points in Social/Ecological Systems ..................................................................................................................... 1085
19.7.5. Limits to Adaptation ....................................................................................................................................................................... 1085
References ....................................................................................................................................................................... 1085
Frequently Asked Questions
19.1: Does science provide an answer to the question of how much warming is unacceptable? ............................................................ 1047
19.2: How does climate change interact with and amplify preexisting risks? .......................................................................................... 1057
19.3: How can climate change impacts on one region cause impacts on other distant areas? ............................................................... 1062

1042
Chapter 19 Emergent Risks and Key Vulnerabilities
19
Executive Summary
This chapter assesses climate-related risks in the context of Article 2 of the United Nations Framework Convention on Climate
Change (UNFCCC). {Box 19.1} Such risks arise from the interaction of the evolving exposure and vulnerability of human, socioeconomic,
and biological systems with changing physical characteristics of the climate system. {19.2} Alternative development paths influence risk by
changing the likelihood of climatic events and trends (through their effects on greenhouse gases (GHGs) and other emissions) and by altering
vulnerability and exposure. {19.2.4, Figure 19-1, Box 19-2}
Interactions of climate change impacts on one sector with changes in exposure and vulnerability, as well as adaptation and
mitigation actions affecting the same or a different sector are generally not included or well integrated into projections of risk.
However, their consideration leads to the identification of a variety of emergent risks {Box 19-2} that were not previously
assessed or recognized (high confidence). {19.3}
This chapter identifies several such complex system interactions that increase vulnerability
and risk synergistically. For example:
•
The risk of climate change to human systems (e.g., agriculture and water supply) is increased by the loss of ecosystem services
that are supported by biodiversity (e.g., water purification, protection from extreme weather events, preservation of soils, recycling of
nutrients, and pollination of crops) (high confidence). Studies since the Fourth Assessment Report (AR4) broadly confirm that a large
proportion of species are at increased risk of extinction at all but the lowest levels of warming. {19.3.2.1, 19.5.1, 19.6.3.5}
•
Risks result from the management of water, land, and energy in the context of climate change. For example, in some water
stressed regions, as groundwater stores that have historically acted as buffers against impacts of climate variations and change are
depleted, adverse consequences arise for human systems and ecosystems simultaneously undergoing alteration of regional groundwater
resources due to climate change. The production of bioenergy crops to mitigate climate change leads to land conversion (e.g., from food
crops and unmanaged ecosystems to energy crops; high confidence) and in some scenarios, reduced food security as well as additional
GHG emissions over the course of decades or centuries. {19.3.2.2}
•
Climate change has the potential to adversely affect human health by increasing exposure and vulnerability to a variety of
stresses. For example, the interaction of climate change with food security can exacerbate malnutrition, increasing vulnerability of
individuals to a range of diseases (high confidence). {19.3.2.3}
•
The risk of severe harm and loss due to climate change-related hazards and various vulnerabilities is particularly high in large
urban and rural areas in low-lying coastal zones (high confidence). These areas, many characterized by increasing populations, are
exposed to multiple hazards and potential failures of critical infrastructure, generating new systemic risks. Cities in Asian megadeltas,
where populations are subject to sea level rise, storm surge, coastal erosion, saline intrusion, and flooding, provide an example. {19.2.3,
19.3.2.4, 19.4.2.1, 19.6.1.3.1, 19.6.2.1, 19.7.5, Table 19-4}
•
Spatial convergence of impacts in different sectors creates compound risk in many areas (medium confidence). Examples
include the Arctic (where thawing and sea ice loss disrupt land transportation, buildings, other infrastructure, and are projected to disrupt
indigenous culture); and the environs of Micronesia, Mariana Island, and Papua New Guinea (where coral reefs are highly threatened due
to exposure to concomitant sea surface temperature rise and ocean acidification). {19.3.2.4}
Emergent risks also arise from indirect, trans-boundary, and long-distance impacts of climate change. Adaptive responses and
mitigation measures sometimes increase such risks (high confidence). {19.4}
Human or ecological responses to local impacts of climate
change can generate harm at distant places.
• Increasing prices of food commodities on the global market due to local climate impacts, in conjunction with other stressors, decrease food
security and exacerbate food insecurity at distant locations. {19.4.1}
• Climate change will bear significant consequences for human migration flows at particular times and places, creating risks as well as
benefits for migrants and for sending and receiving regions and states (high confidence). {19.4.2.1}
• The effect of climate change on conflict and insecurity is an emergent risk because factors such as poverty and economic shocks that are
associated with a higher risk of violent conflict are themselves sensitive to climate change. In numerous statistical studies, the influence of
climate variability on violent conflict is large in magnitude (medium confidence). {19.4.2.2}
• Many species shift their ranges in response to climate change, adversely affecting ecosystem function and services while presenting new
challenges to conservation efforts (medium confidence). {19.4.2.3}

1043
Emergent Risks and Key Vulnerabilities Chapter 19
19
• Mitigation measures taken in one location can have long-distance or indirect impacts on biodiversity and/or human systems. For example,
the development of biofuels as energy sources can increase food prices (high confidence) and affect distant land use practices. {19.4.1,
19.4.3}
Additional risks related to particular biophysical impacts of climate change have arisen recently in the literature in sufficient
detail to permit assessment (high confidence). {19.5}
• Risks associated with global temperature rise in excess of 4°C relative to preindustrial levels
1
arise from severe and widespread
impacts on unique and threatened systems, substantial species extinction, extensive loss of ecosystem functioning, large risks to global and
regional food security, and the combination of high temperature and humidity compromising normal human activities, including growing
food or working outdoors in some areas for parts of the year (high confidence) and the potential for traversing thresholds that lead to
disproportionately large Earth systems responses (medium confidence). {19.5.1}
•
Ocean acidification poses risks to marine ecosystems and the societies that depend on them. For example, ocean acidification is
very likely to lead to changes in coral calcification rates. Reduced coral calcification is projected to have impacts of medium to high
magnitude on some ecosystem services, including tourism and the provisioning of fishing. {19.5.2}
•
There is increasing evidence in the literature that high ambient carbon dioxide (CO
2
) concentrations in the atmosphere will
affect human health by increasing the production and allergenicity of pollen and allergenic compounds and by decreasing
nutritional quality of important food crops. {19.5.3}
• In addition to providing potential climate change abatement benefits, geoengineering poses widespread risks to society and
ecosystems. For example, in some model experiments the implementation of Solar Radiation Management (SRM) for the purpose of limiting
global warming leads to ozone depletion and reduces precipitation. In addition, the failure or abrupt halting of SRM risks rapid climate
change. {19.5.4}
Global, regional, and local socioeconomic, environmental, and governance trends indicate that vulnerability and exposure of
communities or social-ecological systems to climatic hazards related to extreme events are dynamic and thus vary across temporal
and spatial scales (high confidence).
Effective risk reduction and adaptation strategies consider these dynamics and the inter-linkages between
socioeconomic development pathways and the vulnerability and exposure of people. Changes in poverty or socioeconomic status, ethnic
composition, age structure, and governance had a significant influence on the outcome of past crises associated with climatic hazards. {19.6.1}
Challenges for vulnerability reduction and adaptation actions are particularly high in regions that have shown severe difficulties
in governance. Studies confirm that countries that are classified as failed states and afflicted by violence are often not able to reduce
vulnerability effectively. Unless governance improves in countries with severe governance failure, risk will increase as a result of climate
changes interacting with increased human vulnerability (high confidence). {19.6.1.3.3}
Key risks inform evaluation of “dangerous anthropogenic interference with the climate system,” in the terminology of UNFCCC
Article 2. These are potentially severe adverse consequences for humans and social-ecological systems resulting from the
interaction of hazards linked to climate change and the vulnerability of exposed societies and systems. Key risks were identified
in this assessment based on expert judgments made by authors of the various chapters of this report in light of criteria described
here {19.2.2.2} and consolidated into the following representative list (high confidence).
{19.2.2.2, 19.6.2.1, Table 19-4, Boxes 19-2
and CC-KR} (Roman numerals indicate corresponding entries in Table 19-4; notation at end of each entry indicates corresponding Reasons for
Concern (RFCs), discussed below.)
1
Levels of global mean temperature change are variously presented in the literature with respect to “preindustrial” temperatures in a specified year or period, e.g., 1850–1900.
Alternatively, the average temperature within a recent period, e.g., 1986–2005, is used as a baseline. In this chapter, we use both, depending on the literature being assessed.
The increase above preindustrial (1850–1900) levels for the period 1986–2005 is estimated at 0.61°C (WGI AR5 Section 11.3.6.3). For example, using these baselines, a 2°C
increase above preindustrial levels corresponds to a 1.39°C increase above 1986–2005 levels. We use other baselines on occasion depending on the literature cited and explicitly
indicate where this is the case. Climate impact studies often report outcomes as a function of regional temperature change, which can differ significantly from changes in global
mean temperature. In most land areas, regional warming is larger than global warming (WGI AR5 Section 10.3.1.1.2). However, given the many conventions in the literature
for baseline periods, readers are advised to check carefully and to adjust baseline levels for consistency when comparing outcomes.

1044
Chapter 19 Emergent Risks and Key Vulnerabilities
19
i) Risk of death, injury, ill-health, or disrupted livelihoods in low-lying coastal zones and small island developing states and other small islands,
due to storm surges, coastal flooding, and sea level rise. [RFC 1-5]
ii) Risk of severe ill-health and disrupted livelihoods for large urban populations due to inland flooding in some regions. [RFC 2 and 3]
iii) Systemic risks due to extreme weather events leading to breakdown of infrastructure networks and critical services such as electricity,
water supply, and health and emergency services. [RFC 2-4]
iv) Risk of mortality and morbidity during periods of extreme heat, particularly for vulnerable urban populations and those working outdoors
in urban or rural areas. [RFC 2 and 3]
v) Risk of food insecurity and the breakdown of food systems linked to warming, drought, flooding, and precipitation variability and extremes,
particularly for poorer populations in urban and rural settings. [RFC 2-4]
vi) Risk of loss of rural livelihoods and income due to insufficient access to drinking and irrigation water and reduced agricultural productivity,
particularly for farmers and pastoralists with minimal capital in semi-arid regions. [RFC 2 and 3]
vii) Risk of loss of marine and coastal ecosystems, biodiversity, and the ecosystem goods, functions, and services they provide for coastal
livelihoods, especially for fishing communities in the tropics and the Arctic. [RFC 1, 2, and 4]
viii) Risk of loss of terrestrial and inland water ecosystems, biodiversity, and the ecosystem goods, functions, and services they provide for
livelihoods. [RFC 1, 3, and 4]
Climate change risks vary substantially across plausible alternative development pathways and the relative importance of
development and climate change varies by sector, region, and time period; both are important to understanding possible
outcomes (high confidence).
In some cases, there is substantial potential for adaptation to reduce risks, with development pathways playing
a key role in determining challenges to adaptation, including through their effects on ecosystems and ecosystem services. {19.6.2.2}
Assessment of the RFC framework pertinent to Article 2 of the UNFCCC has led to evaluations of risk being updated in light of
the advances since the AR4. {19.6.3}
(All temperature changes are relative to 1986–2005, i.e., “recent.” Numbers are indicative of RFC
designation in key risk enumeration, above.)
1.
Unique and threatened systems: Some unique and threatened systems, including ecosystems and cultures, are already at risk from climate
change (high confidence). The number of such systems at risk of severe consequences is higher with additional warming of around 1°C.
Many species and systems with limited adaptive capacity are subject to very high risks with additional warming of 2°C, particularly Arctic-
sea-ice and coral-reef systems. {19.6.3.2}
2.
Extreme weather events: Climate-change-related risks from extreme events, such as heat waves, extreme precipitation, and coastal
flooding, are already moderate (high confidence) and high with 1°C additional warming (medium confidence). Risks associated with some
types of extreme events (e.g., extreme heat) increase further at higher temperatures (high confidence). {19.6.3.3}
3.
Distribution of impacts: Risks are unevenly distributed and are generally greater for disadvantaged people and communities in countries
at all levels of development. Risks are already moderate because of regionally differentiated climate-change impacts on crop production in
particular (medium to high confidence). Based on projected decreases in regional crop yields and water availability, risks of unevenly
distributed impacts are high for additional warming above 2°C (medium confidence). {19.6.3.4}
4.
Global aggregate impacts: Risks of global aggregate impacts are moderate for additional warming between 1-2°C, reflecting impacts to
both Earth’s biodiversity and the overall global economy (medium confidence). Extensive biodiversity loss with associated loss of ecosystem
goods and services results in high risks around 3°C additional warming (high confidence). Aggregate economic damages accelerate with
increasing temperature (limited evidence, high agreement), but few quantitative estimates have been completed for additional warming
around 3°C or above. {19.3.2.1, 19.5.1, 19.6.3.5}
5.
Large-scale singular events: With increasing warming, some physical systems or ecosystems may be at risk of abrupt and irreversible
changes. Risks associated with such tipping points become moderate between 0-1°C additional warming, due to early warning signs that
both warm-water coral reef and Arctic ecosystems are already experiencing irreversible regime shifts (medium confidence). Risks increase
disproportionately as temperature increases between 1-2°C additional warming and become high above 3°C, due to the potential for a
large and irreversible sea level rise from ice sheet loss. For sustained warming greater than some threshold, near-complete loss of the
Greenland ice sheet would occur over a millennium or more, contributing up to 7 m of global mean sea level rise. {19.6.3.6}

1045
Emergent Risks and Key Vulnerabilities Chapter 19
19
Impacts of climate change avoided under a range of scenarios for mitigation of GHG emissions are potentially large and increasing
over the 21st century (high confidence). {19.7.1}
Among the impacts assessed here, benefits from mitigation are most immediate for surface
ocean acidification and least immediate for impacts related to sea level rise. Because mitigation reduces the rate as well as the magnitude of
warming, it also increases the time available for adaptation to a particular level of climate change, potentially by several decades.
Only mitigation scenarios in the most stringent category (i.e., with 2100 CO
2
-eq concentrations of 430 to 480 ppm) maintain
moderately healthy coral reefs (medium confidence). With respect to the RFCs, only the most stringent of scenarios in this category
constrain overall risks to unique and threatened systems, and those associated with extreme weather events to a moderate level,
while the other scenarios in this category create risk in the high range for these two RFCs. The most stringent among these
scenarios constrain the level of risk associated with all other RFCs to the moderate level (high confidence). {19.6.3.2-3, 19.7.1}
The higher part of the range of GHG emission scenarios in the literature, that is, those with 2100 CO
2
-eq concentrations above
720 ppm create risks associated with extreme weather events and large-scale singular events that are in the high range, and
very high range (reflecting inability to adapt) for unique and threatened systems. Risks associated with the distribution of impacts
increase toward the very high range (high confidence). Risks of global aggregate impacts transition from moderate to high as
CO
2
-eq concentrations increase from 720 ppm. {19.6.3.2, 19.6.3.4, 19.7.1}
Under any plausible scenario for mitigation and adaptation, some degree of risk from residual damages is unavoidable (very high
confidence).
For example, very few integrated assessment model-based scenarios in the literature demonstrate the feasibility of limiting
warming to a maximum of 1.5°C with at least 50% likelihood. {19.7.1-2}
The risk of crossing tipping points (critical thresholds) in the Earth system or socio-ecological systems is projected to decrease
with reduced GHG emissions {19.7.3}, and the risk of crossing tipping points in socio-ecological systems can also be reduced by
reducing human vulnerability or by preserving ecosystem services, or both (medium confidence). {19.7.4}
The risk of crossing tipping
points is reduced by limiting the level of climate change and/or removing concomitant stresses such as overgrazing, overfishing, and pollution,
but there is low confidence in the level of climate change associated with such tipping points and measures to avoid them.

1046
Chapter 19 Emergent Risks and Key Vulnerabilities
19
19.1. Purpose, Scope, and Structure
of this Chapter
The objective of this chapter is to assess new literature published
since the Fourth Assessment Report (AR4) on emergent risks and key
vulnerabilities to climate change from the perspective of the distribution
of risk over geographic location, economic sector, time period, and
socioeconomic characteristics of individuals and societies. Frameworks
used in previous IPCC reports to assess risk in the context of Article 2
of the United Nations Framework Convention on Climate Change
(UNFCCC) are updated and extended in light of new literature, and
additional frameworks arising in recent literature are examined. A
focal point of this chapter is the interaction of the changing physical
characteristics of the climate system with evolving characteristics of
socioeconomic and biological systems (exposure and vulnerability) to
produce risk (see Figure 19-1). Given the centrality of Article 2 to this
chapter, the greater emphasis is on harmful outcomes of climate change
rather than potential benefits.
19.1.1. Historical Development of this Chapter
The Third and Fourth Assessment Reports (TAR and AR4, respectively)
each devoted chapters to evaluating the state of knowledge relevant
t
o Article 2 of the UNFCCC (Smith et al., 2001; Schneider et al., 2007;
see Box 19-1). The TAR sorted and aggregated impacts discussed in
the literature according to a framework called Reasons for Concern
(RFCs), and assessed the level of risk associated with individual impacts
of climate change as well as each category or “reason” as a whole,
generally as a function of global mean warming. This assessment took
account of the distribution of vulnerability across particular regions,
countries, and sectors.
AR4 furthered the discussion relevant to Article 2 by assessing new
literature and developing criteria potentially useful for policy makers in
the determination of key impacts and vulnerabilities, that is, those
meriting particular attention in respect to Article 2. See Box 19-2 for
definitions of Reasons for Concern, Key Vulnerabilities (KVs), and related
terms. Some definitions go beyond those in the Glossary to provide
details especially pertinent to this chapter.
AR4 emphasized the differences in vulnerability between developed
and developing countries but also assessed new literature describing
vulnerability pertaining to various aggregations of people (such as by
ethnic, cultural, age, gender, or income status) and response strategies
for avoiding key impacts. The RFCs were updated and the Synthesis
Report (IPCC, 2007a) noted that they “remain a viable framework to
consider key vulnerabilities” (IPCC, 2007a, Section 5.2). However, their
EMISSIONS
and Land-use Change
Vulnerability
Exposure
RISK
Hazards
Anthropogenic
Climate Change
Socioeconomic
Pathways
Adaptation and
Mitigation
Actions
Governance
IMPACTS
Natural
Variability
SOCIOECONOMIC
PROCESSES
CLIMATE
Key
Emergent
Figure 19-1 | Schematic of the interaction among the physical climate system, exposure, and vulnerability producing risk. The figure visualizes the different terms and concepts
discussed in this chapter. Risk of climate-related impacts results from the interaction of climate-related hazards (including hazardous events and trends) with the vulnerability and
exposure of human and natural systems. The definition and use of “key” and “emergent” are indicated in Box 19-2 and the Glossary. Vulnerability and exposure are, as the figure
shows, largely the result of socioeconomic pathways and societal conditions (although changing hazard patterns also play a role; see Section 19.6.1.1). Changes in both the
climate system (left side) and socioeconomic processes (right side) are central drivers of the different core components (vulnerability, exposure, and hazards) that constitute risk
(modified version of SREX Figure SPM.1 (IPCC, 2012a)).
R

1047
Emergent Risks and Key Vulnerabilities Chapter 19
19
u
tility was limited by several factors: the lack of a time dimension (i.e.,
representation of impacts arising from timing and rates of climate
change and climate forcing); the focus on risk only as a function of
global mean temperature; lack of a clear distinction between impacts
and vulnerability; and, importantly, incomplete incorporation of the
evolving socioeconomic context, particularly adaptation capacity, in
representing impacts and vulnerability.
19.1.2. The Special Report on Managing the Risks
of Extreme Events and Disasters to Advance
Climate Change Adaptation
The IPCC Special Report on Managing the Risks of Extreme Events and
Disasters to Advance Climate Change Adaptation (SREX; IPCC, 2012a)
provides additional insights with respect to two RFCs (risks associated
with extreme weather events and the distribution of impacts) and
particularly the distribution of capacities to adapt to extreme events
across countries, communities, and other groups, and the limitations on
implementation of these capacities. SREX emphasized the role of the
socioeconomic setting and development pathway (expressed through
exposure and vulnerability) in determining, on the one hand, the
circumstances where extreme events do or do not result in extreme
Box 19-1 | Article 2 of the United Nations
Framework Convention on
Climate Change
Article 2
OBJECTIVE: The ultimate objective of this Convention
and any related legal instruments that the Conference of
the Parties may adopt is to achieve, in accordance with the
relevant provisions of the Convention, stabilization of
greenhouse gas concentrations in the atmosphere at a level
that would prevent dangerous anthropogenic interference
with the climate system. Such a level should be achieved
within a time-frame sufficient to allow ecosystems to adapt
naturally to climate change, to ensure that food production
is not threatened and to enable economic development to
proceed in a sustainable manner.
Frequently Asked Questions
FAQ 19.1 | Does science provide an answer to the question of
how much warming is unacceptable?
No. Careful, critical scientific research and assessment can provide information to help society consider what levels
of warming or climate change impacts are unacceptable. However, the answer is ultimately a subjective judgment
that depends on values and culture, as well as socioeconomic and psychological factors, all of which influence how
people perceive risk in general and the risk of climate change in particular. The question of what level of climate
change impacts is unacceptable is ultimately not just a matter of the facts, but of how we feel about those facts.
This question is raised in Article 2 of the UNFCCC. The criterion, in the words of Article 2, is “dangerous anthropogenic
interference with the climate system”—a framing that invokes both scientific analysis and human values.
Agreements reached by governments since 2009, meeting under the auspices of the UNFCCC, have recognized “the
scientific view that the increase in global temperature should be below 2 degrees Celsius” (Section 19.1, UNFCCC,
Copenhagen Accord). Still, as informed on the subject as the scientists referred to in this statement may be, theirs
is just one valuable perspective. How each country or community will define acceptable or unacceptable levels,
essentially deciding what is “dangerous,” is a societal judgment.
Science can certainly help society think about what is unacceptable. For example, science can identify how much
monetary loss might occur if tropical cyclones grow more intense or heat waves more frequent, or identify the land
that might be lost in coastal communities for various levels of higher seas. But “acceptability” depends on how
each community values those losses. This question is more complex when loss of life is involved and yet more so
when damage to future generations is involved. These are highly emotional and controversial value propositions
that science can only inform, not decide.
The purpose of this chapter is to highlight key vulnerabilities and key risks that science has identified; however, it
is up to people and governments to determine how the associated impacts should be valued, and whether and
how the risks should be acted upon.

1048
Chapter 19 Emergent Risks and Key Vulnerabilities
19
Box 19-2 | Definitions
Exposure: The presence of people, livelihoods, species or ecosystems, environmental functions, services, and resources, infrastructure,
or economic, social, or cultural assets in places and settings that could be adversely affected.
Vulnerability: The propensity or predisposition to be adversely affected. Vulnerability encompasses a variety of concepts and elements
including sensitivity or susceptibility to harm and lack of capacity to cope and adapt.
A broad set of factors such as wealth, social status, and gender determine vulnerability and exposure to climate-related risk.
Impacts: (Consequences, Outcomes) Effects on natural and human systems. In this report, the term impacts is used primarily to refer
to the effects on natural and human systems of extreme weather and climate events and of climate change. Impacts generally refer
to effects on lives, livelihoods, health, ecosystems, economies, societies, cultures, services, and infrastructure due to the interaction of
climate changes or hazardous climate events occurring within a specific time period and the vulnerability of an exposed society or
system. Impacts are also referred to as consequences and outcomes. The impacts of climate change on geophysical systems, including
floods, droughts, and sea level rise, are a subset of impacts called physical impacts.
Hazard: The potential occurrence of a natural or human-induced physical event or trend or physical impact that may cause loss of life,
injury, or other health impacts, as well as damage and loss to property, infrastructure, livelihoods, service provision, ecosystems, and
environmental resources. In this report, the term hazard usually refers to climate-related physical events or trends or their physical impacts.
Stressors: Events and trends, often not climate-related, that have an important effect on the system exposed and can increase
vulnerability to climate-related risk.
Risk: The potential for consequences where something of value is at stake and where the outcome is uncertain, recognizing the
diversity of values. Risk is often represented as probability of occurrence of hazardous events or trends multiplied by the impacts if
these events or trends occur.
Risk = (Probability of Events or Trends) × Consequences
Risk results from the interaction of vulnerability, exposure, and hazard (see Figure 19-1). In this report, the term risk is used primarily
to refer to the risks of climate-change impacts.
Key vulnerability, key risk, key impact: A vulnerability, risk, or impact relevant to the definition and elaboration of “dangerous
anthropogenic interference (DAI) with the climate system,” in the terminology of United Nations Framework Convention on Climate
Change (UNFCCC) Article 2, meriting particular attention by policymakers in that context.
Key risks are potentially severe adverse consequences for humans and social-ecological systems resulting from the interaction of
climate-related hazards with vulnerabilities of societies and systems exposed. Risks are considered “key” due to high hazard or high
vulnerability of societies and systems exposed, or both.
Vulnerabilities are considered “key” if they have the potential to combine with hazardous events or trends to result in key risks.
Vulnerabilities that have little influence on climate-related risk, for instance, due to lack of exposure to hazards, would not be
considered key.
Key impacts are severe consequences for humans and social-ecological systems.
Continued next page

1049
Emergent Risks and Key Vulnerabilities Chapter 19
19
impacts and disasters, and on the other hand, when non-extreme events
may also result in extreme impacts and disasters.
19.1.3. New Developments in this Chapter
With these frameworks already established, and a long list of impacts and
key vulnerabilities enumerated and categorized in previous assessments,
the current chapter has three goals: first, to recognize and assess risks that
arise out of complex interactions involving climate and socio-ecological
systems, called emergent risks (see Boxes 19-2, CC-KR; Table 19-4). In many
cases, scientific literature sufficient to permit assessment of such risks
has become available largely since AR4. In this chapter, we consider
only those emergent risks that are relevant to interpreting Article 2 or
have the potential to become relevant (see criteria in Section 19.2.2)
as additional understanding accumulates. For example, since AR4,
sufficient literature has emerged to allow initial assessment of the
potential relationship between climate change and conflict. The second
goal is to reassess and reorganize the existing frameworks (based on
RFCs and KVs) for evaluating the literature pertinent to Article 2 of the
UNFCCC to address the deficiencies cited in Section 19.1.1, particularly
in light of the advances in SREX and the current report’s discussions of
vulnerability and human security (Chapters 12 and 13) and adaptation
(Chapters 14 to 17 and 20). From this perspective, the objective stated
in Article 2 may be viewed as aiming in part to ensure human security
in the face of climate change. Third, this chapter assesses recent literature
pertinent to additional frameworks for categorizing risk and vulnerability,
focusing on indirect impacts and interaction and concatenation of risk,
including geographic areas of compound risk (Section 19.3).
To clarify the relative roles of characteristics of the physical climate system,
such as increases in temperature, precipitation, or storm frequency, and
Box 19-2 (continued)
Extract from WGII AR4 Chapter 19:
Many impacts, vulnerabilities and risks merit particular attention by policy-makers due to characteristics that might make them ‘key’.
The identification of potential key vulnerabilities is intended to provide guidance to decision-makers for identifying levels and rates of
climate change that may be associated with ‘dangerous anthropogenic interference’ (DAI) with the climate system, in the terminology
of United Nations Framework Convention on Climate Change (UNFCCC) Article 2 (see Box 19-1). Ultimately, the definition of DAI
cannot be based on scientific arguments alone, but involves other judgments informed by the state of scientific knowledge.
Emergent Risk: A risk that arises from the interaction of phenomena in a complex system, for example, the risk caused when
geographic shifts in human population in response to climate change lead to increased vulnerability and exposure of populations in
the receiving region. Many of the emergent risks discussed in this report have only recently been analyzed in the scientific literature
in sufficient detail to permit assessment. In this chapter, the only emergent risks discussed are those that have the potential to become
key risks once sufficient understanding accumulates.
Reasons for Concern: Elements of a classification framework, first developed in the IPCC Third Assessment Report, which aims to
facilitate judgments about what level of climate change may be “dangerous” (in the language of Article 2 of the UNFCCC) by
aggregating impacts, risks, and vulnerabilities.
Summary of Reasons for Concern (revised from WGII TAR Chapter 19; see also Sections 1.2.3, 18.6.4):
“Reasons for Concern” may aid readers in making their own determination about what is a “dangerous” climate change. Each Reason
for Concern is consistent with a paradigm that can be used by itself or in combination with other paradigms to help determine what
level of climate change is dangerous. The reasons for concern are the relations between global mean temperature increase and:
1. Risks to unique and threatened systems
2. Risks associated with extreme weather events
3. Risks associated with the distribution of impacts
4. Risks associated with global aggregate impacts
5. Risks associated with large-scale singular events

1050
Chapter 19 Emergent Risks and Key Vulnerabilities
19
c
haracteristics of the socioeconomic and biological systems with which
these interact (vulnerability and exposure) to produce risks of particular
consequences (the latter term used interchangeably here with “impacts”
and “outcomes”), we rely heavily on a concept used sparingly in the TAR
and AR4, key risks (see Box 19-2). Furthermore, we emphasize recent
literature pointing to the dynamic character of vulnerability and exposure
based on their intimate relationship to development.
Section 19.2 describes the framework used here for identifying key
vulnerabilities, key risks, and emergent risks. We consider a variety of
types of emergent risks, including in Section 19.3 those arising from
multiple interacting systems and stresses, and in Section 19.4, those
arising from indirect impacts, trans-boundary impacts, and impacts
occurring at a long distance from the location of the climate change
that causes them. One example that illustrates all of these properties
is the extent to which climate change impacts on agriculture, water
resources, and sea level affect human migration flows. These shifts entail
both risks of harm and potential benefits for the migrants, for the regions
where they originate, and for the destination regions (see Sections 12.4,
19.4.2.1). Associated risks include indirect impacts, like the effect of
land use changes on ecosystems occurring at the new locations of
settlement, which may be near the location of the original climate
impact or quite distant. Such distant, indirect effects would compound
the direct consequences of climate change at the locations receiving
the incoming migrants. In Section 19.5, we discuss other risks newly
assessed here, including those arising from ocean acidification. Section
19.6 assesses key risks and vulnerabilities in light of the criteria discussed
here (Section 19.2.2) and in the context of the RFCs, and Section 19.7
assesses response strategies aimed at avoiding key risks.
19.2. Framework for Identifying
Key Vulnerabilities, Key Risks,
and Emergent Risks
19.2.1. Risk and Vulnerability
Definitions and frameworks that systematize hazards, exposure,
vulnerability, risk, and adaptation in the context of climate change are
multiple, overlapping, and often contested (see, e.g., Burton et al., 1983;
Blaikie et al., 1994; Twigg, 2001; Turner et al., 2003a,b; UNISDR, 2004;
Schröter, 2005; Adger, 2006; Birkmann, 2006b; Füssel and Klein, 2006;
Thomalla et al., 2006; Tol and Yohe, 2006; Villagrán de León, 2006; IPCC,
2007a; Cutter and Finch, 2008; Cutter et al., 2008; ICSU-LAC, 2010a,b;
Cardona, 2011; DEFRA, 2012; IPCC, 2012a; Kienberger, 2012; Birkmann
et al., 2013a; Costa and Kropp, 2013). Today, key reports and most
authors differentiate among hazards, vulnerability, risk, and impacts (see,
e.g., Hutton et al., 2011; IPCC, 2012a; Birkmann et al., 2013a). The recent
literature underscores that risks from climate change are not solely ex-
ternally generated circumstances or changes in the climate system to
which societies respond, but rather the result of complex interactions
among societies or communities, ecosystems, and hazards arising from
climate change (Susman et al., 1983; Comfort et al., 1999; Birkmann et
al., 2011a, 2013a; UNISDR, 2011; IPCC, 2012a). The differentiation of
the various aspects of these interactions is an important improvement
since AR4 because it exhibits the social construction of risk through the
concept of vulnerability (IPCC, 2012a). This new framework, growing
o
ut of SREX, translates information more easily into a risk management
approach that facilitates policy making (de Sherbinin, 2013). The following
section advances this framework in the context of Article 2 of the UNFCCC.
We refer to the characteristics of climate change and its effects on
geophysical systems, such as floods, droughts, deglaciation, sea level
rise, increasing temperature, and frequency of heat waves, as hazards.
In contrast, vulnerability refers primarily to characteristics of human or
social-ecological systems exposed to hazardous climatic (droughts,
floods, etc.) or non-climatic events and trends (increasing temperature,
sea level rise) (UNDRO, 1980; Cardona, 1986, 1990; Liverman, 1990;
Cannon, 1994, 2006; Blaikie et al., 1996; UNISDR, 2004, 2009;
Birkmann, 2006a; Füssel and Klein, 2006; Thywissen, 2006; IPCC, 2012a).
Ecosystems or geographic areas can be classified as vulnerable, which
is of particular concern if human vulnerability increases as a result of
potential impairment of the related ecosystem services. The Millennium
Ecosystem Assessment (MEA), for example, identified ecosystem services
that affect the vulnerability of societies and communities, such as
provision of freshwater resources and air quality (Millennium Ecosystem
Assessment, 2005a,b). Examples in this chapter and other chapters in this
report include the vulnerability of warmwater coral reefs and respective
ecosystem services for coastal communities (see Table 19-4; Box CC-KR).
The new framework used here also underscores that the development
process of a society has significant implications for exposure, vulnerability,
and risk. Climate change is not a risk per se; rather climate changes and
related hazards interact with the evolving vulnerability and exposure
of systems and therewith determine the changing level of risk (see
Figure 19-1; Table 19-4). Identifying key vulnerabilities facilitates
estimating key risks when coupled with information about evolving
hazards associated with climate change. This approach provides the
basis for criteria developed in the following sections.
19.2.2. Criteria for Identifying
Key Vulnerabilities and Key Risks
Vulnerability is dynamic and context specific, determined by human
behavior and societal organization, which influences for example the
susceptibility of people (e.g., by marginalization) and their coping and
adaptive capacities to hazards (see IPCC, 2012a). In this regard coping
mainly refers to capacities that allow a system to protect itself in the
face of adverse consequences, while adaptation—by contrast—denotes
a longer term process that also involves adjustments in the system itself
and refers to learning, experimentation, and change (Yohe and Tol, 2002;
Pelling, 2010; Birkmann et al., 2013a). Perceptions and cognitive
constructs about risks and adaptation options as well as cultural contexts
influence adaptive capacities and thus vulnerability (Grothmann and
Patt, 2005; Rhomberg, 2009; Kuruppu and Liverman, 2011; see Section
19.6.1.4). SREX stressed that the consideration of multiple dimensions
(e.g., social, economic, environmental, institutional, cultural), as well as
different causal factors of vulnerability, can improve strategies to reduce
risks to climate change (see IPCC 2012c, p. 17; Cardona et al., 2012, pp.
17, 67–106).
Key vulnerability and key risk are defined in Box 19-2. Vulnerabilities
that have little influence on overall risk are not considered key. Similarly,

1051
Emergent Risks and Key Vulnerabilities Chapter 19
19
t
he magnitude or other characteristics of climate change-related
hazards, such as glacier melting, sea level rise, or heat waves, are not
by themselves adequate to determine key risks, as the consequences of
climate change also will be determined by the vulnerability of the
exposed society or social-ecological system. Key vulnerabilities and key
risks embody a normative component because different societies might
rank the various vulnerability and risk factors and actual or potential
types of loss and damage differently (see Schneider et al., 2007, p. 785;
Lavell et al., 2012, p. 45). Generally, vulnerability merits particular
attention when the survival of societies, communities, or ecosystems is
threatened (see UNISDR, 2011, 2013; Birkmann et al., 2011a). Climate
change will influence the nature of the climatic hazards people and
ecosystems are exposed to and also contribute to deterioration or
improvement of coping and adaptive capacities of those exposed to
these changes. Consequently, many studies (Wisner et al., 2004; Cardona,
2010; Birkmann et al., 2011a) focus with a priority on the vulnerability
of humans and societies as a central feature, rather than solely on the
level of climatic change and respective hazards.
19.2.2.1. Criteria for Identifying Key Vulnerabilities
We reorganize and further develop criteria for identifying vulnerabilities
as “key” used in AR4 based on the literature (Blaikie et al., 1994; Bohle,
2001; Turner et al., 2003a,b; Birkmann, 2006a, 2011a; Villagrán de León,
2006; Cutter et al., 2008; Cutter and Finch, 2008; ICSU-LAC, 2010a,b;
Cardona, 2011; UNISDR, 2011; IPCC, 2012a; Birkmann et al., 2013a)
and the differentiation of hazard, exposure, and vulnerability presented
here. The criteria in this and succeeding sections were used to identify
key vulnerabilities, key risks, and emergent risks in Sections 19.4 and
19.6.1-2, and in Table 19-4. Not all of the criteria need to be fulfilled to
characterize a vulnerability or risk as key but the characterization of a
phenomenon as a KV or key risk is usually supported by more than one
criterion.
The following five criteria are used to judge whether vulnerabilities are
key:
1) Exposure of a society, community, or social-ecological system to
climatic stressors. While exposure is distinct from vulnerability,
exposure is an important precondition for considering a specific
vulnerability as key. If a system is neither at present nor in the future
exposed to hazardous climatic trends or events, its vulnerability to
such hazards is not relevant in the current context. Exposure can
be assessed based on spatial and temporal dimensions.
2) Importance of the vulnerable system(s). Views on the importance of
different aspects of societies or ecosystems can vary across regions
and cultures (see Kienberger, 2012). However, the identification of
KVs is less subjective when it involves characteristics that are crucial
for the survival of societies or communities or social-ecological
systems exposed to climatic hazards. Defining key vulnerabilities in
the context of particular societal groups or ecosystem services also
takes into account the conditions that make these population
groups or ecosystems highly vulnerable, such as processes of social
marginalization or the degradation of ecosystems (Leichenko and
O’Brien, 2008; O’Brien et al., 2008; IPCC, 2012a).
3) Limited ability of societies, communities, or social-ecological systems
to cope with and to build adaptive capacities to reduce or limit the
a
dverse consequences of climate-related hazard. Coping and adaptive
capacities are part of the formula that determines vulnerability (see
IPCC, 2012a; Birkmann et al., 2013a). While coping describes actions
taken within existing constraints to protect the current system and
institutional settings, adaptation is a continuous process that
encompasses learning and change of the system exposed, including
changes of rule systems or modes of governance (Smithers and Smit,
1997; Pielke Jr., 1998; Frankhauser et al., 1999; Smit et al., 1999;
Kelly and Adger, 2000; Yohe and Tol, 2002; Adger et al., 2005; Smit
and Wandel, 2006; Pelling et al., 2008; Pelling, 2010; Tschakert and
Dietrich; 2010; IPCC, 2012a; Birkmann et al., 2013a; Garschagen,
2013). Severe limits of coping and adaptation provide criteria
for defining a vulnerability as key, as they are core factors that
increase vulnerability to climatic hazards (see, e.g., Warner et al.,
2012).
4) Persistence of vulnerable conditions and degree of irreversibility of
consequences. Vulnerabilities are considered key when they are
persistent and difficult to alter. This is particularly the case when the
susceptibility is high and coping and adaptive capacities are very
low as a result of conditions that are hard to change. Irreversible
degradation of ecosystems (e.g., warmwater coral reefs), chronic
poverty and marginalization, and insecure land tenure arrangements
are drivers of vulnerability that in combination with climatic hazards
determine risks that often persist over decades (see Box CC-KR), for
example, as observed in the Sahel Zone. In this way, communities
or social-ecological systems (e.g., coastal communities dependent
on fishing or mountain communities dependent on specific soil
conditions) may reach a tipping point (or critical threshold) that
would cause a partial or full collapse of the system, including
displacement (see Renaud et al., 2010; Section 19.4.2.1). Inability
to replace such a system or compensate for potential and actual
losses and damages (i.e., irreversibility) is a critical criterion for
determining what is “key.”
5) Presence of conditions that make societies highly susceptible to
cumulative stressors in complex and multiple-interacting systems.
Conditions that make communities or social-ecological systems
highly susceptible to the imposition of additional climatic hazards
or that impinge on their ability to cope and adapt, such as violent
conflicts (e.g., during drought disaster in Somalia (see Menkhaus,
2010)) are considered under this criterion. Also, the critical
dependence of societies on highly interdependent infrastructures
(e.g., energy/power supply, transport, and health care) (see Rinaldi
et al., 2001; Wang, S. et al., 2012; Atzl and Keller, 2013) leads to key
vulnerabilities regarding multiple-interacting systems where capacity
to cope or adapt to their failure is low (see Copeland, 2005; Reed
et al., 2010; Section 19.6.2.1; Table 19-4).
19.2.2.2. Criteria for Identifying Key Risks
Risks are considered “key” due to high hazard or high vulnerability
(“key vulnerability”) of societies and systems exposed, or both. Criteria
for determining key risks build on the criteria for key vulnerabilities, as
vulnerability is a component of risk. As such, risk is strongly determined
by coping and adaptive capacities. However, the criteria for identifying
key risks also take into account the magnitude, frequency, and intensity
of hazardous events and trends linked to climate change to which

1052
Chapter 19 Emergent Risks and Key Vulnerabilities
19
v
ulnerable systems are exposed. Accordingly, the following four
additional criteria are used to judge whether risks are key:
1) Magnitude. Risks are key if associated harmful consequences have
a large magnitude, determined by a variety of metrics including
human mortality and morbidity, economic loss, losses of cultural
importance, and distributional consequences (see Schneider et al.,
2007; IPCC, 2012a). Magnitude and frequency of the hazard as well
as socioeconomic factors that determine vulnerability and exposure
contribute.
2) Probability that significant risks will materialize and their timing.
Risks are considered key when there is a high probability that the
hazard due to climate change will occur under circumstances where
societies or social-ecological systems exposed are highly susceptible
and have very limited capacities to cope or adapt and consequently
potential consequences are severe. Both the timing of the hazard
and the dynamics of vulnerability and exposure contribute. Risks
that materialize in the near term may be evaluated differently than
risks that materialize in the distant future, as the time available for
building up adaptive capacities is different (Oppenheimer, 2005;
Schneider et al., 2007; see also Section 19.6.3.6).
3) Irreversibility and persistence of conditions that determine risks.
Persistence of risks refers to the fact that underlying drivers and
root causes of these risks, either socioeconomic (e.g., chronic
poverty; see Chapter 13) or physical, cannot be rapidly reduced.
The criteria for assessing key vulnerabilities include the persistence
of socioeconomic conditions contributing to vulnerability that also
apply here (Section 19.2.2.1, point 4). In addition, some hazards
are associated with the potential for persistent physical impacts,
such as loss of an ice sheet causing irreversible sea level rise or
release of methane (CH
4
) clathrates from the seabed.
4) Limited ability to reduce the magnitude and frequency or other
characteristics of hazardous climatic events and trends and the
vulnerability of societies and social-ecological systems exposed.
Criterion 3 pertaining to key vulnerabilities (Section 19.2.2.1)
discusses limited ability of societies to improve coping and adaptive
capacities in order to manage risk. This criterion also applies here.
In addition, risks are also considered to be key when societies
together have very limited prospects for reducing the magnitude,
frequency, or intensity of the associated climate hazards. For
example, risks that may be reduced or limited by greenhouse gas
(GHG) reductions that reduce the probability of the associated
hazard are less threatening than those for which the likelihood of
the hazard cannot be effectively altered (see also Section 19.7.1).
For example, risks that are already projected to be large during the
next few decades under a range of Representative Concentration
Pathways (RCPs) are much more difficult to influence by reducing
emissions than those projected to become large late in this century
(e.g., see discussion of risk from extreme heat in Section 19.6.3.3).
19.2.3. Criteria for Identifying Emergent Risks
A risk that arises from the interaction of phenomena in a complex system
is defined here as an emergent risk. For example, feedback processes
between climatic change, human interventions involving mitigation and
adaptation, and processes in natural systems can be classified as emergent
risks if they pose a threat to human security. Emergent risks could arise
f
rom unprecedented situations, such as the increasing urbanization of
low-lying coastal areas that are exposed to sea level rise or where new
pluvial flooding risk emerges due to urbanization of vulnerable areas
not historically populated. Some emergent risks have been identified
or discussed only recently in the scientific literature, and as a result our
ability to assess whether they are key risks is limited. In this chapter,
the only emergent risks discussed are those that have the potential to
become key risks once sufficient understanding accumulates.
19.2.4. Identifying Key and Emergent Risks
under Alternative Development Pathways
Key risks are determined by the interaction of climate-related
hazards with exposure and vulnerabilities of societies or ecosystems.
Development pathways describing possible trends in demographic,
economic, technological, environmental, social, and cultural conditions
(Hallegatte et al., 2011) will affect key risks because they influence both
the likelihood and nature of climate-related hazards, and the societal
and ecological conditions determining exposure and vulnerability.
Therefore some risks could be judged to be key under some development
pathways but not others. Emergent risks can depend on development
pathways as well, because whether or not they become key risks may
be contingent on future socioeconomic conditions.
The effect of development pathways on climate-related hazards occurs
through their effects on emissions and other radiative forcing factors
such as land use change (see WGI AR5 Chapter 12). Components of
development pathways such as economic growth, technical change,
and policy will influence the rates and spatial distributions of emissions
of GHGs and aerosols, and of land use change, and therefore influence
the magnitude, timing, and heterogeneity of hazards (see WGIII AR5
Chapter 5).
Development pathways will also influence the factors determining key
vulnerabilities of human and ecological systems, including exposure,
susceptibility, or sensitivity to impacts, and adaptive capacity (Yohe and
Tol, 2002; Füssel and Klein, 2006; Hallegatte et al., 2011; Birkmann et al.,
2013a; O’Neill et al., 2014). The magnitude of the aggregate exposure
and sensitivity of socio-ecological systems will depend on population
growth and spatial distribution, economic development patterns, and
social systems. The particular elements of the social-ecological system
that are most exposed and sensitive to climate hazards, and that are
considered most important, will depend on spatial development patterns
as well as on cultural preferences, attitudes toward nature/biodiversity,
and reliance on climate-sensitive resources or services, among other
factors (Adger, 2006; Füssel, 2009). The degree to which persistent or
difficult to reverse vulnerabilities are built into social systems, as well
as the degree of inequality in exposure and vulnerability across social
groups or regions, also depend on characteristics of development
pathways (Adger et al., 2009).
19.2.5. Assessing Key Vulnerabilities and Emergent Risks
The criteria above for assessing vulnerability and risk provide a sequence
of potential assessment steps. While the initial assessment phase would

1053
Emergent Risks and Key Vulnerabilities Chapter 19
19
e
xplore whether and how a society or social-ecological system is
exposed to climate-related hazards, the assessment would subsequently
focus on the predisposition of societies or ecosystems to be adversely
affected (vulnerability) and the potential occurrence of severe adverse
consequences for humans and social-ecological systems once the hazard
interacts with the vulnerability of societies and systems exposed. In
addition, the importance of the system at risk and the ability of a society
or system to cope and to adapt to these stressors would be assessed.
Finally, the application of the criteria would also require the assessment
of the irreversibility of the consequences and the persistence of vulnerable
conditions. Hence, the assessment criteria for risks focus on the internal
conditions of a person, a community (e.g., age structure, poverty), or a
social-ecological system and the contextual conditions that influence
their vulnerability (e.g., governance conditions and systems of norms),
in addition to the assessment of hazards, such as storm intensity, heat
waves, and sea level rise, which are directly influenced by climate
change. Examples of such KVs and key risks drawn from other chapters
of this assessment are provided in Section 19.6 and particularly in Table
19-4 and Box CC-KR.
19.3. Emergent Risk: Multiple Interacting
Systems and Stresses
19.3.1. Limitations of Previous Approaches
Imply Key Risks Overlooked
Interactions of climate change impacts on one sector with changes in
exposure and vulnerability, or with adaptation and mitigation actions
affecting the same or a different sector, are generally not included or
well integrated into projections of risk (Warren, 2011). However, their
consideration leads to the identification of a variety of emergent risks
that were not previously assessed or recognized. This chapter identifies
several such complex system interactions that increase vulnerability and
risk synergistically (high confidence; Section 19.3). There are a very large
number of potential interactions, and many important ones have not
yet been quantified, meaning that some key risks have been overlooked
(high confidence). In some cases, literature analyzing these risks is very
recent. The six interaction processes listed below, though not exclusive,
are systemic and may lead to further key vulnerabilities as well as a
larger number of less significant impacts. Several of these are discussed
in more detail in the following sections:
• Biodiversity loss induced by climate change that erodes ecosystem
services, in turn increasing vulnerability and exposure of human
systems dependent on those services (Section 19.3.2.1).
• Alterations in extreme weather events induced by climate change
that affect human systems and ecosystems, increasing vulnerability
and exposure to the effects of mean climate change. Most impacts
projections are based only on changes in mean climate (Rosenzweig
and Hillel, 2008; IPCC, 2012a, Box 3-1).
• The interaction between non-climate stressors such as those related
to land management, water management, air pollution (which has
drivers in common with climate change), and energy production
and climate change (Section 19.3.2.2). Heretofore, mainly climate
interactions with population/economic growth were assessed.
• Climate changes that increase human exposure and vulnerability
to disease (Section 19.3.2.3).
•
Locations where risks in different sectors are compounded because
impacts, hazards, vulnerability, and exposure interact non-additively
(Section 19.3.2.4).
• Mitigation or sectoral adaptation that has unintended consequences
for the functioning of another sector (Section 14.6).
1
9.3.2. Examples of Emergent Risks
19.3.2.1. Emergent Risks Arising from the Effects of Degradation
of Ecosystem Services by Climate Change
Biodiversity loss is linked to disruption of ecosystem structure, function,
and services (Díaz et al., 2006; Gaston and Fuller, 2008; Cardinale et al.,
2012; Maestre et al., 2012; Midgley, 2012). Terrestrial and freshwater
species face increased extinction risks under projected climate change
during and beyond the 21st century, especially as climate change interacts
with other pressures (high confidence; Section 4.3.2.5). A large number
of modelling studies project that species ranges decline in size as mean
climate changes (Section 4.3.2.5); for example, a global scale study of
50,000 species found that the range sizes of 57 ± 6% of widespread
and common plants and 34 ± 7% of widespread and common animals
are projected to decline by more than 50% by the 2080s if global
temperatures increase by 3.5°C relative to preindustrial times, when
allowing for species to disperse at observed rates to areas that become
newly climatically suitable (Warren et al., 2013a). AR4 (Fischlin et al.,
2007, p. 213) estimated that “Approximately 20 to 30% of plant and
animal species assessed so far (in an unbiased sample) are likely to be at
increasingly high risk of extinction as global mean temperatures exceed
a warming of 2 to 3°C above preindustrial levels (medium confidence).”
Evaluation of various lines of evidence including a range of modeling
approaches and, since AR4, new and/or improved techniques (e.g.,
multifactorial driven species distribution models, species specific
population dynamics, tree- and trait-based modeling (for an overview
see Bellard et al., 2012, Table 1; also Murray et al., 2011; Dullinger et
al., 2012; Staudinger et al., 2012; Foden et al., 2013) imply similar levels
of risk as in AR4 with some new estimates indicating higher fractions
of species at risk. However, there is low agreement on the completeness
of these lines of evidence for assigning specific numerical values
forfraction of species at risk (see Sections 4.3.2.5, 19.5.1).
These extinction risks and possible declines in species richness are
associated with change in mean climate, but ecosystems and species
are also expected to be affected by projected climate change-induced
increases in short-term extreme weather events and increased fire
frequency in some locations (see IPCC, 2012a; WGI AR5 Table SPM.1;
WGI AR5 Sections 6.4.8.1, 12.4.3, 12.4.5). Accordingly, despite the
recognition of additional uncertainties in numerical estimates since AR4
(Section 4.3.2.5), the evidence for risk to a substantial fraction of species
associated with increasing global mean temperature (GMT) is robust.
In both terrestrial and marine environments, the potential for the
disruption of ecosystem functionality as a result of climate change
translates into a key risk of large-scale loss of ecosystem services
(Mooney et al., 2009; Midgley, 2012; Table 19-4). At-risk services include
water purification by wetlands, removal and sequestration of carbon
dioxide (CO
2
) by forests, crop pollination by insects, coastal protection

1054
Chapter 19 Emergent Risks and Key Vulnerabilities
19
b
y mangroves and coral reefs, regulation of pests and disease, and
recycling of waste nutrients (Sections 4.3.4, 22.4.5.6, 27.3.2.1; Box 23-1;
Chivian and Bernstein, 2008). Biodiversity loss can lead to an increase
in the transmission of infectious diseases such as Lyme, schistosomiasis,
and hantavirus in humans, and West Nile virus in birds, creating a newly
identified dimension to the emergent risks resulting from biodiversity
loss (Keesing et al., 2010).
There are a number of examples of projected yield losses in the
agricultural sector due to increased prevalence of pest species under
climate change including Fusarium graminearum (a fungal disease of
wheat), the European corn borer, the Colorado beetle, bakanae disease
and leaf blights of rice, and Western corn root worm (Petzoldt and Seaman,
2006; Huang et al., 2010; Kocmánková et al., 2010; Chakraborty and
Newton, 2011; Magan et al., 2011; Aragón and Lobo, 2012); or declines
in pollinators (Rosenzweig and Hillel, 2008; Abrol, 2012; Bedford et al.,
2012; Giannini et al., 2012; Kuhlmann et al., 2012; see also Section 4.3.4).
Climate change impacts on pollinators places these valuable services
at risk, and affects animals that are dependent on the plants (see
Chapter 4). Although the impacts of CO
2
fertilization on plant-pathogen
systems is not well understood (Section 7.3.2.3), these processes operate
simultaneously with climate change’s direct effects on yields through
changing temperature, precipitation, and CO
2
concentrations, creating
an emergent risk. Climate change has caused, or is projected to cause,
range expansion in weeds that have the potential to become invasive
(Bradley et al., 2010; Clements and Ditommaso, 2011). These can damage
agriculture and threaten other species with extinction, with costs to
economies being extremely high (e.g., US$120 billion annually in the
USA; Pimentel et al., 2005; Crowl et al., 2008). Although there are also
examples of projected decreases in insect damage to crops, there is a
tendency for risk of insect damage to plants to increase with climate
change (Section 7.3.2.3). Any one of the above mechanisms could result
in harmful outcomes that act in synergy with existing climate change
impacts on agriculture. Hence, these various susceptibilities to loss of
ecosystem services comprise a KV and, in interaction with climate
change, imply a potential key risk that global scale yields of a number
of crops will be reduced by such interactions.
Severe decline of coral reefs (Section 19.3.2.4) would result in
widespread loss of income for many countries, for example, AU$5.4
billion to the Australian economy from tourism (Box CC-CR). More
generally, for many small island developing states (SIDS), increases in
vulnerability due to loss of such ecosystem services interact with
physical impacts of climate change such as sea level rise to create an
emergent risk (high confidence).
Various studies of ecosystem services, nationally or globally, illustrate
the very large values that are attributed to these services (Table 19-1).
Such costs are represented only very crudely in aggregate global models
of the economic impacts of climate change where “non-market impacts”
are estimated very broadly if at all (Section 19.6.3.5). These costs
contribute to the large magnitude of risks to human systems resulting
from loss of ecosystem services, which in some cases would be irreversible.
Hence the increase in vulnerability due to loss of ecosystem services
interacting with climate change hazards comprises a key risk (high
confidence). In some regions (e.g., South America) payment for ecosystem
services (PES) has been implemented to support landowners to maintain
t
he provision of services over time (Section 27.6.2; Table 27-7). Studies
on degraded ecosystems examine the cost of restoring ecosystem services.
Willingness to pay to restore degraded services along the Platte River (USA)
(Loomis et al., 2000) greatly exceeded estimated costs of restoration. A
meta-analysis of 89 studies looking at the restoration of ecosystem
services measured using 526 different metrics found that restoration
increased the amount of biodiversity and ecosystem services by 44 and
25% respectively, but restored services were still lower than in intact
ecosystems (Benayas et al., 2009). Restoration of damaged ecosystems
may be cost-effective, but only partially compensates for loss of services.
Concomitant stress from land use change adds to the extinction risk from
climate change, increasing the projected extinction rate (e.g., Şekercioğlu
et al., 2012) and contributing to the emergent risk of ecosystem service
loss (see also Chapter 4). A synthesis of empirical studies across the
globe reveals that ecosystem impacts due to land use change correlate
locally with current maximum temperature and recent precipitation
decline, indicating a potential for climate change to exacerbate the
impacts of land use change (Mantyka-Pringle et al., 2012).
Land clearing releases carbon to the atmosphere and removes carbon
sinks (WGI AR5 Section 6.3.2.2) such as old growth forests which would
otherwise accumulate carbon (Luyssaert et al., 2008). Studies that value
ecosystem services have tended to underestimate the importance of
carbon sinks in ecosystems, owing to a tendency to consider only the
carbon currently stored in the systems and not the fluxes (Anderson-
Teixeira and DeLucia, 2011) and overlooking other aspects such as
changes in albedo (e.g., Betts et al., 2012).
19.3.2.2. Emergent Risk Involving Non-Climate Stressors:
The Management of Water, Land, and Energy
Human management of water, land, and energy interacts with climate
change and its impacts, to profoundly affect risks to the amount of
Ecosystem service Region Value Currency Citation
Pollination of crops Globe 153 billion Euro Gallai et al.
(2009)
Pollination of crops and wild
plants
UK 430 million £ UK NEA
(2011)
Woodland cover increase from
6 to 12%
UK 680 million £ UK NEA
(2011)
CO
2
fi xation, O
2
release, nutrient
recycling, soil protection,
water holding capacity, and
environmental purifi cation
Chinese
terrestrial
ecosystems
6.6 trillion Yuan RMB Shi et al.
(2012)
Climate regulation provided
by forests
U S A 1 – 6 b i l l i o n U S $
per year
Krieger
(2001)
Recreation provided by forests USA 1.3 – 110
billion
US$
per year
Krieger
(2001)
Biodiversity supported by
forests
USA 554 billion US$
per year
Krieger
(2001)
Coral reef services Australia 5.4 billion Au$ Section
19.3.2.1;
Box CC-CR
Table 19-1 | Examples of global and national ecosystem service valuation studies. This
table is not intended to be comprehensive. Furthermore, it encompasses studies based
on a wide range of methodologies.

1055
Emergent Risks and Key Vulnerabilities Chapter 19
19
c
arbon that can be stored in terrestrial ecosystems, the amount of
water available for use by humans and ecosystems, and the viability of
adaptation plans for cities or protected areas. Failure to manage land,
water, and energy in a synergistic fashion can exacerbate climate
change impacts globally (Searchinger et al., 2008; Wise et al., 2009;
Lotze-Campen et al., 2010; Warren et al., 2011) producing emergent
risks which are also potential key risks. For example, the use of water
by the energy sector, by thermo-electric power generation, hydropower,
and geothermal energy, or biofuel production, can contribute to water
stress in arid regions (Kelic et al., 2009; Pittock, 2011). Some energy
technologies (biofuels, hydropower, thermal power plants), transportation
fuels and modes, and food products (from irrigated crops, in particular
animal protein produced by feeding irrigated crops) require more water
than others (Box CC-WE; Sections 3.7.2, 7.3.2, 10.2, 10.3.5; McMahon
and Price, 2011; Macknick et al., 2012; Ackerman and Fisher, 2013). In
irrigated agriculture, climate, crop choice, and yields determine water
requirements per unit of produced crop, and in areas where water must
be pumped or treated, energy must be provided (Box CC-WE; Gerten et
al., 2011). Recent studies address the energy, water, and land “nexus”
to explore risks to the agricultural and energy sectors (Box CC-WE;
Tidwell et al., 2011; Skaggs et al., 2012; Smith et al., 2013).
Biofuels can potentially mitigate GHG emissions when used in place of
fossil fuels such as gasoline, diesel, and more carbon-intensive fuels
from tar sands and heavy oil (Cherubini et al., 2009). One simulation of
stringent mitigation (e.g., RCP2.6, which constrains radiative forcing to
2.6 W m
–2
and therefore limits global mean temperature increase to
2°C over preindustrial levels during the 21st century) shows an
increased reliance on biofuels (van Vuuren et al., 2011). However, due
to the potential negative consequences of its use as a mitigation
strategy, bioenergy development leads to several emergent risks, which
are summarized in Table 19-2. Systems that may be vulnerable to
bioenergy development are food systems (high confidence, due to
bioenergy feedstocks replacing food crops; see Table 19-2.iii; Section
19.4.1) and ecosystems (high confidence), where biofuel cropping can
directly or indirectly induce land use change, displacing terrestrial
ecosystems such as forests, which can otherwise also act as carbon
sinks (see Table 19-2.i).
While direct land use change (LUC) from impacts of biofuel development
(from crop substitution and/or biofuel feedstock crop expansion) are a
concern, indirect land use change (iLUC) has received more attention
in the literature—both due to the magnitude of its potential impact
(twice as great as direct LUC; Melillo et al., 2009a) and controversy over
the uncertainty in accurately quantifying it. iLUC connotes land use
change resulting from biofuel impacts on agricultural commodity
markets (Fargione et al., 2008; Searchinger et al., 2008). Reductions of
GHG emissions from biofuel production and use (compared to fossil
fuels) may be offset partly or entirely for decades or centuries from iLUC-
induced CO
2
emissions from deforestation and the draining of peatlands
(medium confidence; Bringezu et al., 2009; van Vuuren et al., 2010; IPCC,
2011, Chapter 2; Miettinen et al., 2012; Smith et al. 2013). In Brazil,
further biofuel expansion would be expected to impinge upon the
Cerrado, the Amazon, and the Atlantic rainforest—all three of which
have high levels of biodiversity (Table 19-2.v) and high levels of
endemism (Lapola et al., 2010). Another study of biofuel production in
Brazil (Barr et al., 2011) found that when pasture is accounted for, direct
e
xpansion into unexploited forest land is minor, that is, most of
additional cropland is predicted to come from conversion of pastureland.
However, unless the density of livestock operations is increased in
tandem, the latter can also lead to iLUC. To the extent that biofuel
feedstock crops are grown on areas that were previously fallow or
degraded, the iLUC effects might be minimized and CO
2
potentially
sequestered (Fargione et al., 2010; IPCC, 2011)—although the amount,
alternative uses, and potential productivity of so-called degraded lands
are still contested (Dauber et al., 2012). (For more information on the
effects of biofuel production on terrestrial ecosystems, see Section 4.4.4;
for more information on the effects of land acquisition for biofuel
production on the poor, see Section 13.3.1.4.)
Whether such land management dynamics confound or contribute to
mitigation depends on important interactions with global emissions
mitigation policies (Table 19-2.ii; Van Vuuren et al., 2011). A failure to
include land use change emissions within a carbon mitigation regime—
for example, by applying a carbon price to fossil fuel and industrial
emissions only—has been projected to lead to large-scale deforestation
of natural forests and conversion of many other natural ecosystems by
the end of the 21st century in 450 ppmv CO
2
-eq and 550 ppmv CO
2
-eq
scenarios (Melillo et al. 2009b; Wise et al., 2009). This dynamic is due
primarily to enhanced bioenergy production without a corresponding
incentive to limit the resulting land use change emissions. If, instead,
an equal carbon price is applied to terrestrial carbon (which, however,
presents monitoring difficulties) along with fossil and industrial carbon,
deforestation could slow down or even reverse.
That said, there are many equally compelling reasons for a country to
encourage biofuel production including a means to produce downward
pressure on oil prices, rural development, and reduced oil imports—all
of which could be prioritized over biofuels as a GHG mitigation strategy
depending on the country (Cherubini et al., 2009). Per-liter GHG
emissions from biofuels decrease as agriculture is further intensified
through row cropping, fertilizer and pesticide use, and irrigation, while
other per-liter environmental impacts such as eutrophication increase
(Burney et al., 2010; Grassini and Cassman, 2012). This creates an
implicit conflict between alternative development priorities. Second-
generation biofuels, such as those based on non-food crops (grasses,
algae, timber) and agricultural residues, are expected to offer reduced
emissions of GHGs and other air pollutants compared to most first-
generation biofuels. This is due primarily to their having a smaller adverse
interaction with food systems resulting in less LUC and iLUC (Plevin,
2009; Cherubini and Ulgiati, 2010; Fargione, 2010; Sander and Murthy,
2010). Further, bioelectricity and biogas both may be more effective at
mitigating GHG emissions than liquid biofuels (Campbell et al., 2009;
Power and Murphy, 2009).
Other emergent risks from bioenergy development are summarized in
Table 19-2. Nearly all of the risks presented here are driven by the
increased need for raw agricultural feedstocks. Competition for
cultivable lands, irrigation resources (Box CC-WE), and other inputs are
not unique to biofuel-related issues. The approximate doubling of
agricultural demand projected between 2005 and 2050 (Tilman et al.,
2011) similarly increases competition for land and water, and would be
expected to exacerbate GHG emissions from agriculture (see also WGI
AR5 Sections 6.4.3.2, 8.3.5).

1056
Chapter 19 Emergent Risks and Key Vulnerabilities
19
Projected changes in the hydrological cycle due to climate change
(WGI AR5 Section 12.4.5) combined with increasing water demand
leads to an emergent, potentially key risk of water stress exacerbated
by the reduction of groundwater which serves as “an historical buffer
against climate variability” (Green et al., 2011), and potentially further
exacerbated by existing governance constraints that can act as barriers
to reduce vulnerability. Climate change and increasing food demand
are expected to drive expansion of irrigated cropland (Wada et al.,
2013), increasing the demand for energy intensive extraction and
conveyance of (ground or desalinated sea) water for irrigation (see Box
CC-WE). If water is provided through groundwater extraction, pumping,
or construction and use of de-salinization plants, local energy demand
(and GHG emissions) will increase, although advanced irrigation systems
are available that minimize enhancement of emissions (Rothausen and
Conway, 2011).
A further potential key risk arises from increased water stress due to
unsustainable groundwater extraction, which is expected to increase
as an adaptation to climate change. Groundwater extraction is generally
increasing globally with particularly large extraction in India and China
(Wang, J. et al., 2012). The effects of climate change on groundwater
are varied with some areas expecting decreased recharge while
others are projected to experience increased recharge (Green et al.,
2011; Portmann et al., 2013). Where extraction rates increase or
recharge decreases, water tables will be depleted with potential key risks
to local ecosystems and human systems (such as agriculture, tourism,
and recreation), while water quality will decrease. One projection shows
insufficient water availability in Africa, Latin America, and the Caribbean
to satisfy both agricultural demands and ideal environmental flow
regulations for rivers by 2050, a situation that is exacerbated by climate
change (Strzepek and Boehlert, 2010).
19.3.2.3. Emergent Risks Involving Health Effects
Climate change will act through numerous direct and indirect pathways
to alter the prevalence and distribution of diseases that are climate and
weather sensitive. These effects will differ substantially depending on
baseline epidemiologic profiles, reflecting the level of development and
access to clean and plentiful water, food, and adequate sanitation and
health care resources. Furthermore, the impact of climate change will
differ within and between regions, depending on the adaptive capacity
of public health and medical services and key infrastructure that ensures
access to clean food and water.
A principal emergent global public health risk is malnutrition secondary
to ecological changes and disruptions in food production as a result
of changing rainfall patterns, increases in extreme temperatures (high
confidence; IPCC, 2012a; see also Section 11.6.1), and increased
atmospheric CO
2
(Taub et al., 2008; Burke and Lobell, 2010; Section
7.3.2.5). Modeling of the magnitude of the effect of climate change on
future under-nutrition in five regions in South Asia and sub-Saharan
Africa in 2050 (using Special Report on Emissions Scenarios (SRES) A2
emissions scenario) suggests an increase in moderate nutritional
stunting, an indicator linked to increased risk of death and poor health
(Black et al., 2008), of 1 to 29%, depending of the region assessed,
compared to a future without climate change, and a much greater
impact on severe stunting for particular regions, such as 23% for central
sub-Saharan Africa and 62% for south Asia (Lloyd et al., 2011). The
impact of climate-induced drought and precipitation changes in Mali
include the southward movement of drought-prone areas which would
result in a loss of critical agriculturally productive land by 2025 and
increase food insecurity (Jankowska et al., 2012).
In densely populated megacities, especially those with a pronounced
urban heat island effect, a principal emergent health risk results
from the synergistic interaction between increased exposure to extreme
heat and degraded air quality with the convergence of increasing
vulnerability of an aging population and a global shift to urbanization
(high confidence; Sections 8.2.3.5, 8.2.4.6, 11.5.3; Box CC-HS). These
trends will increase the risk of relatively higher mortality from exposure
to excessive heat (Knowlton et al., 2007; Kovats and Hajat, 2008; Luber
and McGeehin, 2008). The health risks of such interactions include
increased injuries and fatalities as a result of severe weather events
including heat waves (see Section 19.6.3.3); increased aeroallergen
production in urban areas leading to increases in allergic airway diseases
No. Issue Issue description Nature of emergent risk Reference
i
Direct and / or indirect land use
change
P
otential for enhancement of greenhouse gas
emissions
M
itigation benefi t of biofuels reduced or
negated
M
elillo et al. (2009a,b); Wise et al. (2009);
Khanna et al. (2011)
i
i Policies targeting only fossil
carbon
B
iofuel cropping competes with agricultural
systems and ecosystems for land and water.
M
itigation benefi t of policies reduced; harmful
interactions with other key systems
S
earchinger et al. (2008); Mellilo et al. (2009a,b);
Wise et al. (2009); Fargione et al. (2008)
i
ii Food / fuel competition for land Competition for land driving up food prices Emergent risk of food insecurity due to
mitigation-driven land use change
S
earchinger et al. (2008); Pimentel et al. (2009);
Hertel et al. (2010)
iv Biofuel production affects
w
ater resources.
Competition for water affects biodiversity and
f
ood cropping.
Emergent risk of biodiversity loss and food
i
nsecurity due to mitigation-driven water stress
Fargione (2010); Fingerman et al. (2010); Poudel
e
t al. (2012); Yang et al. (2012)
v Biofuel production affects
b
iodiversity.
Competition for land reduces natural forest and
b
iodiversity.
Emerging risk of biodiversity loss due to
m
itigation-driven land use change
Fizherbert et al. (2008); Koh et al. (2009); Lapola
e
t al. (2010); Fletcher et al. (2011)
vi Land conversion causes air
pollution.
Potential for increased production of
tropospheric ozone from palm / sugarcane-
i
nduced land use change
Emergent risk of greenhouse gas-mitigation-
driven plant and human health damage caused
b
y tropospheric ozone
Cançado et al. (2006); Hewitt et al. (2009)
vii Fertilizer application Potential for increased emissions of N
2
O Offsets some benefi ts of other mitigation
m
easures
Donner and Kucharik (2008); Searchinger et al.
(
2008); Fargione (2010)
viii Invasive properties of biofuel
c
rops
Potential to become an invasive species Unintended consequences that damage
a
griculture and /or biodiversity
Raghu et al. (2006); DiTomaso et al. (2007);
B
arney and Ditomaso (2008)
Table 19-2 | Emergent risks related to biofuel production as a mitigation strategy.

1057
Emergent Risks and Key Vulnerabilities Chapter 19
19
(
see Section 19.5.3); and respiratory and cardiovascular morbidity and
mortality secondary to degraded air quality and ozone formation (see
Section 19.6.3.3). While the association between ambient air quality
and health is well established, there is an increasingly robust body of
evidence linking spikes in respiratory diseases to weather events and to
climate change. In New York City, for example, each single degree (Celsius)
increase in summertime surface temperature has been associated with
a 2.7–3.1% increase in same-day hospitalizations due to respiratory
diseases, and an increase of 1.4–3.6% in hospitalizations due to
cardiovascular diseases (Lin et al., 2009). Respiratory health outcomes
will be exacerbated by climate change through increased production and
exposure to ground-level ozone (particularly in urban areas), wildfire
smoke, and increased production of pollen (D’Amato et al., 2010).
19.3.2.4. Spatial Convergence of Multiple Impacts:
Areas of Compound Risk
In this chapter, we define an area of compound risk as a region where
climate change-induced impacts in one sector affects other sectors in
the same region, or a region where climate change impacts in different
sectors are compounded, resulting in extreme or high-risk consequences.
The frequent and ongoing spatial and temporal coincidence of impacts
in different sectors in the same region has consequences that are more
serious than simple summation of the sectoral impacts indicates
(medium confidence). Such synergistic processes are difficult to identify
through sectoral assessment and are apt to be overlooked in spite of
t
heir potential importance in considering key vulnerabilities and risks.
For example, a large flood in a rural area may damage crop fields
severely, causing food shortages (Stover and Vinck, 2008). The flood
may simultaneously cause a deterioration of hygiene in the region and
the spread of water-borne diseases (Schnitzler et al., 2007; Hashizume
et al., 2008; Kovats and Akhtar, 2008). The coincidence of disease and
malnutrition can thus create an area of compound risk for health
impacts, with the elderly and children most at risk.
As a systematic approach, identification of areas of compound risk could
be achieved by overlaying spatial data of impacts in multiple sectors,
but this cannot indicate synergistic influences and dynamic changes in
these influences quantitatively. For global analysis, certain types of
integrated assessment models that allow spatial analysis of climate
change impacts have been used to identify regions that are affected
disproportionately by climate change (MNP, 2006; Kainuma et al., 2007;
Warren et al., 2008; Füssel, 2010). Recent efforts attempt to collect and
archive spatial data on impact projections and facilitate their public use.
These have created overlays for identifying areas of compound risk with
Web-Geographic Information Systems (GIS) technology (Adaptation
Atlas; Resources for the Future, 2009). There are also efforts to
coordinate impacts assessments adopting identical future climatic
and/or socioeconomic scenarios at various spatial scales (Parry et al.,
2004; Piontek et al., 2014). Areas of compound risk identified by
overlaying spatial data of impacts in multiple sectors can be used as a
starting point for regional case studies on vulnerability and multifaceted
adaptation strategies (Piontek et al., 2014).
Frequently Asked Questions
FAQ 19.2 | How does climate change interact with and amplify preexisting risks?
There are two components of risk: the probability of adverse events occurring and the impact or consequences of
those events. Climate change increases the probability of several types of harmful events that societies and
ecosystems already face, as well as the associated risks. For example, people in many regions have long faced threats
associated with weather-related events such as extreme temperatures and heavy precipitation (which can trigger
flooding). Climate change will increase the likelihood of these two types of extremes as well as others. Climate
change means that impacts already affecting coastal areas, such as erosion and loss of property in damaging storms,
will become more extensive due to sea level rise. In many areas, climate change increases the already high risks to
people living in poverty or to people suffering from food insecurity or inadequate water supplies. Finally, climate
and weather already pose risks for a wide range of economic sectors, including agriculture, fisheries, and forestry:
climate change increases these risks for much of the world.
Climate change can amplify risks in many ways, including through indirect interactions with other risks. These are
often not considered in projections of climate change impacts. For example, hotter weather contributes to increased
amounts of ground level ozone (smog) in polluted areas, exacerbating an existing threat to human health, particularly
for the elderly and the very young and those already in poor health. Also, efforts to mitigate or adapt to climate
change can have negative as well as positive effects. For example, government policies encouraging expansion of
biofuel production from maize have recently contributed to higher food prices for many, increasing food insecurity
for populations already at risk, and threatening the livelihoods of those like the urban poor who are struggling
with the inherent risks of poverty. Increased tapping of water resources for crop irrigation in one region in response
to water shortages related to climate change can increase risks to adjacent areas that share those water resources.
Climate change impacts can also reverberate by damaging critical infrastructure such as power generation,
transportation, or health care systems.
1058
Chapter 19 Emergent Risks and Key Vulnerabilities
19
Canadian North: Risks to travel,
food security, and infrastructure
due to extreme weather events
(SREX Chapter 9, IPCC, 2012a)
Coastal southeast USA and Gulf
of Mexico: Risks of reef loss,
wetland loss, threats to coastal
infrastructure, and tourism from
sea level rise, storm surges, and
flooding (Sections 26.4.3.2,
26.7)
Southern Europe: Risks to human
health, agriculture, energy
production, transport, tourism, labor
productivity, and built environment
affected by increased frequency and
intensity of heat waves
(Section 23.9)
Asian Arctic: Risk of coastal
erosion due to sea level rise,
changes in permafrost, and the
length of the ice-free season
(Section 24.4.3)
Small island states: Risks to
critical economic sectors such as
agriculture, fisheries, and tourism
due to extreme weather events
and sea level rise (SREX Chapter
9, IPCC, 2012a)
Micronesia, Mariana Island,
Papua New Guinea: Risks to
coral reefs due to sea surface
temperature rise and ocean
acidification (Section 19.3.2.4)
Arctic: Risk to human health and
well-being due to climate change
impacts such as injury from changes
in extreme weather and ice/snow
conditions, decreased access to local
foods, compromised freshwater
sources, permafrost and erosion
damage to infrastructure, loss of
traditional livelihood, and
relocation of communities
(Section 28.2.4)
Northern Mexico: Risks to
agriculture and water supplies, due
to projected increases in drought
compounded by salt water intrusion,
in an area with high levels of
poverty (Sections 26.3.2,
26.5.2, 26.5.3, 26.8.3)
São Paulo: Risk of health impacts
from outbreaks of water-borne
diseases due to change in water
quality and availability, rainfall
extremes, urban flash floods,
landslides (Chapter 27,
Box 27-2)
Sub-Saharan Africa: Risks to crop
yields, ecosystems and food security
in an area with the highest levels of
urban poverty in the world (Sections
7.4.1, 19.5.1, 22.3)
Western Turkmenistan and
Uzbekistan: Risk of exacerbated
desertification due to impacts of
droughts on cotton production and
irrigated water demands (Section
24.4.4.3)
Australia: Risks to community
structure of coral reefs due to sea
surface temperature increase and
ocean acidification that are
expected to affect tourism
negatively (Sections 25.6.2,
25.7.5.1, Box CC-CR)
New York area: Risk to sanitation,
energy, transportation,
communication network, coastal
infrastructure, from sea level rise
and coastal storms (Section 8.2,
Table 8-6)
South, East, and Southeast
Asia: Risk of displacement due to
coastal flooding, inundation, and
erosion (Section 5.4.3.1)
Dhaka: Risks to housing, food
security, and human health due to
extreme events like cyclones, pluvial
flooding, and heat stress (Section
8.2)
Near-Equatorial Indo-Pacific:
Risks to coral reefs due to sea
surface temperature rise and
ocean acidification (Section
19.3.2.4)
Australia: Risks to montane
ecosystems from high temperature,
drying trends, and fire risk (Section
25.6.1)
Mumbai: Risks to commerce and
livelihoods from sea level rise,
coastal erosion, pluvial flooding
and storm surge (Sections 8.2, 8.3,
8.4)
Ecosystem Water
Food production
Human health Natural system Livelihood
Figure 19-2 | Some examples of areas of compound risk identified in this assessment. Symbols indicate one or two of the main sectors or systems subject to compound risk, but in each case additional sectors and systems are at risk.

1059
Emergent Risks and Key Vulnerabilities Chapter 19
19
G
eneral equilibrium economic models (see Chapter 10) may facilitate
quantitative evaluation of synergistic influences. An analysis of the EU
by the PESETA project (Projections of economic impacts of climate
change in sectors of Europe based on bottom-up analysis) showed sub-
regional welfare loss by considering impacts on agriculture, coastal
system, river floods, and tourism together in the Computable General
Equilibrium (CGE) model, which is designed to represent interrelationships
among economic activities of sectors. The result indicated the largest
percentage loss in southern Europe (Ciscar et al., 2011).
The following examples illustrate different types of areas of compound
risk where climate change impacts coincide and interact:
1) Cities in deltas, which are subject to sea level rise, storm surge, coastal
erosion, saline intrusion, and flooding. Extreme weather events can
also disrupt access to food supplies, enhancing malnutrition risk
(Ahmed et al., 2009; see also Section 19.3.2.3). Based on national
population projections, if contemporary rates of effective sea level
rise (a net rate, defined by the combination of eustatic sea level
rise and local contributions from fluvial sediment deposition and
subsidence and subsidence due to groundwater and hydrocarbon
extraction) continue through 2050, more than 6 million people would
be at risk of enhanced inundation and increased coastal erosion in
three megadeltas and 8.7 million in 40 deltas, absent measures to
adapt (Ericson et al., 2006). Examples of urbanized delta areas at
risk include, for example, those where Mumbai and Dhaka are
located (see Chapters 8, 24; Section 19.6.3.4; Table 19-4).
2) The Arctic, where indigenous people (Crowley, 2011) are projected
to be exposed to the disruption, and possible destruction of, their
hunting and food sharing culture (see Chapter 28). Risk arises from
a combination of sea ice loss and the concomitant local extinctions
of the animals dependent on the ice (Johannessen and Miles, 2011).
Thawing ground also disrupts land transportation, buildings, and
infrastructure while exposure of coastal settlements to storms also
increases due to loss of sea ice. Arctic ecosystems are broadly at
risk (Kittel et al., 2011).
3) Coral reefs, which are highly threatened due to the synergistic effects
ofsea surface temperature rise and perturbed ocean chemistry,
reducing calcification and also increasing sensitivity to other impacts
such as the loss of coral symbionts (Chapter 6). The importance of
reef sensitivity to climate change was recently highlighted in the
near-equatorial Indo Pacific, the area of greatest reef diversity
worldwide (Lough, 2012).A second highly diverse reef system at
risk for warming was identified around Micronesia, Mariana Island,
and Papua New Guinea (Meissner et al., 2012).
In Figure 19-2, these and other examples of areas of compound risk
identified in this assessment are indicated on a world map. The map
focuses on the key role that exposure plays in determining risk,
particularly compound risk, rather than vulnerabilities per se.
19.4. Emergent Risk: Indirect, Trans-boundary,
and Long-Distance Impacts
Climate change impacts can have consequences beyond the regions in
which they occur. Global trade systems transmit and mediate a variety
of impacts—the most prominent example of this is the global food
t
rade system. The competitive market forces which dominate trade do
not account for considerations of justice, and thus can incidentally
diminish or enhance inequality in the distribution of impacts (see Section
19.6.3.4). Where prices on food, land, and other resources increase,
vulnerability increases, ceteris paribus, for those most in need and least
able to pay (see Section 19.6.1.2 on differential vulnerability). In addition,
both mitigation and other adaptation responses have unintended
consequences beyond the locations in which they are implemented
(Oppenheimer, 2013). All of these mechanisms can create emergent
risks (high confidence).
19.4.1. Crop Production, Prices, and Risk
of Increased Food Insecurity
Recent literature indicates that climate trends have already influenced
the yield trends of important crops (e.g., Kucharik and Serbin, 2008; Tao
et al., 2008; Brisson et al., 2010; Lobell et al., 2011). Chapters 7 and 18
provide a detailed overview of these impacts, and have assessed with
medium confidence that the effects of climate trends on maize and
wheat yield trends have been negative in many regions over the past
several decades, and have been small for major rice and soybean
production areas (see Sections 7.2.1.1, 18.4.1.1.). For projected impacts,
“Without adaptation, local temperature increases in excess of about
1°C above preindustrial is projected to have negative effects on yields
for the major crops (wheat, rice, and maize) in both tropical and
temperate regions, although individual locations may benefit (medium
confidence)” (Section 7.4; Figures 7-4, 7-5, 7-7; Chapter 7 ES). Across
all studies projecting crop yield impacts (some of which include both
CO
2
fertilization and adaptation, and some which account for only one
or neither of these), negative impacts on average yields become likely
from the 2030s (Figure 7-5). Median yield impacts of 0 to –2% per
decade are projected for the rest of the century (compared to yields
without climate change) (Figure 7-7), and after 2050 the risk of more
severe impacts increases (medium confidence) (Chapter 7 ES; Figure
7-5). Among the smaller number of studies that have projected global
yield and price impacts, negative net effects of climate change, CO
2
increases, and agronomic adaptation on global yields are about as likely
as not by 2050 and likely later in the 21st century (Section 7.4.4).
Climate impacts on crop production influence food prices directly and
through complex interactions with a variety of factors, including biofuel
crop production and mandates, as well as other domestic policies such
as crop export bans (Sections 7.1.2, 7.2.2, 7.4.4). If climate changes
reduce crop yields, international food prices and the number of food-
insecure people are expected to increase globally (limited evidence,
high agreement; Section 7.4.4). For example, global rice prices exhibit
sensitivity both to yield impacts from climate changes as well as the loss
of arable land to sea level rise (Chen et al., 2012). While the evidence
base of how climate change will affect future food consumption patterns
is limited (Section 7.3.3.2), there are large numbers of households that
would be especially vulnerable to a loss of food access if food prices
were to increase, for example, agricultural producers in low-income
countries who are net food buyers (Section 7.3.3.2; Table 7-1).
In addition to the direct impacts of climate change, biofuel production
in service of climate change mitigation may also affect food prices.

1060
Chapter 19 Emergent Risks and Key Vulnerabilities
19
A
ccurately tracking and quantifying the direct and indirect impacts of
biofuel production on the food system has become an intense area of
study since AR4. U.S. ethanol production (for which maize is the primary
feedstock) increased around 720% since 2000, with maize commodity
prices nearly tripling and harvested land growing by more than 10%,
mainly at the expense of soy (Wallander et al., 2011; EIA, 2013). Ethanol
recently consumed one-quarter of U.S. maize production, even after
accounting for feed by-products returned to the market (USDA, 2013).
However, isolating biofuels’ exact contribution to food system changes
from other factors such as extreme weather events, climate change,
changing diets, and increasing population have proven difficult (Zilberman
et al., 2011). Still, estimates of the supply and demand elasticity of basic
grain commodities lead to a prediction that the 2009 U.S. Renewable
Fuel standard could increase commodity prices of maize, wheat, rice,
and soybeans by roughly 20%, ceteris paribus, assuming one-third of
the calories used in ethanol production can be recycled as animal feed
(Roberts and Schlenker, 2013). More generally, there is high confidence
that pressure on land use for biofuels will further increase food prices
(see Table 19-2.iii).
In summary, through the global food trade system, climate change
impacts on agriculture can have consequences beyond the regions in
which those impacts are directly felt. Food access can be inhibited by
rising food price levels and volatility (Sections 7.3.3.1-2), as demonstrated
during the recent 2007–2008 price rise episode that resulted from the
combination of poor weather in certain world regions combined with a
demand for biofuel feedstocks, increased demand for grain-fed meat,
and historically low levels of food stocks (Abbot and Borot de Battisti,
2011; Adam and Ajakaiye, 2011; Figure 7-3). These episodes provide an
analog elucidating how reduced crop yields due to impacts of climate
variability and biofuel cropping work synergistically to create a risk of
increased food insecurity: hence this interaction of climate change and
mitigation actions with the food system via markets comprises an
emergent risk of the impacts of climate change acting at a distance,
affecting the food security of vulnerable households (Section 7.3.3.2).
19.4.2. Indirect, Trans-boundary, and Long-Distance
Impacts of Adaptation
Risk can also arise from unintended consequences of adaptation (see
Section 14.6), and this can act across distance, if for example, there is
migration of people or species from one region to another. Adaptation
responses in human systems can include land use change, which can
have both trans-boundary and long-distance effects, and changes in
water management, which often has downstream consequences.
19.4.2.1. Risks Associated with Human Migration and Displacement
Human migration is one of many possible adaptive strategies or
responses to climate change (Reuveny, 2007; Tacoli, 2009; Piguet, 2010;
McLeman, 2011), assessed in detail in Chapter 12 in the context of the
many other causes of migration. Displacement refers to situations where
choices are limited and movement is more or less compelled by land
loss due to sea level rise or extreme drought, for example (see Section
12.4). A number of studies have linked past climate variability to both
l
ocal and long-distance migration (see review by Lilleør and Van den
Broeck, 2011). In addition to yielding positive and negative outcomes
for the migrants, migration indirectly transmits consequences of climate
variability and change at one location to people and states in the
regions receiving migrants, sometimes at long distances. Consequences
for receiving regions, which can be assessed by a variety of metrics,
could be both positive and negative, as may also be the case for sending
regions (Foresight, 2011; McLeman, 2011; see Chapter 12). A rapidly
growing literature examines potential changes in migration patterns
due to future climate changes, but projections of specific positive or
negative outcomes are not available. Furthermore, recent literature
underscores risks previously ignored: risks arising from the lack of
mobility in face of a changing climate, and risks entailed by those
migrating into areas of direct climate-related risk, such as low-lying
coastal deltas (Foresight, 2011; see Section 12.4.1.2).
Climate change-induced sea level rise, in conjunction with storm surges
and flooding, creates a threat of temporary and eventually permanent
displacement from low-lying coastal areas, the latter particularly the
case for small island developing states (SIDS) and other small islands
(Pelling and Uitto 2001; see Chapter 12). The distance and permanence
of the displacement will depend on whether governments develop
strategies such as relocating people from highly vulnerable to less
vulnerable areas nearby, and conserving ecosystem services which
provide storm surge protection in addition to so-called “hardening”
including building sea walls and surge barriers (Perch-Nielsen, 2004;
Box CC-EA). Numbers of people at risk from coastal land loss have been
estimated on a regional basis (Ericson et al., 2006; Nicholls and Tol, 2006;
Nicholls et al., 2011) yet projections of resulting anticipatory migration
or permanent versus temporary displacement are not available.
Taken together, these studies indicate that climate change will bear
significant consequences for migration flows at particular times and
places, creating risks as well as benefits for migrants and for sending
and receiving regions and states (high confidence). Urbanization is a
pervasive aspect of recent migration which brings benefits but, in the
climate change context, also significant risks (see Sections 8.2.2.4,
19.2.3, 19.6.1-2, 19.6.3.3). While the literature projecting climate-driven
migration has grown recently (Section 12.4), there is as of yet insufficient
literature to permit assessment of projected region-specific consequences
of such migration. Nevertheless, the potential for negative outcomes from
migration in such complex, interactive situations is an emergent risk of
climate change, with the potential to become a key risk (Box CC-KR).
19.4.2.2. Risk of Conflict and Insecurity
Violent conflict between individuals or groups arises for a variety of
reasons (Section 12.5). Factors such as poverty and economic shocks
that are associated with a higher risk of violent conflict are themselves
sensitive to climate change and variability (high confidence; Sections
12.5.1, 12.5.3, 13.2). In this section, we focus on evidence for the
magnitude of a climate effect on violent conflict to assess its potential
to become a key risk.
The only meta-analysis of the literature (Hsiang et al., 2013), examining
60 quantitative empirical studies generally published since AR4,

1061
Emergent Risks and Key Vulnerabilities Chapter 19
19
i
mplicates climatic events as a contributing factor to the onset or
intensification of several types of personal violence, group conflict, and
social instability in contexts around the world, at temporal scales ranging
from a climatologically anomalous hour to an anomalous millennium
and at spatial scales ranging from the individual level (Vrij et al., 1994;
Ranson, 2012) to the communal level (Hidalgo et al., 2010; O’Loughlin
et al., 2012) to the national level (Burke et al., 2009; Dell et al., 2012) to
the global level (Hsiang et al., 2011). Nevertheless, some individual studies
have been unable to obtain evidence that violence has a statistically
significant association with climate (Buhaug, 2010; Theisen et al., 2011).
In detection and attribution of their impact on human conflict, there is
low confidence that climate change has an effect (Section 18.4.5) and
medium confidence that climate variability has an effect.
Evidence suggests that climatic events over a large range of time and
spatial scales contribute to the likelihood of violence through multiple
pathways discussed in Section 12.5 (Bernauer et al., 2012; Scheffran et
al., 2012; Hsiang and Burke, 2014). Results from modern contexts
(1950–2010) indicate that the frequency of violence between individuals
rises 2.3% and the frequency of intergroup conflict rises 13.2%for each
standard deviation change toward warmer temperatures (Hsiang et al.,
2013). Becauseannual temperatures around the world are expected to
rise 2 to 4 standard deviations (as measured over 1950–2008) above
temperatures in 2000by 2050 (A1B scenario)(Hsiang et al., 2013), there
is potential ceteris paribus for large relative changes to global patterns
of personal violence, group conflict, and social instability in the future.
Social, economic, technological, and political changes that might
exacerbate or mitigate this potential impact are discussed in Chapter
12. These changes may cause future populations to respond to their
climate differently than modern populations; however, the influence of
climate variability on rates of conflict is sufficiently large in magnitude
that such advances may need to be dramatic to offset the potential
influence of future climate changes.
The effect of climate change on conflict and insecurity has the potential
to become a key risk because factors such as poverty and economic
shocks that are associated with a higher risk of violent conflict are
themselves sensitive to climate change (medium confidence; Sections
12.5.1, 12.5.3, 13.2), and in numerous statistical studies the influence
of climate variability on human conflict is large in magnitude (medium
confidence).
19.4.2.3. Risks Associated with Species Range Shifts
One of the primary ways species adapt to climate change is by moving
to more climatically suitable areas (range shifts). These shifts will affect
ecosystem functioning, potentially posing risks to ecosystem services
(medium confidence; Millennium Ecosystem Assessment, 2005a,b;
Dossena et al., 2012), including those related to climate regulation and
carbon storage (Wardle et al., 2011). One example of a key impact is
the warming-driven expansion and intensification of Mountain pine
beetle (Dendroctonus ponderosae) outbreaks in North American pine
forests and its current and projected impacts on carbon regulation and
economies (Sections 26.4.2.1, 26.8.3). Risks also arise from projected
range shifts of important resource species (e.g., marine fishes; Sections
6
.5.2-3), as well as from potential introductions of diseases to people,
livestock, crops, and native species (see Sections 5.4.3.5, 7.3.2.3, 22.3.5,
23.4.2, 26.6.1.6, 28.2.3). Many newly arrived species prey on, outcompete,
or hybridize with existing biota (e.g., by becoming weeds or pests in
agricultural systems) (Section 4.2.4.6) . The ecological implications of
species reshuffling into novel, no-analog communities largely remain
unknown and pose additional risks that cannot yet be assessed (Root
and Schneider, 2006; Sections 6.5.3, 19.5.1, 21.4.3).
Current legal frameworks and conservation strategies face the challenge
of untangling desirable species range shifts from undesirable invasions
(Webber and Scott, 2012), and identifying circumstances when movement
should be facilitated versus inhibited. New agreements may be needed
recognizing climate change impacts on existing, new, or altered trans-
boundary migration (e.g., under the Convention on the Conservation of
Migratory Species of Wild Animals). As target species and ecosystems
move, protected area networks may become less effective, necessitating
re-evaluation and adaptation, including possible addition of sites,
particularly those important as either “refugia” or migration corridors
(Warren et al., 2013a; Sections 9.4.3.3, 24.4.2.5, 24.5.1). Assisted
colonization—moving individuals or populations from currently occupied
areas to locations with higher probability of future persistence—is
arising as a potential conservation tool for species unable to track changing
climates (Sections 4.4.2.4, 21.4.3). The value of these approaches,
however, is contested and implementation is very limited giving low
confidence that this would be an effective technique (Loss et al., 2011).
Ex situ collections (Section 4.4.2.5) have often been put forward as
fallback resources for conserving threatened species, yet the expense
and the relatively low representation of global species and genetic
diversity (Balmford et al., 2011; Conde et al., 2011) minimize the
effectiveness of this technique.
19.4.3. Indirect, Trans-boundary, and Long-Distance Im-
pacts of Mitigation Measures
Mitigation, too, can have unintended consequences beyond its
boundaries, which may affect natural systems and/or human systems.
If mitigation involves a form of land use change, then regional
implications can ensue in the same way as they can for adaptation
(see Section 14.7).
Mitigation can potentially reduce direct climate change impacts on
biodiversity (Warren et al., 2013a). However, impacts on biodiversity as
a result of land use change induced by biofuel production can offset
benefits associated with biofuels (see Boxes 4-1, 25-10; Sections 4.2.4.1,
4.4.4, 9.3.3.4, 19.3.2.2, 22.6.3, 24.6, 27.2.2.1). Climate change mitigation
through “clean energy” substitution can also have negative impacts on
biodiversity. However, attention to siting and monitoring can decrease
some negative ecological and socioeconomic impacts (medium confidence)
while maximizing positive ones (Section 4.4.4). For example, the U.S.
Government performed an intensive study of suitable sites for solar
power on public lands in the western USA. The end result opened
285,000 acres of public land for large-scale solar deployment while
blocking development on 78 million acres to protect “natural and
cultural” resources (US DOE and BLM, 2012). The construction of large
hydroelectric dams can affect both terrestrial and aquatic ecosystems

1062
Chapter 19 Emergent Risks and Key Vulnerabilities
19
along river systems (World Commission on Dams, 2000; see also
Sections 3.7.2.1, 4.4.4, 24.4.2.3, 24.9.1).
Mitigation strategies will have a range of effects on human systems.
Reforestation that properly mimics existing forest ecosystems in structure
and composition would potentially benefit human systems by stabilizing
micro-climatic variation (Canadell and Raupach, 2008) and allowing
benefits from the sustainable harvest of non-timber forest products for
food, medicine, and other marketable commodities (Guariguata et al.,
2010). However, there is a generally longer time frame and greater
expense involved in recreating a diverse forest system. Afforestation
creates a similar set of costs and benefits (Sections 3.7.2.1, 4.4.3,
17.2.7.1, 22.4.5.6-7; Box CC-WE). Mitigation strategies designed to
reduce dependence on carbon-intensive fuels present a very different
set of circumstances in relation to human systems. The development
of bioresources for energy use may have significant economic and
market effects potentially influencing food prices (see also Section
19.4.1). This would especially affect populations that already devote a
considerable portion of their household income to food (Hymans and
Shapiro, 1976).
19.5. Newly Assessed Risks
Newly assessed risks are those for which the evidence base in the sci-
entific literature has only recently become sufficient to allow for assess-
ment. Furthermore, these risks have at least the potential to become
key based on the criteria in Section 19.2.2. Several of the emergent risks
discussed in Sections 19.3 and 19.4, including those associated with
human migration (Section 19.4.2.1) and mitigation measures (Section
19.4. 3), can be considered newly assessed. Others are related to diverse
aspects of climate change, including the impacts of a large temperature
rise, ocean acidification and other direct consequences of CO2 increases,
and the potential impacts of geoengineering implemented as a climate
change response strategy.
19.5.1. Risks from Large Global Temperature Rise
>4°C above Preindustrial Levels
Most climate change impact studies focus on climate change scenarios
corresponding to global mean temperature rises of up to 3.5°C relative
to 1990 (slightly more than 4°C above preindustrial levels), with only a
few examples of assessments of temperature rise significantly above
that level (Parry et al., 2004; Hare, 2006; Warren et al., 2006; Easterling
et al., 2007; Fischlin et al., 2007). Recently the potential for larger
amounts of warming has received increasing attention and preliminary
assessment of impacts above that level of warming is possible for
agriculture, ecosystems, water, health, and large-scale singular events.
In this section, all temperature changes are global and relative to
preindustrial levels. Relevant climate scenarios include those based on
RCP8.5, which in 2081–2100 is projected to result in a temperature rise
of 4.3°C ± 0.7°C with temperature above 4°C as likely as not (WGI AR5
Section 12.4.1, Table 12.3), and some simulations using SRES A2 and
A1FI, which can reach 5.9°C and 6.9°C warming, respectively, by 2100
(WGI AR4 SPM). Literature that uses these scenarios but assumes low
climate sensitivity and hence less than 4°C of warming is excluded.
Relatively few studies have considered impacts on cropping systems for
scenarios where global mean temperatures increase by 4°C or more
(Section 7.4.1). Among these, one indicates substantial reductions in
yields in sub-Saharan Africa (Thornton et al., 2011) and another indicates
reversal of gains in yields and substantial reductions for Finland (Rötter
et al., 2011). Other studies at or below 4 °C anticipate yield losses,
particularly in tropical regions, even when taking agronomic adaptations
into account (Section 7.5.1.1.1). The possibility of compensation for
Frequently Asked Questions
FAQ 19.3 | How can climate change impacts on one region cause impacts
on other distant areas?
People and societies are interconnected in many ways. Changes in one area can have ripple effects around the
world through globally linked systems such as the economy. Globalized food trade means that changed crop
productivity as a result of extreme weather events or adverse climate trends in one area can shift food prices and
food availability for a given commodity worldwide. Depletion of fish stocks in one region due to ocean temperature
rise can cause impacts on the price of fish everywhere. Severe weather in one area that interferes with transportation
or shipping of raw or finished goods, such as refined oil, can have wider economic impacts.
In addition to triggering impacts via globally linked systems like markets, climate change can alter the movement
of people, other species, and physical materials across the landscape, generating secondary impacts in places far
removed from where these particular direct impacts of climate change occur. For example, climate change can create
stresses in one area that prompt some human populations to migrate to adjacent or distant areas. Migration can
affect many aspects of the regions people leave, as well as many aspects of their destination points, including
income levels, land use, and the availability of natural resources, and the health and security of the affected
populations—these effects can be positive or negative. In addition to these indirect impacts, all regions experience
the direct impacts of climate change.

1063
Emergent Risks and Key Vulnerabilities Chapter 19
19
t
hese losses due to other responses of the food system to impacts on
production, such as land use change and adjustment of trade patterns,
cannot yet be adequately assessed for a world with GMT >4°C (Sections
19.4.1, 19.6.3.4).
Assessments of ecological impacts at and above 4°C warming imply a
high risk of extensive loss of biodiversity with concomitant loss of
ecosystem services (high confidence; Section 4.3.2.5; Table 4-3). AR4
estimated that 20 to 30% of species were likely at increasingly high risk
of extinction as global mean temperatures exceed a warming of 2°C to
3°C above preindustrial levels (medium confidence; Fischlin et al., 2007);
hence 4°C warming implies further increases to extinction risks for an
even larger fraction of species. However, there is low agreement on the
numerical assessment because as more realistic details have been
considered in models, it has been shown that extinction risks may be
either under- or overestimated when using the simpler models (Section
4.3.2.5), among other reasons due to the existence of microrefugias or
to delay in population decline leading to extinction debts (e.g., Dullinger
et al., 2012). Additional risks include biome shifts of 400 km (Gonzalez
et al., 2010), the disappearance of analogs of current climates in regions
of exceptional biodiversity in the Himalayas, Mesoamerica, East and
South Africa, the Philippines, and Indonesia (Beaumont et al., 2011),
and loss of more than half of the climatically determined geographic
ranges of 57 ± 6% of plants and 34 ± 7% of animals studied (Warren
et al., 2013a). Widespread coral reef mortality is expected at 4°C due
to the concomitant effects of warming and a projected decline of
ocean pH of 0.43 since preindustrial times (high confidence; WGI AR5
Figure TS.20; Section 5.4.2.4; Boxes CC-CR, CC-OA). The corresponding
CO
2
concentration in such a scenario is about 900 ppm (WGI AR5
Figure 12.36) whereas the onset of large-scale dissolution of coral
reefs is projected if CO
2
concentrations reach 560 ppm (Sections 5.4.2.4,
26.4.3.2).
A number of studies project increases in water stress, flood, and drought
in a number of regions with >4°C warming, and decreases in others (Li
et al., 2009; Arnell, 2011; Fung et al., 2011; Dankers et al., 2013; Gerten
et al., 2013; Gosling and Arnell, 2013). For example, projections of the
proportion of global population exposed to water stress due to climate
change range from 5 to 50% (Gosling and Arnell, 2013) by 2100. The
proportion of cropland exposed to drought disaster (one or more
months with Palmer Drought Severity Index (PDSI) drought indicator
below –3) is projected to increase from 15% today to 44 ± 6% by 2100,
based on a range of projections including some that reach or exceed 4°C
global warming (Li et al., 2009). Concurrently irrigation water demand
in currently cultivated areas in the North Hemisphere is projected to
rise by 20% in the summer by 2100 under RCP8.5 due to climate change
alone (Wada et al. 2013), although this could be partly buffered by
decreasing evapotranspiration due to plant physiological responses to
increased atmospheric CO
2
(Konzmann et al., 2013; Box CC-VW). One
study (Portmann et al., 2013) projects that, by the 2080s under the
RCP8.5 scenario, 27 to 50% (mean 38%) of the global population would
experience at least a 10% decrease in groundwater resources, mostly
in drier areas with high population density where water stress is more
likely to occur. Concurrently, 20 to 45% of the population is projected
to experience at least a 10% increase in groundwater resources under
RCP8.5 in the 2080s. This is projected to occur mostly in wetter areas
or those with low population density where it is less probable that water
s
tress will be an issue. Another study projects that annual runoff will
fall by up to 75% across the Danube and Mississippi river basins, and
by up to 90% in the Amazon; while runoff is projected to either fall (by
up to 75%) or to rise (by up to 30%) in the Murray Darling, and increase
by up to 150% in the Ganges basin, and up to 80% in the Nile basin
(Fung et al., 2011) with 4°C warming. Both studies are based on an
ensemble of climate model projections. Under RCP8.5 in 2100, nine
global hydrological models driven by five global circulation models
project increases in flood frequency in over half of the land surface, and
decreases in roughly a third of the land surface (Dankers et al., 2013).
According to one study, even if the human population remained
constant in Europe, without adaptation, 3.5°C to 4.8°C global warming
by the 2080s would expose an additional 250,000 to 400,00 people to
river flooding, doubling economic damages since 1961 to 1990, and
expose an additional 850,000 to 5,550,000 to coastal flooding (Ciscar
et al., 2011), compared to 36,000 in 1995.
Under 4°C warming most of the world land area will be experiencing
4°C to 7°C higher temperatures than in the recent past, which means
that important tipping points for health impacts may be exceeded in many
areas of the world during this century, including coping mechanisms for
daily temperature/humidity, seasonally compromising normal human
activities, including growing food or working outdoors (Chapter 11 ES).
Exceedance of human physiological limits is projected in some areas for
a global warming of 7°C, and in most areas for global warming of 11°C
to 12°C (low confidence; Sherwood and Huber, 2010), a temperature
increase that is possible by 2300 (WGI AR5 Figure 12.5).
The risk of large-scale singular events such as ice sheet disintegration,
CH
4
release from clathrates, and regime shifts in ecosystems (including
Amazon dieback), is higher with increased warming (and therefore
higher above 4°C than below it) although there is low confidence in
the temperature changes at which thresholds might exist for these
processes (Section 19.6.3.6; WGI AR5 Sections 12.5.5, 13.4). There are
also more gradual changes that become large with global temperature
rise of 4°C or more, such as decline in theAtlantic Meridional Overturning
Circulation (AMOC) and release of carbon from thawed permafrost
(CTP). The AMOC is considered very likely to weaken for such warming,
with best estimates of loss over the 21st century under RCP8.5 ranging
from 12 to 54% (WGI AR5 Sections 12.4.7.2, 12.5.5.2). The best
estimated range for CTP by 2100 is from 50 to 250 PgC for RCP8.5
(WGI AR5 Section 6.4.3.4) although there are large uncertainties. Larger
decreases in AMOC and increases in CTP are thus implied for a global
warming of above 4°C. Similarly, because a nearly ice-free Arctic Ocean
in September before mid-century is likely under RCP8.5, by which time
projected GMT rise amounts to 2.0 ± 0.4°C above the 1986–2005
baseline (medium confidence; WGI AR5 Section 12.4.6.1), the likelihood
is even higher for global warming of above 4°C. Regions of the boreal
forest could witness widespread forest dieback (low confidence),
putting at risk the boreal carbon sink (Section 4.3.3.1.1; WGI AR5
Section 12.5.5). Forest susceptibility to fire is projected to increase
substantially in many areas for the high emissions scenario (RCP 8.5;
Section 4.3.3.1; Figure 4-6) and hence larger changes are implied for
global warming above 4°C.
Based on the assessment in this section, we conclude that climate
change impacts at 4°C and above would be of greater magnitude and
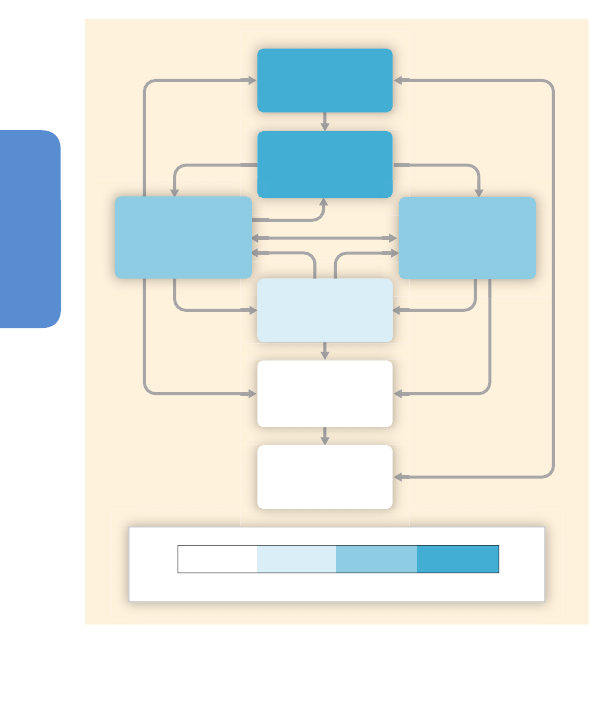
1064
Chapter 19 Emergent Risks and Key Vulnerabilities
19
m
ore widespread than at lower levels of global temperature rise
(medium evidence, high agreement; high confidence), extending to higher
temperature levels previous findings that risks increase with increasing
global average temperature (WGII AR4 SPM.2; National Research
Council, 2011). Few studies yet consider the interactions between these
effects, which could create significant additional risks (Warren et al.,
2011; Sections 19.3-4).
19.5.2. Risks from Ocean Acidification
Ocean acidification is defined as “a reduction in pH of the ocean over
an extended period, typically decades or longer, caused primarily by the
uptake of carbon dioxide (CO
2
) from the atmosphere” (WGI AR5 Section
3.3.2, Box 3.2; Box CC-OA; see also Glossary). Acidification is a physical
and biogeochemical impact resulting from CO
2
emissions that poses risks
to marine ecosystems and the societies that depend on them. Research
on impacts on organisms, ecological responses, and consequences for
ecosystem services is relatively new; the potential for associated risks
to become key is magnified by the fact that acidification is a global
phenomenon and, without a decrease in atmospheric CO
2
concentration,
it is irreversible on century time scales.
It is virtually certain that ocean acidification is occurring now (WGI AR5
Section 3.9) and will continue to increase in magnitude as long as the
atmospheric CO
2
concentration increases (National Research Council,
2010). Risks to society and ecosystems result from a chain of consequences
b
eginning with direct effects on biogeochemical processes and organisms
and extending to indirect effects on ecosystems, ecosystem services,
and society (Figure 19-3). The degree of confidence in assessing risks
decreases along this chain owing to the complexity of interactions
across these scales and the relatively small number of studies available
for quantitative risk assessment.
Most studies have focused on the direct effects of ocean acidification on
marine organisms and biogeochemical processes. The overall effects on
organisms can be assessed with medium confidence (Section 6.3.2; Box
CC-OA), but the effects vary widely across processes (e.g., photosynthesis,
growth, calcification; Section 6.3.2) and across organisms and their life
stages (Section 6.3.2; Box CC-OA).
Far fewer studies have assessed the impacts on ecosystems (Section
6.3.2.5) and ecosystem services (Section 6.4.1), and most of these studies
have focused on the economic impacts on fisheries (Section 6.4.1.1).
For example, changes in overall availability and nutritional value of
desired mollusk species could affect economies (Narita et al., 2012) and
food availability (Section 6.4.1.1). In Table 19-3, we assess the risks to
ecosystem services through the impact of acidification on two key
marine processes, calcification in warmwater corals and nitrogen fixation,
using the criteria for key risks (Section 19.2.2.2).
Based on Table 19-3, the response of coral calcification to ocean
acidification and the resulting consequences for coral reefs constitute
a key risk to important ecosystem services (high confidence). The effect
of ocean acidification on marine N
2
-fixation could potentially become
a key risk, given that it could have potentially large consequences for
marine ecosystems, but currently there is limited evidence on the
likelihood of this risk materializing.
19.5.3. Risks from Carbon Dioxide Health Effects
There is increasing evidence that the impacts of elevated atmospheric
CO
2
on plant species will affect health via two distinct pathways: the
increased production and allergenicity of pollen and allergenic compounds,
and the nutritional quality of key food crops. The evidence for these
impacts on plant species is increasingly robust and recent evidence in
the public health literature points to a medium to high confidence in the
potential for these risks to be sufficiently widespread in geographical
scope and large in magnitude of their impact on human health to be
considered key risks.
Climate change is expected to alter the spatial and temporal distribution
of several key allergen-producing plant species (Shea et al., 2008), and
increased atmospheric CO
2
concentration, independent of climate effects,
has been shown to stimulate pollen production (Rasmussen, 2002; Clot,
2003; Galán et al., 2005; Garcia-Mozo et al., 2006; Ladeau and Clark,
2006; Damialis et al., 2007; Frei and Gassner, 2008). A series of studies
(Ziska and Caulfield, 2000; Ziska et al., 2003; Ziska and Beggs, 2012)
found an association of elevated CO
2
concentrations and temperature
with faster growing and earlier flowering ragweed species (Ambrosia
artemisiifolia) along with greater production of ragweed pollen (Wayne
et al., 2002; Singer et al., 2005; Rogers et al., 2006), leading, in some
areas, to a measurable increase in hospital visits for allergic rhinitis
Low
Medium
Very highHigh
Confidence in quantifying responses
Biogeochemical
processes
(WGI 3.8.2, Box 3.2;
WGII 6.3.2,
Figure 6-4, Box CC-OA)
Ecosystems
(WGII 6.3.2.5, Figure 6-12,
Box CC-OA)
Ocean
acidification
(WGI 3.8.2, Box 3.2;
Box CC-OA)
Organisms
(WGII 6.3.2, Figure 6-10,
Box CC-OA)
Ecosystem
services
(WGII 6.4.1, 6.6.1,
Box CC-OA)
Increases in
atmospheric CO
2
(WGI 6.3, 6.4)
Society
(WGII 6.4.1, Box CC-OA)
Figure 19-3 | The pathways by which ocean acidification affects marine processes,
organisms, ecosystems, and society. The confidence in quantifying the impacts
decreases along the pathway.

1065
Emergent Risks and Key Vulnerabilities Chapter 19
19
(Breton et al., 2006). Experimental studies have shown that poison
ivy, another common allergenic species, responds to atmospheric CO
2
enrichment through increased photosynthesis, water use efficiency,
growth, and biomass. This stimulation, exceeding that of most other
woody species, also produces a more potent form of the primary allergenic
compound, urushiol (Mohan et al., 2006).
While climate change and variability are expected to affect crop
production (see Chapter 7), emerging evidence suggests an additional
stressor on the food system: the impact of elevated levels of CO
2
on
the nutritional quality of important foods. A prominent example of the
effect of elevated atmospheric CO
2
is the decrease in the nitrogen
concentration in vegetative plant parts as well as in seeds and grains
and, related to this, the decrease in the protein concentrations (Cotrufo
et al., 1998; Taub et al., 2008; Wieser et al., 2008). Experimental studies
of increasing CO
2
to 550 ppm demonstrated effects on crude protein,
starch, total and soluble beta-amylase, and single kernel hardiness,
leading to a reduction in crude protein by 4 to 13% in wheat and 11 to
13% in barley (Erbs et al., 2010). Other CO
2
enrichment studies have
shown changes in the composition of other macro- and micronutrients
(calcium, potassium, magnesium, iron, and zinc) and in concentrations
of other nutritionally important components such as vitamins and sugars
(Idso and Idso, 2001). Declining nutritional quality of important global
crops is a potential risk that would broadly affect rates of protein-energy
and micronutrient malnutrition in vulnerable populations. While there
is medium confidence that this risk has the potential to become key
when judged by its magnitude and other criteria (Sections 19.2.2.1-2)
there is currently insufficient information to assess under what ambient
CO
2
concentrations this would occur.
19.5.4. Risks from Geoengineering
(Solar Radiation Management)
Geoengineering refers to a set of proposed methods and technologies that
aim to alter the climate system at a large scale to alleviate the impacts of
climate change (see Glossary; IPCC, 2012b; WGI AR5 Sections 6.5, 7.7;
WGIII AR5 Chapter 6). The main intended benefit of geoengineering would
be the reduction of climate change that would otherwise occur, and
the associated reduction in impacts (Shepherd et al., 2009). Here we
focus on risks, consistent with the goal of this chapter. Although
geoengineering is not a new idea (e.g., Rusin and Flit, 1960; Budyko
and Miller, 1974; Enarson and Morrow, 1998; and a long history of
geoengineering proposals as detailed by Fleming, 2010), it has received
increasing attention in the recent scientific literature.
Geoengineering has come to refer to both carbon dioxide removal (CDR;
discussed in detail in WGI AR5 Section 6.5, FAQ 7.3) and Solar Radiation
Management (SRM; Izrael et al., 2009; Lenton and Vaughan, 2009;
Shepherd et al., 2009; discussed in detail in WGI AR5 Section 7.7, FAQ
7.3). These distinct approaches to climate control raise very different
scientific (e.g., Shepherd et al., 2009), ethical (Morrow et al., 2009;
Preston, 2013), and governance (Lloyd and Oppenheimer, 2014) issues.
Many approaches to CDR are considered to more closely resemble
mitigation rather than other geoengineering methods (IPCC, 2012b).
In addition, CDR is thought to produce fewer risks than SRM if the
CO
2
can be stored safely (Shepherd et al., 2009) and unintended
consequences for land use, the food system, and biodiversity can be
avoided (Section 19.4.3). For these reasons, in addition to the more
substantial recent literature on SRM’s potential impacts, we address only
SRM in this section. SRM is a potential key risk because it is associated
with impacts to society and ecosystems that could be large in magnitude
and widespread. Current knowledge on SRM is limited and our confidence
in the conclusions in this section is low.
Studies of impacts on society and ecosystems have been based on two
of the various SRM schemes that have been suggested: stratospheric
aerosols and marine cloud brightening. These approaches in theory could
produce large-scale cooling (Salter et al., 2008; Lenton and Vaughan,
2009), although it is not clear that it is even possible to produce a
stratospheric sulfate aerosol layer sufficiently optically thick to be
effective (Heckendorn et al., 2009; English et al., 2012). Observations
of volcanic eruptions, frequently used as an analog for SRM (Robock et
al., 2013), indicate that while stratospheric aerosols can reduce the
global average surface air temperature, they can also produce regional
drought (e.g., Oman et al., 2005, 2006; Trenberth and Dai, 2007), cause
ozone depletion (Solomon, 1999), and reduce electricity generation from
solar generators that use focused direct sunlight (Murphy, 2009).
Climate modeling studies show that the risk of ozone depletion depends
in detail on how much and when stratospheric aerosols would be
Criterion for key risk Coral calcifi cation Nitrogen fi xation
1
. Magnitude of consequences for
ecosystem services
E
cosystem services include supporting habitats, provisioning of fi sh,
regulating shoreline erosion, and tourism. Potential magnitude of
c
onsequences is medium to high (Box CC-CR).
E
cosystem services include nitrogen cycling, which supports ecosystem
structure and food chains (Hutchins et al., 2009). Potential magnitude of
c
onsequences has not been investigated.
2. Likelihood that risks will materialize
a
nd their timing
A reduction in coral calcifi cation rate and an increase in reef dissolution
r
ates are very likely (Section 6.1.2), so that reefs will progressively shift
t
oward net dissolution ( medium confi dence; Section 5.4.2.4; Boxes CC-CR
a
nd CC-OA).
Both increases and decreases in nitrogen fi xation have been observed in
v
arious N
2
-
fi xing organisms (Section 6.3.2.2) but there is limited in situ
e
vidence and medium agreement on how N
2
-
fi xation rates will change
i
n response to ocean acidifi cation.
3. Irreversibility and persistence of
o
cean acidifi cation impacts
Decreases in ocean pH will persist as long as atmospheric CO
2
levels
r
emain elevated (WGI AR5 Section 3.8.2). Reductions in coral calcifi cation
will persist unless corals can physiologically adapt to maintain
calcifi cation rates. Reversibility of impacts on ecosystem services of coral
r
eefs is unknown and depends on ecological factors such as hysteresis.
Decreases in ocean pH will persist as long as atmospheric CO
2
levels
r
emain elevated (WGI AR5 Section 3.8.2). Reversibility and persistence
of impacts on nitrogen fi xation are unknown.
4. Limited ability to reduce the
m
agnitude and frequency or nature of
ocean acidifi cation impacts
Reduction of ocean acidifi cation will require global reductions in
a
tmospheric CO
2
.
Feasibility of mitigating ocean acidifi cation at the local
scale is unknown.
Reduction of ocean acidifi cation will require global reductions in
a
tmospheric CO
2
.
Table 19-3 | An assessment of the risks to ecosystem services posed by the impacts of ocean acidifi cation on warm-water coral calcifi cation and nitrogen fi xation, based on the
four criteria for key risks (Section 19.2.2.2).

1066
Chapter 19 Emergent Risks and Key Vulnerabilities
19
r
eleased in the stratosphere (Tilmes et al., 2008) and find that global
stratospheric SRM would produce uneven surface temperature responses
and reduced precipitation (Schmidt et al., 2012; Kravitz et al., 2013),
weaken the global hydrological cycle (Bala et al., 2008), and reduce
summer monsoon rainfall relative to current climate in Asia and Africa
(Robock et al., 2008). Hemispheric geoengineering would have even
larger effects (Haywood et al., 2013).
The net effect on crop productivity would depend on the specific
scenario and region (Pongratz et al., 2012). Use of SRM also poses a
risk of rapid climate change if it fails or is halted suddenly (WGI AR5
Section 7.7; Jones et al., 2013), which would have large negative
impacts on ecosystems (high confidence; Russell et al., 2012) and could
offset the benefits of SRM (Goes et al., 2011). There is also a risk of
“moral hazard”; if society thinks geoengineering will solve the global
warming problem, there may be less attention given to mitigation (e.g.,
Lin, 2013). In addition, without global agreements on how and how
much geoengineering to use, SRM presents a risk for international
conflict (Brzoska et al., 2012). Because the direct costs of stratospheric
SRM have been estimated to be in the tens of billions of U.S. dollars per
year (Robock et al., 2009; McClellan et al., 2012), it could be undertaken
by non-state actors or by small states acting on their own (Lloyd and
Oppenheimer, 2014), potentially contributing to global or regional
conflict (Robock, 2008a,b). Based on magnitude of consequences and
exposure of societies with limited ability to cope, geoengineering poses
a potential key risk.
19.6. Key Vulnerabilities, Key Risks,
and Reasons for Concern
In this section, we present key vulnerabilities, key risks, and emergent
risks that have been identified by many of the chapters of this report
based on the material assessed by each in light of criteria discussed in
Sections 19.2.2 and 19.2.3. We then discuss dynamic characteristics
of exposure, vulnerability, and risk, features that are influenced by
development pathways in the past, present, and future. Illustrative
examples of climate-related hazards, key vulnerabilities, key risks, and
emergent risks in Table 19-4 are representative, having been selected
from a larger number provided by the chapters of this report. The table
demonstrates how these four categories are related, as well as how
they differ, and how they interact with non-climate stressors. The table
also provides information on how key risks actually develop due to
changing climatic hazards and vulnerabilities. This knowledge is an
important prerequisite for effective adaptation and risk reduction
strategies that must address climate-related hazards, non-climatic
stressors, and various vulnerabilities that often interact in complex ways
and change over time.
19.6.1. Key Vulnerabilities
Several of the risks discussed in this and other chapters and noted in
Table 19-4 arise because vulnerable people must cope and adapt not
only to changing climate conditions, but also to multiple, interacting
stressors simultaneously (see Sections 19.3-4), which means that effective
adaptation strategies would address these complexities and relationships.
19.6.1.1. Dynamics of Exposure and Vulnerability
This subsection deals with the meaning and the importance of dynamics
of exposure and vulnerability, while Section 19.6.1.3 assesses recent
literature regarding observed trends of vulnerability mostly at a global or
regional scale. The literature provides increasing evidence that structures
and processes that determine vulnerability are dynamic and spatially
variable (IPCC, 2012a; Section 19.6.1.3). SREX states with high confidence
that vulnerability and exposure of communities or social-ecological
systems to climatic hazards related to extreme events are dynamic, thus
varying across temporal and spatial scales due to influences of and
changes in social, economic, demographic, cultural, environmental, and
governance factors (IPCC, 2012c, SPM.B).
Examples of such dynamics in exposure and vulnerability encompass,
for example, population dynamics, such as population growth or
changes in poverty (Table 19-4; Birkmann et al., 2013b) and increasing
exposure of people and settlements in low-lying coastal areas or flood
plains in Asia (see Nicholls and Small, 2002; Fuchs et al., 2011; IPCC,
2012a; Peduzzi et al., 2012). Also, demographic changes, such as aging
of societies, have a significant influence on people’s vulnerability to
heat stress (see Stafoggia et al., 2006; Gosling et al., 2009). Changes in
poverty or socioeconomic status, ethnic compositions, as well as age
structures had a significant influence on the outcome of past crises and
in addition were modified and reinforced through disasters triggered
by climate- and weather-related hazards. For the USA, for example,
Cutter and Finch (2008) found that social vulnerability to natural hazards
increased over time in some areas owing to changes in socioeconomic
status, ethnic composition, age, and density of population. Changes in
the strength of social networks (e.g., resulting in social isolation of
elderly) and physical abilities to cope with such extreme events modify
vulnerability (see, e.g., Khunwishit and Arlikatti, 2012).
In some cases human vulnerability might also change in different
phases of crises and disasters. Hence, the factors that might determine
vulnerability before a crisis or disaster (drought crises, flood disaster)
might differ from those that determine vulnerability thereafter (post-
disaster and recovery phases). Disaster response and reconstruction
processes and policies can modify exposure and vulnerability, for
example, of coastal communities (Birkmann and Fernando, 2008;
Birkmann, 2011). A comprehensive assessment of vulnerability would
account for these dynamics by evaluating long-distance impacts (e.g.,
resulting from migration or global influence of regional crop production
failures following floods) and multiple stressors (e.g., recovery policies
after disasters) that often influence dynamics and generate complex
crises and even emergent risks. Furthermore, SREX also underscores
that the increased intensity, frequency, and duration of some extreme
events as climate continues to change might make adaptation based
only on recent experience or the extrapolation of historical trends
largely ineffective (Lavell et al., 2012, pp. 44–47); hence understanding
the dynamics of vulnerability and its different facets is crucial.
19.6.1.2. Differential Vulnerability and Exposure
Wealth, education, ethnicity, religion, gender, age, class/caste, disability,
and health status exemplify and contribute to the differential exposure

1067
Emergent Risks and Key Vulnerabilities Chapter 19
19
a
nd vulnerability of individuals or societies to climate and non-climate-
related hazards (see IPCC, 2012a). Differential vulnerability is, for
example, revealed by the fact that people and communities that are
similarly exposed encounter different levels of harm, damage, and loss
as well as success of recovery (see Birkmann, 2013). The uneven effects
and uneven suffering of different population groups and particularly
marginalized groups is well documented in various studies (Bohle et al.,
1994; Kasperson and Kasperson, 2001; Birkmann, 2006a; Thomalla et
al., 2006; Sietz et al., 2011, 2012). Factors that determine and influence
these differential vulnerabilities to climate-related hazards include, for
example, ethnicity (Fothergill et al., 1999; Elliott and Pais, 2006; Cutter
and Finch, 2008), socioeconomic class, gender, and age (O’Keefe et al.,
1976; Sen, 1981; Peacock, 1997; Jabry, 2003; Wisner, 2006; Bartlett,
2008; Ray-Bennett, 2009), as well as migration experience (Cutter and
Finch, 2008) and homelessness (Wisner, 1998; IPCC, 2012a). Differential
vulnerabilities of specific populations can often be discerned at a particular
scale using quantitative or qualitative assessment methodologies
(Cardona, 2006, 2008; Birkmann et al., 2013b). Various population
groups are differentially exposed to and affected by hazards linked to
climate change in terms of both gradual changes in mean properties
and extreme events. For example, in urban areas, marginalized groups
(particularly as a result of gender or wealth status or ethnicity) often
settle along rivers or canals, where they are highly exposed to flood
hazards or potential sea level rise (see Table 19-4; e.g., Neal and Phillips,
1990; Enarson and Morrow, 1998; Neumayer and Plümper, 2007; Sietz
et al., 2012). Studies emphasize that vulnerability in terms of gender is
not determined through biology, but in most cases by social structures,
institutions, and rule systems; hence women and girls are often (not
always) more vulnerable because they are marginalized from decision
making or experience discrimination in development and reconstruction
efforts (Fordham, 1998; Houghton, 2009; Sultana, 2010; IPCC, 2012a).
19.6.1.3. Trends in Exposure and Vulnerability
Vulnerability and exposure of societies and social-ecological systems to
hazards linked to climate change are dynamic and depend on economic,
social, demographic, cultural, institutional, and governance factors (see
IPCC, 2012c, p. 7). The literature shows that there is a high confidence
that rapid and unsustainable urban development, international financial
pressures, increases in socioeconomic inequalities, failures in governance
(e.g., corruption), and environmental degradation are key trends that
modify vulnerability of societies, communities, and social-ecological
systems (Maskrey, 1993a,b, 1994, 1998; Mansilla, 1996; Cannon, 2006;
Birkmann, 2013; de Sherbinin, 2014) at different scales. Consequently,
many of the factors that reveal and determine differential vulnerability
change over time in terms of their spatial distribution. These dynamics
unfold in different places differently and therefore local or regional
specific strategies are needed that strengthen resilience (Garschagen
and Kraas, 2011; Holdschlag and Ratter, 2013) and reduce exposure and
vulnerability. For example, countries characterized by rapid urbanization
coupled with low economic performance and high social development
barriers face among the highest levels of climate change vulnerability.
However, urbanization in some areas can yield conditions conducive to
building up coping and adaptation capacities particularly when
urban socioeconomic development and risk management is properly
implemented (see Garschagen and Romero-Lankao, 2013). The following
s
ubsections outline observed trends in vulnerability according to
different thematic dimensions (e.g., socioeconomic, environmental,
institutional), within the constraint that relevant socioeconomic data
are limited.
19.6.1.3.1. Trends in socioeconomic vulnerability
Multi-dimensional poverty is an important factor determining vulnerability
of societies to climate change and extreme events (Section 13.1.4). For
example, risk due to droughts, particularly in sub-Saharan Africa, is
intimately linked to poverty and rural vulnerability (high confidence; see
World Bank, 2010; Birkmann et al., 2011b; UNISDR, 2011, p. 62; Welle
et al., 2012). In interpreting the following estimates, it should be borne
in mind that diverse concepts of poverty lead to different estimates but
that for some regions, e.g., sub-Saharan Africa, the trends are robust.
Recent evaluation of conditions in 119 countries found that at the
international level there had been a clear decrease in global poverty
over the previous 6 years (Chandy and Gertz, 2011). The number of poor
people globally fell, from more than 1.3 billion in 2005 to fewer than
900 million in 2010. This trend is expected to continue (e.g., Hughes et
al., 2009; Chandy and Gertz 2011). However, regional trends vary, as
do differences between emerging and least developed economies. As a
result, there is a growing climate-related risk in some regions associated
with chronic poverty. For example, in 2010, approximately 48.5% of the
population of the highly drought exposed region sub-Saharan Africa
still lives in poverty (poverty headcount ration at $1.25 per day; see
World Bank, 2012) and this area already has been defined as a global
risk hotspot (see Birkmann et al., 2011b; Welle et al., 2012). However,
various national-level poverty statistics provide little information about
the actual distribution of poverty, for example, between rural vs. urban
areas. Income distribution trends show significant increases in inequality
in some countries in Africa, and particularly in Asia, such as in China,
India, Indonesia, and Bangladesh (World Bank, 2012). In Asia and
Southeast Asia this trend overlaps with areas of compound climate risk
(Section 19.3.2.4) in terms of people currently exposed to floods and
tropical cyclones as well as sea level rise (Förster et al., 2011; IPCC,
2012a; Peduzzi et al., 2012). Assessing vulnerability (and risk) in these
countries requires in-depth analysis of trends and distribution patterns
of poverty, income disparities, and exposure of people to changing
climatic hazards.
New socioeconomic vulnerabilities are emerging in some countries, for
example, in developed countries, where the impoverishment of some
population groups is observed. For example, research underscores that
old age increases the risk of poverty in Greece, as the majority of people
working as farmers or in the private sector receive small pensions that
are below the poverty line (Karamessini, 2010, p. 279). These factors might
interact with limited physical means of elderly to cope with climatic
hazards, such as heat waves, and hence increase vulnerability.
Health status of individuals and population groups affects vulnerability
to climate change by limiting capacities to cope and adapt to climate
hazards (see Chapter 11). Although at a global scale the percentage of
people undernourished is decreasing (FAO, 2012) and this trend is
expected to continue (Hughes et al., 2009), the regional and national
differences are significant: during 2010–2012, 870 million people

1068
Chapter 19 Emergent Risks and Key Vulnerabilities
19
r
emained chronically undernourished (FAO, 2012). Particularly in certain
regions highly exposed to current and projected climate-related hazards,
the number of people undernourished has increased. In sub-Saharan
Africa, where exposure to drought is episodically high, the number of
undernourished increased by 64 million or about 38% during 2010–
2012 compared to 1990–1992 (Hughes et al., 2009; FAO, 2012, p. 10).
Moreover, at many locations, climate change is expected to reduce the
access to and the quality of natural resources that are important to
sustain rural and urban livelihoods as well as the capacities of states
to provide help to sustain livelihoods (Barnett and Adger, 2007; see also
Section 19.3.2.1). These multi-risk contexts require new approaches for
climate change adaptation.
While these trends mainly point to particularly large exposure and
vulnerability in developing countries, studies regarding extreme heat
vulnerability, for example, underscore that developed countries face
increasing challenges to adaptation as well. Heat waves are projected
to increase in duration, intensity, and extent (WGI AR5 Section 11.3.2).
Advanced age represents one of the most significant risk factors for
heat-related death (Bouchama and Knochel, 2002) because, in addition
to limited thermoregulatory and physiologic heat-adaptation capacities,
elderly have often reduced social contacts, and a higher prevalence of
chronic illness and poor health (Section 11.3.3; Khosla and Guntupalli,
1999; Klinenberg, 2002; O’Neill, 2003). The trend toward an aging
society, for example in Japan or Germany, therefore increases the
vulnerability of these societies to extreme heat stress.
19.6.1.3.2. Trends in environmental vulnerability
Societies depend on ecosystem services for their survival; however, these
ecosystem services and functions (see, e.g., Millenium Ecosystem
Assessment, 2005a,b) are vulnerable to climate change (see Cardona
et al., 2012, pp. 76–77; Table 19-4; Section 19.3.2.1). Various societies
and communities that rely heavily on the quality of ecosystem services,
such as rural populations dependent on rainfed agriculture where drying
is projected (see also Table 19-4), will experience increased risk from
climate change owing to its negative influence on ecosystem services
(high confidence; see Sections 4.3.4, 6.4.1).
Although no global overview is available, recent reports (UNDP, 2007;
IPCC, 2012a) underscore that a number of current environmental trends
threaten human well-being and thus increase human vulnerability
(UNEP, 2007). Many communities that have suffered large losses due
to extreme weather events—for example, coastal flooding—also
experienced earlier degradation of ecosystems providing protective
services. Recent global studies and local studies, such as for the U.S.
East Coast, underscore that intact ecosystems, such as marshes, can
have an important protective role against coastal hazards for example,
by wave attenuation (Shepard et al., 2011; Beck et al., 2013). Hence,
coastal degradation, such as destruction of coral reefs in Asia, is
increasing the exposure of communities to such hazards (Welle et al.,
2012). Moreover, the extinctions of species and the loss of biodiversity
pose a threat of diminution of genetic pools that otherwise buffer the
adaptive capacities of social-ecological systems dependent on these
services in the medium and long run (e.g., in terms of medicine and
agricultural production).
19.6.1.3.3. Trends in institutional vulnerability
Institutional vulnerability refers, among other issues, to the role of
governance. Governance is increasingly recognized as a key factor
that influences vulnerability and adaptive capacity of societies and
communities exposed to extreme events and gradual climate change
(Kahn, 2005; Nordås and Gleditsch, 2007; Welle et al., 2012). People in
countries or places that are facing severe failure of governance, such as
violent conflicts (e.g., Somalia, Afghanistan) are particularly vulnerable
to extreme events and climate change, as they are already exposed to
complex emergency situations and hence have limited capacities to
cope or undertake effective risk management (see Ahrens and Rudolph,
2006; Menkhaus, 2010). Countries classified as failed states are often
not able to guarantee their citizens basic standards of human security
and consequently do not provide adequate or any support in crises or
disaster situations for vulnerable people. The Failed State Index (Foreign
Policy Group, 2012; Fund for Peace, 2012) as well as the Corruption
Perception Index (Transparency International, 2012) are used to
characterize institutional vulnerability and governance failure. Trends
in the Failed State Index from 2006 to 2011 show that countries with
severe problems in the functioning of the state cannot easily shift or
change their situation (persistence of institutional vulnerability). Studies
at the global level also confirm that countries classified as failed states
and affected, for example, by violence are not able to effectively reduce
poverty compared to countries without violence (see World Bank, 2011).
Countries characterized in the literature as substantially failing in
governance or in some particular aspects of governance during some
period, such as Somalia and Ethiopia, Afghanistan, or Haiti have shown
in the past severe difficulties in dealing with extreme events or supporting
people that have to cope and adapt to severe droughts, storms, or floods
(see, e.g., Lautze et al., 2004; Ahrens and Rudolph, 2006; Menkhaus,
2010, pp. 320-341; Heine and Thompson, 2011; Khazai et al., 2011, pp.
30-31). In addition, it is probable that climate change will undermine
the capacity of some states to provide the services and support that
help people to sustain their livelihoods in a changing climate (Barnett
and Adger, 2007). Governance failure and violence as characteristics of
institutional vulnerability have significant influence on socioeconomic
and therefore climatic vulnerability. Furthermore, corruption has been
identified as an important factor that hinders effective adaptation
policies and crisis response strategies (Birkmann et al., 2011b; Welle et
al., 2012). At the local level, various aspects of governance in developing
and developed countries, particularly institutional capacities and self-
organization, as well as political and cultural factors, are critical for social
learning, innovations, and actions that can improve risk management
and adaptation to climate related risks and for empowering highly
vulnerable groups (IPCC, 2012a). Overall, unless governance improves
in countries with severe governance failure, risk will increase and human
security will be further undermined there as a result of climate change
and increased human vulnerability (high confidence; Lautze et al., 2004;
Ahrens and Rudolph, 2006; Barnett and Adger, 2007; Menkhaus, 2010).
19.6.1.4. Risk Perception
Risk perceptions influence the behavior of people in terms of risk
preparedness and adaptation to climate change (Burton et al., 1993;
van Sluis and van Aalst, 2006; IPCC, 2012a). Factors that shape risk

1069
Emergent Risks and Key Vulnerabilities Chapter 19
19
p
erceptions and therewith also influence actual and potential responses
(and thus exposure, vulnerability, and risk) include (1) interpretations
of the threat, including the understanding and knowledge of the root
cause of the problem; (2) exposure and personal experience with the
events and respective negative consequences, particularly recently (i.e.,
availability); (3) priorities of individuals; (4) environmental values and
value systems in general (see, e.g., O’Connor et al., 1999; Grothmann
and Patt, 2005; Weber, 2006; Kuruppu and Liverman, 2011). Furthermore,
the perceptions of risk and reactions to such risk and actual events are
also shaped by motivational processes (Weber, 2010). In this context
people will often ignore predictions of climate-related hazards if those
predictions fail to elicit emotional reactions. In contrast, if the event or
forecast of such an event elicits strong emotional feelings of fear, people
may overreact and panic (see Slovic et al., 1982; Slovic, 1993, 2010;
Weber, 2006). Public perceptions of risks are not determined solely by
the “objective” information, but rather are the product of the interaction
of such information with psychological, social, institutional, and cultural
processes and norms that are partly subjective, as demonstrated in
various crises in the context of extreme events (Kasperson et al., 1988;
Funabashi and Kitazawa, 2012). Risk perceptions particularly influence
and increase vulnerability in terms of false perceptions of security
(Cardona et al., 2012, p. 70). Finally, it is important to acknowledge that
everyday concerns and satisfaction of basic needs may prove more
pressing than attention and effort toward actions to address longer-
term risk factors, e.g., climate change (Maskrey, 1989, 2011; Wisner et
al., 2004). Rather, peoples’ worldviews and political ideologies guide
attention toward events that threaten their preferred social order
(Douglas and Wildavsky, 1982; Kahan, 2010).
19.6.2. Key Risks
19.6.2.1. Assessing Key Risks
Key risks arise from the interaction of climate-related hazards and key
vulnerabilities of societies, communities, or systems exposed (see Figure
19-1). Various chapters in this report have assessed key risks from their
particular perspectives. We asked each chapter writing team to provide
Chapter 19 authors with the key risks of highest concern to their chapter
based on the criteria for defining key risks and key vulnerabilities as
outlined in Section 19.2.2. A complete presentation of the key risks
provided is found in Box CC-KR (allowing for some condensation by
authors of Chapter 19 to avoid repetition).
The key risks provided by the chapters represent the issues most
pressing to each set of experts. The list is neither unique nor exhaustive:
other authors might express other preferences; however, this compilation
provides important insights about key risks and their determinants—
hazard, exposure, and vulnerability.
Chapter 19 authors further consolidated these key risks in Table 19-4
in order to produce the following list which, in their judgment (high
confidence), is representative of the range of key risks forwarded. Roman
numerals preceding each key risk correspond with entries in Table 19-4.
Each key risk is followed with a notation in brackets indicating the
Reason(s) for Concern (RFCs; see Section 19.6.3) with which it is aligned.
In addition, a representative set of lines of sight is provided from across
t
he chapters. Examples of these risks are also displayed geographically
in Figure 19-2:
i) Risk of death, injury, ill-health, or disrupted livelihoods in low-lying
coastal zones and small island developing states and other small
islands, due to storm surges, coastal flooding, and sea level rise.
These risks further increase in regions where the capacity to adapt
long-lived coastal infrastructure (e.g. electricity, water and sanitation
infrastructure) to local sea level rise beyond 1 m is limited. Urban
populations with substandard housing and inadequate insurance,
as well as marginalized rural populations with multidimensional
poverty and limited alternative livelihoods are particularly vulnerable
to these hazards. Inadequate local governmental attention to
disaster risk reduction and adaptation can further increase the
vulnerability of people and also the risk of adverse consequences
(WGI AR5 Sections 3.7, 13.5; WGI AR5 Table 13.5; Sections 5.4.3,
8.1.4, 8.2.3-4, 13.1.4, 13.2.2, 24.4-5, 26.7-8, 29.3.1, 30.3.1; Boxes
25-1, 25-7). [RFC 1, 2, 3, 4, and 5]
ii) Risk of severe ill-health and disrupted livelihoods for large urban
populations due to inland flooding in some regions. Particularly
vulnerable are marginalized and poverty-stricken residents in low-
income informal settlements as well as children, the elderly, and
the disabled that have limited means to cope and adapt. Risks are
increasing due to rapid and unsustainable urbanization especially
in areas where risk governance capacities are constrained or limited
attention is given to risk reduction and adaptation measures. Also,
overwhelmed, aging, poorly maintained, and inadequate infrastructure
(e.g., drainage infrastructure, electricity, water supply, etc.) can further
increase the risk of severe harm and threats to human security in the
case of inland flooding (WGI AR5 FAQ 12.2; Sections 3.2.7, 3.4.8,
8.2.3-4, 13.2.1, 25.10, 26.3, 26.7-8, 27.3.5; Box 25-8). [RFC 2 and 3]
iii) Systemic risks due to extreme weather events leading to breakdown
of infrastructure networks and critical services such as electricity,
water supply, and health and emergency services. Interdependency
of critical infrastructure increases the risk of systemic breakdowns
of vital services, for example, the risk of failure in systems dependent
on electric power (such as drainage systems reliant on electric
pumps) during extreme events. Health and emergency services rely
on critical infrastructure (e.g., telecommunication) that can be
disrupted during such power failures. For example, Hurricane Katrina
left 1220 electricity-dependent drinking water systems in Louisiana,
Mississippi, and Alabama inoperable for several weeks (Copeland,
2005). Overly hazard-specific management planning and infrastructure
design and/or low forecasting capabilities exacerbate such risks
(WGI AR5 Section 11.3.2; Sections 8.1.4, 8.2.4, 10.2-3, 12.6, 23.9,
25.10, 26.7-8). [RFC 2, 3, and 4]
iv) Risk of mortality and morbidity during periods of extreme heat,
particularly for vulnerable urban populations and those working
outdoors in urban or rural areas. Increasing frequency and intensity
of extreme heat (including exposure to the urban heat island
effect and air pollution) interacts with an inability of some local
organizations that provide health, emergency, and social services
to adapt to new risk levels for vulnerable groups. In addition, the
impact of heat stress on aging populations, such as during the
heat wave disaster in 2003 in Europe, shows how changing climatic
conditions interact with trends in population structure, health
conditions, and social isolation (characteristics of vulnerability) to
create key risks (WGI AR5 Section 11.3.2; Sections 8.2.3, 11.3,
1070
Chapter 19 Emergent Risks and Key Vulnerabilities
19
1
1.4.1, 13.2, 23.5.1, 24.4.6, 25.8.1, 26.6, 26.8; Box CC-HS). [RFC 2
and 3]
v) Risk of food insecurity and the breakdown of food systems linked to
warming, drought, flooding, and precipitation variability and extremes,
particularly for poorer populations in urban and rural settings. This
risk is a particular concern for farmers who are net food buyers and
people in low-income, agriculturally dependent economies that are
net food importers). Climatic hazards and the vulnerability of people
(see above) may exacerbate malnutrition, giving rise to a larger
burden of disease in these groups, especially among elderly and
f
emale-headed households having limited ability to cope. The
reversal of progress in reducing malnutrition is a potential outcome
(WGI AR5 Section 11.3.2; Sections 7.3-5, 11.3, 11.6.1, 13.2.1-2,
19.3.2, 19.4.1, 22.3.4, 24.4, 26.8, 27.3.4). [RFC 2, 3 and 4]
vi) Risk of loss of rural livelihoods and income due to insufficient
access to drinking and irrigation water and reduced agricultural
productivity, particularly for farmers and pastoralists with minimal
capital in semi-arid regions. Interaction of warming and drought
with lack of alternative sources of income, and the presence of
regional and national conditions that lead to a breakdown of food
No. Hazard Key vulnerabilities Key risks Emergent risks
i
Sea level rise, coastal fl ooding
including storm surges
(
WGI AR5 Sections 3.7 and
13.5; WGI AR5 Table 13.5;
Sections 5.4.3, 8.1.4, 8.2.3,
8.2.4, 13.1.4, 13.2.2, 24.4,
24.5, 26.7, 26.8, 29.3.1, and
30.3.1; Boxes 25-1, 25-7)
H
igh exposure of people, economic activity, and
infrastructure in low-lying coastal zones, Small Island
D
eveloping States (SIDS), and other small islands
D
eath, injury, and disruption to
livelihoods, food supplies, and drinking
w
ater
Loss of common-pool resources, sense
of place and identity, especially among
indigenous populations in rural coastal
zones
I
nteraction of rapid urbanization, sea
level rise, increasing economic activity,
d
isappearance of natural resources,
and limits of insurance; burden of risk
management shifted from the state
to those at risk, leading to greater
inequality
Urban population unprotected due to substandard
housing and inadequate insurance. Marginalized
rural population with multidimensional poverty and
limited alternative livelihoods
Insuffi cient local governmental attention to disaster
risk reduction
ii Extreme precipitation and
inland fl ooding
(WGI AR5 FAQ 12.2; Sections
3.2.7, 3.4.8, 8.2.3, 8.2.4,
13.2.1, 25.10, 26.3, 26.7, 26.8,
and 27.3.5; Box 25-8)
Large numbers of people exposed in urban areas
to fl ood events, particularly in low-income informal
settlements
Death, injury, and disruption of human
security, especially among children,
elderly, and disabled persons
Interaction of increasing frequency of
intense precipitation, urbanization,
and limits of insurance; burden of risk
management shifted from the state
to those at risk, leading to greater
inequality, eroded assets due to
infrastructure damage, abandonment
of urban districts, and the creation of
high-risk / high-poverty spatial traps
Overwhelmed, aging, poorly maintained, and
inadequate urban drainage infrastructure and limited
ability to cope and adapt due to marginalization,
high poverty, and culturally imposed gender roles
Inadequate governmental attention to disaster risk
reduction
iii Novel hazards yielding
systemic risks
(WGI AR5 Section 11.3.2;
Sections 8.1.4, 8.2.4, 10.2,
10.3, 12.6, 23.9, 25.10, 26.7,
and 26.8)
Populations and infrastructure exposed and lacking
historical experience with these hazards
Failure of systems coupled to electric
power system, e.g., drainage systems
reliant on electric pumps or emergency
services reliant on telecommunications.
Collapse of health and emergency
services in extreme events
Interactions due to dependence on
coupled systems lead to magnifi cation
of impacts of extreme events. Reduced
social cohesion due to loss of faith in
management institutions undermines
preparation and capacity for response.
Overly hazard-specifi c management planning
and infrastructure design, and/or low forecasting
capability
iv Increasing frequency and
intensity of extreme heat,
including urban heat island
effect
(WGI AR5 Section 11.3.2;
Sections 8.2.3, 11.3, 11.4.1,
13.2, 23.5.1, 24.4.6, 25.8.1,
26.6, and 26.8; Box CC-HS)
Increasing urban population of the elderly, the very
young, expectant mothers, and people with chronic
health problems in settlements subject to higher
temperatures
Increased mortality and morbidity
during periods of extreme heat
Interaction of changes in regional
temperature extremes, local heat
island, and air pollution, with
demographic shifts
Overloading of health and emergency
services. Higher mortality, morbidity,
and productivity loss among manual
workers in hot climates
Inability of local organizations that provide health,
emergency, and social services to adapt to new risk
levels for vulnerable groups
v Warming, drought, and
precipitation variability
(WGI AR5 Section 11.3.2;
Sections 7.3, 7.4, 7.5, 11.3,
11.6.1, 13.2.1, 13.2.2, 19.3.2,
19.4.1, 22.3.4, 24.4, 26.8, and
27.3.4)
Poorer populations in urban and rural settings are
susceptible to resulting food insecurity; includes
particularly farmers who are net food buyers and
people in low-income, agriculturally dependent
economies that are net food importers. Limited
ability to cope among the elderly and female-headed
households
Risk of harm and loss of life due
to reversal of progress in reducing
malnutrition
Interactions of climate changes,
population growth, reduced
productivity, biofuel crop cultivation,
and food prices with persistent
inequality and ongoing food insecurity
for the poor increase malnutrition,
giving rise to larger burden of disease.
Exhaustion of social networks reduces
coping capacity.
Table 19-4 | A selection of the hazards, key vulnerabilities, key risks, and emergent risks identifi ed in various chapters in this report (Chapters 4, 6, 7, 8, 9, 11, 13, 19, 22,
23, 24, 25, 26, 27, 28, 29, and 30). Key risks are determined by hazards interacting with vulnerability and exposure of human systems and of ecosystems or species. The table
underscores the complexity of risks determined by various climate-related hazards, non-climatic stressors, and multifaceted vulnerabilities. The examples show that underlying
phenomena, such as poverty or insecure land tenure arrangements, unsustainable and rapid urbanization, other demographic changes, failure in governance and inadequate
governmental attention to risk reduction, and tolerance limits of species and ecosystems that often provide important services to vulnerable communities, generate the context in
which climatic change–related harm and loss can occur. The table illustrates that current global megatrends (e.g., urbanization and other demographic changes) in combination
and in specifi c development contexts (e.g., in low-lying coastal zones) can generate new systemic risks in their interaction with climate hazards that exceed existing adaptation
and risk management capacities, particularly in highly vulnerable regions, such as dense urban areas of low-lying deltas. Roman numerals correspond with key risks listed in
Section 19.6.2.1. A representative set of lines of sight is provided from across WGI AR5 and WGII AR5. See Section 19.6.2.1 for a full description of the methods used to select
these entries.
Continued next page
1071
Emergent Risks and Key Vulnerabilities Chapter 19
19
distribution and storage systems, increase risk. Especially vulnerable
are those with limited ability to compensate for losses in water-
dependent farming and pastoral systems, as well as those subject
to conflict over natural resources. In addition, insufficient supply of
water due to droughts and institutional vulnerabilities (e.g., lack of
state capacities, conflicts) for both industry and urban populations
lacking running water, yielding severe economic impacts and other
harms (WGI AR5 Sections 12.4.1, 12.4.5; Sections 3.2.7, 3.4.8, 3.5.1,
8.2.3-4, 9.3.3, 9.3.5, 13.2.1, 19.3.2.2, 24.4). [RFC 2 and 3]
vii) Risk of loss of marine and coastal ecosystems, biodiversity, and the
ecosystem goods, functions, and services they provide for coastal
livelihoods, especially for fishing communities in the tropics and
the Arctic. These resources are especially at risk due to rising water
temperature and the increase of stratification and ocean acidification.
Loss of Arctic sea ice and degradation of coral reefs, as well as other
natural barriers, presents a high risk to ecosystem services where
many people are exposed to coastal hazards and also depend on
coastal resources for livelihoods, such as Alaska, the Philippines,
and Indonesia (WGI AR5 Section 11.3.3; Sections 5.4.2, 6.3.1-2,
7.4.2, 9.3.5, 22.3.2.3, 24.4, 25.6, 27.3.3, 28.2-3, 29.3.1, 30.5-6;
Boxes CC-OA, CC-CR). [RFC 1, 2, and 4]
viii) Risk of loss of terrestrial and inland water ecosystems, biodiversity,
and the ecosystem goods, functions, and services they provide for
livelihoods. Biodiversity and terrestrial ecosystem services are
important for rural and urban communities globally. These services
are at risk due to rising temperatures, changes in precipitation
patterns, and extreme weather events. Risks are high for communities
whose livelihoods depend on provisioning services. Human and
natural systems are susceptible to loss of provisioning services such
as food and fiber, regulating services such as water quality, fire, and
erosion, and cultural services such as aesthetic values and tourism
(WGI AR5 Section 11.3.2.5; Sections 4.3.4, 19.3.2.1, 22.4.5.6,
27.3.2.1; Boxes 23-1, CC-WE; FAQs 4.5, 4.7). [RFC 1, 3 and 4]
An important common characteristic of all key risks associated with
anthropogenic climate change is that they are determined by hazards due
to changing climatic conditions on the one hand and the vulnerability
of exposed societies, communities, and social-ecological systems, for
No. Hazard Key vulnerabilities Key risks Emergent risks
vi Drought
(
WGI AR5 Sections 12.4.1 and
12.4.5; Sections 3.2.7, 3.4.8,
3
.5.1, 8.2.3, 8.2.4, 9.3.3, 9.3.5,
13.2.1, 19.3.2.2, and 24.4)
Urban populations with inadequate water services.
E
xisting water shortages (and irregular supplies),
and constraints on increasing supplies
Insuffi cient water supply for people
a
nd industry, yielding severe harm and
economic impacts
Interaction of urbanization,
i
nfrastructure insuffi ciency,
groundwater depletion
Lack of capacity and resilience in water management
r
egimes including rural–urban linkages
Poorly endowed farmers in drylands or pastoralists
w
ith insuffi cient access to drinking and irrigation
water
Loss of agricultural productivity and/
o
r income of rural people. Destruction
of livelihoods, particularly for those
d
epending on water-intensive
agriculture. Risk of food insecurity
Interactions across human
v
ulnerabilities: deteriorating
livelihoods, poverty traps, heightened
f
ood insecurity, decreased land
productivity, rural outmigration,
and increase in new urban poor in
l
ow- and middle-income countries.
Potential tipping point in rain-fed
f
arming system and/or pastoralism
L
imited ability to compensate for losses in water-
dependent farming and pastoral systems, and
c
onfl ict over natural resources
L
ack of capacity and resilience in water
management regimes, inappropriate land policy,
and misperception and undermining of pastoral
l
ivelihoods
vii Rising ocean temperature,
o
cean acidifi cation, and loss
o
f Arctic sea ice
(WGI AR5 Section 11.3.3;
S
ections 5.4.2, 6.3.1, 6.3.2,
7.4.2, 9.3.5, 22.3.2.3, 24.4,
2
5.6, 27.3.3, 28.2, 28.3,
29.3.1, 30.5, and 30.6; Boxes
CC-OA and CC-CR)
High susceptibility of warm water coral reefs
a
nd respective ecosystem services for coastal
c
ommunities; high susceptibility of polar systems,
e.g., to invasive species
Loss of coral cover, Arctic species, and
a
ssociated ecosystems with reduction
o
f biodiversity and potential losses
of important ecosystem services. Risk
o
f loss of endemic species, mixing
of ecosystem types, and increased
dominance of invasive organisms
Interactions of stressors such as
a
cidifi cation and warming on
c
alcareous organisms enhancing risk
S
usceptibility of coastal and SIDS fi shing
communities depending on these ecosystem services;
a
nd of Arctic settlements and culture
viii Rising land temperatures,
changes in precipitation
patterns, and frequency and
intensity of extreme heat
(WGI AR5 Section 11.3.2.5;
Sections 4.3.4, 19.3.2.1,
22.4.5.6, and 27.3.2.1; FAQs
4.5 and 4.7; Boxes 23-1 and
CC-WE)
Susceptibility of societies to loss of provisioning,
regulation, and cultural services from terrestrial
ecosystems
Reduction of biodiversity and potential
losses of important ecosystem services.
Risk of loss of endemic species, mixing
of ecosystem types, and increased
dominance of invasive organisms
Interaction of social-ecological
systems with loss of ecosystem
services upon which they depend
Susceptibility of human systems, agro-ecosystems,
and natural ecosystems to (1) loss of regulation of
pests and diseases, fi re, landslide, erosion, fl ooding,
avalanche, water quality, and local climate; (2) loss
of provision of food, livestock, fi ber, bioenergy; (3)
loss of recreation, tourism, aesthetic and heritage
values, and biodiversity
Social
vulnerability
Economic
vulnerability
Environmental
vulnerability
Institutional
vulnerability
Exposure
Table 19-4 (continued)

1072
Chapter 19 Emergent Risks and Key Vulnerabilities
19
e
xample, in terms of livelihoods, infrastructure, ecosystem services and
management/governance systems on the other (see Table 19-4). The
compilation of key risks underscores that effective adaptation and risk
reduction measures would address all three components of risk (high
confidence).
1
9.6.2.2. The Role of Adaptation
and Alternative Development Pathways
As discussed in Section 19.2.4, the identification of key risks depends
in part on the underlying socioeconomic conditions assumed to occur
in the future, which can differ widely across alternative development
pathways. This section assesses literature that compares impacts across
development pathways, compares the contributions of anthropogenic
climate change and socioeconomic development (through changes in
vulnerability and exposure) to climate-related impacts, and examines the
potential for adaptation to reduce those impacts. Based on this assessment,
risks vary substantially across plausible alternative development pathways
and the relative importance of development and climate change varies
by sector, region, and time period, but in general both are important to
understanding possible outcomes (high confidence). In some cases, there
is substantial potential for adaptation to reduce risks, with development
pathways playing a critical role in determining challenges to adaptation,
including through their effects on ecosystems and ecosystem services
(Rothman et al., 2014).
Direct comparison of impacts across alternative development pathways
shows, for example, that socioeconomic conditions are an important
determinant of the impacts of climate change on food security, water
stress, and the consequences of extreme events and sea level rise. The
additional effect of climate change and CO
2
fertilization on the number
of people at risk from hunger by 2080 generally spans a range of ± 10 to
30 million across the four marker SRES scenarios, each of which assumes
different socioeconomic futures. However, in a scenario (A2) with high
population growth and slow economic growth, this effect becomes as
high as 120 to 170 million in some analyses (Schmidhuber and Tubiello,
2007). Similarly, the number of people exposed to water scarcity in a
global study is sensitive to population growth assumptions (Gosling
and Arnell, 2013), as are projected water resources in the Middle
East under an A1B climate change scenario (Chenoweth et al., 2011).
Assessments of the risks from river flooding depend on alternative future
population and land use assumptions (Bouwer et al., 2010; te Linde et
al., 2011), and sea level rise impacts depend on development pathways
through their effect on the exposure of both the population and
economic assets to coastal impacts, as well as on the capacity to invest
in protection (Anthoff et al., 2010).
The view that development pathways are an important determinant of
risk related to climate change impacts is further supported by two other
types of studies: those that examine the vulnerability of subgroups of
the current population, and those that compare the relative importance
of climate and socioeconomic changes to future impacts. The first type
finds that variation in current socioeconomic conditions explains some
of the variation in risks associated with climate and climate change,
supporting the idea that alternative development pathways, which
describe different patterns of change in these conditions over time,
s
hould influence the future risks of climate change. For example,
socioeconomic conditions have been found to be a key determinant of
risks to low-income households due to climate change effects on
agriculture (Ahmed et al., 2009; Hertel et al., 2010), to sub-populations
due to exposure to heterogeneous regional climate change (Diffenbaugh
et al., 2007), and to low-income coastal populations due to storm surges
(Dasgupta et al., 2009). Assessments of environmentally induced migration
have concluded that migration responses are mediated by a number
of social and governance characteristics that can vary widely across
societies (Warner, 2010; see Sections 12.4, 19.4.2.1).
The second type of study finds that, within a given projection of future
climate change and change in socioeconomic conditions, typically both
are important to determining risks. In fact, the effect of the physical
impacts of climate change on globally aggregated changes in food
consumption or risk of hunger have been found to be small relative to
changes in these metrics driven by socioeconomic development alone
(Schmidhuber and Tubiello, 2007; Nelson et al., 2010; Wiltshire et al.,
2013). Similarly, future population growth is found to be an equally
(Murray et al., 2012) or more (Fung et al., 2011; Schewe et al., 2013)
important determinant of globally aggregated water stress as the level
of climate change, and population growth, economic growth, and
urbanization are expected to largely drive potential future damages to
coastal cities due to flooding (high confidence; Section 5.4.3.1; Hallegatte
et al., 2013) and to be important determinants of damages from tropical
cyclones (Bouwer et al., 2007; Pielke Jr., 2007; Mendelsohn et al., 2012).
At the regional level, socioeconomic development has also been found
to be equally or more important than climate change to impacts in
Europe due to sea level rise, through coastal development (Hinkel et al.,
2010); heat stress, especially when acclimatization (Watkiss and Hunt,
2012) or aging (Lung et al., 2013) is taken into account; and flood
risks, through exposure due to land use and distributions of buildings
and infrastructure (Feyen et al., 2009; Bouwer et al., 2010). Climate
change was the dominant driver of flood risks in Europe when future
changes in the value of buildings and infrastructure at risk were
excluded from the analysis (te Linde et al., 2011; Lung et al., 2013) or
when biophysical impacts such as stream discharge, rather than its
consequences, were assessed (Ward et al., 2011).
Land use is another socioeconomic factor that can affect risks in addition
to climate change, but until recently few studies have addressed the
combined impacts of climate change and land use on ecosystems
(Warren et al., 2011). Studies including multiple drivers of extinction
find that although land use change remains the dominant driver out to
2100, climate change is the next most important driver (Sala et al., 2000;
Millenium Ecosystem Assessment, 2005b). A study of land bird extinction
risk found some sensitivity to four alternative land use scenarios,
but by 2100 risk was dominated by the climate change scenario
(Şekercioğlu, 2008). A study of European land use found that while
land use outcomes were more sensitive to the assumed socioeconomic
scenario, consequences for species depended more on the climate
scenario (Berry et al., 2006).
Explicit assessments of the potential for adaptation to reduce risks have
indicated that there is substantial scope for reducing impacts of several
types, but the capacity to undertake this adaptation is dependent on
underlying development pathways. Assessments of the impacts of
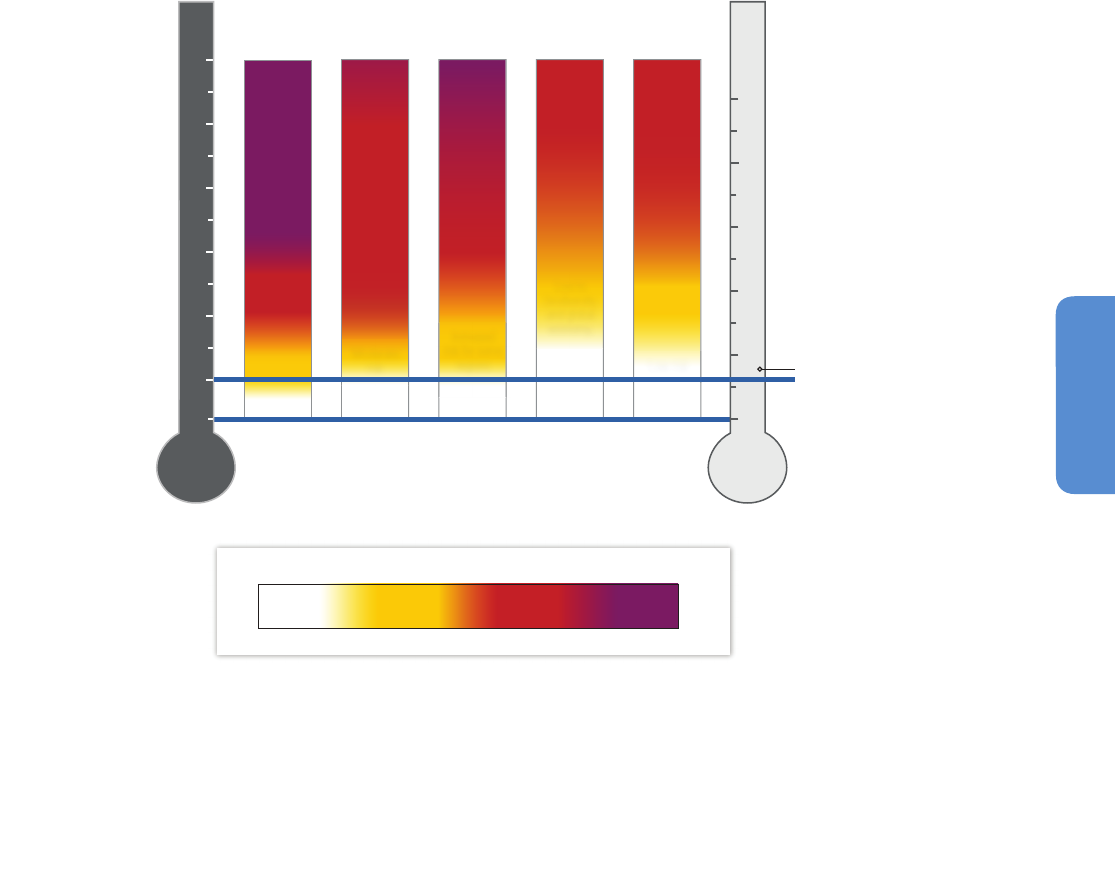
1073
Emergent Risks and Key Vulnerabilities Chapter 19
19
s
ea level rise, for example, show that if development pathways allow
for substantial investment of resources in adaptation through coastal
protection, as opposed to accommodation or abandonment strategies,
reducing impacts by investing in coastal protection can be an economically
rational response for large areas of coastline globally (Nicholls et al.,
2008a,b; Anthoff et al., 2010; Nicholls and Cazenave, 2010; Hallegatte
et al., 2013) and in Europe (Bosello et al., 2012b). For the specific case
of sea level rise impacts in Europe, adaptation in the form of increasing
dike heights and nourishing beaches, at a cost reaching about €3 billion
per year by 2100, was found to reduce the number of people affected by
coastal flooding in 2100 from hundreds of thousands to a few thousand
per year depending on the socioeconomic and sea level rise scenario
(A2 vs. B1), and total economic damages from about €17 billion to
about €2 billion per year (Hinkel et al., 2010). In contrast, in some areas
with higher current and anticipated future vulnerability such as low-
lying island states and parts of Africa and Asia, impacts are expected
to be greater and adaptation more difficult (Nicholls et al., 2011).
Similarly, the risk to food security in many regions could be reduced if
development pathways increase the capacity for policy and institutional
r
eform, although most impact studies have focused on agricultural
production and accounted for adaptation to a limited and varying degree
(Lobell et al., 2008; Nelson et al., 2009; Ziervogel and Ericksen, 2010).
A study of response options in sub-Saharan Africa identified some scope
for adapting to climate change associated with a global warming of
2°C above preindustrial levels (Thornton et al., 2011), given substantial
investment in institutions, infrastructure, and technology, but was
pessimistic about the prospects of adapting to a world with 4°C of
warming (Thornton et al., 2011; see also Section 19.7.1). Improved water
use efficiency and extension services have been identified as the highest
priority agricultural adaptation options available in Europe (Iglesias et
al., 2012), and a potentially large role for expanded desalination has
been identified for the Middle East (Chenoweth et al., 2011).
19.6.3. Updating Reasons for Concern
The RFCs are the relationship between global mean temperature increase
and five categories of impacts that were introduced in the IPCC TAR
(Smith et al., 2001) in order to facilitate interpretation of Article 2
5
4
3
2
1
0
°C
-0.61
(
˚
C relative to 1986–2005)
Global mean temperature change
Risks to
some
Moderate
risk
Loss to
biodiversity
and global
economy.
Low risk
Risks to
many,
limited
adaptation
capacity
Severe and
widespread
impacts
Increased
risk for
most
regions
Risk of
extensive
biodiversity
loss and
global
economic
damages
High
risk
Increased
risk for some
regions
Positive and
negative
impacts
(RFC1) Risks
to unique
and
threatened
systems
(RFC2) Risks
associated
with extreme
weather
events
(RFC3) Risks
associated
with the
distribution
of impacts
(RFC4) Risks
associated
with global
aggregate
impacts
(RFC5) Risks
associated
with
large-scale
singular
events
Level of additional risk due to climate change
Undetectable
Very high
White Yellow Red Purple
White to
yellow
Yellow to
red
Red to
purple
Moderate
High
°C
5
4
3
2
1
0
(
˚
C relative to 1850–1900, as an
approximation of preindustrial levels)
2003
–2012
Recent
(1986–2005)
Figure 19-4 | The dependence of risk associated with the Reasons for Concern (RFCs) on the level of climate change, updated from the Third Assessment Report and Smith et al.
(2009). The color shading indicates the additional risk due to climate change when a temperature level is reached and then sustained or exceeded. The shading of each ember
provides a qualitative indication of the increase in risk with temperature for each individual “reason.” Undetectable risk (white) indicates no associated impacts are detectable
and attributable to climate change. Moderate risk (yellow) indicates that associated impacts are both detectable and attributable to climate change with at least medium
confidence, also accounting for the other specific criteria for key risks. High risk (red) indicates severe and widespread impacts, also accounting for the other specific criteria for
key risks. Purple, introduced in this assessment, shows that very high risk is indicated by all specific criteria for key risks. Comparison of the increase of risk across RFCs indicates
the relative sensitivity of RFCs to increases in GMT. In general, assessment of RFCs takes autonomous adaptation into account, as was done previously (Smith et al., 2001, 2009;
Schneider et al., 2007). In addition, this assessment took into account limits to adaptation in the case of RFC1, RFC3, and RFC5, independent of the development pathway. The
rate and timing of climate change and physical impacts, not illustrated explicitly in this diagram, were taken into account in assessing RFC1 and RFC5. Comments superimposed
on RFCs provide additional details that were factored into the assessment. The levels of risk illustrated reflect the judgments of Chapter 19 authors.
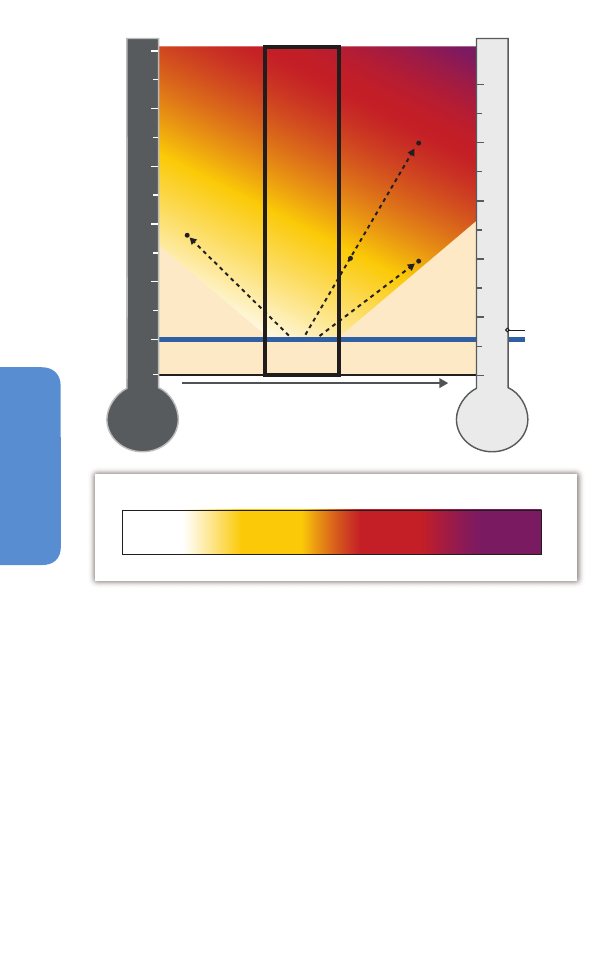
1074
Chapter 19 Emergent Risks and Key Vulnerabilities
19
(
Section 1.2.2; Box 19-2). In AR4, new literature related to the five RFCs
was assessed, leading in most cases to confirmation or strengthening of
the judgments about their relevance to defining dangerous anthropogenic
interference based on evidence that some impacts were already
apparent, higher likelihoods of some climate-related hazards, and
improved identification of currently vulnerable populations (Schneider
et al., 2007; Smith et al., 2009).
RFCs are related to the framework of key risks, climate-related hazards,
and vulnerabilities used in this chapter because each RFC is understood
to represent a broad category of key risks to society or ecosystems
associated with a specific type of hazard (extreme weather events,
large-scale singular events), system at risk (unique and threatened
systems), or characteristic of risk to social-ecological systems (global
aggregate impacts on those systems, distribution of impacts to those
systems). For example, the RFC for extreme weather events implies a
concern for risks to society and ecosystems posed by extreme events,
rather than a concern for extreme events per se. Accordingly, in this
chapter we have reworded the definition of RFCs to emphasize risk.
In this section we assess new literature related to each of the RFCs,
concluding that, compared to judgments presented in AR4 and in Smith
et al. (2009), levels of risk associated with extreme weather events and
distribution of impacts can be assessed with higher confidence and are
higher for large temperature rise than previously assessed; risks associated
w
ith global aggregate impacts are similar to AR4 and Smith et al (2009)
and confidence in the assessment unchanged; and risks to unique and
threatened systems and those associated with large-scale singular
events are higher above 2°C (compared to a 1986–2005 baseline) than
assessed previously. These judgments are illustrated in Figure 19-4, an
updated version of the “burning embers” diagram that describes how
the additional risk due to climate change for each RFC changes with
increasing GMT. We retain the color scheme employed in previous
versions of this figure (Smith et al., 2001, 2009) with some refinement.
White, yellow, and red indicate undetectable, moderate, and high
additional risk, respectively. Risk is low in the transition between white
and yellow, and substantial in the transition between yellow and red. We
add a new color (purple) indicating very high risk as elaborated below.
The following subsections assess risks for each RFC and locate transitions
between colors using the criteria for key risks as a guide (Section 19.2.2.2).
The transition from white to yellow is partly defined by the GMT at
which there is at least medium confidence that impacts associated with
a given risk are both detectable and attributable to climate change,
while also accounting for the magnitude of the risk. We draw on Section
18.6.4 to inform the placement of this transition relative to recent GMT.
The transition from yellow to red is defined by increasing magnitude
(including pervasiveness) or likelihood of impacts, with high risk (red
color) defined as risk of severe and widespread impacts that is judged
to be high on one or more criteria for assessing key risks (Section
19.2.2.2). Purple, introduced in this assessment, shows that very high
risk is indicated by all specific criteria for key risks, including limited
ability to adapt. As was true in the TAR and Smith et al. (2009), transitions
are fuzzy owing to uncertainties in a variety of factors determining the
relation between GMT and risk, including the rate of climate change, the
time at which the temperature is reached, and the extent and agreement
of the evidence base in the literature.
We also clarify the concept of RFCs: because risks depend not only on
physical impacts of climate change but also on exposure and vulnerability
of societies and ecosystems to those impacts, RFCs as a reflection of
those risks depend on both factors as well (see also Section 19.1).
19.6.3.1. Variations in RFCs across Socioeconomic Pathways
The determination of key risks as reflected in the RFCs has not previously
been distinguished across alternative development pathways. In the
TAR and AR4, RFCs took only autonomous adaptation into account
(Smith et al., 2001; Schneider et al., 2007; WGII AR4 Chapter 19).
However, the RFCs represent risks that are determined by both climate-
related hazards and the vulnerability and exposure of social and
ecological systems to climate change stressors. Figure 19-5 illustrates
this dependence on vulnerability and exposure in a modified version of
Low HighMedium
Exposure and vulnerability
Burning
Ember
A2,
2050
A2, 2100
B1, 2100
Figure 19-5 | Illustration of the dependence of risk associated with a Reason for
Concern (RFC) on the level of climate change and exposure and vulnerability (E&V) of
society. This figure is schematic; the degree of risk associated with particular levels of
climate change or E&V has neither been based on a literature assessment nor
associated with a particular RFC (the “burning ember” in the figure refers generically
to any of the embers in Figure 19-4). The E&V axis is relative rather than absolute.
“Medium” E&V indicates a future development path in which E&V changes over time
are driven by moderate trends in socioeconomic conditions. “Low” and “High” E&V
indicate futures that are substantially more optimistic or pessimistic, respectively,
regarding exposure and vulnerability. Judgments made in other burning ember
diagrams of the RFCs (Smith et al., 2001, 2009) including Figure 19-4, which do not
explicitly take changes in E&V into account, are consistent with Medium future E&V.
Arrows and dots illustrate the use of Special Report on Emission Scenarios
(SRES)-based literature to locate particular impact or risk assessments on the figure
according to the evolution of climate and socioeconomic conditions over time. This
figure does not explicitly address issues related to the rates of climate change or when
impacts might be realized.
Level of additional risk due to climate change
Undetectable
Very high
White Yellow
Red
Purple
White to
yellow
Yellow to
red
Red to
purple
Moderate
High
5
4
3
2
1
0
°C
-0.61
(
˚
C relative to 1986–2005)
Global mean temperature change
°C
5
4
3
2
1
0
(
˚
C relative to 1850–1900, as an
approximation of preindustrial levels)
2003
–2012
Recent
(1986–2005)
A2, 2100
with
mitigation

1075
Emergent Risks and Key Vulnerabilities Chapter 19
19
t
he burning embers diagram. Current literature is not sufficient to support
confident assessment of specific RFCs using this approach.
As literature accumulates, it could inform new versions of this figure
applied to specific RFCs. For example, studies that employ particular
scenarios of socioeconomic conditions could be categorized according
to the levels of vulnerability represented by those scenarios (van Vuuren
et al., 2012) to locate results along the horizontal axes, while climate
conditions assumed in those studies would locate results along the
vertical axis. As with previous versions of the burning embers, however,
this new figure does not explicitly address issues related to rates of
climate change or to when impacts might be realized. The updates
of RFCs in 19.6.3.2 to 19.6.3.6 that follow (and are illustrated in Figure
19-4) do not account for differences in vulnerability across development
paths; rather, they are based on the same assessment framework as
used in AR4 and Smith et al. (2009), but with additional elaboration.
19.6.3.2. Unique and Threatened Systems
Unique and threatened systems include a wide range of physical,
biological, and human systems that are restricted to relatively narrow
geographical ranges and are threatened by future changes in climate
(Smith et al., 2001). Where consequences are irreversible and importance
to society and other systems is high, the potential for loss of or damage
to such systems constitutes a key risk. AR4 stated with high confidence
that a warming of up to 2°C above preindustrial levels would result
in significant impacts on many unique and vulnerable systems and
would increase the endangered status of many threatened species, with
increasing adverse impacts (and increasing confidence in this conclusion)
at higher temperatures (Schneider et al., 2007). Since AR4, there is a
growing body of literature suggesting that the number of threatened
systems and species is greater than previously thought.
Chapters 4, 22, 23, 24, 25, 26, and 27 highlight areas where unique and
threatened systems are particularly vulnerable to climate change.
Evidence for severe and widespread impacts to humans and social
systems, ecosystems, and species in polar regions as warming progresses
has continued to accrue (Sections 4.3.3.4, 28.2). Projections of Arctic
sea ice melt rates have increased since AR4 (WGI AR5 Section 12.4.6),
increasing risks to the Inuit and the sea ice-dependent ecosystems upon
which they subsist. CMIP5 model runs for September with all RCPs show
substantial additional losses of Arctic Ocean ice for a global warming
of 1°C relative to 1986–2005 and a nearly ice-free Arctic Ocean for
global warming greater than 2°C (WGI AR5 Figure 12.30). Furthermore,
a nearly ice-free Arctic Ocean in September before mid-century is likely
under RCP8.5 (medium confidence; WGI AR5 Section 12.4.6).
Coral reef ecosystems are still considered amongst the most vulnerable
of unique marine systems (Sections 5.4.2.4, 19.3.2.4), with corals’
evolutionary responses being outpaced by climate change (Hoegh-
Guldberg, 2012) resulting in projections of extensive reef decline
throughout the 21st century. Globally, large-scale reef dissolution may
occur if CO
2
concentrations reach 560 ppm (Section 5.4.2.4) due to the
combined effects of warming and ocean acidification. Even if global
temperature rise in the 2090s is constrained to 1.2 to 2.0°C above
preindustrial levels (WGI AR5 Table 12.3, RCP2.6), and assuming rapid
a
daptation rates in corals, 9 to 60% of reefs are projected to be subject
to long-term degradation, while 30 to 88% of reefs are projected to
eventually degrade if global temperature rises in the 2090s by 1.9 to
2.9°C above preindustrial levels (RCP4.5; Box CC-CR; temperatures from
WGI AR5 Table 12.3). Loss of corals and mangrove ecosystems would
endanger the livelihoods of unique human communities and cause
economic damage (Section 4.3.3 for global discussion; Sections
22.3.2.3, 24.4.3, 25.6 for Africa, Asia, and Australia; Section 26.4 for
North America; Section 27.3.3.1 for South America).
There is a large and increasing amount of evidence for escalating risks
of species range loss, extirpation, and extinction based on studies for
global temperatures exceeding 2°C above preindustrial levels (1.4°C
above 1986–2005; Warren et al., 2011; Şekercioğlu et al., 2012, Foden
et al., 2013; Warren et al., 2013a). An assessment of 16,857 species
(Foden et al., 2013) found that with approximately 2°C of warming
above preindustrial (A1B, 2050s), 24 to 50% of the birds, 22 to 44% of
the amphibians, and 15 to 32% of the corals were highly vulnerable to
climate change defined as having high sensitivity, high exposure, and
low adaptive capacity.
An increasing number of threatened systems has been identified, in the
form of projected species range losses and extinction risks, although
without yet tying risks to specific levels of warming. Evidence of climate
risks to unique mountain ecosystems and their numerous endemic
alpine species has continued to accrue in Europe, Asia, Australia, and
South America (Sections 23.6.4, 24.4.2.3, 25.6.1, 27.3.2.1). Siberian,
tropical, and desert ecosystems in Asia (Section 24.4.2.3), Africa (Warren
et al., 2013a), and Mediterranean areas in Europe (Klausmeyer and
Shaw, 2009; Maiorano et al., 2011), the Queensland rainforest, Kakadu
National Park, and the southwestern region of Australia (Section 25.6.1),
Amazonian ecosystems in South America (Foden et al., 2013; Warren et
al., 2013a), and freshwater ecosystems in Africa (specifically Ethiopia,
Malawi, Mozambique, Zambia, and Zimbabwe) (Section 22.3.2.2) are
particularly at risk, as are the Fynbos and succulent Karoo areas of South
Africa (Midgley and Thuiller, 2011; Kuhlmann et al., 2012; Huntley and
Barnard, 2012) and dune systems in temperate climates (Section 23.6.5).
Recent research has identified risks to highly biodiverse tropical wet
and dry forests (Sections 4.3.3, 24.4.2.3; Kearney et al., 2009, Wright et
al., 2009; Toms et al., 2012) and tropical island endemics (Fordham and
Brook, 2010). Globally amphibians were found to be the most vulnerable
of vertebrate taxa (Stuart et al., 2004; Brito, 2008; Rohr and Raffel, 2010;
Liu et al., 2013; Warren et al., 2013a).
Owing to higher projections of sea level rise than in AR4 (WGI AR5 Sections
13.5-7), risk of partial inundation of small island states has increased.
“Since AR4, almost all glaciers worldwide have continued to shrink as
revealed by the time series of measured changes in glacier length, area,
volume and mass (very high confidence)” (WGI AR5 Chapter 4 ES). There
is substantial new evidence that, across most of Asia, glaciers have been
shrinking, except in some areas in the Karakorum and Pamir (Section
18.5.3). In the Andes, glacier loss threatens to reduce the water and
electricity supplies of large cities and hydropower projects, as well as the
agricultural and tourism sectors (Sections 27.3.1.1-2, 27.6.1; Table
27-3). Model simulations show a large projected loss of glacier ice
volume in central Asia by end of the century: in particular, estimates for

1076
Chapter 19 Emergent Risks and Key Vulnerabilities
19
R
CP8.5 and RCP4.5 suggest the potential for loss of most of the 2006
ice volume (Section 24.9.2). Loss of glacial cover has been projected to
significantly reduce water supplies in meltwater-dependent arid regions
(Kaser et al., 2010), potentially threatening the food security of 60 million
people in the Brahmaputra and Indus basins by the 2050s (Immerzeel
et al., 2010). However, recent work has suggested the glacier melt rates
in two Himalayan watersheds, Baltoro and Langtang, were previously
overestimated and, since precipitation is projected to concurrently increase,
runoff may actually rise until 2050 in these particular watersheds
(Immerzeel et al., 2013). Large uncertainties in projections of Himalayan
ice cover and runoff dynamics remain (Bolch et al., 2012).
In Figure 19-4, we locate the transition to moderate risk (white to
yellow) below recent global temperatures because there is at least
medium confidence in attribution of a major role for climate change for
impacts on at least one each of ecosystems, physical systems, and
human systems (Section 18.6.4). A transition to purple is located around
2°C above 1986–2005 levels to reflect the very high risk to species and
ecosystems projected to occur beyond that level as well as limited ability
to adapt to impacts on coral reef systems and on Arctic sea ice-dependent
systems (Chapters 4, 5, 6, 28) if that level of warming were exceeded
(high confidence). A transition to red is located around 1°C above 1986–
2005 levels, midway between current temperature and the transition
to purple, indicating the increasing risk to unique and threatened systems,
including Arctic sea ice and coral reefs, as well as threatened species
as temperature increases over this range.
19.6.3.3. Extreme Weather Events
Extreme weather events (e.g., heat waves, intense precipitation, drought,
tropical cyclones) trigger impacts that can pose key risks to societies
that are exposed and vulnerable (Lavell et al., 2012). With regard to
the physical hazard aspect of risk, AR5 assesses a higher likelihood of
attribution of heat waves and extreme hot days and nights to human
activity than AR4. WGI AR5 states, “We assess that it is very likely
that human influence has contributed to the observed changes in the
frequency and intensity of daily temperature extremes on the global
scale since the mid-20th century” (WGI AR5 Section 10.6.1.1) and “it
is likely that human influence has substantially increased the probability
of occurrence of heat waves in some locations” (WGI AR5 Section
10.6.2). WGI finds medium confidence in attribution of intensification
of heavy precipitation over land areas with sufficient data (WGI AR5
Section 10.6.1.2), and “low confidence in detection and attribution of
changes in drought over global land areas” (WGI AR5 Section 10.6.1.3)
and global changes in tropical cyclone activity (WGI AR5 Section
10.6.1.5) to human influence. There is high confidence in attribution of
impacts of weather extremes (as opposed to the physical hazards alone)
on coral reef systems (Sections 18.6.4, 19.6.3.2; Table 18-10), with
evidence for impact attribution limited and highly localized otherwise.
The likelihood of projected 21st century changes in extremes has not
changed markedly since AR4 (WGI AR5 Chapters 10, 12), but for the
first time near-term changes (for the period 2016–2035 relative to
1986–2005) are assessed (WGI AR5 Chapter 1), a period during which
the increase in the model and scenario averaged GMT is projected to
remain below 1°C relative to 1986–2005 (WGI AR5 Figure 11.8; WGI
A
R5 Section 11.3.6.3). Among the conclusions are, “In most land regions
the frequency of warm days and warm nights will likely increase in the
next decades, while that of cold days and cold nights will decrease”
(WGI AR5 Chapter 11 ES). Specifically, about 15% of currently observed
maximum daily temperatures exceed the historical 90th percentile
values (rather than the historical 10%) and, by about 2035, 25 to 30%
of daily maximums are projected to exceed the historical 90th percentile
value (WGI AR5 Figure 11.17). WGI also notes that “Models project
near-term increases in the duration, intensity and spatial extent of heat
waves and warm spells” (WGI AR5 Chapter 11 ES; WGI AR5 Table
SPM.1). With regard to extreme precipitation events, WGI finds “The
frequency and intensity of heavy precipitation events over land will
likely increase on average in the near term. However, this trend will not
be apparent in all regions because of natural variability and possible
influences of anthropogenic aerosols” (WGI AR5 Chapter 11 ES). In
addition, SREX (IPCC, 2012a, Figure SPM.4B) projects a reduction in return
period for historical once-in-20-year precipitation events globally (land
only) to about once-in-14-year or less by 2046–2065.
With regard to the vulnerability and exposure aspects of risk, SREX
reviewed literature on the relationship between changes in these factors
and the risk of extreme events (IPCC, 2012a, Sections 4.5.4, 4.5.6).
Increases in local vulnerability and exposure to extreme precipitation
can lead to a disproportionate increase in overall risk (IPCC, 2012a,
Sections 4.3.5.1, 9.2.8; Douglas et al., 2008; Douglas, 2009; Hallegate
et al., 2011; Ranger, 2011). For example, growth of megacities both
concentrates exposure and vulnerability and can generate “synchronous
failure” that spreads beyond the immediate vicinity of extreme events.
Megacities increase nighttime temperature extremes via the urban heat
island effect (Section 8.2.3.1; IPCC, 2012a, Sections 4.3.5.1, 4.4.5.2)
while also enhancing exposure to high air pollution levels (IPCC, 2012a,
Sections 4.3.5.1, 9.2.1.2.3; Fang et al., 2013) and consequent health
effects (Sections 11.5.3.2, 11.5.3.4), with widespread impacts by mid-
century in some studies. Densely populated areas of East and South
Asia and North America are projected to be especially affected by
climate-related air pollution (Fang et al., 2013).
Projections of the global socioeconomic (Mendelsohn et al., 2012) impact
of tropical cyclones demonstrate increasing risk due to interactions of
increasing storm intensity with exposure. Hazard projection suggests a
disproportionate increase in exposure to tropical cyclone risk with
increasing temperature at New York City due to combined effects of
storm intensification and sea level rise (Lin et al., 2012). Other studies
(Jongman et al., 2012; Hallegate et al., 2013; Preston, 2013) project
increasing coastal flood risk due to increasing exposure, although the
first two do not disaggregate to specific types of extreme events. Taken
together, this evidence supports a conclusion of disproportionate
increase in risk associated with extreme events as temperature, and in
many cases, exposure and vulnerability increase as well.
Based on the above assessments of the physical hazard alone, we find
increased confidence in the AR4 assessment of the risk from extreme
weather events.Based on the attribution of heat and precipitation
extremes to anthropogenic climate change, the attribution to climate
change of impacts of climate extremes on one unique and threatened
system, and the current vulnerability of other exposed systems, we
assign a yellow level of risk at recent temperatures in Figure 19-4 (high

1077
Emergent Risks and Key Vulnerabilities Chapter 19
19
c
onfidence), consistent with Smith et al. (2009). We assign a transition
to red beginning below 1°C compared to 1986–2005 (also consistent
with Smith et al. (2009)) based primarily on the magnitude and likelihood
and timing (see Section 19.2.2.2) of the projected change in hazard of
extreme weather events, indicating that impacts will become more
severe and widespread over the next few decades (medium confidence).
Risks associated with some types of extreme events (e.g., extreme heat)
increase further at higher temperatures (high confidence).
19.6.3.4. Distribution of Impacts
The distribution of impacts is a category of climate change consequences
that includes key risks to particular societies and social-ecological systems
that may be disproportionately affected due to unequal distribution of
hazards, exposure, or vulnerability. AR4 concluded that there is high
confidence that low-latitude, less-developed areas are generally at
greatest risk and found that, because vulnerability to climate change
is also highly variable within countries, some population groups in
developed countries are also highly vulnerable even to a warming of less
than 2°C above 1990–2000 (Schneider et al., 2007). These conclusions
remain valid and are now supported by a limited number of impact
studies that explicitly consider differences in socioeconomic conditions
that affect vulnerability across regions or populations (Mougou et al.,
2011; Müller et al., 2011; Gosling and Arnell, 2013; Schewe et al., 2013).
Furthermore, we have increased confidence in the AR4 assessment of
the risk arising in the near term from the distribution of impacts from
extreme weather events because, by their very nature, these events
change in a locally and temporally variable fashion with, for example,
a larger change in extreme temperatures at higher latitudes (IPCC,
2012a, Figure SPM.4A).
Impacts of climate change on food security depend on both production
and non-production aspects of the food system, including not just
yield effects but also changes in the amount of land in production and
adjustments in trade patterns (Section 7.1.1). Effects on prices are often
taken as an indicator of impacts on food security, and the combined
effect of climate and CO
2
change (but ignoring O
3
and pest and disease
impacts) appears about as likely as not to increase prices by 2050,
with few new studies examining prospects at longer time horizons
(Section 7.4.4). Most studies have focused on geographical differences
in the effects of climate change on crop yields. With regard to such
distributional consequences, yields of maize and wheat begin to decline
with about 1°C to 2°C of local warming in the tropics, with or without
adaptation taken into account (Figure 7-4). Temperate maize and
tropical rice yields are less clearly affected at these temperatures, but
significantly affected with local warming of 3 to 5°C particularly without
adaptation (based on studies with various baselines, see Section 7.3.2.1).
These data confirm AR4 findings that even small warming will decrease
yields in low-latitude regions (medium evidence, high agreement; Section
7.3.2.1.1), and increase the risk assigned to yields in mid- to high-latitude
regions (compared to AR4), suggesting thattemperate wheat yield
decreases are about as likely as not for moderate warming.
Risks of climate change related to freshwater systems, such as water
scarcity and flooding, increase with global mean temperature rise
(medium evidence, high agreement; Chapter 3 ES; Table 3-2). Climate
c
hange is projected to reduce renewable surface water and groundwater
resources significantly in most dry subtropical regions (high agreement,
robust evidence; Section 3.5; Chapter 3 ES). One study using multiple
climate and hydrological models to simulate impacts of scenario RCP8.5
and Shared Socioeconomic Pathway 2 (SSP2) project that global warming
of 1.7°C above preindustrial will reduce water resources by more than
one standard deviation, or by more than 20%, for 8% of the global
population, while for warming of 2.7°C above preindustrial this
increases to 14% (model range 10 to 30%), and for warming of 3.7°C
above preindustrial it reaches a mean of 17% across models (Schewe
et al., 2013). In addition, in another study (Gosling and Arnell, 2013),
climate change amplifies water scarcity by 30 to 40% for 1.7 to 2.7°C
of warming, with around 40% of the global population under increased
water stress. In one model, exposure to water scarcity increases steeply
up to 2.3°C above preindustrial in North and East Africa, Arabia, and
South Asia (Gosling and Arnell, 2013). In Africa water resources risks
are “medium-high” at 2°C and “high-very high” at 4°C (Table 22-6).
Model projections generally agree that discharge will decrease in the
Mediterranean and in large parts of North and South America (Schewe et
al., 2013). However, there are opportunities for adaptation in the water
resources sector, particularly for municipal water supply (Section 3.6).
The first global scale analysis of climate change impacts on almost
50,000 species of plants and animals has highlighted that risks are not
distributed equally, with sub-Saharan Africa, Central America, Amazonia,
and Australia at risk for plants and animals, and North Africa, Central
Asia, and southeastern Europe for many plants (Warren et al., 2013a).
A traits-based analysis of more than 16,000 species identified Amazonia
and Mesoamerica as being at risk for birds and amphibians; central
Eurasia, the Congo Basin, the Himalayas, and Sundaland for birds; and
the Coral Triangle region for corals (Foden et al., 2013).
In summary, since AR4, new evidence has emerged highlighting the
magnitude of risk for particular regions, for example, in relation to the
potential for regional impacts on ecosystems (see Section 19.6.3.2),
megadeltas (see Section 8.2.3.3; Chapter 5), and agricultural systems,
which is exacerbated by the potential for changes in the monsoon systems
(see WGI AR5 Sections 12.5.5, 14.2). Overall there is increased evidence
that low-latitude and less developed areas generally face greater risk
than higher latitude and more developed countries (Smith et al., 2009).
At the same time, there has been an increase in appreciation for
vulnerability (e.g., to extreme events) in developed countries, especially,
localized issues of differential vulnerability in particular areas of the
developed world (IPCC, 2012a, Section 2.5.1.2).
Regionally differentiated impacts on crop production have been detected
and attributed to climate change with medium to high confidence
(Section 18.4.1.1), and we interpret this as an early warning sign of
attributable impacts on food security. For this reason, as well as for
reasons of timing and likelihood and magnitude of these risks, we
assign a yellow level of risk at recent temperatures in Figure 19-4. Based
on risks to regional crop production and water resources the transition
from yellow to red is assessed to occur between 1°C and 2°C above
the 1986–2005 global mean temperature (medium confidence). Both
assessments are consistent with Smith et al. (2009). Furthermore, given
evidence that agronomic adaptations would be more than offset for
tropical wheat and maize where increases in local temperature of more

1078
Chapter 19 Emergent Risks and Key Vulnerabilities
19
t
han 3°C above preindustrial occur (limited evidence, medium agreement;
Chapter 7 ES; Section 7.5.1.1.1; Figure 7-4), the intensity of red increases
nonlinearly toward purple in recognition of the temperature sensitivity
of crop productivity and limited efficacy of agronomic adaptation above
2°C compared to 1986–2005.
1
9.6.3.5. Global Aggregate Impacts
The RFC pertaining to aggregate impacts includes risks that are aggregated
globally into a single metric, such as monetary damages, lives affected,
lives lost, or species or ecosystems lost. Estimates of the aggregate,
economy-wide risks of climate change since AR4 continue to exhibit a
low level of agreement. Studies at the sectoral level have been refined
with new data and models, and have assessed new sectors.
AR4 stated with medium confidence that approximately 20 to 30% of
the plant and animal species assessed to date are likely at increasing
risk of extinction as global mean temperatures exceed a warming of
2°C to 3°C above preindustrial levels (Fischlin et al., 2007). There is high
confidence that climate change will contribute to increased extinction
risk for terrestrial, freshwater, and marine species over the coming century
(Sections 4.3.2.5, 30.5; Box CC-CR). Since AR4 a substantial amount of
additional work has been done, looking at many more species and using
new and/or improved modeling and traits-based techniques, strengthening
the evidence of increasing risk of extinction with increasing temperature
(e.g., Lenoir et al., 2008; Amstrup et al., 2010; Hunter et al., 2010; Bálint
et al., 2011; Pearman et al., 2011; Barnosky et al., 2012; Bellard et al., 2012;
Norberg et al., 2012; Foden et al., 2013). More studies have scrutinized
caveats to previous studies and assessed their role in either under- or
overestimating extinction risks (e.g., Beale et al., 2008; Cressey, 2008;
Randin et al., 2009; He and Hubbell, 2011; Harte and Kitzes, 2012),
including the role of evolution (Norberg et al., 2012), while others have
carefully examined risk considering other species traits (looking at
exposure, sensitivity, and potential adaptive capacity for large numbers
of species; Foden et al., 2013). Literature incorporating multiple new
assessment techniques quantifying extinction risks supports the
conclusion that the dependence between increasing extinction risk and
temperature is robust (medium confidence), albeit varying across
biota.However, there is low agreement on assigning specific numerical
values for species at risk (Sections 19.3.2.1, 19.5.1). Since AR4 it has
been found that not only endemics (which have tended to be the focus
of many previous studies) but species geographically widespread are
at risk (Warren et al., 2013a), implying a significant and widespread
potential loss of ecosystem services (Section 4.3.2.5; Gaston and Fuller,
2008; Allesina et al., 2009; Staudinger et al., 2012), comprising a new
emergent risk (Table 19-4). At a global temperature rise of 3.5°C to 4°C
above preindustrial, Foden et al. (2013) estimated that 30 to 60% of
the birds and amphibians and 40 to 62% of the corals studied are highly
vulnerable to climate change. Taking this estimate conservatively as a
maximum (i.e., assuming all species not studied are able to adapt at
least as well as the groups investigated), and combining this estimate
with the finding of ≥50% loss of potential range in 57% of plants and
34% of animals studied globally for a global temperature rise of 3.5°C
to 4°C by the 2080s allowing for realistic dispersal rates (Warren et al.,
2013a), there is high confidence that climate change will significantly
affect biodiversity and related ecosystem services.
M
uch new work has focused on future projected synergistic impacts of
climate change-induced increases in fire, drought, disease, and pests
(Flannigan et al., 2009; Hegland et al., 2009; Koeller et al., 2009;
Krawchuk et al., 2009; Garamszegi, 2011). New work has demonstrated
that the expected large turnovers of more than 60% in marine species
assemblages by the 2050s in response to climate change (under SRES
scenarios A1B and B1), combined with shrinkage of fish body weight of
14 to 24% (SRES A2; Cheung et al., 2009, 2013), put marine ecosystem
functioning at risk with negative consequences for fishing industries,
coastal communities, and wildlife that are dependent on marine resources
(Lam et al., 2012).
Consistent with AR4, global aggregate economic impacts from climate
change are highly uncertain, with most estimates a small fraction of gross
world product up until at least 2.5°C of warming above preindustrial
(Section 10.9.2; Figure 10-1). Some studies suggest net benefits of
climate change at 1°C of warming (Section 10.9.2; Figure 10-1). Little
is known about global aggregate damages above 3°C (Sections 10.9.2,
19.5.1; Figure 10-1; Ackerman et al., 2010; Weitzman, 2010; Ackerman
and Stanton, 2012; Kopp et al., 2012). Aggregate damages vary with
alternative development pathways, but the relationship between
development pathway and aggregate damages is not well explored. In
many sectors, damages as a fraction of output are expected to be larger
in low-income economies, although monetized damages are expected
to be larger in high-income economies (e.g., Anthoff and Tol, 2010).
Adaptation is treated differently across modeling studies (Hope, 2006;
de Bruin et al., 2009; Bosello et al., 2010; Füssel, 2010; Patt et al., 2010)
and affects aggregate damage estimates in ambiguous ways.
Estimates of global aggregate economic damages omit a number of
factors (Yohe and Tirpak, 2008; Kopp and Mignone, 2012). While some
studies of aggregate economic damages include market interactions
between sectors in a computable general equilibrium framework (e.g.,
Bosello et al., 2012a; Roson and van der Mensbrugghe, 2012), none
treat non-market interactions between impacts (Warren, 2011), such as
the effects of the loss of biodiversity among pollinators and wild crops
on agriculture or the effects of land conversions owing to shifts in
agriculture on terrestrial ecosystems (see Sections 19.3-4). They do not
include the effects of the degradation of ecosystem services by climate
change (Section 19.3.2.1) and ocean acidification (Section 19.5.2), and
in general assume that market services can substitute perfectly for
degraded environmental services (Sterner and Persson, 2008; Weitzman,
2010; Kopp et al., 2012). The global aggregate damages associated with
large-scale singular events (Section 19.6.3.6) are not well explored
(Kopp and Mignone, 2012; Lenton and Ciscar, 2013).
The risk associated with global aggregate impacts is similar to that
expressed in AR4 and Smith et al. (2009), as indicated in Figure 19-4,
with risk based primarily on economic damages and confidence in the
assessment unchanged. For aggregate economic impacts, there is low
to medium confidence in attribution of climate change influence on a
few sectors (Section 18.6.4; Table 18-11) so that this RFC is still shaded
white at recent temperature in Figure 19-4. Risks of global aggregate
impacts are moderate for additional warming between 1°C to 2°C
compared to 1986–2005, reflecting impacts to both Earth’s biodiversity
and the overall global economy (medium confidence). Extensive
biodiversity loss with associated loss of ecosystem goods and services

1079
Emergent Risks and Key Vulnerabilities Chapter 19
19
r
esults in high risks around 3°C additional warming (high confidence).
Aggregate economic damages accelerate with increasing temperature
(limited evidence, high agreement) but few quantitative estimates have
been completed for additional warming around 3°C or above.
19.6.3.6. Large-Scale Singular Events: Physical, Ecological,
a
nd Social System Thresholds and Irreversible Change
Large-scale singular events (sometimes called “tipping points,” or critical
thresholds) are abrupt and drastic changes in physical, ecological, or
social systems in response to smooth variations in driving forces (Smith
et al., 2001, 2009; McNeall et al., 2011). Combined with widespread
vulnerability and exposure, they pose key risks because of the potential
magnitude of the consequences; the rate at which they would occur;
and, depending on this rate, the limited ability of society to cope with
them. Research on the societal impacts associated with such events is
limited; we focus in this section on physical hazards and ecological
thresholds.
Regarding singular events in physical systems, AR4 expressed medium
confidence that at least partial deglaciation of the Greenland ice sheet,
and possibly the West Antarctic ice sheet (WAIS), would occur over a
period of time ranging from centuries to millennia for a global average
temperature increase of 1°C to 4°C (relative to 1990–2000), causing a
contribution to sea level rise of 4 to 6 m or more (Schneider et al., 2007).
Studies since AR4 are consistent with these judgments but provide a
more detailed view (see WGI AR5 Chapter 13). The Greenland ice sheet
(very likely) and the Antarctic ice sheet (medium confidence) contributed
to the 5 m higher than present (very high confidence) to 10 m above
present (high confidence) sea level rise that occurred during the Last
Interglacial (WGI AR5 SPM; Kopp et al., 2009; McKay et al., 2011; Dutton
and Lambeck, 2012). This period provides a partial analog for the
magnitude of mid- to late-21st century warming because GMT was not
more than 2°C warmer than preindustrial (medium confidence; WGI
AR5 SPM; Section 5.3.4). However, the resulting sea level rise may have
taken millennia to complete.
With regard to projection, WGI AR5 finds that “There is high confidence
that sustained warming greater than some threshold would lead to the
near-complete loss of the Greenland ice sheet over a millennium or more,
causing a global mean sea level rise of up to 7 m. Current estimates
indicate that the threshold is greater than about 1°C (low confidence)
but less than about 4°C (medium confidence) global mean warming
with respect to preindustrial” (WGI AR5 SPM). A threshold for the
disintegration of WAIS remains difficult to identify due to shortcomings
in various aspects of ice sheet modeling, including representation of
the dynamical component of ice loss and ocean processes. For RCP8.5,
projected sea level rise is 1 to more than 3 m (medium confidence) by
2300. Beyond 2300, “Sustained mass loss by ice sheets would cause larger
sea level rise, and some part of the mass loss might be irreversible”
(WGI AR5 SPM). Extreme exposure and vulnerability to the magnitude
of sea level rise associated with loss of a significant fraction of either
ice sheet is found worldwide (Nicholls and Tol, 2006) but millennial time
scales for ice loss allow greater opportunities to adapt successfully than
do century scales, so timing is a critical and highly uncertain factor in
assessing the risk.
T
here is also additional evidence regarding singular events in other
physical systems. Feedback processes in the Earth system could cause
accelerated emissions of CH
4
from wetlands, permafrost, and ocean
hydrates. There are large uncertainties in the size of carbon stores, the
time scales of release, and the fate of the carbon once released. The
probability of substantial carbon release in the form of CH
4
or CO
2
increases with warming (Archer et al., 2009; O’Connor et al., 2010). WGI
AR5 finds “low confidence in modelling abilities to simulate transient
changes in hydrate inventories, but large CH
4
release to the atmosphere
during this century is unlikely” (WGI AR5 Section 6.4.7.3). Owing to such
uncertainties, the existence of a tipping point cannot be ascertained.
AR4 stated that Arctic summer sea ice disappears almost entirely in
some projections by the end of the century (WGI AR4 Section 10.3); WGI
AR5 finds that a “nearly ice-free Arctic Ocean (sea ice extent less than
1 × 10
6
km
2
for at least 5 consecutive years) in September before mid-
century is likely under RCP8.5 (medium confidence).” Furthermore,
“There is little evidence in global climate models of a tipping point (or
critical threshold) in the transition from a perennially ice-covered to a
seasonally ice-free Arctic Ocean beyond which further sea ice loss is
unstoppable and irreversible” (WGI AR5 Chapter 12 ES). Whether or not
the physical process is reversible, effects of ice loss on biodiversity may
not be.
Large uncertainties remain in estimating the probability of a shutdown
of the AMOC. One expert elicitation finds the chance of a shutdown to
be between 0 and 60% for global average warming between 2°C and
4°C, and between 5 and 95% for 4°C to 8°C of warming relative to 2000
(Zickfeld et al., 2007; Kriegler et al., 2009). AR5 judges that “It is very
unlikely that the AMOC will undergo an abrupt transition or collapse in
the 21st century for the scenarios considered. There is low confidence
in assessing the evolution of the AMOC beyond the 21st century because
of the limited number of analyses and equivocal results. However, a
collapse beyond the 21st century for large sustained warming cannot
be excluded” (WGI AR5 SPM).
Regarding regime shifts in ecosystems, there are “early warning signs”
from detection and attribution analysis that both Arctic and warmwater
coral reef systems are experiencing irreversible regime shifts (Section
18.6.4). Recent observational evidence confirms the susceptibility of the
Amazon to drought and fire (Adams et al., 2009; Phillips et al., 2009),
and recent improvements to models provide increased confidence in
the existence of a tipping point in the Amazon from humid tropical forest
to seasonal forest or grassland as the dominant ecosystem (Jones et
al., 2009; Lapola et al., 2009; Malhi et al., 2009; Section 4.3.3.1; Figure
4-8; Box 4-3). In contrast, one recent study suggests that the Amazon
may be less susceptible to crossing a tipping point than previously
thought (Cox et al., 2013), although this is contingent on the uncertain
role of CO
2
fertilization being as strong as models project. Overall, recent
“multi-model estimates based on different CMIP3 climate scenarios and
different dynamic global vegetation models predict a moderate risk of
tropical forest reduction in South America and even lower risk for
African and Asian tropical forests” (WGI AR5 Section 12.4.8.2).
Based on the weight of the above evidence, we judge that the overall
risk from large-scale singular events is somewhat higher than assessed
in AR4 and indicated by Smith et al. (2009). The position of the transition

1080
Chapter 19 Emergent Risks and Key Vulnerabilities
19
f
rom white to yellow between 0°C and 1°C compared to 1986–2005
remains as before but with higher confidence due to the existence of
early warning signs regarding regime shifts in Arctic and warmwater
coral reef systems. The transition from yellow to red occurs over a range
from 1°C to more than 3°C, consistent with Smith et al. (2009) and
based primarily on the uncertainty in the warming level associated with
eventual ice sheet loss. However, we assess a faster increase in risk as
temperature increases between 1°C and 2°C compared to 1986–2005,
largely determined by the risk arising from a very large sea level rise due
to ice sheet loss as occurred during the Last Interglacial when GMT was
no more than 2°C warmer than preindustrial (medium confidence; WGI
AR5 Sections 5.3.4, 5.6.2). This assessment of risk is based primarily on
the magnitude and irreversibility of such sea level rise and the widespread
exposure and vulnerability to it. However, as noted, the slower the rate
of rise, the more feasible becomes adaptation to reduce vulnerability
and exposure. Owing to this uncertainty in timing, we refrain from
imposing a transition to purple in Figure 19-4.
19.7. Assessment of Response Strategies
to Manage Risks
The management of key and newly identified risks of climate change
can include mitigation that reduces the likelihood of climate changes
and physical impacts and adaptation that reduces the exposure and
vulnerability of society and ecosystems to both. Key risks, impacts, and
vulnerabilities to which societies and ecosystems may be subject will
depend in large part on the mix of mitigation and adaptation measures
undertaken, as will the evaluation of RFCs (Section 19.6.3). This section
therefore assesses relationships between mitigation, adaptation, and
the residual impacts that generate key risks. It also considers limits to
both mitigation and adaptation responses, because understanding
where these limits lie is critical to anticipating risks that may be
unavoidable. Potential impacts involving thresholds for large changes
in physical, ecological, and social systems (Section 19.6.3.6) are
particularly important elements of key risks, and the section therefore
assesses response strategies aimed at avoiding them or adapting to
crossing them.
19.7.1. Relationship between Adaptation Efforts,
Mitigation Efforts, and Residual Impacts
Under any plausible scenario for mitigation and adaptation, some degree
of risk from residual damages is unavoidable (very high confidence).
Evaluating potential mixes of mitigation, adaptation, and impacts requires
joint consideration of outcomes for climate change and socioeconomic
development. A principal way in which these different mixes are assessed
is comparing the impacts that result from scenarios with little or no
mitigation (and therefore more climate change) to those with substantial
mitigation (and less climate change). Climate change mitigation costs
have been extensively explored (WGIII AR5 Chapter 6), but there has
been less work on quantifying the impacts avoided by mitigation and,
with the exception of studies of the impacts of sea level rise (Nicholls
et al., 2011), treatment of adaptation has been limited and uneven. In
this section, unless otherwise stated, global temperature rise is given
relative to preindustrial (1850–1900) levels.
I
mpact studies generally indicate that mitigation can reduce a large
proportion of climate change impacts that would otherwise occur
(high confidence). In one study, mitigation that stabilizes global CO
2
concentrations at 550 ppm reduces by 80 to 95% the number of people
additionally at risk of hunger (largely in Africa) in 2080 under an SRES
A2 scenario with CO
2
concentrations of 800 ppm, creating an estimated
benefit of US$23 to 34 billion of agricultural output compared to the
un-mitigated case (Tubiello and Fischer, 2007). In Africa, there are
much greater impacts on crop productivity, freshwater resources, and
ecosystems at 4°C than at 2°C, with adaptation failing to reduce risk
below a “high” level at 4°C (“very high” for crop productivity), whereas
at 2°C risks are lower and adaptation could reduce these risks to a
“medium” level (Table 22-6). In North America, with 4°C warming,
adaptation is not expected to reduce risks below “high” for urban flooding
(both riverine and coastal) or for fire damage in ecosystems, or below
“medium” for heat-related human mortality. Without adaptation, risk
is “very high” for these sectors. In contrast, at 2°C risks are at the
“high” level for urban flooding and heat-related human mortality, but
the risk of fire in ecosystems is still “very high.” At 2°C, adaptation is
expected to reduce urban flooding risk to “medium” and heat-related
human mortality risk to “low” (Table 26-1). Impacts on water resources
would also be reduced (Table 3-2). Fung et al. (2011) and Gosling and
Arnell et al. (2013) both found that climate change-induced increases
in water stress (defined as persons with <1700 or <1000 m
3
per capita
per year respectively in the two studies) globally would be reduced
significantly were global temperature rise to be constrained to 2°C
rather than 4°C. Reducing climate change from an RCP8.5 scenario to
an RCP2.6 scenario reduces the proportion of the global population
that experiences >10% declines in available groundwater from 27 to
50% to 11 to 39% (Portmann et al., 2013).
Figure 19-6 highlights results from three studies that estimated the
global avoided impacts for multiple sectors when global average
temperature is limited to 2°C rather than following scenarios with no
mitigation, such as the SRES A1B or A1FI baseline scenarios in which
global average temperature reaches 4°C and 5.6°C, respectively (Arnell
et al., 2013; Warren et al., 2013a,b). The studies isolate the effects of
climate change by using common socioeconomic assumptions in
mitigation and baseline scenarios. Overall, sector-specific impacts were
reduced by 20 to 80%, with aggregate global economic damages
reduced by about one-half (Warren et al., 2013b). The largest impacts
avoided were for crop productivity, drought in cropland, biodiversity,
exposure to coastal and pluvial flooding, and energy use for cooling,
while avoided impacts were smaller for water resources stress. Because
some areas become wetter and others drier (WGI AR5 Section 12.4.5),
there are regions where climate change results in decreases in flood,
drought, or water stress, which may be beneficial. (Note that reduced
water stress is not necessarily beneficial; for example, if increased
precipitation occurs in a small number of isolated heavy rainfall events,
water cannot easily be stored and can cause flooding). This means that
as well as avoiding a large amount of negative impacts, mitigation is
projected to result in the avoidance of some benefits that are projected
to result from climate change, although these avoided benefits are much
smaller than the avoided impacts. There are shown as the blue bars in
Figure 19-6. Avoided impacts are significantly larger when an A1FI
baseline is used compared to an A1B baseline (Figure 19-6) because
emissions and global temperature rise are greater in the A1FI baseline
1081
Emergent Risks and Key Vulnerabilities Chapter 19
19
s
cenario. All of these studies employed an ensemble of climate change
projections based on emulation of seven different Global Climate
Models (GCMs). The proportion of impacts avoided at the global scale
was relatively robust to uncertainties in regional climate projection,
but the magnitude of avoided impacts varied considerably with climate
projection uncertainty.
T
he timing of emissions reductions strongly affects impacts. In general
fewer impacts can be avoided when mitigation is delayed(Arnellet al.,
2013; Warren et al., 2013a,b; Figure 19-6b) because there are limits to
how fast emissions can be reducedsubsequently to compensate for the
delay (Section 19.7.2). For example, if global emissions peak in 2016 and
are then reduced at 5% annually, one half of global aggregate economic
(dark red)
(dark red)
(light brown)
(yellow)
(orange)
(dark blue)
(dark blue)
(bright blue)
(light blue)
(purple)
020406080100
% changes avoided in 2100
relative to SRES A1B baseline
020406080100
Change in average annual people flooded in coastal floods
Climatic range loss in plants
Climatic range loss in animals
E
xposure to increased river flood frequency
Change in residential cooling energy demand
C
hange in soybean productivity
T
otal economic damages (without equity weights)
Total economic damages (with equity weights)
C
hange in spring wheat productivity
Increased exposure to drought in croplands
Decline in crop suitability
Change in coastal wetland extent
Increased exposure to water resources stress
Improvement in crop suitability
Exposure to decreased river flood frequency
Decreased exposure to water resources stress
Decreased exposure to drought in croplands
Change in residential heating energy demand
% changes avoided in 2100 relative to SRES A1B
or A1FI baseline in rapid early mitigation
% impacts
avoided
% benefits
avoided
Rapid early mitigation
Slow early mitigation
Rapid late mitigation
A1B
A1B
A1FI
(a) (b)
(a) (b)
Impacts avoidedBenefit avoided
% impacts
avoided
% benefits
avoided
Figure 19-6 | (a) Climate change impacts avoided by an early, rapid mitigation scenario in which global emissions peak in 2016 and are reduced at 5% thereafter, compared to
two no-mitigation baseline cases, Special Report on Emission Scenarios (SRES) A1B (dark red bars) and SRES A1FI (orange bars). Impacts avoided are larger if the A1FI baseline
scenario is used than if the A1B baseline is used, because greenhouse gas emissions in A1FI exceed those in A1B (see Section 19.7.1). Since the literature does not provide
estimates of avoided impacts relative to the A1FI baseline for all sectors considered here, some bars are absent from the panel (a). (b) The dependence of the potential to avoid
climate change impacts upon the timing of emission reductions is illustrated. Climate change impacts avoided by the same early, rapid mitigation scenario compared to the
no-mitigation baseline case SRES A1B (dark red bars) are shown. The information displayed is identical to the orange bars in (a), but a comparison is now made with the impacts
avoided from two other less stringent mitigation scenarios. Impacts avoided if global emissions peak in 2016 but are subsequently reduced more slowly (2% annually) are lower
(light brown bars compared to dark red bars). However, if mitigation occurs later, so that global emissions do not peak until 2030, even if emissions are subsequently reduced at
5% annually, the avoided impacts are smaller than in either of the other two cases (yellow bars compared to dark red and light brown bars). Both panels show the uncertainty
range (error bars) due to regional climate change projected with seven global climate models. Errors due to uncertainty within impacts models are not shown. Uncertainties
associated with sea level rise related impacts are not provided because the models used a single sea level rise projection. Because increases and decreases in water stress, flood
risks, and crop suitability are not co-located and affect different regions, these effects are not combined. Since some areas become wetter and others drier (WGI AR5 Section
12.4.5), there are regions where climate change results in decreases in flood, drought, or water stress, which may be beneficial. This means that avoided benefits of climate
change, as well as avoided impacts of climate change, are also shown here, as the shorter blue bars. Overall the avoided impacts greatly outweigh the avoided benefits (Arnell et
al., 2013; Warren et al., 2013a,b).
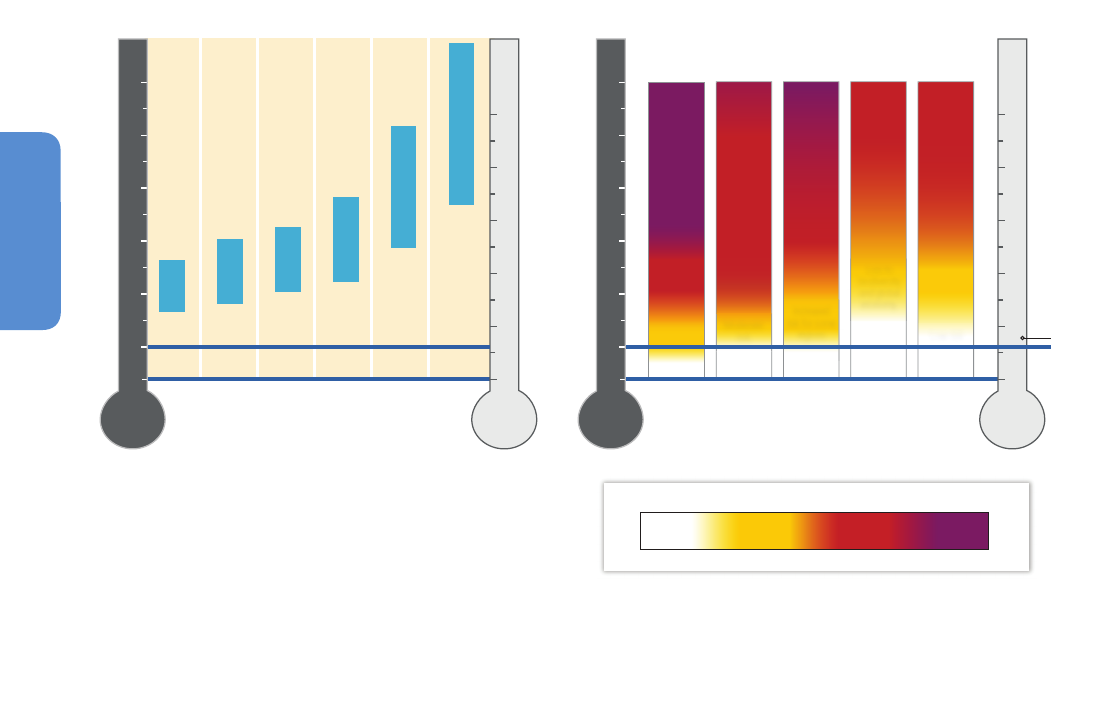
1082
Chapter 19 Emergent Risks and Key Vulnerabilities
19
i
mpacts might be avoided (Figure 19-6b, orange bars), or around 43%
if emissions are reduced more slowly at 2% annually (Figure 19-6b, pink
bars); compared to only one-third if emissions peak in 2030 even if
emissions are reduced at 5% thereafter(Warren et al., 2013b, Figure
19-6b, brown bars). This applies irrespective of whether or not equity
weighting is used in the impact valuation process.
Avoided impacts vary significantly across regions as well as sectors
(high confidence) due to (1) differing levels of regional climate change,
(2) differing numbers of people and levels of resources at risk in different
regions, and (3) differing sensitivities and adaptive capacities of
humans, species, or ecosystems (Tubiello and Fischer, 2007; Ciscar et al.,
2011; Arnell et al., 2013; Section 25.10.1). The length of time it takes
for avoided impacts to accrue is determined partly by the nature of the
climate system. Benefits accrue least rapidly for impacts associated with
sea level rise such as coastal flooding and loss of mangroves and coastal
wetlands because sea level rise responds very slowly to mitigation
efforts (Meehl et al., 2012). Nevertheless, mitigation may limit 21st
century impacts of increased coastal flood damage, dry land loss, and
wetland loss substantially (limited evidence, medium agreement) albeit
there is little agreement on the exact magnitude of this reduction
(Section 5.4.3.1). Benefits accrue more rapidly for impacts associated
with global temperature change (WGI AR5 Section 12.5.2, Figure 12.44)
and those associated with reduced ocean acidification because surface
pH responds relatively quickly to changes in emissions of CO
2
(FAQ
30.1).
I
n WGIII AR5 Chapter 6, the emission scenarios in the literature (as
collected in the AR5 database) have been categorized on the basis of the
2100 radiative forcing (in a total of seven categories). Most Integrated
Assessment Models (IAMs) provide information on concentration,
forcing, and temperature. However, as the climate components of the
IAMs differ, all scenarios were reanalyzed in the simple climate model
Model for the Assessment of Greenhouse-gas Induced Climate Change
(MAGICC; Meinshausen et al., 2011) using its probabilistic set-up. The
results of this categorization can be used to connect emission trajectories
to climate outcomes (Figure 19-7a) and impacts and risks (Figure 19-7b;
Table 19-4).
Mitigationscenarios in category 1 with a 2100 CO
2
-eq concentration
of 430 to 480 ppm result in a median projected 2100 global temperature
rise of between 1.5°C and 1.7°C above preindustrial (10–90% range
1.0–2.8°C) (Figure 19-7a; WGIII AR5 Table 6.3). These scenarios correspond
to a 2011–2100 cumulative emission level of around 630–1180 GtCO
2
(WGIII AR5 Table 6.3). Under these scenarios, based on the MAGICC
calculations, warming is likely to stay below 2°C and very likely to stay
below 3°C during the 21st century. This significantly reduces the key
risks listed in Table 19-4, as well as others discussed in this chapter.
Constraining global temperature rise to 2°C would constrain the risks
associated with global aggregate impacts and large-scale singular
events to the yellow or moderate level and the risks associated with
the distribution of impacts, extreme weather events, and to unique and
threatened systems to the lower part of the red or high level. If global
(a) (b)
2100 CO
2
-eq concentration level (ppm)
Figure 19-7 | Relationship between mitigation scenario categories considered in WGIII AR5, in terms of their CO
2
-eq concentrations and global temperature rise outcomes in
2100, and level of risk associated with Reasons for Concern. (a) The projected increase in global mean temperature in 2100 compared to pre-industrial and recent (1986–2005),
calculated using the Model for the Assessment of Greenhouse-gas Induced Climate Change (MAGICC) climate model for the scenario categories defined in WGIII AR5 Chapter 6,
indicating the uncertainty range resulting both from the range of emission scenario projections within each category (10–90th percentile) and the uncertainty in the climate
system as represented by MAGICC (16–84th percentile) (data taken from WGIII AR5 Chapter 6). (b) Reproduction of Figure 19-4 for ease of comparison. Beyond 2100,
temperature, and therefore risk, decreases in most of the lowest three scenarios and increases further in most of the others.
5
4
3
2
1
0
°C
-0.61
Risks to
some
Moderate
risk
Loss to
biodiversity
and global
economy.
Low risk
Risks to
many,
limited
adaptation
capacity
Severe and
widespread
impacts
Increased
risk for
most
regions
Risk of
extensive
biodiversity
loss and
global
economic
damages
High
risk
Increased
risk for some
regions
Positive and
negative
impacts
Level of additional risk due to climate change
Undetectable Very high
White Yellow Red Purple
White to
yellow
Yellow to
red
Red to
purple
Moderate
High
°C
5
4
3
2
1
0
2003
–2012
Recent
(1986–2005)
(RFC1) Risks
to unique
and
threatened
systems
(RFC2) Risks
associated
with extreme
weather
events
(RFC3) Risks
associated
with the
distribution
of impacts
(RFC4) Risks
associated
with global
aggregate
impacts
(RFC5) Risks
associated
with
large-scale
singular
events
>
1000
7
20-
10
0
0
580-
72
0
530
-5
80
4
80-
53
0
430
-4
80
(
˚
C relative to 1986–2005)
Global mean temperature change
(
˚
C relative to 1850–1900, as an
approximation of preindustrial levels)
(
˚
C relative to 1986–2005)
Global mean temperature change
(
˚
C relative to 1850–1900, as an
approximation of preindustrial levels)
5
4
3
2
1
0
°C
-0.61
°C
5
4
3
2
1
0

1083
Emergent Risks and Key Vulnerabilities Chapter 19
19
t
emperature rise were 1.5–1.7°C only, risks to unique and threatened
systems and risks associated with extreme weather events would be
further constrained to the transition between moderate and high risk
levels. The temperature levels in the RCP2.6 scenario are 1.2°C to 2.0°C
(WGI AR5 Table 12.2) matching closely the scenarios in this category.
Mitigation scenarios in category 2 with a concentration of 480 to 530
ppm CO
2
-eq in 2100 correspond to a median projected 2100 global
temperature rise of between 1.7°C and 2.1°C (10–90% range 1.2–3.3°C)
in the MAGICC calculations. These scenarios correspond to a cumulative
emission level over the 2011–2100 period on the order of 960–1550
GtCO
2
(WGIII AR5 Table 6.3) and are as likely as not to stay below 2°C,
but are still very unlikely to rise above 3°C. Thus, scenarios in category
2 also reduce risks, but to a lesser extent than for category 1. If global
temperature rise reaches 2.5°C in 2100, levels of risk due to extreme
weather events are at the red or high level, while those to unique and
threatened systems now reach the very high or purple level reflecting
inability to adapt. Risks associated with global aggregate impacts reach
the transition zone from yellow or moderate level to red or high risk,
while risks associated with the distribution of impacts and large-scale
singular events reach the red or high level.
Mitigation scenarios in category 3 with 530 to 580 ppm CO
2
-eq in 2100
correspond to a median projected temperature rise of between 2.0°C
and 2.3°C (range 1.4–3.6°C) above preindustrial levels (WGIII AR5
Table 6.3) such that it is very unlikely that temperature rise would
stay below 1.5°C, and less probable than category 2 to remain below
2°C, affording little protection to coral reefs. In this category, risks to
unique and threatened systems remain high or very high indicating
inability to adapt. Risks associated with extreme weather events remain
at the high level. Risks associated with the distribution of impacts,
global aggregate impacts and large-scale singular events range from
moderate to high.
Mitigation scenarios in category 4 with 580 to 720 ppm CO
2
-eq in 2100
result in a range of possible temperature outcomes between 2.3°C and
2.9°C (10–90% range 1.5–4.5°C) above preindustrial levels, affording
no protection to coral reefs. In these scenarios, it is more likely than not
that global temperature rise would exceed 2°C (WGIII AR5 Table 6.3)
so that risks to unique and threatened systems remain high or very high
indicating inability to adapt. Risks associated with extreme weather
events and the distribution of impacts are high. Levels of risk associated
with global aggregate impacts and large-scale singular events may be
moderate or high (high confidence). Global temperature rise in RCP4.5
in 2100 is 1.9 to 2.9°C above preindustrial levels (WGI AR5 Table 12.2),
matching the low scenarios in this category.
Onset of large-scale dissolution of coral reefs is projected if CO
2
concentrations reach 560 ppm (Sections 5.4.1.6, 5.4.2.4, 19.6.3.2,
26.4.3.2; Silverman, 2009), due to the combined effects of warming and
ocean acidification. However, already at 450 ppm, reef growth rates are
projected to be reduced by more than 60% globally and by at least 20%
globally at 380 ppm (Silverman, 2009). Coral organisms themselves are
projected to be damaged by warming at concentrations below 560 ppm:
specifically, even with optimistic assumptions regarding the ability of
corals to rapidly adapt to thermal stress, RCP4.5 is projected to result
in long-term degradation of two-thirds of coral reefs, compared with
o
ne-third of them under RCP3PD (Box CC-CR). Hence, maintenance of
moderately healthy coral reefs is consistent only with scenarios in the
scenarios in the 430 to 480 ppm CO
2
-eq category; while some reef
protection is achieved with scenarios in the category 480 to 530 ppm
CO
2
-eq. A low level of protection exists for the category 530 to 580 ppm
CO
2
-eq while all other categories exceed the 560 ppm level.
Finally, scenarios in category 6 with a concentration level of >1000 ppm
CO
2
-eq are projected to result in median 2100 temperature rise of 4.1°C
to 4.8°C (range 2.8–7.8°C) above preindustrial with negligible chances
to constrain it below 2°C above preindustrial (Figure 19-7a) and would
allow significant key risks to persist in all the areas listed in Table 19-4.
Risk is at the red level for all RFCs except unique and threatened systems,
where risk is at the purple level indicating infeasibility of adaptation.
For the distribution of impacts, risk reaches the transition to purple if
temperatures rise in excess of 4°C above preindustrial levels. For the
scenarios with a concentration level between 720 ppm and 1000 ppm
(category 5) outcomes for risk levels are high or very high, except that
risk of global aggregate impacts ranges from the transition zone from
moderate risk up to high risk.
Scenarios with rapid, early mitigation (particularly those with a 2100
CO
2
-eq concentration of 430 to 480 ppm) generally delay the onset of a
given global annual mean temperature rise until several decades later in
the century than is the case for scenarios with slower, delayed mitigation
or no mitigation (such as those with a 2100 CO
2
-eq concentration of 720
to 1000 ppm), thus allowing impacts to be further reduced by adaptation
during this time.
19.7.2. Limits to Mitigation
Mitigation possibilities, such as those implicit in scenarios discussed in
Section 19.7.1, are not unlimited. Assessment of maximum feasible
mitigation (and lowest feasible emissions pathways) must account for the
fact that feasibility is a subjective concept encompassing technological,
economic, political, and social dimensions (Hare et al., 2010). Most
mitigation studies have focused on technical feasibility, for example,
demonstrating that it is possible to reduce emissions enough to have
at least a 50% chance of limiting warming to less than 2°C relative to
preindustrial (den Elzen and van Vuuren, 2007; Clarke et al., 2009;
Edenhofer et al., 2010; Hare et al., 2010; O’Neill et al., 2010), taking into
account uncertainty in climate and carbon cycle response to emissions
(see WGI AR5 Section 12.5.4 for a discussion of uncertainties in the
relationship between emissions and long-term climate stabilization
targets). RCP2.6, based on an integrated assessment model-based
mitigation scenario (van Vuuren et al., 2012), is unlikely to produce more
than 2°C of warming relative to preindustrial (medium confidence; WGI
AR5 Section 12.4.1.1). Such scenarios lead to pathways in which global
emissions peak within the next 1 to 2 decades and decline to 50 to 85%
below 2000 levels by 2050 (or 40 to 70% compared to 1990 levels), and
in some cases exhibit negative emissions before the end of the century
(den Elzen et al., 2007, 2010; IPCC, 2007b; van Vuuren et al. 2012). Very
few integrated assessment model-based scenarios in the literature
demonstrate the feasibility of limiting warming to a maximum of 1.5°C
with at least 50% likelihood (Rogelj et al., 2012); most 1.5°C scenarios
have been based on stylized emissions pathways (Hare et al.., 2010;

1084
Chapter 19 Emergent Risks and Key Vulnerabilities
19
R
anger et al., 2012). The highest emission reduction rate considered in
most integrated modeling studies that attempt to minimize mitigation
cost is typically between 3 and 4% but with larger values not ruled out
although some studies find that for an additional cost higher rates may
be achievable (den Elzen et al., 2010; O’Neill et al., 2010).
However, most studies of feasibility include a number of idealized
assumptions, including availability of a wide range of mitigation
technologies such as carbon capture and storage (CCS) and large-scale
renewable and biomass energy. Most also assume universal participation
in mitigation efforts beginning immediately, economically optimal
reductions (i.e., reductions are made wherever they are cheapest), and no
constraints on policy implementation. Any deviation from these idealized
assumptions can significantly limit feasible mitigation reductions (Knopf
et al., 2010; Rogelj et al., 2012). For example, delayed participation
in reductions by non-Organisation for Economic Co-operation and
Development (OECD) countries made concentration limits such as not
exceeding 450 ppm CO
2
-eq (roughly consistent with a 50% chance of
remaining below 2°C relative to preindustrial), and in some cases even
550 ppm CO
2
-eq, unachievable in some models unless temporary
overshoot of these targets (Izrael and Semenov, 2006) were allowed
(Clarke et al., 2009), but not in others (Waldhoff and Fawcett, 2011).
Technology limits, such as unavailability of CCS or limited expansion of
renewables or biomass, makes stabilization at 450 ppm CO
2
-eq (or 2°C
with a 50% chance) unachievable in some models (Krey and Riahi, 2009;
van Vliet et al., 2012). Similarly, if the political will to implement
coordinated mitigation policies within or across a large number of
countries were limited, peak emissions and subsequent reductions
would be delayed (Webster, 2008).
These considerations have led some analysts to doubt the plausibility
of limiting warming to 2°C (Anderson and Bows, 2008, 2011; Tol, 2009).
“Emergency mitigation” options have also been considered that would
go beyond the measures considered in most mitigation analyses (Swart
and Marinova, 2010). These include drastic emissions reductions achieved
through limits on energy consumption (Anderson and Bows, 2011) or
geoengineering through management of the Earth’s radiation budget
(Section 19.5.4; WGI AR5 Chapters 6, 7).
19.7.3. Avoiding Thresholds, Irreversible Change, and
Large-Scale Singularities in the Earth System
Section 19.6.3.6 discussed the RFC related to nonlinear changes in the
Earth system (“large-scale singular events”), whereby anthropogenic
forcings might cause irreversible and potentially rapid transitions over
a wide range of time scales (see Section 19.6.3; WGI AR5 SPM, TS, TFE.5,
Section 12.5; Lenton et al., 2008). The risk of triggering such transitions
generally increases with increasing anthropogenic climate forcings/
climate change (Lenton et al., 2008; Kriegler et al., 2009; Levermann et
al., 2012). Reducing GHG emissions is projected to reduce the risks of
triggering such transitions (medium confidence). Adaptation could reduce
their potential consequences, but the efficacy of adaptation might be
limited, for example for rapid transitions (Section 19.7.5).
Several studies have sought to identify levels of atmospheric GHG
concentrations or global average temperature change that would limit
t
he risks of triggering these transitions (e.g., Keller et al., 2005, 2008;
Lenton et al., 2008; Kriegler et al., 2009). Section 19.6.3.6 assesses
evidence regarding the relationship between global average temperature
and risks of disintegration of major ice sheets, loss of Arctic sea ice,
shutdown of the AMOC, carbon releases from temperature-related
feedback processes, and regime shifts in ecosystems. Additional aspects
of these risks are important to mitigation strategies. For example, it is
important to distinguish between triggering and experiencing a
threshold response because model simulations suggest that there can be
sizable delays between the two (e.g., Lenton et al., 2008). The location
of these trigger points can be difficult to determine from process-based
models alone, as some of these models lack potentially important
processes (see e.g., WGI AR5 Chapter 13).
In this situation, expert elicitations can provide additional useful
information for risk assessments. One such assessment based on
expert elicitation (Lenton et al., 2008) finds that limiting global mean
temperature increase to approximately 3°C above recent (1980–1999)
values would considerably reduce the risks of triggering some nonlinear
responses. In general, there is low confidence in the location of such
temperature limits owing to disagreements among experts. Estimates of
such temperature limits can change over time (Oppenheimer et al., 2008)
and may be subject to overconfidence that can introduce a downward
bias in risk estimates of low-probability events (Morgan and Henrion,
1990). The climate threshold responses can interact (e.g., Kriegler et al.,
2009). Other climate change metrics (e.g., rates of changes or atmospheric
CO
2
concentrations) can also be important in the consideration of
response strategies aimed at reducing the risk of crossing thresholds
(McAlpine et al., 2010; Lenton, 2011a).
Several analyses have performed risk- and decision-analyses for specific
thresholds, mostly focusing on a persistent weakening or collapse of the
AMOC (Zickfeld and Bruckner, 2008; Urban and Keller, 2010; Bahn et
al., 2011; McInerney et al., 2012). Experiencing AMOC collapse has been
assessed as very unlikely in this century and there is low confidence in
assessing the AMOC beyond the 21st century (WGI AR5 SPM). However,
owing to lags in the ocean system, the probability of triggering an
eventual collapse differs from that of experiencing such an outcome
(Urban and Keller, 2010). A probabilistic analysis sampling a subset of
the relevant uncertainties concluded that reducing the probability of a
collapse within the next few centuries to one in ten requires emissions
reductions of roughly 60% relative to a business-as-usual strategy by
2050 (McInerney and Keller, 2008). Bruckner and Zickfeld (2009) show
that, under their worst-case assumptions about key parameter values,
emissions mitigation would need to begin within the next 2 decades to
avoid reducing the overturning rate by more than 50%.
Threshold risk estimates and evaluations of risk-management strategies
are sensitive to factors such as the representation of uncertainties and
the decision-making frameworks used (Polasky et al., 2011; McInerney
et al., 2012). Several analyses have examined how the consideration of
threshold events affects response strategies. For example, the design of
risk-management strategies could be informed by observation and
projection systems that would provide an actionable early warning
signal of an approaching threshold response. Learning about key
uncertain parameters (e.g., climate sensitivity or impacts of a threshold
response) can considerably affect risk-management strategies and have

1085
Emergent Risks and Key Vulnerabilities Chapter 19
19
a
sizable economic value of information (Keller et al., 2004; Lorenz et
al., 2012). However, there is limited evidence about the feasibility and
requirements for such systems owing to the small number of studies
and their focus on highly simplified situations (Keller and McInerney,
2008; Lenton, 2011b; Lorenz et al., 2012). In some decision-analytic
frameworks, knowing that a threshold has been crossed can lead to
reductions in emissions mitigation and a shift of resources toward
adaptation and/or geoengineering (Keller et al., 2004; Guillerminet and
Tol, 2008; Swart and Marinova, 2010; Lenton, 2011b).
19.7.4. Avoiding Tipping Points
in Social/Ecological Systems
Tipping points (see Glossary) in socio-ecological systems are defined as
thresholds beyond which impacts increase nonlinearly to the detriment
of both human and natural systems. These can be initiated rapidly,
inducing a need for rapid response. For example, regime shifts have
already occurred in marine food webs (Byrnes et al., 2007; Green et
al., 2008; Alheit, 2009; Section 6.3.6) due to (observed) changes in sea
surface temperature, changes in salinity, natural climate variability,
and/or overfishing.
Because human and ecological systems are linked by the services that
ecosystems provide to society (McLeod and Leslie, 2009; Lubchenco and
Petes, 2010), tipping points may be crossed when either the ecosystem
services are disrupted and/or social/economic networks are disrupted
(Renaud et al., 2010). Climate change provides a stress that increases
the risk that tipping points will be crossed, although they may be
crossed due to other types of stresses even in the absence of climate
change. For example, in dryland ecosystems, overgrazing has caused
grassland-to-desert transitions (Pimm, 2009).
The likelihood of crossing tipping points due to climate change may be
reduced by preserving ecosystem services through (1) limiting the level
and rate of climate change (medium confidence) and/or (2) removing
concomitant stresses such as overgrazing, fishing, habitat destruction,
and pollution. Most literature currently focuses on strategy (2), and
there is limited information about the exact levels and rates of climate
change that specific coupled socioeconomic systems can withstand.
Examples of strategy (2) include maintaining resilience of coral reefs
and cephalopod or piscivorous seabird populations by removal of
concomitant stress from fishing (Andre et al., 2010; Anthony et al., 2011;
see also Sections 6.3.6, 30.6.2) or expanding protected area networks
(Brodie et al., 2012). Removal of concomitant stress such as nutrient
loading can reduce the chance of a regime shift (Jurgensone et al., 2011)
in coral reef ecosystems (De’ath et al., 2012). Sometimes management
can reverse the crossing of a tipping point, for example, by adding
sediment to a submerged salt marsh (Stagg and Mendelssohn, 2010).
Strategy (2) is enhanced by resilience-based management approaches
in ecosystems (Walker and Salt, 2006; Lubchenco and Petes, 2010; Allen
et al., 2011; Selig et al., 2012). A high level of biodiversity increases
ecosystem resilience and can enable recovery after crossing a tipping
point (Brierley and Kingsford, 2009; Lubchenco and Petes, 2010).
Strategy (2) generally becomes ineffective once climate changes beyond
an uncertain and spatially variable threshold; also successive thresholds
may be crossed as stress increases (Renaud et al., 2010).
M
onitoring that aims to detect a slowdown in the recovery of systems
from small changes (van Nes and Scheffer, 2005) or to measure an
appropriate indicator (Biggs et al., 2008) may give warning that a system
is a approaching a regime shift, justifying intervention of type (2) (Guttal
and Jayaprakash, 2009; Brock and Carpenter, 2010). Such indicators
have been identified for the desertification process in the Mediterranean
(Kéfi et al., 2007) and for landscape fire dynamics (Zinck et al., 2011;
McKenzie and Kennedy, 2012).
19.7.5. Limits to Adaptation
Sections 16.2 and 16.4 provide a thorough assessment of the literature
on limits to adaptation. Discussions are beginning on the nature of such
limits, for example, in terms of different dimensions of the limits to
adaptation, including financial or economic limits to adapt, but also
social and political or cognitive limits of adaptation. Limits to adaptation
(see, e.g., Adger et al., 2009) are also recognized in terms of specific
geographies, for example, SIDS and their limited ability to adapt to
increasing impacts of sea level rise, the limits to adaptation of urban
agglomerations and urban dwellers in low-lying coastal zones (see,
e.g., Birkmann et al., 2010), or in relation to loss of water supplies as a
result of glacier retreat (Orlove, 2009). Overall, the concept of limits to
adaptation is closely related to key vulnerabilities and key risks including
those identified in Table 19-4 and Box CC-KR, because this concept
helps define residual risk.
References
Abbott, P. and A. Borot de Battisti, 2011: Recent global food price shocks: causes,
consequences and lessons for African governments and donors. Journal of
African Economies, 20(Suppl. 1), i12-i62.
Abrol, D.P., 2012: Decline in pollinators. In: Pollination Biology: Biodiversity
Conservation and Agricultural Production [Abrol, D.P. (ed.)]. Springer Science,
Dordrecht, Netherlands, pp. 545-601.
Ackerman, F. and J. Fisher, 2013: Is there a water-energy nexus in electricity generation?
Long-term scenarios for the western United States. Energy Policy, 59, 235-241.
Ackerman, F. and E.A. Stanton, 2012: Climate risks and carbon prices: revising the
social cost of carbon. Economics: The Open-Access, Open Assessment E-Journal,
6, 2012-10, doi:10.5018/economics-ejournal.ja.2012-10.
Ackerman, F., E.A. Stanton, and R. Bueno, 2010: Fat tails, exponents, extreme uncertainty:
simulating catastrophe in DICE. Ecological Economics, 69(8), 1657-1665.
Adam, C. and O. Ajakaiye, 2011: Causes, consequences and policy implications of
global food price shocks: introduction and overview. Journal of African
Economies, 20(Suppl. 1), i3-i11.
Adams, H.D., M. Guardiola-Claramonte, G.A. Barron-Gafford, J.C. Villegas, D.D.
Breshears, C.B. Zou, P.A. Troch, and T.E. Huxman, 2009: Temperature sensitivity
of drought-induced tree mortality portends increased regional die-off under
global-change-type drought. Proceedings of the National Academy of Sciences
of the United States of America, 106(17), 7063-7066.
Adger, W.N., 2006: Vulnerability. Global Environmental Change, 16(3), 268-281.
Adger, W.N., N.W. Arnell, and E.L. Tompkins, 2005: Successful adaptation to climate
change across scales. Global Environmental Change, 15(2), 77-86.
Adger, W.N., S. Dessai, M. Goulden, M. Hulme, I. Lorenzoni, D. Nelson, L. Naess, J.
Wolf, and A. Wreford, 2009: Are there social limits to adaptation to climate
change? Climatic Change, 93(3), 335-354.
Ahmed, S.A., N.S. Diffenbaugh, and T.W. Hertel, 2009: Climate volatility deepens
poverty vulnerability in developing countries. Environmental Research Letters,
4(3), 034004, doi:10.1088/1748-9326/4/3/034004.
Ahrens, J. and P.M. Rudolph, 2006: The importance of governance in risk reduction
and disaster management. Journal of Contingencies and Crisis Management,
14(4), 207-220.

1086
Chapter 19 Emergent Risks and Key Vulnerabilities
19
Alheit, J., 2009: Consequences of regime shifts for marine food webs. International
Journal of Earth Sciences, 98(2), 261-268.
Allen, C.R., G.S. Cumming, A.S. Garmestani, P.D. Taylor, and B.H. Walker, 2011:
Managing for resilience. Wildlife Biology, 17, 337-349.
Allesina, S., A. Bodini, and M. Pascual, 2009: Functional links and robustness in food
webs. Philosophical Transactions of the Royal Society B, 364(1524), 1701-1709.
Amstrup, S.C., E.T. DeWeaver, D.C. Douglas, B.G. Marcot, G.M. Durner, C.M. Bitz, and
D.A. Bailey, 2010: Greenhouse gas mitigation can reduce sea-ice loss and
increase polar bear persistence. Nature, 468(7326), 955-958.
Anderson, K. and A. Bows, 2008: Reframing the climate change challenge in light of
post-2000 emission trends. Philosophical Transactions of the Royal Society A,
366(1882), 3863-3882.
Anderson, K. and A. Bows, 2011: Beyond ‘dangerous’ climate change: emission
scenarios for a new world. Philosophical Transactions of the Royal Society A,
369(1934), 20-44.
Anderson-Teixeira, K.J. and E.H. DeLucia, 2011: The greenhouse gas value of
ecosystems. Global Change Biology, 17(1), 425-438.
Andre, J., M. Haddon, and G.T. Pecl, 2010: Modelling climate-change-induced nonlinear
thresholds in cephalopod population dynamics. Global Change Biology, 16(10),
2866-2875.
Anthoff, D. and R.S.J. Tol, 2010: On international equity weights and national decision
making on climate change. Journal of Environmental Economics and Management,
60(1), 14-20.
Anthoff, D., R. Nicholls, and R.S.J. Tol, 2010: The economic impact of substantial sea-
level rise. Mitigation and Adaptation Strategies for Global Change, 15(4), 321-335.
Anthony, K., J.A. Maynard, G. Diaz-Pulido, P.J. Mumby, P.A. Marshall, L. Cao, and O.
Hoegh-Guldberg, 2011: Ocean acidification and warming will lower coral reef
resilience. Global Change Biology, 17(5), 1798-1808.
Aragón, P. and J.M. Lobo, 2012: Predicted effect of climate change on the invasibility
and distribution of the Western corn root-worm. Agricultural and Forest
Entomology, 14(1), 13-18.
Archer, D., M. Eby, V. Brovkin, A. Ridgwell, L. Cao, U. Mikolajewicz, K. Caldeira, K.
Matsumoto, G. Munhoven, and A. Montenegro, 2009: Atmospheric lifetime of fossil
fuel carbon dioxide. Annual Review of Earth and Planetary Sciences, 37, 117-134.
Arnell, N.W., 2011: Uncertainty in the relationship between climate forcing and
hydrological response in UK catchments. Hydrology and Earth System Sciences,
15, 897-912.
Arnell, N.W., J. Lowe, S. Brown, S. Gosling, P. Gottschalk, J. Hinkel, B. Lloyd-Hughes,
R. Nicholls, T. Osborn, and T.M. Osborne, 2013: A global assessment of the effects
of climate policy on the impacts of climate change. Nature Climate Change, 3,
512-519.
Atzl, A. and S. Keller, 2013: A systemic approach for the analysis of infrastructure-
specific social vulnerability. In: From Social Vulnerability to Resilience: Measuring
Progress towards Disaster Risk Reduction [Cutter, S.L. and C. Corendea (eds.)].
SOURCE No. 17, United Nations University Institute for Environment and
Human Security (UNU-EHS), Bonn, Germany, pp. 27-43.
Bahn, O., N.R. Edwards, R. Knutti, and T.F. Stocker, 2011: Energy policies avoiding a
tipping point in the climate system. Energy Policy, 39(1), 334-348.
Bala, G., P.B. Duffy, and K.E. Taylor, 2008: Impact of geoengineering schemes on the
global hydrological cycle. Proceedings of the National Academy of Sciences of
the United States of America, 105(22), 7664-7669.
Bálint, M., S. Domisch, C. Engelhardt, P. Haase, S. Lehrian, J. Sauer, K. Theissinger, S.
Pauls, and C. Nowak, 2011: Cryptic biodiversity loss linked to global climate
change. Nature Climate Change, 1(6), 313-318.
Balmford, A., J. Kroshko, N. Leader-Williams, and G. Mason, 2011: Zoos and captive
breeding. Science, 332(6034), 1149-1150.
Barnett, J. and W.N. Adger, 2007: Climate change, human security and violent conflict.
Political Geography, 26(6), 639-655.
Barney, J.N. and J.M. Ditomaso, 2008: Nonnative species and bioenergy: are we
cultivating the next invader? BioScience, 58(1), 64-70.
Barnosky, A.D., E.A. Hadly, J. Bascompte, E.L. Berlow, J.H. Brown, M. Fortelius, W.M.
Getz, J. Harte, A. Hastings, and P.A. Marquet, 2012: Approaching a state shift
in Earth’s biosphere. Nature, 486(7401), 52-58.
Barr K.J., B.A. Babcock, M.A. Carriquiry, A.M. Nassar, L. Harfuch, 2011: Agricultural
Land Elasticities in the United States and Brazil. Applied Economic Perspectives
and Policy, 33 (3), 449-462.
Bartlett, S., 2008: Climate change and urban children: impacts and implications for
adaptation in low- and middle-income countries. Environment and Urbanization,
20(2), 501-519.
Beale, C.M., J.J. Lennon, and A. Gimona, 2008: Opening the climate envelope reveals
no macroscale associations with climate in European birds. Proceedings of the
National Academy of Sciences of the United States of America, 105(39), 14908-
14912.
Beaumont, L.J., A. Pitman, S. Perkins, N.E. Zimmermann, N.G. Yoccoz, and W. Thuiller,
2011: Impacts of climate change on the world’s most exceptional ecoregions.
Proceedings of the National Academy of Sciences of the United States of
America, 108(6), 2306-2311.
Beck, M.W., B. Gilmer, Z. Ferdaña, G.T. Raber, C.C. Shepard, I. Meliane, J.D. Stone,
A.W. Whelchel, M. Hoover, and S. Newkirk, 2013: Increasing the resilience of
human and natural communities to coastal hazards: supporting decisions in
New York and Connecticut. In:The Role of Ecosystems in Disaster Risk Reduction
[Renaud, F.G., K. Sudmeier-Rieux, and M. Estrella (eds.)]. United Nations
University Press, Tokyo, Japan, pp. 140-163.
Bedford, F.E., R.J. Whittaker, and J.T. Kerr, 2012: Systemic range shift lags among a
pollinator species assemblage following rapid climate change. Botany, 90(7),
587-597.
Bellard, C., C. Bertelsmeier, P. Leadley, W. Thuiller, and F. Courchamp, 2012: Impacts
of climate change on the future of biodiversity. Ecology Letters, 15(4), 365-
377.
Benayas, J.M.R., A.C. Newton, A. Diaz, and J.M. Bullock, 2009: Enhancement of
biodiversity and ecosystem services by ecological restoration: a meta-analysis.
Science, 325(5944), 1121-1124.
Bernauer, T., T. Böhmelt, and V. Koubi, 2012: Environmental changes and violent
conflict. Environmental Research Letters, 7(1), 015601, doi:10.1088/1748-
9326/7/1/015601.
Berry, P., M. Rounsevell, P. Harrison, and E. Audsley, 2006: Assessing the vulnerability
of agricultural land use and species to climate change and the role of policy in
facilitating adaptation. Environmental Science & Policy, 9(2), 189-204.
Betts, R. A., N.W. Arnell, P. Boorman, S.E. Cornell, J.I. House, N.R. Kaye, M.P. McCarthy,
D. McNeall, M.G. Sanderson, and A.J. Wiltshire, 2012: Climate change impacts
and adaptation: an Earth system view. In: Understanding the Earth System:
Global Change Science for Application [Cornell, S.E., I.C. Prentice, J.I. House,
and C. J. Downy (eds.)]. Cambridge University Press, Cambridge, UK and New
York, NY, USA, pp. 160-201.
Biggs, R., H. Simons, M. Bakkenes, R.J. Scholes, B. Eickhout, D. van Vuuren, and R.
Alkemade, 2008: Scenarios of biodiversity loss in southern Africa in the 21
st
century. Global Environmental Change, 18(2), 296-309.
Birkmann, J., 2006a: Measuring Vulnerability to Natural Hazards: Towards Disaster
Resilient Societies. United Nations University Press, Tokyo, Japan, 524 pp.
Birkmann, J., 2006b: Measuring vulnerability to promote disaster-resilient societies:
Conceptual frameworks and definitions. In: Measuring Vulnerability to Natural
Hazards.Towards Disaster Resilient Societies [Birkmann, J. (ed.)]. United Nations
University Press, Tokyo, Japan, pp. 9-54.
Birkmann, J., 2011: First- and second-order adaptation to natural hazards and extreme
events in the context of climate change. Natural Hazards, 58(2), 811-840.
Birkmann, J. (ed.), 2013: Measuring Vulnerability to Natural Hazards: Towards
Disaster Resilient Societies. 2
nd
edn., United Nations University Press, Tokyo,
Japan, 686 pp.
Birkmann, J. and N. Fernando, 2008: Measuring revealed and emergent vulnerabilities
of coastal communities to tsunami in Sri Lanka. Disasters, 32(1), 82-105.
Birkmann, J., M. Garschagen, F. Kraas, and N. Quang, 2010: Adaptive urban governance:
new challenges for the second generation of urban adaptation strategies to
climate change. Sustainability Science, 5(2), 185-206.
Birkmann, J., D.C. Seng, and D. Suarez, 2011a: Adaptive Disaster Risk Reduction
Enhancing Methods and Tools of Disaster Risk Reduction in the Light of Climate
Change [German Committee for Disaster Reduction (ed.)]. DKKV Publication
Series 43, German Committee for Disaster Reduction (DKKV), Bonn, Germany,
51 pp.
Birkmann, J., T. Welle, D. Krause, J. Wolfertz, D.-C. Suarez, and N.Setiadi, 2011b:
Governance and civil society. In: WorldRiskReport 2011 [Bündnis Entwicklung
Hilft (ed.)]. Bündnis Entwicklung Hilft (Alliance Development Works) in
cooperation with the United Nations University Institute for Environment and
Human Security (UNU-EHS) that prepared the WorldRiskIndex, Bündnis
Entwicklung Hilft, Berlin, Germany, pp. 13-42.
Birkmann, J., O. Cardona, M. Carreño, A. Barbat, M. Pelling, S. Schneiderbauer, S.
Kienberger, M. Keiler, D. Alexander, and P. Zeil, 2013a: Framing vulnerability,
risk and societal responses: the MOVE framework. Natural Hazards, 67(2), 193-
211.

1087
Emergent Risks and Key Vulnerabilities Chapter 19
19
Birkmann, J., S.L Cutter, D.S. Rothman, T. Welle, M. Garschagen, B. van Ruijven, B.C.
O’Neill, B.L. Preston, S. Kienberger, O.D. Cardona, T. Siagian, D. Hidayati, N.
Setiadi, C.R. Binder, B. Hughes, and R. Pulwarty, 2013b: Scenarios for vulnerability:
opportunities and constraints in the context of climate change and disaster
risk. Climatic Change, published online 9 November 2013, doi:10.1007/s10584-
013-0913-2.
Black, R.E., L.H. Allen, Z.A. Bhutta, L.E. Caulfield, M. De Onis, M. Ezzati, C. Mathers,
and J. Rivera, 2008: Maternal and child undernutrition: global and regional
exposures and health consequences. The Lancet, 371(9608), 243-260.
Blaikie, P., T. Cannon, I. Davis, and B. Wisner, 1994: At Risk:Natural Hazards, People’s
Vulnerability, and Disasters. Routledge, Abingdon, UK and New York, NY, USA,
284 pp.
Blaikie, P., T. Cannon, I. David, and B. Wisner, 1996: Vulnerabilidad: El Entorno Social,
Político y Económico de los Desastres.LA RED: Red de Estudios Sociales en
Prevención de Desastres en América Latina Desastres, Tercer Mundo Editores,
Bogotá, Colombia, 374 pp.
Bohle, H.-G., 2001: Vulnerability and criticality: perspectives from social geography.
IHDP Update 2/2001, Newsletter of the International Human Dimensions
Programme on Global Environmental Change, 1-7.
Bohle, H.-G., T.E. Downing, and M.J. Watts, 1994: Climate change and social vulnerability:
toward a sociology and geography of food insecurity. Global Environmental
Change, 4(1), 37-48.
Bolch, T., A. Kulkarni, A. Kääb, C. Huggel, F. Paul, J. Cogley, H. Frey, J. Kargel, K. Fujita,
and M. Scheel, 2012: The state and fate of Himalayan glaciers. Science,
336(6079), 310-314.
Bosello, F., C. Carraro, and E.D. Cian, 2010: Climate Policy and the Optimal Balance
between Mitigation, Adaptation and Unavoided Damage. Note di Lavoro
32.2010, Sustainable Development Series, Fondazione Eni Enrico Mattei, Milan,
Italy, 28 pp.
Bosello, F., F. Eboli, and R. Pierfederici, 2012a: Assessing the Economic Impacts of
Climate Change – An Updated CGE Point of View. Note di Lavoro 2.2012, Climate
Change and Sustainable Development Series, Fondazione Eni Enrico Mattei,
Milan, Italy, 26 pp.
Bosello, F., R. Nicholls, J. Richards, R. Roson, and R.S.J. Tol, 2012b: Economic impacts
of climate change in Europe: sea-level rise. Climatic Change, 112(1), 63-81.
Bouchama, A. and J.P. Knochel, 2002: Heat stroke. New England Journal of Medicine,
346(25), 1978-1988.
Bouwer, L.M., R.P. Crompton, E. Faust, P. Höppe, and R.A. Pielke Jr., 2007: Confronting
disaster losses. Science, 318(5851), 753.
Bouwer, L.M., P. Bubeck, and J.C.J.H. Aerts, 2010: Changes in future flood risk due
to climate and development in a Dutch polder area. Global Environmental
Change, 20(3), 463-471.
Bradley, B.A., D.M. Blumenthal, D.S. Wilcove, and L.H. Ziska, 2010: Predicting plant
invasions in an era of global change. Trends in Ecology & Evolution, 25(5), 310-
318.
Breton, M.-C., M. Garneau, I. Fortier, F. Guay, and J. Louis, 2006: Relationship between
climate, pollen concentrations of Ambrosia and medical consultations for allergic
rhinitis in Montreal, 1994-2002. Science of the Total Environment, 370(1), 39-50.
Brierley, A.S. and M.J. Kingsford, 2009: Impacts of climate change on marine organisms
and ecosystems. Current Biology, 19(14), R602-R614.
Bringezu, S., H. Schütz, M. O’Brien, L. Kauppi, R.W. Howarth, and J. McNeely, 2009:
Towards Sustainable Production and Use of Resources: Assessing Biofuels.
Produced by the International Panel for Sustainable Resource Management,
United Nations Environment Programme (UNEP), Paris, France, 118 pp.
Brisson, N., P. Gate, D. Gouache, G. Charmet, F. Oury, and F. Huard, 2010: Why are
wheat yields stagnating in Europe? A comprehensive data analysis for France.
Field Crops Research, 119(1), 201-212.
Brito, D., 2008: Amphibian conservation: are we on the right track? Biological
Conservation, 141(11), 2912-2917.
Brock, W.A. and S.R. Carpenter, 2010: Interacting regime shifts in ecosystems:
implication for early warnings. Ecological Monographs, 80(3), 353-367.
Brodie, J., E. Post, and W.F. Laurance, 2012: Climate change and tropical biodiversity:
a new focus. Trends in Ecology & Evolution, 27(3), 145-150.
Bruckner, T. and K. Zickfeld, 2009: Emissions corridors for reducing the risk of a
collapse of the Atlantic thermohaline circulation. Mitigation and Adaptation
Strategies for Global Change, 14(1), 61-83.
Brzoska, M., P.M. Link, A. Maas, and J. Scheffran (eds.), 2012: Editorial. Geoengineering:
an issue for peace and security studies? Sicherheit & Frieden / Security & Peace,
30(4 SI), IV.
Budyko, M.I. and D.H. Miller, 1974: Climate and Life. Vol. 18 of the International
Geophysics Series, Academic Press, Inc., London, UK, 508 pp.
Buhaug, H., 2010: Climate not to blame for African civil wars. Proceedings of the
National Academy of Sciences of the United States of America, 107(38), 16477-
16482.
Burke, M. and D. Lobell, 2010: Climate effects on food security: an overview. In:
Climate Change and Food Security: Adapting Agriculture to a Warmer World
[Lobell, D. and M. Burke (eds.)]. Springer, New York, pp. 199.
Burke, M.B., E. Miguel, S. Satyanath, J.A. Dykema, and D.B. Lobell, 2009: Warming
increases the risk of civil war in Africa. Proceedings of the National Academy
of Sciences of the United States of America, 106(49), 20670-20674.
Burney, J.A., S.J. Davis, and D.B. Lobell, 2010: Greenhouse gas mitigation by agricultural
intensification. Proceedings of the National Academy of Sciences of the United
States of America, 107(26), 12052-12057.
Burton, I., J. Wilson, and R.E. Munn, 1983: Environmental impact assessment:
national approaches and international needs. Environmental Monitoring and
Assessment, 3(2), 133-150.
Burton, I., R.W. Kates, and G.F. White, 1993: The Environment as Hazard. Guilford
Press, New York, NY, USA, 290 pp.
Byrnes, J.E., P.L. Reynolds, and J.J. Stachowicz, 2007: Invasions and extinctions
reshape coastal marine food webs. PLOS ONE, 3, e295, doi:10.1371/journal.
pone.0000295.
Campbell, J., D. Lobell, and C. Field, 2009: Greater transportation energy and GHG
offsets from bioelectricity than ethanol. Science, 324(5930), 1055-1057.
Canadell, J.G. and M.R. Raupach, 2008: Managing forests for climate change
mitigation. Science, 320(5882), 1456-1457.
Cançado, J.E.D., P.H.N. Saldiva, L.A.A. Pereira, L.B.L.S. Lara, P. Artaxo, L.A. Martinello,
M.A. Arbex, A. Zanobetti, and A.L.F. Braga, 2006: The impact of sugar cane-
burning emissions on the respiratory system of children and the elderly.
Environmental Health Perspectives, 114(5), 725-729.
Cannon, T., 1994: Vulnerability analysis and the explanation of ‘natural’ disasters. In:
Disasters, Development and Environment [Varley, A. (ed.)]. John Wiley & Sons,
Chichester, UK, pp. 13-29.
Cannon, T., 2006: Vulnerability analysis, livelihoods and disasters. In: Coping with Risks
Due to Natural Hazards in the 21
st
Century [Ammann, W.J., S. Dannenmann,
and L. Vulliet (eds.)]. Taylor and Francis/Balkema, Leiden, Netherlands, pp. 41-49.
Cardinale, B.J., J.E. Duffy, A. Gonzalez, D.U. Hooper, C. Perrings, P. Venail, A. Narwani,
G.M. Mace, D. Tilman, D.A. Wardle, A.P. Kinzig, G.C. Daily, M. Loreau, J.B. Grace,
A. Larigauderie, D.S. Srivastava, and S. Naeem, 2012: Biodiversity loss and its
impact on humanity. Nature, 486, 59-67.
Cardona, O.D., 1986: Estudios de vulnerabilidad y evaluación del riesgo sísmico:
planificación física y urbana en áreas propensas. Boletín Técnico de la
Asociación Colombiana de Ingeniería Sismica, 33(2), 32-65.
Cardona, O.D., 1990: Terminología de Uso Común en Manejo de Riesgos. AGID Reporte
No. 13, Escuela de Administración, Finanzas, y Tecnología, Medellín, Colombia.
Cardona, O.D., 2006: A system of indicators for disaster risk management in the
Americas. In: Measuring Vulnerability to Hazards of Natural Origin: Towards
Disaster Resilient Societies [Birkmann, J. (ed.)]. United Nations University Press,
Tokyo, Japan, pp. 189-209.
Cardona, O.D., 2008: Indicators of Disaster Risk and Risk Management: Program for
Latin America and the Caribbean – Summary Report – Second Edition. INE-08-
002, Infrastructure and Environment Sector, Inter-American Development Bank,
Washington, DC, USA, 44 pp.
Cardona, O.D., 2010: Indicators of Disaster Risk and Risk Management – Program
for Latin America and the Caribbean: Summary Report. Evaluación de Riesgos
Naturales – Latino America, ERN-AL, Environment, Rural Development and
Disaster Risk Management Division (INE/RND), Technical Notes No. IDB-TN-
169, Inter-American Development Bank, Washington, DC, USA, 37 pp.
Cardona, O.D., 2011: Disaster risk and vulnerability: concepts and measurement of
human and environmental insecurity. In: Coping with Global Environmental
Change, Disasters and Security [Brauch, H.G., Ú. Oswald Spring, C. Mesjasz, J.
Grin, P. Kameri-Mbote, B. Chourou, P. Dunay, and J. Birkmann, eds.)]. Springer,
Berlin Heidelberg, pp. 107-121.
Cardona, O.D., M.K. van Aalst, J. Birkmann, M. Fordham, G. McGregor, R. Perez, R.S.
Pulwarty, E.L.F. Schipper, and B.T. Sinh, 2012: Determinants of risk: exposure
and vulnerability. In: Managing the Risks of Extreme Events and Disasters to
Advance Climate Change Adaptation. A Special Report of Working Groups I
and II of the Intergovernmental Panel on Climate Change [Field, C.B., V. Barros,
T.F. Stocker, D. Qin, D.J. Dokken, K.L. Ebi, M.D. Mastrandrea, K.J. Mach, G.-K.

1088
Chapter 19 Emergent Risks and Key Vulnerabilities
19
Plattner, S.K. Allen, M. Tignor, and P.M. Midgley (eds.)]. Cambridge University
Press, Cambridge, UK and New York, NY, USA, pp. 65-108.
Chakraborty, S. and A.C. Newton, 2011: Climate change, plant diseases and food
security: an overview. Plant Pathology, 60(1), 2-14.
Chandy, L. and G. Gertz, 2011: Poverty in Numbers: The Changing State of Global
Poverty from 2005 to 2015. Policy Brief 2011-01, The Brookings Institution,
Washington, DC, USA, 23 pp.
Chen, C., B. McCarl, and C. Chang, 2012: Climate change, sea level rise and rice:
global market implications. Climatic Change, 110(3), 543-560.
Chenoweth, J., P. Hadjinicolaou, A. Bruggeman, J. Lelieveld, Z. Levin, M.A. Lange, E.
Xoplaki, and M. Hadjikakou, 2011: Impact of climate change on the water
resources of the eastern Mediterranean and Middle East region: modeled 21
st
century changes and implications. Water Resources Research, 47(6), W06506,
doi:10.1029/2010WR010269.
Cherubini, F. and S. Ulgiati, 2010: Crop residues as raw materials for biorefinery
systems –a LCA case study. Applied Energy, 87(1), 47-57.
Cherubini, F., N.D. Bird, A. Cowie, G. Jungmeier, B. Schlamadinger, and S. Woess-
Gallasch, 2009: Energy- and greenhouse gas-based LCA of biofuel and
bioenergy systems: key issues, ranges and recommendations. Resources,
Conservation and Recycling, 53(8), 434-447.
Cheung, W.W.L., V.W.Y. Lam, J.L. Sarmiento, K. Kearney, R. Watson, and D. Pauly, 2009:
Projecting global marine biodiversity impacts under climate change scenarios.
Fish and Fisheries, 10(3), 235-251.
Cheung, W.W.L., J.L. Sarmiento, J. Dunne, T.L. Frölicher, V.W. Lam, M.D. Palomares, R.
Watson, and D. Pauly, 2013: Shrinking of fishes exacerbates impacts of global
ocean changes on marine ecosystems. Nature Climate Change, 3(5), 254-258.
Chivian, E. and A. Bernstein, 2008: Sustaining Life: How Human Health Depends on
Biodiversity. Oxford University Press, New York, NY, USA, 542 pp.
Ciscar, J.C., A. Iglesias, L. Feyen, L. Szabó, D. Van Regemorter, B. Amelung, R. Nicholls,
P. Watkiss, O.B. Christensen, R. Dankers, L. Garrote, C.M. Goodess, A. Hunt, A.
Moreno, J. Richards, and A. Soria, 2011: Physical and economic consequences
of climate change in Europe. Proceedings of the National Academy of Sciences
of the United States of America, 108(7), 2678-2683.
Clarke, L., J. Edmonds, V. Krey, R. Richels, S. Rose, and M. Tavoni, 2009: International
climate policy architectures: overview of the EMF 22 international scenarios.
Energy Economics, 31(Suppl. 2), S64-S81.
Clements, D. and A. Ditommaso, 2011: Climate change and weed adaptation: can
evolution of invasive plants lead to greater range expansion than forecasted?
Weed Research, 51(3), 227-240.
Clot, B., 2003: Trends in airborne pollen: an overview of 21 years of data in Neuchâtel
(Switzerland). Aerobiologia, 19(3), 227-234.
Comfort, L., B. Wisner, S. Cutter, R. Pulwarty, K. Hewitt, A. Oliver-Smith, J. Wiener, M.
Fordham, W. Peacock, and F. Krimgold, 1999: Reframing disaster policy: the
global evolution of vulnerable communities. Global Environmental Change Part
B: Environmental Hazards, 1(1), 39-44.
Conde, D.A., N. Flesness, F. Colchero, O.R. Jones, and A. Scheuerlein, 2011: An
emerging role of zoos to conserve biodiversity. Science, 331(6023), 1390-1391.
Copeland, C., 2005: Hurricane-Damaged Drinking Water and Wastewater Facilities:
Impacts, Needs, and Response. CRS Report for Congress, RS22285, Congressional
Research Service (CRS), Library of Congress, 6 pp.
Costa, L. and J.P. Kropp, 2013: Linking components of vulnerability in theoretic
frameworks and case studies. Sustainability Science, 8(1), 1-9.
Cotrufo, M.F., M.J.I. Briones, and P. Ineson, 1998: Elevated CO
2
affects field
decomposition rate and palatability of tree leaf litter: importance of changes
in substrate quality. Soil Biology and Biochemistry, 30(12), 1565-1571.
Cox, P.M., D. Pearson, B.B. Booth, P. Friedlingstein, C. Huntingford, C.D. Jones, and
C.M. Luke, 2013: Sensitivity of tropical carbon to climate change constrained
by carbon dioxide variability. Nature, 494, 341-344.
Cressey, D., 2008: Pushing the modelling envelope. Nature News, doi:10.1038/
news.2008.1108.
Crowl, T.A., T.O. Crist, R.R. Parmenter, G. Belovsky, and A.E. Lugo, 2008: The spread
of invasive species and infectious disease as drivers of ecosystem change.
Frontiers in Ecology and the Environment, 6(5), 238-246.
Crowley, P., 2011: Interpreting ‘dangerous’ in the United Nations Framework
Convention On Climate Change and the human rights of Inuit. Regional
Environmental Change, 11(Suppl. 1), S265-S274.
Cutter, S.L. and C. Finch, 2008: Temporal and spatial changes in social vulnerability
to natural hazards. Proceedings of the National Academy of Sciences of the
United States of America, 105(7), 2301-2306.
Cutter, S.L., L. Barnes, M. Berry, C. Burton, E. Evans, E. Tate, and J. Webb, 2008: A
place-based model for understanding community resilience to natural disasters.
Global Environmental Change, 18(4), 598-606.
D’Amato, G., L. Cecchi, M. D’Amato, and G. Liccardi, 2010: Urban air pollution and
climate change as environmental risk factors of respiratory allergy: an update.
Journal of Investigative Allergology and Clinical Immunology, 20(2), 95-102.
Damialis, A., J.M. Halley, D. Gioulekas, and D. Vokou, 2007: Long-term trends in
atmospheric pollen levels in the city of Thessaloniki, Greece. Atmospheric
Environment, 41(33), 7011-7021.
Dankers, R., N.W. Arnell, D.B. Clark, P.D. Falloon, B.M. Fekete, S.N. Gosling, J. Heinke,
H. Kim, Y. Masaki, Y. Satoh, T. Stacke, W. Yoshihide, and D. Wisser, 2013: A
first look at changes in flood hazard in the Inter-Sectoral Impact Model
Intercomparison Project ensemble. Proceedings of the National Academy of
Sciences of the Unites States of America, published ahead of print 16 December
2013, doi:10.1073/pnas.1302078110.
Dasgupta, S., B. Laplante, S. Murray, and D. Wheeler, 2009: Sea-Level Rise and Storm
Surges: A Comparative Analysis of Impacts in Developing Countries. Policy
Research Working Paper No. 4901, the Environment and Energy Team,
Development Research Group, The World Bank, Washington, DC, USA, 41 pp.
Dauber, J., C. Brown, A.L. Fernando, J. Finnan, E. Krasuska, J. Ponitka, D. Styles, D.
Thrän, K.J. Van Groenigen, and M. Weih, 2012: Bioenergy from “surplus” land:
environmental and socio-economic implications. BioRisk, 7, 5-50.
de Bruin, K., R. Dellink, and R.S.J. Tol, 2009: AD-DICE: an implementation of adaptation
in the DICE model. Climatic Change, 95(1), 63-81.
de Sherbinin, A., 2014: Climate change hotspots mapping: what have we learned?
Climatic Change, 123(1), 23-37.
De’ath, G., K.E. Fabricius, H. Sweatman, and M. Puotinen, 2012: The 27-year decline of
coral cover on the Great Barrier Reef and its causes. Proceedings of the National
Academy of Sciences of the United States of America, 109(44), 17995-17999.
Dell, M., B.F. Jones, and B.A. Olken, 2012: Temperature shocks and economic
growth: evidence from the last half century. American Economic Journal:
Macroeconomics, 4(3), 66-95.
den Elzen, M.G.J. and D.P. van Vuuren, 2007: Peaking profiles for achieving long-
term temperature targets with more likelihood at lower costs. Proceedings of
the National Academy of Sciences of the United States of America, 104(46),
17931-17936.
den Elzen, M.G.J., M. Meinshausen, and D.P. van Vuuren, 2007: Multi-gas emission
envelopes to meet greenhouse gas concentration targets: costs versus certainty
of limiting temperature increase. Global Environmental Change, 17(2), 260-280.
den Elzen, M.G., D.P. van Vuuren, and J. van Vliet, 2010: Postponing emission
reductions from 2020 to 2030 increases climate risks and long-term costs.
Climatic Change, 99(1-2), 313-320.
DEFRA, 2012: UK Climate Change Risk Assessment: Government Report. UK
Department for Environment, Food and Rural Affairs (DEFRA), The Stationary
Office, London, UK, 43 pp.
Díaz, S., J. Fargione, F.S. Chapin III, and D. Tilman, 2006: Biodiversity loss threatens
human well-being. PLOS Biology, 4(8), e277, doi:10.1371/journal.pbio.0040277.
Diffenbaugh, N.S., F. Giorgi, L. Raymond, and X. Bi, 2007: Indicators of 21
st
century
socioclimatic exposure. Proceedings of the National Academy of Sciences of
the United States of America, 104(51), 20195-20198.
DiTomaso, J.M., J.N. Barney, and A.M. Fox, 2007: Biofuel Feedstocks: The Risk of
Future Invasions. All U.S. Government Documents (Utah Regional Depository),
Paper 79, CAST Commentary QTA 2007-1, Council for Agricultural Science and
Technology (CAST), Ames, IA, USA, 9 pp., digitalcommons.usu.edu/govdocs/79.
Donner, S.D. and C.J. Kucharik, 2008: Corn-based ethanol production compromises
goal of reducing nitrogen export by the Mississippi River. Proceedings of the
National Academy of Sciences of the United States of America, 105(11), 4513-
4518.
Dossena, M., G. Yvon-Durocher, J. Grey, J.M. Montoya, D.M. Perkins, M. Trimmer, and
G. Woodward, 2012: Warming alters community size structure and ecosystem
functioning. Proceedings of the Royal Society B, 279(1740), 3011-3019.
Douglas, I., 2009: Climate change, flooding and food security in south Asia. Food
Security, 1(2), 127-136.
Douglas, I., K. Alam, M. Maghenda, Y. Mcdonnell, L. McLean, and J. Campbell, 2008:
Unjust waters: climate change, flooding and the urban poor in Africa. Environment
and Urbanization, 20(1), 187-205.
Douglas, M. and A. Wildavsky, 1982: Risk and Culture: An Essay on the Selection of
Technological and Environmental Dangers. University of California Press, Berkeley,
CA, USA, 224 pp.

1089
Emergent Risks and Key Vulnerabilities Chapter 19
19
Dullinger, S., A. Gattringer, W. Thuiller, D. Moser, N.E. Zimmermann, A. Guisan, W.
Willner, C. Plutznar, M. Leitner, T. Mang, M. Caccianiga, T. Dirnboeck, S. Ertl, A.
Fischer, J. Lenior, J.-C. Svenning, A. Psomas, D.R. Schmatz, U. Silc, P. Vittoz, and
K. Huelber, 2012: Extinction debt of high-mountain plants under twenty-first
century climate change. Nature Climate Change, 2, 619-622.
Dutton, A. and K. Lambeck, 2012: Ice volume and sea level during the last interglacial.
Science, 337(6091), 216-219.
Easterling, W.E., P.K. Aggarwal, P. Batima, K.M. Brander, L. Erda, S.M. Howden, A.
Kirilenko, J. Morton, J.-F. Soussana, J. Schmidhuber, and F.N. Tubiello, 2007: Food,
fibre and forest products. In: Climate Change 2007: Impacts, Adaptation and
Vulnerability. Contributions of Working Group II to the Fourth Assessment
Report of the Intergovernmental Panel on Climate Change [Parry, M.L., O.F.
Canziani, J.P. Palutikof, P.J. van der Linden, and C.E. Hanson (eds.)]. Cambridge
University Press, Cambridge, UK and New York, NY, USA, pp. 273-313.
Edenhofer, O., B. Knopf, T. Barker, L. Baumstark, E. Bellevrat, B. Chateau, P. Criqui,
M. Isaac, A. Kitous, S. Kypreos, M. Leimbach, K. Lessmann, B. Mange, S. Scrieciu,
H. Turton, and D.P. Van Vuuren, 2010: The economics of low stabilization: model
comparison of mitigation strategies and costs. The Energy Journal, 31(SI), 11-48.
EIA, 2013: Monthly Energy Review, September 2013. DOE/EIA-0035(2013/09), U.S.
Energy Information Administration (EIA), Washington, DC, USA, 201 pp.
Elliott, J.R. and J. Pais, 2006: Race, class, and Hurricane Katrina: social differences in
human responses to disaster. Social Science Research, 35(2), 295-321.
Enarson, E. and B.H. Morrow, 1998: The Gendered Terrain of Disaster: Through
Women’s Eyes. Praeger Publishers, Westport, CT, USA, 275 pp.
English, J.M., O.B. Toon, and M.J. Mills, 2012: Microphysical simulations of sulfur
burdens from stratospheric sulfur geoengineering. Atmospheric Chemistry and
Physics, 12(10), 4775-4793.
Erbs, M., R. Manderscheid, G. Jansen, S. Seddig, A. Pacholski, and H. Weigel, 2010:
Effects of free-air CO
2
enrichment and nitrogen supply on grain quality parameters
and elemental composition of wheat and barley grown in a crop rotation.
Agriculture, Ecosystems & Environment, 136(1-2), 59-68.
Ericson, J.P., C.J. Vörösmarty, S.L. Dingman, L.G. Ward, and M. Meybeck, 2006: Effective
sea-level rise and deltas: causes of change and human dimension implications.
Global and Planetary Change, 50(1-2), 63-82.
Fang, Y., D.L. Mauzerall, J. Lui, A.M. Fiore, and L.W. Horowitz, 2013: Impacts of 21
st
century climate change on global air pollution-related premature mortality.
Climatic Change, 121(2), 239-253, doi:10.1007/s10584-013-0847-8.
FAO, 2012: The State of Food Insecurity in the World – Economic Growth is Necessary
but not Sufficient to Accelerate Reduction of Hunger and Malnutrition.
Food and Agricultural Organization of the United Nations (FAO), Rome, Italy,
61 pp.
Fargione, J., 2010: Is bioenergy for the birds? An evaluation of alternative future
bioenergy landscapes. Proceedings of the National Academy of Sciences of the
United States of America, 107(44), 18745-18746.
Fargione, J., J. Hill, D. Tilman, S. Polasky, and P. Hawthorne, 2008: Land clearing and
the biofuel carbon debt. Science, 319(5867), 1235-1238.
Feyen, L., J.I. Barredo, and R. Dankers, 2009: Implications of global warming and
urban land use change on flooding in Europe. In: Water & Urban Development
Paradigms – Towards an Integration of Engineering, Design and Management
Approaches [Feyen, J., K. Shannon, and M. Neville (eds.)]. CRC Press/Balkema,
Leiden, Netherlands, pp. 217-225.
Fingerman, K.R., M.S. Torn, M.H. O’Hare, and D.M. Kammen, 2010: Accounting for
the water impacts of ethanol production. Environmental Research Letters, 5(1),
014020, doi:10.1088/1748-9326/5/1/014020.
Fischlin, A., G.F. Midgley, J. Price, R. Leemans, B. Gopal, C. Turley, M. Rounsevall, P.
Dube, J. Tarazona, and A. Velichko, 2007: Ecosystems, their properties, goods,
and services.In: Climate Change 2007: Impacts, Adaptation and Vulnerability.
Contribution of Working Group II to the Fourth Assessment Report of the
Intergovernmental Panel on Climate Change [Parry, M.L., O.F. Canziani, J.P.
Palutikof, P.J. van der Linden, and C.E. Hanson (eds.)]. Cambridge University
Press, Cambridge, UK and New York, NY, USA, pp. 211-272.
Fitzherbert, E.B., M.J. Struebig, A. Morel, F. Danielsen, C.A. Brühl, P.F. Donald, and B.
Phalan, 2008: How will oil palm expansion affect biodiversity? Trends in Ecology
and Evolution, 23(10), 538-545.
Flannigan, M., B. Stocks, M. Turetsky, and M. Wotton, 2009: Impacts of climate
change on fire activity and fire management in the circumboreal forest. Global
Change Biology, 15(3), 549-560.
Fleming, J.R., 2010: Fixing the Sky: The Checkered History of Weather and Climate
Control. Columbia University Press, Chichester, UK and New York, NY, USA, 325 pp.
Fletcher Jr., R.J., B.A. Robertson, J. Evans, P.J. Doran, J.R.R. Alavalapati, and D.W.
Schemske, 2011: Biodiversity conservation in the era of biofuels: risks and
opportunities. Frontiers in Ecology and the Environment, 9, 161-168.
Foden, W.B., S.H.M. Butchart, S.N. Stuart, J.-C. Vié, H.R. Akçakaya, A. Angulo, L.M.
Devantier, A. Gutsche, E. Turak, L. Cao, S.D. Donner, V. Katariya, R. Bernard, R.A.
Holland, A.F. Hughes, S.E. O’Hanlon, S.T. Garnett, Ç.H. Şekercioğlu, and G.M.
Mace, 2013: Identifying the world’s most climate change vulnerable species: a
systematic trait-based assessment of all birds, amphibians and corals. PLOS
ONE, 8(6), e65427, doi:10.1371/journal.pone.0065427.
Fordham, D. and B. Brook, 2010: Why tropical island endemics are acutely susceptible
to global change. Biodiversity and Conservation, 19(2), 329-342.
Fordham, M.H., 1998: Making women visible in disasters: problematising the private
domain. Disasters, 22(2), 126-143.
Foreign Policy Group, 2012: The Failed State Index 2012 – Interactive Map and
Rankings. The Foreign Policy (FP) Group, a division of the Washington Post
Company, Washington, DC, USA, www.foreignpolicy.com/failed_states_index_
2012_interactive.
Foresight, 2011: Migration and Global Environmental Change. Final Project Report.
The Government Office for Science, London, UK, 236 pp. https://www.gov.uk/
government/publications/migration-and-global-environmental-change-future-
challenges-and-opportunities.
Frankhauser, S., J.B. Smith, and R.S.J. Tol, 1999: Weathering climate change: some
simple rules to guide adaptation decisions. Ecological Economics, 30(1), 67-
78.
Förster, H., T. Sterzel, C.A. Pape, M. Moneo-Lain, I. Niemeyer, R. Boer, and J.P. Kropp,
2011: Sea-level rise in Indonesia: on adaptation priorities in the agricultural
sector. Regional Environmental Change, 11(4), 893-904.
Fothergill, A., E.G.M. Maestas, and J.D. Darlington, 1999: Race, ethnicity and disasters
in the United States: a review of the literature. Disasters, 23(2), 156-173.
Frei, T. and E. Gassner, 2008: Climate change and its impact on birch pollen quantities
and the start of the pollen season an example from Switzerland for the period
1969-2006. International Journal of Biometeorology, 52(7), 667-674.
Fuchs, R., M. Conran, and E. Louis, 2011: Climate change and Asia’s coastal urban
cities: can they meet the challenge? Environment and Urbanization Asia, 2(1),
13-28.
Funabashi, Y. and K. Kitazawa, 2012: Fukushima in review: a complex disaster, a
disastrous response. Bulletin of the Atomic Scientists, 68(2), 9-21.
Fund for Peace, 2012: The Failed States Index 2012. The Fund for Peace, Washington,
DC, USA, 48 pp.
Fung, F., A. Lopez, and M. New, 2011: Water availability in +2°C and +4°C worlds.
Philosophical Transactions of the Royal Society A, 369(1934), 99-116.
Füssel, H.-M., 2009: Review and Quantitative Analysis of Indices of Climate Change
Exposure, Adaptive Capacity, Sensitivity, and Impacts. Background note to the
World Development Report 2010, World Bank, Washington, DC, USA, 34 pp.
Füssel, H.-M., 2010: Modeling impacts and adaptation in global IAMs. Wiley
Interdisciplinary Reviews: Climate Change, 1(2), 288-303.
Füssel, H.-M. and R.J. Klein, 2006: Climate change vulnerability assessments: an
evolution of conceptual thinking. Climatic Change, 75(3), 301-329.
Galán, C., H. García-Mozo, L. Vázquez, L. Ruiz, C.D. de la Guardia, and M.M. Trigo,
2005: Heat requirement for the onset of the Olea europaea L. pollen season in
several sites in Andalusia and the effect of the expected future climate change.
International Journal of Biometeorology, 49(3), 184-188.
Gallai, N., J.-M. Salles, J. Settele, and B.E. Vaissiere, 2009: Economic valuation of the
vulnerability of world agriculture confronted with pollinator decline. Ecological
Economics, 68, 810-821.
Garamszegi, L.Z., 2011: Climate change increases the risk of malaria in birds. Global
Change Biology, 17(5), 1751-1759.
Garcia-Mozo, H., C. Galán, V. Jato, J. Belmonte, C. Díaz de la Guardia, D. Fernández,
M. Gutiérrez, M. Aira, J. Roure, L. Ruiz, M. Trigo, and E. Domínguez-Vilches,
2006: Quercus pollen season dynamics in the Iberian Peninsula: response to
meteorological parameters and possible consequences of climate change.
Annals of Agricultural and Environmental Medicine, 13(2), 209-224.
Garschagen, M., 2013: Resilience and organisational institutionalism from a cross-
cultural perspective: an exploration based on urban climate change adaptation
in Vietnam. Natural Hazards, 67(1), 25-46.
Garschagen, M. and F. Kraas, 2011: Urban climate change adaptation in the context
of transformation: lessons from Vietnam. In: Resilient Cities [Otto-Zimmerman,
K. (ed.)]. Local Sustainability, Vol. 1, Springer Science, Dordrecht, Netherlands,
pp. 131-139.

1090
Chapter 19 Emergent Risks and Key Vulnerabilities
19
Garschagen, M. and P. Romero-Lankao, 2013: Exploring the relationships between
urbanization trends and climate change vulnerability. Climatic Change,
published online 15 August 2013, doi:10.1007/s10584-013-0812-6, pp. 16.
Gaston, K.J. and R.A. Fuller, 2008: Commonness, population depletion and
conservation biology. Trends in Ecology & Evolution, 23(1), 14-19.
Gerten, D., J. Heinke, H. Hoff, H. Biemans, M. Fader, and K. Waha, 2011: Global
water availability and requirements for future food production. Journal of
Hydrometeorology, 12(5), 885-899.
Gerten, D., W. Lucht, S. Ostberg, J. Heinke, M. Kowarsch, H. Kreft, Z.W. Kundzewicz,
J. Rastgooy, R. Warren, and H.-J. Schellnhuber, 2013: Asynchronous exposure
to global warming: freshwater resources and terrestrial ecosystems.
Environmental Resarch Letters, 8, 034032, doi:10.1088/1748-9326/8/3/
034032.
Giannini, T.C., A.L. Acosta, C.A. Garófalo, A.M. Saraiva, I. Alves-dos-Santos, and V.L.
Imperatriz-Fonseca, 2012: Pollination services at risk: bee habitats will decrease
owing to climate change in Brazil. Ecological Modelling, 244, 127-131.
Goes, M., N. Tuana, and K. Keller, 2011: The economics (or lack thereof) of aerosol
geoengineering. Climatic Change, 109(3-4), 719-744.
Gonzalez, P., R.P. Neilson, J.M. Lenihan, and R.J. Drapek, 2010: Global patterns in
the vulnerability of ecosystems to vegetation shifts due to climate change.
Global Ecology and Biogeography, 19, 755-768.
Gosling, S.N. and N.W. Arnell, 2013: A global assessment of the impact of climate
change on water scarcity. Climatic Change, published online 17 August 2013,
doi:10.1007/s10584-013-0853-x.
Gosling, S., G. McGregor, and J. Lowe, 2009: Climate change and heat-related
mortality in six cities Part 2: climate model evaluation and projected impacts
from changes in the mean and variability of temperature with climate change.
International Journal of Biometeorology, 53(1), 31-51.
Grassini, P. and K.G. Cassman, 2012: High-yield maize with large net energy yield
and small global warming intensity. Proceedings of the National Academy of
Sciences of the United States of America, 109(4), 1074-1079.
Green, R.E., Y.C. Collingham, S.G. Willis, R.D. Gregory, K.W. Smith, and B. Huntley,
2008: Performance of climate envelope models in retrodicting recent changes
in bird population size from observed climatic change. Biology Letters, 4(5),
599-602.
Green, T.R., M. Taniguchi, H. Kooi, J.J. Gurdak, D.M. Allen, K.M. Hiscock, H. Treidel, and
A. Aureli, 2011: Beneath the surface of global change: impacts of climate
change on groundwater. Journal of Hydrology, 405(3-4), 532-560.
Grothmann, T. and A. Patt, 2005: Adaptive capacity and human cognition: the process
of individual adaptation to climate change. Global Environmental Change,
15(3), 199-213.
Guariguata, M.R., C. García-Fernández, D. Sheil, R. Nasi, C. Herrero-Jáuregui, P.
Cronkleton, and V. Ingram, 2010: Compatibility of timber and non-timber forest
product management in natural tropical forests: perspectives, challenges, and
opportunities. Forest Ecology and Management, 259(3), 237-245.
Guillerminet, M.L. and R.S.J. Tol, 2008: Decision making under catastrophic risk and
learning: the case of the possible collapse of the West Antarctic Ice Sheet.
Climatic Change, 91(1-2), 193-209.
Guttal, V. and C. Jayaprakash, 2009: Spatial variance and spatial skewness: leading
indicators of regime shifts in spatial ecological systems. Theoretical Ecology,
2(1), 3-12.
Hallegatte, S., V. Przyluski, and A. Vogt-Schilb, 2011: Building world narratives for
climate change impact, adaptation and vulnerability analyses. Nature Climate
Change, 1(3), 151-155.
Hallegatte, S., C. Green, R.J. Nicholls, and J. Corfee-Morlot, 2013: Future flood losses
in major coastal cities. Nature Climate Change, 3, 802-806.
Hare, B., 2006: Relationship between increases in global mean temperature and
impacts on ecosystems, food production, water, and socio-economic systems.
In: Avoiding Dangerous Climate Change [Schellnhuber H.J., W. Cramer, N.
Nakicenovich, T. Wigley, and G. Yohe (eds.)]. Cambridge University Press,
Cambridge, UK, pp. 177-185.
Hare, W., J. Lowe, J. Rogelj, E. Sawin, and D. van Vuuren, 2010: Which emission
pathways are consistent with a 2°C or 1.5°C temperature limit? In: The
Emissions Gap Report. Are the Copenhagen Accord Pledges Sufficient to Limit
Global Warming to 2°C or 1.5°C? A Preliminary Assessment. United Nations
Environment Programme (UNEP), Nairobi, Kenya, pp. 23-30.
Harte, J. and J. Kitzes, 2012: The use and misuse of species-area relationships in
predicting climate-driven extinction. In: Saving a Million Species [Hannah, L.
(ed.)]. Island Press, Washington, DC, USA, pp. 73-86.
Hashizume, M., Y. Wagatsuma, A.S.G. Faruque, D.A. Sack, T. Hayashi, P.R. Hunter, and
B. Armstrong, 2008: Factors determining vulnerability to diarrhea during and
after severe floods in Bangladesh. Journal of Water and Health, 6(3), 323-
332.
Haywood, J.M., A. Jones, N. Bellouin, and D. Stephenson, 2013: Asymmetric forcing
from stratospheric aerosols impacts Sahelian rainfall. Nature Climate Change,
3, 660-665.
He, F. and S.P. Hubbell, 2011: Species-area relationships always overestimate extinction
rates from habitat loss. Nature, 473(7347), 368-371.
Heckendorn, P., D. Weisenstein, S. Fueglistaler, B. Luo, E. Rozanov, M. Schraner, L.
Thomason, and T. Peter, 2009: The impact of geoengineering aerosols on
stratospheric temperature and ozone. Environmental Research Letters, 4(4),
045108, doi:10.1088/1748-9326/4/4/045108.
Hegland, S.J., A. Nielsen, A. Lázaro, A. Bjerknes, and Ø. Totland, 2009: How does climate
warming affect plant-pollinator interactions? Ecology Letters, 12(2), 184-195.
Heine, J. and A. Thompson (eds.), 2011: Fixing Haiti: MINUSTAH and Beyond. United
Nations University Press, Tokyo, Japan, 277 pp.
Hertel, T.W., M.B. Burke, and D.B. Lobell, 2010: The poverty implications of climate-
induced crop yield changes by 2030. Global Environmental Change, 20(4), 577-
585.
Hewitt, C.N., A.R. MacKenzie, P. Di Carlo, C.F. Di Marco, J.R. Dorsey, M. Evans, D.
Fowler, M.W. Gallagher, J.R. Hopkins, C.E. Jones, B. Langford, J.D. Lee, A.C. Lewis,
S.F. Lim, J. McQuaid, P. Misztal, S.J. Moller, P.S. Monks, E. Nemitz, D.E. Oram, S.M.
Owen, G.J. Phillips, T.A.M. Pugh, J.A. Pyle, C.E. Reeves, J. Ryder, J. Siong, U. Skiba,
and D.J. Stewart, 2009: Nitrogen management is essential to prevent tropical
oil palm plantations from causing ground-level ozone pollution. Proceedings
of the National Academy of Sciences of the United States of America, 106(44),
18447-18451.
Hidalgo, F.D., S. Naidu, S. Nichter, and N. Richardson, 2010: Economic determinants
of land invasions. Review of Economics and Statistics, 92(3), 505-523.
Hinkel, J., R. Nicholls, A. Vafeidis, R.S.J. Tol, and T. Avagianou, 2010: Assessing risk of
and adaptation to sea-level rise in the European Union: an application of DIVA.
Mitigation and Adaptation Strategies for Global Change, 15(7), 703-719.
Hoegh-Guldberg, O., 2012: The adaptation of coral reefs to climate change: is the
Red Queen being outpaced? Scientia Marina, 76(2), 403-408.
Holdschlag, A. and B.M. Ratter, 2013: Multiscale system dynamics of humans and
nature in The Bahamas: perturbation, knowledge, panarchy and resilience.
Sustainability Science, 8(3), 407-421.
Hope, C., 2006: The marginal impact of CO
2
from PAGE2002: an integrated assess-
ment model incorporating the IPCC’s five reasons for concern. Integrated
Assessment Journal, 6(1), 19-56.
Houghton, R.M.E., 2009: Domestic violence reporting and disasters in New Zealand.
Regional Development Dialogue, 30(1), 79-90.
Hsiang, S.M. and M. Burke, 2014: Climate, conflict, and social stability: what does
the evidence say? Climatic Change, 123(1), 39-55.
Hsiang, S.M., K.C. Meng, and M.A. Cane, 2011: Civil conflicts are associated with
the global climate. Nature, 476(7361), 438-441.
Hsiang, S.M., M. Burke, and E. Miguel, 2013: Quantifying the influence of climate on
human conflict. Science, 341(6151), 1235367.
Huang, T.C., Y.T. Hsu, and Y.C. Chou, 2010: Influence of climate change on the incidence
of rice diseases and our adaptive strategies. Plant Protection Bulletin, 52, 25-42.
Hughes, B.B., M.T. Irfan, H. Khan, K.B. Kumar, D.S. Rothman, and J.R. Solórzano, 2009:
Reducing Global Poverty: Patterns of Potential Human Progress. Vol. 1, Paradigm,
Boulder, CO, USA and Oxford University Press, New Delhi, India, 334 pp.
Hunter, C.M., H. Caswell, M.C. Runge, E.V. Regehr, S.C. Amstrup, and I. Stirling, 2010:
Climate change threatens polar bear populations: a stochastic demographic
analysis. Ecology, 91(10), 2883-2897.
Huntley, B. and P. Barnard, 2012: Potential impacts of climatic change on southern
African birds of fynbos and grassland biodiversity hotspots. Diversity and
Distributions, 18, 769-781.
Hutchins, D.A., M.R. Mulholland, and F. Fu, 2009: Nutrient cycles and marine
microbes in a CO
2
-enriched ocean. Oceanography, 22(4), 128-145.
Hutton, C.W., S. Kienberger, F. Amoako Johnson, A. Allan, V. Giannini, and R. Allen,
2011: Vulnerability to climate change: people, place and exposure to hazard.
Advances in Science and Research, 7(1), 37-45.
Hymans, S.H. and H.T. Shapiro, 1976: The allocation of household income to food
consumption. Journal of Econometrics, 4(2), 167-188.
ICSU-LAC, 2010a: Science for a better life: developing regional scientific programs
in priority areas for Latin America and the Caribbean, Vol. 2. In: Understanding

1091
Emergent Risks and Key Vulnerabilities Chapter 19
19
and Managing Risk Associated with Natural Hazards: An Integrated Scientific
Approach in Latin America and the Caribbean [Cardona, O.D., J.C. Bertoni, T.
Gibbs, M. Hermelin, and A. Lavell (eds.)]. ICSU-LAC / CONACYT, Rio de Janeiro,
Brazil and Mexico City, Mexico, 87 pp.
ICSU-LAC, 2010b: Science for a better life: developing regional scientific programs
in priority areas for Latin America and the Caribbean, Vol. 1. In: Biodiversity in
Latin America and the Caribbean: An Assessment of Knowledge, Research
Scope and Priority Areas [Arroyo, K.T., R. Dirzo, J.C. Castillas, F. Cejas, and C.A
Joly (eds.)]. ICSU-LAC / CONACYT, Rio de Janeiro, Brazil and Mexico City, Mexico,
232 pp.
Idso, S.B. and K.E. Idso, 2001: Effects of atmospheric CO
2
enrichment on plant
constituents related to animal and human health. Environmental and
Experimental Botany, 45(2), 179-199.
Iglesias, A., S. Quiroga, M. Moneo, and L. Garrote, 2012: From climate change impacts
to the development of adaptation strategies: challenges for agriculture in
Europe. Climatic Change, 112(1), 143-168.
Immerzeel, W.W., L.P. van Beek, and M.F. Bierkens, 2010: Climate change will affect
the Asian water towers. Science, 328(5984), 1382-1385.
Immerzeel, W., F. Pellicciotti, and M. Bierkens, 2013: Rising river flows throughout
the twenty-first century in two Himalayan glacierized watersheds. Nature
Geoscience, 6(9), 742-745.
IPCC, 2007a: Climate Change 2007: Synthesis Report. Contribution of Working
Groups I, II and III to the Fourth Assessment Report of the Intergovernmental
Panel on Climate Change [Core Writing Team, Pachauri, R.K. and A. Reisinger
(eds.)]. IPCC, Geneva, Switzerland, 104 pp.
IPCC, 2007b: Climate Change 2007: Mitigation of Climate Change. Contribution of
Working Group III to the Fourth Assessment Report of the Intergovernmental
Panel on Climate Change [Metz, B., O.R. Davidson, P.R. Bosch, R. Dave, and L.A.
Meyers (eds.)]. Cambridge University Press, Cambridge, UK and New York, NY,
USA, 890 pp.
IPCC, 2011: IPCC Special Report on Renewable Energy Sources and Climate Change
Mitigation. Prepared by Working Group III of the Intergovernmental Panel on
Climate Change [Edenhofer, O., R. Pichs-Madruga, Y. Sokona, K. Seyboth, P.
Matschoss, S. Kadner, T. Zwickel, P. Eickemeier, G. Hansen, S. Schlömer, and C.
von Stechow (eds.)]. Cambridge University Press, Cambridge, UK and New York,
NY, USA, 1075 pp.
IPCC, 2012a: Managing the Risks of Extreme Events and Disasters to Advance
Climate Change Adaptation. A Special Report of Working Groups I and II of the
Intergovernmental Panel on Climate Change [Field, C.B., V. Barros, T.F. Stocker,
D. Qin, D.J. Dokken, K.L. Ebi, M.D. Mastrandrea, K.J. Mach, G.-K. Plattner, S.K.
Allen, M. Tignor, and P.M. Midgley (eds.)]. Cambridge University Press,
Cambridge, UK and New York, NY, USA, 582 pp.
IPCC, 2012b: Meeting Report of the Intergovernmental Panel on Climate Change
Expert Meeting on Geoengineering [Edenhofer, O., R. Pichs-Madruga, Y. Sokona,
C. Field, V. Barros, T.F. Stocker, Q. Dahe, J. Minx, K. Mach, G.-K. Plattner, S.
Schlömer, G. Hansen, and M. Mastrandrea (eds.)]. IPCC Working Group III
Technical Support Unit, Potsdam Institute for Climate Impact Research, Potsdam,
Germany, 99 pp.
IPCC, 2012c: Summary for Policymakers. In: Managing the Risks of Extreme Events
and Disasters to Advance Climate Change Adaptation. A Special Report of
Working Groups I and II of the Intergovernmental Panel on Climate Change
[Field, C.B., V. Barros, T.F. Stocker, D. Qin, D.J. Dokken, K.L. Ebi, M.D. Mastrandrea,
K.J. Mach, G.-K. Plattner, S.K. Allen, M. Tignor, and P.M. Midgley (eds.)].
Cambridge University Press, Cambridge, UK and New York, NY, USA, pp. 1-19.
Izrael, Y.A. and S.M. Semenov, 2006: Critical levels of greenhouse gases,stabilization
scenarios, and implicationsfor the global decisions.In: Avoiding Dangerous
Climate Change [Schellnhuber, H.J., W. Cramer, N. Nakicenovic, T.M.L. Wigley,
and G.W. Yohe (eds.)]. Cambridge University Press, New York, NY, USA, pp. 73-79.
Izrael, Y.A., A. Ryaboshapko, and N. Petrov, 2009: Comparative analysis of geo-
engineering approaches to climate stabilization. Russian Meteorology and
Hydrology, 34(6), 335-347.
Jabry, A., 2003: Children in Disasters: After the Cameras have Gone. Plan UK, London,
UK, 56 pp.
Jankowska, M.M., D. Lopez-Carr, C. Funk, G.J. Husak, and Z.A. Chafe, 2012: Climate
change and human health: spatial modeling of water availability, malnutrition,
and livelihoods in Mali, Africa. Applied Geography, 33, 4 15.
Johannessen, O. and M. Miles, 2011: Critical vulnerabilities of marine and sea ice-
based ecosystems in the high Arctic. Regional Environmental Change,
11(Suppl. 1), S239-S248.
Jones, A., J.M. Haywood, K. Alterskjær, O. Boucher, J.N.S. Cole, C.L. Curry, P.J. Irvine, D. Ji,
B. Kravitz, J. Egill Kristjánsson, J.C. Moore, U. Niemeier, A. Robock, H. Schmidt, B.
Singh, S. Tilmes, S. Watanabe, and J.-H. Yoon, 2013: The impact of abrupt suspension
of solar radiation management (termination effect) in experiment G2 of the
Geoengineering Model Intercomparison Project (GeoMIP). Journal of Geophysical
Research: Atmospheres, 118(17), 9743-9752, doi:10.1002/jgrd.50762.
Jones, C., J. Lowe, S. Liddicoat, and R. Betts, 2009: Committed terrestrial ecosystem
changes due to climate change. Nature Geosciences, 2(7), 484-487.
Jongman, B., P.J. Ward, and J.C. Aerts, 2012: Global exposure to river and coastal
flooding: long term trends and changes. Global Environmental Change, 22(4),
823-835.
Jurgensone, I., J. Carstensen, A. Ikauniece, and B. Kalveka, 2011: Long-term changes
and controlling factors of phytoplankton community in the Gulf of Riga (Baltic
Sea). Estuaries and Coasts, 34(6), 1205-1219.
Kahan, D., 2010: Fixing the communications failure. Nature, 463(7279), 296-297.
Kahn, M.E., 2005: The death toll from natural disasters: the role of income, geography,
and institutions. The Review of Economics and Statistics, 87(2), 271-284.
Kainuma, M., Y. Matsuoka, T. Masui, K. Takahashi, J. Fujino, and Y. Hijioka, 2007:
Climate policy assessment using the Asia-Pacific Integrated Model. In: Human-
Induced Climate Change [Schlesinger, M., H. Kheshgi, and J. Smith (eds.)].
Cambridge University Press, New York, NY, USA, pp. 314-327.
Karamessini, M., 2010: Life stage transitions and the still-critical role of the family
in Greece. In: The Welfare State and Life Transitions: A European Perspective
[Anzo, D., G. Bosch, and J. Rubery (eds.)]. Edward Elgar, Cheltenham, UK, pp.
257-283.
Kaser, G., M. Großhauser, and B. Marzeion, 2010: Contribution potential of glaciers
to water availability in different climate regimes. Proceedings of the National
Academy of Sciences of the United States of America, 107(47), 20223-20227.
Kasperson, R.E. and J.X. Kasperson, 2001: Climate Change, Vulnerability and Social
Justice. Risk and Vulnerability Programme, Stockholm Environment Institute
(SEI), Stockholm, Sweden, 18 pp.
Kasperson, R.E., O. Renn, P. Slovic, H.S. Brown, J. Emel, R. Goble, J.X. Kasperson, and
S. Ratick, 1988: The social amplification of risk: a conceptual framework. Risk
Analysis, 8(2), 177-187.
Kearney, M., R. Shine, and W.P. Porter, 2009: The potential for behavioral thermo-
regulation to buffer “cold-blooded” animals against climate warming. Proceedings
of the National Academy of Sciences of the United States of America, 106(10),
3835-3840.
Keesing, F., L.K. Belden, P. Daszak, A. Dobson, C.D. Harvell, R.D. Holt, P. Hudson, A. Jolles,
K.E. Jones, C.E. Mitchell, S.S. Myers, T. Bogich, and R.S. Ostfeld, 2010: Impacts of
biodiversity on the emergence and transmission of infectious diseases. Nature,
468(7324), 647-652.
Kéfi, S., M. Rietkerk, C.L. Alados, Y. Pueyo, V.P. Papanastasis, A. ElAich, and P.C. de
Ruiter, 2007: Spatial vegetation patterns and imminent desertification in
Mediterranean arid ecosystems. Nature, 449, 213-218.
Kelic, A., V. Loose, V. Vargas, and E. Vugrin, 2009: Energy and Water Sector Policy
Strategies for Drought Mitigation. SAND 2009-1360, Sandia National Laboratories,
Albuquerque, NM, USA, 71 pp.
Keller, K. and D. McInerney, 2008: The dynamics of learning about a climate threshold.
Climate Dynamics, 30(2-3), 321-332.
Keller, K., B.M. Bolker, and D.F. Bradford, 2004: Uncertain climate thresholds and
optimal economic growth. Journal of Environmental Economics and Management,
48(1), 723-741.
Keller, K., M. Hall, S. Kim, D. Bradford, and M. Oppenheimer, 2005: Avoiding dangerous
anthropogenic interference with the climate system. Climatic Change, 73(3),
227-238.
Keller, K., G. Yohe, and M. Schlesinger, 2008: Managing the risks of climate thresholds:
uncertainties and information needs. Climatic Change, 91(1), 5-10.
Kelly, P.M. and W.N. Adger, 2000: Theory and practice in assessing vulnerability to
climate change and facilitating adaptation. Climatic Change, 47(4), 325-352.
Khanna, M., C.L. Crago, and M. Black, 2011: Can biofuels be a solution to climate
change? The implications of land use change related emissions for policy.
Interface Focus, 1, 233-247.
Khazai, B., J.E. Daniel, and F. Wenzel, 2011: The March 2011 Japan Earthquake –
analysis of losses, impacts, and implications for the understanding of risks
posed by extreme events. Technikfolgenabschätzung – Theorie Und Praxis,
20(3), 22-33.
Khosla, R. and K.K. Guntupalli, 1999: Heat-related illnesses. Critical Care Clinics,
15(2), 251-263.

1092
Chapter 19 Emergent Risks and Key Vulnerabilities
19
Khunwishit, S. and S. Arlikatti, 2012: Demographic changes in the United States of
America: challenges for disaster management. In: Opportunities and Challenges
for Applied Demography in the 21
st
Century. [Hoque, N. and D. Swanson (eds.)].
Applied Demography Series, Vol. 2, Springer Science, Dordrecht, Netherlands,
pp. 273-288.
Kienberger, S., 2012: Spatial modelling of social and economic vulnerability to floods
at the district level in Búzi, Mozambique. Natural Hazards, 64(3), 2001-2019.
Kittel, T., B. Baker, J. Higgins, and J. Haney, 2011: Climate vulnerability of ecosystems
and landscapes on Alaska’s North Slope. Regional Environmental Change,
11(Suppl. 1), S249-S264.
Klausmeyer, K.R. and M.R. Shaw, 2009: Climate change, habitat loss, protected areas
and the climate adaptation potential of species in Mediterranean ecosystems
worldwide. PLOS ONE, 4(7), e6392, doi:10.1371/journal.pone.0006392.
Klinenberg, E., 2002: Heat Wave: A Social Autopsy of Disaster in Chicago. The
University of Chicago Press, Chicago, IL, USA, 305 pp.
Knopf, B., O. Edenhofer, C. Flachsland, M.T.J. Kok, H. Lotze-Campen, G. Luderer, A.
Popp, and D.P. van Vuuren, 2010: Managing the low-carbon transition – from
model results to policies. The Energy Journal, 31(SI 1), 223-245.
Knowlton, K., B. Lynn, R.A. Goldberg, C. Rosenzweig, C. Hogrefe, J.K. Rosenthal, and
P.L. Kinney, 2007: Projecting heat-related mortality impacts under a changing
climate in the New York City region. American Journal of Public Health, 97(11),
2028-2034.
Kocmánková, E., M. Trnka, J. Eitzinger, H. Formayer, M. Dubrovský, D. Semerádová,
Z. Žalud, J. Juroch, and M. Možný, 2010: Estimating the impact of climate
change on the occurrence of selected pests in the Central European region.
Climate Research, 44(1), 95-105.
Koeller, P., C. Fuentes-Yaco, T. Platt, S. Sathyendranath, A. Richards, P. Ouellet, D. Orr,
U. Skúladóttir, K. Wieland, L. Savard, and M. Aschan, 2009: Basin-scale coherence
in phenology of shrimps and phytoplankton in the North Atlantic Ocean.
Science, 324(5928), 791-793.
Koh, L.P., J. Ghazoul, R.A. Butler, W.F. Laurance, N.S. Sodhi, J. Mateo-Vega, and C.J.A.
Bradshaw, 2010: Wash and spin cycle threats to tropical biodiversity. Biotropica,
42(1), 67-71.
Konzmann, M., D. Gerten, and J. Heinke, 2013: Climate impacts on global irrigation
requirements under 19 GCMs, simulated with a vegetation and hydrology
model. Hydrological Sciences Journal, 58(1), 88-105.
Kopp, R.E. and B.K. Mignone, 2012: The U.S. government’s social cost of carbon
estimates after their first two years: pathways for improvement. Economics:
The Open-Access, Open Assessment E-Journal, 6, 2012-15.
Kopp, R.E., F.J. Simons, J.X. Mitrovica, A.C. Maloof, and M. Oppenheimer, 2009:
Probabilistic assessment of sea level during the last interglacial stage. Nature,
462(7275), 863-867.
Kopp, R.E., A. Golub, N.O. Keohane, and C. Onda, 2012: The influence of the
specification of climate change damages on the social cost of carbon. Economics:
The Open-Access, Open Assessment E-Journal, 6, 2012-2013.
Kovats, R.S. and R. Akhtar, 2008: Climate, climate change and human health in Asian
cities. Environment and Urbanization, 20(1), 165-175.
Kovats, R.S. and S. Hajat, 2008: Heat stress and public health: a critical review. Annual
Review of Public Health, 29, 41-55.
Kravitz, B., K. Caldeira, O. Boucher, A. Robock, P.J. Rasch, K. Alterskjær, D.B. Karam,
J.N. Cole, C.L. Curry, and J.M. Haywood, 2013: Climate model response from
the Geoengineering Model Intercomparison Project (GeoMIP). Journal of
Geophysical Research: Atmospheres, 118(15), 8320-8332.
Krawchuk, M.A., M.A. Moritz, M. Parisien, J. Van Dorn, and K. Hayhoe, 2009: Global
pyrogeography: the current and future distribution of wildfire. Plos One, 4(4),
e5102, doi:10.1371/journal.pone.0005102.
Krey, V. and K. Riahi, 2009: Implications of delayed participation and technology
failure for the feasibility, costs, and likelihood of staying below temperature
targets – greenhouse gas mitigation scenarios for the 21
st
century. Energy
Economics, 31(Suppl. 2), S94-S106.
Krieger, D.J., 2001: The Economic Value of Forest Ecosystem Services: A Review. The
Wilderness Society, Washington, DC, USA, 31 pp.
Kriegler, E., J.W. Hall, H. Held, R. Dawson, and H.J. Schellnhuber, 2009: Imprecise
probability assessment of tipping points in the climate system. Proceedings of
the National Academy of Sciences of the United States of America, 106(13),
5041-5046.
Kucharik, C.J. and S.P. Serbin, 2008: Impacts of recent climate change on Wisconsin
corn and soybean yield trends. Environmental Research Letters, 3(3), 034003,
doi:10.1088/1748-9326/3/3/034003.
Kuhlmann, M., D. Guo, R. Veldtman, and J. Donaldson, 2012: Consequences of warming
up a hotspot: species range shifts within a centre of bee diversity. Diversity and
Distributions, 18, 885-897.
Kuruppu, N. and D. Liverman, 2011: Mental preparation for climate adaptation: the
role of cognition and culture in enhancing adaptive capacity of water management
in Kiribati. Global Environmental Change, 21(2), 657-669.
Ladeau, S.L. and J.S. Clark, 2006: Pollen production by Pinus taeda growing in
elevated atmospheric CO
2
. Functional Ecology, 20(3), 541-547.
Lam, V.W.Y., W.W.L. Cheung, W. Swartz, and U.R. Sumaila, 2012: Climate change
impacts on fisheries in West Africa: implications for economic, food and
nutritional security. African Journal of Marine Science, 34(1), 103-117.
Lapola, D.M., M.D. Oyama, and C.A. Nobre, 2009: Exploring the range of climate
biome projections for tropical South America: the role of CO
2
fertilization and
seasonality. Global Biogeochemical Cycles, 23(3), GB3003, doi:10.1029/
2008GB003357.
Lapola, D.M., R. Schaldach, J. Alcamo, A. Boundeau, J. Koch, C. Koelking, and J.A.
Priess, 2010: Indirect land-use changes can overcome carbon savings from
biofuels in Brazil. Proceedings of the National Academy of the United States of
America, 107(8), 3388-3393, doi:10.1073/pnas.0907318107.
Lautze, S., J. Leaning, A. Raven-Roberts, R. Kent, and D. Mazurana, 2004: Assistance,
protection, and governance networks in complex emergencies. The Lancet,
364(9451), 2134-2141.
Lavell, A., M. Oppenheimer, C. Diop, J. Hess, R. Lempert, J. Li, R. Muir-Wood, and S.
Myeong, 2012: Climate change: new dimensions in disaster risk, exposure,
vulnerability, and resilience. In: Managing the Risks of Extreme Events and
Disasters to Advance Climate Change Adaptation. A Special Report of Working
Groups I and II of the Intergovernmental Panel on Climate Change [Field, C.B.,
V. Barros, T.F. Stocker, D. Qin, D.J. Dokken, K.L. Ebi, M.D. Mastrandrea, K.J. Mach,
G.-K. Plattner, S.K. Allen, M. Tignor, and P.M. Midgley (eds.)]. Cambridge
University Press, Cambridge, UK and New York, NY, USA, pp. 25-64.
Leichenko, R.M. and K.L. O’Brien, 2008: Environmental Change and Globalization:
Double Exposures. Oxford University Press, New York, NY, USA, 192 pp.
Lenoir, J., J. Gegout, P. Marquet, P. De Ruffray, and H. Brisse, 2008: A significant
upward shift in plant species optimum elevation during the 20
th
century.
Science, 320(5884), 1768-1771.
Lenton, T.M., 2011a: Beyond 2°C: redefining dangerous climate change for physical
systems. Wiley Interdisciplinary Reviews: Climate Change, 2(3), 451-461.
Lenton, T.M., 2011b: Early warning of climate tipping points. Nature Climate Change,
1(4), 201-209.
Lenton, T.M. and J. Ciscar, 2013: Integrating tipping points into climate impact
assessments. Climatic Change, 117(3), 585-597.
Lenton, T.M. and N.E. Vaughan, 2009: The radiative forcing potential of different
climate geoengineering options. Atmospheric Chemistry and Physics, 9, 5539-
5561.
Lenton, T.M., H. Held, E. Kriegler, J.W. Hall, W. Lucht, S. Rahmstorf, and H.J. Schellnhuber,
2008: Tipping elements in the Earth’s climate system. Proceedings of the
National Academy of Sciences of the United States of America, 105(6), 1786-
1793.
Levermann, A., T. Albrecht, R. Winkelmann, M. Martin, M. Haseloff, and I. Joughin,
2012: Kinematic first-order calving law implies potential for abrupt ice-shelf
retreat. The Cryosphere, 6(2), 273-286.
Li, Y., W. Ye, M. Wang, and X. Yan, 2009: Climate change and drought: a risk assessment
of crop-yield impacts. Climate Research, 39, 31-46.
Lilleør, H.B. and K. Van den Broeck, 2011: Economic drivers of migration and climate
change in LDCs. Global Environmental Change, 21(Suppl. 1), S70-S81.
Lin, A., 2013: Does geoengineering present a moral hazard? Ecology Law Quarterly,
40, 673-712.
Lin, N., K. Emanuel, M. Oppenheimer, and E. Vanmarcke, 2012: Physically based
assessment of hurricane surge threat under climate change. Nature Climate
Change, 2, 462-467.
Lin, S., M. Luo, R.J. Walker, X. Liu, S. Hwang, and R. Chinery, 2009: Extreme high
temperatures and hospital admissions for respiratory and cardiovascular diseases.
Epidemiology, 20(5), 738-746.
Liu, X., J.R. Rohr, and Y. Li, 2013: Climate, vegetation, introduced hosts and trade
shape a wildlife pandemic. Proceedings of the Royal Society B, 280(1753),
20122506, doi:10.1098/rspb.2012.2506.
Liverman, D.M., 1990: Vulnerability to global environmental change. In: Understanding
Global Environmental Change: The Contributions of Risk Analysis and
Management [Kasperson, R.E., K. Dow, D. Golding, and J.X. Kasperson (eds.)].

1093
Emergent Risks and Key Vulnerabilities Chapter 19
19
Report on an International Workshop, The Earth Transformed Programme, Clark
University, Worcester, MA, USA, pp. 27-44, www.environment.arizona.edu/
files/env/profiles/liverman/liverman-1990-kasperson-et-al.pdf.
Lloyd, I.D. and M. Oppenheimer, 2014: On the design of an international governance
framework for geoengineering. Global Environmental Politics, 14(2), 45-63.
Lloyd, S.J., R.S. Kovats, and Z. Chalabi, 2011: Climate change, crop yields, and
undernutrition: development of a model to quantify the impact of climate
scenarios on child undernutrition. Environmental Health Perspectives, 119(12),
1817-1823.
Lobell, D.B., M.B. Burke, C. Tebaldi, M.D. Mastrandrea, W.P. Falcon, and R.L. Naylor,
2008: Prioritizing climate change adaptation needs for food security in 2030.
Science, 319(5863), 607-610.
Lobell, D.B., W. Schlenker, and J. Costa-Roberts, 2011: Climate trends and global crop
production since 1980. Science, 333(6042), 616-620.
Loomis, J., P. Kent, L. Strange, K. Fausch, and A. Covich, 2000: Measuring the total
economic value of restoring ecosystem services in an impaired river basin:
results from a contingent valuation survey. Ecological Economics, 33, 103-117.
Lorenz, A., M. Schmidt, E. Kriegler, and H. Held, 2012: Anticipating climate threshold
damages. Environmental Modeling and Assessment, 17(1), 163-175.
Loss, S.R., L.A. Terwilliger, and A.C. Peterson, 2011: Assisted colonization: integrating
conservation strategies in the face of climate change. Biological Conservation,
144(1), 92-100.
Lotze-Campen, H., A. Popp, T. Beringer, C. Müller, A. Bondeau, S. Rost, and W. Lucht,
2010: Scenarios of global bioenergy production: the trade-offs between
agricultural expansion, intensification and trade. Ecological Modelling,
221(18), 2188-2196.
Lough, J., 2012: Small change, big difference: sea surface temperature distributions
for tropical coral reef ecosystems, 1950-2011. Journal of Geophysical Research,
117(C9), C09018, doi:10.1029/2012JC008199.
Lubchenco, J. and L. Petes, 2010: Eleventh Annual Roger Revelle Commemorative
Lecture: the interconnected biosphere – science at the ocean’s tipping points.
Oceanography, 23(2), 115-129.
Luber, G. and M. McGeehin, 2008: Climate change and extreme heat events.
American Journal of Preventive Medicine, 35(5), 429-435.
Lung, T., C. Lavalle, R. Hiederer, A. Dosio, and L.M. Bouwer, 2013: A multi-hazard
regional level impact assessment for Europe combining indicators of climatic
and non-climatic change.Global Environmental Change, 23(2), 522-536.
Luyssaert, S., E.-D. Schulze, A. Börner, A. Knohl, D. Hessenmöller, B.E. Law, P. Ciais,
and J. Grace, 2008: Old-growth forests as global carbon sinks. Nature, 455,
213-215.
Macknick, J., S. Sattler, S., K. Averyt, S. Clemmer, and J. Rogers,2012: Water implications
of generating electricity: water use across the United States based on different
electricity pathways through 2050. Environmental Research Letters, 7(4),
045803, doi:10.1088/1748-9326/7/4/045803.
Maestre, F.T., J.L. Quero, N.J. Gotelli, A. Escudero, V. Ochoa, M. Delgado-Baquerizo,
M. García-Gómez, M.A. Bowker, S. Soliveres, C. Escolar, P. García-Palacios, M.
Berdugo, E. Valencia, B. Gozalo, A. Gallardo, L. Aguilera, T. Arredondo, J. Blones,
B. Boeken, D. Bran, A.A. Conceição, O. Cabrera, M. Chaieb, M. Derak, D.J.
Eldridge, C.I. Espinosa, A. Florentino, J. Gaitán, M.G. Gatica, W. Ghiloufi, S.
Gómez-González, J.R. Gutiérrez, R.M. Hernández, X. Huang, E. Huber-Sannwald,
M. Jankju, M. Miriti, J. Monerris, R.L. Mau, E. Morici, K. Naseri, A. Ospina, V. Polo,
A. Prina, E. Pucheta, D.A. Ramírez-Collantes, R. Romão, M. Tighe, C. Torres-Díaz,
J. Val, J.P. Veiga, D. Wang, and E. Zaady, 2012: Plant species richness and ecosystem
multifunctionality in global drylands. Science, 335(6065), 214-218.
Magan, N., A. Medina, and D. Aldred, 2011: Possible climate-change effects on
mycotoxin contamination of food crops pre- and postharvest. Plant Pathology,
60(1), 150-163.
Maiorano, L., A. Falcucci, N.E. Zimmermann, A. Psomas, J. Pottier, D. Baisero, C. Rondinini,
A. Guisan, L. Boitani, and L. Maiorano, 2011: The future of terrestrial mammals
in the Mediterranean basin under climate change. Philosophical Transactions
of the Royal Society B, 366(1578), 2681-2692.
Malhi, Y., L.E.O.C. Aragão, D. Galbraith, C. Huntingford, R. Fisher, P. Zelazowski, S.
Sitch, C. McSweeney, and P. Meir, 2009: Exploring the likelihood and mechanism
of a climate-change-induced dieback of the Amazon rainforest. Proceedings of
the National Academy of Sciences of the United States of America, 106(49),
20610-20615, doi:10.1073/pnas.0804619106.
Mansilla, E., 1996: Desastres Modelo Para Armar: Colección de Piezas de un
Rompecabezas Social. Red de Estudios Sociales en Prevención de Desastres en
América Latin: La RED, Lima, Peru, 223 pp.
Mantyka-Pringle, C.S., T.G. Martin, and J.R. Rhodes, 2012: Interactions between
climate and habitat loss effects on biodiversity: a systematic review and meta-
analysis. Global Change Biology, 18(4), 1239-1252.
Maskrey, A., 1989: Disaster Mitigation: A Community Based Approach. Oxfam,
Oxford, UK, 114 pp.
Maskrey, A., 1993a: Vulnerability accumulation in peripheral regions in Latin
America: the challenge for disaster prevention and management. In: Natural
Disasters: Protecting Vulnerable Communities [Merriman, P.A. and C.W. Browitt
(eds.)]. Proceedings of the Conference Held in London, 13-15 October 1993,
International Decade for Natural Disaster Reduction (IDNDR), Thomas Telford,
London, UK, pp. 461-472.
Maskrey, A., 1993b: Los Desastres: No son Naturales. Red de Estudios Sociales en
Prevención de Desastres en América Latina: LA RED, Tercer Mundo Editores,
Bogata, Colombia, 137 pp.
Maskrey, A., 1994: Disaster mitigation as a crisis paradigm: reconstructing after the
Alto Mayo Earthquake, Peru. In: Disaster, Development and Environment [Varley,
A. (ed.)]. John Wiley & Sons, Chichester, UK, pp. 109-123.
Maskrey, A., 1998: Navegando entre Brumas: La Aplicación de los Sistemas de
Información Geográfica al Análisis de Riesgo en América Latina. Red de Estudios
Sociales en Prevención de Desastres en América Latina: LA RED, Intermediate
Technology Development Group (ITDG-Perú), Lima, Peru, 344 pp.
Maskrey, A., 2011: Revisiting community-based disaster risk management.
Environmental Hazards, 10(1), 42-52.
McAlpine, C.A., J.G. Ryan, L. Seabrook, S. Thomas, P.J. Dargusch, J.I. Syktus, R.A. Pielke
Sr, A.E. Etter, P.M. Fearnside, and W.F. Laurance, 2010: More than CO
2
: a broader
paradigm for managing climate change and variability to avoid ecosystem
collapse. Current Opinion in Environmental Sustainability, 2(5-6), 334-346.
McClellan, J., D.W. Keith, and J. Apt, 2012: Cost analysis of stratospheric albedo
modification delivery systems. Environmental Research Letters, 7(3), 034019,
doi:10.1088/1748-9326/7/3/034019.
McInerney, D. and K. Keller, 2008: Economically optimal risk reduction strategies in
the face of uncertain climate thresholds. Climatic Change, 91(1), 29-41.
McInerney, D., R. Lempert, and K. Keller, 2012: What are robust strategies in the face
of uncertain climate threshold responses? Climatic Change, 112(3), 547-568.
McKay, N.P., J.T. Overpeck, and B.L. Otto-Bliesner, 2011: The role of ocean thermal
expansion in Last Interglacial sea level rise. Geophysical Research Letters,
38(14), doi:10.1029/2011GL048280.
McKenzie, D. and M.C. Kennedy, 2012: Power laws reveal phase transitions in landscape
controls of fire regimes. Nature Communications, 3, 726, doi:10.1038/ncomms1731.
McLeman, R., 2011: Climate Change, Migration, and Critical International Security
Considerations. IOM Migration Research Series No. 42, International Organization
for Migration (IOM), Geneva, Switzerland, 50 pp.
McLeod, K.L. and H.M. Leslie, 2009: Why ecosystem-based management? In:
Ecosystem-Based Management for the Oceans [McLeod, K.L. and H.M. Leslie
(ed.)]. Island Press, Washington, DC, USA, pp. 3-12.
McMahon, J. and S.K. Price, 2011: Water and energy interactions. Annual Review of
Environment and Resources, 36, 163-191.
McNeall, D., P.R. Halloran, P. Good, and R.A. Betts, 2011: Analyzing abrupt and
nonlinear climate changes and their impacts. Wiley Interdisciplinary Reviews:
Climate Change, 2(5), 663-686.
Meehl, G.A., W.M. Washington, J.M. Arblaster, A. Hu, H. Teng, C. Tebaldi, B.N. Sanderson,
J. Lamarque, A. Conley, and W.G. Strand, 2012: Climate system response to
external forcings and climate change projections in CCSM4. Journal of Climate,
25(11), 3661-3683.
Meinshausen, M., S.C.B. Raper, and T.M.L. Wigley, 2011: Emulating coupled
atmosphere-ocean and carbon cycle models with a simpler model, MAGICC6:
Part I – model description and calibration. Atmospheric Chemistry and Physics,
11, 1417-1456.
Meissner, K., T. Lippmann, and A. Sen Gupta, 2012: Large-scale stress factors affecting
coral reefs: open ocean sea surface temperature and surface seawater aragonite
saturation over the next 400 years. Coral Reefs, 31(2), 309-319.
Melillo, J.M., J.M. Reilly, D.W. Kicklighter, A.C. Gurgel, T.W. Cronin, S. Paltsev, B.S.
Felzer, X. Wang, A.P. Sokolov, and C.A. Schlosser, 2009a: Indirect emissions from
biofuels: how important? Science 326(5958), 1397-1399.
Melillo, J.M., A.C. Gurgel, D.W. Kicklighter, J.M. Reilly, T.W. Cronin, B.S. Felzer, S. Paltsev,
C.A. Schlosser, A.P. Sokolov, X. Wang, 2009b: Unintended Environmental
Consequences of a Global Biofuels Program. Report No. 168. MIT Joint Program
on the Science and Policy of Global Change, Cambridge, Massachusetts, USA,
34 pp., http://dspace.mit.edu/handle/1721.1/44626

1094
Chapter 19 Emergent Risks and Key Vulnerabilities
19
Mendelsohn, R., K. Emanuel, S. Chonabayashi, and L. Bakkensen, 2012: The impact
of climate change on global tropical cyclone damage. Nature Climate Change,
2(3), 205-209.
Menkhaus, K., 2010: Stabilisation and humanitarian access in a collapsed state: the
Somali case. Disasters, 34(Suppl. S3), S320-S341.
Midgley, G.F., 2012: Biodiversity and ecosystem function. Science, 335(6065), 174-175.
Midgley, G.F. and W. Thuiller, 2011: Potential responses of terrestrial biodiversity in
Southern Africa to anthropogenic climate change. Regional Environmental
Change, 11(Suppl. 1), S127-S135.
Miettinen, J., A. Hooijer, C. Shi, D. Tollenaar, R. Vernimmen, S.C. Liew, C. Malins, and
S.E. Page, 2012: Extent of industrial plantations on Southeast Asian peatlands
in 2010 with analysis of historical expansion and future projections. Global
Change Biology Bioenergy, 4(6), 908-918.
Millennium Ecosystem Assessment, 2005a: Ecosystems and Human Well-Being:
Our Human Planet: Summary for Decision-Makers. A Report of the Millennium
Ecosystem Assessment, Island Press, Washington, DC, USA, 109 pp.
Millennium Ecosystem Assessment, 2005b: Ecosystems and Human Well-being:
Synthesis. A Report of the Millennium Ecosystem Assessment, Island Press,
Washington, DC, USA, 137 pp.
MNP, 2006: Intergrated Modelling of Global Environmental Change: An Overview of
IMAGE 2.4 [Bouwman, A.F., T. Kram, and K. Klein Goldewijk (eds.)]. MNP
publication number 500110002/2006, Netherlands Environmental Assessment
Agency (MNP), Bilthoven, Netherlands, 228 pp.
Mohan, J.E., L.H. Ziska, W.H. Schlesinger, R.B. Thomas, R.C. Sicher, K. George, and J.S.
Clark, 2006: Biomass and toxicity responses of poison ivy (Toxicodendron
radicans) to elevated atmospheric CO
2
. Proceedings of the National Academy
of Sciences of the United States of America, 103(24), 9086-9089.
Mooney, H., A. Larigauderie, M. Cesario, T. Elmquist, O. Hoegh-Guldberg, S. Lavorel,
G.M. Mace, M. Palmer, R. Scholes, and T. Yahara, 2009: Biodiversity, climate
change, and ecosystem services. Current Opinion in Environmental Sustainability,
1(1), 46-54.
Morgan, M.G. and M. Henrion, 1990: Uncertainty: A Guide to Dealing with
Uncertainty in Quantitative Risk and Policy Analysis. Cambridge University
Press, Cambridge, UK, 332 pp.
Morrow, D.R., R.E. Kopp, and M. Oppenheimer, 2009: Toward ethical norms and
institutions for climate engineering research. Environmental Research Letters,
4(4), 045106, doi:10.1088/1748-9326/4/4/045106.
Mougou, R., M. Mansour, A. Iglesias, R. Chebbi, and A. Battaglini, 2011: Climate
change and agricultural vulnerability: a case study of rain-fed wheat in Kairouan,
Central Tunisia. Regional Environmental Change, 11(Suppl. 1), S137-S142.
Müller, C., W. Cramer, W.L. Hare, and H. Lotze-Campen, 2011: Climate change risks
for African agriculture. Proceedings of the National Academy of Sciences of the
United States of America, 108(11), 4313-4315.
Murphy, D.M., 2009: Effect of stratospheric aerosols on direct sunlight and implications
for concentrating solar power. Environmental Science & Technology, 43(8),
2784-2786.
Murray, K.A., D. Rosauer, H. McCallum, and L.F. Skerratt, 2011: Integrating species
traits with extrinsic threats: closing the gap between predicting and preventing
species declines. Proceedings of the Royal Society B, 278(1711), 1515-1523.
Murray, S., P. Foster, and I. Prentice, 2012: Future global water resources with respect
to climate change and water withdrawals as estimated by a dynamic global
vegetation model. Journal of Hydrology, 448-449, 14-29.
Narita, D., K. Rehdanz, and R.S.J. Tol, 2012: Economic costs of ocean acidification: a
look into the impacts on global shellfish production. Climatic Change, 113,
1049-1063.
National Research Council, 2010: Ocean Acidification: A National Strategy to Meet
the Challenges of a Changing Ocean. Committee on the Development of an
Integrated Science Strategy for Ocean Acidification Monitoring, Research, and
Impacts Assessment, Division on Earth and Life Studies, National Research
Council, The National Academies Press, Washington, DC, USA, 188 pp.
National Research Council, 2011: Climate Stabilization Targets: Emissions,
Concentrations, and Impacts over Decades to Millennia. Committee on
Stabilization Targets for Atmospheric Greenhouse Gas Concentrations, Division
on Earth and Life Studies, National Research Council, The National Academies
Press, Washington, DC, USA, 286 pp.
UK NEA, 2011: The UK National Ecosystem Assessment: Synthesis of the Key Findings.
UK National Ecosystem Assessment (UK NEA) Project, United Nations
Environment Programme-World Conservation Monitoring Centre (UNEP-WCMC),
Cambridge, UK, 87 pp.
Neal, D.M. and B.D. Phillips, 1990: Female-dominated local social movement
organizations in disaster-threat situations. In: Women and Social Protest [West,
G. and R.L. Blumberg (eds.)]. Oxford University Press, New York, NY, USA, pp.
243-255.
Nelson, G.C., M.W. Rosegrant, J. Koo, R. Robertson, T.B. Sulser, Z. Tingju, C. Ringler, S.
Msangi, A. Palazzo, M. Batka, M. Magalhaes, R. Valmonte-Santos, M. Ewing, and
D. Lee, 2009: Climate Change: Impact on Agriculture and Costs of Adaptation.
International Food Policy Research Institute (IFPRI), Washington, DC, USA, 19 pp.
Nelson, G.C., M.W. Rosegrant, A. Palazzo, I. Gray, C. Ingersoll, R. Robertson, S. Tokgoz,
T. Zhu, T.B. Sulser, C. Ringler, S. Msangi, and L. You, 2010: Food Security, Farming,
and Climate Change to 2050: Scenarios, Results, Policy Options. International
Food Policy Research Institute, Washington, DC, USA, 131 pp.
Neumayer, E. and T. Plümper, 2007: The gendered nature of natural disasters: the
impact of catastrophic events on the gender gap in life expectancy, 1981-2002.
Annals of the Association of American Geographers, 97(3), 551-566.
Nicholls, R.J. and A. Cazenave, 2010: Sea-level rise and its impact on coastal zones.
Science, 328(5985), 1517-1520.
Nicholls, R.J. and C. Small, 2002: Improved estimates of coastal population and
exposure to hazards released. EOS, Transactions of the American Geophysical
Union, 83(28), 301-305, doi:10.1029/2002EO000216.
Nicholls, R.J. and R.S. Tol, 2006: Impacts and responses to sea-level rise: a global
analysis of the SRES scenarios over the twenty-first century. Philosophical
Transactions of the Royal Society A, 364(1841), 1073-1095.
Nicholls, R.J., R.S.J. Tol, and A. Vafeidis, 2008a: Global estimates of the impact of a
collapse of the West Antarctic ice sheet: an application of FUND. Climatic
Change, 91(1), 171-191.
Nicholls, R.J., S. Hanson, C. Herweijer, N. Patmore, S. Hallegatte, J. Corfee-Morlot, J.
Château, and R. Muir-Wood, 2008b: Ranking Port Cities with High Exposure
and Vulnerability to Climate Extremes: Exposure Estimates. OECD Environment
Working Papers, No.1, OECD Publishing, Paris, France, 62 pp., doi:10.1787/
011766488208.
Nicholls, R.J., N. Marinova, J.A. Lowe, S. Brown, P. Vellinga, D. de Gusmão, J. Hinkel,
and R.S.J. Tol, 2011: Sea-level rise and its possible impacts given a ‘beyond 4°C
world’ in the twenty-first century. Philosophical Transactions of the Royal
Society A, 369(1934), 161-181.
Norberg, J., M.C. Urban, M. Vellend, C.A. Klausmeier, and N. Loeuille, 2012: Eco-
evolutionary responses of biodiversity to climate change. Nature Climate
Change, 2, 747-751.
Nordås, R. and N.P. Gleditsch, 2007: Climate change and conflict. Political Geography,
26(6), 627-638.
O’Brien, K., L. Sygna, R. Leichenko, W.N. Adger, J. Barnett, T. Mitchell, L. Schipper, T.
Tanner, C. Vogel, and C. Mortreux, 2008: Disaster Risk Reduction, Climate
Change Adaptation and Human Security. Report prepared for the Royal
Norwegian Ministry of Foreign Affairs by the Global Environmental Change
and Human Security (GECHS) Project, GECHS Report 2008:3, University of Oslo,
Oslo, Norway, 76 pp.
O’Connor, F.M., O. Boucher, N. Gedney, C.D. Jones, G.A. Folberth, R. Coppell, P.
Friedlingstein, W.J. Collins, J. Chappellaz, J. Ridley, and C.E. Johnson, 2010:
Possible role of wetlands, permafrost, and methane hydrates in the methane
cycle under future climate change: a review. Reviews of Geophysics, 48(4),
RG4005, doi:10.1029/2010RG000326.
O’Connor, R., R. Bord, and A. Fisher, 1999: Risk perceptions, general environmental
beliefs, and willingness to address climate change. Risk Analysis 19(3), 461-
471.
O’Keefe, P., K. Westgate, and B. Wisner, 1976: Taking the naturalness out of natural
disasters. Nature, 260, 566-567.
O’Loughlin, J., F.D. Witmer, A.M. Linke, A. Laing, A. Gettelman, and J. Dudhia, 2012:
Climate variability and conflict risk in East Africa, 1990-2009. Proceedings of
the National Academy of Sciences of the United States of America, 109(45),
18344-18349.
O’Neill, B.C., K. Riahi, and I. Keppo, 2010: Mitigation implications of midcentury targets
that preserve long-term climate policy options. Proceedings of the National
Academy of Sciences of the United States of America, 107(3), 1011-1016.
O’Neill, B.C., E. Kriegler, K. Riahi, K.L. Ebi, S. Hallegatte, T.R. Carter, R. Mathur, and
D.P. van Vuuren, 2014: A new scenario framework for climate change research:
the concept of shared socioeconomic pathways. Climatic Change, 122(3), 387-
400.
O’Neill, M.S., 2003: Air conditioning and heat-related health effects. Applied
Environmental Science and Public Health, 111(16), 1861-1870.

1095
Emergent Risks and Key Vulnerabilities Chapter 19
19
Oman, L., A. Robock, G. Stenchikov, G.A. Schmidt, and R. Ruedy, 2005: Climatic
response to high-latitude volcanic eruptions. Journal of Geophysical Research,
110(D13), D13103, doi:10.1029/2004JD005487.
Oman, L., A. Robock, G.L. Stenchikov, and T. Thordarson, 2006: High-latitude eruptions
cast shadow over the African monsoon and the flow of the Nile. Geophysical
Research Letters, 33, L18711, doi:10.1029/2006GL027665.
Oppenheimer, M., 2005: Defining dangerous anthropogenic interference: the role
of science, the limits of science. Risk Analysis, 25(6), 1399-1407.
Oppenheimer, M., 2013: Climate change impacts: accounting for the human
response. Climatic Change, 117(3), 439-449.
Oppenheimer, M., B. O’Neill, and M. Webster, 2008: Negative learning. Climatic
Change, 89(1), 155-172.
Orlove, B., 2009: Glacier retreat: reviewing the limits of human adaptation to climate
change. Environment: Science and Policy for Sustainable Development, 51(3),
22-34.
Parry, M.L., C. Rosenzweig, A. Iglesias, M. Livermore, and G. Fischer, 2004: Effects of
climate change on global food production under SRES emissions and socio-
economic scenarios. Global Environmental Change, 14(1), 53-67.
Patt, A., D. van Vuuren, F. Berkhout, A. Aaheim, A. Hof, M. Isaac, and R. Mechler, 2010:
Adaptation in integrated assessment modeling: where do we stand? Climatic
Change, 99(3), 383-402.
Peacock, W., 1997: Hurricane Andrew: Ethnicity, Gender and the Sociology of Disasters.
Routledge, Abingdon, UK and New York, NY, USA, 304 pp.
Pearman, P.B., A. Guisan, and N.E. Zimmermann, 2011: Impacts of climate change
on Swiss biodiversity: an indicator taxa approach. Biological Conservation,
144(2), 866-875.
Peduzzi, P., B. Chatenoux, H. Dao, A. De Bono, C. Herold, J. Kossin, F. Mouton, and O.
Nordbeck, 2012: Global trends in tropical cyclone risk. Nature Climate Change,
2(4), 289-294.
Pelling, M., 2010: Adaptation to Climate Change: From Resilience to Transformation.
Routledge, Abingdon, UK and New York, NY, USA, 224 pp.
Pelling, M. and J.I. Uitto, 2001: Small island developing states: natural disaster
vulnerability and global change. Global Environmental Change Part B:
Environmental Hazards, 3(2), 49-62.
Pelling, M., C. High, J. Dearing, and D. Smith, 2008: Shadow spaces for social learning:
a relational understanding of adaptive capacity to climate change within
organizations. Environment and Planning, 40(4), 867-884.
Perch-Nielsen, S. (ed.), 2004: Understanding the Effect of Climate Change on Human
Migration: The Contribution of Mathematical and Conceptual Models. Diploma
Thesis, Department of Environmental Sciences, Swiss Federal Institute of
Technology, Zurich, Switzerland, 113 pp.
Petzoldt, C. and A. Seaman, 2006: Climate Change Effects on Insects and Pathogens.
New York State IPM Program, Geneva, New York, USA, 16 pp.
Phillips, O.L., L.E.O.C. Aragão, S.L. Lewis, J.B. Fisher, J. Lloyd, G. López-González, Y.
Malhi, A. Monteagudo, J. Peacock, C.A. Quesada, G. van der Heijden, S. Almeida,
I. Amaral, L. Arroyo, G. Aymard, T.R. Baker, O. Bánki, L. Blanc, D. Bonal, P. Brando,
J. Chave, Á.C.A. de Oliveira, N.D. Cardozo, C.I. Czimczik, T.R. Feldpausch, M.A.
Freitas, E. Gloor, N. Higuchi, E. Jiménez, G. Lloyd, P. Meir, C. Mendoza, A. Morel,
D.A. Neill, D. Nepstad, S. Patiño, M.C. Peñuela, A. Prieto, F. Ramírez, M. Schwarz,
J. Silva, M. Silveira, A.S. Thomas, H. ter Steege, J. Stropp, R. Vásquez, P.
Zelazowski, E.A. Dávila, S. Andelman, A. Andrade, K.-J. Chao, T. Erwin, A. Di Fiore,
E.H.C.,H. Keeling, T.J. Killeen, W.F. Laurance, A.P. Cruz, N.C.A. Pitman, P.N. Vargas,
H. Ramírez-Angulo, A. Rudas, R. Salamão, N. Silva, J. Terborgh, and A. Torres-
Lezama, 2009: Drought sensitivity of the Amazon rainforest. Science,
323(5919), 1344-1347.
Pielke Jr., R.A., 1998: Rethinking the role of adaptation in climate policy. Global
Environmental Change, 8(2), 159-170.
Pielke Jr., R.A., 2007: Future economic damage from tropical cyclones: sensitivities
to societal and climate changes. Philosophical Transactions of the Royal Society
A, 365(1860), 2717-2729.
Piguet, E., 2010: Linking climate change, environmental degradation, and migration:
a methodological overview. Wiley Interdisciplinary Reviews: Climate Change,
1(4), 517-524.
Pimentel, D., R. Zuniga, and D. Morrison, 2005: Update on the environmental and
economic costs associated with alien-invasive species in the United States.
Ecological Economics, 52, 273-288.
Pimentel, D., A. Marklein, M.A. Toth, M.N. Karpoff, G.S. Paul, R. McCormack, J. Kyriazis,
and T. Krueger, 2009: Food versus biofuels: environmental and economic costs.
Human Ecology, 37(1), 1-12.
Pimm, S.L., 2009: Climate disruption and biodiversity. Current Biology, 19(14), R595-
R601.
Piontek, F., C. Müller, T.A.M. Pugh, D.B. Clark, D. Deryng, J. Elliott, F. de Jesus Colón
González, M. Flörke, C. Folberth, W. Franssen, K. Frieler, A.D. Friend, S.N. Gosling,
D. Hemming, N. Khabarov, H. Kim, M.R. Lomas, Y. Masaki, M. Mengel, A. Morse,
K. Neumann, K. Nishina, S. Ostberg, R. Pavlick, A.C. Ruane, J. Schewe, E. Schmid,
T. Stacke, Q. Tang, Z.D. Tessler, A.M. Tompkins, L. Warszawski, D. Wisser, and H.J.
Schellnhuber, 2014: Multisectoral climate impact hotspots in a warming world.
Proceedings of the National Academy of Sciences of the United States of
America, 111(9), 3233-3238.
Pittock, J., 2011: National climate change policies and sustainable water management,
conflicts and synergies. Ecology and Society, 16(2), 25, www.ecologyand
society.org/vol16/iss2/art25/.
Plevin, R.J., 2009: Modeling corn ethanol and climate. Journal of Industrial Ecology,
13(4), 495-507.
Polasky, S., S.R. Carpenter, C. Folke, and B. Keeler, 2011: Decision-making under great
uncertainty: environmental management in an era of global change. Trends in
Ecology & Evolution, 26(8), 398-404.
Pongratz, J., D. Lobell, L. Cao, and K. Caldeira, 2012: Crop yields in a geoengineered
climate. Nature Climate Change, 2(2), 101-105.
Portmann, F.T., P. Döll, S. Eisner, and M. Flörke, 2013: Impact of climate change on
renewable groundwater resources: assessing the benefits of avoided greenhouse
gas emissions using selected CMIP5 climate projections. Environmental
Research Letters, 8(2), 024023, doi:10.1088/1748-9326/8/2/024023.
Poudel, B.N., K.P. Paudel, G. Timilsina, and D. Zilberman, 2012: Providing numbers
for a food versus fuel debate: an analysis of a future biofuel production scenario.
Applied Economic Perspectives and Policy, 24(4), 637-668.
Power, N.M. and J.D. Murphy, 2009: Which is the preferable transport fuel on a
greenhouse gas basis; biomethane or ethanol? Biomass and Bioenergy, 33(10),
1403-1412.
Preston, B.L., 2013: Local path dependence of US socioeconomic exposure to climate
extremes and the vulnerability commitment. Global Environmental Change,
23(4), 719-732.
Raghu, S., R.C. Anderson, C.C. Daehler, A.S. Davis, R.N. Wiedenmann, D. Simberloff,
and R.N. Mack, 2006: Adding biofuels to the invasive species fire? Science,
313(5794), 1742.
Randin, C.F., R. Engler, S. Normand, M. Zappa, N.E. Zimmermann, P.B. Pearman, P.
Vittoz, W. Thuiller, and A. Guisan, 2009: Climate change and plant distribution:
local models predict high-elevation persistence. Global Change Biology, 15(6),
1557-1569.
Ranger, N., 2011: Adaptation as a decision making under deep uncertainty. In:
Climate: Global Change and Local Adaptation [Linkov, I. and T.S. Bridges (eds.)].
NATO Science for Peace and Security Series C: Environmental Security, Springer
Science, Dordrecht, Netherlands, pp. 89-122.
Ranger, N., L. Gohar, J. Lowe, S. Raper, A. Bowen, and R. Ward, 2012: Is it possible to
limit global warming to no more than 1.5°C? Climatic Change, 111(3), 973-981.
Ranson, M., 2012: Crime, Weather, and Climate Change. Harvard Kennedy School
M-RCBG Associate Working Paper Series No. 8, Mossavar-Rahmani Center for
Business & Government, Harvard Kennedy School, Cambridge, MA, USA, 50 pp.
Rasmussen, A., 2002: The effects of climate change on the birch pollen season in
Denmark. Aerobiologia, 18(3), 253-265.
Ray-Bennett, N.S., 2009: The influence of caste, class and gender in surviving multiple
disasters: a case study from Orissa, India. Environmental Hazards, 8(1), 5-22.
Reed, D.A., M.D. Powell, and J.M. Westerman, 2010: Energy infrastructure damage
analysis for hurricane Rita. Natural Hazards Review, 11(3), 102-109.
Renaud, F., J. Birkmann, M. Damm, and G. Gallopín, 2010: Understanding multiple
thresholds of coupled social-ecological systems exposed to natural hazards as
external shocks. Natural Hazards, 55(3), 749-763.
Resources for the Future, 2009: The Global Adaptation Atlas. Online mapping tool
developed by Resources for the Future in collaboration with a diverse network
of partners, www.adaptationatlas.org.
Reuveny, R., 2007: Climate change-induced migration and violent conflict. Political
Geography, 26(6), 656-673.
Rhomberg, M., 2009: The Mass Media and the Risk Communication of Climate
Change: A Theoretical Observation. The Political Studies Association, London,
UK, 28 pp.
Rinaldi, S.M., J.P. Peerenboom, and T.K. Kelly, 2001: Identifying, understanding, and
analyzing critical infrastructure interdependencies. IEEE Control Systems
Magazine, 21(6), 11-25.

1096
Chapter 19 Emergent Risks and Key Vulnerabilities
19
Roberts, M.J. and W. Schlenker, 2013: Identifying supply and demand elasticities of
agricultural commodities: implications for the US ethanol mandate. American
Economic Review, 103(6), 2265-2295.
Robock, A., 2008a: Whither geoengineering? Science, 320(5880), 1166-1167.
Robock, A., 2008b: 20 Reasons why geoengineering may be a bad idea. Bulletin of
the Atomic Scientists, 64(2), 14-18.
Robock, A., L. Oman, and G.L. Stenchikov, 2008: Regional climate responses to
geoengineering with tropical and Arctic SO
2
injections. Journal of Geophysical
Research, 113, D16101, doi:10.1029/2008JD010050.
Robock, A., A. Marquardt, B. Kravitz, and G. Stenchikov, 2009: Benefits, risks, and
costs of stratospheric geoengineering. Geophysical Research Letters, 36(19),
L19703, doi:10.1029/2009GL039209.
Robock, A., D.G. MacMartin, R. Duren, and M.W. Christensen, 2013: Studying
geoengineering with natural and anthropogenic analogs. Climatic Change,
121(3), 445-458.
Rogelj, J., M. Meinshausen, and R. Knutti, 2012: Global warming under old and new
scenarios using IPCC climate sensitivity range estimates. Nature Climate
Change, 2(4), 248-253.
Rogers, C.A., P.M. Wayne, E.A. Macklin, M.L. Muilenberg, C.J. Wagner, P.R. Epstein, and
F.A. Bazzaz, 2006: Interaction of the onset of spring and elevated atmospheric
CO
2
on ragweed (Ambrosia artemisiifolia L.) pollen production. Environmental
Health Perspectives, 114(6), 865-869.
Rohr, J.R. and T.R. Raffel, 2010: Linking global climate and temperature variability to
widespread amphibian declines putatively caused by disease. Proceedings of
the National Academy of Science of the United States of America, 107(18),
8269-8274, doi:10.1073/pnas.0912883107.
Root, T.L. and S.H. Schneider, 2006: Conservation and climate change: the challenges
ahead. Conservation Biology, 20(3), 706-708.
Rosenzweig, C. and D. Hillel, 2008: Climate Variability and the Global Harvest:
Impacts of El Nino and Other Oscillations on Agro-Ecosystems. Oxford University
Press, New York, NY, USA, 280 pp.
Roson, R. and D. Van der Mensbrugghe, 2012: Climate change and economic growth:
impacts and interactions. Int’l Journal of Sustainable Economy, 4(3), 270-285.
Rothausen, S.G.S.A. and D. Conway, 2011: Greenhouse-gas emissions from energy
use in the water sector. Nature Climate Change, 1(4), 210-219.
Rothman, D.S., P. Romero-Lankao, V.J. Schweizer, and B.A. Bee, 2014: Challenges to
adaptation: a fundamental concept for the shared socio-economic pathways
and beyond. Special Issue of Climatic Change, 122(3), 495-507.
Rötter, R.P., T.R. Carter, J.E. Olesen, and J.R. Porter, 2011: Crop-climate models need
an overhaul. Nature Climate Change, 1(4), 175-177.
Rusin, N. and L. Flit, 1960: Man Versus Climate. Peace Publishers, Moscow, Russia,
175 pp.
Russell, L.M., P.J. Rasch, G.M. Mace, R.B. Jackson, J. Shepherd, P. Liss, M. Leinen, D.
Schimel, N.E. Vaughan, A.C. Janetos, P.W. Boyd, R.J. Norby, K. Caldeira, J.
Merikanto, P. Artaxo, J. Melillo, and M.G. Morgan, 2012: Ecosystem impacts of
geoengineering: a review for developing a science plan. Ambio, 41(350-369),
doi:10.1007/s13280-012-0258-5.
Sala, O.E., F.S. Chapin III, J.J. Armesto, E. Berlow, J. Bloomfield, R. Dirzo, E. Huber-
Sanwald, L.F. Huenneke, R.B. Jackson, A. Kinzig, R. Leemans, D.M. Lodge, H.A.
Mooney, M. Oesterheld, N. LeRoy Poff, M.T. Sykes, B.H. Walker, M. Walker, and
D.H. Wall, 2000: Global biodiversity scenarios for the year 2100. Science,
287(5459), 1770-1774.
Salter, S., G. Sortino, and J. Latham, 2008: Sea-going hardware for the cloud albedo
method of reversing global warming. Philosophical Transactions of the Royal
Society A, 366(1882), 3989-4006.
Sander, K. and G.S. Murthy, 2010: Life cycle analysis of algae biodiesel. The
International Journal of Life Cycle Assessment, 15(7), 704-714.
Scheffran, J., M. Brzoska, J. Kominek, P.M. Link, and J. Schilling, 2012: Climate change
and violent conflict. Science, 336(6083), 869-871.
Schewe, J., J. Heinke, D. Gerten, I. Haddeland, N.W. Arnell, D.B. Clark, R. Dankers, S.
Eisner, B.M. Fekete, F.J. Colón-González, S.N. Gosling, H. Kim, X. Liu, Y. Masaki,
F.T. Portmann, Y. Satoh, T. Stacke, Q. Tang, Y. Wada, D. Wisser, T. Albrecht, K. Frieler,
F. Piontek, L. Warszawski, and P. Kabat, 2013: Multi-model assessment of water
scarcity under climate change. Proceedings of the National Academy of Sciences
of the United States of America, published ahead of print 16 December 2013,
doi:10.1073/pnas.1222460110.
Schmidhuber, J. and F.N. Tubiello, 2007: Climate change and food security special
feature: global food security under climate change. Proceedings of the National
Academy of Sciences of the United States of America, 104(50), 19703-19708.
Schmidt, H., K. Alterskjær, D. Bou Karam, O. Boucher, A. Jones, J.E. Kristjánsson, U.
Niemeier, M. Schulz, A. Aaheim, F. Benduhn, M. Lawrence, and C. Timmreck,
2012: Can a reduction of solar irradiance counteract CO
2
-induced climate
change? – results from four Earth system models. Earth System Dynamics, 3,
63-78.
Schneider, S.H., S. Semenov, A. Patwardhan, I. Burton, C.H.D. Magadza, M.
Oppenheimer, A.B. Pittock, A. Rahman, J.B. Smith, A. Suarez, and F. Yamin, 2007:
Assessing key vulnerabilities and the risk from climate change. In: Climate
Change 2007: Impacts, Adaptation and Vulnerability. Contribution of Working
Group II to the Fourth Assessment Report of the Intergovernmental Panel on
Climate Change [Parry, M.L., O.F. Canziani, J.P. Palutikof, P.J. van der Linden, and
C.E. Hanson (eds.)]. Cambridge University Press, Cambridge, UK and New York,
NY, USA, pp. 779-810.
Schnitzler, J., J. Benzler, D. Altmann, I. Mücke, and G. Krause, 2007: Survey on the
population’s needs and the public health response during floods in Germany
2002. Journal of Public Health Management and Practice, 13(5), 461-464.
Schröter, D., 2005: Assessing vulnerabilities to the effects of global change: an eight
step approach. Mitigation and Adaptation Strategies for Global Change, 10(4),
573-595.
Searchinger, T., R. Heimlich, R.A. Houghton, F. Dong, A. Elobeid, J. Fabiosa, S. Tokgoz,
D. Hayes, and T. Yu, 2008: Use of US croplands for biofuels increases greenhouse
gases through emissions from land-use change. Science, 319(5867), 1238-
1240.
Şekercioğlu, Ç.H., 2008: Climate change, elevational range shifts, and bird extinctions.
Conservation Biology, 22(1), 140-150.
Şekercioğlu, Ç.H., R.B. Primack, and J. Wormworth, 2012: The effects of climate
change on tropical birds. Biological Conservation, 148(1), 1-18.
Selig, E.R., K.S. Casey, and J.F. Bruno, 2012: Temperature-driven coral decline: the
role of marine protected areas. Global Change Biology, 18(5), 1561-1570.
Sen, A., 1981: Poverty and Famines. An Essay on Entitlements and Deprivation.
Clarendon Press, Oxford, UK, 257 pp.
Shea, K.M., R.T. Truckner, R.W. Weber, and D.B. Peden, 2008: Climate change and
allergic disease. Journal of Allergy and Clinical Immunology, 122(3), 443-453.
Shepard, C.C., C.M. Crain, and M.W. Beck, 2011: The protective role of coastal
marches: a systemic review and meta-analysis. PLOS ONE, 6(11), e27374,
doi:10.1371/journal.pone.0027374.
Shepherd, J., K. Caldeira, P. Cox, J. Haigh, D. Keith, B. Launder, G. Mace, G. MacKerron,
J. Pyle, S. Rayner, C. Redgwell, and A. Watson, 2009: Geoengineering the
Climate: Science, Governance and Uncertainty. The Royal Society, London, UK,
82 pp.
Sherwood, S.C. and M. Huber, 2010: An adaptability limit to climate change due to
heat stress. Proceedings of the National Academy of Sciences of the United
States of America, 107(21), 9552-9555.
Shi, Y., R.S. Wang, J.L. Huang, and W.R. Yang, 2012: An analysis of the spatial and
temporal changes in Chinese terrestrial ecosystem service functions. Chinese
Science Bulletin, 57(17), 2120-2131.
Sietz, D., M.K. Lüdeke, and C. Walther, 2011: Categorisation of typical vulnerability
patterns in global drylands. Global Environmental Change, 21(2), 431-440.
Sietz, D., S.E. Manani Choque, and M.K.B. Lüdeke, 2012: Typical patterns of
smallholder vulnerability to weather extremes with regard to food security in
the Peruvian Altiplano. Regional Environmental Change, 12(3), 489-505.
Silverman, J., 2009: Coral reefs may start dissolving when atmospheric CO
2
doubles.
Geophysical Research Letters, 36(5), L05606, doi:10.1029/2008GL036282.
Singer, B.D., L.H. Ziska, D.A. Frenz, D.E. Gebhard, and J.G. Straka, 2005: Increasing
Amb a 1 content in common ragweed (Ambrosia artemisiifolia) pollen as a
function of rising atmospheric CO
2
concentration. Functional Plant Biology,
32(7), 667-670.
Skaggs, R., K. Hibbard, P. Frumhoff, T. Lowry, R. Middleton, R. Pate, V. Tidwell, J. Arnold,
K. Averyt, and A. Janetos, 2012: Climate and Energy-Water-Land System
Interactions.Technical Report PNNL-21185 to the U.S. Department of Energy in
support of the National Climate Assessment, Pacific Northwest National
Laboratory, Richland, WA, USA, 152 pp.
Slovic, P., 1993: Perceived risk, trust, and democracy. Risk Analysis, 13(6), 675-682.
Slovic, P., 2010: The Feeling of Risk: New Perspectives on Risk Perception. Earthscan,
London, UK, 425 pp.
Slovic, P., B. Fischoff, and S. Lichtenstein, 1982: Facts versus fears: understanding
perceived risk. In: Judgment Under Uncertainty: Heuristics and Biases [Kahneman,
D., P. Slovic, and A. Tversky (eds.)]. Cambridge University Press, New York, NY,
USA, pp. 463-489.

1097
Emergent Risks and Key Vulnerabilities Chapter 19
19
Smit, B. and J. Wandel, 2006: Adaptation, adaptive capacity and vulnerability. Global
Environmental Change, 16(3), 282-292.
Smit, B., I. Burton, R.J.T. Klein, and R. Street, 1999: The science of adaptation: a
framework for assessment. Mitigation and Adaptation Strategies for Global
Change, 4(3), 199-213.
Smith, J.B., H.-J. Schellnhuber, M.M.Q. Mirza, S. Fankhauser, R. Leemans, L. Erda, L.
Ogallo, B. Pittock, R. Richels, C. Rosenzweig, U. Safriel, R.S.J. Tol, J. Weyant, and
G.W. Yohe, 2001: Vulnerability to climate change and reasons for concern: a
synthesis. In: Climate Change 2001: Impacts, Adaptation, and Vulnerability.
Contribution of Working Group II to the Third Assessment Report of the
Intergovernmental Panel on Climate Change [McCarthy, J.J., O.F. Canziani, N.A.
Leary, D.J. Dokken, and J.S. White (eds.)]. Cambridge University Press,
Cambridge, UK and New York, NY, USA, pp. 913-967.
Smith, J.B., S.H. Schneider, M. Oppenheimer, G.W. Yohe, W. Hare, M.D. Mastrandrea,
A. Patwardhan, I. Burton, J. Corfee-Morlot, C.H.D. Magadza, H.-M. Füssel, A.B.
Pittock, A. Rahman, A. Suarez, and J.-P. van Ypersele, 2009: Assessing dangerous
climate change through an update of the Intergovernmental Panel on Climate
Change (IPCC) “reasons for concern”. Proceedings of the National Academy
of Sciences of the United States of America, 106(11), 4133-4137.
Smith, P., H. Haberl, A. Popp, K.-h. Erb, C. Lauk, R. Harper, F.N. Tubiello, A. de Siquera
Pinto, M. Jafari, S. Sohi, O. Masera, H. Böttcher, G. Berndes, M. Bustamante, H.
Ahammad, H. Clark, H. Dong, E.A. Elsiddig, C. Mbow, N.H. Ravindranath, C.W.
Rice, C.R. Abad, A. Romanovskaya, F. Sperling, M. Herrero, J.I. House, and S.
Rose, 2013: How much land-based greenhouse gas mitigation can be achieved
without compromising food security and environmental goals? Global Change
Biology, 19(8), 2285-2302.
Smithers, J. and B. Smit, 1997: Human adaptation to climatic variability and change.
Global Environmental Change, 7(2), 129-146.
Solomon, S., 1999: Stratospheric ozone depletion: a review of concepts and history.
Reviews of Geophysics, 37(3), 275-316.
Stafoggia, M., F. Forastiere, D. Agostini, A. Biggeri, L. Bisanti, E. Cadum, N. Caranci, F.
de’Donato, S. De Lisio, M. De Maria, P. Michelozzi, R. Miglio, P. Pandolfi, S.
Picciotto, M. Rognoni, A. Russo, C. Scarnato, and C.A. Perucci, 2006: Vulnerability
to heat-related mortality: a multicity, population-based, case-crossover analysis.
Epidemiology, 17(3), 315-323.
Stagg, C.L. and I.A. Mendelssohn, 2010: Restoring ecological function to a
submerged salt marsh. Restoration Ecology, 18(Suppl. s1), 10-17.
Staudinger, M.D., N.B. Grimm, A. Staudt, S.L. Carter, F.S. Chapin III, P. Kareiva, M.
Ruckelshaus, and B.A. Stein, 2012: Impacts of Climate Change on Biodiversity,
Ecosystems, and Ecosystem Services: Technical Input to the 2013 National
Climate Assessment. Cooperative Report to the 2013 National Climate
Assessment, United States Global Change Research Program, Washington, DC,
USA, 296 pp.
Sterner, T. and U.M. Persson, 2008: An even sterner review: introducing relative prices
into the discounting debate. Review of Environmental Economics and Policy,
2(1), 61-76.
Stover, E. and P. Vinck, 2008: Cyclone Nargis and the politics of relief and
reconstruction aid in Burma (Myanmar). JAMA: The Journal of the American
Medical Association, 300(6), 729-731.
Strzepek, K. and B. Boehlert, 2010: Competition for water for the food system.
Philosophical Transactions of the Royal Society B, 365(1554), 2927-2940.
Stuart, S.N., J.S. Chanson, N.A. Cox, B.E. Young, A.S.L. Rodrigues, D.L. Fischman, and
R.W. Waller, 2004: Status and trends of amphibian declines and extinctions
worldwide. Science, 306(5702), 1783-1786.
Sultana, F., 2010: Living in hazardous waterscapes: gendered vulnerabilities and
experiences of floods and disasters. Environmental Hazards, 9(1), 43-53.
Susman, P., P. O’Keefe, and B. Wisner, 1983: Global disasters, a radical interpretation.
In: Interpretations of Calamity [Hewitt, K. (ed.)]. Allen & Unwin, Inc., Winchester,
MA, USA, pp. 264-283.
Swart, R. and N. Marinova, 2010: Policy options in a worst case climate change world.
Mitigation and Adaptation Strategies for Global Change, 15(6), 531-549.
Tacoli, C., 2009: Crisis or adaptation? Migration and climate change in a context of
high mobility. Environment and Urbanization, 21(2), 513-525.
Tao, F., M. Yokozawa, J. Liu, and Z. Zhang, 2008: Climate-crop yield relationships at
provincial scales in China and the impacts of recent climate trends. Climate
Research, 38(1), 83-94.
Taub, D.R., B. Miller, and H. Allen, 2008: Effects of elevated CO
2
on the protein
concentration of food crops: a meta-analysis. Global Change Biology, 14(3),
565-575.
te Linde, A.H., P. Bubeck, J.E.C. Dekkers, H. de Moel, and J.C.J.H. Aerts, 2011: Future
flood risk estimates along the river Rhine. Natural Hazards and Earth System
Science, 11(2), 459-473.
Theisen, O.M., H. Holtermann, and H. Buhaug, 2011: Climate wars? Assessing the
claim that drought breeds conflict. International Security, 36(3), 79-106.
Thomalla, F., T. Downing, E. Spanger-Siegfried, G. Han, and J. Rockström, 2006:
Reducing hazard vulnerability: towards a common approach between disaster
risk reduction and climate adaptation. Disasters, 30(1), 39-48.
Thornton, P.K., P.G. Jones, P.J. Ericksen, and A.J. Challinor, 2011: Agriculture and food
systems in sub-Saharan Africa in a 4°C+ world. Philosophical Transactions of
the Royal Society A, 369(1934), 117-136.
Thywissen, K., 2006: Core terminology of disaster reduction: a comparative glossary.
In: Measuring Vulnerability to Natural Hazards: Towards Disaster Resilient
Societies [Birkmann, J. (ed.)]. United Nations University Press, Tokyo, Japan, pp.
448-484.
Tidwell, V.C., P.H. Kobos, L.A. Malczynski, G. Klise, and C.R. Castillo, 2011: Exploring
the water-thermoelectric power Nexus. Journal of Water Resources Planning
and Management, 138(5), 491-501.
Tilman, D., C. Balzer, J. Hill, and B.L. Befort, 2011: Global food demand and the
sustainable intensification of agriculture. Proceedings of the National Academy
of Sciences of the United States of America, 108(50), 20260-20264.
Tilmes, S., R. Müller, and R. Salawitch, 2008: The sensitivity of polar ozone depletion
to proposed geoengineering schemes. Science, 320(5880), 1201-1204.
Tol, R.S.J., 2009: The feasibility of low concentration targets: an application of FUND.
Energy Economics, 31(Suppl. 2), S121-S130.
Tol, R.S.J. and G.W. Yohe, 2006: Of dangerous climate change and dangerous emission
reduction. In: Avoiding Dangerous Climate Change [Schellnhüber, H.J., W.
Cramer, N. Nakicenovic, T.M.L. Wigley, and G.W. Yohe (eds.)]. Cambridge
University Press, Cambridge, UK, pp. 291-298.
Toms, J.D., J. Faaborg, and W.J. Arendt, 2012: Climate change and birds in the
forgotten tropics: the importance of tropical dry forests. Ibis, 154(3), 632-634.
Transparency International, 2012: The Corruption Perception Index 2011.
Transparency International, Berlin, Germany, 7 pp.
Trenberth, K.E. and A. Dai, 2007: Effects of Mount Pinatubo volcanic eruption on the
hydrological cycle as an analog of geoengineering. Geophysical Research
Letters, 34(15), L15702, doi:10.1029/2007GL030524.
Tschakert, P. and K.A. Dietrich, 2010: Anticipatory learning for climate change
adaptation and resilience. Ecology and Society, 15(2), 11, www.ecologyand
society.org/vol15/iss2/art11/.
Tubiello, F.N. and G. Fischer, 2007: Reducing climate change impacts on agriculture:
global and regional effects of mitigation, 2000-2080. Technological Forecasting
and Social Change, 74(7), 1030-1056.
Turner, B.L. II, R.E. Kasperson, P.A. Matson, J.J. McCarthy, R.W. Corell, L. Christensen,
N. Eckley, J.X. Kasperson, A. Luers, M.L. Martello, C. Polsky, A. Pulsipher, and A.
Schiller, 2003a: A framework for vulnerability analysis in sustainability science.
Proceedings of the National Academy of Sciences of the United States of
America, 100(14), 8074-8079.
Turner, B.L. II, P.A. Matson, J.J. McCarthy, R.W. Corell, L. Christensen, N. Eckley, G.K.
Hovelsrud-Broda, J.X. Kasperson, R.E. Kasperson, A. Luers, M.L. Martello, S.
Mathiesen, R. Naylor, C. Polsky, A. Pulsipher, A. Schiller, H. Selin, and N. Tyler,
2003b: Illustrating the coupled human-environment system for vulnerability
analysis: three case studies. Proceedings of the National Academy of Sciences
of the United States of America, 100(14), 8080-8085.
Twigg, J., 2001: Sustainable Livelihoods and Vulnerability to Disasters. Benfield Greig
Hazard Research Centre, Disaster Management Working Paper 2/2001, Prepared
by the Benfield Greig Hazard Research Centre for the Disaster Mitigation
Institute (DMI), London, UK, 18 pp., www.eird.org/cd/on-better-terms/docs/
Twigg-Sustainable-livelihoods-and-vulnerability-to-disasters.pdf.
UNDP, 2007: Human Development Report 2007/2008. Fighting Climate Change:
Human Solidarity in a Divided World. United Nations Development Programme
(UNDP), Palgrave Macmillan, Houndmills, UK and New York, NY, USA, 399 pp.
UNDRO, 1980: Natural Disasters and Vulnerability Analysis. Report of Expert Group
Meeting 9-12 July 1979, Office of the United Nations Disaster Relief Co-ordinator
(UNDRO), Geneva, Switzerland, 49 pp.
UNEP, 2007: Global Environment Outlook 4. United Nations Environment Programme,
Nairobi, Kenya, 540 pp.
UNISDR, 2004: Living with Risk: A Global Review of Disaster Reduction Initiatives.
Vol. 1, United Nations Office for Disaster Risk Reduction (UNISDR), Geneva,
Switzerland, 430 pp.

1098
Chapter 19 Emergent Risks and Key Vulnerabilities
19
UNISDR, 2009: Reducing Disaster Risk through Science: Issues and Actions. Full Report
of the Scientific and Technical Committee 2009, United Nations International
Strategy for Disaster Reduction (UNISDR), Geneva, Switzerland, 23 pp.
UNISDR, 2011: Global Assessment Report on Disaster Risk Reduction. United Nations
Office for Disaster Reduction (UNISDR), Geneva, Switzerland, 178 pp.
UNISDR, 2013: Global Assessment Report on Disaster Risk Reduction 2013. United
Nations Office for Disaster Reduction (UNISDR), Geneva, Switzerland, pp. 288.
Urban, N.M. and K. Keller, 2010: Probabilistic hindcasts and projections of the coupled
climate, carbon cycle and Atlantic meridional overturning circulation system: a
Bayesian fusion of century-scale observations with a simple model. Tellus A,
62(5), 737-750.
US DOE and BLM, 2012: Final Programmatic Environmental Impact Statement (PEIS)
for Solar Energy Development in Six Southwestern States. FES 12-24 • DOE/EIS-
0403, Prepared by the U.S. Department of Energy (DOE), Office of Energy
Efficiency and Renewable Energy (EERE), and The U.S. Department of the
Interior (DOI), U.S. Bureau of Land Management, with assistance from Argonne
National Laboratory, Washington, DC, USA, solareis.anl.gov/Documents/fpeis/
index.cfm.
USDA, 2013: Table 5. Corn Supply, Disappearance, and Share of Total Corn used for
Ethanol. U.S. Department of Agriculture (USDA) Economic Research Service
(ERS), U.S. Bioenergy Statistics, Washington, DC, USA, 8 pp., www.ers.usda.gov/
data-products/us-bioenergy-statistics.aspx#.Ux-g9_ldXTo.
van Nes, E.H. and M. Scheffer, 2005: Implications of spatial heterogeneity for
catastrophic regime shifts in ecosystems. Ecology, 86, 1797-1807.
van Sluis, E. and M. van Aalst, 2006: Climate change and disaster risk in urban
environments. Humanitarian Exchange Magazine, (35), 20-23.
van Vliet, J., M. van den Berg, M. Schaeffer, D.P. van Vuuren, M. den Elzen, A.F. Hof,
A.M. Beltran, and M. Meinshausen, 2012: Copenhagen Accord pledges imply
higher costs for staying below 2°C warming. Climatic Change, 113, 551-561.
van Vuuren, D.P., E. Bellevrat, A. Kitous, and M. Isaac, 2010: Bio-energy use and low
stabilization scenarios. The Energy Journal, 31(SI 1), 192-222.
van Vuuren, D.P., E. Stehfest, M.G. den Elzen, T. Kram, J. van Vliet, S. Deetman, M.
Isaac, K. Klein Goldewijk, A. Hof, and A. Mendoza Beltran, 2011: RCP2. 6:
exploring the possibility to keep global mean temperature increase below 2ºC.
Climatic Change, 109(1), 95-116.
van Vuuren, D.P., M.T. Kok, B. Girod, P.L. Lucas, and B. de Vries, 2012: Scenarios in
global environmental assessments: key characteristics and lessons for future
use. Global Environmental Change, 22(4), 884-885.
Villagrán de León, J.C., 2006: Vulnerability: A Conceptual and Methodological
Review.SOURCE Publication Series of UNU-EHS, No. 4, United Nations University
Institute for Environment and Human Security (UNU-EHS), Bonn, Germany,
64 pp.
Vrij, A., J. Van der Steen, and L. Koppelaar, 1994: Aggression of police officers as a
function of temperature: an experiment with the Fire Arms Training System.
Journal of Community & Applied Social Psychology, 4(5), 365-370.
Wada, Y., D. Wisser, S. Eisner, M. Flörke, D. Gerten, I. Haddeland, N. Hanasaki, Y. Masaki,
F.T. Portmann, T. Stacke, Z. Tessler, and J. Schewe, 2013: Multimodel projections
and uncertainties of irrigation water demand under climate change. Geophysical
Research Letters, 40(17), 4626-4632.
Waldhoff, S. and A. Fawcett, 2011: Can developed economies combat dangerous
anthropogenic climate change without near-term reductions from developing
economies? Climatic Change, 107(3), 635-641.
Walker, B. and D. Salt, 2006: Resilience Thinking: Sustaining Ecosystems and People
in a Changing World. Island Press, Washington, DC, USA, 192 pp.
Wallander, S., R. Claassen, and C. Nickerson, 2011: The Ethanol Decade: An Expansion
of U.S. Corn Production, 2000-09, EIB-79. U.S. Department of Agriculture,
Economic Research Service, 16 pp., http://www.ers.usda.gov/ersDownload
Handler.ashx?file=/media/121204/eib79.pdf.
Wang, J., S.G.S.A. Rothausen, D. Conway, L. Zhang, W. Xiong, I.P. Holman, and Y. Li,
2012: China’s water-energy nexus: greenhouse-gas emissions from groundwater
use for agriculture. Environmental Research Letters, 7(1), 014035, doi:10.1088/
1748-9326/7/1/014035.
Wang, S., L. Hong, and X. Chen, 2012: Vulnerability analysis of interdependent
infrastructure systems: a methodological framework. Physica A: Statistical
Mechanics and its Applications, 391(11), 3323-3335.
Ward, P.J., M.A. Marfai, F. Yulianto, D.R. Hizbaron, and J.C.J.H. Aerts, 2011: Coastal
inundation and damage exposure estimation: a case study for Jakarta. Natural
Hazards, 56(3), 899-916.
Wardle, D.A., R.D. Bardgett, R.M. Callaway, and W.H. Van der Putten, 2011: Terrestrial
ecosystem responses to species gains and losses. Science, 332(6035), 1273-
1277.
Warner, K., 2010: Global environmental change and migration: governance challenges.
Global Environmental Change, 20(3), 402-413.
Warner, K., K. van der Geest, S. Kreft, S. Huq, S. Harmeling, K. Kusters and A. de
Sherbinin, 2012: Evidence from the Frontlines of Cimate Change: Loss and
Damage to Communities despite Coping and Adaptation. Loss and Damage in
Vulnerable Countries Initiative, UNU Policy Report 9, United Nations University
Institute for Environment and Human Security (UNU-EHS), Bonn, Germany, 86
pp.
Warren, R., 2011: The role of interactions in a world implementing adaptation and
mitigation solutions to climate change. Philosophical Transactions of the Royal
Society A, 369(1934), 217-241.
Warren, R., C. Hope, M. Mastrandrea, R.S.J. Tol, W.N. Adger, and I. Lorenzoni, 2006:
Spotlighting the Impacts Functions in Integrated Assessments. Research Report
Prepared for the Stern Review on the Economics of Climate Change, Working
Paper 91, Tyndall Centre for Climate Change Research, University of East Anglia,
Norwich, UK, 216 pp.
Warren, R., S. de la Nava Santos, N.W. Arnell, M. Bane, T. Barker, C. Barton, R. Ford,
H.-M. Füssel, R.K.S. Hankin, R. Klein, C. Linstead, J. Kohler, T.D. Mitchell, T.J.
Osborn, H. Pan, S.C.B. Raper, G. Riley, H.J. Schellnhüber, S. Winne, and D. Anderson,
2008: Development and illustrative outputs of the Community Integrated
Assessment System (CIAS), a multi-institutional modular integrated assessment
approach for modelling climate change. Environmental Modelling & Software,
23(5), 592-610.
Warren, R., J. Price, A. Fischlin, S. de la Nava Santos, and G. Midgley, 2011: Increasing
impacts of climate change upon ecosystems with increasing global mean
temperature rise. Climatic Change, 106(2), 141-177.
Warren, R., J. VanDerWal, J. Price, J. Welbergen, I. Atkinson, J. Ramirez-Villegas, T.
Osborn, A. Jarvis, L. Shoo, and S. Williams, 2013a: Quantifying the benefit of
early climate change mitigation in avoiding biodiversity loss. Nature Climate
Change, 3, 678-682.
Warren, R., J. Lowe, N. Arnell, C. Hope, P. Berry, S. Brown, A. Gambhir, S. Gosling, R.
Nicholls, and J. O’Hanley, 2013b: The AVOID Programme’s new simulations of
the global benefits of stringent climate change mitigation. Climatic Change,
120(1-2), 55-70.
Watkiss, P. and A. Hunt, 2012: Projection of economic impacts of climate change in
sectors of Europe based on bottom up analysis: human health. Climatic Change,
112(1), 101-126.
Wayne, P., S. Foster, J. Connolly, F. Bazzaz, and P. Epstein, 2002: Production of allergenic
pollen by ragweed (Ambrosia artemisiifolia L.) is increased in CO
2
-enriched
atmospheres. Annals of Allergy, Asthma & Immunology, 88(3), 279-282.
Webber, B.L. and J.K. Scott, 2012: Rapid global change: implications for defining
natives and aliens. Global Ecology and Biogeography, 21(3), 305-311.
Weber, E.U., 2006: Experience-based and description-based perceptions of long-term
risk: why global warming does not scare us (yet). Climatic Change, 77(1), 103-
120.
Weber, E.U., 2010: What shapes perceptions of climate change? Wiley Interdisciplinary
Reviews: Climate Change, 1(3), 332-342.
Webster, M.D., 2008: Incorporating path-dependency into decision analytic methods:
an application to global climate change policy. Decision Analysis, 5(2), 60-75.
Weitzman, M.L., 2010: What is the “damages function” for global warming – and
what difference might it make? Climate Change Economics, 1(1), 57-69.
Welle, T., J. Birkmann, J. Rhyner, M. Witting, and J. Wolfertz, 2012: WorldRiskIndex
2012: concept, updating and results. In: World Risk Report 2012 [Brodbeck, N.
(ed.)]. Alliance Development Works, Berlin, Germany, pp. 11-26.
Wieser, H., R. Manderscheid, M. Erbs, and H. Weigel, 2008: Effects of elevated
atmospheric CO
2
concentrations on the quantitative protein composition of
wheat grain. Journal of Agricultural and Food Chemistry, 56(15), 6531-6535.
Wiltshire, A.J., G. Kay, J.L. Gornall, and R.A. Betts, 2013: The impact of climate, CO
2
and
population on regional food and water resources in the 2050s. Sustainability,
5(5), 2129-2151.
Wise, M., K. Calvin, A. Thomson, L. Clarke, B. Bond-Lamberty, R. Sands, S.J. Smith, A.
Janetos, and J. Edmonds, 2009: Implications of limiting CO
2
concentrations for
land use and energy. Science, 324(5931), 1183-1186.
Wisner, B., 1998: Marginality and vulnerability: why the homeless of Tokyo don’t
‘count’ in disaster preparations. Applied Geography, 18(1), 25-33.

1099
Emergent Risks and Key Vulnerabilities Chapter 19
19
Wisner, B., 2006: Let Our Children Teach Us! A Review of the Role of Education and
Knowledge in Disaster Risk Reduction. ISDR System Thematic Cluster / Platform
on Knowledge and Education, Books for Change, Bangalore, India, 135 pp.
Wisner, B., P. Blaikie, T. Cannon, and I. Davis, 2004: At Risk: Natural Hazards, People’s
Vulnerability and Disasters. Routledge, Abingdon, UK and New York, NY, USA,
471 pp.
World Bank, 2010: World Development Report 2010: Development and Climate
Change. The International Bank for Reconstruction and Development / The
World Bank, Washington, DC, USA, 439 pp.
World Bank, 2011: World Development Report 2011: Conflict, Security, and
Development. The International Bank for Reconstruction and Development /
The World Bank, Washington, DC, USA, 416 pp.
World Bank, 2012: Poverty Data. The World Bank Group, Washington, DC, USA,
data.worldbank.org/topic/poverty.
World Commission on Dams, 2000: Dams and Development: A New Framework
for Decision-Making. Earthscan, London, UK, 356 pp.
Wright, S.J., H.C. Muller-Landau, and J. Schipper, 2009: The future of tropical species
on a warmer planet. Conservation Biology, 23(6), 1418-1426.
Yang, Y., J. Bae, J. Kim, and S. Suh, 2012: Replacing gasoline with corn ethanol results
in significant environmental problem-shifting. Environmental Science and
Technology, 46(7), 3671-3678.
Yohe, G.W. and D. Tirpak, 2008: A research agenda to improve economic estimates
of the benefits of climate change policies. Integrated Assessment, 8(1), 1-17.
Yohe, G. and R.S.J. Tol, 2002: Indicators for social and economic coping capacity –
moving toward a working definition of adaptive capacity. Global Environmental
Change, 12(1), 25-40.
Zickfeld, K. and T. Bruckner, 2008: Reducing the risk of Atlantic thermohaline
circulation collapse: sensitivity analysis of emissions corridors. Climatic Change,
91(3), 291-315.
Zickfeld, K., A. Levermann, M.G. Morgan, T. Kuhlbrodt, S. Rahmstorf, and D.W. Keith,
2007: Expert judgements on the response of the Atlantic meridional overturning
circulation to climate change. Climatic Change, 82(3), 235-265.
Ziervogel, G. and P.J. Ericksen, 2010: Adapting to climate change to sustain food
security. Wiley Interdisciplinary Reviews: Climate Change, 1(4), 525-540.
Zilberman, D., G. Hochman, and D. Rajagopal, 2011: Indirect land use change: a
second-best solution to a first-class problem. Journal of Agrobiotechnology
Management and Economics, 13(4), 11, 382-390.
Zinck, R.D., M. Pascual, and V. Grimm, 2011: Understanding shifts in wildfire regimes
as emergent threshold phenomena. The American Naturalist, 178(6), E149-
E161, doi:10.1086/662675.
Ziska, L.H. and P.J. Beggs, 2012: Anthropogenic climate change and allergen exposure:
therole of plant biology. Journal of Allergy and Clinical Immunology, 129(1),
27-32.
Ziska, L.H. and F.A. Caulfield, 2000: Rising CO
2
and pollen production of common
ragweed (Ambrosia artemisiifolia L.), a known allergy-inducing species:
implications for public health. Functional Plant Biology, 27(10), 893-898.
Ziska, L.H., D.E. Gebhard, D.A. Frenz, S. Faulkner, B.D. Singer, and J.G. Straka, 2003:
Cities as harbingers of climate change: common ragweed, urbanization, and
public health. Journal of Allergy and Clinical Immunology, 111(2), 290-295.
