
1439
26
North America
Coordinating Lead Authors:
Patricia Romero-Lankao (Mexico), Joel B. Smith (USA)
Lead Authors:
Debra J. Davidson (Canada), Noah S. Diffenbaugh (USA), Patrick L. Kinney (USA), Paul Kirshen
(USA), Paul Kovacs (Canada), Lourdes Villers Ruiz (Mexico)
Contributing Authors:
William Anderegg (USA), Jessie Carr (USA), Anthony Cheng (USA), Thea Dickinson (Canada),
Ellen Douglas (USA), Hallie Eakin (USA), Daniel M. Gnatz (USA), Mary Hayden (USA),
Maria Eugenia Ibarraran Viniegra (Mexico), Blanca E. Jiménez Cisneros (Mexico), Rob de Loë
(Canada), Michael D. Meyer (USA), Catherine Ngo (USA), Amrutasri Nori-Sarma (India),
Greg Oulahen (Canada), Diana Pape (USA), Ana Peña del Valle (Mexico), Roger Pulwarty
(USA), Ashlinn Quinn (USA), Fabiola S. Sosa-Rodriguez (Mexico), Daniel Runfola (USA),
Landy Sánchez Peña (Mexico), Bradley H. Udall (USA), Fiona Warren (Canada),
Kate Weinberger (USA), Tom Wilbanks (USA)
Review Editors:
Ana Rosa Moreno (Mexico), Linda Mortsch (Canada)
Volunteer Chapter Scientist:
William Anderegg (USA)
This chapter should be cited as:
Romero-Lankao
, P., J.B. Smith, D.J. Davidson, N.S. Diffenbaugh, P.L. Kinney, P. Kirshen, P. Kovacs, and L. Villers Ruiz,
2014: North America. In: Climate Change 2014: Impacts, Adaptation, and Vulnerability. Part B: Regional Aspects.
Contribution of Working Group II to the Fifth Assessment Report of the Intergovernmental Panel on Climate
Change [Barros, V.R., C.B. Field, D.J. Dokken, M.D. Mastrandrea, K.J. Mach, T.E. Bilir, M. Chatterjee, K.L. Ebi,
Y.O. Estrada, R.C. Genova, B. Girma, E.S. Kissel, A.N. Levy, S. MacCracken, P.R. Mastrandrea, and L.L. White (eds.)].
Cambridge University Press, Cambridge, United Kingdom and New York, NY, USA, pp. 1439-1498.

26
1440
Executive Summary ......................................................................................................................................................... 1443
26.1. Introduction .......................................................................................................................................................... 1446
26.2. Key Trends Influencing Risk, Vulnerability, and Capacities for Adaptation .......................................................... 1448
26.2.1. Demographic and Socioeconomic Trends ........................................................................................................................................ 1448
26.2.1.1. Current Trends ................................................................................................................................................................. 1448
Box 26-1. Adapting in a Transboundary Context: The Mexico-USA Border Region ........................................................ 1448
26.2.1.2. Future Trends ................................................................................................................................................................... 1450
26.2.2. Physical Climate Trends .................................................................................................................................................................. 1452
26.2.2.1. Current Trends ................................................................................................................................................................. 1452
26.2.2.2. Climate Change Projections ............................................................................................................................................ 1454
26.3. Water Resources and Management ...................................................................................................................... 1456
26.3.1. Observed Impacts of Climate Change on Water Resources ............................................................................................................. 1456
26.3.1.1. Droughts and Floods ....................................................................................................................................................... 1456
26.3.1.2. Mean Annual Streamflow ................................................................................................................................................ 1456
26.3.1.3. Snowmelt ........................................................................................................................................................................ 1456
26.3.2. Projected Climate Change Impacts and Risks ................................................................................................................................. 1456
26.3.2.1. Water Supply ................................................................................................................................................................... 1456
26.3.2.2. Water Quality .................................................................................................................................................................. 1457
26.3.2.3. Flooding .......................................................................................................................................................................... 1457
26.3.2.4. Instream Uses .................................................................................................................................................................. 1458
26.3.3. Adaptation ..................................................................................................................................................................................... 1458
26.4. Ecosystems and Biodiversity ................................................................................................................................ 1458
26.4.1. Overview ........................................................................................................................................................................................ 1458
26.4.2. Tree Mortality and Forest Infestation .............................................................................................................................................. 1459
26.4.2.1. Observed Impacts ............................................................................................................................................................ 1459
26.4.2.2. Projected Impacts and Risks ............................................................................................................................................ 1459
26.4.3. Coastal Ecosystems ........................................................................................................................................................................ 1459
26.4.3.1. Observed Climate Impacts and Vulnerabilities ................................................................................................................. 1459
26.4.3.2. Projected Impacts and Risks ............................................................................................................................................ 1459
Box 26-2. Wildfires ......................................................................................................................................................... 1460
26.4.4. Ecosystems Adaptation, and Mitigation .......................................................................................................................................... 1460
26.5. Agriculture and Food Security .............................................................................................................................. 1462
26.5.1. Observed Climate Change Impacts ................................................................................................................................................. 1462
26.5.2. Projected Climate Change Risks ..................................................................................................................................................... 1462
Table of Contents

1441
North America Chapter 26
26
26.5.3. A Closer Look at Mexico ................................................................................................................................................................. 1463
26.5.4. Adaptation ..................................................................................................................................................................................... 1463
26.6. Human Health ....................................................................................................................................................... 1464
26.6.1. Observed Impacts, Vulnerabilities, and Trends ................................................................................................................................. 1464
26.6.1.1. Storm-Related Impacts .................................................................................................................................................... 1464
26.6.1.2. Temperature Extremes ..................................................................................................................................................... 1464
26.6.1.3. Air Quality ....................................................................................................................................................................... 1464
26.6.1.4. Pollen .............................................................................................................................................................................. 1465
26.6.1.5. Water-borne Diseases ...................................................................................................................................................... 1465
26.6.1.6. Vector-borne Diseases ..................................................................................................................................................... 1465
26.6.2. Projected Climate Change Impacts ................................................................................................................................................. 1465
26.6.3. Adaptation Responses .................................................................................................................................................................... 1466
26.7. Key Economic Sectors and Services ...................................................................................................................... 1466
26.7.1. Energy ............................................................................................................................................................................................ 1466
26.7.1.1. Observed Impacts ............................................................................................................................................................ 1466
26.7.1.2. Projected Impacts ............................................................................................................................................................ 1466
26.7.1.3. Adaptation ...................................................................................................................................................................... 1466
26.7.2. Transportation ................................................................................................................................................................................ 1467
26.7.2.1. Observed Impacts ............................................................................................................................................................ 1467
26.7.2.2. Projected Impacts ............................................................................................................................................................ 1467
26.7.2.3. Adaptation ...................................................................................................................................................................... 1467
26.7.3. Mining ............................................................................................................................................................................................ 1467
26.7.3.1. Observed Impacts ............................................................................................................................................................ 1467
26.7.3.2. Projected Impacts ............................................................................................................................................................ 1467
26.7.3.3. Adaptation ...................................................................................................................................................................... 1468
26.7.4. Manufacturing ................................................................................................................................................................................ 1468
26.7.4.1. Observed Impacts ............................................................................................................................................................ 1468
26.7.4.2. Projected Impacts ............................................................................................................................................................ 1468
26.7.4.3. Adaptation ...................................................................................................................................................................... 1468
26.7.5. Construction and Housing .............................................................................................................................................................. 1468
26.7.5.1. Observed Impacts ............................................................................................................................................................ 1468
26.7.5.2. Projected Impacts ............................................................................................................................................................ 1468
26.7.5.3. Adaptation ...................................................................................................................................................................... 1468
26.7.6. Insurance ........................................................................................................................................................................................ 1469
26.7.6.1. Observed Impacts ............................................................................................................................................................ 1469
26.7.6.2. Projected Impacts ............................................................................................................................................................ 1469
26.7.6.3. Adaptation ...................................................................................................................................................................... 1469

1442
Chapter 26 North America
26
26.8. Urban and Rural Settlements ................................................................................................................................ 1469
26.8.1. Observed Weather and Climate Impacts ......................................................................................................................................... 1469
26.8.2. Observed Factors and Processes Associated with Vulnerability ....................................................................................................... 1470
26.8.2.1. Urban Settlements ........................................................................................................................................................... 1470
26.8.2.2. Rural Settlements ............................................................................................................................................................ 1471
26.8.3. Projected Climate Risks on Urban and Rural Settlements ............................................................................................................... 1472
26.8.4. Adaptation ..................................................................................................................................................................................... 1472
26.8.4.1. Evidence of Adaptation ................................................................................................................................................... 1472
26.8.4.2. Opportunities and Constraints ......................................................................................................................................... 1473
Box 26-3. Climate Responses in Three North American Cities ....................................................................................... 1474
26.9. Federal and Subnational Level Adaptation ........................................................................................................... 1475
26.9.1. Federal Level Adaptation ................................................................................................................................................................ 1475
26.9.2. Subnational Level Adaptation ......................................................................................................................................................... 1475
26.9.3. Barriers to Adaptation .................................................................................................................................................................... 1476
26.9.4. Maladaptation, Trade-offs, and Co-benefits .................................................................................................................................... 1476
26.10.Key Risks, Uncertainties, Knowledge Gaps, and Research Needs ......................................................................... 1476
26.10.1. Key Multi-sectoral Risks ................................................................................................................................................................ 1476
26.10.2. Uncertainties, Knowledge Gaps, and Research Needs ................................................................................................................... 1477
References ....................................................................................................................................................................... 1478
Frequently Asked Questions
26.1: What impact are climate stressors having on North America? ....................................................................................................... 1478
26.2: Can adaptation reduce the adverse impacts of climate stressors in North America? ...................................................................... 1478

1443
North America Chapter 26
26
Executive Summary
Overview
North America’s climate has changed and some societally relevant changes have been attributed to anthropogenic causes (very
high confidence). {Figure 26-1} Recent climate changes and individual extreme events demonstrate both impacts of climate-
related stresses and vulnerabilities of exposed systems (very high confidence). {Figure 26-2}
Observed climate trends in North America
include an increased occurrence of severe hot weather events over much of the USA, decreases in frost days, and increases in heavy precipitation
over much of North America (high confidence). {26.2.2.1} The attribution of observed changes to anthropogenic causes has been established
for some climate and physical systems (e.g., earlier peak flow of snowmelt runoff and declines in the amount of water stored in spring snowpack
in snow-dominated streams and areas of western USA and Canada (very high confidence). {Figure 26-1} Evidence of anthropogenic climatic
influence on ecosystems, agriculture, water resources, infrastructure, and urban and rural settlements is less clearly established, though, in
many areas, these sectors exhibit substantial sensitivity to climate variability (high confidence). {26.3.1-2, 26.4.2.1-2, 26.4.3.1, 26.5.1, 26.7.1.1,
26.7.2, 26.8.1; Figure 26-2; Box 26-3}
Many climate stresses that carry risk—particularly related to severe heat, heavy precipitation, and declining snowpack—will
increase in frequency and/or severity in North America in the next decades (very high confidence). Global warming of approximately
2°C (above the preindustrial baseline) is very likely to lead to more frequent extreme heat events and daily precipitation extremes over most
areas of North America, more frequent low-snow years, and shifts toward earlier snowmelt runoff over much of the western USA and Canada.
{26.2.2.2} Together with climate hazards such as higher sea levels and associated storm surges, more intense droughts, and increased precipitation
variability, these changes are projected to lead to increased stresses to water, agriculture, economic activities, and urban and rural settlements
(high confidence). {26.3.2, 26.5.2, 26.7.1.2, 26.8.3} Global warming of approximately 4°C is very likely to cause larger changes in extreme heat
events, daily-scale precipitation extremes and snow accumulation and runoff, as well as emergence of a locally novel temperature regime
throughout North America. {26.2.2.2} This higher level of global temperature change is likely to cause decreases in annual precipitation over
much of the southern half of the continent and increases in annual precipitation over much of the northern half of the continent. {26.2.2.2} The
higher level of warming would present additional and substantial risks and adaptation challenges across a range of sectors (high confidence).
{26.3.3, 26.5.2, 26.6.2, 26.7.2.2, 26.8.3}
We highlight below key findings on impacts, vulnerabilities, projections, and adaptation responses relevant to specific North American sectors:
ecosystems, water, agriculture, human health, urban and rural settlements, infrastructure, and the economy. We then highlight challenges and
opportunities for adaptation, and future risks and adaptive capacity for three key climate-related risks.
Sector-Specific Climate Risks and Adaptation Opportunities
North American ecosystems are under increasing stress from rising temperatures, carbon dioxide (CO
2
) concentrations, and sea
levels, and are particularly vulnerable to climate extremes (very high confidence).
Climate stresses occur alongside other anthropogenic
influences on ecosystems, including land use changes, non-native species, and pollution, and in many cases will exacerbate these pressures
(very high confidence). {26.4.1, 26.4.3}. Evidence since the Fourth Assessment Report (AR4) highlights increased ecosystem vulnerability to
multiple and interacting climate stresses in forest ecosystems, through wildfire activity, regional drought, high temperatures, and infestations
(medium confidence); {26.4.2.1; Box 26-2} and in coastal zones due to increasing temperatures, ocean acidification, coral reef bleaching,
increased sediment load in runoff, sea level rise (SLR), storms, and storm surges (high confidence). {26.4.3.1} In the near term, conservation and
adaptation practices can buffer against climate stresses to some degree in these ecosystems, both through increasing system resilience, such as
forest management to reduce vulnerability to infestation, and in reducing co-occurring non-climate stresses, such as careful oversight of fishing
pressure (medium confidence). {26.4.4}
Water resources are already stressed in many parts of North America due to non-climate change anthropogenic forces, and are
expected to become further stressed due to climate change (high confidence). {26.3}
Decreases in snowpacks are already influencing
seasonal streamflows (high confidence). {26.3.1} Though indicative of future conditions, recent floods, droughts, and changes in mean flow

1444
Chapter 26 North America
26
conditions cannot yet be attributed to climate change (medium to high confidence). {26.3.1-2} The 21st century is projected to witness decreases
in water quality and increases in urban drainage flooding throughout most of North America under climate change as well as a decrease in
instream uses such as hydropower in some regions (high confidence). {26.3.2.2-4} In addition, there will be decreases in water supplies for
urban areas and irrigation in North America except in general for southern tropical Mexico, northwest coastal USA, and west coastal Canada
(high to medium confidence). {26.3.2.1} Many adaptation options currently available can address water supply deficits; adaptation responses
to flooding and water quality concerns are more limited (medium confidence). {26.3.3}
Effects of temperature and climate variability on yields of major crops have been observed (high confidence). {25.5.1} Projected
increases in temperature, reductions in precipitation in some regions, and increased frequency of extreme events would result in
net productivity declines in major North American crops by the end of the 21st century without adaptation, although the rate of
decline varies by model and scenario, and some regions, particularly in the north, may benefit (very high confidence). {26.5.2}
Given that North America is a significant source of global food supplies, projected productivity declines here may affect global food security
(medium confidence). At 2°C, adaptation has high potential to offset projected declines in yields for many crops, and many strategies offer
mitigation co-benefits; but effectiveness of adaptation would be reduced at 4°C (high confidence). {26.5.3} Adaptation capacity varies widely
among producers, and institutional support—currently lacking in some regions—greatly enhances adaptive potential (medium confidence).
{26.5.4}
Human health impacts from extreme climate events have been observed, although climate change-related trends and attribution
have not been confirmed to date. Extreme heat events currently result in increases in mortality and morbidity in North America (very high
confidence), with impacts that vary by age, location, and socioeconomic factors (high confidence). {26.6.1.2} Extreme coastal storm events can
cause excess mortality and morbidity, particularly along the East Coast of the USA, and the Gulf Coast of both Mexico and the USA (high
confidence). {26.6.1.1} A range of water-, food-, and vector-borne infectious diseases, air pollutants, and airborne pollens are influenced by
climate variability and change (medium confidence). {26.6.1.3-6} Further climate warming in North America will impose stresses on the health
sector through more severe extreme events such as heat waves and coastal storms, as well as more gradual changes in climate and CO
2
levels.
{26.6.2} Human health impacts in North America from future climate extremes can be reduced by adaptation measures such as targeted and
sustainable air conditioning, more effective warning and response systems, enhanced pollution controls, urban planning strategies, and resilient
health infrastructure (high confidence). {26.6.3}
Observed impacts on livelihoods, economic activities, infrastructure, and access to services in North American urban and rural
settlements have been attributed to SLR, changes in temperature and precipitation, and occurrences of such extreme events as
heat waves, droughts, and storms (high confidence). {26.8.2.1}
Differences in the severity of climate impacts on human settlements are
strongly influenced by context-specific social and environmental factors and processes that contribute to risk, vulnerability, and adaptive
capacity such as hazard magnitude, populations access to assets, built environment features, and governance (high confidence). {26.8.2.1-2}.
Some of these processes (e.g., the legacy of previous and current stresses) are common to urban and rural settlements, while others are more
pertinent to some types of settlements than others. For example, human and capital risks are highly concentrated in some highly exposed
urban locations, while in rural areas, geographic isolation and institutional deficits are key sources of vulnerability. Among the most vulnerable
are indigenous peoples due to their complex relationship with their ancestral lands and higher reliance on subsistence economies, and those
urban centers where high concentrations of populations and economic activities in risk-prone areas combine with several socioeconomic and
environmental sources of vulnerability (high confidence). {26.8.2.1-2} Although larger urban centers would have higher adaptation capacities,
future climate risks from heat waves, droughts, storms, and SLR in cities would be enhanced by high population density, inadequate infrastructures,
lack of institutional capacity, and degraded natural environments (medium evidence, high agreement). {26.8.3}
Much of North American infrastructure is currently vulnerable to extreme weather events and, unless investments are made to
strengthen them, would be more vulnerable to climate change (medium confidence).
Water resources and transportation infrastructure
are in many cases deteriorating, thus more vulnerable to extremes than strengthened ones (high confidence). Extreme events have caused
significant damage to infrastructure in many parts of North America; risks to infrastructure are particularly acute in Mexico but are a big
concern in all three countries (high confidence). {26.7}

1445
North America Chapter 26
26
Most sectors of the North American economy have been affected by and have responded to extreme weather, including hurricanes,
flooding, and intense rainfall (high confidence). {Figure 26-2}
Despite a growing experience with reactive adaptation, there are few
examples of proactive adaptation anticipating future climate change impacts, and these are largely found in sectors with longer term decision
making, including energy and public infrastructure. Knowledge about lessons learned and best adaptive practices by industry sector are not
well documented in the published literature. {26.7} There is an emerging concern that dislocation in one sector of the economy may have an
adverse impact on other sectors as a result of supply chain interdependency (medium confidence). {26.7} Slow-onset perils—such as SLR,
drought, and permafrost thaw—are an emerging concern for some sectors, with large regional variation in awareness and adaptive capacity
(medium confidence).
Adaptation Responses
Adaptation—including through technological innovation, institutional strengthening, economic diversification, and infrastructure
design—can help to reduce risks in the current climate, and to manage future risks in the face of climate change (medium
confidence). {26.8.4, 26.9.2}
There is increasing attention to adaptation among planners at all levels of government but particularly at the
municipal level, with many jurisdictions engaging in assessment and planning processes. These efforts have revealed the significant challenges
and sources of resistance facing planners at both the planning and implementation stages, particularly the adequacy of informational, institutional,
financial, and human resources, and lack of political will (medium confidence). {26.8.4.2, 26.9.3} Specific strategies introduced into policy to
date tend to be incremental rather than transformational. Fiscal constraints are higher for Mexican jurisdictions and sectors than for Canada or
the USA. The literature on sectoral-level adaptation is stronger in the areas of technological and engineering adaptation strategies than in social,
behavioral, and institutional strategies. Adaptation actions have the potential to result in synergies or trade-offs with mitigation and other
development actions and goals (high confidence). {26.8.4.2, 26.9.3}

1446
Chapter 26 North America
26
26.1. Introduction
This chapter assesses literature on observed and projected impacts,
vulnerabilities, and risks as well as on adaptation practices and options
in three North American countries: Canada, Mexico, and the USA. The
North American Arctic region is assessed in Chapter 28: Polar Regions.
North America ranges from the tropics to frozen tundra, and contains a
diversity of topography, ecosystems, economies, governance structures,
and cultures. As a result, risk and vulnerability to climate variability and
change differ considerably across the continent depending on geography,
scale, hazard, socio-ecological systems, ecosystems, demographic sectors,
cultural values, and institutional settings. This chapter seeks to take
account of this diversity and complexity as it affects and is projected to
affect vulnerabilities, impacts, risks, and adaptation across North America.
No single chapter would be adequate to cover the range and scope of the
literature about climate change vulnerabilities, impacts, and adaptations
in the three focus countries of this assessment. (Interested readers are
encouraged to review these reports: Lemmen et al., 2008; INECC and
SEMARNAT, 2012a; NCADAC, 2013.) We therefore attempt to take a more
integrative and innovative approach. In addition to describing current and
future climatic and socioeconomic trends of relevance to understanding
risk and vulnerability in North America (Section 26.2), we contrast climate
impacts, vulnerabilities, and adaptations across and within the three
countries in the following key sectors: water resources and management
(Section 26.3); ecosystems and biodiversity (Section 26.4); agriculture
and food security (Section 26.5); human health (Section 26.6); and key
economic sectors and services (Section 26.7). We use a comparative and
place-based approach to explore the factors and processes associated
with differences and commonalities in vulnerability, risk, and adaptation
between urban and rural settlements (Section 26.8); and to illustrate
and contrast the nuanced challenges and opportunities adaption entails
at the city, subnational, and national levels (Sections 26.8.4, 26.9; Box
26-3). We highlight two case studies that cut across sectors, systems, or
national boundaries. The first, on wildfires (Box 26-2), explores some of
the connections between climatic and physical and socioeconomic
process (e.g., decadal climatic oscillation, droughts, wildfires land use,
and forest management) and across systems and sectors (e.g., fires direct
and indirect impacts on local economies, livelihoods, built environments,
and human health). The second takes a look at one of the world’s
longest borders between a high-income (USA) and middle-income
country (Mexico) and briefly reflects on the challenges and opportunities
of responding to climate change in a transboundary context (Box 26-1).
We close with a section (26.10) summarizing key multi-sectoral risks
and uncertainties and discussing some of the knowledge gaps that will
need to be filled by future research.
Findings from the Fourth Assessment Report
This section summarizes key findings on North America, as identified in
Chapter 13 of the Fourth Assessment Report (AR4) focused on Mexico
(Magrin et al., 2007) and Chapter 14 on Canada and the USA (Field et
al., 2007). It focuses on observed and projected impacts, vulnerabilities,
and risks, as well as on adaptation practices and options, and highlights
areas of agreement and difference between the AR4’s two chapters and
our consolidated North American chapter.
Observed Impacts and Processes Associated with Vulnerability
Both WGII AR4 Section 14.2 and our chapter (Figure 26-2) find that, over
the past decades, economic damage from severe weather has increased
dramatically. Our chapter confirms that although Canada and the USA
have considerably more adaptive capacity than Mexico, their vulnerability
depends on the effectiveness and timing of adaptation and the distribution
of capacity, which vary geographically and between sectors (WGII AR4
Sections 14.2.6, 14.4-5; Sections 26.2.2, 26.8.2).
WGII AR4 Chapters 13 and 14 did not assess impacts, vulnerabilities,
and risks in urban and rural settlements, but rather assessed literature
on future risks in the following sectors:
• Ecosystems: Both AR4 and our chapter find that ecosystems are under
increased stress from increased temperatures, climate variability,
and other climate stresses (e.g., sea level rise (SLR) and storm-surge
flooding), and that these stresses interact with developmental and
environmental stresses (e.g., as salt intrusion, pollution, population
growth, and the rising value of infrastructure in coastal areas) (WGII
AR4 Sections 13.4.4, 14.2.3, 14.4.3). Differential capacities for range
shifts and constraints from development, habitat fragmentation,
invasive species, and broken ecological connections would alter
ecosystem structure, function, and services in terrestrial ecosystems
(WGII AR4 Sections 14.2, 14.4). Both reports show that dry soils
and warm temperatures are associated with increased wildfire
activity and insect outbreaks in Canada and the USA (WGII AR4
Sections 14.2, 14.4; Section 26.4.2.1).
• Water resources: AR4 projects millions in Mexico to be at risk from
the lack of adequate water supplies due to climate change (WGII AR4
Section 13.4.3); our chapter, however, finds that water resources
are already stressed by non-climatic factors, such as population
pressure that will be compounded by climate change (Section 26.3.1).
Both reports find that in the USA and Canada rising temperatures
would diminish snowpack and increase evaporation (Section 26.2.2.1),
thus affecting seasonal availability of water (WGII AR4 Section
14.2.1; Section 26.3.1). The reports also agree that these effects
will be amplified by water demand from economic development,
agriculture, and population growth, thus imposing further constraints
to over-allocated water resources and increasing competition
among agricultural, municipal, industrial, and ecological uses (WGII
AR4 Sections 14.4.1, 14.4.6; Section 26.3.3). Both agree water quality
will be further stressed (WGII AR4 Sections 13.4.3, 14.4.1; Section
26.3.2.2). There is more information available now on water
adaptation than in AR4 (WGII AR4 Sections 13.5.1.3, 14.5.1;
Section 26.3.3), and it is possible to attribute changes in extreme
precipitation, snowmelt, and snowpack to climate change (WGII
AR4 Sections 13.2.4, 14.2.1; Section 26.3.1).
• Agriculture: The AR4 noted that while increases in grain yields in
the USA and Canada are projected by most scenarios (WGII AR4
Section 14.4.4), in Mexico the picture is mixed for wheat and maize,
with different projected impacts depending on scenario used (WGII
AR4 Section 13.4.2). Research since the AR4 has offered more
cautious projections of yield change in North America due to shifts
in temperature and precipitation, particularly by 2100; and significant
harvest losses due to recent extreme weather events have been
observed (Section 26.5.1). Furthermore, our chapter reports on recent
research that underscores the context-specific nature of adaptation

1447
North America Chapter 26
26
c
apacity and of institutional support and shows that these factors,
which greatly enhance adaptive potential, are currently lacking in
some regions (Section 26.5.3).
• Health: AR4 focused primarily on a set of future health risks. These
include changes in the geographical distribution and transmission
of diseases such as dengue (WGII AR4 Section 13.4.5) and increases
in respiratory illness, including exposure to pollen and ozone (WGII
A
R4 Section 14.4) and in mortality from hot temperatures and
extreme weather in Canada and the USA. AR4 also projects that
climate change impacts on infrastructure and human health in cities
of Canada and the USA would be compounded by aging infrastructure,
maladapted urban form and building stock, urban heat islands, air
pollution, population growth, and an aging population (WGII AR4
Sections 14.4-5). Without increased investments in measures such
Understanding causes of trends
(a) Degree of understanding of causes of changes
in climatic extreme events in the USA
(b) Degree of understanding of the climate
influence in key impacts in North America
More knowledgeLess knowledge
Adequacy of data to detect trends
Less knowledge More knowledge
Understanding of climate Influence
More knowledgeLess knowledge
Adequacy of data to detect trends
Less knowledge More knowledge
1. Earlier peak flow of snowmelt runoff in snow-dominated streams and rivers in western North
America (Section 26.3.1)
2. Declines in the amount of water stored in spring snowpack in snow-dominated areas of western
North America (Section 26.3.1)
3. Northward and upward shifts in species’ distributions in multiple taxa of terrestrial species, although
not all taxa and regions (Section 26.4.1),
4. Increases in coastal flooding (Section 26.8.1)
5. Increases in wildfire activity, including fire season length and area burned by wildfires in the western
USA and boreal Canada (Box 26-2)
6. Storm-related disaster losses in the USA (most of the increase in insurance claims paid has been
attributed to increasing exposure of people and assets in areas of risk; Sections 26.7.6.1, 26.8.1)
7. Increases in bark beetle infestation levels in pine tree species in western North America (Section
26.4.2.1)
8. Yield increases due in part to increasing temperatures in Canada and higher precipitation in the USA;
yield variances attributed to climate variability in Ontario and Quebec; yield losses attributed to
climate-related extremes across North America (Section 26.5.1)
9. Increases in tree mortality rates in old-growth forests in the western USA and western Canada from
1960 to 2007 (Section 26.4.2.1)
10. Changes in flooding in some urban areas due to extreme rainfall (Sections 26.3.1, 26.8.2.1)
Trend detected and attributed
11. Changes in storm-related mortality in the USA (Section 26.6.1.2)
12.
Changes in heat-related mortality in the USA (Section 26.6.1.2)
13. Increase in water supply shortages due to drought (Sections 26.3, 26.8.1)
14. Changes in cold-related mortality (Section 26.6.1.2)
Trend not detected
Trend detected but not attributed
Extreme precipitation
Heat waves
C
old waves
Hail
Tornadoes
H
urricanes
Extreme snow
Ocean waves
Floods
Droughts
T
hunderstorm winds
Ice
Winds
Extreme extratropical
cyclones
1
7
2
6
458
3
9
14
13
11 12 10
Figure 26-1 | (a) Detection and attribution of climate change impacts. Comparisons of the adequacy of currently available data to detect trends and the degree of understanding
of causes of those changes in climatic extreme events in the USA (Peterson et al., 2013), and (b) degree of understanding of the climate influence in key impacts in North
America. Note that “climate influence” means that the impact has been documented to be sensitive to climate, not that it has been attributed to climate change. Red circles
indicate that formal detection and attribution to climate change has been performed for the given impact; yellow circles indicate that a trend has been detected from background
variability in the given impact, but formal attribution to climate change has not occurred and the trend could be due to other drivers; and white circles indicate that a trend has
not currently been detected.

1448
Chapter 26 North America
26
a
s early warning and surveillance systems, air conditioning, and
access to health care, hot temperatures and extreme weather in
Canada and the USA are predicted to result in increased adverse
health impacts (WGII AR4 Sections 14.4-5). Our chapter provides
a more detailed assessment of these future risks (Section 26.6),
besides assessing a richer literature on observed health impacts
(Section 26.6.1).
• Adaptation: AR4 found that Mexico has early warning and risk
management systems, yet it faces planning and management barriers.
In Canada and the USA, a decentralized response framework has
resulted in adaptation that tends to be reactive, unevenly distributed,
and focused on coping with rather than preventing problems (WGII
AR4 Section 14.5). Both chapters see “mainstreaming” climate issues
into decision making as key to successful adaptation (WGII AR4
Sections 13.5, 14.5). The current chapter provides a summary of
the growing empirical literature on emerging opportunities and
constraints associated with recent institutional adaptation planning
activities since the AR4 (Sections 26.3.3, 26.4.4, 26.5.4, 26.6.3,
26.8.4, 26.9).
In summary, scholarship on climate change impacts, adaptation, and
vulnerability has grown considerably since the AR4 in North America,
particularly in Canada and the USA. It is possible now not only to detect
and attribute to anthropogenic climate change some impacts such as
changes in extreme precipitation, snowmelt, and snowpack, but also to
examine trends showing increased insect outbreaks, wildfire events, and
c
oastal flooding. These latter trends have been shown to be sensitive
to climate, but, like the local climate patterns that cause them, have
not yet been positively attributed to anthropogenic climate change (see
Figure 26-1).
26.2. Key Trends Influencing Risk, Vulnerability,
and Capacities for Adaptation
26.2.1. Demographic and Socioeconomic Trends
26.2.1.1. Current Trends
Canada, Mexico, and USA share commonalities but also differ in key
dimensions shaping risk, vulnerability, and adaptation such as population
dynamics, economic development, and institutional capacity. During the
last years, the three countries, particularly the USA, have suffered economic
losses from extreme weather events (Figure 26-2). Hurricanes, droughts,
floods, and other climate-related hazards produce risk as they interact
with increases in exposed populations, infrastructure, and other assets
and with the dynamics of such factors shaping vulnerability as wealth,
population size and structure, and poverty (Figures 26-2 and SPM.1).
Population growth has been slower in Canada and USA than in Mexico
(UN DESA Population Division, 2011). Yet population growth in Mexico
also decreased from 3.4% between 1970 and 1980 to 1.5% yearly during
2000–2010. Populations in the three countries are aging at different
Box 26-1 | Adapting in a Transboundary Context: The Mexico-USA Border Region
Extending over 3111 km (1933 miles; U.S. Census Bureau, 2011), the border between the USA and Mexico, which can be defined in
different ways (Varady and Ward, 2009), illustrates the challenges and opportunities of responding to climate change in a transboundary
context. Changing regional climate conditions and socioeconomic processes combined shape differentiated vulnerabilities of exposed
populations, infrastructure, and economic activities.
Since at least 1999, the region has experienced high temperatures and aridity anomalies leading to drought conditions (Woodhouse
et al., 2010; Wilder et al., 2013) affecting large areas on both sides of the border, and considered the most extreme in over a century
of recorded precipitation patterns for the area (Cayan et al., 2010; Seager and Vecchi, 2010; Nielsen-Gammon, 2011). Streamflow in
already oversubscribed rivers such as the Colorado and Rio Grande (Nakaegawa et al., 2013) has decreased. Climatological conditions
for the area have been unprecedented, with sustained high temperatures that may have exceeded any experienced for 1200 years.
Although these changes cannot conclusively be attributed to anthropogenic climate change, they are consistent with climate change
projections (Woodhouse et al., 2010).
The population of the Mexico-USA border is rapidly growing and urbanizing, doubling from just under 7 million in 1983 to more than
15 million in 2012 (Peach and Williams, 2000). Since 1994, rapid growth in the area has been fueled by rapid economic development
subsequent to passage of the North American Free Trade Agreement (NAFTA). Between 1990 and 2001 the number of assembly
factories or maquiladoras in Mexico grew from 1700 to nearly 3800, with 2700 in the border area. By 2004, it was estimated that
more than 1 million Mexicans were employed in more than 3000 maquiladoras located along the border (Border Indicators Task
Force, 2011; EPA and SEMARNAT, 2012).
Continued next page

1449
North America Chapter 26
26
rates (Figure 26-2). In 2010, 14.1% of the population in Canada was
60 years and older, compared to 12.7% in the USA and 6.1% in Mexico
(UN DESA Population Division, 2011). Urban populations have grown
faster than rural populations, resulting in a North America that is highly
urbanized (Canada 84.8%, Mexico 82.8%, and USA 85.8%). Urban
populations are also expanding into peri-urban spaces, producing rapid
changes in population and land use dynamics that can exacerbate risks
from such hazards as floods and wildfires (Eakin et al., 2010; Romero-
Lankao et al., 2012a). Mexico has a markedly higher poverty rate (34.8%)
than Canada (9.1%) and the USA (12.5%) (Figure 26-2), with weather
events and climate affecting poor people’s livelihood assets, including
crop yields, homes, food security, and sense of place (Chapter 13;
Section 26.8.2). Between 1970 and 2012, a 10% increase in single-
person households—who can be vulnerable because of isolation and low
income and housing quality (Roorda et al., 2010)—has been detected
in the USA (Vespa et al., 2013).
While concentrations of growing populations, water, sanitation,
transportation and energy infrastructure, and industrial and service
sectors in urban areas can be a source of risk, geographic isolation and
high dispersion of rural populations also introduce risk because of long
distances to essential services (Section 26.8.2). Rural populations are
more vulnerable to climate events due to smaller labor markets, lower
income levels, and reduced access to public services. Rural poverty could
also be aggravated by changes in agricultural productivity, particularly
in Mexico, where 65% of the rural population is poor, agricultural income
is seasonal, and most households lack insurance (Scott, 2007). Food price
increases, which may also result from climate events, would contribute
to food insecurity (Lobell et al., 2011; World Bank, 2011).
Migration is a key trend affecting North America, recently with movements
between urban centers and from rural Mexico into Mexico’s cities, and
in the USA. Rates of migration from rural Mexico are positively associated
with natural disaster occurrence and increased poverty trends (Saldaña-
Zorilla and Sandberg, 2009), and with decreasing precipitation (Nawrotski
et al., 2013). Studies of migration induced by past climate variability
and change indicate a preference for short-range domestic movement,
a complex relationship to assets with indications that the poorest are
Box 26-1 (continued)
Notwithstanding this growth, challenges to adaptive capacity include high rates of poverty in a landscape of uneven economic
development (Wilder et al., 2013). Large sections of the urban population, particularly in Mexico, live in informal housing lacking the
health and safety standards needed to respond to hazards, and with no insurance (Collins et al., 2011). Any effort to increase regional
capacity to respond to climate needs to take existing gaps into account. In addition, there is a prevalence of incipient or actual conflict
(Mumme, 1999), given by currently or historically contested allocation of land and water resources (e.g., an over-allocated Colorado
River ending in Mexico above the Sea de Cortes (Getches, 2003)). Climate change, therefore, would bring additional significant
consequences for the region’s water resources, ecosystems, and rural and urban settlements.
The impacts of regional climatic and non-climatic stresses compound existing urban vulnerabilities that are different across countries.
For instance, besides degrading highly diverse ecosystems (Wilder et al., 2013), residential growth in flood-prone areas in Ciudad
Juárez has not been complemented with the provision of determinants of adaptive capacity to residents, such as housing, health
care, and drainage infrastructure. As a result, although differences in mean hazard scores are not significant between Ciudad Juárez
(Mexico) and El Paso (USA), social vulnerability and average risk are three times and two times higher in Ciudad Juárez than in El
Paso respectively (Collins, 2008).
Projected warming and drying would impose additional burdens on already stressed water resources and ecosystems and compound
existing vulnerabilities for populations, infrastructure, and economic activities (Wilder et al., 2013). The recent drought in the region
illustrated the multiple dimensions of climate-related events, including notable negative impacts on the agricultural sector, water
supplies, food security, and risk of wildfire (discussed in Box 26-2) (Wehner et al., 2011; Hoerling et al., 2012; Schwalm et al., 2012).
Adaptation opportunities and constraints are shared across international borders, creating the need for cooperation among local,
national, and international actors. Although there are examples of efforts to manage transborder environmental issues, such as the
USA-Mexico International Boundary and Water Commission agreement (United States and Mexico International Boundary and Water
Commission, 2012), constraints to effective cooperation and collaboration include different governance structures (centralized in
Mexico, decentralized in the USA), institutional fragmentation, asymmetries in the use and dissemination of information, and language
(Wilder et al., 2010, 2013; Megdal and Scott, 2011).
1450
Chapter 26 North America
26
l
ess able to migrate, and the role of preexisting immigrant networks in
facilitating international migration (Oppenheimer, 2013).
North America has become more economically integrated following the
1994 North American Free Trade Agreement. Prior to a 2007–2008
reduction in trade, the three countries registered dynamic growth in
industry, employment, and global trade of agricultural and manufactured
goods (Robertson et al., 2009). Notwithstanding North America’s
economic dynamism, increased socioeconomic disparities (Autor et al.,
2
008) have affected such determinants of vulnerability as differentiated
human development and institutional capacity within and across
countries.
26.2.1.2. Future Trends
The North American population is projected to continue growing, reaching
between 531.8 (SRES B2) and 660.1 (A2) millionby 2050 (IIASA, 2007).
0
400 800 1200 1600200
Kilometers
Continued next page
Drought
Fire
Flood
Hurricane
Severe storm
Winter storm
03
11
95
05
01
07
11
10
95
07
05
95
96
10
95
05
0
9
12
96
03
11 9310
05
96
98
04
06
11
11
95
93
08
08
00
00
94
07
09
95
98
06
02
10
09
09
05
05
03
11
99
07
93
96
11
11
12
96
95
96
95
04
03
12
96
08
08
99
99
00
08
11
98
98
12
10
06
12
09
09
12
96
96
11
99
11
08
08
94
94
07
05
09
93
00
93
96
98
11
98
09
10
02
12
96
07
06
12
98
02
97
94
09
11
95
10
95
95
99
11
03
12
00
07
06
08
98
02
95
99
03
98
08
11
96
11
97
08
96
04
93
11
11
05
05
05
12
04
04
08
12
05
1
1
01
03
93
03
12
94
01
04
02
05
94
10
93
97
02
11
(a) Significant weather events taking place during 1993–2012
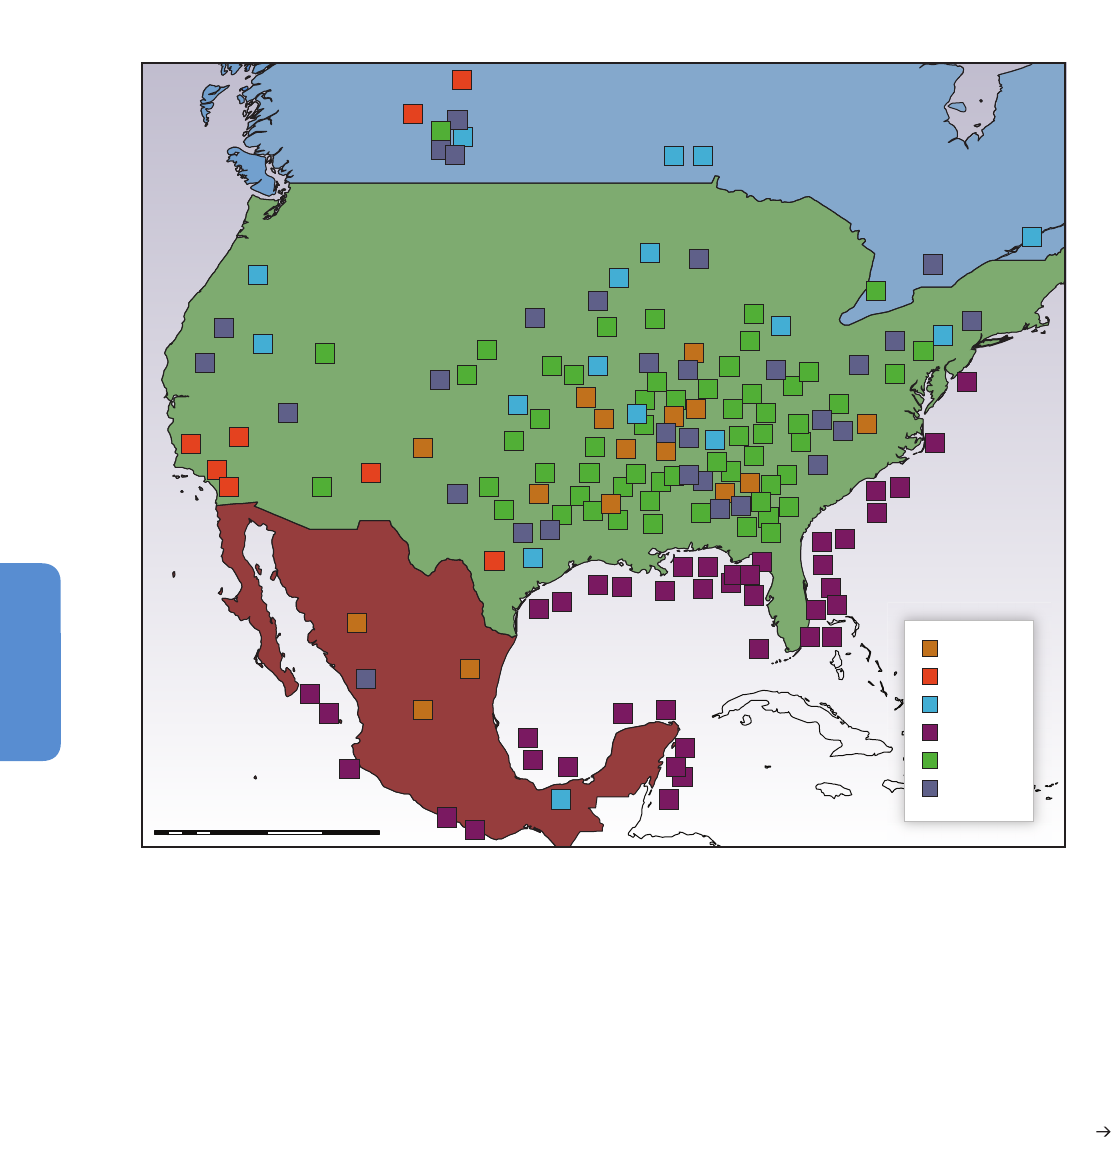
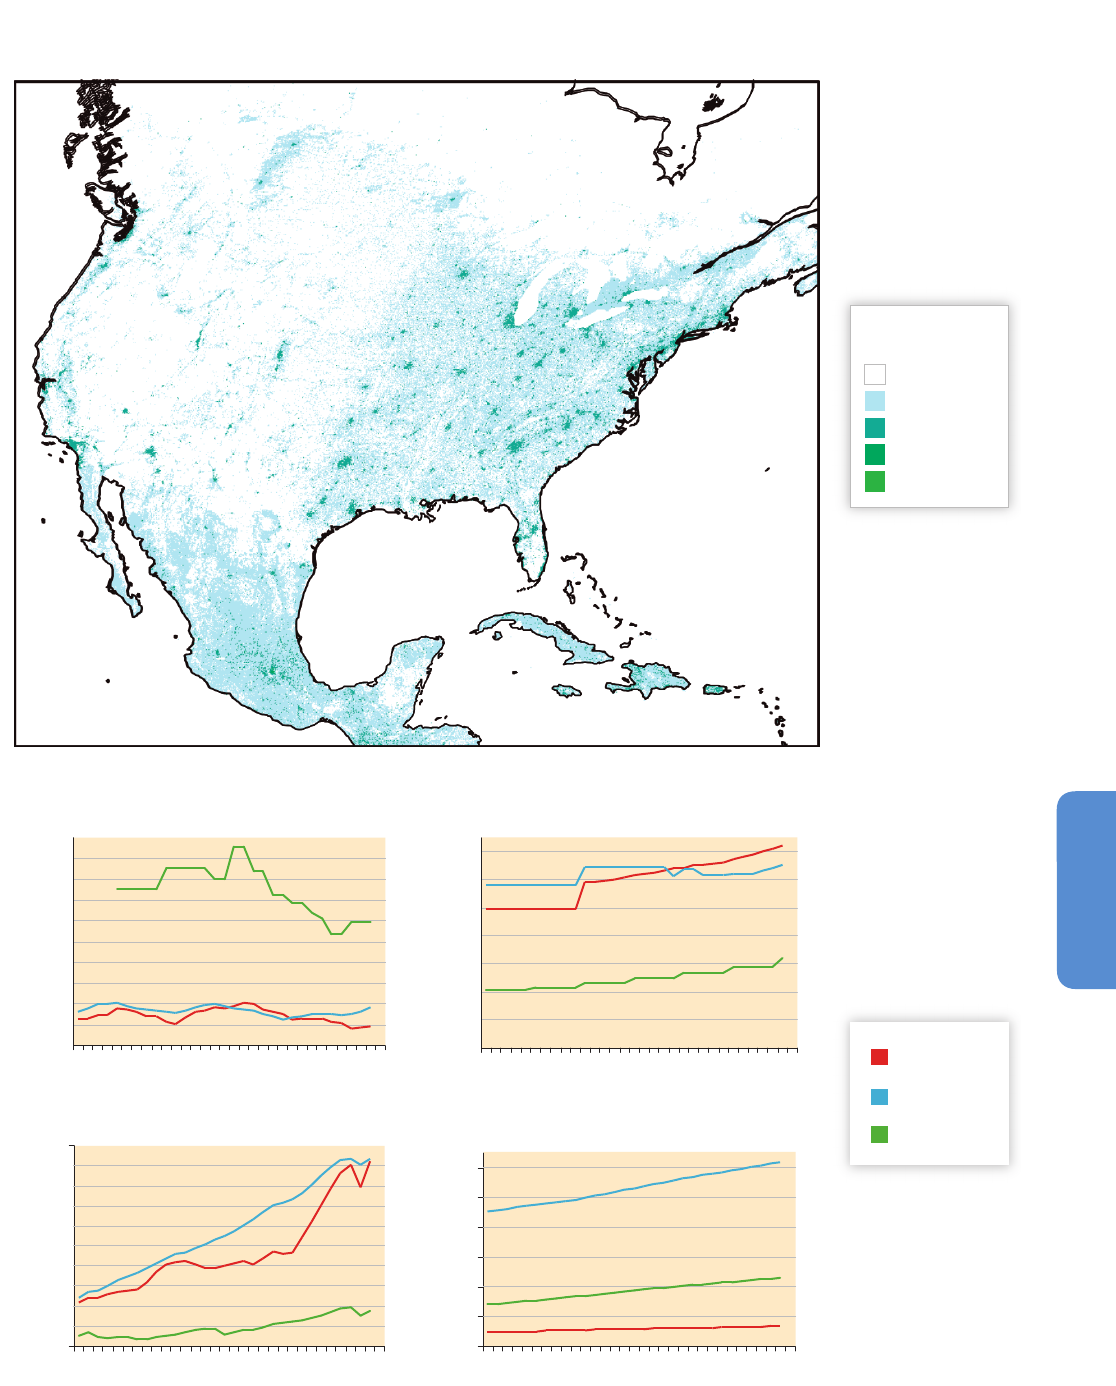
Figure 26-2 | Extreme events illustrating vulnerabilities for Mexico, the USA, and Canada. This figure offers a graphic illustration of location of extreme events and relevant
vulnerability trends. The observed extreme events have not been attributed to anthropogenic climate change, yet they are climate-sensitive sources of impact illustrating vulnerability
of exposed systems, particularly if projected future increases in the frequency and/or intensity of such events should materialize. The figure contains three elements. (a) A map with
significant weather and climate events taking place during 1993–2012 (data derived from NatCatSERVICE, 2013). The categories “Severe storm” and “Winter storm” are
aggregations of multiple types of storms; e.g., hailstorms are shown as Winter storms and tornadoes as Severe storms. Boxed numbers refer to the years in which the extreme events
occurred. Hurricanes are placed offshore of the point of initial landfall, and placement of all other boxes (which may span multiple subnational jurisdictions) is weighted towards areas
with the highest expected impacts (defined by estimated affected populations when finer subnational detail was not available). The map includes only events with overall losses ≥
US$1 billion in the USA, or ≥US$500 million in Mexico and Canada, adjusted to 2012 values; hence, it does not include events of small and medium impact. Additionally, losses do
not capture the impacts of disasters on populations’ livelihoods and well-being. (b) A map (facing page) with population density per ~0.0083
˚ gridbox at 1-km resolution highlighting
exposure and represented using 2011 Landsat data (Bright et al., 2012). Note that a ~0.0083
˚ grid box is approximately1 km
2
, but this approximation varies by latitude. (c)
Four panels (facing page) with trends in socio-demographic indicators used in the literature to measure vulnerability to hazards (Romero-Lankao et al., 2012b): poverty rates,
percentage of elderly, GDP per capita and total population (U.S. Census Bureau, 2011; Statistics Canada, 2012, CEPAL, 2013).
1451
North America Chapter 26
26
Figure 26-2 (continued)
5
10
15
20
25
30
35
40
45
50
55
1980 1985 1990 1995 2000 2005 2010
Percent of people
0
2
4
6
8
10
12
14
1980 1985 1990 1995 2000 2005 2010
% of population older than 65
0
5
10
15
20
25
30
35
40
45
50
1980 1985 1990 1995 2000 2005 2010
2012 US dollars (thousands)
0
50
100
150
200
250
300
1980 1985 1990 1995 2000 2005 2010
People (millions)
Canada
United States
Mexico
0
0 –100
100–10,000
10,000–50,000
50,000 +
Population
(per ~0.0083˚ gridbox)
(b) Population density at 1 km resolution
(c) Trends in socioeconomic indicators
% of population below poverty line
Elderly population
Per capita gross domestic product
Total population

1452
Chapter 26 North America
26
T
he percentage of elderly people (older than 64 years) is also projected
to continue to increase, by 23.4 to 26.9% in Canada, 12.4 to 18.4% in
Mexico, and 17.3 to 20.9% in the USA by 2050 (B2 and A2, respectively)
(IIASA, 2007). The elderly are highly vulnerable to extreme weather
events (heat waves in particular, Figure 26-2) (Martiello and Giacchi,
2010; Diffenbaugh and Scherer, 2011; Romero-Lankao, 2012; White-
Newsome et al., 2012). Numbers of single-person households and female-
headed households—both of which are vulnerable because of low
income and housing quality—are anticipated to increase (Roorda et al.,
2010). Institutional capacity to address the demands posed by increasing
numbers of vulnerable populations may also be limited, with resulting
stress on health and the economy.
Three other shifts are projected to influence impacts, vulnerabilities, and
adaptation to climate change in North America: urbanization, migration,
and socioeconomic disparity. With small differences between countries,
both the concentration of growing populations in some urban areas and
the dispersion of rural populations are projected to continue to define
North America by 2050. Assuming no change in climate, between 2005
and 2030 the population of Mexico City Metro Area will increase by
17.5%, while between 2007 and 2030 available water will diminish by
11.2% (Romero-Lankao, 2010). Conversely, education, a key determinant
of adaptive capacity (Chapter 13), is expected to expand to low-income
households, minorities, and women, which could increase the coping
capacity of households and have a positive impact on economic growth
(Goujon et al., 2004). However, the continuation of current patterns of
economic disparity and poverty would hinder future adaptive capacity.
Inequality in Mexico is larger (Figure 26-2), having a Gini coefficient
(according to which the higher the number the higher economic disparity)
of 0.56, in contrast to 0.317 for Canada and 0.389 for the USA (OECD,
2010). Mexico is one of five countries in the world that is projected to
experience the highest increases in poverty due to climate-induced
extreme events (52% increase in rural households, 95.4% in urban wage-
labor households; Coupled Model Intercomparison Project Phase 3
(CMIP3), A2) (Ahmed et al., 2009).
Some studies project increased North American migration in response
to climate change. Feng, Krueger, and Oppenheimer (2010) estimated
the emigration of an additional 1.4 to 6.7 million Mexicans by 2080
based on projected maize yield declines, range depending on model
(B1, United Kingdom Meteorological Office (UKMO), and Geophysical
Fluid Dynamics Laboratory (GFDL)). Oppenheimer speculates that the
indirect impacts of migration “could be as substantial as the direct effects
of climate change in the receiving area,” because the arrival migrants
can increase pressure on climate sensitive urban regions (Oppenheimer,
2013, p. 442).
26.2.2. Physical Climate Trends
Some processes important for climate change in North America are
assessed eslewhere in the Fifth Assessment Report, including WGI AR5
Chapter 2 (Observations: Atmosphere and Surface), WGI AR5 Chapter 4
(Observations: Cryosphere), WGI AR5 Chapter 12 (Long-term Climate
Change: Projections, Commitments, and Irreversibility), WGI AR5 Chapter
14 (Climate Phenomena and Their Relevance for Future Regional Climate
Change), WGI AR5 Annex I (Atlas of Global and Regional Climate
P
rojections), and Chapter 21 of this volume (Regional Context). In
addition, comparisons of emissions, concentrations, and radiative
forcing in the Representative Concentration Pathways (RCPs) and
Special Report on Emission Scenarios (SRES) scenarios can be found in
WGI AR5 Annex II (Climate System Scenario Tables).
2
6.2.2.1. Current Trends
It is very likely that mean annual temperature has increased over the
past century over most of North America (WGI AR5 Figure SPM.1b;
Figure 26-3). Observations also show increases in the occurrence of
severe hot events over the USA over the late 20th century (Kunkel et
al., 2008), a result in agreement with observed late-20th-century
increases in extremely hot seasons over a region encompassing
northern Mexico, the USA, and parts of eastern Canada (Diffenbaugh and
Scherer, 2011). These increases in hot extremes have been accompanied
by observed decreases in frost days over much of North America
(Alexander et al., 2006; Brown et al., 2010; see also WGI AR5 Section
2.6.1), decreases in cold spells over the USA (Kunkel et al., 2008; see
also WGI AR5 Section 2.6.1), and increasing ratio of record high to low
daily temperatures over the USA (Meehl et al., 2009). However, warming
has been less pronounced and less robust over areas of the central and
southeastern USA (e.g., Alexander et al., 2006; Peterson et al., 2008;
see also WGI AR5 Section 2.6.1; WGI AR5 Figure SPM.1b; Figure 26-3).
It is possible that this pattern of muted temperature change has been
influenced by changes in the hydrologic cycle (e.g., Pan et al., 2004;
Portmann et al., 2009), as well as by decadal-scale variability in the
ocean (e.g., Meehl et al., 2012; Kumar et al., 2013b).
It is very likely that annual precipitation has increased over the past
century over areas of the eastern USA and Pacific Northwest (WGI AR5
Figure 2.29; Figure 26-3). Observations also show increases in heavy
precipitation over Mexico, the USA, and Canada between the mid-20th
and the early 21st century (DeGaetano, 2009; Peterson and Baringer,
2009; Pryor et al., 2009; see also WGI AR5 Section 2.6.2). Observational
analyses of changes in drought are more equivocal over North America,
with mixed sign of trend in dryness over Mexico, the USA, and Canada
(Dai, 2011; Sheffield et al., 2012; see also WGI AR5 Section 2.6.2; WGI
AR5 Figure 2.42). There is also evidence for earlier occurrence of peak
flow in snow-dominated rivers globally (Rosenzweig, 2007; WGI AR5
Section 2.6.2). Observed snowpack and snow-dominated runoff have
been extensively studied in the western USA and western Canada, with
observations showing primarily decreasing trends in the amount of
water stored in spring snowpack from 1960 to 2002 (with the most
prominent exception being the central and southern Sierra Nevada;
Mote, 2006) and primarily earlier trends in the timing of peak runoff over
the 1948–2000 period (Stewart et al., 2006; WGI AR5 Section 4.5; WGI
AR5 Figure 4.21). Observations also show decreasing mass and length
of glaciers in North America (WGI AR5 Section 4.3; WGI AR5 Figures
4.9, 4.10, 4.11). Further, in assessing changes in the hydrology of the
western USA, it has been concluded that “up to 60% of the climate-related
trends of river flow, winter air temperature, and snowpack between
1950 and 1999 are human-induced” (Barnett et al., 2008, p. 1080).
Observational limitations prohibit conclusions about trends in severe
thunderstorms (WGI AR5 Section 2.6.2) and tropical cyclones (WGI AR5
1453
North America Chapter 26
26
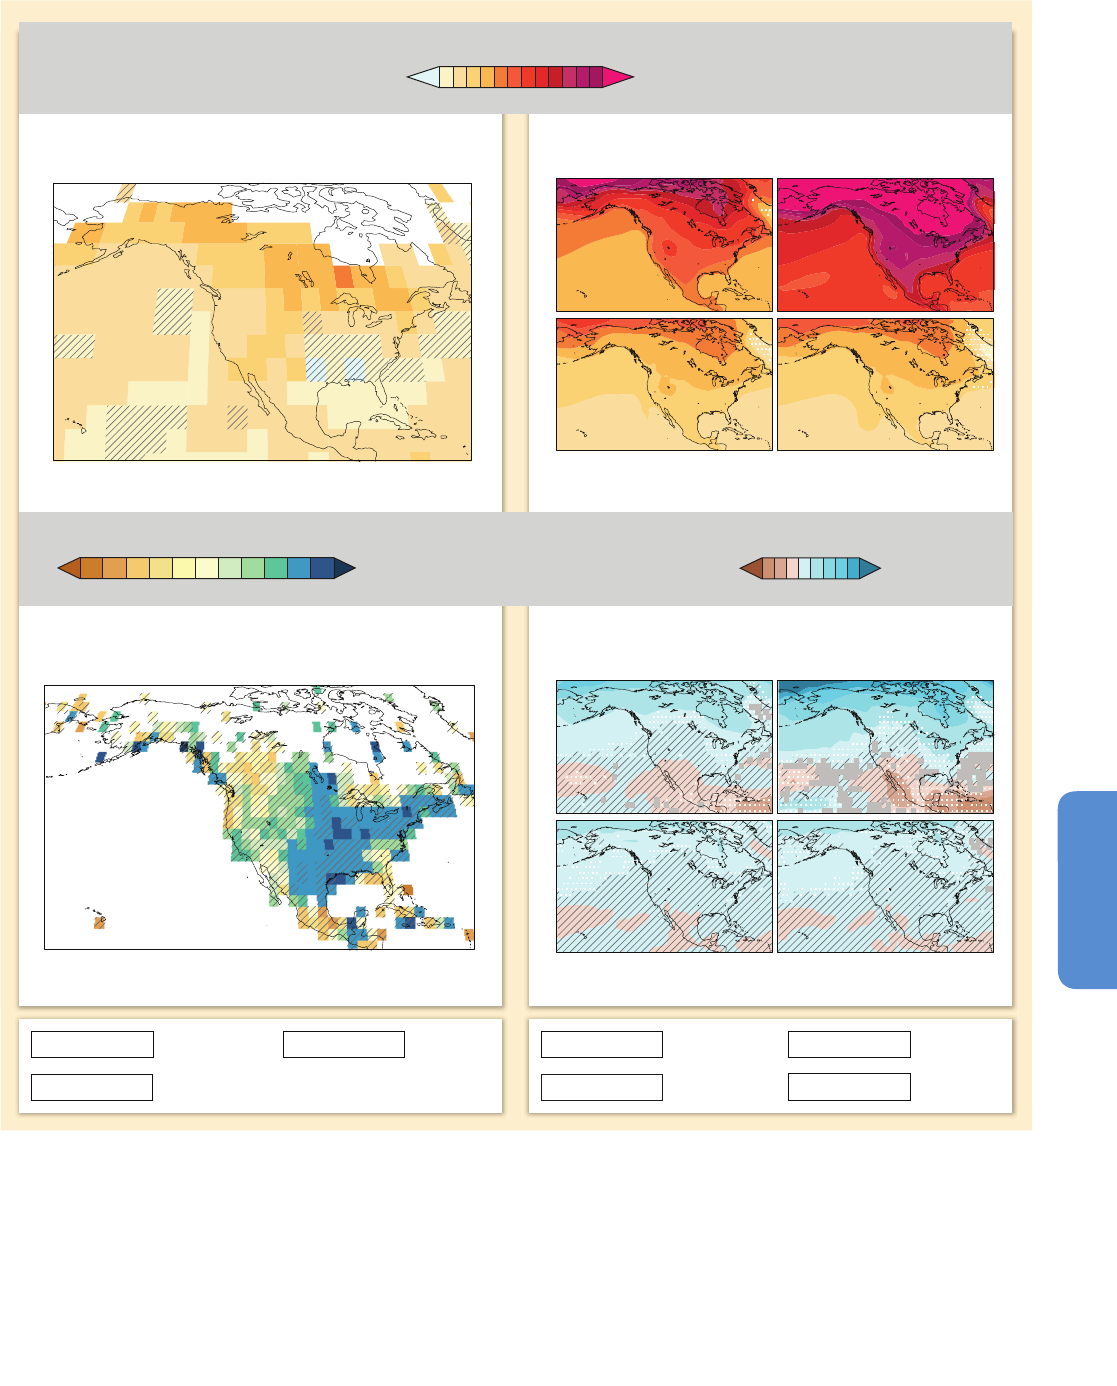
Annual Precipitation
Change
Diagonal Lines
Trend not
statistically
significant
White
Insufficient
data
Solid Color
Strong
agreement
Very strong
agreement
Little or
no change
Gray
Divergent
changes
Solid Color
Significant
trend
Diagonal Lines
White Dots
Annual Temperature Change
late 21st century
mid 21st century
Difference from 1986–2005 mean (%)
Difference from 1986–2005 mean
(˚C)
Trend over 1901–2012
(˚C over period)
(mm/year per decade)
Trend in annual precipitation over 1951–2010
Figure 26-3 | Observed and projected changes in annual average temperature and precipitation. (Top panel, left) Map of observed annual average temperature change from
1901–2012, derived from a linear trend. [WGI AR5 Figures SPM.1 and 2.21] (Bottom panel, left) Map of observed annual precipitation change from 1951–2010, derived from a
linear trend. [WGI AR5 Figures SPM.2 and 2.29] For observed temperature and precipitation, trends have been calculated where sufficient data permit a robust estimate (i.e., only
for grid boxes with greater than 70% complete records and more than 20% data availability in the first and last 10% of the time period). Other areas are white. Solid colors
indicate areas where trends are significant at the 10% level. Diagonal lines indicate areas where trends are not significant. (Top and bottom panel, right) CMIP5 multi-model
mean projections of annual average temperature changes and average percent changes in annual mean precipitation for 2046–2065 and 2081–2100 under RCP2.6 and 8.5,
relative to 1986–2005. Solid colors indicate areas with very strong agreement, where the multi-model mean change is greater than twice the baseline variability (natural internal
variability in 20-yr means) and ≥90% of models agree on sign of change. Colors with white dots indicate areas with strong agreement, where ≥66% of models show change
greater than the baseline variability and ≥66% of models agree on sign of change. Gray indicates areas with divergent changes, where ≥66% of models show change greater
than the baseline variability, but <66% agree on sign of change. Colors with diagonal lines indicate areas with little or no change, where <66% of models show change greater
than the baseline variability, although there may be significant change at shorter timescales such as seasons, months, or days. Analysis uses model data and methods building
from WGI AR5 Figure SPM.8. See also Annex I of WGI AR5. [Boxes 21-2 and CC-RC]
–20 0 20 40
–
5 0
5
2510
2.5
–
2.5 50
–
10
–
50
–
25
–
100
RCP8.5RCP2.6
0 2 4 6
late 21st century
mid 21st century
RCP8.5RCP2.6

1454
Chapter 26 North America
26
S
ection 2.6.3) over North America. The most robust trends in extratropical
cyclones over North America are determined to be toward more frequent
and intense storms over the northern Canadian Arctic and toward less
frequent and weaker storms over the southeastern and southwestern
coasts of Canada over the 1953–2002 period (Wang et al., 2006; see
also WGI AR5 Section 2.7.4).
WGI concludes that “Global mean sea level (GMSL) has risen by 0.19
(0.17 to 0.21) m over the period 1901–2010” and that “it is very likely
that the mean rate was 1.7 (1.5 to 1.9) mm yr
–1
between 1901 and 2010
and increased to 3.2 (2.8 to 3.6) mm yr
–1
between 1993 and 2010”
(WGI AR5 Chapter 3 ES). In addition, observed changes in extreme sea
level have been caused primarily by increases in mean sea level (WGI
AR5 Section 3.7.5). Regional variations in the observed rate of SLR can
result from processes related to atmosphere and ocean variability (such
as lower rates along the west coast of the USA) or vertical land motion
(such as high rates along the US Gulf Coast), but the persistence of the
observed regional patterns is unknown (WGI AR5 Section 3.7.3).
26.2.2.2. Climate Change Projections
WGI AR5 Chapters 11 and 12 assess near- and long-term future climate
change, respectively. WGI AR5 Chapter 14 assesses processes that are
important for regional climate change, with WGI AR5 Section 14.8.3
focused on North America. Many of the WGI AR5 conclusions are drawn
from Annex I of the WGI contribution to the AR5.
The CMIP5 ensemble projects very likely increases in mean annual
temperature over North America, with very likely increases in temperature
over all land areas in the mid- and late-21st-century periods in RCP2.6
and RCP8.5 (Figure 26-3). Ensemble-mean changes in mean annual
temperature exceed 2°C over most land areas of all three countries in
the mid-21st-century period in RCP8.5 and the late-21st-century period
in RCP8.5, and exceed 4°C over most land areas of all three countries
in the late-21st-century period in RCP8.5. However, ensemble-mean
changes in mean annual temperature remain within 2°C above the late-
20th-century baseline over most North American land areas in both the
mid- and late-21st-century periods in RCP2.6. The largest changes in
mean annual temperature occur over the high latitudes of the USA and
Canada, as well as much of eastern Canada, including greater than 6°C
in the late-21st-century period in RCP8.5. The smallest changes in mean
annual temperature occur over areas of southern Mexico, the Pacific
Coast of the USA, and the southeastern USA.
The CMIP5 ensemble projects warming in all seasons over North America
beginning as early as the 2016–2035 period in RCP2.6, with the greatest
warming occurring in winter over the high latitudes (WGI AR5 Annex I;
Figure 26-3) (Diffenbaugh and Giorgi, 2012). The CMIP5 and CMIP3
ensembles suggest that the response of warm-season temperatures to
elevated radiative forcing is larger as a fraction of the baseline variability
than the response of cold-season temperatures (Diffenbaugh and
Scherer, 2011; Kumar et al., 2013b), and the CMIP3 ensemble suggests
that the response of temperature in low-latitude areas of North America
is larger as a fraction of the baseline variability than the response of
temperature in high-latitude areas (Diffenbaugh and Scherer, 2011). In
addition, CMIP3 and a high-resolution climate model ensemble suggest
t
hat the signal-to-noise ratio of 21st century warming is far greater over
the western USA, northern Mexico, and the northeastern USA than over
the central and southeastern USA (Diffenbaugh et al., 2011), a result
that is similar to the observed pattern of temperature trend significance
in the USA (Figure 26-3).
Most land areas north of 45°N exhibit likely or very likely increases in
mean annual precipitation in the late-21st-century period in RCP8.5
(Figure 26-3). The high-latitude areas of North America exhibit very likely
changes in mean annual precipitation throughout the illustrative RCP
periods, with very likely increases occurring in the mid-21st-century
period in RCP2.6 and becoming generally more widespread at higher
levels of forcing. In contrast, much of Mexico exhibits likely decreases
in mean annual precipitation beginning in the mid-21st-century period
in RCP8.5, with the area of likely decreases expanding to cover most of
Mexico and parts of the south-central and southwestern USA in the
late-21st-century period in RCP8.5. Likely changes in mean annual
precipitation are much less common at lower levels of forcing. For
example, likely changes in mean annual precipitation in the mid- and
late-21st-century periods in RCP2.6 are primarily confined to increases
over areas of Canada and Alaska, with no areas of Mexico and very few
areas of the contiguous USA exhibiting differences that exceed the
baseline variability in more than 66% of the models.
CMIP5 projects increases in winter precipitation over Canada and Alaska,
consistent with projections of a poleward shift in the dominant cold-
season storm tracks (Yin, 2005; see also WGI AR5 Section 14.8.3),
extratropical cyclones (Trapp et al., 2009), and areas of moisture
convergence (WGI AR5 Section 14.8.3), as well as with projections of a
shift toward positive North Atlantic Oscillation (NAO) trends (Hori et al.,
2007; see also WGI AR5 Section 14.8.3). CMIP5 also projects decreases
in winter precipitation over the southwestern USA and much of Mexico
associated with the poleward shift in the dominant stormtracks and the
expansion of subtropical arid regions (Seager and Vecchi, 2010; see WGI
AR5 Section 14.8.3). However, there are uncertainties in hydroclimatic
change in western North America associated with the response of the
tropical Pacific sea surface temperatures (SSTs) to elevated radiative
forcing (particularly given the influence of tropical SSTs on the Pacific
North American (PNA) pattern and north Pacific storm tracks; Cayan et
al., 1999; Findell and Delworth, 2010; Seager and Vecchi, 2010; see
also WGI AR5 Section 14.8.3), and not all CMIP5 models simulate the
observed recent hydrologic trends in the region (Kumar et al., 2013a).
For seasonal-scale extremes, CMIP5 projects substantial increases in the
occurrence of extremely hot seasons over North America in early, middle,
and late-21st-century periods in RCP8.5 (Diffenbaugh and Giorgi, 2012;
Figure 26-4). For example, during the 2046–2065 period in RCP8.5,
more than 50% of summers exceed the respective late-20th-century
maximum seasonal temperature value over most of the continent.
CMIP3 projects similar increases in extremely hot seasons, including
greater than 50% of summers exceeding a mid-20th-century baseline
throughout much of North America by the mid-21st-century in the A2
scenario (Duffy and Tebaldi, 2012), and greater than 70% of summers
exceeding the highest summer temperature observed on record over
much of the western USA, southeastern USA, and southern Mexico by
the mid-21st-century in the A2 scenario (Battisti and Naylor, 2009).
CMIP5 also projects substantial decreases in snow accumulation over
1455
North America Chapter 26
26
0 10 20 30 40 50
% of years
20 40 60 80 1000
% of years
% of years
% change in 20-year return value
–2 2 5 10 20–5 30
0
20 40 60
80
100
(c) Summer Extreme Dry
RCP8.5 2080–2099
(a) Summer Extreme Hot
RCP8.5 2046–2065
(d) March Extreme Low Snow
RCP8.5 2070–2099
(b) Extreme Precipitation
RCP4.5 2046–2065
Figure 26-4 | Projected changes in extremes in North America. (a) The percentage of years in the 2046–2065 period of Representative Concentration Pathway 8.5 in which the
summer temperature is greater than the respective maximum summer temperature of the 1986–2005 baseline period (Diffenbaugh and Giorgi, 2012). (b) The percentage
difference in the 20-year return value of annual precipitation extremes between the 2046–2065 period of RCP4.5 and the 1986–2005 baseline period (Kharin et al., 2013). The
hatching indicates areas where the differences are not significant at the 5% level. (c) The percentage of years in the 2080–2099 period of RCP8.5 in which the summer
precipitation is less than the respective minimum summer precipitation of the 1986–2005 baseline period (Diffenbaugh and Giorgi, 2012). (d) The percentage of years in the
2070–2099 period of RCP8.5 in which the March snow water equivalent is less than the respective minimum March snow water equivalent of the 1976–2005 period
(Diffenbaugh et al., 2012). The black (white) stippling indicates areas where the multi-model mean exceeds 1.0 (2.0) standard deviations of the multi-model spread. (a-d) The
RCPs and time periods are those used in the peer-reviewed studies in which the panels appear. The 2046–2065 period of RCP8.5 and the 2046–2065 period of RCP4.5 exhibit
global warming in the range of 2°C to 3°C above the preindustrial baseline (WGI AR5 Figure 12.40). The 2080–2099 and 2070–2099 periods of RCP8.5 exhibit global warming
in the range of 4°C to 5°C above the preindustrial baseline (WGI AR5 Figure 12.40).

1456
Chapter 26 North America
26
t
he USA and Canada (Diffenbaugh et al., 2012; Figure 26-4), suggesting
that the increases in cold-season precipitation over these regions reflect
a shift towards increasing fraction of precipitation falling as rain rather
than snow (Diffenbaugh et al., 2012). Over much of the western USA
and western Canada, greater than 80% of years exhibit March snow
amount that is less than the late-20th-century median value beginning
in the mid-21st-century period in RCP8.5, with the ensemble-mean
change exceeding 2 standard deviations of the ensemble spread.
Likewise, greater than 60% of years exhibit March snow amount that is
less than the late-20th-century minimum value in the late-21st-century
period in RCP8.5, with the ensemble-mean change exceeding 2 standard
deviations of the ensemble spread (Diffenbaugh and Giorgi, 2012; Figure
26-4). CMIP5 also projects increases in the occurrence of extremely dry
summer seasons over much of Mexico, the USA, and southern Canada
(Figure 26-4). The largest increases occur over southern Mexico, where
greater than 30% of summers in the late-21st-century period in RCP8.5
exhibit seasonal precipitation that is less than the late-20th-century
minimum summer precipitation.
For daily-scale extremes, almost all areas of North America exhibit very
likely increases of at least 5°C in the warmest daily maximum temperature
by the late-21st-century period in RCP8.5. Likewise, most areas of Canada
exhibit very likely increases of at least 10°C in the coldest daily minimum
temperature by the late-21st-century period in RCP8.5, while most areas
of the USA exhibit very likely increases of at least 5°C and most areas
of Mexico exhibit very likely increases of at least 3°C (Sillmann et al.,
2013; see also WGI AR5 Figure 12.13). In addition, almost all areas of
North America exhibit very likely increases of 5 to 20% in the 20-year
return value of extreme precipitation by the mid-21st-century period in
RCP4.5 (Figure 26-4), while most areas of the USA and Canada exhibit
very likely increases of at least 5% in the maximum 5-day precipitation
by the late-21st-century period in RCP8.5 (Sillmann et al., 2013; see also
WGI AR5 Figure 12.13). Further, almost all areas of Mexico exhibit very
likely increases in the annual maximum number of consecutive dry days
by the late-21st-century period in RCP8.5 (Sillmann et al., 2013; see also
WGI AR5 Figure 12.13).
26.3. Water Resources and Management
Water withdrawals are exceeding stressful levels in many regions of
North America such as the southwestern USA, northern and central
Mexico (particularly Mexico City), southern Ontario, and the southern
Canadian Prairies (CONAGUA, 2010; Romero-Lankao, 2010; Sosa-
Rodriguez, 2010; Averyt et al., 2011; Environment Canada, 2013a).
Water quality is also a concern with 10 to 30% of the surface monitoring
sites in Mexico having polluted water (CONAGUA, 2010), and about 44%
of assessed stream miles and 64% of assessed lake areas in the USA not
clean enough to support their uses (EPA, 2004). Stations in Canada’s
16 most populated drainage basins reported at least fair quality, with
many reporting good or excellent quality (Environment Canada, 2013b).
In basins outside of the populated areas there are some cases of
declining water quality where impacts are related to resource extraction,
agriculture, and forestry (Hebben, 2009).
Water management infrastructure in most areas of North America is in
need of repair, replacement, or expansion (Section 26.7). Climate change,
l
and use changes and population growth, and demand increases will
add to these stresses (Karl et al., 2009).
26.3.1. Observed Impacts of Climate Change
on Water Resources
2
6.3.1.1. Droughts and Floods
As reported in WGI AR5 Chapter 10 and in Section 26.2.2.1, it is not
possible to attribute changes in drought frequency in North America to
anthropogenic climate change (Prieto-González et al., 2011; Axelson et al.,
2012; Orlowsky and Senevirantne, 2013; Figure 26-1). Few discernible
trends in flooding have been observed in the USA (Chapter 3). Changes in
the magnitude or frequency of flood events have not been attributed to
climate change. Floods are generated by multiple mechanisms (e.g., land
use, seasonal changes, and urbanization); trend detection is confounded
by flow regulation, teleconnections, and long-term persistence (Section
26.2.2.1; Collins, 2009; Kumar et al., 2009; Smith et al., 2010; Villarini
and Smith, 2010; Villarini et al., 2011; Hirsch and Ryberg, 2012; INECC
and SEMARNAT, 2012a; Prokoph et al., 2012; Peterson et al., 2013).
26.3.1.2. Mean Annual Streamflow
Whereas annual precipitation and runoff increases have been found in
the midwestern and northwestern USA, decreases have been observed
in southern states (Georgakakos et al., 2013). Chapter 3 notes the
correlation between changes in streamflow and observed regional
changes in temperature and precipitation. Kumar et al. (2009) suggest
that human activities have influenced observed trends in streamflow,
making attribution of changes to climate difficult in many watersheds.
Nonetheless, earlier peak flow of snowmelt runoff in snow-dominated
streams and rivers in western North America has been formally detected
and attributed to anthropogenic climate change (Barnett et al., 2008;
Das et al., 2011; Figure 26-1).
26.3.1.3. Snowmelt
Warm winters produced earlier runoff and discharge but less snow
water equivalent and shortened snowmelt seasons in many snow-
dominated areas of North America (Barnett et al., 2005; Rood et al.,
2008; Reba et al., 2011; see also Section 26.2.2; Chapter 3).
26.3.2. Projected Climate Change Impacts and Risks
26.3.2.1. Water Supply
Most of this assessment focuses on surface water as there are few
groundwater studies (Tremblay et al., 2011; Georgakakos et al., 2013).
Impacts and risks vary by region and model used.
In arid and semiarid western USA and Canada and in most of Mexico,
except the southern tropical area, water supplies are projected to be
further stressed by climate change, resulting in less water availability

1457
North America Chapter 26
26
a
nd increased drought conditions (Seager et al., 2007; Cayan et al.,
2010; MacDonald, 2010; Martínez Austria and Patiño Gómez, 2010;
Montero Martínez et al., 2010; CONAGUA, 2011; Prieto-González et al.,
2011; Bonsal et al., 2012; Diffenbaugh and Field, 2013; Orlowsky and
Seneviratne, 2013; Sosa-Rodriguez, 2013). Compounding factors include
saltwater intrusion, and increased groundwater and surface water
pollution (Leal Asencio et al., 2008).
In the southwest and southeast USA, ecosystems and irrigation are
projected to be particularly stressed by decreases in water availability
due to the combination of climate change, growing water demand, and
water transfers to urban and industrial users (Seager et al., 2009;
Georgakakos et al., 2013). In the Colorado River basin, crop irrigation
requirements for pasture grass are projected to increase by 20% by
2040 and by 31% by 2070 (Dwyer et al., 2012). In the Rio Grande basin,
New Mexico, runoff is projected to decrease by 8 to 30% by 2080 due
to climate change. Water transfers may entail significant transaction
costs associated with adjudication and potential litigation, and might
have economic, environmental, social, and cultural impacts that vary
by water user (Hurd and Coonrod, 2012). In Mexico, water shortages
combined with increased water demands are projected to increase
surface and groundwater over-exploitation (CONAGUA, 2011).
Other parts of North American are projected to have different climate
risks. The vulnerability of water resources over the tropical southern
region of Mexico is projected to be low for 2050: precipitation decreases
from 10 to 5% in the summer and no precipitation changes in the
winter. After 2050, greater winter precipitation is projected, increasing
the possibility of damaging hydropower and water storage dams by
floods, while precipitation is projected to decrease by 40 to 35% in the
summer (Martínez Austria and Patiño Gómez, 2010).
Throughout the 21st century, cities in northwest Washington are
projected to have drawdown of average seasonal reservoir storage in
the absence of demand reduction because of less snowpack even though
annual streamflows increase. Without accounting for demand increases,
projected reliability of all systems remains above 98% through mid-
and late-21st century (Vano et al., 2010a; CONAGUA, 2011). Throughout
the eastern USA, water supply systems will be negatively impacted by
lost snowpack storage, rising sea levels contributing to increased storm
intensities and saltwater intrusion, possibly lower streamflows, land use
and population changes, and other stresses (Sun et al., 2008; Obeysekera
et al., 2011).
In Canada’s Pacific Northwest region, cool season flows are expected
to increase, while warm seasons flows would decrease (Hamlet, 2011).
Southern Alberta, where approximately two-thirds of Canadian irrigated
land is located, is projected to experience declines in mean annual
streamflow, especially during the summer (Shepherd et al., 2010; Poirier
and de Loë, 2012; Tanzeeba and Gan, 2012). In the Athabasca River
basin in northern Alberta, modeling results consistently indicate large
projected declines in mean annual flows (Kerkhoven and Gan, 2011).
In contrast, modeling results for basins in Manitoba indicate an increase
in mean annual runoff (Choi et al., 2009). Some model results for the
Fraser River basin in British Columbia indicate increases in mean annual
runoff by the end of the 21st century, while others indicate decreases
(Kerkhoven and Gan, 2011). In central Quebec, J. Chen et al. (2011)
p
roject a general increase in discharge during November to April, and
a general decrease in summer discharge under most climate change
conditions.
26.3.2.2. Water Quality
Many recent studies project water quality declines due to the combined
impacts of climate change and development (Daley et al., 2009; Tu,
2009; Praskievicz and Chang, 2011; Wilson and Weng, 2011; Tong et
al., 2012). Increased wildfires linked to a warming climate are expected
to affect water quality downstream of forested headwater regions
(Emelko et al., 2011).
Model simulation of lakes under a range of plausible higher air
temperatures (Tahoe, Great Lakes, Lake Onondaga, and shallow polymictic
lakes), depending on the system, predict a range of impacts such as
increased phytoplankton, fish,and cyanobacteria biomass; lengthened
stratification periods with risks of significant hypolimnetic oxygen
deficits in late summer with solubilization of accumulated phosphorus
and heavy metals with accelerated reaction rates; and decreased lake
clarity (Dupuis and Hann, 2009; Trumpickas et al., 2009; Sahoo et al.,
2011; Taner et al., 2011). Model simulations have found seasonal climate
change impacts on nonpoint source pollution loads, while others have
found no impact (Marshall and Randhir, 2008; Tu, 2009; Taner et al.,
2011; Praskievicz and Chang, 2011).
Changes in physical-chemical-biological parameters and micropollutants
are predicted to negatively affect drinking water treatment and distribution
systems (Delpla et al., 2009; Carriere et al., 2010; Emelko et al., 2011).
Wastewater treatment plants would be more vulnerable as increases
in rainfall and wet weather lead to higher rates of inflow and infiltration
(King County Department of Natural Resources and Parks, 2008; New
York City Department of Environmental Protection, 2008; Flood and
Cahoon, 2011). They would also face reduced hydraulic capacities due
to higher sea levels and increased river and coastal flooding (Flood and
Cahoon, 2011), with higher sea levels also threatening sewage collection
systems (Rosenzweig et al., 2007; King County Department of Natural
Resources and Parks, 2008).
26.3.2.3. Flooding
Projected increases in flooding (Georgakakos et al., 2013) may affect
sectors ranging from agriculture and livestock in southern tropical
Mexico (CONAGUA, 2010) to urban and water infrastructure in areas
such as Dayton (Ohio), metro Boston, and the Californian Bay-Delta
region (NRC, 1995; Kirshen et al., 2006; DWR, 2009; Wu, 2010). Floods
could begin earlier, and have earlier peaks and longer durations (e.g.,
southern Quebec basin). Urbanization can compound the impacts of
increased flooding due to climate change, particularly in the absence
of flood management infrastructure that takes climate change into
account (Hejazi and Markus, 2009; Mailhot and Duchesne, 2010; Sosa-
Rodriguez, 2010). Ntelekos et al. (2010) estimate that annual riverine
flood losses in the USA could increase from approximately US$2 billion
now to US$7 to US$19 billion annually by 2100 depending on emission
scenario and economic growth rate.

1458
Chapter 26 North America
26
26.3.2.4 Instream Uses
Projections of climate impacts on instream uses vary by region and time
frame. Hydropower generation, affected by reduced lake levels, is
projected to decrease in arid and semiarid areas of Mexico (CICC, 2009;
Sosa-Rodriguez, 2013) and in the Great Lakes (Buttle et al., 2004; Mortsch
et al., 2006; Georgakakos et al., 2013). In the US Pacific Northwest under
several emissions scenarios, it is projected to increase in 2040 by
approximately 5% in the winter and decrease by approximately 13%
in the summer, with annual reductions of approximately 2.5%. Larger
increases and decreases are projected by 2080 (Hamlet et al., 2010).
On the Peribonka River system in Quebec, annual mean hydropower
production will similarly decrease in the short term and increase by as
much as 18% in the late-21st century (Minville et al., 2009). Navigation
on the Great Lakes, Mississippi River, and other inland waterways may
benefit from less ice cover but will be hindered by increased floods and
low river levels during droughts (Georgakakos et al., 2013).
26.3.3. Adaptation
A range of structural and non-structural adaptation measures are being
implemented, many of which are no-regret policies. For instance, in
preparation for more intense storms, New York City is using green
infrastructure to capture rainwater before it can flood the combined
sewer system and is elevating boilers and other equipment above ground
(Bloomberg, 2012). The Mexican cities of Monterrey, Guadalajara,
Mexico City, and Tlaxcala are reducing leaks from water systems (CICC,
2009; CONAGUA, 2010; Romero-Lankao, 2010; Sosa-Rodriguez, 2010).
Regina, Saskatchewan, has increased urban water conservation efforts
(Lemmen et al., 2008).
The 540-foot high, 1300-foot long concrete Ross Dam in the state of
Washington, USA, was built on a special foundation so it could later be
raised in height (Simmons, 1974). Dock owners in the Trent-Severn
Waterway in the Great Lakes have moved their docks into deeper water
to better manage impacts on shorelines (Coleman, 2005). The South
Florida Water Management District is assessing the vulnerability to
sea level rise of its aging coastal flood control system and exploring
adaptation strategies, including a strategy known as forward pumping
(Obeysekera et al., 2011). In Cambridge, Ontario, extra-capacity culverts
are being installed in anticipation of larger runoff (Scheckenberger et
al., 2009).
Water meters have been installed to reduce consumption by different
users such as Mexican and Canadian farmers and in households of
several Canadian cities (INE and SEMARNAT, 2006; Lemmen et al., 2008).
Agreements and regulations are underway such as the 2009 SECURE
Water Act, which establishes a federal climate change adaptation
program with required studies to assess future water supply risks in
the western USA (42 USC § 10363).One such large, multi-year study
was recently completed in the USA for the Colorado River (Bureau of
Reclamation, 2013), and others are planned. Agreements and regulations
are underway, such as the 2007 Shortage Sharing Agreement for the
management of the Colorado River, driven by concerns about water
conservation, planning, better reservoir coordination, and preserving
flexibility to respond to climate change (Bureau of Reclamation, 2007).
Q
uebec Province is requiring dam safety inspections every 10 years
to account for new knowledge on climate change impacts (Centre
d’Expertise Hydrique du Québec, 2003). Expanded beyond flood and
hydropower management to now include climate change, the Columbia
River Treaty is a good example of an international treaty to manage a
range of water resources challenges (U.S. Army Corps of Engineers and
Bonneville Power Administration, 2013).
26.4. Ecosystems and Biodiversity
26.4.1. Overview
Recent research has documented gradual changes in physiology,
phenology, and distributions in North American ecosystems consistent
with warming trends (Dumais and Prévost, 2007). Changes in phenology
and species’ distributions, particularly in the USA and Canada, have been
attributed to rising temperatures, which have in turn been attributed
to anthropogenic climate change via joint attribution (Root et al., 2005;
Vose et al., 2012). Concomitant with 20th-century temperature increases,
northward and upward shifts in plant, mammal, bird, lizard, and insect
species’ distributions have been documented extensively in the western
USA and eastern Mexico (Parmesan, 2006; Kelly and Goulden, 2008;
Moritz et al., 2009; Tingley et al., 2009; Sinervo et al., 2010). These
distribution shifts consistent with climate change interact with other
environmental changes such as land use change, hindering the ability
of species to respond (Ponce-Reyes et al., 2013).
A range of techniques have been applied to assess the vulnerability of
North American ecosystems and species to changes in climate (Anderson
et al., 2009; Loarie et al., 2009; Glick and Stein, 2011). A global risk
analysis based on dynamic global vegetation models identified boreal
forest in Canada as notably vulnerable to ecosystem shift (Scholze et
al., 2006). Since the AR4, the role of extreme events, including droughts,
flood, hurricanes, storm surges, and heat waves, is a more prominent theme
in studies of climate change impacts on North American ecosystems
(Chambers et al., 2007; IPCC, 2012).
A number of ecosystems in North America are vulnerable to climate
change. For example, species in alpine ecosystems are at high risk due
to limited geographic space into which to expand (Villers Ruiz and
Castañeda-Aguado, 2013). Many forest ecosystems are susceptible to
wildfire and large-scale mortality and infestation events (Section 26.4.1).
Across the continent, potentially rapid rates of climate change may
require location shifts at velocities well outside the range in historical
reconstructions (Sandel et al., 2011; Schloss et al., 2012). Changes in
temperature, precipitation amount, and CO
2
concentrations can have
different effects across species and ecological communities (Parmesan,
2006; Matthews et al., 2011), leading to ecosystem disruption and
reorganization (Dukes et al., 2011; Smith et al., 2011), as well as
movement or loss.
The following subsections focus in more depth on climate vulnerabilities
in forests and coastal ecosystems. These ecosystems, spanning all three
North American countries, are illustrative cases of where understanding
opportunities for conservation and adaptation practices is important,
and recent research advances on and new evidence of increased

1459
North America Chapter 26
26
v
ulnerabilities since AR4 motivate further exploration. Further treatment
of grasslands and shrublands can be found in Section 4.3.3.2.2; wetlands
and peatlands in Section 4.3.3.3; and tundra, alpine, and permafrost
systems in Section 4.3.3.4. Additional synthesis of climate change impacts
on terrestrial, coastal, and ocean ecosystems can be found in Chapter 8
of the U.S. National Climate Assessment (Groffman et al., 2013).
26.4.2. Tree Mortality and Forest Infestation
26.4.2.1. Observed Impacts
Droughts of unusual severity, extent, and duration have affected large
parts of western and southwestern North America and resulted in
regional-scale forest dieback in Canada, the USA, and Mexico.Extensive
tree mortality has been related to drought exacerbated by high
summertime temperatures in trembling aspen (Populus tremuloides),
pinyon pine (Pinus edulis), and lodgepole pine (Pinus contorta) since
the early 2000s (Breshears et al., 2005; Hogg et al., 2008; Raffa et al.,
2008; Michaelian et al., 2011; Anderegg et al., 2012).In 2011 and 2012,
forest dieback in northern and central Mexico was associated with
extreme temperatures and severe droughts (Comisión Nacional Forestal,
2012a). Widespread forest-mortality events triggered by extreme
climate events can alter ecosystem structure and function (Phillips et
al., 2009; Allen et al., 2010; Anderegg et al., 2013). Similarly, multi-
decadal changes in demographic rates, particularly mortality, indicate
climate-mediated changes in forest communities over longer periods
(Hogg and Bernier, 2005; Williamson et al., 2009). Average annual
mortality rates increased from less than 0.5% of trees per year in the
1960s in forests of western Canada and the USA to, respectively, 1.5 to
2.5% (Peng et al., 2011), and 1.0 to 1.5% in the 2000s in the USA (van
Mantgem et al., 2009).
The influences of climate change on ecosystem disturbance, such as
insect outbreaks, have become increasingly salient and suggest that
these disturbances could have a major influence on North American
ecosystems and economy in a changing climate. In terms of carbon
stores these outbreaks have the potential to turn forests into carbon
sources (Kurz et al., 2008a,b; Hicke et al., 2012). Warm winters in
western Canada and USA have increased winter survival of the larvae
of bark beetles, helping drive large-scale forest infestations and forest
die-off in western North America since the early 2000s (Bentz et al.,
2010). Beginning in 1994, mountain pine beetle outbreaks have severely
affected more than 18 million hectares of pine forests in British Columbia,
and outbreaks are expanding northwards (Energy, Mines and Resources,
2012).
26.4.2.2. Projected Impacts and Risks
Projected increases in drought severity in southwestern forests and
woodlands in USA and in northwestern Mexico suggest that these
ecosystems may be increasingly vulnerable, with impacts including
vegetation mortality (Overpeck and Udall, 2010; Seager and Vecchi,
2010; Williams et al., 2010) and an increase of biological agents such
as beetles, borers, pathogenic fungi, budworms, and other pests (Drake
et al., 2005). An index of forest drought stress calibrated from tree rings
i
ndicates that projected drought stress by the 2050s in the SRES A2
scenario from the CMIP3 model ensemble, due primarily to warming-
induced rises in vapor pressure deficit, exceeds the most severe droughts
of the past 1000 years (Williams et al., 2013).
Under a scenario with large changes in global temperature (SRES A2)
increases in growing-season temperature in forest soils in southern Quebec
are as high as 5.0°C toward the end of the century and decreases of
soil water content reach 20 to 40% due to elevated evapotranspiration
rates (Houle et al., 2012). More frequent droughts in tropical forests
may change forest structure and regional distribution, favoring a higher
prevalence of deciduous species in the forests of Mexico (Drake et al.,
2005; Trejo et al., 2011).
Shifts in climate are expected to lead to changes in forest infestation,
including shifts of insect and pathogen distributions into higher latitudes
and elevations (Bentz et al., 2010). Predicted climate warming is
expected to have effects on bark beetle population dynamics in the
western USA, western Canada, and northern Mexico that may include
increases in developmental rates, generations per year, and changes in
habitat suitability (Waring et al., 2009). As a result, the impacts of bark
beetles on forest resources are expected to increase (Waring et al.,
2009).
Wildfire, a potentially powerful influence on North American forests in
the 21st century, is discussed in Box 26-2.
26.4.3. Coastal Ecosystems
Highly productive estuaries, coastal marshes, and mangrove ecosystems
are present along the Gulf Coast and the East and West Coasts of North
America. These ecosystems are subject to a wide range of non-climate
stressors, including urban and tourist developments and the indirect
effects of overfishing (Bhatti et al., 2006; Mortsch et al., 2006; CONABIO
et al., 2007; Lund et al., 2007). Climate change adds risks from SLR,
warming, ocean acidification, extratropical cyclones, altered upwelling,
and hurricanes and other storms.
26.4.3.1. Observed Climate Impacts and Vulnerabilities
SLR, which has not been uniform across the coasts of North America
(Crawford et al., 2007; Kemp et al., 2008; Leonard et al., 2009; Zavala-
Hidalgo et al., 2010; Sallenger, Jr. et al., 2012), is directly related to
flooding and loss of coastal dunes and wetlands, oyster beds, seagrass,
and mangroves (Feagin et al., 2005; Cooper et al., 2008; Najjar et al., 2010;
Ruggiero et al., 2010; Martinez Arroyo et al., 2011; McKee, 2011).
Increases in sea surface temperature in estuaries alter metabolism,
threatening species, especially coldwater fish (Crawford et al., 2007).
Historical warm periods have coincided with low salmon abundance
and restriction of fisheries in Alaska (Crozier et al., 2008; Karl et al.,
2009). North Atlantic cetaceans and tropical coral reefs in the Gulf of
California and the Caribbean have been affected by increases in the
incidence of diseases associated with warm waters and low water quality
(ICES, 2011; Mumby et al., 2011).

1460
Chapter 26 North America
26
I
ncreased concentrations of CO
2
i
n the atmosphere due to human
emissions are causing ocean acidification (Chapters 5 ES, 6 ES; FAQ 5.1).
Along the temperate coasts of North America acidification directly
affects calcareous organisms, including colonial mussel beds, with
indirect influences on food webs of benthic species (Wootton et al.,
2008). Increased acidity in conjunction with high temperatures has been
identified as a serious threat to coral reefs and other marine ecosystems
in the Bahamas and the Gulf of California (Doney et al., 2009; Hernández
et al., 2010; Mumby et al., 2011).
Tropical storms and hurricanes can have a wide range of effects on
coastal ecosystems, potentially altering hydrology, geomorphology
(erosion), biotic structure in reefs, and nutrient cycling. Hurricane impacts
on the coastline change dramatically the marine habitat of sea turtles,
reducing feeding habitats, such as coral reefs and areas of seaweed,
and nesting places (Liceaga-Correa et al., 2010; Montero Martínez et al.,
2010).
26.4.3.2. Projected Impacts and Risks
Projected increases in sea levels, particularly along the coastlines of
Florida, Louisiana, North Carolina, and Texas (Kemp et al., 2008; Leonard
et al., 2009; Weiss et al., 2011), will threaten many plants in coastal
ecosystems through increased inundation, erosion, and salinity levels. In
settings where landward shifts are not possible, a 1 m rise in sea level
will result in loss of wetlands and mangroves along the Gulf of Mexico
of 20% in Tamaulipas to 94% in Veracruz (Flores Verdugo et al., 2010).
Projected impacts of increased water temperatures include contraction
of coldwater fish habitat and expansion of warmwater fish habitat
(Mantua et al., 2010), which can increase the presence of invasive species
that threaten resident populations (Janetos et al., 2008). Depending on
scenario, Chinook salmon in the Pacific Northwest may decline by 20 to
50% by 2040–2050 (Battin et al., 2007; Crozier et al., 2008), integrating
across restrictions in productivity and abundance at the southern end
of their range and expansions at the northern end (Azumaya et al.,
2007), although habitat restoration and protection particularly at lower
elevations may help mitigate declines in abundance.
C
ontinuing ocean acidification will decrease coral growth and interactions
with temperature increases will lead to increased risk of coral bleaching,
leading to declines in coral ecosystem biodiversity (Veron et al., 2009;
see also Section 5.4.2.4; Box CC-OA). Oyster larvae in the Chesapeake
Bay grew more slowly when reared with CO
2
levels between 560 and
480 ppm compared to current environmental conditions (Gazeau et al.,
2007; Miller et al., 2009; Najjar et al., 2010).
Although future trends in thunderstorms and tropical cyclones are
uncertain (Section 26.2.2), any changes, particularly an increase in the
frequency of category 4 and 5 storms (Bender et al., 2010; Knutson et
al., 2010), could have profound impacts on mangrove ecosystems, which
require 25 years for recovery from storm damage (Kovacs et al., 2004;
Flores Verdugo et al., 2010).
26.4.4. Ecosystems Adaptation, and Mitigation
In North America, a number of adaptation strategies are being applied
in novel and flexible ways to address the impacts of climate change
(Mawdsley et al., 2009; NOAA, 2010; Gleeson et al., 2011; Poiani et al.,
2011). The best of these are based on detailed knowledge of the
vulnerabilities and sensitivities of species and ecosystems, and with a
focus on opportunities for building resilience through effective ecosystem
management. Government agencies and nonprofit organizations have
established initiatives that emphasize the value of collaborative dialog
between scientists and practitioners, indigenous communities, and grass-
roots organizations to develop no-regrets and co-benefits adaptation
strategies (Ogden and Innes, 2009; Gleeson et al., 2011; Halofsky et al.,
2011; Cross et al., 2012, 2013; INECC and SEMARNAT, 2012b).
Examples of adaptation measures implemented to respond to climate
change impacts on ecosystems are diverse. They include programs to
reduce the incidence of Canadian forest pest infestations (Johnston et
al., 2010); breeding programs for resistance to diseases and insect pests
(Yanchuk and Allard, 2009); use of forest programs to reduce the
incidence of forest fires and encourage agroforestry in areas of Mexico
(Sosa-Rodriguez, 2013); and selection by forest or fisheries managers
of activities that are more adapted to new climatic conditions (Vasseur
Box 26-2 | Wildfires
Wildfire is a natural process, critical to nutrient cycling, controlling populations of pests and pathogens, biodiversity, and fire-adapted
species (Bond and Van Wilgen, 1996). However, since the mid-1980s large wildfire activity in North America has been marked by
increased frequency and duration, and longer wildfire seasons (Westerling et al., 2006; Williamson et al., 2009). Recent wildfires in
western Canada, the USA, and Mexico relate to long and warm spring and summer droughts, particularly when they are accompanied
by winds (Holden et al., 2007; Comisión Nacional Forestal, 2012b). Interacting processes such as land use changes associated with
the expansion of settlements and activities in peri-urban areas or forested areas, combined with the legacies of historic forest
management that prescribed fire suppression, also substantially increase wildfire risk (Radeloff et al., 2005; Peter et al., 2006; Fischlin
et al., 2007; Theobald and Romme, 2007; Gude et al., 2008; Collins and Bolin, 2009; Hammer et al., 2009; Brenkert-Smith, 2010).
Continued next page

1461
North America Chapter 26
26
Box 26-2 (continued)
Drought conditions are strongly associated with wildfire occurrence, as dead fuels such as needles and dried stems promote the
incidence of firebrands and spot fires (Keeley and Zedler, 2009; Liu et al., 2012). Drought trends vary across regions (Groisman et al.,
2007; Girardin et al., 2012): The western USA has experienced drier conditions since the 1970s (Peterson et al., 2013); drought periods
in Alberta and Idaho have coincided with large burned areas (Pierce and Meyer, 2008; Kulshreshtha, 2011); and heterogeneous
patterns of drought severity and a reduction of wildfire risk have been detected for the circumboreal region (Girardin et al., 2009).
Decadal climatic oscillations also contribute to differences in drought, and thus in wildfire occurrences. The areas burned in the
continent boreal forest and in northwest and central Mexico correlate with the dynamics of seasonal land/ocean temperature
variability (Macias Fauria and Johnson, 2006; Skinner et al., 2006; Villers Ruíz and Hernández-Lozano, 2007; Girardin and Sauchyn,
2008; Macias Fauria and Johnson, 2008), which is shifting toward hotter temperatures and longer droughts. Such human practices as
slash-and-burn agriculture can have negative impacts on Mexican forests (Bond and Keeley, 2005; CONANP and The Nature
Conservancy, 2009).
Drought index projections and climate change regional models show increases in wildfire risk during the summer and fall on the
southeast Pacific Coast, Northern Plains, and the Rocky Mountains (Liu et al., 2012). In places like Sierra Nevada, mixed conifer
forests, which have a natural cycle of small, non-crown fires, are projected to have massive crown fires (Bond and Keeley, 2005; see
also Table 26-1).
While healthy forests (Davis, 2004) and many fire-maintained systems that burn at lower intensities can provide carbon sequestration
and thus mitigation co-benefits (e.g., longleaf pine savanna, Sierra mixed-conifer; Fried et al., 2008; North et al., 2012), forests affected
by pests and fires are less effective carbon sinks, and wildfires themselves are a source of emissions.
Wildfires pose a direct threat to human lives, property, and health. Over the last 30 years, 155 people were killed in wildfires across
North America, including 103 in the USA, 50 in Mexico, and 2 in Canada (Centre for Research on the Epidemiology of Disasters,
2012). Direct effects include injury and respiratory effects from smoke inhalation, with firefighters at increased risk (Naeher et al.,
2007; Reisen and Brown, 2009; Reisen et al., 2011). Wildfire activity causes impacts on human health (Section 26.6).
Minimizing adverse effects of wildfires involves short- and long-term strategies such as planned manipulation of vegetation composition
and stand structure (Girardin et al., 2012; Terrier et al., 2013), suppression of fires where required, fuel treatments, use of fire-safe
materials in construction, community planning, and reduction of arson. Not all negative consequences of fire can be avoided, though
a mixture of techniques can be used to minimize adverse effects (Girardin et al., 2012). Prescribed fire may be an important tool for
managing fire risk in Canada and the USA (Hurteau and North, 2010; Wiedinmyer and Hurteau, 2010; Hurteau et al., 2011). Managers
in the USA have encouraged reduction of flammable vegetation around structures with different levels of success (Stewart et al.,
2006). However, such efforts depend largely on land use planning; the socioeconomic capacity of communities at risk; the extent of
resource dependence; community composition; and the risk perceptions, attitudes, and beliefs of decision makers, private property
owners, and affected populations (McFarlane, 2006; Repetto, 2008; Collins and Bolin, 2009; Martin et al., 2009; Trainor et al., 2009;
Brenkert-Smith, 2010). Indigenous peoples are at higher risk from wildfire and may have unique requirements for adaptation strategies
(Carroll et al., 2010; Christianson et al., 2012a,b).
Effective forest management requires stakeholder involvement and investment. The provision of adequate information on smoke,
prescribed fire, pest management, and forest thinning is crucial, as is building trust between stakeholders and land managers
(Dombeck et al., 2004; Flint et al., 2008; Chang et al., 2009). Institutional shifts from reliance on historical records toward incorporation
of climate forecasting in forest management is also crucial to effective adaptation (McKenzie et al., 2004; Millar et al., 2007; Kolden
and Brown, 2010).

1462
Chapter 26 North America
26
a
nd Catto, 2008). Example programs have addressed commercial fishing,
mass tourism (Pratchett et al., 2008), and enforcement mechanisms for
using water regulation technologies to maintain quantity and quality in
wetlands around the Great Lakes and San Francisco, California (Mortsch
et al., 2006; Okey et al., 2012). Assisted migration is increasingly discussed
as a potential management option to maintain health and productivity
of forests; yet the technique has logistical and feasibility challenges
(Keel, 2007; Hoegh-Guldberg et al., 2008; Winder et al., 2011).
Several lines of evidence indicate that effective adaptation requires
changes in approach and becomes much more difficult if warming exceeds
2°C above preindustrial levels (CONABIO et al., 2007; Mansourian et
al., 2009; U.S. Forest Service, 2010; Glick and Stein, 2011; March et al.,
2011; INECC and SEMARNAT, 2012b). Even though options for effective
adaptation are increasingly constrained at warming over 2°C, some
opportunities will remain. In particular, efforts to maintain or increase
forest carbon stocks can lead to numerous benefits, including not only
benefits for atmospheric CO
2
(Anderson and Bell, 2009; Anderson et al.,
2011). Even where there are opportunities, managers face challenges
in designing management practices that favor carbon stocks, while
at the same time maintaining biodiversity, recognizing the rights of
indigenous people, and contributing to local economic development
(FAO, 2012).
26.5. Agriculture and Food Security
Projected declines in global agricultural productivity (Chapter 7) have
implications for food security among North Americans. Because North
America is a major exporter (FAO, 2009; Schlenker and Roberts, 2009),
shifts in agricultural productivity here may have implications for global
food security. Canada and the USA are relatively food secure, although
households living in poverty are vulnerable. 17.6% of Mexicans are food
insecure (Monterroso et al., 2012). Indigenous peoples are highly
vulnerable due to high reliance on subsistence (Chapter 12). While this
section focuses on agricultural production, food security is related to
multiple factors (see Chapter 7).
26.5.1. Observed Climate Change Impacts
Historic yield increases are attributed in part to increasing temperatures
in Canada and higher precipitation in the USA (medium evidence, high
agreement; Pearson et al., 2008; Nadler and Bullock, 2011; Sakurai et al.,
2011), although multiple non-climatic factors affect historic production
rates. In many North American regions optimum temperatures have
been reached for dominant crops; thus continued regional warming
would diminish rather than enhance yields (high confidence; Jones et
al., 2005). Regional yield variances over time have been attributed to
climate variability, for example Ontario (Cabas et al., 2010) and Quebec
(Almaraz et al., 2008). Since 1999 a marked increase in crop losses
attributed to climate-related events such as drought, extreme heat, and
storms has been observed across North America (Hatfield et al., 2013),
with significant negative economic effects (high confidence; Swanson
et al., 2007; Chen and McCarl, 2009; Costello et al., 2009). In Mexico,
agriculture accounted for 80% of weather-related financial losses since
1990 (Saldaña-Zorrilla, 2008; Figure 26-2).
26.5.2. Projected Climate Change Risks
Studies project productivity gains in northern regions and where water
is not projected to be a limiting factor, across models, time frames, and
scenarios (high confidence; Hatfield et al., 2008; Pearson et al., 2008;
Stöckle et al., 2010; Wheaton et al., 2010). Overall yields of major crops
in North America are projected to decline modestly by mid-century and
more steeply by 2100 among studies that do not consider adaptation
(very high confidence). Certain regions and crops may experience gains
in the absence of extreme events, and projected yields vary by climate
model (Paudel and Hatch, 2012; Liu et al., 2013).
Among studies projecting yield declines, two factors stand out:
exceedance of temperature thresholds and water availability. Yields of
several important North American agriculture sectors—including grains,
forage, livestock, and dairy—decline significantly above temperature
thresholds (Wolfe et al., 2008; Schlenker and Roberts, 2009; Craine et
al., 2010). Temperature increases affect product quality as well, for
example, coffee (Lin, 2007), wine grapes (Hayhoe et al., 2004; Jones et
al., 2005), wheat (Porter and Semenov, 2005), fruits and nuts (Lobell et
al., 2006), and cattle forage (Craine et al., 2010). Projected temperature
increases would reduce corn, soy, and cotton yields by 2020, with declines
ranging from 30 to 82% by 2099 depending on crop and scenario
(steepest decline for corn, A1; Schlenker and Roberts, 2009). Studies
also project increasing interannual yield variability over time (Sakurai
et al., 2011; Urban et al., 2012). Several studies focus on California, one
of North America’s most productive agricultural regions. Modest and
variable yield changes among several California crops are projected to
2026, with yield declines from 9 to 29% by 2097 (A2, DAYCENT model).
Lee et al. (2011) and Lobell and Field (2011) found little negative effect
for California perennials by 2050 due to projected climate change,
assuming irrigation access (General Circulation Model (GCM) ensemble,
A2 and B1). Hannah et al. (2013), however, project large declines in land
suitability for California viticulture by 2050 (with increases further north)
with RCP4.5 and RCP8.5 (GCM ensemble); declines are greater under
RCP8.5. Heat-induced livestock stress, combined with reduced forage
quality, would reduce milk production and weight gain in cattle (Wolfe
et al., 2008; Hernández et al., 2011).
Precipitation increases offset but do not entirely compensate for
temperature-related declines in productivity (Kucharik and Serbin,
2008). In regions projected to experience increasing temperatures
combined with declining precipitation, declines in yield and quality are
more acute (Craine et al., 2010; Monterroso Rivas et al., 2011).
Projected change in climate will reduce soil moisture and water availability
in the US West/Southwest, the Western Prairies in Canada, and central
and northern Mexico (very high confidence; Pearson et al., 2008; Cai et
al., 2009; Karl et al., 2009; Sanchez-Torres Esqueda, 2010; Vano et al.,
2010b; Kulshreshtha, 2011). CMIP5 models indicate soil moisture
decreases across the continent in spring and summer under RCP8.5,
with high agreement (Dirmeyer et al., 2013). Based on a combined
exposure/consumptive water use model, the US Great Plains is identified
as one of four global future vulnerability hotspots for water availability
from the 2030s and beyond, where anticipated water withdrawals would
exceed 40% of freshwater resources (Liu et al., 2013). In western USA
and Canada, projected earlier spring snowmelt and reduced snowpack

1463
North America Chapter 26
26
w
ould affect productivity negatively regardless of precipitation, as water
availability in summer and fall are reduced (Schlenker et al., 2007;
Forbes et al., 2011; Kienzle et al., 2012).
Projected increases in extreme heat, drought, and storms affect
productivity negatively (Chen and McCarl, 2009; Kulshreshtha, 2011).
The northeastern and southeastern USA have been identified as
“vulnerability hotspots” for corn and wheat production respectively by
2045 with vulnerability worsening thereafter, using a combined drought
exposure and adaptive capacity assessment, with only slight differences
between A1B and B2 scenarios (Fraser et al., 2013). Central North
America is identified as among the globe’s regions of highest risk of
heat stress by 2070 (National Institute for Environmental Studies (NIES)
GCM, A1B; Teixeira et al., 2013).
26.5.3. A Closer Look at Mexico
Much of Mexico’s land base is already marginal for two of the country’s
major crops: corn and beef (Buechler, 2009). Severe desertification in
Mexico due to non-climate drivers further compromises productivity
(Huber-Sannwald et al., 2006). Land classified suitable for rain-fed corn
is projected to decrease from 6.2% currently to between 3 and 4.3%
by 2050 (UKHadley B2, European Centre for Medium Range Weather
Forecasts and Hamburg 5 (ECHAM5)/Max Planck Institute (MPI) A2;
Monterroso Rivas et al., 2011). The distribution of most races of corn
is expected to be reduced and some eliminated by 2030 (A2, three
climate models; Ureta et al., 2012). Precipitation declines of 0 to 30%
are projected over Mexico by 2040, with the most acute declines in
northwestern Mexico, the primary region of irrigated grain farming
(declines steeper in A2 than A1B, 18-model ensemble).
Although projected increases in precipitation may contribute to increase
in rangeland productivity in some regions (Monterroso Rivas et al., 2011),
a study in Veracruz indicates that the effects of projected maximum
summer temperatures on livestock heat stress are expected to reach the
“danger level” (at which losses can occur) by 2020 and continue to rise
(A2, B2, three GCMs; Hernández et al., 2011). Coffee, an economically
important crop supporting 500,000 primarily indigenous households
(González Martínez, 2006), is projected to decline 34% by 2020 in
Veracruz if historic temperature and precipitation trends continue (Gay
et al., 2006); see also Schroth et al. (2009), on declines in Chiapas.
Many of Mexico’s agricultural communities are also considered highly
vulnerable, due to high sensitivity and/or low adaptive capacity
(Monterroso et al., 2012). The agriculture sector here consists primarily
of small farmers (Claridades Agropecuarias, 2006), who face high
livelihood risks due to limited access to credit and insurance (Eakin and
Tucker, 2006; Wehbe et al., 2008; Saldaña-Zorilla and Sandberg, 2009;
Walthall et al., 2012).
26.5.4. Adaptation
The North American agricultural industry has the adaptive capacity to
offset projected yield declines and capitalize on opportunities under
2°C warming. Butler and Huybers (2012) project a reduction in US corn
y
ield loss from 14 to 6% with 2°C warming, with spatial shifts in varietal
selection (not accounting for variability in temperature and precipitation).
Incremental strategies, such as planting varieties better suited to future
climate conditions and changing planting dates, have been observed
across the continent (Bootsma et al., 2005; Conde et al., 2006; Eakin
and Appendini, 2008; Coles and Scott, 2009; Nadler and Bullock, 2011;
Paudel and Hatch, 2012; Campos et al., 2013). In some sectors we are
seeing multi-organizational investments in adaptation. International
coffee retailers and non-governmental organizations, for example, are
engaged in enhancing coffee farmers’ adaptive capacity (Schroth et al.,
2009; Soto-Pinto and Anzueto, 2010). Other strategies specifically
recommended for Mexico include soil remediation, improved use of
climate information, rainwater capture, and drip irrigation (Sosa-
Rodriguez, 2013). New crop varieties better suited to future climates,
including genetically modified organisms (GMOs), are under development
in the USA (e.g., Chen et al., 2012), although potential risks have been
noted (Quist and Chapela, 2001). Current trends in agricultural practices
in commercial regions such as the midwestern USA, however, amplify
productivity risks posed by climate change (Hatfield et al., 2013).
Incremental strategies will have reduced effectiveness under a 2099/4°C
warming scenario, which would require more systemic adaptation,
including production and livelihood diversification (Howden et al., 2007;
Asseng et al., 2013; Mehta et al., 2013; Smith and Gregory, 2013).
Some adaptive strategies impose financial costs and risks onto producers
(Wolfe et al., 2008; Craine et al., 2010), which may be beyond the means
of smallholders (Mercer et al., 2012) or economically precluded for low-
value crops. Technological improvements improve yields under normal
conditions but do not protect harvests from extremes (Karl et al., 2009;
Wittrock et al., 2011). Others may have maladaptive effects (e.g., increased
groundwater and energy consumption). Crop-specific weather index
insurance, for example (widely implemented in Mexico to support small
farmers), may impose disincentives to invest in diversification and
irrigation (Fuchs and Wolff, 2010).
Many strategies have co-benefits, however. In fact, investments in
agricultural adaptation represent a cost-effective mitigation strategy
(Lobell et al., 2013). Low- and no-till practices reduce soil erosion and
runoff, protect crops from extreme precipitation (Zhang and Nearing,
2005), retain soil moisture, reduce biogenic and geogenic greenhouse
gas emissions (Nelson et al., 2009; Suddick et al., 2010), and build soil
organic carbon (Aguilera et al., 2013). Planting legumes and weed
management on pastures enhance both forage productivity and soil
carbon sequestration (Follett and Reed, 2010). Shade perennials increase
soil moisture retention (Lin, 2010) and contribute to local cooling
(Georgescu et al., 2011). Crop diversification mediates the impacts of
climate and market shocks (Eakin and Appendini, 2008) and enhances
management flexibility (Chhetri et al., 2010).
Barriers and Enablers
Market forces and technical feasibility alone are insufficient to foster
sectoral-level adaptation (Kulshreshtha, 2011). Institutional support is
key, but found to be inadequate in many contexts (high confidence;
Bryant et al., 2008; Klerkx and Leeuwis, 2009; Jacques et al., 2010;
Tarnoczi and Berkes, 2010; Brooks and Loevinsohn, 2011; Alam et al.,

1464
Chapter 26 North America
26
2
012; Anderson and McLachlan, 2012). Many suggested adaptation
strategies with anticipated economic benefits are often not adopted by
farmers, suggesting the need for more attention to culture and behavior
(Moran et al., 2013). Attitudinal studies among US farmers indicate
limited acknowledgment of anthropogenic climate change, associated
with lower levels of support for adaptation (medium evidence, high
agreement; Arbuckle, Jr. et al., 2013; Gramig et al., 2013).
Other key enablers are access to and quality of information (Tarnoczi
and Berkes, 2010; Tarnoczi, 2011; Baumgart-Getz et al., 2012; Tambo and
Abdoulaye, 2012), particularly regarding optimum crop management,
production inputs, and optimum crop-specific geographic information.
Social networks are important for information dissemination and farmer
support (Chiffoleau, 2009; Wittrock et al., 2011; Baumgart-Getz et al.,
2012). Networks among producers may be especially important to the
level of awareness and concern farmers hold about climate change
(Frank et al., 2010; Sánchez-Cortés and Chavero, 2011), while also
enabling extensive farmer-to-farmer exchange of adaptation strategies
(Eakin et al., 2009).
26.6. Human Health
Large national assessments of climate and health have been carried out
in the USA and Canada (Bélanger et al., 2008; see references in Section
26.1). These have highlighted the potential for changes in impacts of
extreme storm and heat events, air pollution, pollen, and infectious
diseases, drawing from a growing North American research base
analyzing observed and projected relationships among weather,
vulnerability, and health. The causal pathways leading from climate to
health are complex, and can be modified by factors including economic
status, preexisting illness, age, other health risk factors, access to health
care, built and natural environments, adaptation actions, and others.
Human health is an important dimension of adaptation planning at the
local level, much of which has so far focused on warning and response
systems to extreme heat events (New York State Climate Action Council,
2012).
26.6.1. Observed Impacts, Vulnerabilities, and Trends
26.6.1.1. Storm-Related Impacts
The magnitude of health impacts of extreme storms depends on
interactions between exposure and characteristics of the affected
communities (Keim, 2008). Coastal and low-lying infrastructure and
populations can be vulnerable owing to flood-related interruptions in
communications, health care access, and mobility. Health impacts can
arise through direct pathways of traumatic death and injury (e.g.,
drowning, impacts of blowing and falling objects, contact with power
wires) as well as more indirect, longer term pathways related to damage
to health and transportation infrastructure, contamination of water and
soil, vector-borne diseases, respiratory diseases, and mental health
(CCSP, 2008a). Infectious disease impacts from flooding include creation
of breeding sites for vectors (Ivers and Ryan, 2006) and bacterial
transmission through contaminated water and food sources causing
gastrointestinal disease. Chemical toxins can be mobilized from industrial
o
r contaminated sites (Euripidou and Murray, 2004). Elevated indoor
mold levels associated with flooding of buildings and standing water
are identified as risk factors for cough, wheeze, and childhood asthma
(Bornehag et al., 2001; Jaakkola et al., 2005). Mental health impacts
can arise as a result of the stress of evacuation, property damage,
economic loss, and household disruption (Weisler et al., 2006; CCSP,
2008a; Berry et al., 2010, 2011). Since 1970, there has been no clear
trend in US hurricane deaths, once the singular Katrina event is set aside
(Blake et al., 2007).
26.6.1.2. Temperature Extremes
Studies throughout North America have shown that high temperatures
can increase mortality and/or morbidity (e.g., Medina-Ramon and
Schwartz, 2007; Kovats and Hajat, 2008; Anderson and Bell, 2009;
Deschênes et al., 2009; Knowlton et al., 2009; O’Neill and Ebi, 2009;
Hajat and Kosatsky, 2010; Kenny et al., 2010; Cueva-Luna et al., 2011;
Hurtado-Díaz et al., 2011; Romero-Lankao et al., 2012b). Extremely
cold temperatures have also been associated with increased mortality
(Medina-Ramon and Schwartz, 2007), an effect separate from the
seasonal phenomenon of excess winter mortality, which does not
appear to be directly related to cold temperatures (Kinney, 2012). To date,
trends over time in cold-related deaths have not been investigated.
Most available North American evidence derives from the USA and
Canada, though one study reported significant heat- and cold-related
mortality impacts in Mexico City (McMichael et al., 2008). US EPA has
tracked the death rate in the USA from 1979 to 2009 for which death
certificates list the underlying cause of death as heat related (EPA,
2012). No clear trend upwards or downwards is yet apparent in this
indicator. Note that this case definition is thought to significantly
underestimate the total impacts of heat on mortality.
26.6.1.3. Air Quality
Ozone and particulate matter (e.g., particulate matter with aerodynamic
diameter <2.5 µm (PM
2.5
) and PM
10
) have been associated with
adverse health effects in many locations in North America (Romero-Lankao
et al., 2013b). Emissions, transport, dilution, chemical transformation,
and eventual deposition of air pollutants all can be influenced by
meteorological variables such as temperature, humidity, wind speed
and direction, and mixing height (Kinney, 2008). Although air pollution
emission trends will play a dominant role in future pollution levels,
climate change may make it harder to achieve some air quality goals
(Jacob and Winner, 2009). Forest fire is a source of particle emissions in
North America, and can lead to increased cardiac and respiratory
disease incidence, as well as direct mortality (Rittmaster et al., 2006;
Ebi et al., 2008). The indoor environment also can affect health in many
ways, for example, via penetration of outdoor pollution, emissions or
pollutants indoors, moisture-related problems, and transmission of
respiratory infections. Indoor moisture leads to mold growth, a problem
that is exacerbated in colder regions such as northern North America
in the winter (Potera, 2011). Climate variability and change will affect
indoor air quality, but with direction and magnitude that remains largely
unknown (Institute of Medicine, 2011).

1465
North America Chapter 26
26
26.6.1.4. Pollen
Exposure to pollen has been associated with a range of allergic
outcomes, including exacerbations of allergic rhinitis (Cakmak et al.,
2002; Villeneuve et al., 2006) and asthma (Delfino, 2002). Temperature
and precipitation in the months prior to the pollen season affect
production of many types of tree and grass pollen (Reiss and Kostic,
1976; Minero et al., 1998; Lo and Levetin, 2007; EPA, 2008). Ragweed
pollen production is responsive to temperatures and to CO
2
concentrations
(Ziska and Caulfield, 2000; Wayne et al., 2002; Ziska et al., 2003; Singer
et al., 2005). Because pollen production and release can be affected by
temperature, precipitation, and CO
2
concentrations, pollen exposure and
allergic disease morbidity could change in response to climate change.
However, to date, the timing of the pollen season is the only evidence
for observed climate-related impacts. Many studies have indicated that
pollen seasons are beginning earlier (Emberlin et al., 2002; Rasmussen,
2002; Clot, 2003; Teranishi et al., 2006; Frei and Gassner, 2008; Levetin
and de Water, 2008; Ariano et al., 2010). Ragweed season length has
increased at some monitoring stations in the USA (Ziska et al., 2011).
Research on trends in North America has been hampered by the lack of
long-term, consistently collected pollen records (EPA, 2008).
26.6.1.5. Water-borne Diseases
Water-borne infections are an important source of morbidity and mortality
in North America. Commonly reported infectious agents in US and
Canadian outbreaks include Legionella bacterium, the cryptosporidium
parasite Campylobacter, and Giardia (Bélanger et al., 2008; Centers for
Disease Control and Prevention, 2011). Cholera remains an important
agent in Mexico (Greer et al., 2008). Risk of water-borne illness is greater
among the poor, infants, elderly, pregnant women, and immune-
compromised individuals (Rose et al., 2001; CCSP, 2008a). In Mexico City,
declining water quality has led to ineffective disinfection of drinking
water supplies (Mazari-Hiriart et al., 2005; Sosa-Rodriguez, 2010).
Changes in temperature and hydrological cycles can influence the risk
of water-borne diseases (Curriero et al., 2001; Greer et al., 2008; Harper
et al., 2011). Severe storms have been shown to play a role in water-
borne disease risks in Canada (Thomas et al., 2006). Floods enhance the
potential for runoff to carry sediment and pollutants to water supplies
(CCSP, 2008b). Disparities in access to treated water were identified as a
key determinant of under age-5 morbidity due to water-borne illnesses in
the central State of Mexico (Jiménez-Moleón and Gómez-Albores, 2011).
26.6.1.6. Vector-borne Diseases
The extent to which climate change has altered, and will alter, the
geographic distribution of vectors of infectious disease remains uncertain
because of the inherent complexity of the ecological system. Spatial
and temporal distribution of disease vectors depend not only on climate
factors, but also on land use/change, socioeconomic and sociocultural
factors, prioritization of vector control, access to health care, and human
behavioral responses to perception of disease risk, among other factors
(Lafferty, 2009; Wilson, 2009). Although temperature drives important
biological processes in these organisms, climate variability on a daily,
s
easonal, or interannual scale may result in organism adaptation and
shifts, though not necessarily expansion, in geographic range (Lafferty,
2009; Tabachnick, 2010; McGregor, 2011). Range shifts may alter the
incidence of disease depending on host receptiveness and immunity,
as well as the ability of the pathogen to evolve so that strains are more
effectively and efficiently acquired (Reiter, 2008; Beebe et al., 2009;
Rosenthal, 2009; Russell, 2009; Epstein, 2010).
North Americans are currently at risk from a number of vector-borne
diseases, including Lyme disease (Ogden et al., 2008; Diuk-Wasser et
al., 2010), dengue fever (Jury, 2008; Ramos et al., 2008; Johansson et
al., 2009; Degallier et al., 2010; Kolivras, 2010; Lambrechts et al., 2011;
Riojas-Rodriguez et al., 2011; Lozano-Fuentes et al., 2012), West Nile
virus (Gong et al., 2011; Morin and Comrie, 2010), and Rocky Mountain
spotted fever, to name a few. Risk is increasing from invasive vector-
borne pathogens, such as chikungunya (Ruiz-Moreno et al., 2012) and
Rift Valley fever viruses (Greer et al., 2008). Mexico is listed as high risk
for dengue fever by the World Health Organization (WHO). There has
been an increasing number of cases of Lyme disease in Canada, and
Lyme disease vectors are spreading along climate-determined trajectories
(Koffi et al., 2012; Leighton et al., 2012).
26.6.2. Projected Climate Change Impacts
Projecting future consequences of climate warming for heat-related
mortality and morbidity is challenging, due in large part to uncertainties
in the nature and pace of adaptations that populations and societal
infrastructure will undergo in response to long-term climate change
(Kinney et al., 2008). Additional uncertainties arise from changes over
time in population demographics, economic well-being, and underlying
disease risk, as well as in the model-based predictions of future climate
and our understanding of the exposure-response relationship for heat-
related mortality. However, climate warming will lead to continuing
health stresses related to extreme high temperatures, particularly for
the northern parts of North America. The health implications of warming
winters remain uncertain (Kinney, 2012).
Several recent studies have projected future health impacts due to air
pollution in a changing climate (Knowlton et al., 2004; Bell et al., 2007;
Tagaris et al., 2009, 2010; Chang et al., 2010). There is a large literature
examining future climate influences on outdoor air quality in North
America, particularly for ozone (Murazaki and Hess, 2006; Steiner et al.,
2006; Kunkel et al., 2007;Tao et al., 2007; Holloway et al., 2008; Lin et
al., 2008, 2010; Nolte et al., 2008; Wu et al., 2008; Avise et al., 2009;
Chen et al., 2009; Liao et al., 2009; Racherla and Adams, 2009; Tai et
al., 2010). This work suggests with medium confidence that ozone
concentrations could increase under future climate change scenarios if
emissions of precursors were held constant (Jacob and Winner, 2009).
However, analyses show that future increases can be offset through
measures taken to limit emission of pollutants (Kelly et al., 2012). The
literature for PM
2.5
is more limited than that for ozone, and shows a
more complex pattern of climate sensitivities, with no clear net influence
of warming temperatures (Liao et al., 2007; Tagaris et al., 2008; Avise
et al., 2009; Pye et al., 2009; Mahmud et al., 2010). On the other hand,
PM
2.5
plays a crucial role in potential health co-benefits of some climate
mitigation measures. Regarding outdoor pollen, warming will lead to

1466
Chapter 26 North America
26
f
urther changes in the seasonal timing of pollen release (high
confidence). Another driver of future pollen could be changing spatial
patterns of vegetation as a result of climate change. Regarding clean
water supplies, extreme precipitation can overwhelm combined sewer
systems and lead to overflow events that threaten human health (Patz
et al., 2008). Conditional on a future increase in such events, we can
anticipate increasing risks related to water-borne diseases.
Whether future warmer winters in the USA and Canada will promote
transmission of diseases like dengue and malaria is uncertain, in part
because of access to amenities such as screening and air-conditioning
that provide barriers to human-vector contact. Socioeconomic factors also
play important roles in determining risks. Better longitudinal data sets
and empirical models are needed to address research gaps on climate-
sensitive infectious diseases, as well as to provide a better mechanism
for weighting the roles of external drivers such as climate change on a
macro/micro scale, human-environmental changes on a regional to local
scale, and extrinsic factors in the transmission of vector-borne infectious
diseases (Wilson, 2009; McGregor, 2011).
26.6.3. Adaptation Responses
Early warning and response systems can be developed to build resilience
to events like heat waves, storms, and floods (Ebi, 2011) and protect
susceptible populations, which include infants, children, the elderly,
individuals with pre-existing diseases, and those living in socially and/
or economically disadvantaged conditions (Pinkerton et al., 2012).
Adaptation planning at all scales to build resilience for health systems in
the face of a changing climate is a growing priority (Kinney et al., 2011).
Adaptation to heat events can occur via physiologic mechanisms, indoor
climate control, urban-scale cooling initiatives, and with implementation
of warning and response systems (Romero-Lankao et al., 2012b).
Additional research is needed on the extent to which warning systems
prevent deaths (Harlan and Ruddell, 2011). Efforts to reduce GHG
emissions could provide health co-benefits, including reductions in heat-
related and respiratory illnesses (Luber et al., 2014).
26.7. Key Economic Sectors and Services
There is mounting evidence that many economic sectors across North
America have experienced climate impacts and are adapting to the risk
of loss and damage from weather perils. This section covers the literature
for the energy, transportation, mining, manufacturing, construction and
housing, and insurance sectors in North America. Recent studies find a
range of adaptive practices and adaptation responses to experience
with extreme events, and only an emerging consideration of proactive
adaptation in anticipation of future global warming.
26.7.1. Energy
26.7.1.1. Observed Impacts
Energy demand for cooling has increased as building stock and air
conditioning penetration have increased (Wilbanks et al., 2012). Extreme
w
eather currently poses risk to the energy system (Wilbanks et al.,
2012). For example, Hurricane Sandy resulted in a loss of power to 8.5
million customers in the northeastern USA (NOAA, 2013). Energy
consumption is a major user of water resources in North America, with
49% of the water withdrawals in the USA for thermoelectric power
(Kenny et al., 2009).
26.7.1.2. Projected Impacts
Demand for summer cooling is projected to increase and demand for
winter heating is projected to decrease. Total energy demand in North
America is projected to increase in coming decades because of non-
climate factors (Galindo, 2009; National Energy Board, 2011; EIA, 2013).
Climate change is projected to have varying geographic impacts. In
Canada, a net decrease in residential annual energy demand is
projected by 2050 and by 2100 (Isaac and Van Vuuren, 2009; Schaeffer
et al., 2012). It is difficult to project changes in net energy demand in
the USA because of uncertainties in such factors as climate change, and
change in technology, population, and energy prices. Peak demand for
electricity is projected to increase more than the average demand for
electricity, with capacity expansion needed in many areas (Wilbanks
et al., 2012). Given the projected increases in energy demand in the
southern USA from climate change (Auffhammer and Aroonruengsawat,
2011, 2012), it is reasonable to conclude that Mexico will have a net
increase in demand.
Major water resource-related concerns include effects of increased
cooling and other demands for water and water scarcity in the west;
effects of extreme weather events, SLR, hurricanes, and seasonal
droughts in the southeast; and effects of increased cooling demands in
the northern regions (CCSP, 2007; MacDonald et al., 2012; Wilbanks et
al., 2012; DOE-PI, 2013).
The magnitude of projected impacts on hydropower potential will vary
significantly between regions and within drainage basins (Desrochers
et al., 2009; Kienzle et al., 2012; Shrestha et al., 2012). Annual mean
hydropower production in the Peribonka River in Quebec is estimated
to increase by approximately 10% by mid-century and 20% late in the
century under the A2 scenario (Minville et al., 2009).
Higher temperatures and increased climate variability can have adverse
impacts on renewable energy production such as wind and solar (DOE-
PI, 2013). Changing cloud cover affects solar energy resources, changes
in winds affect wind power potentials, and temperature change and
water availability can affect biomass production (CCSP, 2007; DOE-PI,
2013).
26.7.1.3. Adaptation
Many adaptations are underway to reduce vulnerability of the energy
sector to extreme climate events such as heat, drought, and flooding
(DOE-PI, 2013). Adaptation includes many approaches such as increased
supply and demand efficiency (e.g., through more use of insulation), more
use of urban vegetation and reflective surfaces, improved electric grid,
reduced reliance on above-ground distribution systems, and distributed

1467
North America Chapter 26
26
p
ower (Wilbanks et al., 2012). Important barriers to adaptation include
uncertainty about future climate change, inadequate information on costs
of adaptation, lack of climate resilient energy technologies, and limited
price signals (DOE-PI, 2013). Strategies resulting in energy demand
reduction would reduce GHG emissions and reduce the vulnerability of
the sector to climate change.
26.7.2. Transportation
26.7.2.1. Observed Impacts
Much of the transportation infrastructure across North America is aging,
or inadequate (Mexico), which may make it more vulnerable to damage
from extreme events and climate change. Approximately 11% of all US
bridges are structurally deficient, 20% of airport runways are in fair or
poor condition, and more than half of all locks are more than 50 years
old (U.S. Department of Transportation, 2013). More than US$2 trillion
is needed to bring infrastructure in the USA up to “good condition”
(ASCE, 2009, p. 6). Canadian infrastructure had an investment deficit
of CA$125 billion in the 1980s and 1990s (Mirza and Haider, 2003).
Some transportation systems have been harmed (Figure 26-2). For
example, in 2008, Hurricane Ike caused US$2.4 billion in damages to ports
and waterways in Texas (MacDonald et al., 2012). The “superflood” in
Tennessee and Kentucky in 2010 caused US$2.3 billion in damage
(NOAA, 2013).
Hurricane Sandy flooded portions of New York City’s subway system,
overtopped runways at La Guardia airport, and caused US$400 million
in damage to the New Jersey transit system (NOAA, 2013).
26.7.2.2. Projected Impacts
Scholarship on projected climate impacts on transportation infrastructure
focuses mostly on USA and Canada. Increases in high temperatures,
intense precipitation, drought, sea level, and storm surge could affect
transportation across the USA. The greatest risks would be to coastal
transportation infrastructure, but there could be benefits to marine and
lake transportation in high latitudes from less ice cover (TRB, 2008). A
1-m SLR combined with a 7-m storm surge could inundate over half
of the highways, arterials, and rail lines in the US Gulf Coast (CCSP,
2008c). Declining water levels in the Great Lakes would increase
shipping costs by restricting vessel drafts and reducing vessel cargo
volume (Millerd, 2011). In southern Canada by the 2050s, cracking of
roads from freeze and thaw would decrease under the B2 and A2
scenarios, structures would freeze later and thaw earlier, while higher
extreme temperatures could increase rutting (Mills et al., 2009) and
related maintenance and rehabilitation costs (Canadian Council of
Professional Engineers, 2008).
A 1°C to 1.5°C increase in global mean temperature would increase
the costs of keeping paved and unpaved roads in the USA in service by,
respectively, US$2 to US$3 billion per year by 2050 (Chinowsky et al.,
2013). Tens of thousands to more than 100,000 bridges in the USA could
be vulnerable to increasing peak river flows in the mid- and late-21st
c
entury under the A1B and A2 scenarios. Strengthening vulnerable
bridges to be less vulnerable to climate change is estimated to cost
approximately US$100 to US$250 billion (Wright et al., 2012).
26.7.2.3. Adaptation
Adaptation steps are being taken in North America, particularly to
protect transportation infrastructure from SLR and storm surge in
coastal regions. Almost all of the major river and bay bridges destroyed
by Hurricane Katrina surge waters were rebuilt at higher elevations, and
the design of the connections between the bridge decks and piers were
strengthened (Grenzeback and Luckmann, 2006).
Adaptation actions include protecting coastal transportation from SLR
and more intense coastal storms or possibly relocating infrastructure.
Many midwestern states are examining channel protection and drainage
designs, while transportation agencies in Canada and the USA have been
preparing to manage the aftermath of extreme weather events (Meyer
et al., 2013). In addition, new materials may be needed so pavement
and rail lines can better withstand more extreme temperatures.
26.7.3. Mining
26.7.3.1. Observed Impacts
Climatic sensitivities of mining activities, including exploration, extraction,
processing, operations, transportation, and site remediation, have been
noted in the limited literature (Chiotti and Lavender, 2008; Furgal and
Prowse, 2008; Meza-Figueroa et al., 2009; Ford et al., 2010a; Gómez-
Álvarez et al., 2011; Kirchner et al., 2011; Locke et al., 2011; Pearce et
al., 2011; Stratos Inc. and Brodie Consulting Ltd., 2011). Drought-like
conditions have affected the mining sector by limiting water supply for
operations (Pearce et al., 2011), enhancing dust emissions from quarries
(Pearce et al., 2011), and increasing concentrations of heavy metals in
sediments (Gómez-Álvarez et al., 2011). Heavy precipitation events have
caused untreated mining wastewater to be flushed into river systems
(Pearce et al., 2011). High loads of contamination (from metals, sulfate,
and acid) at three mine sites in the USA were measured during rainstorm
events following dry periods (Nordstrom, 2009).
26.7.3.2. Projected Impacts
Climate change is perceived by Canadian mine practitioners as an
emerging risk and, in some cases, a potential opportunity (Ford et al.,
2010a, 2011; Pearce et al., 2011; NRTEE, 2012), with potential impacts
on transportation (Ford et al., 2011) and limited water availability
(Acclimatise, 2009) from projected drier conditions (Sun et al., 2008;
Seager and Vecchi, 2010) being identified as key issues.
An increase in heavy precipitation events projected for much of North
America (Warren and Egginton, 2008; Nordstrom, 2009) would adversely
affect the mining sector. A study on acid rock damage drainage in
Canada concluded that an increase in heavy precipitation events
presented a risk of both environmental impacts and economic costs

1468
Chapter 26 North America
26
(
Stratos Inc. and Brodie Consulting Ltd., 2011) Damage to mining
infrastructure from extreme events, for active and post-operation mines,
is also a concern (Pearce et al., 2011). Climate change impacts that
affect the bottom-line of mining companies (through direct impacts
or associated costs of adaptation), would have consequences for
employment, for both the mining sectors and local support industries
(Backus et al., 2013).
26.7.3.3. Adaptation
Despite increasing awareness, there are presently few documented
examples of proactive adaptation planning within the mining sector
(Acclimatise, 2009; Ford et al., 2010a, 2011). However, adjustments to
management practices to deal with short-term water shortages, including
reducing water intake, increasing recycling, and establishing infrastructure
to move water from tailing ponds, pits, and quarries, have worked
successfully in the past (Chiotti and Lavender, 2008). Integrating climate
change considerations at the mine planning and design phase increases
the opportunity for effective and cost-efficient adaptation (Stratos Inc.
and Brodie Consulting Ltd., 2011).
26.7.4. Manufacturing
26.7.4.1. Observed Impacts
There is little literature focused on climate change and manufacturing,
although one study suggested that manufacturing is among the most
sensitive sectors to weather in the USA (Lazo et al., 2011). Weather affects
the supply of raw material, production process, transportation of goods,
and demand for certain products. In 2011, automobile manufacturers
in North America experienced production losses associated with shortages
of components due to flooding in Thailand (Kim, 2011). In 2013, reduced
cattle supply and higher feed prices associated with drought in Texas
led to a decision to close a beef processing plant (Beef Today Editors,
2013). Drought also caused delays for barge shipping on the Mississippi
River in 2012 (Polansek, 2012). Major storms, like Hurricanes Sandy,
Katrina, and Andrew, significantly disrupted manufacturing activities,
including plant shutdowns due to direct damages and/or loss of
electricity and supply disruptions due to unavailability of parts, and
difficulties delivering products due to compromised transportation
networks (Baade et al., 2007; Dolfman et al., 2007).
26.7.4.2. Projected Impacts
The drier conditions (Sun et al., 2008; Seager and Vecchi, 2010; Wehner
et al., 2011) would present challenges, especially for manufacturers
located in regions already experiencing water stress. This could lead to
increased conflicts over water between sectors and regions, and affect
the ability of regions to attract new facilities or retain existing operations.
A study of the effect of changes in precipitation (A1B scenario) on 70
industries in the USA between 2010 and 2050 found potentially
significant losses in production and employment due to declines in
water availability and the interconnectedness of different industries
(Backus et al., 2013).
A
nother potential concern for manufacturing relates to impacts of heat
on worker safety and productivity. Several studies suggest that higher
temperatures and humidity would lead to decreased productivity and
increased occupational health risks (e.g., Kjellstrom et al., 2009; Hanna
et al., 2011; Kjellstrom and Crowe, 2011).
2
6.7.4.3. Adaptation
Some companies are beginning to recognize the risks climate change
presents to their manufacturing operations, and consider strategies to
build resilience (NRTEE, 2012). Coca Cola has a water stewardship strategy
focusing on improving water use efficiency at its manufacturing plants,
while Rio Tinto Alcan is assessing climate change risks for their operations
and infrastructure, which include vulnerability of transport systems,
increased maintenance costs, and disruptions due to extreme events
(NRTEE, 2012). Air conditioning is a viable and effective adaptation
option to address some of the impacts of warming, though it does
incur greater demands for electricity and additional costs (Scott et al.,
2008a). Sourcing raw materials from different regions and relocating
manufacturing plants are other adaptation strategies that can be used
to increase resiliency and reduce vulnerability.
26.7.5. Construction and Housing
26.7.5.1. Observed Impacts
The risk of damage from climate change is important for construction
industries, though little research has systematically explored the topic
(Morton et al., 2011). Private data from insurance companies report a
significant increase in severe weather damage to buildings and other
insured infrastructure over several decades (Munich Re, 2012).
26.7.5.2. Projected Impacts
Most studies project a significant further increase in damage to homes,
buildings, and infrastructure (Bjarndadottir et al., 2011; IPCC, 2012).
Affordable adaptation in design and construction practices could reduce
much of the risk of climate damage for new buildings and infrastructure,
involving reform in building codes and other standards (Kelly et al.,
2012). However, adaptation best practices in design and construction
are often prohibitively expensive to apply to existing buildings and
infrastructure, so much of the projected increase in climate damage risk
involves existing buildings and infrastructure.
26.7.5.3. Adaptation
Engineering and construction knowledge exists to design and construct
new buildings to accommodate the risk of damage from historic
extremes and anticipated changes in severe weather (IBHS, 2008; Kelly,
2010; Ministry of Municipal Affairs and Housing, 2011). Older buildings
may be retrofit to increase resilience, but these changes are often more
expensive to introduce into an existing structure than if they were
included during initial construction.

1469
North America Chapter 26
26
T
he housing and construction industries have made advances toward
climate change mitigation by incorporating energy efficiency in building
design (Heap, 2007). Less progress has been made in addressing the
risk of damage from extreme weather events (Kenter, 2010). In some
markets, such as the Gulf Coast of the USA, change is underway in the
design and construction of new homes in reaction to recent hurricanes
(Levina et al., 2007; Kunreuther and Michel-Kerjan, 2009; IBHS, 2011),
but in most markets across North America there has been little change
in building practices. The cost of adaptation measures combined with
limited long-term liability for future buildings has influenced some
builders to take a wait-and-see attitude (Morton et al., 2011). Exploratory
work is underway to consider implementation of building codes that
would focus on historic weather experience and also introduce expected
future weather risks (Auld et al., 2010; Ontario Ministry of Environment,
2011).
26.7.6. Insurance
26.7.6.1. Observed Impacts
Property insurance and reinsurance companies across North America
experienced a significant increase in severe weather damage claims
paid over the past 3 or 4 decades(Cutter and Emrich, 2005; Bresch and
Spiegel, 2011; Munich Re, 2011). Most of the increase in insurance
claims paid has been attributed to increasing exposure of people and
assets in areas of risk (Pielke, Jr. et al., 2008; Barthel and Neumayer,
2012). A role for climate change has not been excluded, but the increase
to date in damage claims is largely due to growth in wealth and
population (IPCC, 2012).
Severe weather and climate risks have emerged over the past decade as
the leading cost for property insurers across North America, resulting in
significant change in industry practices. The price of insurance increased
in regions where the risk of loss and damage has increased. Discounts
have been introduced where investments in adaptation have reduced the
risk of future weather losses (Mills, 2012). Further detailed discussion
on the insurance sector and climate change can be found in Section 10.7.
26.7.6.2. Projected Impacts
Without adaptation, there is an expectation that severe weather insurance
damage claims would increase significantly over the next several
decades across North America (World Bank, 2010). The risk of damage
is expected to rise due to continuing growth in wealth, the population
living at risk, and climate change. There is also an expectation that some
weather perils in North America will increase in severity, including
Atlantic hurricanes and the area burned by wildfire (Karl et al., 2008;
Balshi et al., 2009), and other perils in frequency, including intense
rainfall events (IPCC, 2012).
26.7.6.3. Adaptation
The insurance industry is one of the most studied sectors in North America
in terms of climate impacts and adaptation. Most adaptation in the
i
nsurance industry has been in response to an increase in severe
weather damage, with little evidence of proactive adaptation in
anticipation of future climate change (Mills and Lecomte, 2006; Mills,
2007, 2009; Kunreuther and Michel-Kerjan, 2009; AMF, 2011; Leurig,
2011; Gallagher, 2012). In addition to pricing decisions based on an
actuarial analysis of historic loss experience, many insurance companies
in the USA and Canada now use climate model information to help
determine the prices they charge and discounts they offer. Most insurance
companies have established specialized claims handling procedures for
responding to catastrophic events (Kovacs, 2005; Mills, 2009).
A recent study of more than 2000 major catastrophes since 1960 found
that insurance is a critical adaptive tool available to help society minimize
the adverse economic consequences of natural disasters (von Peter et
al., 2012). Government insurance programs for coverage of flood in the
USA have been affected by recent hurricanes and previously subsidized
premiums have been changed to more accurately reflect risk (FEMA,
2013). In the USA and Canada, homeowners make extensive use of
insurance to manage a broad range of risks, and those with insurance
recover quickly following most extreme weather events. However, the
majority of public infrastructure is not insured and it frequently takes
more than a decade before government services fully recover. In contrast,
Mexico has a well-developed program for financing the rebuilding of
public infrastructure following a disaster (Fondo de Desastres Naturales
(FONDEN)) but insurance markets are only beginning to emerge for
homeowners and businesses. In 2012, per capita spending on property
and casualty insurance was US$2239.20 in the USA, US$2040.40 in
Canada, and US$113.00 in Mexico (Swiss Re, 2013).
Insurance companies are also working to influence the behavior of their
policyholders to reduce the risk of damage from climate extremes (Kovacs,
2005; Anderson et al., 2006; Mills, 2009). For example, the industry
supports the work of the Insurance Institute for Business and Home
Safety in the USA, and the Institute for Catastrophic Loss Reduction in
Canada, in working to champion change in the building code and
communicate to property owners, governments, and other stakeholders
best practices for reducing the risk of damage from hurricanes, tornadoes,
winter storms, wildfire, flood, and other extremes.
26.8. Urban and Rural Settlements
Recently a growing body of literature and national assessments have
focused on climate-related impacts, vulnerabilities, and risks in North
American settlements (e.g., US-NCA Chapters 11, 14; Chapters 8, 9).
26.8.1. Observed Weather and Climate Impacts
Observed impacts on lives, livelihoods, economic activities, infrastructure,
and access to services in North American human settlements have been
attributed to SLR (Section 26.2.2.1), changes in temperature and
precipitation, and occurrences of extreme events such as heat waves,
droughts, and storms (Figure 26-2).
Only a handful of these impacts have been attributed to anthropogenic
climate change, such as shifts in Pacific Northwest marine ecosystems,

1470
Chapter 26 North America
26
w
hich have restricted fisheries and thus affected fishing communities
(Karl et al., 2009). As well, MacKendrick and Parkins (2005), Parkins and
MacKendrick (2007), Parkins (2008), and Holmes (2010) identified 30
communities and 25,000 families in British Columbia negatively affected
by the mountain pine beetle outbreak (see Section 26.4.1.1).
While droughts are among the more notable extreme events affecting
North American urban and rural settlements recently, with severe
occurrences in the Canadian Prairies causing economic and employment
losses (2001–2002; Wheaton et al., 2007), changes in drought frequency
in North America have not been attributed to anthropogenic climate
change (Figure 26-1). The 2010–2012 drought across much of the USA
and northern Mexico was considered the most severe in a century
(MacDonald, 2010). It affected 80% of agricultural land in the USA,
with 2000 counties designated disaster zones by September (USDA ERS,
2012). Impacts include the loss of 3.2 million tons of maize in Mexico,
placing 2.5 million at risk of food insecurity (DGCS, 2012). Among the
most severely affected were indigenous peoples, such as the Rarámuri
of Chihuahua (DGCS, 2012). Closely associated with droughts, the
impacts of recent wildfires have been significant (see Box 26-2), and
have intensified inequalities in vulnerability between amenity migrants
and low-income residents in peri-urban areas of California and Colorado
(Collins and Bolin, 2009).
Other extreme events include heat waves, resulting in excess urban
mortality (O’Neill and Ebi, 2009; Romero-Lankao et al., 2012b) and
affecting infrastructure and built environments. For example, road
pavement in Chicago buckled under temperatures higher than 100°F
(CBS Chicago, 2012); in Colorado two wildfires burned more than 600
homes (NOAA NCDC, 2013).
Extreme storms and extreme precipitation have also impacted several
North American regions (Figures 26-1, 26-2). Flood frequency has
increased in some cities, a trend sometimes associated with more intense
precipitation (e.g., Mexico City and Charlotte, North Carolina, USA;
Villarini et al., 2009; Magana, 2010), while in others this trend is
associated with a transition from flood events dominated by snowmelt
to those caused by warm-season thunderstorms (e.g., Québec, Canada,
and Milwaukee, Wisconsin, USA; Ouellet et al., 2012; Yang et al., 2013).
As illustrated by Hurricane Sandy (Neria and Shultz, 2012; Powell et al.,
2012), storms impact human health and health care access (Section
26.6.1.1), and impacts on infrastructure and the built environment have
been costly. Heavy precipitation, storm surges, flash floods, and wind—
including flooding on the US East Coast and Midwest (2011), hurricanes
and floods in the city of Villa Hermosa (Galindo et al., 2009) and other
urban areas in southern Mexico (2004–2005)—have compromised
homes and businesses (Comfort, 2006; Kirshen et al., 2008; Jonkman
et al., 2009; Romero-Lankao, 2010). Hurricane Wilma alone caused
US$1.8 billion in damage, among the biggest insurance losses in Latin
American history (Galindo et al., 2009).
The impacts of interacting hazards compound vulnerabilities (Section
26.8.2). Coastal settlements are at risk from the combined occurrence
of coastal erosion, health effects, infrastructure, and economic damage
from storm surges. Earlier thaw (Friesinger and Bernatchez, 2010), SLR,
and coastal flooding have been detected along the Mid-Atlantic, Gulf of
Mexico, and St. Lawrence (Kirshen et al., 2008; Friesinger and Bernatchez,
2
010; Zavala-Hidalgo et al., 2010; Rosenzweig et al., 2011; Tebaldi et
al., 2012).
Climate impacts on the ecosystem function and services (e.g., water
supplies, biodiversity, or flood protection) provided to human settlements
are another concern. While acknowledged in some places (e.g., Mexico
City Climate Action Plan), they have received relatively less scholarship
attention (Hunt and Watkiss, 2011).
26.8.2. Observed Factors and Processes
Associated with Vulnerability
Differences in the severity of climate impacts on human settlements are
strongly influenced by context-specific vulnerability factors and processes
(Table 26-1; Cutter et al., 2013), some of which are common to many
settlements, while others are more pertinent to some types of settlements
than others. Human settlements simultaneously face a multi-level array
of non-climate-related hazards (e.g., economic, industrial, technological)
that contribute to climate change vulnerability (McGranahan et al.,
2007; Satterthwaite et al., 2007; Romero-Lankao and Dodman, 2011).
In the following subsections we highlight key sources of vulnerability
for urban and rural systems.
26.8.2.1. Urban Settlements
Hazard risks in urban settlements are enhanced by the concentration of
populations, economic activities, cultural amenities, and built environments
particularly when they are in highly exposed locations such as coastal
and arid areas. Cities of concern include those in the Canadian prairies
and USA-Mexico border region; and major urban areas including Boston,
New York, Chicago, Washington DC, Los Angeles, Villa Hermosa, Mexico
City, and Hermosillo (Bin et al., 2007; Collins, 2008; Kirshen et al., 2008;
Collins and Bolin, 2009; Galindo et al., 2009; Gallivan et al., 2009;
Hayhoe et al., 2010; Romero-Lankao, 2010; Rosenzweig et al., 2010;
Wittrock et al., 2011).
Risks may also be heightened by multiple interacting hazards. Slow-
onset events such as urban heat islands, for instance, interact with poor
air quality in large North American cities to exacerbate climate impacts
on human health (Romero-Lankao et al., 2013a). As illustrated by recent
weather events (Figure 26-2), however, hazard interactions can also
follow individual, high-magnitude extreme events of short duration, with
cascading effects across interconnected energy, transportation, water,
and health infrastructures and services to contribute to and compound
urban vulnerability (Gasper et al., 2011). Wildfire vulnerability in the
southwest has been compounded by peri-urban growth (Collins and
Bolin, 2009; Brenkert-Smith, 2010). Under current financial constraints
in many cities, climate-related economic losses can reduce resources
available to address social issues, thus threatening institutional capacity
and urban livelihoods (Kundzewicz et al., 2008).
The urbanization process and urban built-environments of North America
can amplify climate impacts as they change land use and land surface
physical characteristics (e.g., surface albedo; Chen, F. et al., 2011). A
34% increase in US urban land development (Alig et al., 2004) between

1471
North America Chapter 26
26
1
982 and 1997 had implications for water supplies and extreme
event impacts. Effects on water are of special concern (Section 26.3), as
urbanization can enhance or reduce precipitation, depending on climate
regime; geographical location; and regional patterns of land, energy,
and water use (Cuo et al., 2009). Urbanization also has significant impacts
on flood climatology through atmospheric processes tied to the urban heat
island (UHI), the urban canopy layer (UCL), and the aerosol composition
of airsheds (Ntelekos et al., 2010). The UHI can also increase health risks
differentially, due to socio-spatial inequalities across and within North
American cities (Harlan et al., 2008; Miao et al., 2011).
Urbanization imposes path dependencies that can amplify or attenuate
vulnerability (Romero-Lankao and Qin, 2011). The overexploitation of
Mexico City’s aquifer by 19.1 to 22.2 m
3
s
–1
, for example, has reduced
groundwater levels and caused subsidence, undermining building
foundations and infrastructure and increasing residents’ vulnerability
to earthquakes and heavy rains (Romero-Lankao, 2010).
Elements of the built-environment such as housing stock, urban form,
the condition of water and power infrastructures, and changes in urban
and ecological services also affect vulnerability. Large, impermeable
surfaces and buildings disrupt drainage channels and accelerate runoff
(Walsh et al., 2005). Damage from floods can be much more catastrophic
if drainage or waste collection systems are inadequate to accommodate
peak flows (Richardson, 2010; Sosa-Rodriguez, 2010). While many
Canadian and US cities are in need of infrastructure adaptation upgrades
(Doyle et al., 2008; Conrad, 2010), Mexican cites are faced with existing
infrastructure deficits (Niven et al., 2010; Hardoy and Romero-Lankao,
2011), and high levels of socio-spatial segregation (Smolka and Larangeira,
2008; see also Section 26.7).
Recent weather hazards (Figure 26-2) illustrate that economic activities
and highly valued physical capital of cities (real estate, interconnected
infrastructure systems) are very sensitive to climate-related disruptions
that can result in high impacts; activities in some urban areas are
particularly exposed to key resource constraints (e.g., water in the USA-
Mexico border; oil industry in Canada, USA, and Mexico; Conrad, 2010;
Levy et al., 2010); others are dependent upon climate-sensitive sectors
(e.g., tourism; Lal et al., 2011). Disruptions to production, services, and
livelihoods, and changes in the costs of raw materials, also impact the
economic performance of cities (Hunt and Watkiss, 2011).
Cities are relatively better endowed than rural populations with individual
and neighborhood assets such as income, education, quality of housing,
and access to infrastructure and services that offer protection from climate
hazards. However, intra-urban socio-spatial differences in access to
these assets shape response capacities (Harlan and Ruddell, 2011;
Romero-Lankao et al., 2013a). All this means that class and socio-spatial
segregation are key determinants not only of vulnerability but also of
inequalities in risk generation and distribution within cities. Economic
elites are better positioned to access the best land and enjoy the rewards
of environmental amenities such as clean air, safe drinking water, open
space, and tree shade (Morello-Frosch et al., 2002; Harlan et al., 2006,
2008; Ruddell et al., 2011). Although wealthy sectors are moving into
risk prone coastal and forested areas (Collins, 2008), and certain hazards
(air pollution) affect both rich and poor alike (Romero-Lankao et al.,
2013a), climate risks tend to be disproportionally borne by the poor or
o
therwise marginalized populations (Cutter et al., 2008; Collins and
Bolin, 2009; Romero-Lankao, 2010; Wittrock et al., 2011). In some cities,
marginalized populations are moving to peri-urban areas with inadequate
services, a portfolio of precarious livelihood mechanisms, and inappropriate
risk-management institutions (Collins and Bolin, 2009; Eakin et al., 2010;
Monkkonen, 2011; Romero-Lankao et al., 2012a).
Although cities have comparatively higher access than rural municipalities
to determinants of institutional capacity such as human resources and
revenue pools, their governance arrangements are often hampered by
jurisdictional conflicts, asymmetries in information and communication
access, fiscal constraints on public services including emergency personnel,
and top-down decision making. These governance issues exacerbate
urban vulnerabilities and constrain urban adaptation planning (Carmin
et al., 2012; Romero-Lankao et al., 2013a).
26.8.2.2. Rural Settlements
The legacy of previous and current stressors in North American rural
communities, including rapid population growth or loss, reduced
employment, and degradation of local knowledge systems, can increase
vulnerability (Brklacich et al., 2008; Coles and Scott, 2009; McLeman,
2010). North American rural communities have a higher proportion of
lower income and unemployed populations and higher poverty than
cities (Whitener and Parker, 2007; Lal et al., 2011; Skoufias et al., 2011).
55% of Mexico’s rural residents live in poverty, and the livelihood of
72% of these is in farming (Saldaña-Zorrilla, 2008). US and Canadian
rural communities have older populations (McLeman, 2010) and lower
education levels (Lal et al., 2011). Indigenous communities have lower
education levels and high levels of poverty, but are younger than average
populations (Downing and Cuerrier, 2011). The legacy of their colonial
history, furthermore, has stripped Indigenous communities of land and
many sources of social and human capital (Brklacich et al., 2008; Hardess
et al., 2011). Conversely, rural and Indigenous community members
possess valuable local and experiential knowledge regarding regional
ecosystem services (Galloway McLean et al., 2011).
Rural economies have limited economic diversity and relatively high
dependence on climate-sensitive sectors (Johnston et al., 2008; Lemmen
et al., 2008; Molnar, 2010); they are sensitive to climate-induced reductions
in resource supply and productivity, in addition to direct exposure to
climate hazards (Daw et al., 2009). Single-sector economic dependence
contributes significantly to vulnerability (Cutter et al., 2003). Engagement
in export markets presents opportunity but also exposure to economic
volatility (Eakin, 2006; Saldaña-Zorilla and Sandberg, 2009), and economic
downturns take attention away from climate change adaptation. Farming
and fishing provide both economic and food security, the impacts of
climate thus posing a double threat to livelihood (Badjek et al., 2010),
particularly among women (Bee et al., 2013). Inter-related factors affecting
vulnerability in forestry and fishing communities include over-harvesting
and the cumulative environmental effects of multiple land use activities
(Brklacich et al., 2008).
Many tourism-based communities are dominated by seasonal economies
and low-wage, service-based employment (Tufts, 2010), and small
businesses that lack resources for emergency planning (Hystad and

1472
Chapter 26 North America
26
K
eller, 2006, 2008). Non-renewable resource industries are sensitive to
power, water, and transportation disruptions associated with hazards.
Geographic isolation can be a key source of vulnerability for rural
communities in North America, imposing long commutes to essential
services like hospitals and non-redundant transportation corridors that
can be compromised during extreme events (Chouinard et al., 2008).
Many Indigenous communities are isolated, raising the costs and limiting
the diversity of imported food, fuel, and other supplies, rendering the
ability to engage in subsistence harvesting especially critical for both
cultural and livelihood well-being (Andrachuk and Pearce, 2010; Hardess
et al., 2011). Many Indigenous peoples also maintain strong cultural
attachment to ancestral lands, and thus are especially sensitive to
declines in the ability of that land to sustain their livelihoods and
cultural well-being (Downing and Cuerrier, 2011).
Rural physical infrastructure is often inadequate to meet service needs
or is in poor condition (McLeman and Gilbert, 2008; Krishnamurthy et
al., 2011), especially for Indigenous communities (Brklacich et al., 2008;
Hardess et al., 2011; Lal et al., 2011; see also Section 26.9). A lack of
redundant power and communication services can compromise hazard
response capacity.
26.8.3. Projected Climate Risks
on Urban and Rural Settlements
Urbanization, migration, economic disparity, and institutional capacity
will influence future impacts and adaptation to climate change in North
American human settlements (Section 26.2.1). Water-related concerns
are assessed in Sections 26.3.2.1, 26.3.2.3). We describe below a variety
of future climate risks identified in the literature, many of which focus
on cities (Chapters 8, 9) and, with the exception of larger centers such as
New York and Boston, are qualitative in nature (Hunt and Watkiss, 2011).
This is due in part to the difficulty in downscaling the shifts in key trends
in climate parameters to an appropriate scale.
Model-based SLR projections of future risks to cities are characterized
by large uncertainties due to global factors (e.g., the dynamics of polar
ice sheets) and regional factors (e.g., regional shifts in ocean circulation,
high of the adjacent ocean and local land elevation; Blake et al., 2011; see
WGI AR5 Chapter 3). The latter will determine differential SLR impacts
on regional land development of coastal settlements (GAO, 2007; Yin
et al., 2009; Conrad, 2010; Millerd, 2011; Biasutti et al., 2012), making
some areas particularly vulnerable to inundation (Cooper and Sehlke,
2012). SLR can also exacerbate vulnerability to extreme events such as
hurricanes (Frazier et al., 2010).
Temperature increases would lead to additional health hazards. Baseline
warmer temperatures in cities are expected to be further elevated by
extreme heat events whose intensity and frequency is projected to
increase during the 21st century (Section 26.2.2), particularly in northern
mid-latitude cities (Jacob and Winner, 2009).
Participation in some outdoor activities would increase as a result of
projected increases in warm days (Scott and McBoyle, 2007). Projected
snowfall declines in Canada and the northeastern USA would reduce
l
ength of winter sport seasons and thus affect the economic well-being
of some communities (McBoyle et al., 2007; Scott et al., 2008b).
Any increase in frequency of extreme events, such as intense precipitation,
flooding, and prolonged dry periods, would affect particularly the
populations, economic activities, infrastructures, and services on coasts,
flood-prone deltas, and arid regions (Kirshen et al., 2008; Nicholls et al.,
2008; Richardson, 2010; Weiss et al., 2011). For example, by the end of
this century, New York City is projected to experience nearly twice as many
extreme precipitation days compared to today (A2, mean ensemble of
17 models). Ntelekos et al. (2010) and Cayan et al. (2010) project an
increase in the number and duration of droughts in the southwestern
USA, with most droughts expected to last more than 5 years by 2050
(GDFL CM2.1 and National Centre for Meteorological Research (CNRM)
CM3, A2 and B1). Assuming no adaptation, total losses from river flooding
in metropolitan Boston are estimated to exceed US$57 billion by 2100,
of which US$26 billion is attributed to climate change (Kirshen et al.,
2008; Nicholls et al., 2008; Richardson, 2010; Weiss et al., 2011).
Future climate risks on lives and livelihoods have been relatively less
studied. A handful of studies focused on forestry are notable, indicating
potentially substantial shifts in livelihood options without adaptation.
Sohngen and Sedjo (2005) estimate losses from climate change in the
Canadian/US timber sector of US$1.4 to US$2.1 billion per year over the
next century. Anticipated future supply reductions in British Columbia
as a consequence of the pine beetle outbreak vary from 10 to 62%
(Patriquin et al., 2007). Substantial declines in suitable habitat for valued
tree species in Mexico have been projected (Gómez-Mendoza and
Arriaga, 2007; Gómez Diaz et al., 2011).
Scholars are starting to project future risks from interacting hazards.
For instance, by 2070 with a 0.5 m rise in sea level and under scenarios
of socioeconomic growth, storm surges, and subsidence, populations at
risk in New York, Miami, and New Orleans might increase three-fold, while
asset exposure will increase more than 10-fold (Hanson et al., 2011).
Essential infrastructure and services are key concerns (Sections 26.3,
26.7). Increased occurrence of drought affecting water availability is
projected for southwestern USA/northern Mexico, the southern Canadian
Prairies and central Mexico, combined with projected increases in water
demand due to rapid population growth and agriculture (Schindler and
Donahue, 2006; MacDonald, 2010; Lal et al., 2011). Using A1B and A2
scenarios, Escolero-Fuentes et al. (2009) projected that, by 2050, Mexico
City and its watersheds will experience a more intense hydrological
cycle and a reduction of between 10 to 17% in per capita available
water. SLR is predicted to threaten water and electricity infrastructure
with inundation and increasing salinity (Sharp, 2010).
26.8.4. Adaptation
26.8.4.1. Evidence of Adaptation
26.8.4.1.1. What are populations doing? Autonomous adaptation
As illustrated by recent extreme events (Figure 26-2), individuals and
households in North America not only have been affected by extremes,

1473
North America Chapter 26
26
b
ut have also been responding to climate impacts mostly through
incremental actions, for example, by purchasing additional insurance or
reinforcing homes to withstand extreme weather (Simmons and Sutter,
2007; Romero-Lankao et al., 2012a). Some individuals respond by
diversifying livelihoods (Newland et al., 2008; Rose and Shaw, 2008) or
migrating (see Section 26.1.1; Black et al., 2011).
The propensity to respond to climate and weather hazards is strongly
influenced not only by access to household assets, but also by community
and governmental support. The emergency response to Hurricane Sandy
illustrates this. Although New York and New Jersey witnessed vivid scenes
of “medical humanitarianism,” because of inadequate communication
and coordination among agencies, public health support did not always
reach those most in need (Abramson and Redlener, 2013).
The perceived risks of climate change among individuals are equally
important. Strong attachment to place and occupation may motivate
willingness to support incremental adaptation, enhance coping capacity,
and foster adaptive learning (Collins and Bolin, 2009; Romero-Lankao,
2010; Aguilar and Santos, 2011; Wittrock et al., 2011). They have also
been found to serve as barriers to transformational adaptation (Marshall
et al., 2012). Residents of the USA stand out in international research
as holding lower levels of perceived risk of climate change (AXA Group
and Ipsos Research, 2012), which may limit involvement in household-
level adaptation or support for public investments in adaptation.
26.8.4.1.2. What are governments doing? Planned adaptation
Leadership in adaptation is far more evident locally than at other tiers of
government in North America (Richardson, 2010; Vasseur, 2011; Vrolijks
et al., 2011; Carmin et al., 2012; Henstra, 2012). Few municipalities have
moved into the implementation stage, however; most programs are in
the process of problem diagnosis and planning (Perkins et al., 2007;
Moser and Satterthwaite, 2008; Romero-Lankao and Dodman, 2011).
Systematic assessments of vulnerability are rare, particularly in relation
to population groups (Vrolijks et al., 2011). Surveys of municipal leaders
showed adaptation is rarely incorporated into planning, due to lack of
resources, information, and expertise (Horton and Richardson, 2011),
and the prevalence of other issues considered higher priority, suggesting
the need for subnational and federal-level facilitation in the form of
resources and enabling regulations.
Climate change policies have been motivated by concerns for local
economic or energy security and the desire to play leadership roles
(Rosenzweig et al., 2010; Anguelovski and Carmin, 2011; Romero-
Lankao et al., 2013a). Some policies constitute “integrated” strategies
(New York; Perkins et al., 2007; Rosenzweig et al., 2010), and coordinated
participation of multiple municipalities (Vancouver; Richardson, 2010).
Sector-specific climate risk management plans have also emerged
(e.g., water conservation in Phoenix, USA and Regina, Canada; wildfire
protection in Kamloops, Canada and Boulder, USA). Municipalities
affected by the mountain pine beetle have taken many steps toward
adaptation (Parkins, 2008), and coastal communities in eastern Canada
are investing in saltwater marsh restoration to adapt to rising sea levels
(Marlin et al., 2007). Green roofs, forest thinning, and urban agriculture
have all been expanding (Chicago, New York, Kamloops, Mexico City), as
h
ave flood protection (New Orleans, Chicago), private and governmental
insurance policies (Browne and Hoyt, 2000; Ntelekos et al., 2010; see
also Section 26.10), saving schemes (common in Mexico), air pollution
controls (Mexico City), and hazard warning systems (Collins and Bolin,
2009; Coffee et al., 2010; Romero-Lankao, 2010; Aguilar and Santos,
2011).
26.8.4.2. Opportunities and Constraints
Adaptation in human settlements is influenced by local access to resources,
political will, and the capacity for institutional-level attention and multi-
level/sectoral coordination (Burch, 2010; Romero-Lankao et al., 2013a).
26.8.4.2.1. Adaptation is path-dependent
Adaptation options are constrained by past settlement patterns and
decisions. The evolution of cities as economic hubs, for example, affects
vulnerability and resilience (Leichenko, 2011). Urban expansion into
mountain, agricultural, protected, and otherwise risk-prone areas (Boruff
et al., 2005; McGranahan et al., 2007; Collins and Bolin, 2009; Conrad,
2010) invariably alters regional environments. Development histories
foreclose some resilience pathways. Previous water development, for
example, can result in irreversible over-exploitation and degradation of
water resources.
26.8.4.2.2. Institutional capacity
At all levels of governance, adaptation in North America is affected by
numerous determinants of institutional capacity. Three have emerged
in the literature as particularly significant challenges for urban and rural
settlements:
• Economic resources: Rural communities face limited revenues
combined with higher costs of supplying services (Williamson et al.,
2008; Posey, 2009). Small municipal revenue pools translate into
fiscal constraints necessary to support public services, including
emergency personnel and health care (Lal et al., 2011). Although
large cities tend to have greater fiscal capacity, most do not receive
financial support for adaptation (Carmin et al., 2012), yet face the
risk of higher economic losses.
• Information and social capital: Differences in access and use of
information, and capacity for learning and innovation, affect adaptive
capacity (Romero-Lankao et al., 2013a). Levels of knowledge and
prioritization can be low among municipal planners. Information
access can be limited, even among environmental planners (Picketts
et al., 2012). The relationship between trust and participation in
support networks (social capital) and adaptive capacity is generally
positive; however, strong social bonds may support narratives that
underestimate climate risk (Wolf et al., 2010; Romero-Lankao et al.,
2012b).
• Participation: Considering the overlap among impacts and sources
of vulnerability in North American human settlements, long-term
effectiveness of local adaptation hinges on inclusion of all
stakeholders. Stakeholder involvement lengthens planning time
frames, may elicit conflicts, and power relationships can constrain

1474
Chapter 26 North America
26
Box 26-3 | Climate Responses in Three North American Cities
With populations of 20.5, 14, and 2.3 million people, respectively, the metropolitan areas of Mexico City, New York, and Vancouver
are facing multiple risks that climate change is projected to aggravate. These risks range from sea level rise, coastal flooding, and
storm surges in New York and Vancouver to heat waves, heavy rains and associated flooding, air pollution, and heat island effects in
all three cities (Leon and Neri, 2010; Rosenzweig and Solecki, 2010; City of Vancouver, 2012). Many of these risks result not only
from long-term global and regional processes of environmental change, but also from local changes in land and water uses and in
atmospheric emissions induced by urbanization (Leon and Neri, 2010; Romero-Lankao, 2010; Kinney et al., 2011; Solecki, 2012).
The three cities have been frontrunners in the climate arena. In Mexico City, the Program of Climate Action 2008–2012 (PAC) and the
2011 Law for Mitigation and Adaptation to Climate Change are parts of a larger 15-year “Green Agenda,” with most of designated
funds committed to reducing 7 million tonnes of CO
2
-equivalent by 2012 (Romero-Lankao et al., 2013). New York City and Vancouver’s
plans are similarly mitigation centered. As of 2007 New York’s long-term sustainability plan included adaptation (Solecki, 2012; Ray
et al., 2013), while Vancouver launched its municipal adaptation plan in July 2012. The shifts in focus from mitigation to adaptation
have followed as it has become increasingly clear that even if mitigation efforts are wholly successful, some adverse impacts due to
climate change are unavoidable.
Urban leaders in all three cities have emerged as global leaders in sustainability. Mayor Bloomberg of New York, Mayor Ebrard of Mexico
City, and David Cadman of Vancouver have, respectively, led the C40, World Mayors Council on Climate Change, and International
Council for Local Environmental Initiatives (ICLEI). Scientists, private sector actors, and non-governmental organizations have been of
no lesser importance. To take advantage of a broad-based interaction between various climate change actors, Mexico City has set up
a Virtual Climate Change Center to serve as a repository of knowledge, models, and data on climate change impacts, vulnerability,
and risks (Romero-Lankao et al., 2013a). Information sharing by climate change actors has also taken place in New York, where
scientists and insurance and risk management experts have served on the Panel on Climate Change to advise the city on the science
of climate change impacts and “protection levels specific to the city’s critical infrastructure” (Solecki, 2012, p. 564).
The climate plans of the three cities are far reaching, including mitigation and adaptation strategies related to their sustainability goals.
The three cities emphasize different priorities in their climate action plans. Mexico City seeks to reduce water consumption and
transportation emissions through such actions as improvements in infrastructure and changes in the share of public transport. Vancouver
has prioritized the separation of sanitary and storm water systems, yet this adaptation is not expected to be complete until 2050 (City of
Vancouver, 2012). It will also take New York much time, money, and energy to expand adaptation strategies beyond the protection of
water systems to include all essential city infrastructure (Ray et al., 2013). Overall, few proposed actions will result in immediate effects,
and instead call for additional planning, highlighting the significant effort necessary for comprehensive responses. Overall, adaptation
planning in the three cities faces many challenges. In all three regions, multi-jurisdictional governance structures with differing approaches
to climate change challenge the ability for coordinated responses (Solecki, 2012; Romero-Lankao et al., 2013a). Conflicts in priorities and
objectives between various actors and sectors are also prevalent (Burch, 2010). For instance, authorities in Mexico City concerned with
avoiding growth into risk-prone and conservation areas (Aguilar and Santos, 2011) compete for regulatory space within a policy agenda
that is already coping with a wide range of economic and developmental imperatives (Romero-Lankao et al., 2013a).
Climate responses require new types of localized scientific information, such as vulnerability analyses and flood risk assessments,
which are not always available (Romero-Lankao et al., 2012a; Ray et al., 2013). Little is known, for instance, about how to predict
and respond to common and differential levels of risk experienced by different human settlements. Comprehensive planning is still
limited as well. For example, although scholarship exists on disparities in household- and population-level vulnerability and adaptive
capacity (Cutter et al., 2003; Villeneuve and Burnett, 2003; Douglas et al., 2012; Romero-Lankao et al., 2013b), equity concerns have
received relatively less attention by the three cities. Even when local needs are identified, such as the need to protect higher risk
homeless and low-income populations (Vancouver), they are often not addressed in action plans.

1475
North America Chapter 26
26
a
ccess (Few et al., 2007; Colten et al., 2008). However, effective
stakeholder engagement has tremendously enhanced adaptation
planning, eliciting key sources of information regarding social
values, securing legitimacy (Aguilar and Santos, 2011), and fostering
adaptive capacity of involved stakeholders.
26.9. Federal and Subnational Level Adaptation
Along with many local governments (Section 26.8.4), federal, and
subnational tiers of government across North America are developing
climate change adaptation plans. These initiatives, which began at the
subnational levels (e.g., Nunavut Department of Sustainable Development,
2003), appear to be preliminary and relatively little has been done to
implement specific measures.
26.9.1. Federal Level Adaptation
All three national governments are addressing adaptation to some extent,
with a national strategy and a policy framework (Mexico), a federal policy
framework (Canada), and the USA having delegated all federal agencies
to develop adaptation plans.
In 2005, the Mexican government created the Inter-Secretarial
Commission to Climate Change (Comisión Inter-Secretarial de Cambio
Climático (CICC)) to coordinate national public policy on climate change
(CICC, 2005; Sosa-Rodriguez, 2013). The government’s initiatives are
being delivered through the National Strategy for Climate Change
2007–2012 (Intersecretarial Commission on Climate Change, 2007) and,
the Special Programme on Climate Change 2009–2012, which identify
priorities in research, cross-sectoral action such as developing early
warning systems, and capacity development to support mitigation and
adaptation actions (CICC, 2009). The Policy Framework for Medium Term
Adaptation (CICC, 2010) aims at framing a single national public policy
approach on adaptation with a time horizon up to 2030. The General Law
of Climate Change requires state governments to implement mitigation
and adaptation actions (Diario Oficial de la Federación, 2012).
Canada is creating a Federal Adaptation Policy Framework intended to
mainstream climate risks and impacts into programs and activities to
help frame government priorities (Government of Canada, 2011). In
2007, the federal Government made a 4-year adaptation commitment
to develop six Regional Adaptation Collaboratives (RAC) in provinces
across Canada, ranging in size and scope, from flood protection and
drought planning, to extreme weather risk management; and assessing
the vulnerability of Nunavut’s mining sector to climate change (Natural
Resources Canada, 2011). In 2011, the federal government renewed
financial support for several adaptation programs and provided new
funding to create a Climate Adaptation and Resilience Program for
Aboriginals and Northerners, and Enhancing Competitiveness in a
Changing Climate program (Environment Canada, 2011). Canada recently
launched an Adaptation Platform to advance adaptation priorities
across the country (Natural Resources Canada, 2013).
The US government embarked in 2009 on a government-wide effort to
have all federal agencies address adaptation; to apply understanding
o
f climate change to agency missions and operations; to develop,
prioritize, and implement actions; and to evaluate adaptations and learn
from experience (The White House, 2009; Bierbaum et al., 2012). A 2013
plan issued by the president enhanced the US government effort
supporting adaptation (Executive Office of the President, 2013). The US
government provides technical and information support for adaptation
by non-federal actors, but does not provide direct financial support for
adaptation (Parris et al., 2010).
Some federal agencies took steps to address climate change adaptation
prior to this broader interagency effort. In 2010, the US Department of
Interior created Climate Science Centers to integrate climate change
information and management strategies in eight regions and 21
Landscape Conservation Cooperatives (Secretary of the Interior, 2010),
while the US Environmental Protection Agency’s Office of Water
developed a climate change strategy (EPA, 2011).
26.9.2. Subnational Level Adaptation
A number of states and provinces in all three countries have developed
adaptation plans. For example, in Canada, Quebec’s 2013–2020
adaptation strategy outlines 17 objections covering a number of
managed sectors and ecosystems (Government of Quebec, 2012). British
Columbia is modernizing its Water Act to alter water allocation during
drought to reduce agricultural crop and livestock loss and community
conflict, while protecting aquatic ecosystems (BC Ministry of the
Environment, 2010).
In the USA, California was the first state to publish an adaptation plan
calling for a 20% reduction in per capita water use by 2020 (California
Natural Resources Agency, 2009). Maryland first developed a plan on
coastal resources and then broadened it to cover human health,
agriculture, ecosystems, water resources, and infrastructure (Maryland
Commission on Climate Change, 2008, 2010). The State of Washington
is addressing environment, infrastructure, and communities; human health
and security; ecosystems, species, and habitat; and natural resources
(Built Environment: Infrastructure & Communities Topic Advisory Group,
2011; Human Health and Security Topic Advisory Group, 2011; Natural
Resources Working Lands and Waters Topic Advisory Group, 2011;
Species, Habitats and Ecosystems Topic Advisory Group, 2011).
Of the three national governments, only Mexico requires that states
develop adaptation plans. In Mexico, seven of 31 states—Veracruz,
Mexico City, Nuevo León, Guanajuato, Puebla, Tabasco, and Chiapas—
have developed their State Programmes for Climate Change Action
(Programas Estatales de Acción ante el Cambio Climático (PEACC)),
while Baja California Sur, Hidalgo, and Campeche are in the final stage
and 17 states are still in the planning and development stage (Instituto
de Ecología del Estado de Guanajuato, 2011). The proposed adaptation
actions focus mainly on: (1) reducing physical and social vulnerability
of key sectors and populations; (2) conservation and sustainable
management of ecosystems, biodiversity, and ecosystem services; (3)
developing risk management strategies; (4) strengthening water
management; (5) protecting human health; and (6) improving current
urban development strategies, focusing on settlements and services,
transport, and land use planning.

1476
Chapter 26 North America
26
26.9.3. Barriers to Adaptation
Chapter 16 provides a more in-depth discussion on adaptation barriers
and limits. Adaptation plans tend to exist as distinct documents and are
often not integrated into other planning activities (Preston et al., 2011).
Most adaptation activities have only involved planning for climate
change rather than specific actions, and few measures have been
implemented (Preston et al., 2011; Bierbaum et al., 2012).
Even though Canada and the USA are relatively well endowed in their
capacity to adapt, there are significant constraints on adaptation, with
financing being a significant constraint in all three countries (Carmin et
al., 2012). Barriers include legal constraints (e.g., Jantarasami et al.,
2010), lack of coordination across different jurisdictions (Smith et al.,
2009; NRC, 2010; INECC and SEMARNAT, 2012b), leadership (Smith et
al., 2009; Moser and Ekstrom, 2010), and divergent perceptions about
climate change (Bierbaum et al., 2012; Moser, 2013). Although obtaining
accurate scientific data was ranked less important by municipalities
(Carmin et al., 2012), an important constraint is lack of access to scientific
information and capacity to manage and use it (Moser and Ekstrom,
2010; INECC and SEMARNAT, 2012b). Adaptation activities in developed
countries such as the USA tend to address hazards and propose
adaptations that tend to protect current activities rather than facilitate
long-term change. In addition, the adaptation plans generally do not
attempt to increase adaptive capacity (Eakin and Patt, 2011). However,
making changes to institutions needed to enable or promote adaptations
can be costly (Marshall, 2013).
Although multi-level and multi-sectoral coordination is a key component
of effective adaptation, it is constrained by factors such as mismatch
between climate and development goals, political rivalry, and lack of
national support to regional and local efforts (Brklacich et al., 2008;
Brown, 2009; Sander-Regier et al., 2009; Sydneysmith et al., 2010; Craft
and Howlett, 2013; Romero-Lankao et al., 2013a). Traditionally,
environmental or engineering agencies are responsible for climate issues
(e.g., Mexico City, Edmonton and London, Canada), but have neither
the decision-making power nor the resources to address all dimensions
involved. Adaptation planning requires long-term investments by
government, business, grassroots organizations, and individuals (e.g.,
Romero-Lankao, 2007; Burch, 2010; Croci et al., 2010; Richardson,
2010).
26.9.4. Maladaptation, Trade-Offs, and Co-Benefits
Adaptation strategies may introduce trade-offs or maladaptive effects
for policy goals in mitigation, industrial development, energy security,
and health (Hamin and Gurran, 2009; Laukkonen et al., 2009). Snow-
making equipment, for example, mediates snowpack reductions, but
has high water and energy requirements (Scott et al., 2007). Irrigation
and air conditioning have immediate adaptive benefits for North
American settlements, but are energy-consumptive. Sea walls protect
coastal properties, yet negatively affect coastal processes and ecosystems
(Richardson, 2010).
Conventional sectoral approaches to risk management and adaptation
planning undertaken at different temporal and spatial scales have
e
xacerbated vulnerability in some cases, for example, peri-urban areas
in Mexico (Eakin et al., 2010; Romero-Lankao, 2012). Approaches that
delegate response planning to residents in the absence of effective
knowledge exchange have resulted in maladaptive effects (Friesinger
and Bernatchez, 2010).
Other strategies offer synergies and co-benefits. Policies addressing air
pollution (Harlan and Ruddell, 2011) or housing for the poor, particularly
in Mexico (Colten et al., 2008), can often be adapted at low or no cost
to fulfill adaptation and sustainability goals (Badjek et al., 2010). Efforts
to temper declines in production or competitiveness in rural communities
could involve mitigation innovations, including carbon sequestration
forest plantations (Holmes, 2010). Painting roofs white reduces the effects
of heat and lowers energy demand for cooling (Akbari et al., 2009).
Adaptation planning can be greatly enhanced by incorporating regionally
or locally specific vulnerability information (Clark et al., 1998; Barsugli
et al., 2012; Romsdahl et al., 2013). Methods for mapping vulnerability
have been improved and effectively utilized (Romero-Lankao et al.,
2013b). Similarly, strategies supporting cultural preservation and
subsistence livelihood needs among Indigenous peoples would enhance
adaptation (Ford et al., 2010b), as would integrating traditional culture
with other forms of knowledge, technologies, education, and economic
development (Hardess et al., 2011).
26.10. Key Risks, Uncertainties,
Knowledge Gaps, and Research Needs
26.10.1. Key Multi-sectoral Risks
We close this chapter with our assessment of key current and future
regional risks from climate change with an evaluation of the potential
for risk reduction through adaptation (Table 26-1). Two of the three
examples, wildfires and urban floods, illustrate that multiple climate
drivers can result in multiple impacts (e.g., loss of ecosystems integrity,
property damage, and health impacts due to wildfires and urban floods).
The three risks evaluated in Table 26-1 also show that relative risks
depend on the context-specific articulation and dynamics of such factors
as the following:
• The magnitude and rate of change of relevant climatic and non-
climatic drivers and hazards. For instance, the risk of urban floods
depends not only on global climatic conditions (current vs. future
global mean temperatures of 2°C and 4°C), but also on urbanization,
a regional source of hazard risk that can enhance or reduce
precipitation, as it affects the hydrologic cycle and, hence, has
impacts on flood climatology (Section 26.8.2.1).
• The internal properties and dynamics of the system being stressed.
For example, some ecosystems are more fire adapted than others.
Some populations are more vulnerable to heat stress because of
age, preexisting medical conditions, working conditions and
lifestyles (e.g., outdoor workers, athletes).
• Adaptation potentials and limits. For example, while residential air
conditioning can effectively reduce health risk, availability and
usage is often limited among the most vulnerable individuals.
Furthermore, air conditioning is sensitive to power failures and its
use has mitigation implications.
1477
North America Chapter 26
26
The judgments about risk conveyed by the Table 26-1 are based on
assessment of the literature and expert judgment by chapter authors
living under current socioeconomic conditions. Therefore, risk levels
are estimated for each time frame, assuming a continuation of current
adaptation potentials and constraints. Yet over the course of the 21st
century, socioeconomic and physical conditions can change considerably
for many sectors, systems, and places. The dynamics of wealth generation
and distribution, technological innovations, institutions, and even culture
can substantially affect North American levels of risk tolerance within
the social and ecological systems considered (see also Box TS.8).
26.10.2. Uncertainties, Knowledge Gaps,
and Research Needs
The literature on climate impacts, adaptation, and vulnerability in North
America has grown considerably, as has the diversity of sectors and
topics covered (e.g., urban and rural settlements; food security; and
adaptation at local, state, and national levels). However, limitations in
the topical and geographical scope of this literature are still a challenge
(e.g., more studies have focused on insurance than on economic sectors
such as industries, construction, and transportation). It is also challenging
to summarize results across many studies and identify trends in the
literature when there are differences in methodology, theoretical
frameworks, and causation narratives (e.g., between outcome and
contextual approaches), making it hard to compare “apples to oranges”
(Romero-Lankao et al., 2012b). While the USA and Canada have produced
large volumes of literature, Mexico lags well behind. It was, therefore,
difficult to devote equal space to observed and projected impacts,
vulnerabilities, and adaptations in Mexico in comparison with its northern
neighbors. With its large land area, population, and important, albeit
under-studied, climate change risks and vulnerabilities, more climate
change research focusing on Mexico is direly needed.
The literature on North America tends to be dominated by sector level
analyses. Yet, climate change interacts with other physical and social
processes to create differential risks and impact levels. These differences
are mediated by context-specific physical and social factors shaping the
vulnerability of exposed systems and sectors. Furthermore, while studies
often focus on isolated sectoral effects, impacts happen in communities,
socio-ecologic systems, and regions, and shocks and dislocations in one
sector or region often affect other sectors and regions as a result of social
and physical interdependencies. This point is illustrated by Boxes 26-1
and 26-2 and the human settlements section, which discuss place-based
impacts, vulnerabilities, and adaptations. Unfortunately, literature using
placed-based or integrated approaches to these complexities is limited.
Indeed, although in early drafts the authors of this chapter attempted
to put more emphasis on place-based analysis and comparisons, the
literature was inadequate to support such an effort. The IPCC includes
chapters on continents and large regions to make it possible to assess
Damaging
cyclone
Precipitation
Climate-related drivers of impacts
W
arming
t
rend
E
xtreme
p
recipitation
E
xtreme
t
emperature
S
ea
l
evel
L
evel of risk & potential for adaptation
Potential for additional adaptation
t
o reduce risk
R
isk level with
current adaptation
R
isk level with
high adaptation
Drying
trend
Table 26-1 | Key risks from climate change and the potential for risk reduction through adaptation. Key risks are identified based on assessment of the literature and expert
judgments made by authors of this chapter, with supporting evaluation of evidence and agreement in the referenced chapter sections. Each key risk is characterized as very low,
low, medium, high, or very high. Risk levels are presented for the near-term era of committed climate change (here, for 2030–2040), in which projected levels of global mean
temperature increase do not diverge substantially across emissions scenarios. Risk levels are also presented for the longer-term era of climate options (here, for 2080–2100), for
global mean temperature increase of 2°C and 4°C above preindustrial levels. For each timeframe, risk levels are estimated for the current state of adaptation and for a
hypothetical highly adapted state. As the assessment considers potential impacts on different physical, biological, and human systems, risk levels should not necessarily be used
to evaluate relative risk across key risks. Relevant climate variables are indicated by symbols.
N
ear term
(2030–2040)
Present
L
ong term
(
2080–2100)
2°C
4°C
Very
low
V
ery
high
Medium
Near term
(2030–2040)
Present
Long term
(2080–2100)
2
°C
4°C
Very
low
V
ery
high
Medium
H
eat-related human mortality
(
high confidence)
[26.6, 26.8]
•
Residential air conditioning (A/C) can effectively reduce risk. However,
a
vailability and usage of A/C is highly variable and is subject to complete loss
d
uring power failures. Vulnerable populations include athletes and outdoor
w
orkers for whom A/C is not available.
•
Community- and household-scale adaptations have the potential to reduce
e
xposure to heat extremes via family support, early heat warning systems,
c
ooling centers, greening, and high-albedo surfaces.
Urban floods in riverine and coastal areas,
inducing property and infrastructure
damage; supply chain, ecosystem, and
social system disruption; public health
impacts; and water quality impairment, due
to sea level rise, extreme precipitation, and
cyclones (high confidence)
[26.2-4, 26.8]
• Implementing management of urban drainage is expensive and disruptive to
urban areas.
• Low-regret strategies with co-benefits include less impervious surfaces leading
to more groundwater recharge, green infrastructure, and rooftop gardens.
• Sea level rise increases water elevations in coastal outfalls, which impedes
drainage. In many cases, older rainfall design standards are being used that need
to be updated to reflect current climate conditions.
• Conservation of wetlands, including mangroves, and land-use planning
strategies can reduce the intensity of flood events.
Key risk Adaptation issues & prospects
Climatic
drivers
Risk & potential for
adaptation
Timeframe
N
ear term
(2030–2040)
Present
L
ong term
(
2080–2100)
2°C
4°C
V
ery
low
Very
high
Medium
W
ildfire-induced loss of ecosystem
i
ntegrity, property loss, human morbidity,
a
nd mortality as a result of increased
d
rying trend and temperature trend
(
high confidence)
[
26.4, 26.8, Box 26-2]
•
Some ecosystems are more fire-adapted than others. Forest managers and
m
unicipal planners are increasingly incorporating fire protection measures (e.g.,
p
rescribed burning, introduction of resilient vegetation). Institutional capacity to
s
upport ecosystem adaptation is limited.
•
Adaptation of human settlements is constrained by rapid private property
d
evelopment in high-risk areas and by limited household-level adaptive capacity.
•
Agroforestry can be an effective strategy for reduction of slash and burn
p
ractices in Mexico.

1478
Chapter 26 North America
26
how multiple climate change impacts can affect these large areas.
However, this macro view gives insufficient detail on context-specific
local impacts and risks, missing the on-the-ground reality that the effects
of climate change are and will be experienced at much smaller scales,
and those smaller scales are often where meaningful mitigation and
adaptation actions can be generated. To give local actors relevant
information on which to base these local actions, more research is needed
to understand better the local and regional effects of climate change
across sectors.
References
Abramson, D.M. and I.E. Redlener, 2013: Hurricane Sandy: lessons learned, again.
Disaster Medicine and Public Health Preparedness, 6(4), 328-329.
Acclimatise, 2009: Building Business Resilience to Inevitable Climate Change.
Carbon Disclosure Project Report 2008, FTSE 350, Produced by Climate Risk
Management Ltd., trading as Acclimatise, with staff of the Carbon Disclosure
Project and IBM United Kingdom Ltd., Acclimatise, Oxford, UK, 20 pp.
Aguilar, A.G. and C. Santos, 2011: Informal settlements’ needs and environmental
conservation in Mexico City: an unsolved challenge for land-use policy. Land
Use Policy, 28(4), 649-662.
Fr
e
que
nt
l
y
As
k
e
d
Q
ue
s
t
i
ons
FAQ 26.1 | What impact ar
e climate str
essors having on North America?
Re
ce
nt
cl
i
m
a
t
e
cha
nge
s
a
nd
e
x
t
r
e
m
e
e
v
e
nt
s
s
uch
a
s
fl
oods
a
nd
dr
ought
s
de
pi
ct
e
d
i
n
F
i
gur
e
2
6
-
2
de
m
ons
t
r
a
t
e
cl
e
a
r
i
m
p
ac
ts
o
f
c
l
i
m
ate-
rel
ated
stresses
i
n
No
rth
Am
eri
c
a
(
h
i
g
h
c
o
n
fi
d
en
c
e
)
.
Th
ere
h
as
b
een
i
n
c
reased
o
c
c
u
rren
c
e
o
f
se
v
e
r
e
hot
w
e
a
t
he
r
e
v
e
nt
s
ov
e
r
m
uch
of
t
he
U
S
A
a
nd
i
ncr
e
a
s
e
s
i
n
he
a
v
y
pr
e
ci
pi
t
a
t
i
on
ov
e
r
m
uch
of
N
or
t
h
A
m
e
r
i
ca
(
hi
gh
confi
de
nce
)
.
S
uch e
v
e
nt
s
a
s
dr
ought
s
i
n nor
t
he
r
n M
e
x
i
co a
nd s
out
h-
ce
nt
r
a
l
U
S
A
,
fl
oods
i
n Ca
na
da
,
a
nd hur
r
i
ca
ne
s
s
uch a
s
S
a
ndy
de
m
ons
t
r
a
t
e
e
x
pos
ur
e
a
nd v
ul
ne
r
a
bi
l
i
t
y
t
o e
x
t
r
e
m
e
cl
i
m
a
t
e
(
hi
gh confi
de
nce
)
.
M
a
ny
ur
ba
n a
nd r
ur
a
l
s
e
t
t
l
e
m
e
nt
s
,
a
gr
i
cul
t
ur
a
l
pr
oduct
i
on,
w
a
t
e
r
s
uppl
i
e
s
,
a
nd
hum
a
n
he
a
l
t
h
ha
v
e
be
e
n
obs
e
r
v
e
d
t
o
be
v
ul
ne
r
a
bl
e
t
o
t
h
e
s
e
a
n
d
o
t
h
e
r
e
xt
r
e
m
e
w
e
a
t
h
e
r
e
ve
n
t
s
(Fi
g
u
r
e
2
6
-2
).
Fo
r
e
s
t
e
c
o
s
ys
t
e
m
s
h
a
ve
b
e
e
n
s
t
r
e
s
s
e
d
t
h
r
o
u
g
h
wi
l
d
fir
e
a
c
t
i
v
i
t
y
,
r
e
gi
ona
l
dr
ought
,
hi
gh
t
e
m
pe
r
a
t
ur
e
s
,
a
nd
i
nf
e
s
t
a
t
i
ons
,
w
hi
l
e
a
qua
t
i
c
e
c
os
y
s
t
e
m
s
a
r
e
be
i
ng
a
ff
e
c
t
e
d
by
hi
ghe
r
t
e
m
pe
r
a
t
ur
e
s
a
nd
s
e
a
l
e
v
e
l
r
i
s
e
.
M
a
ny
de
ci
s
i
on
m
a
k
e
r
s
,
pa
r
t
i
cul
a
r
l
y
i
n
t
he
U
S
A
a
nd
Ca
na
da
,
ha
v
e
t
he
fi
na
nci
a
l
,
hum
a
n,
a
nd
i
ns
t
i
t
ut
i
ona
l
ca
pa
ci
t
y
t
o
inv
e
s
t
in
r
e
s
ilie
nce
,
y
e
t
a
t
r
e
nd
of
r
is
ing
los
s
e
s
f
r
om
e
x
t
r
e
me
s
ha
s
be
e
n
e
v
ide
nt
a
cr
os
s
t
he
cont
ine
nt
(
F
igur
e
2
6
-
2
)
,
l
a
r
ge
l
y
due
t
o s
oci
oe
conom
i
c f
a
ct
or
s
,
i
ncl
udi
ng a
gr
ow
i
ng popul
a
t
i
on,
e
qui
t
y
i
s
s
ue
s
,
a
nd i
ncr
e
a
s
e
d pr
ope
r
t
y
v
a
l
ue
i
n
a
r
e
a
s
of
hi
gh
e
x
pos
ur
e
.
I
n
a
ddi
t
i
on,
cl
i
m
a
t
e
cha
nge
i
s
v
e
r
y
l
i
k
e
l
y
t
o
l
e
a
d
t
o
m
or
e
f
r
e
que
nt
e
x
t
r
e
m
e
he
a
t
e
v
e
nt
s
an
d
d
aily
p
r
ec
ip
it
at
io
n
ext
r
emes
o
ver
mo
s
t
ar
eas
o
f
No
r
t
h
Amer
ic
a,
mo
r
e
f
r
eq
u
en
t
lo
w
s
n
o
w
year
s
,
an
d
s
h
if
t
s
t
o
wa
r
d
earl
i
er
snowm
el
t
runoff
ov
er
m
uch
of
the
western
U
S
A
and
Canada
(
hi
gh
confi
dence
)
.
These
changes
com
bi
ned
wi
th hi
gher sea l
ev
el
s and associ
ated storm
surges,
m
ore i
ntense droughts,
and i
ncreased preci
pi
tati
on v
ari
abi
l
i
ty
a
r
e
p
r
o
je
ct
e
d
t
o
le
a
d
t
o
in
cr
e
a
s
e
d
s
t
r
e
s
s
e
s
t
o
w
a
t
e
r, a
g
r
icu
lt
u
r
e
, e
co
n
o
mic a
ct
ivit
ie
s
, a
n
d
u
r
b
a
n
a
n
d
r
u
r
a
l s
e
t
t
le
me
n
t
s
(
hi
gh
confi
dence
)
.
Fr
equent
l
y
As
ked
Ques
t
i
ons
FAQ 26.2 | Can adaptation reduce the adverse impacts of climate stressors in North America?
Ad
a
p
t
a
t
io
n
—
in
clu
d
in
g
la
n
d
u
s
e
p
la
n
n
in
g
, in
ve
s
t
me
n
t
s
in
in
f
r
a
s
t
r
u
ct
u
r
e
, e
me
r
g
e
n
cy ma
n
a
g
e
me
n
t
, h
e
a
lt
h
p
r
o
g
r
a
ms
,
and
water
conserv
ati
on—has
si
gni
fi
cant
capaci
ty
to
reduce
ri
sks
from
current
cl
i
m
ate
and
cl
i
m
ate
change
(
F
i
gure
26-
3)
.
There i
s i
ncreasi
ng attenti
on to adaptati
on am
ong pl
anners at al
l
l
ev
el
s of gov
ernm
ent but parti
cul
arl
y
at
the
m
uni
c
i
pal
l
ev
el
,
wi
th
m
any
j
uri
sdi
c
ti
ons
engagi
ng
i
n
assessm
ent
and
pl
anni
ng
proc
esses.
Yet,
there
are
few
d
o
c
u
men
t
ed
examp
les
o
f
imp
lemen
t
at
io
n
o
f
p
r
o
ac
t
ive
ad
ap
t
at
io
n
an
d
t
h
es
e
ar
e
lar
g
ely
f
o
u
n
d
in
s
ec
t
o
r
s
w
it
h
lo
n
g
er
term
dec
i
si
on
m
aki
ng,
i
nc
l
udi
ng
energy
and
publ
i
c
i
nfrastruc
ture
(
hi
gh
c
onfi
denc
e
).
Adaptati
on
efforts
hav
e
rev
eal
ed
t
h
e s
ig
n
ific
an
t
c
h
allen
g
es
an
d
s
o
u
r
c
es
o
f
r
es
is
t
an
c
e f
ac
in
g
p
lan
n
er
s
at
b
o
t
h
t
h
e p
lan
n
in
g
an
d
imp
lemen
t
at
io
n
s
t
ag
es
,
parti
cul
arl
y
the
adequacy
of
i
nform
ati
onal
,
i
nsti
tuti
onal
,
fi
nanci
al
,
and
hum
an
resources,
and
l
ack
of
pol
i
ti
cal
wi
l
l
(
m
edi
um
confi
dence)
.
Whi
l
e there i
s hi
gh capaci
ty
to adapt to cl
i
m
ate change across m
uch of N
orth A
m
eri
ca,
there
are regi
onal
and sectoral
di
spari
ti
es i
n econom
i
c resources,
gov
ernance capaci
ty
,
and access to and abi
l
i
ty
to uti
l
i
z
e
i
nform
ati
on on cl
i
m
ate change,
whi
ch l
i
m
i
t adapti
v
e capaci
ty
i
n m
any
regi
ons and am
ong m
any
popul
ati
ons such
as the poor and Indigenous communities. For example, there is limited capacity for many species to adapt to climate
cha
nge
, e
ven with huma
n intervention. At lower levels of temperature rise, adaptation has high potential to offset
proje
c
te
d
de
c
line
s
in
yie
lds
for
ma
ny
c
rops,
but this effectiveness is expected to be much lower at higher temper
atures.
T
he
risk
tha
t clima
te
stre
sse
s will c
a
use
profound impacts on ecosystems and society—including the possibility of
spe
c
ie
s e
xtinc
tion or se
ve
re
a
dve
rse
soc
ioe
c
onomic shocks—highlights limits to adaptation.

1479
North America Chapter 26
26
Aguilera, E., L. Lassaletta, A. Gattinger, and B.S. Gimeno, 2013: Managing soil carbon
for climate change mitigation and adaptation in Mediterranean cropping systems:
a meta-analysis. Agriculture, Ecosystems & Environment, 168, 25-36.
Ahmed, S.A., N.D. Diffenbaugh, and T. Hertel, 2009: Climate volatility deepens poverty
vulnerability in developing countries. Environmental Research Letters, 4(3),
034004, doi:10.1088/1748-9326/4/3/034004.
Akbari, H., S. Menon, and A. Rosenfeld, 2009: Global cooling: increasing world-wide
urban albedos to offset CO
2
. Climatic Change, 94(3), 275-286.
Alam, M.M., C. Siwar, R.I. Molla, B. Talib, and M.E.B. Toriman, 2012: Paddy farmers’
adaptation practices to climatic vulnerabilities in Malaysia. Mitigation and
Adaptation Strategies for Global Change, 17(4), 415-423.
Alexander, L.V., X. Zhang, T.C. Peterson, J. Caesar, B. Gleason, A.M.G. Klein Tank, M.
Haylock, D. Collins, B. Trewin, F. Rahimzadeh, A. Tagipour, K. Rupa Kumar, J.
Revadekar, G. Griffiths, L. Vincent, D.B. Stephenson, J. Burn, E. Aguilar, M. Brunet,
M. Taylor, M. New, P. Zhai, M. Rusticucci, and J.L. Vazquez-Aguirre, 2006: Global
observed changes in daily climate extremes of temperature and precipitation.
Journal of Geophysical Research: Atmospheres, 111(D5), D05109, doi:10.1029/
2005JD006290.
Alig, R.J., J.D. Kline, and M. Lichtenstein, 2004: Urbanization on the US landscape:
looking ahead in the 21
s
t
century. Landscape and Urban Planning, 69(2), 219-
234.
Allen, C.D., A. Macalady, H. Chenchouni, D. Bachelet, N. McDowell, M. Vennetier, P.
Gonzales, T. Hogg, A. Rigling, and D.D. Breshears, 2010: A global overview of
drought and heat-induced tree mortality reveals emerging climate change risks
for forests. Forest Ecology and Management, 259(4), 660-684.
Almaraz, J.J., F. Mabood, X. Zhou, E.G. Gregorich, and D.L. Smith, 2008: Climate
change, weather variability and corn yield at a higher latitude locale:
southwestern Quebec. Climatic Change, 88(2), 187-197.
AMF, 2011: Managing Climate Change Risk: Findings of 2010 Survey of Property and
Casualty Insurers Operating in Quebec. Autorité des Marchés Financiers (AMF),
Quebéc and Montréal, QC, Canada, 57 pp.
Anderegg, W.R.L., J.A. Berry, D.D. Smith, J.S. Sperry, L.D.L. Anderegg, and C.B. Field,
2012: The roles of hydraulic and carbon stress in a widespread climate-induced
forest die-off. Proceedings of the National Academy of Sciences of the United
States of America, 109(1), 233-237.
Anderegg, W.R.L., J.M. Kane, and L.D.L. Anderegg, 2013: Consequences of
widespread tree mortality triggered by drought and temperature stress. Nature
Climate Change, 3(1), 30-36.
Anderson, B.G. and M.L. Bell, 2009: Weather-related mortality: how heat, cold, and
heat waves affect mortality in the United States. Epidemiology, 20(2), 205.
Anderson, B.J., H.R. Akcakaya, M.B. Araujo, D.A. Fordham, E. Martinez-Meyer, W.
Thuiller, and B.W. Brook, 2009: Dynamics of range margins for metapopulations
under climate change. Proceedings of the National Academies of Sciences of
the United States of America, 276(1661), 1415-1420.
Anderson, C. and S. McLachlan, 2012: Exiting, enduring and innovating: farm
household adaptation to global zoonotic disease. Global Environmental
Change, 22(1), 82-93.
Anderson, M., S. Dobardzic, and D. Gardiner, 2006: Climate Change and Insurance: An
Agenda for Action in the United States. Report prepared by Miranda Anderson,
Saliha Dobardzic and David Gardiner, David Gardiner & Associates, LLC, for the
Allianz Group and the World Wildlife Fund (WWF)-US, Allianz Group, Munich,
Germany and WWF-US, Washington, DC, USA, 45 pp.
Anderson, R.G., J.G. Canadell, J.T. Randerson, R.B. Jackson, B.A. Hungate, D.D.
Baldocchi, G.A. Ban-Weiss, G.B. Bonan, K. Caldeira, L. Cao, N.S. Diffenbaugh,
K.R. Gurney, L.M. Kueppers, B.E. Law, S. Luyssaert, and T.L. O’Halloran, 2011:
Biophysical considerations in forestry for climate protection. Frontiers in Ecology
and the Environment, 9(3), 174-182.
Andrachuk, M. and T. Pearce, 2010: Vulnerability and adaptation in two communities
in the Inuvialuit settlement region. In: Community Adaptation and Vulnerability
in Arctic Regions [Hovelsrud, G.K. and B. Smit (eds.)]. Springer Science, Dordrecht,
Netherlands, pp. 63-81.
Anguelovski, I. and J.A. Carmin, 2011: Something borrowed, everything new:
innovation and institutionalization in urban climate governance. Current
Opinion in Environmental Sustainability, 3(3), 169-175.
Arbuckle Jr., J.G., L.S. Prokopy, T. Haigh, J. Hobbs, T. Knoot, C. Knutson, A. Loy, A.S.
Mase, J. McGuire, L.W. Morton, J. Tyndall, and M. Widhalm, 2013: Climate
change beliefs, concerns, and attitudes toward adaptation and mitigation
among farmers in the Midwestern United States. Climatic Change, 117(4), 943-
950.
Ariano, R., G.W. Canonica, and G. Passalacqua, 2010: Possible role of climate changes
in variations in pollen seasons and allergic sensitizations during 27 years.
Annals of Allergy, Asthma & Immunology, 104(3), 215-222.
ASCE, 2009: 2009 Report Card for America’s Infrastructure.American Society of Civil
Engineers (ASCE), Reston, Virginia, USA, 153 pp.
Asseng, S., F. Ewert, C. Rosenzweig, J.W. Jones, J.L. Hatfield, A.C. Ruane, K.J. Boote,
P.J. Thorburn, R.P. Rotter, D. Cammaranol, N. Brisson, B. Basso, P. Martre, P.K.
Aggarwal, C. Angulo, P. Bertuzzi, C. Biernath, A.J. Challinor, J. Doltra, S. Gayler,
R. Goldberg, R. Grant, L.N. Kumar, C. Nendel, G. O’Leary, J.E. Olesen, T.M.
Osborne, T. Palosuo, E. Priesack, D. Ripoche, M.A. Semenov, I. Shcherbak, P.
Steduto, C. Stockle, P. Stratonovitch, T. Streck, I. Supit, F. Tao, M. Travasso, K. Waha,
D. Wallach, J.W. White, J.R. Williams, and J. Wolf, 2013: Uncertainty in simulating
wheat yields under climate change. Nature Climate Change, 3(9), 827-832.
Auffhammer, M. and A. Aroonruengsawat, 2011: Simulating the impacts of climate
change, prices and population on California’s residential electricity consumption.
Climatic Change, 109(1 Suppl.), S191-S210.
Auffhammer, M. and A. Aroonruengsawat, 2012: Erratum to: Simulating the impacts
of climate change, prices and population on California’s residential electricity
consumption. Climatic Change, 113(3-4), 1101-1104.
Auld, H., J. Waller, S. Eng, J. Klaassen, R. Morris, S. Fernandez, V. Cheng, and D. MacIver,
2010: The Changing Climate and National Building Codes and Standards.
Proceedings of American Meteorological Society, Ninth Symposium on the
Urban Environment, Session 5.6, August 1-6, 2010, Keystone, CO, USA, 12 pp.,
ams.confex.com/ams/19Ag19BLT9Urban/techprogram/paper_174517.htm.
Autor, D.H., L.F. Katz, and M.S. Kearney, 2008: Trends in U.S. wage inequality: revising
the revisionists. The Review of Economics and Statistics, 90(2), 300-323.
Averyt, K., J. Fisher, A. Huber-Lee, A. Lewis, N. Macknick, J. Madden, S. Rogers, and S.
Tellinghuisen, 2011: Freshwater Use by US Power Plants: Electricity’s Thirst for
a Precious Resource. A Report of the Energy and Water in a Warming World
Initiative, Union of Concerned Scientists, Cambridge, MA, USA, 52 pp.
Avise, J., J. Chen, B. Lamb, C. Wiedinmyer, A. Guenther, and E. Salath, 2009: Attribution
of projected changes in summertime US ozone and PM
2
.5
concentrations to
global changes. Atmospheric Chemistry and Physics, 9, 1111-1124.
AXA Group and Ipsos Research, 2012: Individual Perceptions of Climate Change
Risk: Survey AXA/Ipsos, 2012. Survey produced by Ipsos Research for the AXA
Group and AXA Research Fund, AXA Group, Paris, France, 16 pp.
Axelson, J.N., D.J. Sauchyn, and J. Barichivich, 2012: New reconstructions of streamflow
variability in the South Saskatchewan River Basin from a network of tree ring
chronologies, Alberta, Canada. Water Resources Research, 45(9), W09422,
doi:10.1029/2008WR007639.
Azumaya, T., T. Nagasawa, O.S. Temnykh, and G.V. Khen, 2007: Regional and seasonal
differences in temperature and salinity limitations of Pacific salmon (Oncorhynchus
spp.). North Pacific Anadromous Fish Commission Bulletin, 4, 179-187.
Baade, R.A., R. Baumann, and V. Matheson, 2007: Estimating the economic impact
of natural and social disasters, with an application to Hurricane Katrina. Urban
Studies, 44(11), 2061-2076.
Backus, G.A., T.S. Lowry, and D.E. Warren, 2013: The near-term risk of climate
uncertainty among the U.S. states. Climatic Change, 116(3-4), 495-522.
Badjek, M., E.H. Allison, A.S. Halls, and N.K. Dulvy, 2010: Impacts of climate variability
and change on fishery-based livelihoods. Marine Policy, 34(3), 375-383.
Balshi, M.S., A.D. McGuire, P. Duffy, M. Flannigan, J. Walsh, and J. Melillo, 2009:
Assessing the response of area burned to changing climate in western boreal
North America using a Multivariate Adaptive Regression Splines (MARS)
approach. Global Change Biology, 15(3), 578-600.
Barnett, T.P., J.C. Adam, and D.P. Lettenmaier, 2005: Potential impacts of a warming
climate on water availability in snow-dominated regions. Nature, 438(7066),
303-309.
Barnett, T.P., D.W. Pierce, H.G. Hidalgo, C. Bonfils, B.D. Santer, T. Das, G. Bala, A. Wood,
T. Nozawa, A. Mirin, D. Cavan, and M.D. Dettinger, 2008: Human-induced changes
in the hydrology of the western United States. Science, 319(5866), 1080-1083.
Barsugli, J.J., J.M. Vogel, L. Kaatz, J.B. Smith, M. Waage, and C.J. Anderson, 2012: Two
faces of uncertainty: climate science and water utility planning methods.
Journal of Water Resources Planning and Management, 138(5), 389-395.
Barthel, F. and E. Neumayer, 2012: A trend analysis of normalized insured damage
from natural disasters. Climatic Change, 113(2), 215-237.
Battin, J., M.W. Wiley, M.H. Ruckelshaus, R.N. Palmer, E. Korb, K.K. Bartz, and H. Imaki,
2007: Projected impacts of climate change on salmon habitat restoration.
Proceedings of the National Academy Sciences of the United States of America,
104(16), 6720-6725.

1480
Chapter 26 North America
26
Battisti, D.S. and R.L. Naylor, 2009: Historical warnings of future food insecurity with
unprecedented seasonal heat. Science, 323(5911), 240-244.
Baumgart-Getz, A., L. Prokopy, and K. Floress, 2012: Why farmers adopt best
management practice in the United States: a meta-analysis of the adoption
literature. Journal of Environmental Management, 96(1), 17-25.
BC Ministry of the Environment, 2010: Preparing for Climate Change: British
Columbia’s Adaptation Strategy. British Columbia Ministry of the Environment,
Victoria, BC, Canada, 4 pp.
Bee, B., M. Biermann, and P. Tschakert, 2013: Gender, development, and rights-based
approaches: lessons for climate change adaptation and adaptive social protection.
In: Research, Action and Policy: Addressing the Gendered Impacts of Climate
Change [Alston, M. and K. Whittenbury (eds.)]. Springer, Dordrecht, Netherlands,
pp. 95-108.
Beebe, N.W., R.D. Cooper, P. Mottram, and A.W. Sweeney, 2009: Australia’s dengue
risk driven by human adaptation to climate change. PLoS Neglected Tropical
Diseases, 3(5), e429, doi:10.1371/journal.pntd.0000429.
Beef Today Editors, 2013: Cargill to idle Texas beef processing plant. AgWeb: Beef
Today , January 17, 2013, 1 p., www.agweb.com/article/cargill_to_idle_texas_
beef_processing_plant/.
Bélanger, D., P. Berry, V. Bouchet, D. Charron, K.-L. Clarke, B. Doyon, M. Fleury, C.
Furgal, P. Gosselin, S. Lamy, L.R. Lindsay, G. McBean, N.H. Ogden, J. Séguin, C.J.
Shuster, and C.L. Soskolne, 2008: Human Health in a Changing Climate: A
Canadian Assessment of Vulnerabilities and Adaptive Capacity [Séguin, J. (ed.)].
Health Canada, Ottawa, ON, Canada, 484 pp.
Bell, M.L., R. Goldberg, C. Hogrefe, P.L. Kinney, K. Knowlton, B. Lynn, J. Rosenthal, C.
Rosenzweig, and J.A. Patz, 2007: Climate change, ambient ozone, and health
in 50 US cities. Climatic Change, 82(1), 61-76.
Bender, M.A., T.R. Knutson, R.E. Tuleya, J.J. Sirutis, G.A. Vecchi, S.T. Garner, and I.M.
Held, 2010: Modeled impact of anthropogenic warming on the frequency of
intense Atlantic hurricanes. Science, 327(5964), 454-458.
Bentz, B.J., J. Régnière, C.F. Fettig, E.M. Hansen, J.L. Hayes, J.A. Hicke, R.G. Kelsey, J.F.
Negrón, and S.J. Seybold, 2010: Climate change and bark beetles of the western
United States and Canada: direct and indirect effects. BioScience, 60(8), 602-613.
Berry, H.L., K. Bowen, and T. Kjellstrom, 2010: Climate change and mental health: a
causal pathways framework. International Journal of Public Health, 55(2), 123-
132.
Bethel, J.W., A.N. Foreman, and S.C. Burke, 2011: Disaster preparedness among
medically vulnerable populations. American Journal of Preventive Medicine,
40(2), 139-143.
Bhatti, J.S., M.J. Apps, and R. Lal, 2006: Anthropogenic changes and the global carbon
cycle. In: Climate Change and Managed Ecosystems [Bhatti, J.S., M.J. Apps, R.
Lal, and M.A. Price (eds.)]. Taylor & Francis, Boca Raton, FL, USA, pp. 71-91.
Biasutti, M., A.H. Sobel, S.J. Camargo, and T.T. Creyts, 2012: Projected changes in the
physical climate of the Gulf Coast and Caribbean. Climatic Change, 112(3-4),
819-845.
Bierbaum, R., J.B. Smith, A. Lee, M. Blair, F.S.I. Chapin, P. Fleming, S. Russo, M. Stults,
S. McNeely, E. Wasley, and L. Verduzco, 2012: A comprehensive review of climate
adaptation in the United States: more than before, but less than needed.
Mitigation and Adaptation Strategies for Global Change, 18(3), 361-401.
Bin, O., C. Dumas, B. Poulter, and J. Whitehead, 2007: Measuring the Impacts of
Climate Change on North Carolina Coastal Resources: Final Report. National
Commission on Energy Policy, Washington, DC, USA, 91 pp.
Bjarndadottir, S., Y. Li, and M.G. Stewart, 2011: A probabilistic-based framework for
impact and adaptation assessment of climate change on hurricane damage
risks and costs. Structural Safety, 33(3), 173-185.
Black, R., N.W. Adger, N.W. Arnell, S. Dercon, A. Geddes, and D.S.G. Thomas, 2011:
The effect of environmental change on human migration. Global Environmental
Change, 21(1 Suppl.), S3-S11.
Blake, E.S., E.N. Rappaport, and C.W. Landsea, 2007: The Deadliest, Costliest, and
Most Intense United States Tropical Cyclones from 1851 to 2006 (and Other
Frequently Requested Hurricane Facts). NOAA Technical Memorandum NWS
TPC-5, National Oceanic and Atmospheric Administration (NOAA), The National
Weather Service (NWS) and the National Hurricane Center (NHC), Miami, FL,
USA, 43 pp.
Blake, R., A. Grimm, T. Ichinose, R. Horton, S. Gaffin, S. Jiong, D. Bader, and D. Cecil,
2011: Urban climate: processes, trends, and projections. In: Climate Change
and Cities: First Assessment Report of the Urban Climate Change Research
Network [Rosenzweig, C., W.D. Solecki, S.A. Hammer, and S. Mehrotra (eds.)].
Cambridge University Press, New York, NY, USA, pp. 43-83.
Bloomberg, M., 2012: News from the Blue Room: Mayor Bloomberg Delivers Address
on Shaping New York City’s Future after Hurricane Sandy. Remarks delivered
at the New York City Marriott Downtown, December 6, 2012, NYC Office of
the Major, New York, NY, USA, www.nyc.gov/cgi-bin/misc/pfprinter.cgi?
action=print&sitename=OM&p=1400099880000.
Bond, W.J. and J.E. Keeley, 2005: Fire as a global ‘herbivore’: the ecology and evolution
of flammable ecosystems. Trends in Ecology and Evolution, 20(7), 387-394.
Bond, W.J. and B.W. van Wilgen, 1996: Fire and Plants. Population and Community
Biology Series, Vol. 14, Chapman & Hall, London, UK, 263 pp.
Bonsal, B.R., R. Aider, P. Gachon, and S. Lapp, 2012: An assessment of Canadian
prairie drought: past, present, and future. Climate Dynamics, 41(2), 501-516.
Bootsma, A., S. Gameda, and D.W. McKenney, 2005: Potential impacts of climate
change on corn, soybeans and barley yields in Atlantic Canada. Canadian
Journal of Soil Science, 85(2), 345-357.
Border Indicators Task Force, 2011: State of the Border Region: Indicators Report
2010. Border 2012: U.S. – Mexico Environmental Program Indicators Report,
Border Indicators Task Force (BITF) led by representatives from the United States
Environmental Protection Agency (EPA) and Secretaría de Medio Ambiente y
Recursos Naturales (SEMARNAT), EPA, Washington, DC, USA and SEMARNAT,
Mexico City, DF, Mexico, 99 pp.
Bornehag, C.G., G. Blomquist, F. Gyntelberg, B. Jarvholm, P. Malmberg, L. Nordvall,
A. Nielsen, G. Pershagen, and J. Sundell, 2001: Dampness in buildings and
health. Indoor Air, 11(2), 72-86.
Boruff, B.J., C. Emrich, and S.L. Cutter, 2005: Erosion hazard vulnerability of US coastal
counties. Journal of Coastal Research, 21(5), 932-942.
Brenkert-Smith, H., 2010: Building bridges to fight fire: the role of informal social
interactions in six Colorado wildland-urban interface communities.
International Journal of Wildland Fire, 19(6), 689-697.
Bresch, D. and A. Spiegel, 2011: A Blueprint for Managing Climate Risks in Emerging
Markets. Swiss Re, Zürich, Switzerland, 4 pp.
Breshears, D.D., N.S. Cobb, P.M. Rich, K.P. Price, C.D. Allen, R.G. Balice, W.H. Romme,
J.H. Kastens, M.L. Floyd, J. Belnap, J.J. Anderson, O.B. Myers, and C.W. Meyer,
2005: Regional vegetation die-off in response to global-change-type drought.
Proceedings of the National Academy of Sciences of the United States of
America, 102(42), 15144-15148.
Bright, E.A., P.R. Coleman, A.N. Rose, and M.L. Urban, 2012: LandScan 2011. Digital
dataset, Oakridge National Laboratory, Oakridge, TN, USA, web.ornl.gov/sci/
landscan/index.shtml.
Brklacich, M., M. Woodrow, R. McLeman, and K. Vodden, 2008: Enhancing the
Capacity of Canadian Rural Communities to Adapt to Uncertain Futures. Prepared
for Canadian Climate Impacts and Adaptation Program, Project A1397, Natural
Resources Canada, Ottawa, ON, Canada.
Brooks, S. and M. Loevinsohn, 2011: Shaping agricultural innovation systems
responsive to food insecurity and climate change. Natural Resources Forum,
35(3), 185-200.
Brown, H.C.P., 2009: Climate change and Ontario forests: prospects for building
institutional adaptive capacity. Mitigation and Adaptation Strategies for Global
Change, 14(6), 513-536.
Brown, P.J., R.S. Bradley, and F.T. Keimig, 2010: Changes in extreme climate indices
for the northeastern United States, 1870-2005. Journal of Climate, 23(14),
6555-6572.
Browne, M.J. and R.E. Hoyt, 2000: The demand for flood insurance: empirical
evidence. Journal of Risk and Uncertainty, 20(3), 291-306.
Bryant, C., B. Singh, and P. Thomassin, 2008: Evaluation of Agricultural Adaptation
Processes and Adaptive Capacity to Climate Change and Variability: The Co-
Construction of New Adaptation Planning Tools with Stakeholders and Farming
Communities in the Saguenay-Lac-Saint-Jean and Montérégie Regions of
Québec. Natural Resources Canada Climate Change Impacts and Adaptation
Program.
Buechler, S., 2009: Gender, water, and climate change in Sonora, Mexico: implications
for policies and programmes on agricultural income-generation. Gender &
Development, 17(1 SI), 51-66.
Built Environment: Infrastructure & Communities Topic Advisory Group, 2011:
Washington State Climate Change Response Strategy: Interim Recommendations
of the Built Environment: Infrastructure & Communities Topic Advisory Group
(TAG). Department of Ecology, State of Washington, Olympia, WA, USA, 53 pp.
Burch, S., 2010: Transforming barriers into enablers of action on climate change:
insights from three municipal case studies in British Columbia, Canada. Global
Environmental Change, 20(2), 287-297.

1481
North America Chapter 26
26
Bureau of Reclamation, 2007: Colorado River Interim Guidelines for Lower Basin
Shortages and Coordinated Operations for Lake Powell and Lake Mead: Final
Environmental Impact Statement. United States Department of the Interior,
Bureau of Reclamation, Upper and Lower Colorado Regions, Boulder City, NV,
USA, www.usbr.gov/lc/region/programs/strategies/FEIS/.
Bureau of Reclamation, 2013: Colorado River Basin Water Supply and Demand
Study: Final Study Reports. United States Department of the Interior, Bureau of
Reclamation, Lower Colorado Region, Boulder City, NV, USA, www.usbr.gov/lc/
region/programs/crbstudy/finalreport/index.html.
Butler, E.E. and P. Huybers, 2012: Adaptation of US maize to temperature variations.
Nature Climate Change, 3(1), 68-72.
Buttle, J., J.T. Muir, and J. Frain, 2004: Economic impacts of climate change on the
Canadian Great Lakes hydro-electric power producers: a supply analysis.
Canadian Water Resources Journal, 29(2), 89-109.
Cabas, J., A. Weersink, and E. Olale, 2010: Crop yield response to economic, site and
climate variables. Climatic Change, 101(3-4), 599-616.
Cai, X., D. Wang, and R. Laurent, 2009: Impact of climate change on crop yield: a
case study of rainfed corn in central Illinois. Journal of Applied Meteorology &
Climatology, 48(9), 1868-1881.
Cakmak, S., R.E. Dales, R.T. Burnett, S. Judek, F. Coates, and J.R. Brook, 2002: Effect
of airborne allergens on emergency visits by children for conjunctivitis and
rhinitis. Lancet, 359(9310), 947-948.
California Natural Resources Agency, 2009: 2009 California Climate Adaptation
Strategy: A Report to the Governor of the State of California in Response to
Executive Order S-13-2008. State of California, California Natural Resources
Agency, Sacramento, CA, USA, 197 pp.
Campos, M., D. Herrador, C. Manuel, and M.K. McCall, 2013: Adaptation strategies
to climate change in two rural communities in Mexico and El Salvador. Boletín
De La Asociación De Geógrafos Españoles, 61, 433-436.
Canadian Council of Professional Engineers, 2008: Adapting to Climate Change:
Canada’s First National Engineering Vulnerability Assessment of Public
Infrastructure. Canadian Council of Professional Engineers, Ottowa, ON,
Canada, 72 pp.
Carmin, J., N. Nadkarni, and C. Rhie, 2012: Progress and Challenges in Urban Climate
Adaptation Planning: Results of a Global Survey. Massachusetts Institute of
Technology (MIT), Cambridge, MA, USA, 30 pp.
Carriere, A., M. Prevost, A. Zanyadi, P. Chevalier, and B. Barbeau, 2010: Vulnerability
of Quebec drinking water treatment plants to cyanotoxins in a climate change
context. Journal of Water and Health, 8(3), 455-465.
Carroll, M.S., P.J. Cohn, T.B. Paveglio, D.R. Drader, and P.J. Jakes, 2010: Fire burners to
firefighters: the Nez Perce and fire. Journal of Forestry, 108(2), 71-76.
Cayan, D.R., K.T. Redmond, and L.G. Riddle, 1999: ENSO and hydrologic extremes in
the western United States. Journal of Climate, 12(9), 2881-2893.
Cayan, D.R., T. Das, D.W. Pierce, T.P. Barnett, M. Tyree, and A. Gershunov, 2010: Future
dryness in the southwest US and the hydrology of the early 21
st
century
drought. Proceedings of the National Academy of Sciences of the United States
of America, 107(50), 21271-21276.
CBS Chicago, 2012: City Sets July 5 Record At 103°; Heat Blamed For 2 Deaths: Two
People Dead Due To Excessive Heat. CBS News, July 5, 2012 (Updated
07/05/12), Chicago IL, USA, chicago.cbslocal.com/2012/07/05/another-day-of-
dangerous-heat-as-high-set-to-hit-103/.
CCSP, 2007: Effects of Climate Change on Energy Production and Use in the United
States [Wilbanks, T.J., V. Bhatt, D.E. Bilello, S.R. Bull, J. Ekmann, W.C. Horak, Y.J.
Huang, M.D. Levine, M.J. Sale, D.K. Schmalzer, and M.J. Scott (eds.)]. Synthesis
and Assessment Product 4.5, Report by the United States Climate Change
Science Program (CCSP) and the Subcommittee on Global Change Research,
Department of Energy, Office of Biological & Environmental Research,
Washington, DC, USA, 95 pp.
CCSP, 2008a: Analyses of the Effects of Global Change on Human Health and Welfare
and Human Systems [Gamble, J.L. (ed.), K.L. Ebi, A.E. Grambsch, F.G. Sussman,
and T.J. Wilbanks (authors)]. Synthesis and Assessment Product 4.6, Final Report
by the United States Climate Change Science Program (CCSP) and Subcommittee
on Global Change Research, United States Environmental Protection Agency
(EPA), Washington, DC, USA, 283 pp.
CCSP, 2008b: Weather and Climate Extremes in a Changing Climate: Regions of
Focus: North America, Hawaii, Caribbean and U.S. Pacific Islands [Karl, T.R., G.A.
Meehl, C.D. Miller, S.J. Hassol, A.M. Waple, and W.L. Murray (eds.)]. Synthesis
and Assessment Product 3.3, Report by the United States Climate Change
Science Program (CCSP) and the Subcommittee on Global Change Research,
Department of Commerce, NOAA’s National Climatic Data Center, Washington,
DC, USA, 162 pp.
CCSP, 2008c: Impacts of Climate Change and Variability on Transportation Systems
and Infrastructure: Gulf Coast Study, Phase I [Savonis, M.J., V.R. Burkett, and
J.R. Potter (eds.)]. Synthesis and Assessment Product 4.7, Report by the United
States Climate Change Science Program (CCSP) and the Subcommittee on Global
Change Research, Department of Transportation, Washington, DC, USA, 439 pp.
Center for Disease Control and Prevention, 2011: Surveillance for waterborne
disease outbreaks and other health events associated with recreational water
– United States, 2007-2008 and Surveillance for waterborne disease outbreaks
associated with drinking water – United States, 2007-2008. Morbidity and
Mortality Weekly Report, Surveillance Summaries, 60(12), 1-75.
Centre d’expertise hydrique du Québec, 2003: Measures Provided by the Dam
Safety Act and Regulation. Government of Quebec, Centre d’expertise hydrique
du Québec (CEHQ), Ministère du Développement durable, de l’Environnement,
de la Faune et des Parcs (MDDEFP), Quebec City, QC, Canada, www.cehq.
gouv.qc.ca/loisreglements/barrages/reglement/index-en.htm.
CEPAL: CEPAL Statistic Databases: Population, by Age Group, by Sex. Comisión
Económica para América Latina y el Caribe (CEPAL), Santiago, Chile,
interwp.cepal.org/sisgen/ConsultaIntegrada.asp?IdAplicacion=1&idTema=1&id
Indicador=31&idioma=i.
Chambers, J.Q., J.I. Fisher, H. Zeng, E.L. Chapman, D.B. Baker, and G.C. Hurtt, 2007:
Hurricane Katrina’s carbon footprint on U.S. Gulf Coast forests. Science,
318(5853), 1107.
Chang, H.H., J. Zhou, and M. Fuentes, 2010: Impact of climate change on ambient
ozone level and mortality in southeastern United States. International Journal
of Environmental Research and Public Health, 7(7), 2866-2880.
Chang, W., V.A. Lantz, and D.A. MacLean, 2009: Public attitudes about forest pest
outbreaks and control: case studies in two Canadian provinces. Forest Ecology
and Management, 257(4), 1333-1343.
Chen, C.C. and B.A. McCarl, 2009: Hurricanes and possible intensity increases: effects
on and reactions from U.S. agriculture. Journal of Agricultural and Applied
Economics, 41(1), 125-144.
Chen, F., S. Miao, M. Tewari, J.W. Bao, and H. Kusaka, 2011: A numerical study of
interactions between surface forcing and sea breeze circulations and their
effects on stagnation in the greater Houston area. Journal of Geophysical
Research: Atmospheres, 116(D12), D12105, doi:10.1029/2010JD015533.
Chen, J., J. Avise, B. Lamb, and E. Salath, 2009: The effects of global changes upon
regional ozone pollution in the United States. Atmospheric Chemistry and
Physics, 9, 1125-1141.
Chen, J., F.P. Brissette, and R. Leconte, 2011: Uncertainty of downscaling method in
quantifying the impact of climate change on hydrology. Journal of Hydrology,
401(3), 190-202.
Chen, J., W. Xu, J. Velten, Z. Xin, and J. Stout, 2012: Characterization of maize inbred
lines for drought and heat tolerance. Journal of Soil and Water Conservation,
67(5), 354-364.
Chhetri, N.B., W.E. Easterling, E. Terandoc, and L. Mearns, 2010: Modeling path
dependence in agricultural adaptation to climate variability and change. Annals
of the Association of American Geographers, 100(4), 894-907.
Chiffoleau, Y., 2009: From politics to co-operation: the dynamics of embeddedness
in alternative food supply chains. Sociologia Ruralis, 49(3), 218-235.
Chinowsky, P., J.C. Price, and J. Neumann, 2013: Assessment of climate change
adaptation costs for the U.S. road network. Global Environmental Change,
23(4), 764-773.
Chiotti, Q. and B. Lavender, 2008: Ontario. In: From Impacts to Adaptation: Canada
in a Changing Climate [Lemmen, D.S., F.J. Warren, J. Lacroix, and E. Bush (eds.)].
Government of Canada, Ottawa, ON, Canada, pp. 227-274.
Choi, W., P.F. Rasmussen, A.R. Moore, and S.J. Kim, 2009: Simulating streamflow
response to climate scenarios in central Canada using a simple statistical
downscaling method. Climate Research, 40(1), 89-102.
Chouinard, O., S. Plante, and G. Martin, 2008: The community engagement process:
a governance approach in adaptation to coastal erosion and flooding in Atlantic
Canada. Canadian Journal of Regional Science, 31(3), 507-520.
Christianson, A., T.K. McGee, and L. L’Hirondelle, 2012a: Community support for
wildfire mitigation at Peavine Métis Settlement, Alberta, Canada. Environmental
Hazards, 11(3), 177-193.
Christianson, A., T.K. McGee, and L. L’Hirondelle, 2012b: How historic and current
wildfire experiences in an Aboriginal community influence mitigation preferences.
International Journal of Wildland Fire, 24(2), 527-536.

1482
Chapter 26 North America
26
CICC, 2005: Interministerial Commission on Climate Change Terms of Reference.
Government of Mexico, Mexico City, DF, Mexico, 6 pp. (in Spanish),
www.ordenjuridico.gob.mx/ Federal/PE/APF/CI/CICC/25042005%281%29.pdf.
CICC, 2009: Programa Especial de Cambio Climatico 2009-2012. Comisión
Intersecretarial de Cambio Climatico [Interministerial Commission on Climate
Change] (CICC), Secretaria de Medio Ambiente y Recursos Naturales (SEMARNAT),
Poder Ejecutivo Federal Méxicano, Mexico City, DF, Mexico, 98 pp. (in Spanish),
http://idbdocs.iadb.org/wsdocs/getDocument.aspx?Docnum=35921662.
CICC, 2010: Marco de Políticas de Adaptación de Mediano Plazo. Elaborado en
coordinación con Grupo de Trabajo de Adaptación (GT-Adapt), Comisión
Intersecretarial de Cambio Climático (CICC) con el apoyo financiero y técnico
del Programa de las Naciones Unidas para el Desarrollo (PNUD), Gobierno
Federal de México, México, DF, México, 54 pp. (in Spanish), www.undp.org.mx/
IMG/pdf/Marco_de_Politicas_de_Adaptacion_de_Mediano_Plazo.pdf.
City of Vancouver, 2012: Climate Change Adaptation Strategy. City of Vancouver,
Vancouver, BC, Canada, 54 pp.
Clark, G.E., S.C. Moser, S.J. Ratick, K. Dow, W.B. Meyer, S. Emani, W. Jin, J.X. Kasperson,
R.E. Kasperson, and H.E. Schwarz, 1998: Assessing the vulnerability of coastal
communities to extreme storms: the case of Revere, MA., USA. Mitigation and
Adaptation Strategies for Global Change, 3(1), 59-82.
Clot, B., 2003: Trends in airborne pollen: an overview of 21 years of data in Neuchâtel
(Switzerland). Aerobiologia, 19(3), 227-234.
Coffee, J.E., J. Parzen, M. Wagstaff, and R.S. Lewis, 2010: Preparing for a changing
climate: the Chicago Climate Action Plan’s adaptation strategy. Journal of Great
Lakes Research, 36(2 Suppl.), 115-117.
Coleman, J.M.A., 2005: Assessing Stakeholder Impacts and Adaptations to Low
Water Levels in the Trent River Watershed. Master´s Thesis, University of
Waterloo, Waterloo, Ontario.
Coles, A.R. and C.A. Scott, 2009: Vulnerability and adaptation to climate change and
variability in semi-arid rural southeastern Arizona, USA. Natural Resources
Forum, 33(4), 297-309.
Collins, M.J., 2009: Evidence for changing flood risk in New England since the late
20
th
century. Journal of the American Water Resources Association, 45(2), 279-
290.
Collins, T.W., 2008: The political ecology of hazard vulnerability: marginalization,
facilitation and the production of differential risk to urban wildfires in Arizona’s
White Mountains. Journal of Political Ecology, 15, 21-43.
Collins, T.W. and B. Bolin, 2009: Situating hazard vulnerability: people’s negotiations
with wildfire environments in the US Southwest. Environmental Management,
44(3), 441-455.
Collins, T.W., S.E. Grineski, J. Chakraborty, and Y.J. McDonald, 2011: Understanding
environmental health inequalities through comparative intracategorical analysis:
racial/ethnic disparities in cancer risks from air toxics in El Paso County, Texas.
Health & Place, 17(1), 335-344.
Colten, C., R. Kates, and S. Laska, 2008: Community Resilience: Lessons from New
Orleans and Hurricane Katrina. Community and Regional Resilience Initiative
(CARRI) Research Report 3, Oak Ridge National Laboratory, Oak Ridge, TN,
USA, 31 pp.
Comfort, L.K., 2006: Cities at risk: Hurricane Katrina and the drowning of New
Orleans. Urban Affairs Review, 41(4), 501-516.
CONABIO, CONANP, The Nature Conservancy, and Pronatura, 2007: Análisis de
Vacíos y Omisiones en Conservación de la Biodiversidad Marina de México:
Océanos, Costas e Islas. Comisión Nacional para el Conocimiento y Uso de la
Biodiversidad (CONABIO), Comisión Nacional de Áreas Naturales Protegidas
(CONANP), The Nature Conservancy-Programa México, and Pronatura A.C.,
Mexico City, DF, Mexico, 129 pp.
CONAFOR, 2012: Panel 1: La sequía en terrenos forestales de México. In: Proceedings
of Seminario: Información Estadística y Geográfica para Prevenir y Mitigar los
Efectos de Sequías e Inundaciones en la Población y la Economía, November
14-15, 2012. Organized by the Instituto Nacional de Estadística y Geografía
(INEGI) and the Universidad Nacional Autónoma de México (UNAM), Mexico
City, DF, Mexico, www.inegi.org.mx/eventos/2012/sequias_inundaciones/
presentacion.aspx.
CONAGUA, 2010: Statistics on Water in Mexico, 2010 Edition [Ministry of Environment
and Natural Resources (ed.)]. National Water Commission of Mexico [Comisión
Nacional del Agua (CONAGUA)], Mexico City, DF, Mexico, 249 pp.
CONAGUA, 2011: Atlas del Agua en México. Comisión Nacional del Agua
(CONAGUA) Secretaria de Medio Ambiente y Recursos Naturales (SEMARNAT),
Mexico City, DF, Mexico, 133 pp. (in Spanish).
CONANP and The Nature Conservancy, 2009: Programa de Manejo Integral del
Fuego, Reserva de la Biosfera Selva El Ocote, Chiapas, México, 2009-2012.
Comisión Nacional de Áreas Naturales Protegidas (CONANP) and The Nature
Conservancy, Mexico City, DF, Mexico, 43 pp.
Conde, C., R. Ferrer, and S. Orozco, 2006: Climate change and climate variability
impacts on rainfed agricultural activities and possible adaptation measures.
Atmosfera, 19(3), 181-194.
Conrad, E., 2010: Climate change and infrastructure in the Gulf of Mexico and
Caribbean Basin: new risks to building blocks of resilience. In: Commissioned
Papers Briefing Book for ‘Fighting for Survival: The Vulnerability of America’s Gulf
Coast and the Caribbean Basin Conference, August 25-26, 2010, New Orleans,
Louisiana’. Earth Institute, Columbia University, New York, NY, USA, pp. 63-86.
Cooper, D.C. and G. Sehlke, 2012: Sustainability and energy development: influences
of greenhouse gas emission reduction options on water use in energy production.
Environmental Science & Technology, 46(6), 3509-3518.
Cooper, M.J.P., M.D. Beevers, and M. Oppenheimer, 2008: The potential impacts of
sea level rise on the coastal region of New Jersey, USA. Climatic Change, 90(4),
475-492.
Costello, C.J., O. Deschênes, and C.D. Kolstad, 2009: Economic Impacts of Climate
Change on California Agriculture. Paper from the California Climate Change
Center, California Energy Commission, Santa Barbara, CA, USA, 41 pp.
Craft, J. and M. Howlett, 2013: Policy capacity and the ability to adapt to climate change:
Canadian and US case studies. Review of Policy Research, 30(1 SI), 1-18.
Craine, J.M., A.J. Elmore, K.C. Olson, and D. Tollesons, 2010: Climate change and
cattle nutritional stress. Global Change Biology, 16(10), 2901-2911.
Crawford, W., D. Johannessen, F. Whitney, R. Birch, K. Borg, D. Fissel, and S. Vagle,
2007: Appendix C: Physical and chemical oceanography. In: Ecosystem
Overview: Pacific North Coast Integrated Management Area (PNCIMA) [Lucas,
B.G., S. Verrin, and R. Brown (eds.)]. Canadian Technical Report of Fisheries and
Aquatic Sciences 2667, Institute of Ocean Sciences, Sidney, BC, Canada,
www.pncima.org/media/documents/pncima-publications/pncima_eoar_
328842_c_oceanography.pdf.
CRED, 2012: EM-DAT: The International Disaster Data Base. Centre for Research on
the Epidemiology of Disasters (CRED), School of Public Health, Université
catholique de Louvain, Brussels, Belgium, www.emdat.be/.
Croci, E., S. Melandri, and T. Molteni, 2010: A Comparative Analysis of Global City
Policies in Climate Change Mitigation: London, New York, Milan, Mexico City
and Bangkok. IEFE Working Paper No. 32, The Center for Research on Energy
and Environmental Economics and Policy (IEFE) at Bocconi University, Milan,
Italy, 37 pp.
Cross, M.S., E.S. Zavaleta, D. Bachelet, M.L. Brooks, C.A.F. Enquist, E. Fleishman, L.
Graumlich, C.R. Groves, L. Hannah, L. Hansen, G. Hayward, M. Koopman, J.
Lawler, J.R. Malcolm, J. Nordgren, B. Petersen, E.L. Rowland, D. Scott, S.L. Shafer,
M.R. Shaw, and G.M. Tabor, 2012: The Adaptation for Conservation Targets
(ACT) framework: a tool for incorporating climate change into natural resource
management. Environmental Management, 50(3), 341-351.
Cross, M.S., P.D. McCarthy, G. Garfin, D. Gori, and C.A. Enquist, 2013: Accelerating
adaptation of natural resource management to address climate change.
Conservation Biology, 27(1), 4-13.
Crozier, L.G., R.W. Zabel, and A. Hamlet, 2008: Predicting differential effects of climate
change at the population level with life-cycle models of spring Chinook salmon.
Global Change Biology, 14(2), 236-249.
Cueva-Luna, T.E., R. Few, and A. Mercado, 2011: Afrontando el cambio climático y
los riesgos contra la salud: respuestas en la Sierra Tarahumara [Coping with
climate change and health risks: responses in the Sierra Tarahumara]. Estudios
Demográficos Y Urbanos, 26(3), 671-708 (in Spanish).
Cuo, L., D.P. Lettenmaier, M. Alberti, and J.E. Richey, 2009: Effects of a century of land
cover and climate change on the hydrology of the Puget Sound basin.
Hydrological Processes, 23(6), 907-933.
Curriero, F.C., J.A. Patz, J.B. Rose, and S. Lele, 2001: The association between extreme
precipitation and waterborne disease outbreaks in the United States, 1948-
1994. American Journal of Public Health, 91(8), 1194-1199.
Cutter, S.L. and C. Emrich, 2005: Are natural hazards and disaster losses in the US
increasing? EOS, Transactions American Geophysical Union, 86(41), 381-396.
Cutter, S.L., B.J. Boruff, and W.L. Shirley, 2003: Social vulnerability to environmental
hazards. Social Science Quarterly, 84(2), 242-261.
Cutter, S.L., L. Barnes, M. Berry, C. Burton, E. Evans, E. Tate, and J. Webb, 2008: A
place-based model for understanding community resilience to natural disasters.
Global Environmental Change, 18(4), 598-606.

1483
North America Chapter 26
26
Cutter, S.L., W. Solecki, N. Bragado, J. Carmin, M. Fragkias, M. Ruth, and T. Wilbanks,
2013: Chapter 11 – Urban systems, infrastructure, and vulnerability. In: Climate
Change Impacts in the United States: The Third National Climate Assessment:
Draft for Public Review [Melillo, J.M., T. Richmond, and G.W. Yohe (eds.)].
National Climate Assessment and Development Advisory Committee (NCADAC),
United States Global Change Research Program, Washington, DC, USA,
www.globalchange.gov/sites/globalchange/files/NCAJan11-2013-publicreview
draft-chap11-urban.pdf .
Dai, A., 2011: Drought under global warming: a review. Wiley Interdisciplinary
Reviews: Climate Change, 2(1), 45-65.
Daley, M.L., J.D. Potter, and W.H. McDowell, 2009: Salinization of urbanizing New
Hampshire streams and groundwater: effects of road salt and hydrologic
variability. Journal of the North American Benthological Society, 28(4), 929-940.
Das, T., M.D. Dettinger, D.R. Cayan, and H.G. Hidalgo, 2011: Potential increase in
floods in California’s Sierra Nevada under future climate projections. Climatic
Change, 109(1), 71-94.
Davis, J.B., 2004: The Healthy Forests Initiative: unhealthy policy choices in forest
and fire management. Environmental Law, 34(4), 1209-1245.
Daw, T., W.N. Adger, K. Brown, and M.-C. Badjeck, 2009: Climate change and capture
fisheries: potential impacts, adaptation and mitigation. In: Climate Change
Implications for Fisheries andAquaculture: Overview of Current Scientific
Knowledge [Cochrane, K., C. De Young, D. Soto, and T. Bahri (eds.)]. FAO
Fisheries and Aquaculture Technical Paper, No. 530, Food and Agricultural
Organization of the United Nations (FAO), Rome, Italy, pp. 107-150.
DeGaetano, A.T., 2009: Time-dependent changes in extreme-precipitation return-
period amounts in the continental United States. Journal of Applied Meteorology
and Climatology, 48(10), 2086-2099.
Degallier, N., C. Favier, C. Menkes, M. Lengaigne, W.M. Ramalho, R. Souza, J. Servain,
and J.P. Boulanger, 2010: Toward an early warning system for dengue prevention:
modeling climate impact on dengue transmission. Climatic Change, 98, 581-592.
Delfino, R.J., 2002: Epidemiologic evidence for asthma and exposure to air toxics:
linkages between occupational, indoor, and community air pollution research.
Environmental Health Perspectives, 110(4 Suppl.), 573-589.
Delpla, I., A.-V. Jung, E. Baures, M. Clement, and O. Thomas, 2009: Impacts of climate
change on surface water quality in relation to drinking water production.
Environment International, 35(8), 1255-1233.
Deschênes, O., M. Greenstone, and J. Guryan, 2009: Climate change and birth weight.
American Economic Review: Papers & Proceedings, 99(2), 211-217.
Desrochers, G., R. Roy, L. Roy, G. Pasher, F. Guay, and D. Tapsoba, 2009: Comparing
methods to investigate the impacts of climate change. In: Proceedings of 2009
AWRA Spring Specialty Conference: Managing Water Resources Development
in a Changing Climate, May 4-5, 2009, Anchorage, AK, USA, Session 29: Water
Supply Management II. Organized by the American Water Resources Association
(AWRA), Middleburg, VA, USA, www.awra.org/meetings/Anchorage2009/doc/
Sess%2029%20Abs.pdf.
DGCS, 2012: Por Efectos de la Sequía, más de Dos Millones de Mexicanos Están en
Riesgo de Hambruna. Boletín DGCS-053-UNAM Ciudad Universitaria, Direccion
General de Comunicacion Social (DGCS), Universidad Nacional Autónoma de
México, Mexico City, DF, Mexico (in Spanish), www.dgcs.unam.mx/boletin/
bdboletin/2012_053.html.
Diario Oficial de la Federación, 2012: Ley General de Cambio Climático CÁMARA
DE DIPUTADOS DEL H. CONGRESO DE LA UNIÓN. Secretaría General, Secretaría
de Servicios Parlamentarios, Dirección General de Servicios de Documentación,
Información y Análisis, Cuidad Mexico, 45 pp., www.diputados.gob.mx/Leyes
Biblio/pdf/LGCC.pdf.
Diffenbaugh, N.S. and C.B. Field, 2013: Changes in ecologically critical terrestrial
climate conditions. Science, 341(6145), 486-491.
Diffenbaugh, N.S. and F. Giorgi, 2012: Climate change hotspots in the CMIP5 global
climate model ensemble. Climatic Change, 114(3-4), 813-822.
Diffenbaugh, N.S. and M. Scherer, 2011: Observational and model evidence of global
emergence of permanent, unprecedented heat in the 20
th
and 21
st
centuries.
Climatic Change, 107(3-4), 615-624.
Diffenbaugh, N.S., M. Ashfaq, and M. Scherer, 2011: Transient regional climate
change: analysis of the summer climate response in a high-resolution, century-
scale, ensemble experiment over the continental United States. Journal of
Geophysical Research, 116(D24), D24111, doi:10.1029/2011JD016458.
Diffenbaugh, N.S., M. Scherer, and M. Ashfaq, 2012: Response of snow-dependent
hydrologic extremes to continued global warming. Nature Climate Change,
3(4), 349-384.
Dirmeyer, P.A., Y. Jin, B. Singh, and X. Yan, 2013: Evolving land-atmosphere interactions
over North America from CMIP5 simulations. Journal of Climate, 26(19), 7313-
7327.
Diuk-Wasser, M.A., G. Vourc’h, P. Cislo, A.G. Hoen, F. Melton, S.A. Hamer, M. Rowland,
R. Cortinas, G.J. Hickling, J.I. Tsao, A.G. Barbour, U. Kitron, J. Piesman, and D. Fish,
2010: Field and climate-based model for predicting the density of host-seeking
nymphal Ixodes scapularis, an important vector of tick-borne disease agents in
the eastern United States. Global Ecology and Biogeography, 19(4), 504-514.
DOE-PI, 2013: U.S. Energy Sector Vulnerabilitiesto Climate Change and Extreme
Weather. United States Department of Energy’s Office of Policy and International
Affairs (DOE-PI) and the National Renewable Energy Laboratory (NREL), DOE-
PI, Washington, DC, USA and NREL, Golden, CO, USA, 82 pp.
Dolfman, M.L., S. Fortier Wasser, and B. Bergman, 2007: The effects of Hurricane
Katrina on the New Orleans economy. Monthly Labor Review, 130, 3-18.
Dombeck, M.P., J.E. Williams, and C.A. Wood, 2004: Wildfire policy and public lands:
integrating scientific understandings with social concerns across landscapes.
Conservation Biology, 18(4), 883-889.
Doney, S.C., V.J. Fabry, R.A. Feely, and J.A. Kleypas, 2009: Ocean acidification: the
other CO
2
problem. Annual Review of Marine Science, 1, 169-192.
Douglas, E.M., P.H. Kirshen, M. Paolisso, C. Watson, J. Wiggin, A. Enrici, and M. Ruth,
2012: Coastal flooding, climate change and environmental justice: identifying
obstacles and incentives for adaptation in two metropolitan Boston communities.
Mitigation and Adaptation Strategies for Global Change, 17(5), 537-562.
Downing, A. and A. Cuerrier, 2011: A synthesis of the impacts of climate change on
the First Nations and Inuit of Canada. Indian Journal of Traditional Knowledge,
10(1), 57-70.
Doyle, M.W., E.H. Stanley, D.G. Havlick, M.J. Kaiser, G. Steinbach, W.L. Graf, G.E.
Galloway, and J.A. Riggsbee, 2008: Aging infrastructure and ecosystem
restoration. Science, 319(5861), 286-287.
Drake, B.G., L. Hughes, E.A. Johnson, B.A. Seibel, M.A. Cochrane, V.J. Fabry, D. Rasse, and
L. Hannah, 2005: Synergistic effects. In: Climate Change and Biodiversity [Lovejoy,
T.E. and L.J. Hannah (ed.)]. Yale University Press, New Haven, CT, USA, pp. 296-316.
Duffy, P. and C. Tebaldi, 2012: Increasing prevalence of extreme summer temperatures
in the US. Climatic Change, 111(2), 487-495.
Dukes, J.S., N.R. Chiariello, S.R. Loarie, and C.B. Field, 2011: Strong response of an
invasive plant species (Centaurea solstitialis L.) to global environmental
changes. Ecological Applications, 21(6), 1887-1894.
Dumais, D. and M. Prévost, 2007: Management for red spruce conservation in
Québec: the importance of some physiological and ecological characteristics –
a review. The Forestry Chronicle, 83(3), 378-392.
Dupuis, A.P. and B.J. Hann, 2009: Warm spring and summer water temperatures in small
eutrophic lakes of the Canadian prairies: potential implications for phytoplankton
and zooplankton. Journal of Plankton Research, 31(5), 489-502.
DWR, 2009: California Water Plan Update 2009: Bulletin 160-09. State of California,
California Natural Resources Agency, Department of Water Resources (DWR),
Sacramento, CA, USA, www.waterplan.water.ca.gov/cwpu2009/.
Dwyer, B., B. Harding, E. Wilson, M. Brown, J. Pearce, and J. Smith, 2012: Colorado
River Water Availability Study: Phase I Report. Colorado Water Conservation
Board (CWCB) in association with AMEC Earth & Environmental, Canyon Water
Resources, Leonard Rice Engineers, Inc., and Stratus Consulting, CWCB, Denver,
CO, USA, 189 pp.
Eakin, H., 2006: Weathering Risk in Rural Mexico: Climatic, Institutional, and
Economic Change. University of Arizona Press, Tuscon, AZ, USA, 242 pp.
Eakin, H. and K. Appendini, 2008: Livelihood change, farming, and managing flood
risk in the Lerma Valley, Mexico. Agriculture and Human Values, 25(4), 555-566.
Eakin, H.C. and A. Patt, 2011: Are adaptation studies effective, and what can enhance
practical impact? Wiley Interdisciplinary Review: Climatic Change, 2(2), 141-153.
Eakin, H. and C. Tucker, 2006: Responding to the coffee crisis: a pilot study of farmers’
adaptations in Mexico, Guatemala and Honduras. The Geographical Journal,
172(2), 156-171.
Eakin, H., A. Winkels, and J. Sendzimir, 2009: Nested vulnerability: exploring cross-
scale linkages and vulnerability teleconnections in Mexican and Vietnamese
coffee systems. Environmental Science and Policy, 12(4), 398-412.
Eakin, H., A.M. Lerner, and F. Murtinho, 2010: Adaptive capacity in evolving peri-
urban spaces: responses to flood risk in the Upper Lerma River Valley, Mexico.
Global Environmental Change, 20(1), 14-22.
Ebi, K.L., 2011: Resilience to the health risks of extreme weather events in a changing
climate in the United States. International Journal of Environmental Research
and Public Health, 8(12), 4582-4595.

1484
Chapter 26 North America
26
Ebi, K.L., J. Balbus, P.L. Kinney, E. Lipp, D. Mills, M.S. O’Neill, and M. Wilson, 2008:
Chapter 2: Effects of global change on human health. In: Analyses of the Effects
of Global Change on Human Health and Welfare and Human Systems [Gamble,
J.L. (ed.), K.L. Ebi, F.G. Sussman, and T.J. Wilbanks, (authors)]. Report by the
United States Climate Change Science Program (CCSP) and Subcommittee on
Global Change Research, United States Environmental Protection Agency (EPA),
Washington, DC, USA, pp. 2-1 to 2-78.
Emberlin, J., M. Detandt, R. Gehrig, S. Jaeger, N. Nolard, and A. Rantio-Lehtimäki,
2002: Responses in the start of Betula (birch) pollen seasons to recent changes
in spring temperatures across Europe. International Journal of Biometeorology,
46(4), 159-170.
Emelko, M.B., U. Silins, K.D. Bladon, and M. Stone, 2011: Implications of land disturbance
on drinking water treatability in a changing climate: demonstrating the need for
“source water supply and protection” strategies. Water Research, 45(2), 461-472.
EIA, 2013: Annual Energy Outlook 2013. U.S. Energy Information Administration (EIA),
United States Department of Energy, Washington, DC, USA, 233 pp.
Energy, Mines and Resources, 2012: Forest Health Report 2012. Government of
Yukon, Energy, Mines and Resources, Forest Management Branch, Whitehorse,
YT, Canada, pp. 8-15.
Environment Canada, 2011: Backgrounder: Canada’s Ongoing Commitment to
Climate Change Adaptation. Government of Canada, Ottawa, ON, Canada,
ec.gc.ca/default.asp?lang=En&n=2D1D6FA7-1&news=B67A7995-A1CA-4DE3-
89D2-E4E3C0E24BFB.
Environment Canada, 2013a: Water Availability: Indicator Initiative. Government
of Canada, Ottawa, ON, Canada, www.ec.gc.ca/eau-water/default.asp?lang=
En&n=2DC058F1-1.
Environment Canada, 2013b: Regional Freshwater Quality in Canadian Rivers.
Government of Canada, Ottawa, ON, Canada, www.ec.gc.ca/indicateurs-
indicators/default.asp?lang=En&n=1C71AB61-1.
EPA, 2008: Review of the Impacts of Climate Variability and Change on Aeroallergens
and Their Associated Effects. EPA/600/R-06/164F, Global Change Research
Program (GCRP), National Center for Environmental Assessment, Office of
Research and Development (ORD), United States Environmental Protection
Agency (EPA), Washington, DC, USA, 125 pp.
EPA, 2009: National Water Quality Inventory: Report to Congress for the 2004
Reporting Cycle. EPA 841-R-08-001, Office of Water, United States Environmental
Protection Agency (EPA), Washington, DC, USA, 37 pp.
EPA 2011: U.S. EPA National Water Program Strategy: Response to Climate Change
2010-2011 National and Regional Highlights of Progress. United States
Environmental Protection Agency (EPA) National Water Program, Washington,
DC, USA, 20 pp.
EPA 2012: Climate Change Indicators in the United States, 2012. Second Edition.
United States Environmental Protection Agency (EPA), Office of Atmospheric
Programs, Climate Change Division, Washington, DC, USA, 81 pp.
EPA and SEMARNAT, 2012: U.S.-Mexico Environmental Program: Border 2012: A Mid-
Course Refinement (2008-2012). EPA-909-R-08-003, United States Environmental
Protection Agency (EPA), Washington, DC, USA, and Secretaría de Medio
Ambiente y Recursos Naturales (SEMARNAT), Mexico City, Mexico, 18 pp.
Epstein, P., 2010: The ecology of climate change and infectious diseases: comment.
Ecology, 91(3), 925-928.
Escolero-Fuentes, O.A., S.E. Martínez, S. Kralisch, and M. Perevochtchikova, 2009:
Vulnerabilidad de las Fuentes de Abastecimiento de Agua Potable de la Ciudad
de México en el Contexto de Cambio Climático. Centro Virtual de Cambio
Climático Ciudad de México (CVCCCM), Instituto de Ciencia y Tecnología del
Distrito Federal (ICyTDF), Centro de Ciencias de la Atmósfera-UNAM, Instituto
de Geología-UNAM, and the Universidad Nacional Autónoma de México
(UNAM), Mexico City, DF, Mexico, 164 pp. (in Spanish).
Euripidou, E. and V. Murray, 2004: Public health impacts of floods and chemical
contamination. Journal of Public Health, 26(4), 376-383.
Executive Office of the President, 2013: The President’s Climate Action Plan. The
White House, Washington, DC, USA, 21 pp.
Feagin, R.A., D.J. Sherman, and W.E. Grant, 2005: Coastal erosion, global sea-level
rise, and the loss of sand dune plant habitats. Frontiers in Ecology and the
Environment, 3(7), 359-364.
FEMA, 2013: Questions about the Biggert-Waters Flood Insurance Reform Act of 2012.
Federal Emergency Management Agency (FEMA), United States Department of
Homeland Security, Washington, DC, USA, 4 pp.
Few, R., K. Brown, and E.L. Tompkins, 2007: Public participation and climate change
adaptation: avoiding the illusion of inclusion. Climate Policy, 7(1), 46-59.
Field, C.B., L.D. Mortsch, M. Brklacich, D.L. Forbes, P. Kovacs, J.A. Patz, S.W. Running, and
M.J. Scott, 2007: North America. In: Climate Change 2007: Impacts, Adaptation
and Vulnerability. Contribution of Working Group II to the Fourth Assessment
Report of the Intergovernmental Panel on Climate Change [Parry, M.L., O.F.
Canziani, J.P. Paulikof, P.J. van der Linden, and C.E. Hanson (eds.)]. Cambridge
University Press, Cambridge, UK and New York, NY, USA, pp. 617-652.
Findell, K.L. and T.L. Delworth, 2010: Impact of common sea surface temperature
anomalies on global drought and pluvial frequency. Journal of Climate, 23(3),
485-503.
Fischlin, A., G.F. Midgley, J.T. Price, R. Leemans, B. Gopal, C. Turley, M.D.A. Rounsevell,
O.P. Dube, J. Tarazona, and A.A. Velichko, 2007: Ecosystems, their properties,
goods, and services. In: Climate Change 2007: Impacts, Adaptation and
Vulnerability. Contribution of Working Group II to the Fourth Assessment Report
of the Intergovernmental Panel on Climate Change [Parry, M.L., O.F. Canziani,
J.P. Palutikof, P.J. van der Linden and C.E. Hanson (ed.)]. Cambridge University
Press, Cambridge, UK and New York, NY, USA, pp. 211-272.
Flint, C.G., B. McFarlane, and M. Miller, 2008: Human dimensions of forest disturbance
by insects: an international synthesis. Environmental Management, 43(6),
1174-1186.
Flood, J.F. and L.B. Cahoon, 2011: Risks to coastal wastewater collection systems
from sea-level rise and climate change. Journal of Coastal Research, 27(4),
652-660.
Follett, R.F. and D.A. Reed, 2010: Soil carbon sequestration in grazing lands: societal
benefits and policy implications. Rangeland Ecology and Management, 63(1),
4-15.
FAO, 2009: FAOSTAT: Countries by Commodity: Wheat. Food and Agriculture
Organization of the United Nations (FAO), Rome, Italy, faostat3.fao.org/
faostat-gateway/go/to/home/E.
FAO, 2012: Forest Management and Climate Change: A Literature Review. Forests
and Climate Change Working Paper 10, Food and Agriculture Organization of
the United Nations (FAO), Rome, Italy, 45 pp.
Flores Verdugo, F.J., P. Moreno-Casasola, G. De La Lanza-Espino, and C. Agraz
Hernández, 2010: El manglar, otros humedales costeros y el cambio climático.
In: Vulnerabilidad de las Zonas Costeras Mexicanas ante el Cambio Climático
[Botello, A.V., S. Villanueva, J. Gutiérrez, and J. L. Rojas Galaviz (eds.)]. Gobierno
del Estado de Tabasco, SEMARNAT-INE, UNAM-ICMyL, and Universidad
Autónoma de Campeche, Centro epomex, Universidad Autónoma de
Campeche, Campeche, México, pp.165-188, http://etzna.uacam.mx/epomex/
publicaciones/vulnerabilidad/vulnerabilidad_CCParte1.pdf.
Forbes, K.A., S.W. Kienzle, C.A. Coburn, J.M. Byrne, and J. Rasmussen, 2011: Simulating
the hydrological response to predicted climate change on a watershed in
southern Alberta, Canada. Climatic Change, 105(3-4), 555-576.
Ford, J.D., T. Pearce, J. Prno, F. Duerden, L.B. Ford, M. Beaumier, and T. Smith, 2010a:
Perceptions of climate change risks in primary resource use industries: a survey
of the Canadian mining sector. Regional Environmental Change, 10(1), 65-81.
Ford, J.D., T. Pearce, F. Duerden, C. Furgal, and B. Smit, 2010b: Climate change policy
responses for Canada’s Inuit population: the importance of and opportunities
for adaptation. Global Environmental Change, 20(1), 177-191.
Ford, J.D., T. Pearce, J. Prno, F. Duerden, L.B. Ford, T.R. Smith, and M. Beaumier, 2011:
Canary in a coal mine: perceptions of climate change risks and response options
among Canadian mine operations. Climatic Change, 109(3-4), 399-415.
Frank, E., H. Eakin, and D. Lopez-Carr, 2010: Risk perception and adaptation to
climate risk in the coffee sector of Chiapas, Mexico. In: Proceedings of Tropentag
2010: “World Food System –A Contribution from Europe,” Conference on
International Research on Food Security, Natural Resource Management and
Rural Development, ETH Zurich, September 14-16, Zurich, Switzerland, Value
Chains –Poster Session I. Organised by the universities of Bonn, Göttingen,
Hohenheim, Kassel (Witzenhausen), Hamburg, and ETH Zurich, and the Council
for Tropical and Subtropical Research (ATSAF e.V.) in co-operation with the GTZ
Advisory Service on Agricultural Research for Development (BEAF), North-South
Centre, ETH Zurich, Switzerland, 4 pp., www.tropentag.de/2010/abstracts/
abstracts.php?showtime=0&noID=1&menu=11#Subgroup_5f.
Fraser, E.D.G., E. Simelton, M. Termansen, S.N. Gosling, and A. South, 2013:
“Vulnerability hotspots”: integrating socio-economic and hydrological models
to identify where cereal production may decline in the future due to climate
change induced drought. Agricultural and Forest Meteorology, 170, 195-205.
Frazier, T.G., N. Wood, B. Yarnal, and D.H. Bauer, 2010: Influence of potential sea level
rise on societal vulnerability to hurricane storm-surge hazards, Sarasota County,
Florida. Applied Geography, 30(4), 490-505.

1485
North America Chapter 26
26
Frei, T. and E. Gassner, 2008: Climate change and its impact on birch pollen quantities
and the start of the pollen season an example from Switzerland for the period
1969-2006. International Journal of Biometeorology, 52(7), 667-674.
Fried, J.S., J.K. Gilless, W.J. Riley, T.J. Moody, C. Simon de Blas, K. Hayhoe, M. Moritz,
S. Stephens, and M. Torn, 2008: Predicting the effect of climate change on
wildfire behavior and initial attack success. Climatic Change, 87(1), 251-264.
Friesinger, S. and P. Bernatchez, 2010: Perceptions of Gulf of St. Lawrence coastal
communities confronting environmental change: hazards and adaptation,
Quebec, Canada. Ocean and Coastal Management, 53(11), 669-678.
Fuchs, A. and H. Wolff, 2010: Concept and unintended consequences of weather
index insurance: the case of Mexico. American Journal of Agricultural Economics,
93(2), 505-511.
Furgal, C. and T.D. Prowse, 2008: Northern Canada. In: From Impacts to Adaptation:
Canada in a Changing Climate 2007 [Lemmen, D.S., F.J. Warren, J. Lacroix, and
E. Bush (eds.)]. Government of Canada, Ottawa, ON, Canada, pp. 57-118.
Galindo, I., S. Castro, and M. Valdés, 2009: Satellite derived solar irradiance over
Mexico. Atmósfera, 4(3), 189-201.
Galindo, L.M., 2009: The Economics of Climate Change in Mexico: Synopsis. Secretaría
de Medio Ambiente y Recursos Naturales (SEMARNAT) and Secretaría de
Hacienda y Crédito Público (SHCP), Mexico City, DF, Mexico, 67 pp.
Gallagher, J., 2012: Learning about an Infrequent Event: Evidence from Flood
Insurance Take-Up in the US. Department of Economics, Weatherhead School
of Management, Case Western Reserve University, Cleveland, OH, USA, 66 pp.
Gallivan, F., K. Bailey, and L. O’Rourke, 2009: Planning for impacts of climate change
at US ports. Transportation Research Record: Journal of the Transportation
Research Board, 2100, 15-21.
Galloway McLean, K., A. Ramos-Castillo, and J.T. Rubis (eds.), 2011: Indigenous Peoples,
Marginalized Populations and Climate Change:Vulnerability, Adaptation and
Traditional Knowledge. IPMPCC/2011/MEX/3/REPORT, IPMPCC Meeting Report
of the Expert Workshop on Indigenous Peoples, Marginalized Populations and
Climate Change, July 19-21, 2011, Mexico City, DF, Mexico, Co-convened by
the United Nations University (UNU), Intergovernmental Panel on Climate
Change (IPCC), United Nations Educational, Scientific and Cultural Organization
(UNESCO), Secretariat of the Convention on Biological Diversity (CBD), United
Nations Development Program (UNDP)/GEF Small Grants Programme, and
Mexican National Institute of Ecology, United Nations University-Institute of
Advanced Studies: Traditional Knowledge Initiative, Darwin, NT, Australia and
UNESCO-Local and Indigenous Knowledge Systems (LINKS) Programme, Paris,
France, 49 pp., www.unutki.org/downloads/File/2011_IPMPCC_Mexico_
Workshop_Summary_Report-Final.pdf.
GAO, 2007: Port Risk Management: Additional Federal Guidance Would Aid Ports in
Disaster Planning and Recovery. United States Government Accountability
Office (GAO) Report to Congressional Committees (GAO-07-412), GAO,
Washington, DC, USA, 53 pp.
GAO, 2009: Climate Change Adaptation: Strategic Federal Planning Could Help
Government Officials Make More Informed Decisions. United States Government
Accountability Office (GAO) Report to the Chairman of the Select Committee
on Energy Independence and Global Warming, House of Representatives, GAO,
Washington, DC, USA, 81 pp.
Gasper, R., A. Blohm, and M. Ruth, 2011: Social and economic impacts of climate change
on the urban environment. Current Opinion in Environmental Sustainability, 3(3),
150-157.
Gay, C., F. Estrada, C. Conde, H. Eakin, and L. Villers, 2006: Potential impacts of climate
change on agriculture: a case of study of coffee production in Veracruz, Mexico.
Climatic Change, 79(3-4), 259-288.
Gazeau, F., C. Quiblier, J.M. Jansen, J. Gattuso, J.J. Middelburg, and C.H. Heip, 2007:
Impact of elevated CO
2
on shellfish calcification. Geophysical Research Letters,
34(7), L07603, doi:10.1029/2006GL028554.
Georgakakos, A., P. Fleming, M. Dettinger, C. Peters-Lidgard, T.C. Richmond, K.
Reckhow, K. White, and D. Yates, 2013: Chapter 3: Water resources. In: Climate
Change Impacts in the United States: The Third National Climate Assessment:
Draft for Public Review [Melillo, J.M., T. Richmond, and G.W. Yohe (eds.)].
National Climate Assessment and Development Advisory Committee
(NCADAC), United States Global Change Research Program, Washington, DC,
USA, www.globalchange.gov/sites/globalchange/files/NCAJan11-2013-public
reviewdraft-chap3-water.pdf.
Georgescu, M., D.B. Lobell, and C.B. Field, 2011: Direct climate effects of perennial
bioenergy crops in the United States. Proceedings of the National Academy of
Sciences of the United States of America, 108(11), 4307-4312.
Getches, D.H., 2003: Water management in the United States and the fate of the
Colorado River Delta in Mexico. United States-Mexico Law Journal, 11, 107-
113.
Girardin, M.P. and D. Sauchyn, 2008: Three centuries of annual area burned variability
in northwestern North America inferred from tree rings. The Holocene, 18(2),
205-214.
Girardin, M.P., A.A. Ali, C. Carcaillet, M. Mudelsee, I. Drobyshev, C. Hély, and Y. Bergeron,
2009: Heterogeneous response of circumboreal wildfire risk to climate change
since the early 1900s. Global Change Biology, 15(11), 2751-2769.
Girardin, M.P., A.A. Ali, C. Carcaillet, S. Gauthier, C. Hély, H. Le Goff, A. Terrier, and Y.
Bergeron, 2012: Fire in managed forests of eastern Canada: risks and options.
Forest Ecology and Management, 294, 238-249.
Gleeson, J., P. Gray, A. Douglas, C.J. Lemieux, and G. Nielsen, 2011: A Practitioner’s
Guide to Climate Change Adaptation in Ontario’s Ecosystems. Ontario Centre
for Climate Impacts and Adaptation Resources, Sudbury, ON, Canada, 74 pp.
Glick, P. and B.A. Stein, 2011: Scanning the Conservation Horizon: A Guide to Climate
Change Vulnerability Assessment. National Wildlife Federation, Washington,
DC, USA, 168 pp.
Gómez-Álvarez, A., J.L. Valenzuela-García, D. Meza-Figueroa, M. de la O-Villanueva,
J. Ramírez-Hernández, J. Almendariz-Tapia, and E. Pérez-Segura, 2011: Impact
of mining activities on sediments in a semi-arid environment: San Pedro River,
Sonora, Mexico. Applied Geochemistry, 26(12), 2101-2112.
Gómez Díaz, J.D., A.I. Monterroso Rivas, J.A.Tinoco Rueda, M.L.Toledo Medrano, C.
Conde Álvarez, and C. Gay García, 2011: Assessing current and potential
patterns of 16 forest species driven by climate change scenarios in México.
Atmósfera, 24(1), 31-52.
Gómez-Mendoza, L. and L. Arriaga, 2007: Modeling the effect of climate change on
the distribution of oak and pine species of Mexico. Conservation Biology, 21(6),
1545-1555.
Gong, H., A.T. DeGaetano, and L.C. Harrington, 2011: Climate-based models for West
Nile Culex mosquito vectors in the Northeastern US. International Journal of
Biometeorology, 55(3), 435-436.
González Martínez, E., 2006: Plan Rector de la Cafeticultura Nacional. Sistema
Producto Cafe Nacional, La Secretaría de Agricultura, Ganadería, Desarrollo
Rural, Pesca y Alimentación, Mexico City, DF, Mexico.
Goujon, A., W. Lutz, and W.C. Sanderson, 2004: Future human capital: population
projections by level of education. In: The End of World Population Growth in
the 21
st
Century: New Challenges for Human Capital Formation and Sustainable
Development [Lutz, W., W.C. Sanderson, and S. Scherbov (eds.)]. Earthscan,
London, UK, pp. 121-141.
Government of Canada, 2011: Federal Adaptation Policy Framework. Environment
Canada, Gatineau, QC, Canada, 8 pp.
Government of Quebec, 2012: Québec in Action: Greener by 2020: 2013-2020
Government Strategy for Climate Change Adaptation. Government of Quebec,
Quebec City, QC, Canada, 40 pp.
Gramig, B.M., J.M. Barnard, and L.S. Prokopy, 2013: Farmer beliefs about climate
change and carbon sequestration incentives. Climate Research, 56, 157-167.
Greer, A., V. Ng, and D. Fisman, 2008: Climate change and infectious diseases in
North America: the road ahead. Canadian Medical Association Journal, 178(6),
715-722.
Grenzeback, L. and A. Luckmann, 2006: Case Study of the Transportation Sector’s
Response to and Recovery from Hurricanes Katrina and Rita. Transportation
Research Board (TRB), Washington, DC, USA, 44 pp.
Groffman, P.M., P. Kareiva, S. Carter, N.B. Grimm, J.J. Lawler, M. Mack, V. Matzek, and
H. Tallis, 2013: Chapter 8: Ecosystems, biodiversity and ecosystem services. In:
Climate Change Impacts in the United States: The Third National Climate
Assessment: Draft for Public Review [Melillo, J.M., T. Richmond, and G.W. Yohe
(eds.)]. National Climate Assessment and Development Advisory Committee
(NCADAC), United States Global Change Research Program, Washington, DC,
USA, www.globalchange.gov/sites/globalchange/files/NCAJan11-2013-public
reviewdraft-chap8-ecosystems.pdf.
Groisman, P.Y., B.G. Sherstyukov, V.N. Razuvaev, R.W. Knight, J.G. Enloe, N.S.
Stroumentova, P.H. Whitfield, E. Førland, I. Hannsen-Bauer, and H. Tuomenvirta,
2007: Potential forest fire danger over Northern Eurasia: changes during the
20
th
century. Global and Planetary Change, 56(3), 371-386.
Gude, P., R. Rasker, and J. van den Noort, 2008: Potential for future development on
fire-prone lands. Journal of Forestry, 106(4), 198-205.
Hajat, S. and T. Kosatsky, 2010: Heat-related mortality: a review and exploration of
heterogeneity. Journal of Epidemiology and Community Health, 64(9), 753-760.

1486
Chapter 26 North America
26
Halofsky, J.E., D.L. Peterson, K.A. O’Halloran, and C. Hawkins-Hoffman, 2011:
Adapting to Climate Change at Olympic National Forest and Olympic National
Park. General Technical Report PNW-GTR-844, United States Department of
Agriculture (USDA) Forest Service, Pacific Northwest Research Station, Portland
OR, USA, 130 pp.
Hamin, E.M. and N. Gurran, 2009: Urban form and climate change: balancing
adaptation and mitigation in the US and Australia. Habitat International, 33(3),
238-245.
Hamlet, A.F., 2011: Assessing water resources adaptive capacity to climate change
impacts in the Pacific Northwest Region of North America. Hydrology and Earth
System Sciences, 15(5), 1427-1443.
Hamlet, A.F., S.-Y. Lee, K.E.B. Mickelson, and M.M. Elsner, 2010: Effects of projected
climate change on energy supply and demand in the Pacific Northwest and
Washington State. Climatic Change, 102(1-2), 103-128.
Hammer, R.B., S.I. Stewart, and V.C. Radeloff, 2009: Demographic trends, the
wildland-urban interface, and wildfire management. Society and Natural
Resources, 22(8), 777-782.
Hanna, E.G., T. Kjellstrom, C. Bennett, and K. Dear, 2011: Climate change and rising
heat: population health implications for working people in Australia. Asia-
Pacific Journal of Public Health, 23(2 Suppl.), 14S-26S.
Hannah, L., P.R. Roehrdanz, M. Ikegami, A.V. Shepard, M.R. Shaw, G. Tabor, L. Zhi,
P.A. Marquet, and R.J. Hijmans, 2013: Climate change, wine, and conservation.
Proceedings of the National Academy of Sciences of the United States of
America, 110(17), 6907-6912.
Hanson, S., R. Nicholls, N. Ranger, S. Hallegatte, J. Corfee-Morlot, C. Herweijer, and J.
Chateau, 2011: A global ranking of port cities with high exposure to climate
extremes. Climatic Change, 104(1), 89-111.
Hardess, L., A. Karst, M. M’Lot, S. Morgan, S. Wolfe, R. Matthews, and R. Sydneysmith,
2011: Climate Change and Adaptive Capacity in Aboriginal Communities South
of 60 Assessment Report. Centre for Indigenous Environmental Resources
(CIER) and the University of British Columbia (UBC), CIER, Winnipeg, MB,
Canada, and UBC, Vancouver, BC, Canada, 413 pp.
Hardoy, J. and P. Romero Lankao, 2011: Latin American cities and climate change:
challenges and options to mitigation and adaptation responses. Current Opinion
in Environmental Sustainability, 3(3), 158-163.
Harlan, S.L. and D.M. Ruddell, 2011: Climate change and health in cities: impacts of
heat and air pollution and potential co-benefits from mitigation and adaptation.
Current Opinion in Environmental Sustainability, 3(3), 126-134.
Harlan, S.L., A.J. Brazel, L. Prashad, W.L. Stefanov, and L. Larsen, 2006: Neighborhood
microclimates and vulnerability to heat stress. Social Science & Medicine,
63(11), 2847-2863.
Harlan, S.L., A.J. Brazel, G.D. Jenerette, N.S. Jones, L. Larsen, L. Prashad, and W.L.
Stefanov, 2008: In the shade of affluence: the inequitable distribution of the
urban heat island. Research in Social Problems and Public Policy, 15, 173-
202.
Harper, S.L., V.L. Edge, C. Schuster-Wallace, O. Berke, and S.A. McEwen, 2011:
Weather, water quality and infectious gastrointestinal illness in two Inuit
communities in Nunatsiavut, Canada: potential implications for climate change.
EcoHealth, 8(1), 93-108.
Hatfield, J.L., R.M. Cruse, and M.D. Tomer, 2013: Convergence of agricultural
intensification and climate change in the Midwestern United States:
implications for soil and water conservation. Marine and Freshwater Research,
64(5), 423-435.
Hatfield, J.R., K.J. Boote, B.A. Kimball, D.W. Wolfe, D.R. Ort, R.C. Izaurralde, and G.L.
Hahn, 2008: Chapter 2: Agriculture. In: The Effects of Climate Change on
Agriculture, Land Resources, Water Resources, and Biodiversity in the United
States [Walsh, M. (ed.)]. Synthesis and Assessment Product 4.3, A Report by the
United States Climate Change Science Program (CCSP) and the Subcommittee
on Global Change Research, U.S. Department of Agriculture, Washington, DC,
USA, pp. 21-74.
Hayhoe, K., D. Cavan, C. Field, P. Frumhoff, E. Maurer, M.N. Miller, S. Moser, S. Schneider,
K.N. Cahill, E. Cleland, L. Dale, and J. Verville, 2004: Emissions pathways, climate
change and impacts on California. Proceedings of the National Academies of
Sciences of the United States of America, 101(34), 12422-12427.
Hayhoe, K., S. Sheridan, L. Kalkstein, and S. Greene, 2010: Climate change, heat
waves, and mortality projections for Chicago. Journal of Great Lakes Research,
36(2 Suppl.), 65-73.
Heap, N., 2007: Hot Properties: How Global Warming could Transform B.C.’s Real
Estate Sector. David Suzuki Foundation, Vancouver, BC, Canada, 32 pp.
Hebben, T., 2009: Analysis of Water Quality Conditions and Trends for the Long-Term
River Network: Athabasca River, 1960-2007. Water Policy Branch, Alberta
Environment, Edmonton, AB, Canada, 341 pp.
Hejazi, M.I. and M. Markus, 2009: Impacts of urbanization and climate variability on
floods in northeastern Illinois. Journal of Hydrologic Engineering, 14(6), 606-
616.
Henstra, D., 2012: Toward the climate-resilient city: extreme weather and urban climate
adaptation policies in two Canadian provinces. Journal of Comparative Policy
Analysis: Research and Practice, 14(2), 175-194.
Hernández, A., B. Domínguez, P. Cervantes, S. Muñoz-Melgarejo, S. Salazar-Lizán, and
A. Tejeda-Martínez, 2011: Temperature-humidity index (THI) 1917-2008 and future
scenarios of livestock comfort in Veracruz, México. Atmósfera, 24(1), 89-102.
Hernández, L., H. Reyes-Bonilla, and E.F. Balart, 2010: Efecto del blanqueamiento
del coral por baja temperatura en los crustáceos decápodos asociados a
arrecifes del suroeste del golfo de California. Revista Mexicana De Biodiversidad,
81, S113-S119 (in Spanish).
Hicke, J.A., C.D. Allen, A.R. Desai, M.C. Dietze, R.J. Hall, E.H. (Ted) Hogg, D.M. Kashian,
D. Moore, K.F. Raffa, R.N. Sturrock, and J. Vogelmann, 2012: Effects of biotic
disturbances on forest carbon cycling in the United States and Canada. Global
Change Biology, 18(1), 7-34.
Hirsch, R.M. and K.R. Ryberg, 2012: Has the magnitude of floods across the USA
changed with global CO
2
levels? Hydrological Sciences Journal, 57(1), 1-9.
Hoegh-Guldberg, O., L. Hughes, S. McIntyre, D.B. Lindenmayer, C. Parmesan, H.P.
Possingham, and C.D. Thomas, 2008: Assisted colonization and rapid climate
change. Science, 321(5887), 345-346.
Hoerling, M.P., J.K. Eischeid, X.W. Quan, H.F. Diaz, R.S. Webb, R.M. Dole, and D.R.
Easterling, 2012: Is a transition to semipermanent drought conditions imminent
in the U.S. Great Plains? Journal of Climate, 25(24), 8380-8386.
Hogg, E.H. and P.Y. Bernier, 2005: Climate change impacts on drought-prone forest
in western Canada. The Forestry Chronicle, 81(5), 675-682.
Hogg, E.H., J.P. Brandt, and M. Michaelian, 2008: Impacts of a regional drought on
the productivity, dieback, and biomass of western Canadian aspen forests.
Canadian Journal of Forest Research, 38(6), 1373-1384.
Holden, Z.A., P. Morgan, M.A. Crimmins, R.K. Steinhorst, and A.M. Smith, 2007: Fire
season precipitation variability influences fire extent and severity in a large
southwestern wilderness area, United States. Geophysical Research Letters,
34(16), L16708, doi:10.1029/2007GL030804.
Holloway, T., S.N. Spak, D. Barker, M. Bretl, C. Moberg, K. Hayhoe, J. Van Dorn, and D.
Wuebbles, 2008: Change in ozone air pollution over Chicago associated with
global climate change. Journal of Geophysical Research, 113(D22), D22306,
doi:10.1029/2007JD009775.
Holmes, J., 2010: The forestry industry. In: What Do We Know? What Do We Need to
Know? The State of Canadian Research on Work, Employment and Climate
Change [Lipsig-Mummé, C. (ed.)]. Work in a Warming World Research
Programme, York University, Toronto, ON, Canada, pp. 148-166.
Hori, M.E., D. Nohara, and H.L. Tanaka, 2007: Influence of Arctic Oscillation towards
the Northern Hemisphere surface temperature variability under the global
warming scenario. Journal of the Meteorological Society of Japan, 85(6), 847-
859.
Horton, B. and G.R.A. Richardson, 2011: Climate Change Adaptation and Canadian
Municipal and Business Decision-Makers: A Snapshot of 2009. CCIAD Discussion
Paper Series, Natural Resources Canada, Ottawa, ON, Canada.
Houle, D., A. Bouffard, L. Duchesne, T. Logan, and R. Harvey, 2012: Projections of future
soil temperature and water content for three southern Quebec forested sites.
Journal of Climate, 25(21), 7690-7701.
Howden, S.M., J.F. Soussana, F.N. Tubiello, N. Chhetri, M. Dunlop, and H. Meinke, 2007:
Adapting agriculture to climate change. Proceedings of the National Academy
of Sciences of the United States of America, 104(50), 19691-19696.
Huber-Sannwald, E., F.T. Maestre, J.E. Herrick, and J.F. Reynolds, 2006: Ecohydrological
feedbacks and linkages associated with land degradation: a case study from
Mexico. Hydrological Processes, 20(15), 3395-3411.
Human Health and Security Topic Advisory Group, 2011: Washington State Climate
Change Response Strategy: Topic Advisory Group (TAG) Report –TAG 2 Human
Health and Security. Department of Ecology, State of Washington, Olympia,
WA, USA, 17 pp.
Hunt, A. and P. Watkiss, 2011: Climate change impacts and adaptation in cities: a
review of the literature. Climatic Change, 104(1), 13-49.
Hurd, B.H. and J. Coonrod, 2012: Hydro-economic consequences of climate change
in the upper Rio Grande. Climate Research, 53(2), 103-118.

1487
North America Chapter 26
26
Hurtado-Díaz, M., H. Riojas-Rodríguez, A. Brito-Hernández, and W. Junger, 2011:
Temperature, Air Pollution and Pediatric Hospitalizations in Mexico City. Presented
at: “The Encompassing Face of Environmental Epidemiology,” the 23
rd
Annual
Conference of the International Society for Environmental Epidemiology (ISEE)
2011, September 13-16, 2011, Barcelona, Spain, ISEE Secretariat, Boston, MA,
USA, ehp.niehs.nih.gov/isee/PDF/isee11Abstract01367.pdf.
Hurteau, M.D. and M. North, 2010: Carbon recovery rates following different
wildfire risk mitigation treatments. Forest Ecology and Management, 260(5),
930-937.
Hurteau, M.D., M.T. Stoddard, and P.Z. Fulé, 2011: The carbon costs of mitigating
high-severity wildfire in southwestern ponderosa pine. Global Change Biology,
17(4), 1516-1521.
Hystad, P.W. and P.C. Keller, 2006: Disaster management: Kelowna tourism industry’s
preparedness, impact and response to a 2003 major forest fire. Journal of
Hospitality and Tourism Management, 13(1), 44-58.
Hystad, P.W. and P.C. Keller, 2008: Towards a destination tourism disaster management
framework: long-term lessons from a forest fire disaster. Tourism and
Management, 29(1), 151-162.
IBHS, 2008: Fortified for Safer Living: Builders’ Guide (2008 Edition). Insurance
Institute for Business and Home Safety (IBHS), Tampa, FL, USA, 79 pp.
IBHS, 2011: Rating the States: An Assessment of Residential Building Code and
Enforcement Systems for Life Safety and Property Protection in Hurricane-Prone
Regions. Insurance Institute for Business and Home Safety (IBHS), Tampa, FL,
USA, 19 pp.
ICES, 2011: Report of the Study Group on Designing Marine Protected Area Networks
in a Changing Climate (SGMPAN). International Council for the Exploration of
the Sea (ICES) CM 2011/SSGSUE:01, Proceedings of the Meeting of the
NAMPAN-ICES Study Group on Designing Marine Protected Area Networks in
a Changing Climate (SGMPAN) held at the U.S. Geological Survey, Center for
Marine Science November 15-19, 2010, Woods Hole, MA, USA, ICES,
Copenhagen, Denmark, 155 pp.
IIASA, 2007: GGI Downscaled Spatially Explicit Socio-Economic Scenario Data.
Greenhouse Gas Initiative (GGI) Program of the International Institute for
Applied Systems Analysis (IIASA).
INE and SEMARNAT, 2006: Mexico’s Third National Communication to the United
Nations Framework Convention on Climate Change. National Institute of
Ecology (INE) and Ministry of Environment and Natural Resources (SEMARNAT),
Mexico City, DF, Mexico, 208 pp.
INECC and SEMARNAT, 2012a: Quinta Comunicación Nacional ante la Convención
Marco de las Naciones Unidas sobre el Cambio Climático. Instituto Nacional
de Ecología y Cambio Climático (INECC) and Secretaria de Medio Ambiente
y Recursos Naturales (SEMARNAT), Mexico City, DF, Mexico, 399 pp. (in
Spanish).
INECC and SEMARNAT, 2012b: Adaptación al Cambio Climático en México: Visión,
Elementos y Criterios para la Toma de Decisiones. Instituto Nacional de Ecología
y Cambio Climático (INECC) and Secretaría de Medio Ambiente y Recursos
Naturales (SEMARNAT), Mexico City, DF, Mexico, 182 pp. (in Spanish).
Institute of Medicine, 2011: Climate Change, the Indoor Environment, and Health.
Committee on the Effect of Climate Change on Indoor Air Quality and Public
Health, Institute of Medicine of the National Academies, The National Academies
Press, Washington, DC, USA, 286 pp.
Intersecretarial Commission on Climate Change, 2007: National Strategy on
Climate Change: Mexico –Executive Summary. Secretaría de Medio Ambiente
y Recursos Naturales (SEMARNAT), Mexico City, DF, Mexico, 16 pp.
IPCC, 2012: Summary for Policymakers. In: Managing the Risks of Extreme Events
and Disasters to Advance ClimateChange Adaptation. A Special Report of
Working Groups I and II of the Intergovernmental Panel on Climate Change
[Field, C.B., V. Barros, T.F. Stocker, D. Qin, D.J. Dokken, K.L. Ebi, M.D. Mastrandrea,
K.J. Mach, G.-K. Plattner, S.K. Allen, M. Tignor, and P.M. Midgley (eds.)].
Cambridge University Press, Cambridge, UK and New York, NY, USA, pp. 1-19.
Isaac, M. and D.P. Van Vuuren, 2009: Modeling global residential sector energy
demand for heating and air conditioning in the context of climate change.
Energy Policy, 37(2), 507-512.
Ivers, L.C. and E.T. Ryan, 2006: Infectious diseases of severe weather-related and
flood-related natural disasters. Current Opinion in Infectious Diseases, 19(5),
408-414.
Jaakkola, J.J.K., B.F. Hwang, and N. Jaakkola, 2005: Home dampness and molds,
parental atopy, and asthma in childhood: a six-year population-based cohort
study. Environmental Health Perspectives, 113(3), 357-361.
Jacob, D.J. and D.A. Winner, 2009: Effect of climate change on air quality. Atmospheric
Environment, 43(1), 51-63.
Jacques, L., C. De Vit, and F. Gagnon-Lebrun, 2010: Status of Climate Change
Adaptation in Canada’s Agricultural Sector. Government of Canada Policy
Research Initiative (PRI) Project, Sustainable Development, Government of
Canada, Ottawa, ON, Canada, 26 pp.
Janetos, A., L. Hansen, D. Inouye, B.P. Kelly, L. Meyerson, W. Peterson, and R. Shaw, 2008:
Chapter 5: Biodiversity. In: The Effects of Climate Change on Agriculture, Land
Resources, Water Resources, and Biodiversity in the United States [Walsh, M. (ed.)].
Synthesis and Assessment Product 4.3, Report by the United States Climate
Change Science Program (CCSP) and the Subcommittee on Global Change
Research, U.S. Department of Agriculture, Washington, DC, USA, pp. 151-181.
Jantarasami, L.C., J.L. Lawler, and C.W. Thomas, 2010: Institutional barriers to climate
change adaptation in U.S. national parks and forests. Ecology and Society,
15(4), 33, www.ecologyandsociety.org/vol15/iss4/art33/.
Jiménez-Moleón, M.C. and M.A. Gómez-Albores, 2011: Waterborne diseases in the
state of Mexico, Mexico (2000-2005). Journal of Water and Health, 9(1), 200-207.
Johansson, M.A., D.A.T. Cummings, and G.E. Glass, 2009: Multiyear climate variability
and dengue – El Niño Southern Oscillation, weather, and dengue incidence in
Puerto Rico, Mexico, and Thailand: a longitudinal data analysis. PLoS Medicine,
6(11), e1000168, doi:10.1371/journal.pmed.1000168.
Johnston, M., T. Williamson, E. Wheaton, V. Wittrock, H. Nelson, H. Hesseln, L.
Vandamme, J. Pittman, and M. Lebel, 2008: Limited Report: Climate Change
Adaptive Capacity of Forestry Stakeholders in the Boreal Plains Ecozone. SRC
Publication No. 12306-3C08, Prepared for Canadian Climate Change Impacts
and Adaptation Program, Project A1383, Saskatchewan Research Council (SRC),
Saskatoon, SK, Canada, 182 pp.
Johnston, M., T. Williamson, A. Munson, A. Ogden, M. Moroni, R. Parsons, D. Price,
and J. Stadt, 2010: Climate Change and Forest Management in Canada:
Impacts, Adaptive Capacity and Adaptation Options. A State of Knowledge Report,
Sustainable Forest Management Network, Edmonton, AB, Canada, pp. 16-35.
Jones, G.V., M.A. White, O.R. Cooper, and K. Storchmann, 2005: Climate change and
global wine quality. Climatic Change, 73(3), 319-343.
Jonkman, S.N., B. Maaskant, E. Boyd, and M.L. Levitan, 2009: Loss of life caused by
the flooding of New Orleans after Hurricane Katrina: analysis of the relationship
between flood characteristics and mortality. Risk Analysis, 29(5), 676-698.
Jury, M.R., 2008: Climate influence on dengue epidemics in Puerto Rico. International
Journal of Environmental Health Research, 18(5), 323-234.
Karl, T.R., J.M. Melillo, and T.C. Peterson (eds.), 2009: Global Climate Change Impacts
in the United States. U.S. Global Change Research Program, Cambridge
University Press, New York, NY, USA, 192 pp., nca2009.globalchange.gov/.
Keel, B.G. (ed.), 2007: Assisted Migration as a Conservation Strategy for Rapid Climatic
Change: Investigating Extended Photoperiod and Mycobiont Distribution for
Habenaria repens Nuttall (Orchidaceae) as a Case Study. PhD Dissertation,
Antioch University, Yellow Springs, OH, USA, 160 pp.
Keeley, J.E. and P.H. Zedler, 2009: Large, high-intensity fire events in southern
California shrublands: debunking the fine-grain age patch model. Ecological
Applications, 19(1), 64-94.
Keim, M.E., 2008: Building human resilience: the role of public health preparedness
and response as an adaptation to climate change. American Journal of Preventive
Medicine, 35(5), 508-516.
Kelly, A.E. and M.L. Goulden, 2008: Rapid shifts in plant distribution with recent
climate change. Proceedings of the National Academy of Sciences of the United
States of America, 105(33), 11823-11826.
Kelly, G., 2010: Built to a new code. Canadian Underwriter, Aug. 2010, 77(8), 48-50.
Kelly, G., P. Kovacs, and J. Thistlethwaite, 2012: Insurance: adapting building codes
for climate change. In: Climate Change Adaptation: A Priorities Plan for Canada
[Feltmate, B. and J. Thistlethwaite (eds.)]. A Report of the Climate Change
Adaptation Project (CCAP) – Canada, University of Waterloo, Waterloo, ON,
Canada, pp. 85-92.
Kelly, J., P.A. Makar, and D.A. Plummer, 2012: Projections of mid-century summer air
quality for North America: effects of changes in climate and precursor emissions.
Atmospheric Chemistry and Physics, 12, 3875-3940.
Kemp, A., B.P. Horton, S.J. Culver, D.R. Corbett, O. Van De Plassche, and R. Edwards,
2008: Early onset of historical accelerated relative sea level rise in North
Carolina, USA. In: Proceedings of the 2008 Joint Meeting of the Geological
Society of America (GSA), Soil Science Society of America (SSSA), American
Society of Agronomy (ASA), Crop Science Society of America (CSSA), and the
Gulf Coast Association of Geological Societies with the Gulf Coast Section of

1488
Chapter 26 North America
26
SEPM (GCAGS), 5-9 October, 2008, Houston, TX, Session: 282 T1. Hosted by
the Houston Geological Society (HGS), Houston, TX, USA, https://scisoc.
confex.com/crops/2008am/webprogram/Session4930.html.
Kenny, G.F., J. Yardley, C. Brown, R.J. Sigal, and O. Jay, 2010: Heat stress in older
individuals and patients with common chronic diseases. Canadian Medical
Association Journal, 182(10), 1053-1060.
Kenny, J.F., N.L. Barber, S.S. Hutson, K.S. Linsey, J.K. Lovelace, and M.A. Maupin, 2009:
Estimated Use of Water in the United States in 2005. USGS Circular 1344,
United States Department of the Interior, the United States Geological Survey
(USGS), Reston, VA, USA, 52 pp.
Kenter, P., 2010: Climate change adaptation missing. Daily Commercial News and
Construction Record, 83(97).
Kerkhoven, E. and T.Y. Gan, 2011: Differences and sensitivities in potential hydrologic
impact of climate change to regional-scale Athabasca and Fraser River basins of
the leeward and windward sides of the Canadian Rocky Mountains respectively.
Climatic Change, 106(4), 583-607.
Kharin, V.V., F.W. Zwiers, X. Zhang, and M. Wehner, 2013: Changes in temperature
and precipitation extremes in the CMIP5 ensemble. Climatic Change, 119(2),
345-357.
Kienzle, S.W., M.W. Nemeth, J.M. Byrne, and R.J. MacDonald, 2012: Simulating the
hydrological impacts of climate change in the upper North Saskatchewan River
basin, Alberta, Canada. Journal of Hydrology, 412, 76-89.
Kim, C.-R., 2011: RPT-UPDATE 4: Thai flooding impact spreads across world for Toyota.
Reuters, www.reuters.com/article/2011/10/27/toyota-idUSL3E7LR00I20111027.
King County Department of Natural Resources and Parks, 2008: Vulnerability
of Major Wastewater Facilities to Flooding from Sea-Level Rise. King County
(WA) Department of Natural Resources and Parks, Wastewater Treatment
Division, Seattle, WA, USA, 13 pp.
Kinney, P.L., 2008: Climate change, air quality, and human health. American Journal
of Preventive Medicine, 35(5), 459-67.
Kinney, P.L., 2012: Health: a new measure of health effects. Nature Climate Change,
2(4), 233-234.
Kinney, P., M. O’Neill, M. Bell, and J. Schwartz, 2008: Approaches for estimating
effects of climate change on heat-related deaths: challenges and opportunities.
Environmental Science & Policy, 11(1), 87-96.
Kinney, P.L., P. Sheffield, R.S. Ostfeld, J.L. Carr, R. Leichenko, and P. Vancura, 2011:
Chapter 11: Public health. In: Responding to Climate Change in New York State:
The ClimAID Integrated Assessment for Effective Climate Change Adaptation in
New York State [Rosenzweig, C., W. Solecki, A. DeGaetano, M. O’Grady, S. Hassol,
and P. Grabhorn (eds.)]. New York State Energy Research and Development
Authority (NYSERDA), Albany, NY, USA, pp. 397-438.
Kirchner, J.W., C.M. Austin, A. Myers, and D.C. Whyte, 2011: Quantifying remediation
effectiveness under variable external forcing using contaminant rating curves.
Environmental Science and Technology, 45(18), 7874-7881.
Kirshen, P.H., M. Ruth, and W. Anderson, 2006: Chapter 7: Climate’s long-term
impacts on urban infrastructures and services: the case of Metro Boston. In:
Regional Climate Change and Variability: Impacts and Responses [Ruth, M., K.
Donaghy, and P.H. Kirshen (eds.)]. Edward Elgar Publishers, Cheltenham, UK,
pp. 191-225.
Kirshen, P., K. Knee, and M. Ruth, 2008: Climate change and coastal flooding in
Metro Boston: impacts and adaptation strategies. Climatic Change, 90(4), 453-
473.
Kjellstrom, T. and J. Crowe, 2011: Climate change, workplace heat exposure, and
occupational health and productivity in Central America. International Journal
of Occupational and Environmental Health, 17(3), 270-281.
Kjellstrom, T., R.S. Kovats, S.J. Lloyd, T. Holt, and R.S.J. Tol, 2009: The direct impact of
climate change on regional labor productivity. Archives of Environmental and
Occupational Health, 64(4), 217-227.
Klerkx, L. and C. Leeuwis, 2009: Establishment and embedding of innovation brokers
at different innovation system levels: insights from the Dutch agricultural sector.
Technological Forecasting and Social Change, 76, 849-860.
Knowlton, K., J.E. Rosenthal, C. Hogrefe, B. Lynn, S. Gaffin, R. Goldberg, C.
Rosenzweig, K. Civerolo, J. Ku, and P.L. Kinney, 2004: Assessing ozone-related
health impacts under a changing climate. Environmental Health Perspectives,
112(15), 1557-1563.
Knowlton, K., M. Rotkin-Ellman, G. King, H.G. Margolis, D. Smith, G. Solomon, R. Trent,
and P. English, 2009: The 2006 California heat wave: impacts on hospitalizations
and emergency department visits. Environmental Health Perspectives, 117(1),
61-67.
Knutson, T.R., J.L. McBride, J. Chan, K. Emanual, G. Holland, C. Landsea, I. Held, J.P.
Kossin, A.K. Srivastava, and M. Sugi, 2010: Tropical cyclones and climate change.
Nature Geosciences, 3, 157-163.
Koffi, J.K., P.A. Leighton, Y. Pelcat, L. Trudel, L.R. Lindsay, F. Milord, and N.H. Ogden,
2012: Passive surveillance of I. scapularis ticks: enhanced analysis for early
detection of emerging Lyme disease risk. Journal of Medical Entomology, 49(2),
400-409.
Kolden, C.A. and T.J. Brown, 2010: Beyond wildfire: perspectives of climate, managed
fire, and policy in the USA. International Journal of Wildland Fire, 19, 364-373.
Kolivras, K., 2010: Changes in dengue risk potential in Hawaii, USA, due to climate
variability and change. Climate Research, 42(1), 1-11.
Kovacs, J.M., J. Malczewski, and F. Flores-Verdugo, 2004: Examining local ecological
knowledge of hurricane impacts in a mangrove forest using an Analytical
Hierarchy Process (AHP) approach. Journal of Coastal Research, 20(3), 792-
800.
Kovacs, P., 2005: Promoting resilient homes. Canadian Underwriter, May 2005, 36-40.
Kovats, R.S. and S. Hajat, 2008: Heat stress and public health: a critical review. Annual
Review of Public Health, 29, 41-55.
Krishnamurthy, P.K., J.B. Fisher, and C. Johnson, 2011: Mainstreaming local perceptions
of hurricane risk into policymaking: a case study of community GIS in Mexico.
Global Environmental Change, 21, 143-153.
Kucharik, C.J. and S.P. Serbin, 2008: Impacts of recent climate change on Wisconsin
corn and soybean yield trends. Environmental Research Letters, 3(3), 034003,
doi:10.1088/1748-9326/3/3/034003.
Kulshreshtha, S., 2011: Climate change, prairie agriculture, and prairie economy: the
new normal. Canadian Journal of Agricultural Economics, 59, 19-44.
Kumar, S., V. Merwade, J. Kam, and K. Thurner, 2009: Streamflow trends in Indiana:
effects of long term persistence, precipitation and subsurface drains. Journal
of Hydrology, 374(1), 171-183.
Kumar, S., V. Merwade, J.L. Kinter III, and D. Niyogi, 2013a: Evaluation of temperature
and precipitation trends and long-term persistence in CMIP5 20
th
century climate
simulations. Journal of Climate, 26(12), 4168-4185.
Kumar, S., S.I. Kinter, P.A. Dirmeyer, Z. Pan, and J.M. Adams, 2013b: Multi-decadal
climate variability and the “warming hole” in North America – results from CMIP5
20
th
and 21
st
century climate simulations. Journal of Climate, 26(11), 3511-3527.
Kundzewicz, Z., L. Mata, N.W. Arnell, P. Döll, B. Jimenez, K. Miller, T. Oki, Z. Sen, and
I. Shiklomanov, 2008: The implications of projected climate change for
freshwater resources and their management. Hydrological Sciences Journal,
53(1), 3-10.
Kunkel, K.E., P. Bromirski, H.E. Brooks, T. Cavazos, A.V. Douglas, D.R. Easterling, K.A.
Emanuel, P.Y. Groisman, G.J. Holland, T.R. Knutson, J.P. Kossin, P.D. Komar, D.
Levinson, and R.L. Smith, 2008: Observed changes in weather and climate
extremes. In: Weather and Climate Extremes in a Changing Climate. Regions
of Focus: North America, Hawaii, Caribbean, and U.S. Pacific Islands [Karl, T.R.,
G.A. Meehl, C.D. Miller, S.J. Hassol, A.M. Waple, and W.L. Murray (eds.)]. Report
by the United States Climate Change Science Program (CCSP) and the
Subcommittee on Global Change Research, Department of Commerce, NOAA’s
National Climatic Data Center, Washington, DC, USA, pp. 35-80.
Kunkel, K.E., H.-C. Huang, X.-Z. Liang, J.-T. Lin, D. Wuebbles, Z. Tao, A. Williams, M.
Caughey, J. Zhu, and K. Hayhoe, 2007: Sensitivity of future ozone concentrations
in the northeast USA to regional climate change. Mitigation and Adaptation
Strategies for Global Change, 13(5-6), 597-606.
Kunreuther, H.C. and E.O. Michel-Kerjan, 2009: At War with the Weather: Managing
Large Scale Risks in a New Era of Catastrophes. Massachusetts Institute of
Technology (MIT) Press, Cambridge, MA, USA, 416 pp.
Kurz, W.A., C.C. Dymond, G. Stinson, G.J. Rampley, E.T. Neilson, A.L. Carroll, T. Ebata,
and L. Safranyik, 2008a: Mountain pine beetle and forest carbon feedback to
climate change. Nature, 452(24), 987-990.
Kurz, W.A., G. Stinson, G.J. Rampley, C.C. Dymond, and E.T. Neilson, 2008b: Risk of
natural disturbances makes future contribution of Canada’s forests to the
global carbon cycle highly uncertain. Proceedings of the National Academy of
Sciences of the United States of America, 105(5), 1551-1555.
Lafferty, K.D., 2009: The ecology of climate change and infectious diseases. Ecology,
90(4), 888-900.
Lafferty, K.D., 2010: The ecology of climate change and infectious diseases: reply.
Ecology, 91(3), 928-929.
Lal, P., J. Alavalapati, and D.E. Mercer, 2011: Socio-economic impacts of climate
change on rural United States. Mitigation and Adaptation Strategies for Global
Change, 16(7), 819-844.

1489
North America Chapter 26
26
Lambrechts, L., K.P. Paaijmans, T. Fansiri, L.B. Carrington, and L.D. Kramer, 2011:
Impact of daily temperature fluctuations on dengue virus transmission by Aedes
aegypti. Proceedings of the National Academy of Sciences of the United States
of America, 108(18), 7460-7465.
Laukkonen, J., P.K. Blanco, J. Lenhart, M. Keiner, B. Cavric, and C. Kinuthia-Njenga,
2009: Combining climate change adaptation and mitigation measures at the
local level. Habitat International, 33(3), 287-292.
Lazo, J.K., M. Lawson, P.H. Larsen, and D.M. Waldman, 2011: U.S. economic sensitivity
to weather variability. Bulletin of the American Meteorological Society, 92(6),
709-720.
Leal Asencio, T., D.V. Millán Gómez, C.G. Méndez Jaime, and C.A. Servín Jungdorf,
2008: Evaluación de la Afectación de la Calidad del Agua en Cuerpos de Agua
Superficiales y Subterráneos por Efecto de la Variabilidad y el Cambio Climático
y su Impacto en la Biodiversidad, Agricultura, Salud, Turismo e Industria:
Informe Final[Assessment of the Impacts on Surface and Groundwater due to
Climate Change and the Climate Variability and Effects on Biodiversity,
Agriculture, Health Tourim and the Industry: Final Report]. Instituto Nacional
de Ecología (INE), Instituto Mexicano de Tecnología del Agua (IMTA), and
Secretaria de Medio Ambiente y Recursos Naturales (SEMARNAT), Mexico City,
DF, Mexico, 103 pp.
Lee, J., S. Gryze, and J. Six, 2011: Effect of climate change on field crop production in
California’s Central Valley. Climatic Change, 109(1), 335-353.
Leichenko, R., 2011: Climate change and urban resilience. Current Opinion in
Environmental Sustainability, 3(3), 164-168.
Leighton, P.A., J.K. Koffi, Y. Pelcat, L.R. Lindsay, and N.H. Ogden, 2012: Predicting the
speed of tick invasion: an empirical model of range expansion for the Lyme
disease vector Ixodes scapularis in Canada. Journal of Applied Ecology, 49(2),
457-464.
Lemmen, D.S., F.J. Warren, J. Lacroix, and E. Bush (eds.), 2008: From Impacts to
Adaptation: Canada in a Changing Climate 2007. Government of Canada,
Natural Resources Canada, Ottawa, ON, Canada, 448 pp.
Leon, C. and C. Neri, 2010: Mexico City case study. In: Climate Change, Disaster
Risk Management and the Urban Poor: Cities Building Resilience for a
Changing World [Baker, J.L. (ed.)]. The World Bank, Washington, DC, USA, pp.
217-234.
Leonard, L., J. Dorton, S. Culver, and R. Christian, 2009: Coastal and Estuarine
Observing in North Carolina: Integrating Observations and Science to
Understand our Coastal Environment. East Carolina University Press, Greenville,
NC, USA, 30 pp.
Leurig, S., 2011: Climate Risk Disclosure by Insurers: Evaluating Insurer Responses
to the NAIC Climate Disclosure Survey. Ceres, Boston, MA, USA, 54 pp.
Levetin, E. and V. de Water, 2008: Changing pollen types/concentrations/distribution
in the United States: fact or fiction? Current Allergy and Asthma Reports, 8(5),
418-424.
Levina, E., J.S. Jacob, L.E. Ramos, and I. Ortiz, 2007: Policy Frameworks for Adaptation
to Climate Change in Coastal Zones: The Case of the Gulf of Mexico. COM/ENV/
EPOC/IEA/SLT(2007)2, Organisation for Economic Co-operation and Development
(OECD) and the International Energy Agency (IEA), Paris, France, 68 pp.
Liao, K., E. Tagaris, K. Manomaiphiboon, C. Wang, J. Woo, P. Amar, S. He, and A.G.
Russell, 2009: Quantification of the impact of climate uncertainty on regional
air quality. Atmospheric Chemistry and Physics, 9(3), 865-878.
Liao, K., E. Tagaris, K. Manomaiphiboon, S.L. Napelenok, J. Woo, S. He, P. Amar, and
A.G. Russell, 2007: Sensitivities of ozone and fine particulate matter formation
to emissions under the impact of potential future climate change. Environmental
Science & Technology, 41(24), 8355-8361.
Liceaga-Correa, M.A., L.U. Arellano-Méndez, and H. Hernández-Núñez, 2010: Efectos
de los huracanes y cambio climático sobre el Caribe mexicano: adaptabilidad
de los pastos marinos. In: Vulnerabilidad de las Zonas Costeras Mexicanas ante
el Cambio Climático [Botello, A.V., S. Villanueva-Fragoso, J. Gutiérrez, and J.L.
Rojas Galaviz (eds.)]. Secretaría de Gobierno, Gobierno del estado de Tabasco,
Instituto Nacional de Ecología, Secretaría de Medio Ambiente y Recursos
Naturales (SEMARNAT-INE), Instituto de Ciencias del Mar y Limnología,
Universidad Nacional Autónoma de México (UNAM-ICMyL), and the Universidad
Autónoma de Campeche, CentrodeEcología, Pesquerías y Oceanografía del
Golfo de México (CENTRO EPOMEX), Universidad Autónoma de Campeche,
Campeche, Mexico, pp. 211-228 (in Spanish).
Lin, B.B., 2007: Agroforestry management as an adaptive strategy against potential
microclimate extremes in coffee agriculture. Agricultural and Forest Meteorology,
144(1-2), 85-94.
Lin, B.B., 2010: The role of agroforestry in reducing water loss through soil evaporation
and crop transpiration in coffee agroecosystems. Agricultural and Forest
Meteorology, 150(4), 510-518.
Lin, J., K.O. Patten, K. Hayhoe, X. Liang, and D.J. Wuebbles, 2008: Effects of future
climate and biogenic emissions changes on surface ozone over the United
States and China. Journal of Applied Meteorology and Climatology, 47(7),
1888-1909.
Lin, J., D.J. Wuebbles, H. Huang, Z. Tao, M. Caughey, X. Liang, J. Zhu, and T. Holloway,
2010: Potential effects of climate and emissions changes on surface ozone in
the Chicago area. Journal of Great Lakes Research, 36(2 Suppl.), 59-64.
Liu, J., C. Folberth, H. Yang, J. Röckström, K. Abbaspour, and A.J. Zehnder, 2013: A
global and spatially explicit assessment of climate change impacts on crop
production and consumptive water use. PLoS ONE, 8(2), e57750, doi:10.1371/
journal.pone.0057750.
Liu, Y., S.L. Goodrick, and J.A. Stanturf, 2012: Future US wildfire potential trends
projected using a dynamically downscaled climate change scenario. Forest
Ecology and Management, 294, 120-135.
Lo, E. and E. Levetin, 2007: Influence of meteorological conditions on early spring
pollen in the Tulsa atmosphere from 1987-2006. Journal of Allergy and Clinical
Immunology, 119(1 Suppl.), S101, doi:10.1016/j.jaci.2006.11.612.
Loarie, S.R., P.B. Duffy, H. Hamilton, G.P. Asner, C.B. Field, and D.D. Ackerly, 2009: The
velocity of climate change. Nature, 462(7276), 1052-1055.
Lobell, D.B. and C.B. Field, 2011: California perennial crops in a changing climate.
Climatic Change, 109(1), 317-333.
Lobell, D.B., C.B. Field, K.N. Cahill, and C. Bonfils, 2006: Impacts of future climate
change on California perennial crop yields: model projections with climate and
crop uncertainties. Agricultural and Forest Meteorology, 141(2), 208-218.
Lobell, D.B., S. Wolfram, and J. Costa-Roberts, 2011: Climate trends and global crop
production since 1980. Science, 333(6042), 616-620.
Lobell, D.B., U.L.C. Baldos, and T.W. Hertel, 2013: Climate adaptation as mitigation:
the case of agricultural investments. Environmental Research Letters, 8(1),
015012, doi:10.1088/1748-9326/8/1/015012.
Locke, P., C. Clifton, and S. Westra, 2011: Extreme weather events and the mining
industry. Engineering and Mining Journal, 212(3), 58-59.
Lozano-Fuentes, S., M.H. Hayden, C. Welsh-Rodriguez, C. Ochoa-Martinez, B. Tapia-
Santos, K.C. Kobylinski, C.K. Uejio, E. Zielinski-Gutierrez, L. Delle Monache, A.J.
Monaghan, D.F. Steinhoff, and L. Eisen, 2012: The dengue virus mosquito vector
Aedes aegypti at high elevation in Mexico. American Journal of Tropical
Medicine and Hygiene, 87(5), 902-909.
Luber, G., K. Knowlton, J. Balbus, H. Frumkin, M. Hayden, J. Hess, M. McGeehin, N.
Sheats, L. Backer, C.B. Beard, K.L. Ebi, E. Maibach, R.S. Ostfeld, C. Wiedinmyer,
E. Zielinski-Gutiérrez, and L. Ziska, 2014: Human Health. In: Climate Change
Impacts in the United States: The Third National Climate Assessment [Melillo,
J.M., T.C. Richmond, and G.W. Yohe (eds.)]. U.S. Global Change Research
Program, Washington, DC, USA, pp. 220-256. doi:10.7930/J0PN93H5.
Lund, J., E. Hanak, W. Fleenor, R. Howitt, J. Mount, and P. Moyle, 2007: Envisioning
Futures for the Sacramento-San Joaquin Delta. Public Policy Institute of
California, San Francisco, CA, USA, 285 pp.
MacDonald, G.M., 2010: Water, climate change, and sustainability in the southwest.
Proceedings of the National Academy of Sciences of the United States of
America, 107(50), 21256-21262.
MacDonald, T., A. Becker, D. Bellomo, V. Burkett, J. Cikir, S. Cutter, K Dow, J. Hall, M.
Honeycutt, P. King, P. Kirshen, J. London, A. McGregor, J. Melby, L. Patton, E.
Russo, G. Smith, C. Thatcher, and J. Trtanj, 2012: Chapter 4: Vulnerability and
impacts on human development. In: Coastal Impacts, Adaptation, and
Vulnerabilities: A Technical Input to the2013 National Climate Assessment
[Burkett, V.R. and M.A. Davidson (eds.)]. National Climate Assessment (NCA)
Regional Input Reports, The National Oceanic and Atmospheric Administration
(NOAA), Island Press, Washington, DC, USA, pp. 66-97.
Macias Fauria, M. and E.A. Johnson, 2006: Large-scale climatic patterns control
large lightning fire occurrence in Canada and Alaska forest regions. Journal of
Geophysical Research, 111(G4), G04008, doi:10.1029/2006JG000181.
Macias Fauria, M. and E.A. Johnson, 2008: Climate and wildfires in the North American
boreal forest. Philosophical Transactions of the Royal Society B, 363(1501),
2317-2329.
MacKendrick, N. and J. Parkins, 2005: Social Dimensions of Community Vulnerability
to Mountain Pine Beetle. Mountain Pine Beetle Initiative Working Paper 2005-
26, Social Science Research Group, Natural Resources Canada, Canadian Forest
Service, Pacific Forestry Centre, Victoria, BC, Canada, 79 pp.

1490
Chapter 26 North America
26
Magana, V., 2010: Climate change, disaster risk management and the urban poor Mexcio
City case study. In: Estudio de Vulnerabilidad Diferenciada ante Eventos Extremos
del Clima en la Zona Metropolitan de la Ciudad de México: Aspectos Climáticos
[Leon, C. and C. Neri (eds.)]. The World Bank, Washington, DC, USA, pp. 72-114.
Magrin, G., C. Gay García, D. Cruz Choque, J.C. Giménez, A.R. Moreno, G.J. Nagy, C.
Nobre, and A. Villamiza, 2007: Latin America. In: Climate Change 2007: Impacts,
Adaptation and Vulnerability. Contribution of Working Group II to the Fourth
Assessment Report of the Intergovernmental Panel on Climate Change [Parry, M.L.,
O.F. Canziani, J.P. Palutikof, P.J. van der Linden, and C.E. Hanson, (eds.)].Cambridge
University Press, Cambridge, UK and New York, NY, USA, pp. 581-615.
Mahmud, A., M. Hixson, J. Hu, Z. Zhao, S.-H. Chen, and M.J. Kleeman, 2010: Climate
impact on airborne particulate matter concentrations in California using seven
year analysis periods. Atmospheric Chemistry and Physics, 10(22), 11097-11114.
Mailhot, A. and S. Duchesne, 2010: Design criteria of urban drainage infrastructures
under climate change. Journal of Water Resources Planning and Management,
136(2), 201-208.
Mansourian, S., A. Belokurov, and P.J. Stephenson, 2009: The role of forest protected
areas in adaptation to climate change. Unasylva, 60(1-2), 63-68.
Mantua, N., I. Tohver, and A. Hamlet, 2010: Climate change impacts on streamflow
extremes and summertime stream temperature and their possible consequences
for freshwater salmon habitat in Washington State. Climatic Change, 102(1-2),
187-223.
March, I.J., H. Cabral, Y. Echeverría, M. Bellot, and J.M. Frausto (eds.), 2011:
Adaptación al Cambio Climático en Áreas Protegidas del Caribe de México.
Serie Estrategias de Adaptación al Cambio Climático en Áreas Protegidas de
México No. 1, Comisión Nacional de Áreas Naturales Protegidas, The Nature
Conservancy, and Fondo Mexicano para la Conservación de la Naturaleza,
Mexico City, DF, Mexico, 109 pp. (in Spanish).
Marlin, A., L. Olsen, D. Bruce, J. Ollerhead, K. Singh, J. Heckman, B. Walters, D. Meadus,
and A. Hanson, 2007: Examining Community Adaptive Capacity to Address
Climate Change, Sea Level Rise, and Salt Marsh Restoration in Maritime
Canada. Coastal Wetlands Institute and the Rural and Small Town Programme,
Mount Allison University, Sackville, NB, Canada, 83 pp.
Márquez, R. and Ma. del C. Jiménez, 2010: El posible efecto del cambio climático en
las tortugas marinas. In: Vulnerabilidad de las Zonas Costeras Mexicanas ante
el Cambio Climático [Botello, A.V., S. Villanueva, J. Gutiérrez, and J.L. Rojas
Galaviz (eds.)]. Gobierno del Estado de Tabasco, SEMARNAT-INE, UNAM-ICMyL,
and Universidad Autónoma de Campeche, Centro epomex, Universidad
Autónoma de Campeche, Campeche, México, pp. 97-112, etzna.uacam.mx/
epomex/publicaciones/vulnerabilidad/vulnerabilidad_CCParte1.pdf.
Marshall, E. and T. Randhir, 2008: Effect of climate change on watershed system: a
regional analysis. Climatic Change, 89(3-4), 263-280.
Marshall, G.R., 2013: Transaction costs, collective action and adaptation in managing
complexsocial-ecological systems. Ecological Economics, 88, 185-194.
Marshall, N.A., S.E. Park, W.N. Adger, K. Brown, and S.M. Howden, 2012:
Transformational capacity and the influence of place and identity. Environmental
Research Letters, 7(3), 034022, doi:10.1088/1748-9326/7/3/034022.
Martiello, M.A. and M.V. Giacchi, 2010: Review article: high temperatures and health
outcomes: a review of the literature. Scandinavian Journal of Public Health,
38(8), 826-837.
Martin, W.E., I.M. Martin, and B. Kent, 2009: The role of risk perceptions in the risk
mitigation process: the case of wildfire in high risk communities. Journal of
Environmental Management, 91(2), 489-498.
Martínez Arroyo, A., S. Manzanilla Naim, and J. Zavala Hidalgo, 2011: Vulnerability
to climate change of marine and coastal fisheries in México. Atmósfera, 24(1),
103-123.
Martínez Austria, P.F. and C. Patiño Gómez, (eds.) 2010: Efectos del Cambio Climático
en los Recursos Hídricos de México, Volumen III. Atlas de Vulnerabilidad Hídrica
en México ante el Cambio Climático. Instituto Mexicano de Tecnología del Agua,
Jiutepec, Morales, Mexico, 162 pp. (in Spanish).
Maryland Commission on Climate Change, 2008: Comprehensive Strategy for
Reducing Maryland’s Vulnerability to Climate Change: Phase I: Sea-level Rise and
Coastal Storms. Report by Maryland Commission on Climate Change Adaptation
and Response Working Group, Maryland Coastal Zone Management Program,
Department of Natural Resources, Annapolis, MD, USA, 32 pp.
Maryland Commission on Climate Change, 2010: Update to Governor and General
Assembly. Report prepared by the Maryland Department of the Environment
on behalf of the Maryland Commission on Climate Change, Department of the
Environment, Annapolis, MD, USA, 60 pp.
Matthews, S.N., L.R. Iverson, A.M. Prasad, and M.P. Peters, 2011: Changes in potential
habitat of 147 North American breeding bird species in response to redistribution
of trees and climate following predicted climate change. Ecography, 34(6),
933-945.
Mawdsley, J.R., R. O’Malley, and D.S. Ojima, 2009: A review of climate-change
adaptation strategies for wildlife management and biodiversity conservation.
Conservation Biology, 23(5), 1080-1089.
Mazari-Hiriart, M., Y. López-Vidal, S. Ponce-de-León, J.J. Calva, F. Rojo-Callejas, and
G. Castillo-Rojas, 2005: Longitudinal study of microbial diversity and seasonality
in the Mexico City metropolitan area water supply system. Applied and
Environmental Microbiology, 71(9), 5129-5137.
McBoyle, G., D. Scott, and B. Jones, 2007: Climate change and future of snowmobiling
in non-mountainous regions of Canada. Managing Leisure, 12(4), 237-250.
McFarlane, B.L., 2006: Human dimensions of fire management in the wildland-urban
interface: a literature review. In: Canadian Wildland Fire Strategy: Background,
Syntheses, Analyses, and Perspectives [Kirsch, K.G. and P. Fuglem (eds.)].
Canadian Council for Forest Ministries, Edmonton, AB, Canada, pp. 27-34.
McGranahan, G., D. Balk, and B. Anderson, 2007: The rising tide: assessing the risks
of climate change and human settlements in low elevation coastal zones.
Environment and Urbanization, 19(1), 17-37.
McGregor, G.R., 2011: Human biometeorology. Progress in Physical Geography,
36(1), 93-109.
McKee, K.L., 2011: Biophysical controls on accretion and elevation change in Caribbean
mangrove ecosystems. Estuarine, Coastal and Shelf Science, 91(4), 475-483.
McKenzie, D., Z. Gedalof, D.L. Peterson, and P. Mote, 2004: Climatic change, wildfire,
and conservation. Conservation Biology, 18(4), 890-920.
McLeman, R.A., 2010: Impacts of population change on vulnerability and the
capacity to adapt to climate change and variability: a typology based on lessons
from ‘a hard country’. Population & Environment, 31(5), 286-316.
McLeman, R. and G. Gilbert, 2008: Economic and Social Adaptation to Climate
Change in Canadian Seasonal-Economy Communities. Final Scientific Report
for Natural Resources Canada, Project A1319, Natural Resources Canada,
Ottawa, ON, Canada, 41 pp.
McMichael, A.J., P. Wilkinson, R.S. Kovats, S. Pattenden, S. Hajat, B. Armstrong, N.
Vajanapoom, E.M. Niciu, H. Mahomed, and C. Kingkeow, 2008: International
study of temperature, heat and urban mortality: the ‘ISOTHURM’project.
International Journal of Epidemiology, 37(5), 1121-1131.
Medina-Ramon, M. and J. Schwartz, 2007: Temperature, temperature extremes, and
mortality: a study of acclimatization and effect modification in 50 United States
cities. Occupational and Environmental Medicine, 64(12), 827-833.
Meehl, G.A., C. Tebaldi, G. Walton, D. Easterling, and L. McDaniel, 2009: Relative
increase of record high maximum temperatures compared to record low
minimum temperatures in the U.S. Geophysical Research Letters, 36(23),
L23701, doi:10.1029/2009GL040736.
Meehl, G.A., J.M. Arblaster, and G. Branstator, 2012: Mechanisms contributing to the
warming hole and the consequent US east-west differential of heat extremes.
Journal of Climate, 25(18), 6394-6408.
Megdal, S.B. and C.A. Scott, 2011: The importance of institutional asymmetries to
the development of binational aquifer assessment programs: the Arizona-
Sonora experience. Water, 3(3), 949-963.
Mehta, V.K., V.R. Haden, B.A. Joyce, D.R. Purkey, and L.E. Jackson, 2013: Irrigation
demand and supply, given projections of climate and land-use change, in Yolo
County, California. Agricultural Water Management, 117, 70-82.
Mercer, K.L., H.R. Perales, and J.D. Wainwright, 2012: Climate change and the
transgenic adaptation strategy: smallholder livelihoods, climate justice, and
maize landraces in Mexico. Global Environmental Change, 22(2), 495-504.
Meyer, M.D., E. Rowan, C. Snow, and A. Choate, 2013: Impacts of Extreme Weather
on Transportation: National Symposium Summary. American Association of
State Highway and Transportation Officials, Washington, DC, USA, 20 pp.
Meza-Figueroa, D., R.M. Maier, M. de la O-Villanueva, A. Gómez-Alvarez, A. Moreno-
Zazueta, and J. Rivera, 2009: The impact of unconfined mine tailings in residential
areas from a mining town in a semi-arid environment: Nacozari, Sonora,
Mexico. Chemosphere, 77(1), 140-147.
Miao, S., F. Chen, Q. Li, and S. Fan, 2011: Impacts of urban processes and urbanization
on summer precipitation: a case study of heavy rainfall in Beijing on 1 August
2006. Journal of Applied Meteorology and Climatology, 50, 806-825.
Michaelian, M., E.H. Hogg, R.J. Hall, and E. Arsenault, 2011: Massive mortality of
aspen following severe drought along the southern edge of the Canadian
boreal forest. Global Change Biology, 17(6), 2084-2094.

1491
North America Chapter 26
26
Millar, C.I., N.L. Stephenson, and S.S. Stephens, 2007: Climate change and forests of
the future: managing in the face of uncertainty. Ecological Applications, 17(8),
2145-2151.
Miller, A.W., A.C. Reynolds, C. Sobrino, and G.F. Riedel, 2009: Shellfish face uncertain
future in high CO
2
world: influence of acidification on oyster larvae calcification
and growth in estuaries. PLoS One, 4(5), e5661.
Millerd, F., 2011: The potential impact of climate change on Great Lakes international
shipping. Climatic Change, 104(3-4), 629-652.
Mills, B.N., S.L. Tighe, J. Andrey, J.T. Smith, and K. Huen, 2009: Climate change
implications for flexible pavement design and performance in southern Canada.
Journal of Transportation Engineering, 135(10), 773-782.
Mills, E., 2007: From Risk to Opportunity 2007: Insurer Responses to Climate Change.
Ceres, Boston, MA, USA, 44 pp.
Mills, E., 2009: A global review of insurance industry responses to climate change.
Geneva Papers on Risk & Insurance, 34(3), 323-359.
Mills, E., 2012: The greening of insurance. Science, 338(6113), 1424-1425.
Mills, E. and E. Lecomte, 2006: From Risk to Opportunity: How Insurers can Proactively
and Profitably Manage Climate Change. Ceres, Boston, MA, USA, 42 pp.
Minero, F.J.G., P. Candau, J. Morales, and C. Tomas, 1998: Forecasting olive crop
production based on ten consecutive years of monitoring airborne pollen in
Andalusia (southern Spain). Agriculture, Ecosystems & Environment, 69(3),
201-215.
Ministry of Municipal Affairs and Housing, 2011: Potential Changes for the Next
Edition of the Building Code: Second Round of Consultation (February-April
2011). Queen’s Printer for Ontario, Toronto, ON, Canada, 46 pp.
Minville, M., F. Brissette, S. Krau, and R. Leconte, 2009: Adaptation to climate change
in the management of a Canadian water-resources system exploited for
hydropower. Water Resources Management, 23(14), 2965-2986.
Mirza, M.S. and M. Haider, 2003: The State of Infrastructure in Canada: Implications
for Infrastructure Planning and Policy. Research and Analysis, Infrastructure
Canada, Ottawa, ON, Canada, 38 pp.
Molnar, J.J., 2010: Climate change and societal response: livelihoods, communities,
and the environment. Rural Sociology, 75(1), 1-16.
Monkkonen, P., 2011: The housing transition in Mexico: expanding access to housing
finance. Urban Affairs Review, 47(5), 672-695.
Montero Martínez, M.J., J. Martínez Jiménez, N.I. Castillo Pérez, and B.E. Espinoza
Tamarindo, 2010: Capitulo 2. Escenarios climáticos en México proyectados para
el siglo XXI: precipitación y temperaturas máxima y mínima [Chapter 2. Climate
scenarios projected for the twenty-first century in Mexico: precipitation and
maximum and minimum temperatures]. In: Efectos del Cambio Climático en
los Recursos Hídricos de México, Volumen III. Atlas de Vulnerabilidad Hídrica
en México ante el Cambio Climático [Atlas of Water Vulnerability to Climate
Change in Mexico]. Instituto Mexicano de Tecnología del Agua, Jiutepec,
Morales, Mexico, pp. 39-63.
Monterroso, A., C. Conde, C. Gay, D. Gómez, and J. López, 2012: Two methods to
assess vulnerability to climate change in the Mexican agricultural sector.
Mitigation and Adaptation Strategies for Global Change (in press), doi:10.1007/
s11027-012-9442-y.
Monterroso Rivas, A.I., C. Conde Álvarez, G. Rosales Dorantes, J.D. Gómez Díaz, and
C. Gay García, 2011: Assessing current and potential rainfed maize suitability
under climate change scenarios in Mexico. Atmósfera, 24(1), 53-67.
Moran, D., A. Lucas, and A. Barnes, 2013: Commentary: mitigation win-win. Nature
Climate Change, 3, 611-613.
Morello-Frosch, R., M. Pastor Jr., C. Porras, and J. Sadd, 2002: Environmental justice
and regional inequality in southern California: implications for future research.
Environmental Health Perspectives, 110(2 Suppl.), 149-154.
Morin, C.W. and A.C. Comrie, 2010: Modeled response of the West Nile virus vector
Culex quinquefasciatus to changing climate using the dynamic mosquito
simulation model. International Journal of Biometeorology, 54(5), 517-529.
Moritz, C., C. Hoskin, J. MacKenzie, B. Phillips, M. Tonione, N. Silva, J. VanDerWal, S.
Williams, and C. Graham, 2009: Identification and dynamics of a cryptic suture
zone in tropical rainforest. Proceedings of the Royal Society B, 276(1660),
1235-1244.
Morton, T., P. Bretschneider, D. Coley, and T. Kershaw, 2011: Building a better future: an
exploration of beliefs about climate change and perceived need for adaptation
within the building industry. Building and Environment, 46, 1151-1158.
Mortsch, L.D., 2006: Impact of climate change on agriculture, forestry and wetlands.
In: Climate Change and Managed Ecosystems [Bhatti, J.S., R. Lal, M.J. Apps, and
M.A. Price (eds.)]. Taylor & Francis, CRC Press, Boca Raton, FL, USA, pp. 45-67.
Moser, C. and D. Satterthwaite, 2008: Chapter 9: Towards pro-poor adaptation to
climate change in the urban centres of low-and middle-income countries. In:
Social Dimensions of Climate Change Equity and Vulnerability in a Warming
World [Mearns, R. and A. Norton (eds.)]. New Frontiers of Social Policy 52097,
The International Bank for Reconstruction and Development / The World Bank,
Washington, DC, USA, pp. 231-258.
Moser, S.C., 2013: Navigating the political and emotional terrain of adaptation:
community engagement when climate change comes home. In: Successful
Adaptation to Climate Change: Linking Science and Practice in a Rapidly
Changing World [Moser, S.C. and M.T. Boykoff (eds.)]. Routledge, London, UK,
pp. 289-305.
Moser, S.C. and J.A. Ekstrom, 2010: A framework to diagnose barriers to climate
change adaptation. Proceedings of the National Academy of Sciences of the
United States of America, 107(51), 22026-22031.
Mote, P.W., 2006: Climate-driven variability and trends in mountain snowpack in
western North America. Journal of Climate, 19(23), 6209-6220.
Mumby, P.J., I.A. Elliott, C.M. Eakin, W. Skirving, C.B. Paris, H.J. Edwards, S. Enríquez,
R. Iglesias-Prieto, L.M. Cherubin, and J.R. Stevens, 2011: Reserve design for
uncertain responses of coral reefs to climate change. Ecology Letters, 14(2),
132-140.
Mumme, S.P., 1999: Managing acute water scarcity on the U.S.-Mexico border:
institutional issues raised by the 1990’s drought. Natural Resources Journal,
39(1), 149-166.
Munich Re, 2011: Topics Geo: Natural Catastrophes 2010: Analyses, Assessments,
Positions. Munich Reinsurance Company (Munich Re), Munich, Germany, 52 pp.
Munich Re, 2012: Severe Weather in North America: Perils, Risks, Insurance.
Knowledge Series: Natural Hazards, Munich Reinsurance Company (Munich
Re), Munich, Germany, 274 pp.
Murazaki, K. and P. Hess, 2006: How does climate change contribute to surface ozone
change over the United States? Journal of Geophysical Research: Atmospheres,
111(D5), D05301, doi:10.1029/2005JD005873.
Nadler, A.J. and P.R. Bullock, 2011: Long-term changes in heat and moisture related
to corn production on the Canadian Prairies. Climatic Change, 104(2), 339-
352.
Naeher, L.P., M. Brauer, M. Lipsett, J.T. Zelikoff, C.D. Simpson, J.Q. Koenig, and K.R.
Smith, 2007: Woodsmoke health effects: a review. Inhalation Toxicology, 19(1),
67-106.
Najjar, R.G., C.R. Pyke, M.B. Adams, D. Breitburg, C. Hershner, M. Kemp, R. Howarth,
M.R. Mulholland, M. Paolisso, D. Secor, K. Sellner, D. Wardrop, and R. Wood,
2010: Potential climate-change impacts on the Chesapeake Bay. Estuarine,
Coastal and Shelf Science, 86(1), 1-20.
Nakaegawa, T., A. Kitoh, and M. Hosaka, 2013: Discharge of major global rivers in
the late 21
st
century climate projected with the high horizontal resolution MRI-
AGCMs. Hydrological Processes, 27(23 SI), 3301-3318.
NatCatSERVICE, 2013: Downloadcenter for Statistics on Natural Catastrophes,
Period 1/1/1993-31/12/2012. Geo Risks Research, Munich Reinsurance Company,
Munich, Germany, www.munichre.com/en/reinsurance/business/non-life/
natcatservice/index.html.
National Energy Board, 2011: Canada’s Energy Future: Energy Supply and Demand
Projections to 2035. An Energy Market Assessment, November 2011, National
Energy Board, Ottawa, ON, Canada, 64 pp.
Natural Resources Canada, 2011: Canada’s Regional Adaptation Collaborative
Program: Helping Canadians Prepare for and Adapt to Climate Change –
Factsheet. Government of Canada, Ottawa, ON, Canada, 1 pp.
Natural Resources Canada, 2013: Adaptation Platform 1
st
Annual Report. Government
of Canada, Ottawa, ON, Canada, 26 pp.
Natural Resources Working Lands and Waters Topic Advisory Group, 2011:
Washington State Climate Change Response Strategy: Interim Recommendations
of the Natural Resources: Working Lands and Waters Topic Advisory Group
(TAG 4). Department of Ecology, State of Washington, Olympia, WA, USA,
44 pp.
Nawrotski, R.J., F. Riosmena, and L.M. Hunter, 2013: Do rainfall deficits predict U.S.-
bound migration from rural Mexico? Evidence from the Mexican census.
Population Research Policy Review, 32(1), 129-158.
NCADAC, 2013: Climate Change Impacts in the United States: The Third National
Climate Assessment: Draft for Public Review [Melillo, J.M., T. Richmond, and
G.W. Yohe (eds.)]. National Climate Assessment and Development Advisory
Committee (NCADAC), United States Global Change Research Program,
Washington, DC, USA, 1284 pp., www.globalchange.gov/ncadac.

1492
Chapter 26 North America
26
Nelson, G.C., M.W. Rosegrant, J. Koo, R. Robertson, T. Sulser, T. Zhu, C. Ringler, S.
Msangi, A. Palazzo, M. Batka, M. Magalhaes, R. Valmonte-Santos, M.
Ewing, and D. Lee, 2009: Climate Change: Impact on Agriculture and Costs of
Adaptation. International Food Policy Research Institute (IFPRI), Washington,
DC, USA, 19 pp.
Neria, Y. and J.M. Shultz, 2012: Mental health effects of Hurricane Sandy:
characteristics, potential aftermath, and response. The Journal of the American
Medical Association, 308(24), 2571-2572.
New York City Department of Environmental Protection, 2008: Assessment and
Action Plan: Report 1: A Report Based on the Ongoing Work of the DEP Climate
Change Task Force. New York City Department of Environmental Protection
(DEP), New York, NY, USA, 100 pp., www.nyc.gov/html/dep/pdf/climate/
climate_complete.pdf.
New York State Climate Action Council, 2012: Climate Action Plan: Interim Report.
Interim Report 11-9-10, New York State Climate Action Council, Albany, NY,
USA, 428 pp.
Newland, K., D.R. Agunias, and A. Terrazas, 2008: Learning by Doing: Experiences of
Circular Migration. Policy Brief of the Program on Migrants, Migration, and
Development, Migration Policy Institute, Washington, DC, USA, 27 pp.
Nicholls, R.J., S. Hanson, C. Herweijer, N. Patmore, S. Hallegatte, J. Corfee-Morlot, J.
Château, and R. Muir-Wood, 2008: Ranking Port Cities with High Exposure and
Vulnerability to Climate Extremes. OECD Environment Working Papers, No. 1,
Organisation for Economic Co-operation and Development (OECD) Publishing,
Paris, France, 62 pp.
Nielsen-Gammon, J.W., 2011: The 2011 Texas Drought. A Briefing Packet for the
Texas Legislature.The Office of the State Climatologist, College of Geosciences,
Texas A&M University, College Station, TX, USA, 43 pp.
Niven, R.V., N.M. Hutson, L. Loftus-Otway, and L.B. Boske, 2010: Transportation
Infrastructure Planning in Mexico. Presented at the Transportation Research
Board 89th Annual Meeting, January 10-14, 2010, Washington, DC, USA,
20 pp.
NOAA, 2013: Service Assessment:Hurricane/Post-Tropical Cyclone Sandy October
22-29, 2012. United States Department of Commerce, National Oceanic and
Atmospheric Administration (NOAA), National Weather Service, Silver Spring,
MD, USA, 66 pp.
NOAA NCDC, 2013: State of the Climate: Wildfires – Annual 2012. U.S. Department
of Commerce, National Oceanographic and Atmospheric Administration
(NOAA), National Climate Data Center (NCDC), Asheville, NC, USA,
www.ncdc.noaa.gov/sotc/fire/2012/13.
Nolte, C.G., A.B. Gilliland, C. Hogrefe, and L.J. Mickley, 2008: Linking global to
regional models to assess future climate impacts on surface ozone levels in
the United States. Journal of Geophysical Research: Atmospheres, 113(D14),
D14307, doi:10.1029/2007JD008497.
Nordstrom, D.K., 2009: Acid rock drainage and climate change. Journal of
Geochemical Exploration, 100(2-3), 97-104.
North, M., B.M. Collins, and S. Stephens, 2012: Using fire to increase the scale,
benefits, and future maintenance of fuels treatments. Journal of Forestry,
110(7), 392-401.
NRC, 1995: Flood Risk Management and the American River Basin: An Evaluation.
Committee on Flood Control Alternatives in the American River Basin, Water
Science and Technology Board, and Commission on Geosciences, Environment,
and Resources, National Research Council (NRC), The National Academies Press,
Washington, DC, USA, 235 pp.
NRC, 2010: Adapting to the Impacts of Climate Change. America’s Climate Choices:
Panel on Adapting to the Impacts of Climate Change, The National Research
Council (NRC), The National Academies Press, Washington, DC, USA, 292 pp.
NRTEE, 2012: Facing the Elements: Building Business Resilience in a Changing
Climate – Case Studies. Climate Prosperity: Report 05, Canadian National
Round Table on the Environment and the Economy (NRTEE), Ottawa, ON,
Canada, 97 pp.
Ntelekos, A.A., M. Oppenheimer, J.A. Smith, and A.J. Miller, 2010: Urbanization,
climate change and flood policy in the United States. Climatic Change, 103(3-4),
597-616.
Nunavut Department of Sustainable Development, 2003: Nunavut Climate
Change Strategy. Nunavut Department of Sustainable Development, Iqaluit,
NU, Canada, 26 pp.
Obeysekera, J., M. Irizarry, J. Park, J. Barnes, and T. Dessalegne, 2011: Climate change
and its implications for water resources management in south Florida. Stochastic
Environmental Research and Risk Assessment, 25(4), 495-516.
OECD, 2010: Chapter 1. General assessment of the macroeconomic situation. In:
OECD Economic Outlook, Vol. 2010(1). Organisation for Economic Co-operation
and Development (OECD) Publishing, Paris, France, pp. 13-76, www.oecd-
ilibrary.org/economics/oecd-economic-outlook-volume-2010-issue-1_eco_
outlook-v2010-1-en.
Ogden, A.E. and J.L. Innes, 2009: Application of structured decision making to an
assessment of climate change vulnerabilities and adaptation options for
sustainable forest management. Ecology and Society, 14(1), 11, www.ecology
andsociety.org/vol14/iss1/art11/.
Ogden, N.H., L. St.-Onge, I.K. Barker, S. Brazeau, M. Bigras-Poulin, D.F. Charron, C.M.
Francis, A. Heagy, L.R. Lindsay, A. Maarouf, P. Michel, F. Milord, C. O’Callaghan
J., L. Trudel, and R.A. Thompson, 2008: Risk maps for range expansion of the
Lyme disease vector, Ixodes scapularis, in Canada now and with climate change.
International Journal of Health Geographics, 7(1), 24, doi:10.1186/1476-072X-
7-24.
Okey, T.A., H.M. Alidina, V. Lo, A. Montenegro, and S. Jessen, 2012: Climate Change
Impacts and Vulnerabilities in Canada’s Pacific Marine Ecosystems. Canadian
Parks and Wilderness Society (British Columbia Chapter), and World Wildlife
Fund Canada, Vancouver, BC, Canada, 156 pp.
O’Neill, M.S. and K.L. Ebi, 2009: Temperature extremes and health: impacts of climate
variability and change in the United States. Journal of Occupational and
Environmental Medicine, 51(1), 13-25.
Ontario Ministry of Environment, 2011: Climate Ready: Ontario’s Adaptation
Strategy and Action Plan 2011-2014. Queen’s Printer for Ontario, Toronto, ON,
Canada, 124 pp.
Oppenheimer, M., 2013: Climate change impacts: accounting for the human
response. Climatic Change, 117(3), 439-449.
Orlowsky, B. and S.I. Senevirantne, 2013: Elusive drought: uncertainty in observed
trends and short- and long-term CMIP5 projections. Hydrology and Earth
System Sciences, 17, 1765-1781.
Ouellet, C., D. Saint-Laurent, and F. Normand, 2012: Flood events and flood risk
assessment in relation to climate and land-use changes: Saint-François River,
southern Québec, Canada. Hydrological Sciences Journal, 57(2), 313-325.
Overpeck, J. and B. Udall, 2010: Dry times ahead. Science, 328(5986), 1642-
1643.
Pan, Z., R.W. Arritt, E.S. Takle, W.J.J. Gutowski, C.J. Anderson, and M. Segal, 2004:
Altered hydrologic feedback in a warming climate introduces a ‘’warming hole’’.
Geophysical Research Letters, 31(17), L17109, doi:10.1029/2004GL020528.
Park, W.A., C.D. Allen, A.K. Macalady, D. Griffin, C.A. Woodhouse, D.M. Meko, T.W.
Swetnam, S.A. Rauscher, R. Seager, H. Grissino-Mayer, J.S. Dean, E.R. Cook, C.
Gangodagamage, M. Cai, and N.G. McDowell, 2013: Temperature as a potent
driver of regional forest drought stress and tree mortality. Nature Climate
Change, 3(3), 292-297.
Parkins, J.R., 2008: The metagovernance of climate change: institutional adaptation
to the mountain pine beetle epidemic in British Columbia. Journal of Rural and
Community Development, 3(2), 7-26.
Parkins, J.R. and N.A. MacKendrick, 2007: Assessing community vulnerability: a study
of the mountain pine beetle outbreak in British Columbia, Canada. Global
Environmental Change, 17(3-4), 460-471.
Parmesan, C., 2006: Ecological and evolutionary responses to recent climate change.
Annual Review of Ecology Evolution and Systematics, 37, 637-669.
Parris, A., C. Simpson, and S. Abdelrahim (eds.), 2010: RISA Workshop Report: Looking
Ahead at Climate Service, Assessment, and Adaptation. National Oceanographic
and Atmospheric Administration (NOAA), Climate Program Office, Silver Spring,
MD, USA, 25 pp.
Patriquin, M.N., A.M. Wellstead, and W.A. White, 2007: Beetles, trees and people:
regional economic impact sensitivity and policy considerations related to the
mountain pine beetle infestation in British Columbia, Canada. Forest Policy and
Economics, 9(8), 938-946.
Patz, J., S.J. Vavrus, C.K. Uejio, and S.L. McLellan, 2008: Climate change and water-
borne disease risk in the Great Lakes region of the U.S. American Journal of
Preventive Medicine, 35(5), 451-458.
Paudel, K.P. and L.U. Hatch, 2012: Global warming, impact on agriculture and
adaptation strategy. Natural Resource Modeling, 25(3), 456-481.
Peach, J. and J. Williams, 2000: Population and economic dynamics on the U.S.-Mexican
border: past, present, and future. In: The U.S.-Mexican Border Environment: A
Road Map to a Sustainable 2020 [Ganster, P. (ed.)]. SCERP Monograph Series,
No.1, Southwest Center for Environmental Research and Policy (SCERP), San
Diego State University (SDSU) Press, San Diego, CA, pp. 37-72.

1493
North America Chapter 26
26
Pearce, T.D., J.D. Ford, J. Prno, F. Duerden, J. Pittman, M. Beaumier, L. Berrang-Ford,
and B. Smit, 2011: Climate change and mining in Canada. Mitigation and
Adaptation Strategies for Global Change, 16(3), 347-368.
Pearson, C.J., D. Bucknell, and G.P. Laughlin, 2008: Modelling crop productivity and
variability for policy and impacts of climate change in eastern Canada.
Environmental Modelling & Software, 23(12), 1345-1355.
Peng, C., Z. Ma, X. Lei, Q. Zhu, H. Chen, W. Wang, S. Liu, W. Li, X. Fang, and X. Zhou,
2011: A drought-induced pervasive increase in tree mortality across Canada’s
boreal forests. Nature Climate Change, 1(9), 467-471.
Perkins, B., D. Ojima, and R. Corell, 2007: A Survey of Climate Change Adaptation
Planning.The H. John Heinz III Center for Science, Economics and the Environment,
Washington, DC, USA, 52 pp.
Peter, B., S. Want, T. Mogus, and B. Wilson, 2006: Fire risk and population trends in
Canada’s wildland-urban interface. In: Canadian Wildland Fire Strategy:
Background, Syntheses, Analyses, and Perspectives [Kirsch, K.G. and P. Fuglem
(eds.)]. Canadian Council for Forest Ministries, Edmonton, AB, Canada, pp. 37-48.
Peterson, T.C. and M.O. Baringer, 2009: State of the climate in 2008. Bulletin of the
American Meteorological Society, 90(8), S1-S196.
Peterson, T.C., X. Zhang, M. Brunet-India, and J.L. Vázquez-Aguirre, 2008: Changes in
North American extremes derived from daily weather data. Journal of Geophysical
Research: Atmospheres, 113(D7), D07113, doi:10.1029/2007JD009453.
Peterson, T.C., R.R. Heim Jr., R. Hirsch, D.P. Kaiser, H. Brooks, N.S. Diffenbaugh, R.M.
Dole, J.P. Giovannettone, K. Guirguis, T.R. Karl, R.W. Katz, K. Kunkel, D.
Lettenmair, G.J. McCabe, C.J. Paciorek, K.R. Ryberg, S. Schubert, V.B.S. Silva, B.G.
Stewart, A.V. Vecchia, G. Villiarini, R.S. Vose, J. Walsh, M. Wehner, D. Wolock, K.
Wolter, G.A. Woodhouse, and D. Wuebbles, 2013: Monitoring and understanding
changes in heat waves, cold waves, floods and droughts in the United States:
state of knowledge. Bulletin of the American Meteorological Society, 94(6),
821-834.
Phillips, O.L., L. Aragao, S.L. Lewis, J.B. Fisher, J. Lloyd, G. Lopez-Gonzalez, Y. Malhi, A.
Monteagudo, J. Peacock, and C.A. Quesada, 2009: Drought sensitivity of the
Amazon rainforest. Science, 323(5919), 1344-1347.
Picketts, I.M., J. Curry, and E. Rapaport, 2012: Community adaptation to climate
change: environmental planners’ knowledge and experiences in British Columbia,
Canada. Journal of Environmental Policy & Planning, 14(2), 119-137.
Pielke Jr., R.A., J. Gratz, C.W. Landsea, D. Collins, M.A. Saunders, and R. Musulin,
2008: Normalized hurricane damage in the United States: 1900-2005. Natural
Hazards Review, 9(1), 29-42.
Pierce, J. and G. Meyer, 2008: Long-term fire history from alluvial fan sediments: the
role of drought and climate variability, and implications for management of
Rocky Mountain forests. International Journal of Wildland Fire, 17(1), 84-95.
Pinkerton, K.E., W.N. Rom, M. Akpinar-Elci, J.R. Balmes, H. Bayram, O. Brandli, J.W.
Hollingsworth, P.L. Kinney, H.G. Margolis, W.J. Martin, E.N. Sasser, K.R. Smith,
and T.K. Takaro, 2012: An official American Thoracic Society workshop report:
climate change and human health. Proceedings of the American Thoracic Society,
9(1), 3-8.
Poiani, K.A., R.L. Goldman, J. Hobson, J.M. Hoekstra, and K.S. Nelson, 2011: Redesigning
biodiversity conservation projects for climate change: examples from the field.
Biodiversity and Conservation, 20(1), 185-201.
Poirier, B. and R.C. de Loë, 2012: Protecting aquatic ecosystems in heavily-allocated
river systems: the case of the Oldman River Basin, Alberta. The Canadian
Geographer, 55(2), 243-261.
Ponce-Reyes, R., E. Nicholson, P.W. Baxter, R.A. Fuller, and H. Possingham, 2013:
Extinction risk in cloud forest fragments under climate change and habitat loss.
Diversity and Distributions, 19(5-6), 518-529.
Porter, J.R. and M.A. Semenov, 2005: Crop responses to climatic variation.
Philosophical Transactions of the Royal Society B, 360(1463), 2021-2035.
Portmann, R.W., S. Solomon, and G.C. Hegerl, 2009: Spatial and seasonal patterns
in climate change, temperatures, and precipitation across the United States.
Proceedings of the National Academy of Sciences of the United States of
America, 106(18), 7324-7329.
Posey, J., 2009: The determinants of vulnerability and adaptive capacity at the
municipal level: evidence from floodplain management programs in the United
States. Global Environmental Change, 19(4), 482-493.
Potera, C., 2011: Indoor air quality: climate change impacts indoor environment.
Environmental Health Perspectives, 119(9), A382, doi:10.1289/ehp.119-a382.
Powell, T., D. Hanfling, and L.O. Gostin, 2012: Emergency preparedness and public
health: the lessons of Hurricane Sandy. Journal of the American Medical
Association, 308(24), 2569-2570.
Praskievicz, S. and H. Chang, 2011: Impacts of climate change and urban development
on water resources in the Tualatin River Basin, Oregon. Annals of the Association
of American Geographers, 101(2), 249-271.
Pratchett, M.S., P.L. Munday, S.K. Wilson, N.A.J. Graham, J.E. Cinner, D.R. Bellwood,
G.P. Jones, N.V.C. Polunin, and T.R. McClanahan, 2008: Effects of climate-induced
coral bleaching on coral-reef fishes –ecological and economic consequences.
Oceanography and Marine Biology: An Annual Review, 46, 251-296.
Preston, B.L., R.M. Westaway, and E.J. Yuen, 2011: Climate adaptation planning in
practice: an evaluation of adaptation plans from three developed nations.
Mitigation and Adaptation Strategies for Global Change, 16(4), 407-438.
Prieto-González, R., V.E. Cortés-Hernández, and M.J. Montero-Martínez, 2011:
Variability of the standardized precipitation index over México under the A2
climate change scenario. Atmósfera, 24(3), 243-249.
Prokoph, A., J. Adamowski, and K. Adamowski, 2012: Influence of the 11 year solar
cycle on annual streamflow maxima in Southern Canada. Journal of Hydrology,
442-443, 55-62.
Pryor, S.C., R.J. Barthelmie, D.T. Young, E.S. Takle, R.W. Arritt, D. Flory, W.J.J. Gutowski,
A. Nunes, and J. Roads, 2009: Wind speed trends over the contiguous United
States. Journal of Geophysical Research: Atmospheres, 114(D14), D14105,
doi:10.1029/2008JD011416.
Pye, H.O.T., H. Liao, S. Wu, L.J. Mickley, D.J. Jacob, D.K. Henze, and J.H. Seinfeld, 2009:
Effect of changes in climate and emissions on future sulfate-nitrate-ammonium
aerosol levels in the United States. Journal of Geophysical Research:
Atmospheres, 114(D1), D01205, doi:10.1029/2008JD010701.
Quist, D. and I.H. Chapela, 2001: Transgenic DNA introgressed into traditional maize
landraces in Oaxaca, Mexico. Nature, 414(6863), 541-543.
Racherla, P.N. and P.J. Adams, 2009: U.S. ozone air quality under changing climate
and anthropogenic emissions. Environmental Science & Technology, 43(3), 571-
577.
Radeloff, V.C., R.B. Hammer, S.I. Stewart, J.S. Fried, S.S. Holcomb, and J.S. McKeefry,
2005: The wildland-urban interface in the United States. Ecological Applications,
15(3), 799-805.
Raffa, K.F., B.H. Aukema, B.J. Bentz, A.L. Carroll, J.A. Hicke, M.G. Turner, and W.H.
Romme, 2008: Cross-scale drivers of natural disturbances prone to
anthropogenic amplification: the dynamics of bark beetle eruptions. BioScience,
58(6), 501-517.
Ramos, M.M., H. Mohammed, E. Zielinski-Gutierrez, M.H. Hayden, J.L.R. Lopez, M.
Fournier, A.R. Trujillo, R. Burton, J.M. Brunkard, L. Anaya-Lopez, A.A. Banicki,
P.K. Morales, B. Smith, J.L. Muñoz, S.H. Waterman, and the Dengue Serosurvey
Working Group, 2008: Epidemic dengue and dengue hemorrhagic fever at the
Texas-Mexico border: results of a household-based seroepidemiologic survey,
December 2005. The American Journal of Tropical Medicine and Hygiene, 78(3),
364-369.
Rasmussen, A., 2002: The effects of climate change on the birch pollen season in
Denmark. Aerobiologia, 18(3), 253-265.
Ray, A., J. Vogel, J.B. Smith, and P. Kovacs, 2013: Adaptation to Climate Change in
the United States: Examples from Municipalities, Water Resources, and
Insurance. Stratus Consulting, Boulder, CO, USA.
Reba, M.L., D. Marks, A. Winstral, T.E. Link, and M. Kumar, 2011: Sensitivity of the
snowcover energetics in a mountain basin to variations in climate. Hydrological
Processes, 25(21), 3312-3321.
Reisen, F. and S.K. Brown, 2009: Australian firefighters’ exposure to air toxics during
bushfire burns of autumn 2005 and 2006. Environment International, 35(2),
342-352.
Reisen, F., D. Hansen, and C. Meyer, 2011: Exposure to bushfire smoke during
prescribed burns and wildfires: firefighters’ exposure risks and options.
Environment International, 37(2), 314-321.
Reiss, N.M. and S.R. Kostic, 1976: Pollen season severity and meteorologic parameters
in central New Jersey. The Journal of Allergy and Clinical Immunology, 57(6),
609-614.
Reiter, P., 2008: Climate change and mosquito-borne disease: knowing the horse
before hitching the cart. Revue Scientifique et Technique [International Office
of Epizooties], 27(2), 383-398.
Repetto, R., 2008: The Climate Crisis and the Adaptation Myth. Yale School of
Forestry and Environmental Studies Working Paper No. 13, Yale Printing and
Publishing Services, New Haven, CT, USA, 20 pp.
Polansek, T. 2012: US Army Corps fights to keep Mississippi River open for shipping.
Reuters, December 28, 2012, http://in.reuters.com/article/2012/12/27/
mississippi-river-corps-idUSL1E8NR6ZN20121227.

1494
Chapter 26 North America
26
Richardson, G.R.A., 2010: Adapting to Climate Change: An Introduction for Canadian
Municipalities. Natural Resources Canada, Ottawa, ON, Canada, 40 pp.
Riojas-Rodriguez, H., M. Hurtado-Diaz, G.L. Moreno-Banda, and A. Castaneda
Martinez, 2011: Mapping Human Health Vulnerability to Climate Change in
Mexico. Presented at: “The Encompassing Face of Environmental Epidemiology,”
the 23
rd
Annual Conference of the International Society for Environmental
Epidemiology (ISEE) 2011, Sept 13-16, 2011, Barcelona, Spain, ISEE Secretariat,
Boston, MA, USA, ehp.niehs.nih.gov/isee/PDF/ISEE11Abstract01332.pdf.
Rittmaster, R., W. Adamowicz, B. Amiro, and R.T. Pelletier, 2006: Economic analysis
of health effects from forest fires. Canadian Journal of Forest Research, 36(4),
868-877.
Robertson, R., D. Brown, G. Pierre, and M.L. Sanchez-Puerta (eds.), 2009: Globalization,
Wages, and the Quality of Jobs: Five Country Studies. The World Bank,
Washington, DC, USA, 282 pp.
Romero-Lankao, P., 2007: How do local governments in Mexico City manage global
warming? Local Environment, 12(5), 519-535.
Romero-Lankao, P., 2010: Water in Mexico City: what will climate change bring to
its history of water-related hazards and vulnerabilities? Environment and
Urbanization, 22(1), 157-178.
Romero-Lankao, P., 2012: Governing carbon and climate in the cities: an overview
of policy and planning challenges and options. European Planning Studies,
20(1), 7-26.
Romero-Lankao, P. and D. Dodman, 2011: Cities in transition: transforming urban
centers from hotbeds of GHG emissions and vulnerability to seedbeds of
sustainability and resilience: introduction and editorial overview. Current
Opinion in Environmental Sustainability, 3(3), 113-120.
Romero-Lankao, P. and H. Qin, 2011: Conceptualizing urban vulnerability to global
climate and environmental change. Current Opinion in Environmental
Sustainability, 3(3), 142-149.
Romero-Lankao, P., H. Qin, S. Hughes, M. Haeffner, and M. Borbor-Cordova, 2012a:
Urban vulnerability and adaptation to the health impacts of air pollution and
climate extremes in Latin American cities. In: Urban Areas and Global Climate
Change: Research in Urban Sociology,Vol. 12 [Holt, W.G. (ed.)]. Emerald Group
Publishing Ltd., Bingley, UK, pp. 247-275.
Romero-Lankao, P., H. Qin, and K. Dickinson, 2012b: Urban vulnerability to
temperature-related hazards: a meta-analysis and meta-knowledge approach.
Global Environmental Change, 22(3), 670-683.
Romero-Lankao, P., S. Hughes, A. Rosas-Huerta, R. Borquez, and D.M. Gnatz, 2013a:
Institutional capacity for climate change responses: an examination of
construction and pathways in Mexico City and Santiago. Environment and
Planning C: Government and Policy, 31(5), 785-805.
Romero-Lankao, P., H. Qin, and M. Borbor-Cordova, 2013b: Exploration of health
risks related to air pollution and temperature in three Latin American cities.
Social Science & Medicine, 83, 110-118.
Romsdahl, R., L. Atkinson, and J. Schultz, 2013: Planning for climate change across
the US Great Plains: concerns and insights from government decision-makers.
Journal of Environmental Studies and Sciences, 3(1), 1-14.
Rood, S.B., J. Pan, K.M. Gill, C.G. Franks, G.M. Samuelson, and A. Shepherd, 2008:
Declining summer flows of Rocky Mountain rivers: changing seasonal
hydrology and probable impacts on floodplain forests. Journal of Hydrology,
349(3), 397-410.
Roorda, M.J., A. Páez, C. Morency, R. Mercado, and S. Farber, 2010: Trip generation
of vulnerable populations in three Canadian cities: a spatial ordered probit
approach. Transportation, 37(3), 525-548.
Root, T.L., D.P. MacMynowski, M.D. Mastrandrea, and S.H. Schneider, 2005: Human-
modified temperatures induce species changes: joint attribution. Proceedings
of the National Academy of Sciences of the United States of America, 102(21),
7465-7469.
Rose, J.B., P.R. Epstein, E.K. Lipp, B.H. Sherman, S.M. Bernard, and J.A. Patz, 2001:
Climate variability and change in the United States: potential impacts on water-
and foodborne diseases caused by microbiologic agents. Environmental Health
Perspectives, 109(2 Suppl.), 211-221.
Rose, S. and R. Shaw, 2008: The gamble: circular Mexican migration and the return
on remittances. Mexican Studies/Estudios Mexicanos, 24(1), 79-111.
Rosenthal, J., 2009: Climate change and the geographic distribution of infectious
diseases. EcoHealth, 6(4), 489-495.
Rosenzweig, C. and W. Solecki, 2010: Introduction to climate change adaptation in
New York City: building a risk management response. Annals of the New York
Academy of Sciences, 1196(1), 13-18.
Rosenzweig, C., G. Casassa, D.J. Karoly, A. Imeson, C. Liu, A. Menzel, S. Rawlins, T.L.
Root, B. Seguin, and P. Tryjanowski, 2007: Assessment of observed changes and
responses in natural and managed systems. In: Climate Change 2007: Impacts,
Adaptation and Vulnerability. Contribution of Working Group II to the Fourth
Assessment Report of the Intergovernmental Panel on Climate Change [M. L.
Parry, O.F. Canziani, J.P. Palutikof, P.J. van der Linden, and C.E. Hanson (eds.)].
Cambridge University Press, Cambridge, UK and New York, NY, USA, pp. 79-131.
Rosenzweig, C., D.C. Major, K. Demong, C. Stanton, R. Horton, and M. Stults, 2007:
Managing climate change risks in New York City’s water system: assessment
and adaptation planning. Mitigation and Adaptation Strategies for Global
Change, 12(8), 1391-1409.
Rosenzweig, C., W. Solecki, S.A. Hammer, and S. Mehrotra, 2010: Cities lead the way
in climate-change action. Nature, 467(7318), 909-911.
Rosenzweig, C., W.D. Solecki, R. Blake, M. Bowman, C. Faris, V. Gornitz, R. Horton, K.
Jacob, A. LeBlanc, and R. Leichenko, 2011: Developing coastal adaptation to
climate change in the New York City infrastructure-shed: process, approach,
tools, and strategies. Climatic Change, 106(1), 93-127.
Ruddell, D., S.L. Harlan, S. Grossman-Clarke, and G. Chowell, 2011: Scales of perception:
public awareness of regional and neighborhood climates. Climatic Change,
111(3-4), 581-607.
Ruggiero, P., C.A. Brown, P.D. Komar, J.C. Allan, D.A. Reusser, and S. Rumril, 2010:
Chapter 6. Impacts of climate change on Oregon’s coasts and estuaries. In:
Oregon Climate Assessment Report [Dello, K.D. and P.W. Mote (eds.)]. College
of Oceanic and Atmospheric Sciences, Oregon State University, Corvallis, OR,
USA, pp. 15-17.
Ruiz-Moreno, D., I.S. Vargas, K.E. Olson, and L.C. Harrington, 2012: Modeling dynamic
introduction of Chikungunya virus in the United States. PLoS Neglected Tropical
Diseases, 6(11), e1918, doi:10.1371/journal.pntd.0001918.
Russell, R.C., 2009: Mosquito-borne disease and climate change in Australia: time
for a reality check. Australian Journal of Entomology, 48(1), 1-7.
Sahoo, G., S.G. Schladow, J.E. Reuter, and R. Coats, 2011: Effects of climate change
on thermal properties of lakes and reservoirs, and possible implications.
Stochastic Environmental Research and Risk Assessment, 25(4), 445-456.
Sakurai, G., T. Iizumi, and M. Yokozawa, 2011: Varying temporal and spatial effects
of climate on maize and soybean affect yield prediction. Climate Research, 49,
143-154.
Saldaña-Zorrilla, S.O., 2008: Stakeholders’ views in reducing rural vulnerability to
natural disasters in Southern Mexico: hazard exposure and coping and adaptive
capacity. Global Environmental Change, 18(4), 583-597.
Saldaña-Zorilla, S. and S. Sandberg, 2009: Impact of climate-related disasters on
human migration in Mexico: a spatial model. Climatic Change, 96(1-2), 97-118.
Sallenger Jr., A.H., K.S. Doran, and P.A. Howd, 2012: Hotspot of accelerated sea-
level rise on the Atlantic coast of North America. Nature Climate Change, 2(12),
884-888.
Sánchez-Cortés, M.S. and E.L. Chavero, 2011: Indigenous perception of changes in
climate variability and its relationship with agriculture in a Zoque community
of Chiapas, Mexico. Climatic Change, 107(3-4), 363-389.
Sanchez-Torres Esqueda, G., J.E. Ospina-Noreña, C. Gay-García, and C. Conde, 2010:
Vulnerability of water resources to climate change scenarios. Impacts on the
irrigation districts in the Guayalejo-Tamesí river basin, Tamaulipas, México.
Atmósfera, 24(1), 141-155.
Sandel, B., L. Arge, B. Dalsgaard, R. Davies, K. Gaston, W. Sutherland, and J. Svenning,
2011: The influence of Late Quaternary climate-change velocity on species
endemism. Science, 334(6056), 660-664.
Sander-Regier, R., R. McLeman, M. Brklacich, and M. Woodrow, 2009: Planning for
climate change in Canadian rural and resource-based communities. Environments
Journal, 37(1), 35-57.
Satterthwaite, D., S. Huq, H. Reid, M. Pelling, and P. Romero-Lankao, 2007: Adapting
to Climate Change in Urban Areas:The Possibilities and Constraints in Low-
and Middle-Income Nations. Climate Change and Cities Discussion Paper No.
1, Human Settlements Discussion Paper Series, Human Settlements Program of
the International Institute for Environment and Development (IIED), London,
UK, 107 pp.
Schaeffer, R., A.S. Szklo, A.F. Pereira de Lucena, B.S. Moreira Cesar Borba, L.P. Pupo
Nogueira, F.P. Fleming, A. Troccoli, M. Harrison, and M.S. Boulahya, 2012: Energy
sector vulnerability to climate change: a review. Energy, 38(1), 1-12.
Scheckenberger, R.B., A.C. Farrell, and M. Senior, 2009: Economic assessment of
climate change scenarios on drainage infrastructure design. In: Proceedings of
“Transportation in a Climate of Change,” the 2009 Annual Conference and

1495
North America Chapter 26
26
Exhibition of the Transportation Association of Canada (TAC), Vancouver, BC,
Canada, Economic Implications of Climate Change Session. TAC, Ottawa, ON,
Canada, conf.tac-atc.ca/english/resourcecentre/readingroom/conference/conf2009/
sessions/e_session21.htm.
Schindler, D.W. and W.F. Donahue, 2006: An impending water crisis in Canada’s
western prairie provinces. Proceedings of the National Academy of Sciences of
the United States of America, 103(19), 7210-7216.
Schlenker, W. and M.J. Roberts, 2009: Nonlinear temperature effects indicate severe
damages to US crop yields under climate change. Proceedings of the National
Academy of Sciences of the United States of America, 106(37), 15594-15598.
Schlenker, W., W.M. Hanemann, and A.C. Fisher, 2007: Water availability, degree
days, and the potential impact of climate change on irrigated agriculture in
California. Climatic Change, 81(1), 19-38.
Schloss, C.A., T.A. Nuñez, and J.J. Lawler, 2012: Dispersal will limit ability of mammals
to track climate change in the Western Hemisphere. Proceedings of the National
Academy of Sciences of the United States of America, 109(22), 8606-8611.
Scholze, M., W. Knorr, N.W. Arnell, and I.C. Prentice, 2006: A climate-change risk
analysis for world ecosystems. Proceedings of the National Academy of Sciences
of the United States of America, 103(35), 13116-13120.
Schroth, G., P. Laderach, J. Dempewolf, S.M. Philpott, J. Haggar, H. Eakin, T. Castillejos,
J. Garcia Moreno, L. Soto Pinto, R. Hernandez, A. Eitzinger, and J. Ramirez-
Villegas, 2009: Towards a climate change adaptation strategy for coffee
communities and ecosystems in the Sierra Madre de Chiapas, Mexico. Mitigation
and Adaptation Strategies for Global Change, 14(7), 605-625.
Schwalm, C.R., C.A. Williams, K. Schaefer, D. Baldocchi, T.A. Black, A.H. Goldstein,
B.E. Law, W.C. Oechel, K.T.P. U, and R.L. Scott, 2012: Reduction in carbon uptake
during turn of the century drought in western North America. Nature Geoscience,
5(8), 551-555.
Scott, D. and G. McBoyle, 2007: Climate change adaptation in the ski industry.
Mitigation and Adaptation Strategies for Global Change, 12(8), 1411-1431.
Scott, D., G. McBoyle, and A. Minogue, 2007: Climate change and Wuebec’s ski
industry. Global Environmental Change, 17(2), 181-190.
Scott, D., B. Amelung, S. Becken, J.-P. Ceron, G. Dubois, S. Gössling, P. Peeters, and M.
Simpson, 2008a: Part II: Technical report. In: Climate Change and Tourism:
Responding to Global Challenges [Cabrini, L., G. Vereczi, S. Fotiou, and L. Malone
(eds.)]. United Nations World Tourism Organization (UNWTO) and United
Nations Environment Programme (UNEP), UNWTO, Madrid, Spain and UNEP,
Paris, France, pp. 23-256.
Scott, D.J., Dawson, and B. Jones, 2008b: Climate change vulnerability of the US
Northeast winter recreation-tourism sector. Mitigation and Adaptation Strategies
for Global Change, 13(5-6), 577-596.
Scott, J., 2007: Agricultural Policy and Rural Poverty in Mexico. Working Paper 395,
Centro de Investigación y Docencia Económicas (CIDE), Mexico City, DF, Mexico,
39 pp.
Seager, R. and G.A. Vecchi, 2010: Greenhouse warming and the 21
st
century
hydroclimate of southwestern North America. Proceedings of the National
Academy of Sciences of the United States of America, 107(50), 21277-21282.
Seager, R., M. Ting, I. Held, Y. Kushnir, J. Lu, G. Vecchi, H. Huang, N. Harnik, A. Leetmaa,
N. Lau, C. Li, J. Velez, and N. Naik, 2007: Model projections of an imminent
transition to a more arid climate in southwestern North America. Science,
316(5828), 1181-1184.
Seager, R., A. Tzanova, and J. Nakamura, 2009: Drought in the southeastern United
States: causes, variability over the last millennium, and the potential for future
hydroclimate change. Journal of Climate, 22(19), 5021-5045.
Secretary of the Interior, 2010: Addressing the Impacts of Climate Change on
America’s Water, Land, and Other Natural and Cultural Resources. Office of the
Secretary of the Interior, Washington, DC, USA, 4 pp.
Sharp, J.H., 2010: Estuarine oxygen dynamics: what can we learn about hypoxia from
long-time records in the Delaware Estuary? Limnology and Oceanography,
55(2), 535-548.
Sheffield, J., E.F. Wood, and M.L. Roderick, 2012: Little change in global drought
over the past 60 years. Nature, 491(7424), 435-438.
Shepherd, A., K.M. Gill, and S.B. Rood, 2010: Climate change and future flows of
Rocky Mountain rivers: converging forecasts from empirical trend projection
and down-scaled global circulation modelling. Hydrological Processes, 24(26),
3864-3877.
Shrestha, R.R., M.A. Schnorbus, A.T. Werner, and A.J. Berland, 2012: Modelling spatial
and temporal variability of hydrologic impacts of climate change in the Fraser River
basin, British Columbia, Canada. Hydrological Processes, 26(12), 1841-1861.
Sillmann, J., V.V. Kharin, F.W. Zwiers, X. Zhang, and D. Bronaugh, 2013: Climate
extremes indices in the CMIP5 multimodel ensemble: Part 2. Future climate
projections. Journal of Geophysical Research: Atmospheres, 118(6), 2473-2493.
Simmons, K.M. and D. Sutter, 2007: Tornado shelters and the manufactured home
parks market. Natural Hazards, 43(3), 365-378.
Simmons, T.A., 1974: The Damnation of a Dam: The High Ross Dam Controversy.
Dissertation for Master of Arts, Department of Geography, Simon Fraser
University, Burnaby, BC, Canada, 227 pp.
Sinervo, B., F. Méndez-de-la-Cruz, D.B. Miles, B. Heulin, E. Bastiaans, M. Villagrán-
Santa Cruz, R. Lara-Resendiz, N. Martínez-Méndez, M.L. Calderón-Espinosa,
R.N. Meza-Lázaro, H. Gadsden, L.J. Avila, M. Morando, I.J. De la Riva, P.V.
Sepulveda, C.F.D. Rocha, N. Ibargüengoytía, C.A. Puntriano, M. Massot, V.
Lepetz, T.A. Oksanen, D.G. Chapple, A.M. Bauer, W.R. Branch, J. Clobert, and
J.W. Sites, 2010: Erosion of lizard diversity by climate change and altered
thermal niches. Science, 328(5980), 894-899.
Singer, B.D., L.H. Ziska, D.A. Frenz, D.E. Gebhard, and J.G. Straka, 2005: Research
note: increasing Amb a 1 content in common ragweed (Ambrosia artemisiifolia)
pollen as a function of rising atmospheric CO
2
concentration. Functional Plant
Biology, 32(7), 667-670.
Skinner, W.R., E. Shabbar, M.D. Flannigan, and K. Logan, 2006: Large forest fires in
Canada and the relationship to global sea surface temperatures. Journal of
Geophysical Research, 111(D14), D14106, doi:10.1029/2005JD006738.
Skoufias, E., K. Vinha, and H.V. Conroy, 2011: The Impacts of Climate Variability on
Welfare in Rural Mexico. Policy Research Working Paper 5555, Poverty Reduction
and Equity Unit of the Poverty Reduction and Economic Management Network,
The World Bank, Washington, DC, USA, 57 pp.
Smith, J.A., M.L. Baeck, G. Villarini, and W.F. Krajewski, 2010: The hydrology and
hydrometeorology of flooding in the Delaware River Basin. Journal of
Hydrometeorology, 11(4), 841-859.
Smith, J.A., G. Villarini, and M.L. Baeck, 2011: Mixture distributions and the
hydroclimatology of extreme rainfall and flooding in the eastern United States.
Journal of Hydrometeorology, 12(2), 294-309.
Smith, J.B., J.M. Vogel, and J.E.I. Cromwell, 2009: An architecture for government
action on adaptation to climate change. An editorial comment. Climatic
Change, 95(1-2), 53-61.
Smith, P. and P.J. Gregory, 2013: Climate change and sustainable food production.
Proceedings of the Nutrition Society, 1(1), 1-8.
Smolka, M.O. and A.A. Larangeira, 2008: Informality and poverty in Latin American
urban policies. In: The New Global Frontier: Urbanization, Poverty and Environment
in the 21
st
Century [Martine, G., G. McGranahan, M. Montgomery, and R.
Fernández-Castilla (eds.)]. Earthscan, London, UK, pp. 99-114.
Sohngen, B. and R. Sedjo, 2005: Impacts of climate change on forest product markets:
implications for North American producers. The Forestry Chronicle, 81(5), 669-
674.
Solecki, W., 2012: Urban environmental challenges and climate change action in
New York City. Environment and Urbanization, 24(2), 557-573.
Sosa-Rodriguez, F.S., 2010: Impacts of water-management decisions on the survival
of a city: from ancient Tenochtitlan to modern Mexico City. Water Resources
Development, 26(4), 675-687.
Sosa-Rodriguez, F.S., 2013: From federal to city mitigation and adaptation strategies:
climate change policy in Mexico. Mitigation and Adaptation Strategies for
Global Change, doi:10.1007/s11027-013-9455-1.
Soto-Pinto, L. and M. Anzueto, 2010: Carbon sequestration through agroforestry in
indigenous communities of Chiapas, Mexico. Agroforestry Systems, 78(1), 39-51.
Species, Habitats and Ecosystems Topic Advisory Group, 2011: Washington
State Integrated Climate ChangeResponse Strategy: Interim Recommendations
from Topic Advisory Group 3: Species, Habitats and Ecosystems (TAG3).
Department of Ecology, State of Washington, Olympia, WA, USA, 95 pp.
Statistics Canada, 2007: Chart 24.4 Population Projections, Children and Seniors –
Enlarged Version and Data Source. Government of Canada, Ottawa, ON, Canada,
www41.statcan.gc.ca/2007/3867/grafx/htm/ceb3867_001_4-eng.htm.
Statistics Canada, 2012: Table 051- 0001: Estimates of Population, by Age Group
and Sex for July 1, Canada, Provinces and Territories: Annual. Government of
Canada, Ottawa, ON, Canada, www5.statcan.gc.ca/cansim/a26?lang=
eng&retrLang=eng&id=0510001&paSer=&pattern=&stByVal=1&p1=1&p2=
-1&tabMode=dataTable&csid=.
Steiner, A.L., S. Tonse, R.C. Cohen, A.H. Goldstein, and R.A. Harley, 2006: Influence
of future climate and emissions on regional air quality in California. Journal of
Geophysical Research, 111(D18), D18303, doi:10.1029/2005JD006935.

1496
Chapter 26 North America
26
Stewart, S.I., V.C. Radeloff, R.B. Hammer, and T.J. Hawbaker, 2006: Defining the
wildland-urban interface. Journal of Forestry, 105(4), 201-207.
Stöckle, C.O., R.L. Nelson, S. Higgins, J. Brunner, G. Grove, R. Boydston, M. Whiting,
and C. Kruger, 2010: Assessment of climate change impact on eastern
Washington agriculture. Climatic Change, 102(1-2), 77-102.
Stratos Inc. and Brodie Consulting Ltd., 2011: Climate Change and Acid Rock
Drainage – Risks for the Canadian Mining Sector. MEND Report 1.61.7, Mine
Environment Neutral Drainage Program (MEND), Natural Resources Canada,
Ottawa, ON, Canada, 51 pp.
Suddick, E.C., K.M. Scow, W.R. Horwath, L.E. Jackson, D.R. Smart, J. Mitchell, and J.
Six, 2010: The potential for California agricultural crop soils to reduce
greenhouse gas emissions: a holistic evaluation. In: Advances in Agronomy,
Vol. 107 [Sparks, D.L. (ed.)]. Elsevier Science and Technology/Academic Press,
Waltham, MA, USA, pp. 124-162.
Sun, G., S.G. McNulty, J.A. Moore Myers, and E.C. Cohen, 2008: Impacts of multiple
stresses on water demand and supply across the southeastern United States.
Journal of the American Water Resources Association, 44(6), 1441-1457.
Swanson, D., J. Hiley, and H.D. Venema, 2007: Indicators of Adaptive Capacity to
Climate Change for Agriculture in the Prairie Region of Canada: An Analysis
Based on Statistics Canada’s Census of Agriculture. IISD Working Paper for the
Prairie Climate Resilience Project, International Institute for Sustainable
Development (IISD), Winnipeg, MB, Canada, 56 pp.
Swiss Re, 2013: World Insurance in 2012: Progressing on the Long and Winding
Road to Recovery. Sigma No. 3/2013, Swiss Reinsurance Company, (Swiss Re
Ltd.), Economic Research & Consulting, Zurich, Switzerland, 42 pp.
Sydneysmith, R., M. Andrachuk, B. Smit, and G.K. Hovelsrud, 2010: Vulnerability and
adaptive capacity in Arctic communities. In: Adaptive Capacity and Environmental
Governance [Armitage, D. and R. Plummer (eds.)]. Springer-Verlag, Berlin,
Germany, pp. 133-156.
Tabachnick, W.J., 2010: Challenges in predicting climate and environmental effects on
vector-borne disease episystems in a changing world. The Journal of Experimental
Biology, 213(6), 946-954.
Tagaris, E., K. Liao, K. Manomaiphiboon, S. He, J. Woo, P. Amar, and A.G. Russell, 2008:
The role of climate and emission changes in future air quality over southern
Canada and northern Mexico. Atmospheric Chemistry and Physics, 8(14), 3973-
3983.
Tagaris, E., K. Liao, A.J. Delucia, L. Deck, P. Amar, and A.G. Russell, 2009: Potential
impact of climate change on air pollution-related human health effects.
Environmental Science & Technology, 43(13), 4979-4988.
Tagaris, E., K. Liao, A.J. DeLucia, L. Deck, P. Amar, and A.G. Russell, 2010: Sensitivity
of air pollution-induced premature mortality to precursor emissions under the
influence of climate change. International Journal of Environmental Research
and Public Health, 7(5), 2222-2237.
Tai, A.P.K., L.J. Mickley, and D.J. Jacob, 2010: Correlations between fine particulate
matter (PM
2.5
) and meteorological variables in the United States: implications
for the sensitivity of PM
2.5
to climate change. Atmospheric Environment, 44(32),
3976-3984.
Tambo, J.A. and T. Abdoulaye, 2012: Climate change and agricultural technology
adoption: the case of drought tolerant maize in rural Nigeria. Mitigation and
Adaptation Strategies for Global Change, 17(3), 277-292.
Taner, M.T., J.N. Carleton, and M. Wellman, 2011: Integrated model projections of
climate change impacts on a North American lake. Ecological Modelling,
222(18), 3380-3393.
Tanzeeba, S. and T.Y. Gan, 2012: Potential impact of climate change on the water
availability of South Saskatchewan River Basin. Climatic Change, 112(2), 355-386.
Tao, Z., A. Williams, H. Huang, M. Caughey, and X. Liang, 2007: Sensitivity of U.S.
surface ozone to future emissions and climate changes. Geophysical Research
Letters, 34(8), L08811, doi:10.1029/2007GL029455.
Tarnoczi, T., 2011: Transformative learning and adaptation to climate change in the
Canadian Prairies agro-ecosystem. Mitigation and Adaptation Strategies for
Global Change, 16(4), 387-406.
Tarnoczi, T.J. and F. Berkes, 2010: Sources of information for farmers’ adaptation
practices in Canada’s Prairie agro-ecosystem. Climatic Change, 98(1), 299-305.
Tebaldi, C., B.H. Strauss, and C.E. Zervas, 2012: Modelling sea level rise impacts on
storm surges along US coasts. Environmental Research Letters, 7(1), 014032,
doi:10.1088/1748-9326/7/1/014032.
Teixeira, E.I., G. Fischer, H. van Velthuizen, C. Walter, and F. Ewert, 2013: Global hot-
spots of heat stress on agricultural crops due to climate change. Agricultural
and Forest Meteorology, 170, 206-215.
Teranishi, H., T. Katoh, K. Kenda, and S. Hayashi, 2006: Global warming and the earlier
start of the Japanese-cedar (Cryptomeria japonica) pollen season in Toyama,
Japan. Aerobiologia, 22(2), 90-94.
Terrier, A., M.P. Girardin, C. Périé, P. Legendre, and Y. Bergeron, 2013: Potential
changes in forest composition could reduce impacts of climate change on
boreal wildfires. Ecological Applications, 23(1), 21-35.
The White House, 2009: Federal Leadership in Environmental, Energy, and Economic
Performance – Executive Order 13514. Executive Office of the President,
Washington, DC, USA, www.whitehouse.gov/assets/documents/2009fedleader_
eo_rel.pdf.
Theobald, D.M. and W.H. Romme, 2007: Expansion of the US wildland-urban
interface. Landscape and Urban Planning, 83(4), 340-354.
Thomas, M.K., D.F. Charron, D. Waltner-Toews, C.J. Schuster, A.R. Maarouf, and J.D.
Holt, 2006: A role of high impact weather events in waterborne disease
outbreaks in Canada, 1975-2001. International Journal of Environmental Health
Research, 16(3), 167-180.
Tingley, M.W., W.B. Monahan, S.R. Beissinger, and C. Moritz, 2009: Birds track their
Grinnellian niche through a century of climate change. Proceedings of the
National Academy of Sciences of the United States of America, 106(2 Suppl.),
19637-19643.
Tong, S.T.Y., Y. Sun, T. Ranatunga, J. He, and Y.J. Yang, 2012: Predicting plausible
impacts of sets of climate and land use change scenarios on water resources.
Applied Geography, 32(2), 477-489.
Trainor, S.F., M. Calef, D. Natcher, F.S. Chapin III, A.D. McGuire, O. Huntington, P. Duffy,
T.S. Rupp, L. DeWilde, M. Kwart, N. Fresco, and A.L. Lovecraft, 2009: Vulnerability
and adaptation to climate-related fire impacts in rural and urban interior
Alaska. Polar Research, 28, 100-118.
Trapp, R.J., N.S. Diffenbaugh, and A. Gluhovsky, 2009: Transient response of severe
thunderstorm forcing to elevated greenhouse gas concentrations. Geophysical
Research Letters, 36(1), L01703, doi:10.1029/2008GL036203.
TRB, 2008: Potential Impacts of Climate Change on U.S. Transportation. TRB Special
Report 290, Committee on Climate Change and U.S. Transportation, Transportation
Research Board (TRB), National Research Council of the National Academy of
Sciences, TRB, Washington, DC, USA, 280 pp.
Trejo, I., E. Martínez-Meyer, E. Calixto-Pérez, S. Sánchez-Colón, R. Vázquez de La Torre,
and L. Villers-Ruiz, 2011: Analysis of the effects of climate change on plant
communities and mammals in México. Atmósfera, 24(1), 1-14.
Tremblay, L., M. Larocque, F. Anctil, and C. Rivard, 2011: Teleconnections and
interannual variability in Canadian groundwater levels. Journal of Hydrology,
410(3-4), 178-188.
Trumpickas, J., B.J. Shuter, and C.K. and Minns, 2009: Forecasting impacts of climate
change on Great Lakes surface water temperatures. Journal of Great Lakes
Research, 35(3), 454-463.
Tu, J., 2009: Combined impact of climate and land use changes on streamflow and
water quality in eastern Massachusetts, USA. Journal of Hydrology, 379(3-4),
268-283.
Tufts, S., 2010: Tourism, climate change and the missing worker: uneven impacts,
institutions and response. In: What Do We Know? What Do We Need to Know?
The State of Canadian Research on Work, Employment and Climate Change
[Lipsig-Mummé, C. (ed.)]. Work in a Warming World Research Programme, York
University, Toronto, ON, Canada, pp. 80-108.
UN DESA Population Division, 2011: World Population Prospects: The 2010
Revision, Volume I: Comprehensive Tables. The United Nations Department of
Economic and Social Affairs (UN DESA), New York, NY, USA, 481 pp.
United States and Mexico International Boundary and Water Commission,
2012: Commission Signs Colorado River Agreement. Press release, November
20, 2012, International Boundary and Water Commission: United States Section,
El Paso, TX, USA, 3 pp., www.ibwc.state.gov/Files/Press_Release_112012.pdf.
U.S. Army Corps of Engineers and Bonneville Power Administration, 2013: Columbia
River Treaty 2014/2024 Review. www.crt2014-2024review.gov/.
U.S. Census Bureau, 2011: Statistical Abstract of the United States: 2012. United
States Department of Commerce, Washington, DC, USA, www.census.gov/
compendia/statab/.
USDA ERS, 2012: U.S. Drought 2012: Farm and Food Impacts. United States Department
of Agriculture (USDA) Economic Research Service (ERS), Washington, DC, USA,
www.ers.usda.gov/topics/in-the-news/us-drought-2012-farm-and-food-
impacts.aspx#.U1rkalVdXh4.
U.S. Department of Transportation, 2013: Transportation Statistics Annual
Report 2012. Research and Innovative Technology Administration, Bureau of

1497
North America Chapter 26
26
Transportation Statistics, Washington, DC, USA, 118 pp., www.rita.dot.gov/bts/
sites/rita.dot.gov.bts/files/publications/transportation_statistics_annual_
report/2012/index.html.
U.S. Forest Service, 2010: National Roadmap for Responding to Climate Change.
United States Department of Agriculture (USDA), Forest Service, Washington,
DC, USA, 30 pp.
Urban, D., M.J. Roberts, W. Schlenker, and D.B. Lobell, 2012: Projected temperature
changes indicate significant increase in interannual variability of U.S. maize
yields. Climatic Change, 112(2), 525-533.
Ureta, C., E. Martínez-Meyer, H.R. Perales, and E.R. Álvarez-Buylla, 2012: Projecting
the effects of climate change on the distribution of maize races and their wild
relatives in Mexico. Global Change Biology, 18(3), 1073-1082.
van Mantgem, P.J., N.L. Stephenson, J.C. Byrne, L.D. Daniels, J.F. Franklin, P.Z. Fulé,
M.E. Harmon, A.J. Larson, J.M. Smith, A.H. Taylor, and T.T. Veblen, 2009:
Widespread increase of tree mortality rates in the western United States.
Science, 323(5913), 521-524.
Vano, J., N. Voisin, L. Cuo, A. Hamlet, M. Elsner, R. Palmer, A. Polebitski, and D. Lettenmaier,
2010a: Climate change impacts on water management in the Puget Sound
region, Washington State, USA. Climatic Change, 102(1-2), 261-286.
Vano, J.A., M.J. Scott, N. Voisin, C.O. Stöckle, A.F. Hamlet, K. Mickelson, and D.P.
Lettenmaier, 2010b: Climate change impacts on water management and
irrigated agriculture in the Yakima River Basin, Washington, USA. Climatic
Change, 102(1-2), 287-317.
Varady, R. and E. Ward, 2009: Transboundary conservation in context: what drives
environmental change? In: Conservation of Shared Environments: Learning
from the United States and Mexico [López-Hoffman, L., E.D. McGovern, R.G.
Varady, and K.W. Flessa (eds.)]. University of Arizona Press, Tucson, AZ, USA,
pp. 9-22.
Vasseur, L., 2011: Moving from research into action on issues of climate change for
a Canadian community: integration of sciences into decision making. The
International Journal of Climate Change: Impacts & Responses, 2(4), 116-126.
Vasseur, L. and N. Catto, 2008: Atlantic Canada. In: From Impacts to Adaptation:
Canada in a Changing Climate 2007 [Lemmen, D.S., F.J. Warren, J. Lacroix, and
E. Bush (eds.)]. Government of Canada, Ottawa, ON, Canada, pp. 119-170.
Veron, J.E.N., O. Hoegh-Guldberg, T.M. Lenton, J.M. Lough, D.O. Obura, P. Pearce-
Kelly, C.R.C. Sheppard, M. Spalding, M.G. Stafford-Smith, and A.D. Rogers, 2009:
The coral reef crisis: the critical importance of <350 ppm CO
2
. Marine Pollution
Bulletin, 58(10), 1428-1436.
Vespa, J., J. Lewis, and R. Kreider, 2013: America’s Families and Living Arrangements:
2012. Population Characteristics. U.S. Department of Commerce, Economics
and Statistics Administration, United States Census Bureau, Washington, DC,
USA, 34 pp.
Villarini, G. and J.A. Smith, 2010: Flood peak distributions for the eastern United
States. Water Resources Research, 46(6), W06504, doi:10.1029/2009WR008395.
Villarini, G., J.A. Smith, F. Serinaldi, J. Bales, P.D. Bates, and W.F. Krajewski, 2009: Flood
frequency analysis for nonstationary annual peak records in an urban drainage
basin. Advances in Water Resources, 32(8), 1255-1266.
Villarini, G., J.A. Smith, M.L. Baeck, and W.F. Krajewski, 2011: Examining flood
frequency distributions in the Midwest U.S. Journal of the American Water
Resources Association, 47(3), 447-463.
Villeneuve, P.J. and R.T. Burnett, 2003: A time-series study of air pollution, socioeconomic
status, and mortality in Vancouver, Canada. Journal of Exposure Science and
Environmental Epidemiology, 13(6), 427-435.
Villeneuve, P.J., M. Doiron, D. Stieb, R. Dales, R.T. Burnett, and R. Dugandzic, 2006:
Is outdoor air pollution associated with physician visits for allergic rhinitis
among the elderly in Toronto, Canada? Allergy, 61(6), 750-758.
Villers Ruiz, L. and D. Castañeda-Aguado, 2013: Species and plant communities
reorganization in the trans-Mexican volcanic belt under climate change
conditions. Journal of Mountain Science, 10(6), 923-931.
Villers Ruíz, L. and J. Hernández-Lozano, 2007: Incendios forestales y el fenómeno
de El Niño en México [Forest fires and the El Nino phenomenon in Mexico]. In:
Proceedings of IV Conferencia Internacional sobre Incendios Forestales, May
13-17, 2007, Seville, Spain. Sponsored by the International Strategy of the
United Nations Disaster Reduction (UNISDR), the United Nations Food and
Agriculture Organization (FAO), and the European Commission and organized
by the Ministry of Environment of Spain and the Junta de Andalucía, Ministry
of Environment, General Directorate for Biodiversity, Area Defense Against
Forest Fires, Madrid, Spain (in Spanish), www.fire.uni-freiburg.de/sevilla-2007/
contributions/html/es/autor_V.html.
von Peter, G., S. von Dahlen, and S. Saxena, 2012: Unmitigated Disasters? New Evidence
on the Macroeconomic Cost of Natural Catastrophes. BIS Working Papers No.
394, Bank for International Settlements (BIS), Basel, Switzerland, 34 pp.
Vose, J.M., D.L. Peterson, and T. Patel-Weynand, 2012: Effects of Climatic Variability
and Change on Forest Ecosystems: A Comprehensive Science Synthesis for the
U.S. General Technical Report PNW-GTR-870, United States Department of
Agriculture (USDA), Forest Service, Pacific Northwest Research Station, Portland,
OR, USA, 265 pp.
Vrolijks, L., A. Spatafpre, and A.S. Mittel, 2011: Comparative research on the
adaptation strategies of ten urban climate plans. In: Resilient Cities: Cities and
Adaptation to Climate Change – Proceedings of the Global Forum 2010 [Otto-
Zimmerman, K. (ed.)]. Local Sustainability Series, Vol. 1, Springer, Berlin,
Germany, pp. 193-203.
Walsh, C.J., T.D. Fletcher, and A.R. Ladson, 2005: Stream restoration in urban
atchments through redesigning stormwater systems: looking to the catchment
to save the stream. Journal of the North American Benthological Society, 24(3),
690-705.
Walthall, C.L., J. Hatfield, P. Backlund, L. Lengnick, E. Marshall, M. Walsh, S. Adkins,
M. Aillery, E.A. Ainsworth, C. Ammann, C.J. Anderson, I. Bartomeus, L.H.
Baumgard, F. Booker, B. Bradley, D.M. Blumenthal, J. Bunce, K. Burkey, S.M.
Dabney, J.A. Delgado, J. Dukes, A. Funk, K. Garrett, M. Glenn, D.A. Grantz, D.
Goodrich, S. Hu, R.C. Izaurralde, R.A.C. Jones, S.-H. Kim, A.D.B. Leaky, K. Lewers,
T.L. Mader, A. McClung, J. Morgan, D.J. Muth, M. Nearing, D.M. Oosterhuis, D.
Ort, C. Parmesan, W.T. Pettigrew, W. Polley, R. Rader, C. Rice, M. Rivington, E.
Rosskopf, W.A. Salas, L.E. Sollenberger, R. Srygley, C. Stöckle, E.S. Takle, D. Timlin,
J.W. White, R. Winfree, L. Wright-Morton, and L.H. Ziska, 2012: Climate Change
and Agriculture in the United States: Effects and Adaptation. USDA Technical
Bulletin 1935, United States Department of Agriculture (USDA), Washington,
DC, USA, 186 pp.
Wang, X.L., V.R. Swail, and F.W. Zwiers, 2006: Climatology and changes of extratropical
cyclone activity: comparison of ERA-40 with NCEP-NCAR reanalysis for 1958-
2001. Journal of Climate, 19(13), 3145-3166.
Waring, K.M., D.M. Reboletti, L.A. Mork, C. Huang, R.W. Hofstetter, A.M. Garcia, P.Z.
Fulé, and T.S. Davis, 2009: Modeling the impacts of two bark beetle species
under a warming climate in the southwestern USA: ecological and economic
consequences. Environmental Management, 44(4), 824-835.
Warren, F.J. and P. Egginton, 2008: Background information – concepts, overviews
and approaches. In: From Impacts to Adaptation: Canada in a Changing Climate
2007 [Lemmen, D.S., F.J. Warren, J. Lacroix, and E. Bush (eds.)]. Government of
Canada, Ottawa, ON, Canada, pp. 27-56.
Wayne, P., S. Foster, J. Connolly, F. Bazzaz, and P. Epstein, 2002: Production of allergenic
pollen by ragweed (Ambrosia artemisiifolia L.) is increased in CO
2
-enriched
atmospheres. Annals of Allergy, Asthma & Immunology, 88(3), 279-82.
Wehbe, M., H. Eakin, R. Seiler, M. Vinocur, C. Avila, and C. Marutto, 2008: Local
perspectives on adaptation to climate change: lessons from Mexico and
Argentina. In: Climate Change and Adaptation [Leary, N., J. Adejuwon, V. Barros,
I. Burton, J. Kulkarni, and R. Lasco (eds.)]. Earthscan, London, UK, pp. 296-314.
Wehner, M., D.R. Easterling, J.H. Lawrimore, R.R. Heim, R.S. Vose, and B.D. Santer,
2011: Projections of future drought in the continental United States and Mexico.
Journal of Hydrometeorology, 12(6), 1359-1377.
Weisler, R.H., J.G. Barbee, and M.H. Townsend, 2006: Mental health and recovery in
the Gulf Coast after Hurricanes Katrina and Rita. The Journal of the American
Medical Association, 296(5), 585-588.
Weiss, J.L., J.T. Overpeck, and B. Strauss, 2011: Implications of recent sea level rise
science for low-elevation areas in coastal cities of the conterminous U.S.A.
Climatic Change, 105(3-4), 635-645.
Westerling, A.L., H.G. Hidalgo, D.R. Cayan, and T.W. Swetnam, 2006: Warming and
earlier Spring increase western U.S. forest wildfire activity. Science, 313(5789),
940-943.
Wheaton, E., G. Koshida, B. Bonsal, T. Johnston, W. Richards, and V. Wittrock, 2007:
Agricultural Adaptation to Drought (ADA) in Canada: The Case of 2001 and
2002. SRC Publication No. 11927-1E07, Synthesis Report, Saskatchewan
Research Council, Environment and Forestry, Saskatoon, SK, Canada, 25 pp.
Wheaton, E., S. Kulshreshtha, W. Eilers, and V. Wittrock, 2010: Environmental
Sustainability of Agriculture in the Context of Adapting to a Changing Climate.
Keynote address to the joint OECD, INEA, FAO Workshop on Agriculture and
Adaptation to Climate Change, 23-25 June 2010, Rome, Italy, SRC Publication
No. 10432-1D10, Saskatchewan Research Council, Saskatoon, Saskatchewan,
Canada, 36slides, www.oecd.org/tad/sustainable-agriculture/45501531.pdf.

1498
Chapter 26 North America
26
Whitener, L.A. and T. Parker, 2007: Policy options for a changing rural America.
Perspectives on Food and Farm Policy: Rural Development & Energy, 5(3 SI),
58-65.
White-Newsome, J.L., B.N. Sánchez, O. Jolliet, Z. Zhang, E.A. Parker, J.T. Dvonch,
and M.S. O’Neill, 2012: Climate change and health: indoor heat exposure in
vulnerable populations. Environmental Research, 112, 20-27.
Wiedinmyer, C. and M.D. Hurteau, 2010: Prescribed fire as a means of reducing
forest carbon emissions in the western United States. Environment, Science
and Technology, 44(6), 1926-1932.
Wilbanks, T., D. Bilello, D. Schmalzer, M. Scott, D. Arent, J. Buizer, H. Chum, J. Dell, J.
Edmonds, G. Franco, R. Jones, S. Rose, N. Roy, A. Sanstad, S. Seidel, J. Weyant,
and D. Wuebbles, 2012: Climate Change and Energy Supply and Use: Technical
Report for the U.S. Department of Energy in Support of the National Climate
Assessment. Oak Ridge National Laboratory, Oak Ridge, TN, USA, 79 pp.
Wilder, M., C.A. Scott, N.P. Pablos, R.G. Varady, G.M. Garfin, and J. McEvoy, 2010:
Adapting across boundaries: climate change, social learning, and resilience in the
US-Mexico border region. Annals of the Association of American Geographers,
100(4), 917-928.
Wilder, M., G. Garfin, P. Ganster, H. Eakin, P. Romero-Lankao, F. Lara-Valencia, A.A.
Cortez-Lara, S. Mumme, C. Neri, and F. Muñoz-Arriola, 2013: Chapter 16:
Climate change and U.S.-Mexico border communities. In: Assessment of Climate
Change in the Southwest United States: A Report Prepared for the National
Climate Assessment [Garfin, G., A. Jardine, R. Merideth, M. Black, and S. LeRoy
(eds.)]. Report by the Southwest Climate Alliance, Island Press, Washington,
DC, USA, 340-384.
Williams, A.P., C.D. Allen, C.I. Millar, T.W. Swetnam, J. Michaelson, C.J. Still, and S.W.
Leavitt, 2010: Forest responses to increasing aridity and warmth in the
southwestern United States. Proceedings of the National Academy of Sciences
of the United States of America, 107(50), 21289-21294.
Williamson, T.B., M. Patriquin, and V. Wittrock, 2008: Chapter 5: Adaptive capacity
deficits of human populations in the Canadian boreal plains ecozone:
assessment and issues. In: Limited Report: Climate Change Adaptive Capacity
of Forestry Stakeholders in the Boreal Plains Ecozone [Johnston, M., T.
Williamson, E. Wheaton, V. Wittrock, H. Nelson, H. Hesseln, L. Vandamme, J.
Pittman, and M. Lebel (eds.)]. SRC Publication No. 12306-3C08, Prepared for
Canadian Climate Change Impacts and Adaptation Program, Project A1383,
Saskatchewan Research Council (SRC), Saskatoon, SK, Canada, pp. 46-81.
Williamson, T.B., S.J. Colombo, P.N. Duinker, P.A. Gray, R.J. Hennessey, D. Houle, M.H.
Johnston, A.E. Ogden, and D.L. Spittlehouse, 2009: Climate Change and
Canada’s Forests: From Impacts to Adaptation. Sustainable Forest Management
Network and Natural Resources Canada, Canadian Forest Service, Northern
Forestry Centre, Edmonton, AB, Canada, 104 pp.
Wilson, C.O. and Q. Weng, 2011: Simulating the impacts of future land use and
climate changes on surface water quality in the Des Plaines River watershed,
Chicago Metropolitan Statistical Area, Illinois. Science of the Total Environment,
409(20), 4387-4405.
Wilson, K., 2009: Climate change and the spread of infectious ideas. Ecology, 90(4),
901-902.
Winder, R., E.A. Nelson, and T. Beardmore, 2011: Ecological implications for assisted
migration in Canadian forests. The Forestry Chronicle, 87(6), 731-744.
Wittrock, V., S.N. Kulshreshtha, and E. Wheaton, 2011: Canadian Prairie rural
communities: their vulnerabilities and adaptive capacities to drought. Mitigation
and Adaptation Strategies for Global Change, 16(3), 267-290.
Wolf, J., W.N. Adger, I. Lorenzoni, V. Abrahamson, and R. Raine, 2010: Social capital,
individual responses to heat waves and climate change adaptation: an empirical
study of two U.K. cities. Global Environmental Change, 20(1), 44-52.
Wolfe, D.W., L. Ziska, C. Petzoldt, A. Seaman, L. Chase, and K. Hayhoe, 2008: Projected
change in climate thresholds in the Northeastern U.S.: implications for crops,
pests, livestock, and farmers. Mitigation and Adaptation Strategies for Global
Change, 13(5-6), 555-575.
Woodhouse, C., D.M. Meko, G.M. MacDonald, D.W. Stahle, and E.R. Cook, 2010:
1,200-year perspective of 21
st
century drought in southwestern North America.
Proceedings of the National Academies of Sciences of the United States of
America, 107(50), 21283-21288.
Wootton, J.T., C.A. Pfister, and J.D. Forester, 2008: Dynamic patterns and ecological
impacts of declining ocean pH in a high resolution multi-year dataset.
Proceedings of the National Academy of Sciences of the United States of
America, 105(48), 18848-18853.
World Bank, 2010: Natural Hazards, Unnatural Disasters: The Economics of Effective
Prevention. The International Bank for Reconstruction and Development
/ The World Bank, Washington, DC, USA, 254 pp.
World Bank, 2011: Global Economic Prospects: Maintaining Progress Amid Turmoil,
Volume 3. Prospects Group of the Development Economics Vice Presidency,The
International Bank for Reconstruction and Development / The World Bank,
Washington, DC, USA, 141 pp.
Wright, L., P. Chinowsky, K. Strzepek, R. Jones, R. Streeter, J.B. Smith, J.-M. Mayotte,
A. Powell, L. Jantarasami, and W. Perkins, 2012: Estimated effects of climate
change on flood vulnerability of U.S. bridges. Mitigation and Adaptation Strategies
for Global Change, 17(8), 939-955.
Wu, S., L.J. Mickley, E.M. Leibensperger, D.J. Jacob, D. Rind, and D.G. Streets, 2008:
Effects of 2000-2050 global change on ozone air quality in the United States.
Journal of Geophysical Research: Atmospheres, 113(D6), D06302, doi:10.1029/
2007JD008917.
Wu, S.-Y., 2010: Potential impact of climate change on flooding in the Upper Great
Miami River Watershed, Ohio, USA: a simulation-based approach. [Impact
potentiel du changement climatique sur les inondations dans le bassin
supérieur de la Rivière Great Miami, Ohio, Etats-Unis: une approche basée sur
la simulation]. Hydrological Sciences Journal, 55(8), 1251-1263.
Yanchuk, A. and G. Allard, 2009: Tree improvement programmes for forest health –
can they keep pace with climate changes? Unasylva, 60(231-232), 50-56.
Yang, L., J.A. Smith, D.B. Wright, M.L. Baeck, G. Villarini, F. Tian, and H. Hu, 2013:
Urbanization and climate change: an examination of nonstationarities in urban
flooding. Journal of Hydrometeorology, 14, 1791-1809.
Yin, J.H., 2005: A consistent poleward shift of the storm tracks in simulations of 21
st
century climate. Geophysical Research Letters, 32(18), L18701, doi:10.1029/
2005GL023684.
Yin, J., M.E. Schlesinger, and R.J. Stouffer, 2009: Model projection of rapid sea-level
rise on the northeast coast of the United States. Nature Geoscience, 2(4), 262-
266.
Zavala-Hidalgo, J., R. de Buen Kalman, R. Romero-Centeno, and F. Hernández
Maguey, 2010: Tendencias del nivel del mar en las costas mexicanas. In:
Vulnerabilidad de las Zonas Costeras Mexicanas ante el Cambio Climático
[Botello, A.V., S. Villanueva-Fragoso, J. Gutiérrez, and J.L. Rojas Galaviz (ed.)].
SEMARNAT-INE, UNAM-ICMyL, and Universidad Autónoma de Campeche,
Centro epomex, Universidad Autónoma de Campeche, Campeche, México,
pp. 249-268, http://etzna.uacam.mx/epomex/publicaciones/vulnerabilidad/
vulnerabilidad_CCParte1.pdf.
Zhang, X.C. and M.A. Nearing, 2005: Impact of climate change on soil erosion, runoff,
and wheat productivity in central Oklahoma. Catena, 61(2-3), 185-195.
Ziska, L.H. and F.A. Caulfield, 2000: Rising CO
2
and pollen production of common
ragweed (Ambrosia artemisiifolia), a known allergy-inducing species: implications
for public health. Australian Journal of Plant Physiology, 27, 893-898.
Ziska, L., K. Knowlton, C. Rogers, D. Dalan, N. Tierney, M. Ann, W. Filley, J. Shropshire,
L.B. Ford, C. Hedberg, P. Fleetwood, K.T. Hovanky, and T. Kavanaugh, 2011:
Recent warming by latitude associated with increased length of ragweed pollen
season in central North America. Proceedings of the National Academies of
Sciences of the United States of America, 108(10), 4248-4251.
Ziska, L.H., D.E. Gebhard, D.A. Frenz, S. Faulkner, B.D. Singer, and J.G. Straka, 2003:
Cities as harbingers of climate change: common ragweed, urbanization, and
public health. Journal of Allergy and Clinical Immunology, 111(2), 290-295.
