
739
10
Industry
Coordinating Lead Authors:
Manfred Fischedick (Germany), Joyashree Roy (India)
Lead Authors:
Amr Abdel-Aziz (Egypt), Adolf Acquaye (Ghana / UK), Julian Allwood (UK), Jean-Paul Ceron (France),
Yong Geng (China), Haroon Kheshgi (USA), Alessandro Lanza (Italy), Daniel Perczyk (Argentina),
Lynn Price (USA), Estela Santalla (Argentina), Claudia Sheinbaum (Mexico), Kanako Tanaka (Japan)
Contributing Authors:
Giovanni Baiocchi (UK / Italy), Katherine Calvin (USA), Kathryn Daenzer (USA), Shyamasree
Dasgupta (India), Gian Delgado (Mexico), Salah El Haggar (Egypt), Tobias Fleiter (Germany), Ali
Hasanbeigi (Iran / USA), Samuel Höller (Germany), Jessica Jewell (IIASA / USA), Yacob Mulugetta
(Ethiopia / UK), Maarten Neelis (China), Stephane de la Rue du Can (France / USA), Nickolas
Themelis (USA / Greece), Kramadhati S. Venkatagiri (India), María Yetano Roche (Spain / Germany)
Review Editors:
Roland Clift (UK), Valentin Nenov (Bulgaria)
Chapter Science Assistant:
María Yetano Roche (Spain / Germany)
This chapter should be cited as:
Fischedick M., J. Roy, A. Abdel-Aziz, A. Acquaye, J. M. Allwood, J.-P. Ceron, Y. Geng, H. Kheshgi, A. Lanza, D. Perczyk, L. Price,
E. Santalla, C. Sheinbaum, and K. Tanaka, 2014: Industry. In: Climate Change 2014: Mitigation of Climate Change. Contri-
bution of Working Group III to the Fifth Assessment Report of the Intergovernmental Panel on Climate Change [Edenhofer,
O., R. Pichs-Madruga, Y. Sokona, E. Farahani, S. Kadner, K. Seyboth, A. Adler, I. Baum, S. Brunner, P. Eickemeier, B. Kriemann,
J. Savolainen, S. Schlömer, C. von Stechow, T. Zwickel and J.C. Minx (eds.)]. Cambridge University Press, Cambridge, United
Kingdom and New York, NY, USA.

740740
Industry
10
Chapter 10
Contents
Executive Summary � � � � � � � � � � � � � � � � � � � � � � � � � � � � � � � � � � � � � � � � � � � � � � � � � � � � � � � � � � � � � � � � � � � � � � � � � � � � � � � � � � � � � � � � � � � � � � � � � � � � � � � � � � � � � � � 743
10�1 Introduction � � � � � � � � � � � � � � � � � � � � � � � � � � � � � � � � � � � � � � � � � � � � � � � � � � � � � � � � � � � � � � � � � � � � � � � � � � � � � � � � � � � � � � � � � � � � � � � � � � � � � � � � � � � 745
10�2 New developments in extractive mineral industries, manufacturing industries and services 747
10�3 New developments in emission trends and drivers � � � � � � � � � � � � � � � � � � � � � � � � � � � � � � � � � � � � � � � � � � � � � � � � � � � � � � � 749
10�3�1 Industrial CO
2
emissions � � � � � � � � � � � � � � � � � � � � � � � � � � � � � � � � � � � � � � � � � � � � � � � � � � � � � � � � � � � � � � � � � � � � � � � � � � � � � � � � � � � � � 749
10�3�2 Industrial non-CO
2
GHG emissions � � � � � � � � � � � � � � � � � � � � � � � � � � � � � � � � � � � � � � � � � � � � � � � � � � � � � � � � � � � � � � � � � � � � � � � � � � 753
10�4 Mitigation technology options, practices and behavioural aspects � � � � � � � � � � � � � � � � � � � � � � � � � � � � � � � � � 753
10�4�1 Iron and steel
� � � � � � � � � � � � � � � � � � � � � � � � � � � � � � � � � � � � � � � � � � � � � � � � � � � � � � � � � � � � � � � � � � � � � � � � � � � � � � � � � � � � � � � � � � � � � � � 757
10�4�2 Cement
� � � � � � � � � � � � � � � � � � � � � � � � � � � � � � � � � � � � � � � � � � � � � � � � � � � � � � � � � � � � � � � � � � � � � � � � � � � � � � � � � � � � � � � � � � � � � � � � � � � � � � 758
10�4�3 Chemicals (plastics / fertilizers / others)
� � � � � � � � � � � � � � � � � � � � � � � � � � � � � � � � � � � � � � � � � � � � � � � � � � � � � � � � � � � � � � � � � � � � � � 759
10�4�4 Pulp and paper
� � � � � � � � � � � � � � � � � � � � � � � � � � � � � � � � � � � � � � � � � � � � � � � � � � � � � � � � � � � � � � � � � � � � � � � � � � � � � � � � � � � � � � � � � � � � � � 760
10�4�5 Non-ferrous (aluminium / others)
� � � � � � � � � � � � � � � � � � � � � � � � � � � � � � � � � � � � � � � � � � � � � � � � � � � � � � � � � � � � � � � � � � � � � � � � � � � � 761
10�4�6 Food processing
� � � � � � � � � � � � � � � � � � � � � � � � � � � � � � � � � � � � � � � � � � � � � � � � � � � � � � � � � � � � � � � � � � � � � � � � � � � � � � � � � � � � � � � � � � � � � 761
10�4�7 Textiles and leather
� � � � � � � � � � � � � � � � � � � � � � � � � � � � � � � � � � � � � � � � � � � � � � � � � � � � � � � � � � � � � � � � � � � � � � � � � � � � � � � � � � � � � � � � � � 762
10�4�8 Mining
� � � � � � � � � � � � � � � � � � � � � � � � � � � � � � � � � � � � � � � � � � � � � � � � � � � � � � � � � � � � � � � � � � � � � � � � � � � � � � � � � � � � � � � � � � � � � � � � � � � � � � � 762
10�5 Infrastructure and systemic perspectives� � � � � � � � � � � � � � � � � � � � � � � � � � � � � � � � � � � � � � � � � � � � � � � � � � � � � � � � � � � � � � � � � � � � � 763
10�5�1 Industrial clusters and parks ( meso-level)
� � � � � � � � � � � � � � � � � � � � � � � � � � � � � � � � � � � � � � � � � � � � � � � � � � � � � � � � � � � � � � � � � � 763
10�5�2 Cross-sectoral cooperation (macro-level)
� � � � � � � � � � � � � � � � � � � � � � � � � � � � � � � � � � � � � � � � � � � � � � � � � � � � � � � � � � � � � � � � � � � 764
10�5�3 Cross-sectoral implications of mitigation efforts
� � � � � � � � � � � � � � � � � � � � � � � � � � � � � � � � � � � � � � � � � � � � � � � � � � � � � � � � � � � 764
10�6 Climate change feedback and interaction with adaptation � � � � � � � � � � � � � � � � � � � � � � � � � � � � � � � � � � � � � � � � � � � � 764
10�7 Costs and potentials � � � � � � � � � � � � � � � � � � � � � � � � � � � � � � � � � � � � � � � � � � � � � � � � � � � � � � � � � � � � � � � � � � � � � � � � � � � � � � � � � � � � � � � � � � � � � � � � 765

741741
Industry
10
Chapter 10
10�7�1 CO
2
emissions � � � � � � � � � � � � � � � � � � � � � � � � � � � � � � � � � � � � � � � � � � � � � � � � � � � � � � � � � � � � � � � � � � � � � � � � � � � � � � � � � � � � � � � � � � � � � � � � 765
10�7�2 Non-CO
2
emissions � � � � � � � � � � � � � � � � � � � � � � � � � � � � � � � � � � � � � � � � � � � � � � � � � � � � � � � � � � � � � � � � � � � � � � � � � � � � � � � � � � � � � � � � � � 767
10�7�3 Summary results on costs and potentials
� � � � � � � � � � � � � � � � � � � � � � � � � � � � � � � � � � � � � � � � � � � � � � � � � � � � � � � � � � � � � � � � � � 767
10�8 Co-benefits, risks and spillovers � � � � � � � � � � � � � � � � � � � � � � � � � � � � � � � � � � � � � � � � � � � � � � � � � � � � � � � � � � � � � � � � � � � � � � � � � � � � � � � � � 770
10�8�1 Socio-economic and environmental effects
� � � � � � � � � � � � � � � � � � � � � � � � � � � � � � � � � � � � � � � � � � � � � � � � � � � � � � � � � � � � � � � � � 771
10�8�2 Technological risks and uncertainties
� � � � � � � � � � � � � � � � � � � � � � � � � � � � � � � � � � � � � � � � � � � � � � � � � � � � � � � � � � � � � � � � � � � � � � � 772
10�8�3 Public perception
� � � � � � � � � � � � � � � � � � � � � � � � � � � � � � � � � � � � � � � � � � � � � � � � � � � � � � � � � � � � � � � � � � � � � � � � � � � � � � � � � � � � � � � � � � � � 772
10�8�4 Technological spillovers
� � � � � � � � � � � � � � � � � � � � � � � � � � � � � � � � � � � � � � � � � � � � � � � � � � � � � � � � � � � � � � � � � � � � � � � � � � � � � � � � � � � � � 774
10�9 Barriers and opportunities � � � � � � � � � � � � � � � � � � � � � � � � � � � � � � � � � � � � � � � � � � � � � � � � � � � � � � � � � � � � � � � � � � � � � � � � � � � � � � � � � � � � � � � 774
10�9�1 Energy efficiency for reducing energy requirements
� � � � � � � � � � � � � � � � � � � � � � � � � � � � � � � � � � � � � � � � � � � � � � � � � � � � � � � 774
10�9�2 Emissions efficiency, fuel switching, and carbon dioxide capture and storage
� � � � � � � � � � � � � � � � � � � � � � � � � � � � 774
10�9�3 Material efficiency
� � � � � � � � � � � � � � � � � � � � � � � � � � � � � � � � � � � � � � � � � � � � � � � � � � � � � � � � � � � � � � � � � � � � � � � � � � � � � � � � � � � � � � � � � � � 775
10�9�4 Product demand reduction
� � � � � � � � � � � � � � � � � � � � � � � � � � � � � � � � � � � � � � � � � � � � � � � � � � � � � � � � � � � � � � � � � � � � � � � � � � � � � � � � � � 776
10�9�5 Non-CO
2
greenhouse gases � � � � � � � � � � � � � � � � � � � � � � � � � � � � � � � � � � � � � � � � � � � � � � � � � � � � � � � � � � � � � � � � � � � � � � � � � � � � � � � � � � 776
10�10 Sectoral implications of transformation pathways and sustainable development � � � � � � � � � � � � � � 776
10�10�1 Industry transformation pathways
� � � � � � � � � � � � � � � � � � � � � � � � � � � � � � � � � � � � � � � � � � � � � � � � � � � � � � � � � � � � � � � � � � � � � � � � � � 776
10�10�2 Transition, sustainable development, and investment
� � � � � � � � � � � � � � � � � � � � � � � � � � � � � � � � � � � � � � � � � � � � � � � � � � � � � 779
10�11 Sectoral policies � � � � � � � � � � � � � � � � � � � � � � � � � � � � � � � � � � � � � � � � � � � � � � � � � � � � � � � � � � � � � � � � � � � � � � � � � � � � � � � � � � � � � � � � � � � � � � � � � � � � � � 780
10�11�1 Energy efficiency
� � � � � � � � � � � � � � � � � � � � � � � � � � � � � � � � � � � � � � � � � � � � � � � � � � � � � � � � � � � � � � � � � � � � � � � � � � � � � � � � � � � � � � � � � � � � 781
10�11�2 Emissions efficiency
� � � � � � � � � � � � � � � � � � � � � � � � � � � � � � � � � � � � � � � � � � � � � � � � � � � � � � � � � � � � � � � � � � � � � � � � � � � � � � � � � � � � � � � � � 782
10�11�3 Material efficiency
� � � � � � � � � � � � � � � � � � � � � � � � � � � � � � � � � � � � � � � � � � � � � � � � � � � � � � � � � � � � � � � � � � � � � � � � � � � � � � � � � � � � � � � � � � � 783
10�12 Gaps in knowledge and data � � � � � � � � � � � � � � � � � � � � � � � � � � � � � � � � � � � � � � � � � � � � � � � � � � � � � � � � � � � � � � � � � � � � � � � � � � � � � � � � � � � � � 783
10�13 Frequently Asked Questions � � � � � � � � � � � � � � � � � � � � � � � � � � � � � � � � � � � � � � � � � � � � � � � � � � � � � � � � � � � � � � � � � � � � � � � � � � � � � � � � � � � � � 784

742742
Industry
10
Chapter 10
10�14 Appendix: Waste � � � � � � � � � � � � � � � � � � � � � � � � � � � � � � � � � � � � � � � � � � � � � � � � � � � � � � � � � � � � � � � � � � � � � � � � � � � � � � � � � � � � � � � � � � � � � � � � � � � � � 785
10�14�1 Introduction
� � � � � � � � � � � � � � � � � � � � � � � � � � � � � � � � � � � � � � � � � � � � � � � � � � � � � � � � � � � � � � � � � � � � � � � � � � � � � � � � � � � � � � � � � � � � � � � � � � 785
10�14�2 Emissions trends
� � � � � � � � � � � � � � � � � � � � � � � � � � � � � � � � � � � � � � � � � � � � � � � � � � � � � � � � � � � � � � � � � � � � � � � � � � � � � � � � � � � � � � � � � � � � � 785
10.14.2.1 Solid waste disposal
. . . . . . . . . . . . . . . . . . . . . . . . . . . . . . . . . . . . . . . . . . . . . . . . . . . . . . . . . . . . . . . . . . . . . . . . . . . . . . . . . . 785
10.14.2.2 Wastewater
. . . . . . . . . . . . . . . . . . . . . . . . . . . . . . . . . . . . . . . . . . . . . . . . . . . . . . . . . . . . . . . . . . . . . . . . . . . . . . . . . . . . . . . . . . . 787
10�14�3 Technological options for mitigation of emissions from waste
� � � � � � � � � � � � � � � � � � � � � � � � � � � � � � � � � � � � � � � � � � � 788
10.14.3.1 Pre-consumer waste
. . . . . . . . . . . . . . . . . . . . . . . . . . . . . . . . . . . . . . . . . . . . . . . . . . . . . . . . . . . . . . . . . . . . . . . . . . . . . . . . . . 788
10.14.3.2 Post-consumer waste
. . . . . . . . . . . . . . . . . . . . . . . . . . . . . . . . . . . . . . . . . . . . . . . . . . . . . . . . . . . . . . . . . . . . . . . . . . . . . . . . . 788
10.14.3.3 Wastewater
. . . . . . . . . . . . . . . . . . . . . . . . . . . . . . . . . . . . . . . . . . . . . . . . . . . . . . . . . . . . . . . . . . . . . . . . . . . . . . . . . . . . . . . . . . . 790
10�14�4 Summary results on costs and potentials
� � � � � � � � � � � � � � � � � � � � � � � � � � � � � � � � � � � � � � � � � � � � � � � � � � � � � � � � � � � � � � � � � � � 791
References � � � � � � � � � � � � � � � � � � � � � � � � � � � � � � � � � � � � � � � � � � � � � � � � � � � � � � � � � � � � � � � � � � � � � � � � � � � � � � � � � � � � � � � � � � � � � � � � � � � � � � � � � � � � � � � � � � � � � � � � � � 793

743743
Industry
10
Chapter 10
Executive Summary
An absolute reduction in emissions from the industry sector will
require deployment of a broad set of mitigation options beyond
energy efficiency measures (medium evidence, high agreement). In
the last two to three decades there has been continued improvement in
energy and process efficiency in industry, driven by the relatively high
share of energy costs. In addition to energy efficiency, other strategies
such as emissions efficiency (including e. g., fuel and feedstock switch-
ing, carbon dioxide capture and storage (CCS)), material use efficiency
(e. g., less scrap, new product design), recycling and re-use of materials
and products, product service efficiency (e. g., car sharing, maintain-
ing buildings for longer, longer life for products), or demand reductions
(e. g., less mobility services, less product demand) are required in paral-
lel (medium evidence, high agreement). [Section 10.4, 10.7]
Industry-related greenhouse gas (GHG) emissions have continued
to increase and are higher than GHG emissions from other end-
use sectors (high confidence). Despite the declining share of industry in
global gross domestic product (GDP), global industry and waste / waste-
water GHG emissions grew from 10.4 GtCO
2
eq in 1990 to 13.0 GtCO
2
eq
in 2005 to 15.4 GtCO
2
eq in 2010. Total global GHG emissions for indus-
try and waste / wastewater in 2010, which nearly doubled since 1970,
were comprised of direct energy-related CO
2
emissions of 5.3 GtCO
2
eq,
indirect CO
2
emissions from production of electricity and heat for indus-
try of 5.2 GtCO
2
eq, process CO
2
emissions of 2.6 GtCO
2
eq, non-CO
2
GHG emissions of 0.9 GtCO
2
eq, and waste / wastewater emissions of
1.4 GtCO
2
eq. 2010 direct and indirect emissions were dominated by CO
2
(85.1 %) followed by CH
4
(8.6 %), HFC (3.5 %), N
2
O (2.0 %), PFC (0.5 %)
and SF
6
(0.4 %) emissions. Currently, emissions from industry are larger
than the emissions from either the buildings or transport end-use sec-
tors and represent just over 30 % of global GHG emissions in 2010 (just
over 40 % if Agriculture, Forestry, and Other Land Use (AFOLU) emis-
sions are not included). (high confidence) [10.2, 10.3]
Globally, industrial GHG emissions are dominated by the
Asia region, which was also the region with the fastest emis-
sion growth between 2005 and 2010 (high confidence). In 2010,
over half (52 %) of global direct GHG emissions from industry and
waste / wastewater were from the Asia region (ASIA), followed by the
member countries of the Organisation for Economic Co-operation and
Development in 1990 (OECD-1990) (25 %), Economies in Transition
(EIT) (9 %), Middle East and Africa (MAF) (8 %), and Latin America
(LAM) (6 %). Between 2005 and 2010, GHG emissions from industry
grew at an average annual rate of 3.5 % globally, comprised of 7 %
average annual growth in the ASIA region, followed by MAF (4.4 %),
LAM (2 %), and the EIT countries (0.1 %), but declined in the OECD-
1990 countries (– 1.1 %). [10.3]
The energy intensity of the sector could be reduced by approxi-
mately up to 25 % compared to current level through wide-
scale upgrading, replacement and deployment of best available
technologies, particularly in countries where these are not in
practice and for non-energy intensive industries (robust evidence,
high agreement). Despite long-standing attention to energy efficiency
in industry, many options for improved energy efficiency remain. [10.4,
10.7]
Through innovation, additional reductions of approximately up
to 20 % in energy intensity may potentially be realized before
approaching technological limits in some energy intensive
industries (limited evidence, medium agreement). Barriers to imple-
menting energy efficiency relate largely to the initial investment costs
and lack of information. Information programmes are the most preva-
lent approach for promoting energy efficiency, followed by economic
instruments, regulatory approaches, and voluntary actions. [10.4, 10.7,
10.9, 10.11]
Besides sector specific technologies, cross-cutting technologies
and measures applicable in both large energy intensive indus-
tries and Small and Medium Enterprises (SMEs) can help to
reduce GHG emissions (robust evidence, high agreement). Cross-cut-
ting technologies such as efficient motors, electronic control systems,
and cross-cutting measures such as reducing air or steam leaks help to
optimize performance of industrial processes and improve plant effi-
ciency cost-effectively with both energy savings and emissions benefits
[10.4].
Long-term step-change options can include a shift to low car-
bon electricity, radical product innovations (e� g�, alternatives
to cement), or carbon dioxide capture and storage (CCS)� Once
demonstrated, sufficiently tested, cost-effective, and publicly accepted,
these options may contribute to significant climate change mitigation
in the future (medium evidence, medium agreement). [10.4]
The level of demand for new and replacement products has a
significant effect on the activity level and resulting GHG emis-
sions in the industry sector (medium evidence, high agreement).
Extending product life and using products more intensively could
contribute to reduction of product demand without reducing the ser-
vice. Absolute emission reductions can also come through changes in
lifestyle and their corresponding demand levels, be it directly (e. g. for
food, textiles) or indirectly (e. g. for product / service demand related to
tourism). [10.4]
Mitigation activities in other sectors and adaptation measures
may result in increased industrial product demand and corre-
sponding emissions (robust evidence, high agreement). Production
of mitigation technologies (e. g., insulation materials for buildings) or
material demand for adaptation measures (e. g., infrastructure materi-
als) contribute to industrial GHG emissions. [10.4, 10.6]
Systemic approaches and collaboration within and across indus-
trial sectors at different levels, e� g�, sharing of infrastructure,
information, waste and waste management facilities, heating,

744744
Industry
10
Chapter 10
and cooling, may provide further mitigation potential in certain
regions or industry types (robust evidence, high agreement). The
formation of industrial clusters, industrial parks, and industrial symbio-
sis are emerging trends in many developing countries, especially with
SMEs. [10.5]
Several emission-reducing options in the industrial sector are
cost-effective and profitable (medium evidence, medium agree-
ment). While options in cost ranges of 20 – 50, 0 – 20, and even below
0 USD
2010
/ tCO
2
eq exist, to achieve near-zero emission intensity levels
in the industry sector would require additional realization of long-
term step-change options (e. g., CCS) associated with higher levelized
costs of conserved carbon (LCCC) in the range of 50 – 150 USD
2010
/ tCO
2
.
However, mitigation costs vary regionally and depend on site-specific
conditions. Similar estimates of costs for implementing material effi-
ciency, product-service efficiency, and service demand reduction strat-
egies are not available. [10.7]
Mitigation measures in the industry sector are often associated
with co-benefits (robust evidence, high agreement). Co-benefits of
mitigation measures could drive industrial decisions and policy choices.
They include enhanced competitiveness through cost reductions, new
business opportunities, better environmental compliance, health ben-
efits through better local air and water quality and better work condi-
tions, and reduced waste, all of which provide multiple indirect private
and social benefits. [10.8]
Unless barriers to mitigation in industry are resolved, the pace
and extent of mitigation in industry will be limited and even
profitable measures will remain untapped (robust evidence, high
agreement). There are a broad variety of barriers to implementing
energy efficiency in the industry sector; for energy-intensive industry,
the issue is largely initial investment costs for retrofits, while barriers
for other industries include both cost and a lack of information. For
material efficiency, product-service efficiency, and demand reduction,
there is a lack of experience with implementation of mitigation mea-
sures and often there are no clear incentives for either the supplier
or consumer. Barriers to material efficiency include lack of human and
institutional capacities to encourage management decisions and pub-
lic participation. [10.9]
There is no single policy that can address the full range of miti-
gation measures available for industry and overcome associ-
ated barriers (robust evidence, high agreement). In promoting energy
efficiency, information programs are the most prevalent approach,
followed by economic instruments, regulatory approaches and volun-
tary actions. To date, few policies have specifically pursued material or
product service efficiency. [10.11]
While the largest mitigation potential in industry lies in reduc-
ing CO
2
emissions from fossil fuel use, there are also signifi-
cant mitigation opportunities for non-CO
2
gases� Key opportuni-
ties comprise, for example, reduction of HFC emissions by leak repair,
refrigerant recovery and recycling, and proper disposal and replace-
ment by alternative refrigerants (ammonia, HC, CO
2
). Nitrous oxide
(N
2
O) emissions from adipic and nitric acid production can be reduced
through the implementation of thermal destruction and secondary
catalysts. The reduction of non-CO
2
GHGs also faces numerous barriers.
Lack of awareness, lack of economic incentives, and lack of commer-
cially available technologies (e. g., for HFC recycling and incineration)
are typical examples. [10.4, 10.7, 10.9]
Long-term scenarios for industry highlight improvements in
emissions efficiency as an important future mitigation strategy
(robust evidence, high agreement). Detailed industry sector scenarios
fall within the range of more general long-term integrated scenarios.
Improvements in emissions efficiency in the mitigation scenarios result
from a shift from fossil fuels to electricity with low (or negative) CO
2
emissions and use of CCS for industry fossil fuel use and process emis-
sions. The crude representation of materials, products, and demand in
scenarios limits the evaluation of the relative importance of material
efficiency, product-service efficiency, and demand reduction options.
(robust evidence, high agreement) [6.8, 10.10]
The most effective option for mitigation in waste manage-
ment is waste reduction, followed by re-use and recycling and
energy recovery (robust evidence, high agreement) [10.4, 10.14].
Direct emissions from the waste sector almost doubled during the
period from 1970 to 2010. Globally, approximately only 20 % of
municipal solid waste (MSW) is recycled and approximately 13.5 %
is treated with energy recovery while the rest is deposited in open
dumpsites or landfills. Approximately 47 % of wastewater produced
in the domestic and manufacturing sectors is still untreated. As the
share of recycled or reused material is still low, waste treatment tech-
nologies and energy recovery can also result in significant emission
reductions from waste disposal. Reducing emissions from landfilling
through treatment of waste by anaerobic digestion has the largest
cost range, going from negative cost to very high cost. Also, advanced
wastewater treatment technologies may enhance GHG emissions
reduction in the wastewater treatment but they tend to concentrate
in the higher costs options (medium evidence, medium agreement).
[10.14]
A key challenge for the industry sector is the uncertainty, incom-
pleteness, and quality of data available in the public domain
on energy use and costs for specific technologies on global and
regional scales that can serve as a basis for assessing perfor-
mance, mitigation potential, costs, and for developing policies
and programmes with high confidence� Bottom-up information
on cross-sector collaboration and demand reduction as well as their
implications for mitigation in industry is particularly limited. Improved
modelling of material flows in integrated models could lead to a better
understanding of material efficiency and demand reduction strategies
and the associated mitigation potentials. [10.12]

745745
Industry
10
Chapter 10
10.1 Introduction
This chapter provides an update to developments on mitigation in the
industry sector since the IPCC (Intergovernmental Panel on Climate
Change) Fourth Assessment Report (AR4) (IPCC, 2007), but has much
wider coverage. Industrial activities create all the physical products
(e. g., cars, agricultural equipment, fertilizers, textiles, etc.) whose use
delivers the final services that satisfy current human needs. Compared
to the industry chapter in AR4, this chapter analyzes industrial activi-
ties over the whole supply chain, from extraction of primary mate-
rials (e. g., ores) or recycling (of waste materials), through product
manufacturing, to the demand for the products and their services. It
includes a discussion of trends in activity and emissions, options for
mitigation (technology, practices, and behavioural aspects), estimates
of the mitigation potentials of some of these options and related
costs, co-benefits, risks and barriers to their deployment, as well as
industry-specific policy instruments. Findings of integrated models
(long-term mitigation pathways) are also presented and discussed
from the sector perspective. In addition, at the end of the chapter,
the hierarchy in waste management and mitigation opportunities are
synthesized, covering key waste-related issues that appear across
all chapters in the Working Group III contribution to the IPCC Fifth
Assessment Report (AR5).
Figure 10.1, which shows a breakdown of total global anthropogenic
GHG emissions in 2010 based on Bajželj etal. (2013), illustrates the
logic that has been used to distinguish the industry sector from other
sectors discussed in this report. The figure shows how human demand
for energy services, on the left, is provided by economic sectors,
through the use of equipment in which devices create heat or work
from final energy. In turn, the final energy has been created by pro-
cessing a primary energy source. Combustion of carbon-based fuels
leads to the release of GHG emissions as shown on the right. The
remaining anthropogenic emissions arise from chemical reactions in
industrial processes, from waste management and from the agriculture
and land-use changes discussed in Chapter 11.
Mitigation options can be chosen to reduce GHG emissions at all
stages in Figure 10.1, but caution is needed to avoid ‘double count-
ing’. The figure also demonstrates that care is needed when allocat-
ing emissions to specific products and services (‘carbon footprints’, for
example) while ensuring that the sum of all ‘footprints’ adds to the
sum of all emissions.
Emissions from industry (30 % of total global GHG emissions) arise
mainly from material processing, i. e., the conversion of natural
resources (ores, oil, biomass) or scrap into materials stocks which are
then converted in manufacturing and construction into products. Pro-
Figure 10�1 | A Sankey diagram showing the system boundaries of the industry sector and demonstrating how global anthropogenic emissions in 2010 arose from the chain of
technologies and systems required to deliver final services triggered by human demand. The width of each line is proportional to GHG emissions released, and the sum of these
widths along any vertical slice through the diagram is the same, representing all emissions in 2010 (Bajželj etal., 2013).
Burners
Electricity
Coal
CO
2
Mobility
Freight
Warmth
Other
Goods &
Services
Construction
Food
Waste
Transport
Buildings
Industry
Agriculture
Car
Truck
Appliances
Heated
Space &
Water
Furnaces
&
Boilers
Machines
Crops
Livestock
Process
Engines
&
Motors
Land-Use Change
Waste Management
Oil Fuels
Fuel
Production
Natural
Gas
Oil
F-Gas
CH
4
N
2
O
Device Final Energy Fuel EmissionsEquipmentSectorService
746746
Industry
10
Chapter 10
duction of just iron and steel and non-metallic minerals (predominately
cement) results in 44 % of all carbon dioxide (CO
2
) emissions (direct,
indirect, and process-related) from industry. Other emission-intensive
sectors are chemicals (including plastics) and fertilizers, pulp and
paper, non-ferrous metals (in particular aluminium), food processing
(food growing is covered in Chapter 11), and textiles.
Decompositions of GHG emissions have been used to analyze the dif-
ferent drivers of global industry-related emissions. An accurate decom-
position for the industry sector would involve great complexity, so
instead this chapter uses a simplified conceptual expression to identify
the key mitigation opportunities available within the sector:
G =
G
_
E
×
E
_
M
×
M
_
P
×
P
_
S
× S
where G is the GHG emissions of the industrial sector within a speci-
fied time period (usually one year), E is industrial sector energy con-
sumption and M is the total global production of materials in that
period. P is stock of products created from these materials (including
both consumables and durables added to existing stocks), and S is the
services delivered in the time period through use of those products.
The expression is indicative only, but leads to the main mitigation
strategies discussed in this chapter:
G / E is the emissions intensity of the sector expressed as a ratio to
the energy used: the GHG emissions of industry arise largely from
energy use (directly from combusting fossil fuels, and indirectly
through purchasing electricity and steam), but emissions also arise
from industrial chemical reactions. In particular, producing cement,
chemicals, and non-ferrous metals leads to the inevitable release
of significant ‘process emissions’ regardless of energy supply. We
refer to reductions in G / E as emissions efficiency for the energy
inputs and the processes.
E / M is the energy intensity: approximately three quarters of industrial
energy use is required to create materials from ores, oil or biomass,
with the remaining quarter used in the downstream manufactur-
ing and construction sectors that convert materials to products.
The energy required can in some cases (particularly for metals and
paper) be reduced by production from recycled scrap, and can be
further reduced by material re-use, or by exchange of waste heat
and exchange of by-products between sectors. Reducing E / M is the
goal of energy efficiency.
M / P is the material intensity of the sector: the amount of material required
to create a product and maintain the stock of a product depends both
on the design of the product and on the scrap discarded during its
production. Both can be reduced by material efficiency.
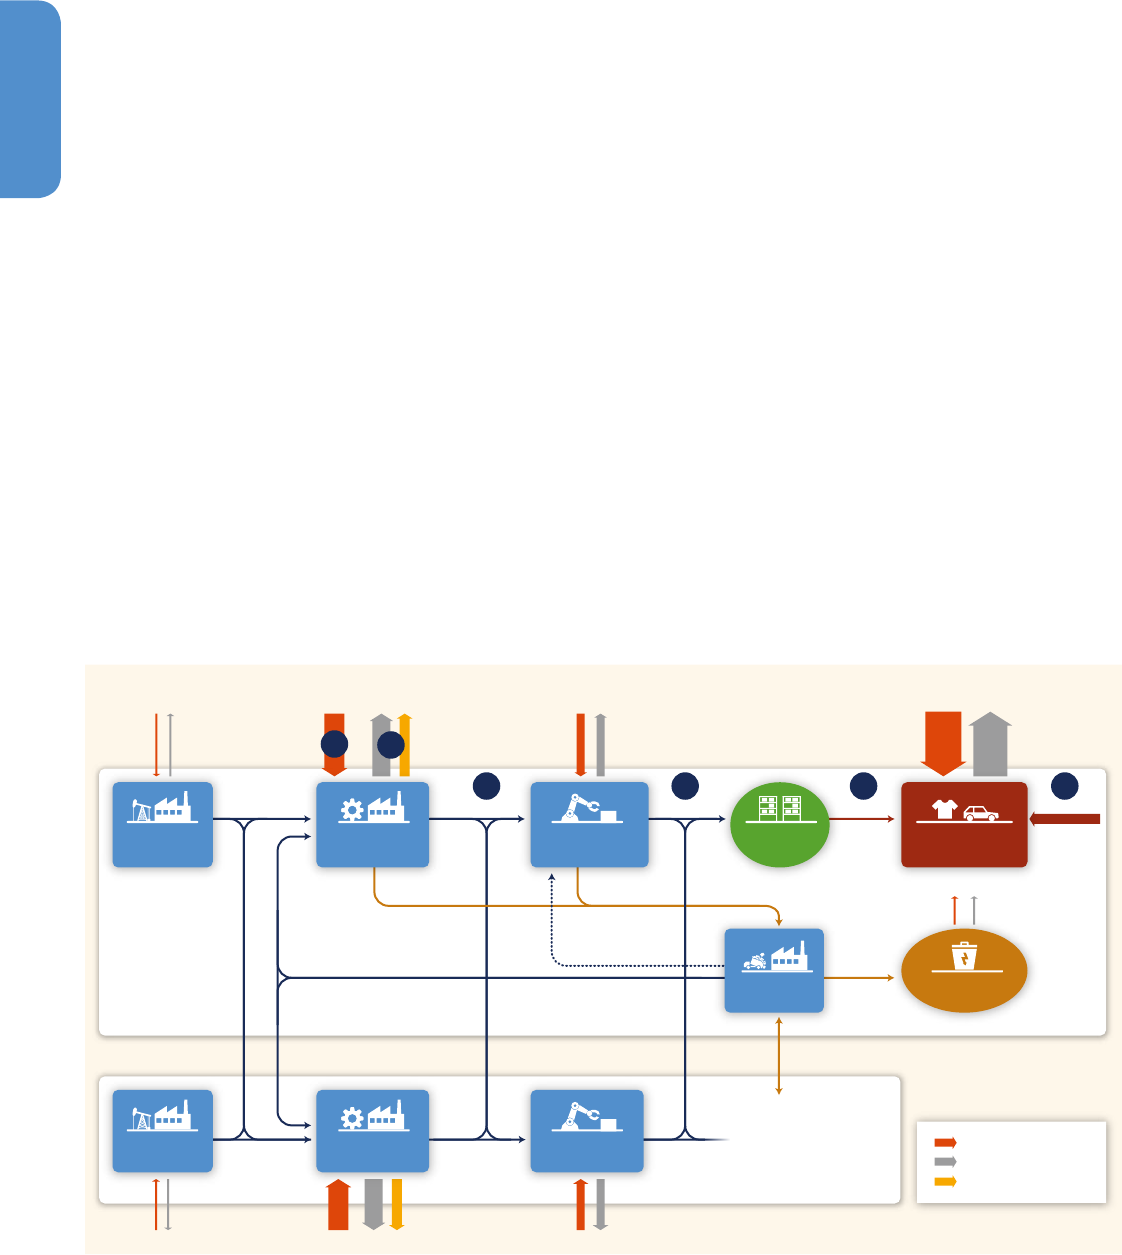
Figure 10�2 | A schematic illustration of industrial activity over the supply chain. Options for climate change mitigation in the industry sector are indicated by the circled numbers:
(1) Energy efficiency (e. g., through furnace insulation, process coupling, or increased material recycling); (2) Emissions efficiency (e. g., from switching to non-fossil fuel electricity
supply, or applying CCS to cement kilns); (3a) Material efficiency in manufacturing (e. g., through reducing yield losses in blanking and stamping sheet metal or re-using old struc-
tural steel without melting); (3b) Material efficiency in product design (e. g., through extended product life, light-weight design, or de-materialization); (4) Product-Service efficiency
(e. g., through car sharing, or higher building occupancy); (5) Service demand reduction (e. g., switching from private to public transport).
Energy Use
Process Emissions
Energy-Related Emissions
Extractive
Industry
Materials
Industries
Energy (Ch.7)
Energy (Ch.7) Downstream Buildings/Transport (Chs. 8,9)
Demand
ServicesProductsMaterialFeedstocks
Home Scrap New Scrap Retirement
Discards
Re-Use
Recyclate
Manufacturing
and Construction
Extractive
Industry
Materials
Industries
Manufacturing
and Construction
Waste to Energy/
Disposal
Regional/
Domestic
Industry
Waste
Industry
Rest of the World/
Offshore Industry:
Traded Emissions
(See Ch. 5 and 14)
Use of Products
to Provide Services
Downstream
543b3a
2
1
Stock of
Products

747747
Industry
10
Chapter 10
P / S is the product-service intensity: the level of service provided by a
product depends on its intensity of use. For consumables (e. g., food
or detergent) that are used within the accounting period in which
they are produced, service is provided solely by the production
within that period. For durables that last for longer than the account-
ing period (e. g., clothing), services are provided by the stock of prod-
ucts in current use. In this case P is the flow of material required to
replace retiring products and to meet demand for increases in total
stock. Thus for consumables, P / S can be reduced by more precise use
(for example using only recommended doses of detergents or apply-
ing fertilizer precisely) while for durables, P / S can be reduced both
by using durable products for longer and by using them more inten-
sively. We refer to reductions in P / S as product-service efficiency.
S: The total global demand for service is a function of population,
wealth, lifestyle, and the whole social system of expectations and
aspirations. If the total demand for service were to decrease, it
would lead to a reduction in industrial emissions, and we refer to
this as demand reduction.
Figure 10.2 expands on this simplified relationship to illustrate the
main options for GHG emissions mitigation in industry (circled num-
bers). The figure also demonstrates how international trade of prod-
ucts leads to significant differences between ‘production’ and ‘con-
sumption’ measures of national emissions, and demonstrates how the
‘waste’ industry, which includes material recycling as well as options
like ‘waste to energy’ and disposal, has a significant potential for influ-
encing future industrial emissions.
Figure 10.2 clarifies the terms used for key sectors in this chapter:
‘Industry’ refers to the totality of activities involving the physical trans-
formation of materials within which ‘extractive industry’ supplies feed-
stock to the energy-intensive ‘materials industries’ which create refined
materials. These are converted by ‘manufacturing’ into products and
by ‘construction’ into buildings and infrastructure. ‘Home scrap’ from
the materials processing industries, ‘new scrap’ from downstream con-
struction and manufacturing, and products retiring at end-of-life are
processed in the ‘waste industry.’ This ‘waste’ may be recycled (particu-
larly bulk metals, paper, glass and some plastics), may be re-used to
save the energy required for recycling, or may be discarded to landfills
or incinerated (which can lead to further emissions on one hand and
energy recovery on the other hand).
10.2 New developments in
extractive mineral indus-
tries, manufacturing
industries and services
World production trends of mineral extractive industries, manufactur-
ing, and services, have grown steadily in the last 40 years (Figure 10.3).
However, the service sector share in world GDP increased from 50 % in
1970 to 70 % in 2010; while the industry world GDP share decreased
from 38.2 to 26.9 % (World Bank, 2013).
Figure 10�3 | World’s growth of main minerals and manufacturing products (1970 = 1). Sources: (WSA, 2012a; FAO, 2013; Kelly and Matos, 2013).
20102005200019951990
Relative Growth [1970=1]
19851980
19751970
0
1
2
3
4
5
6
7
Paper and Paperboard
Nitrogen (Fixed) - Ammonia
Cement
Steel
Iron ore
Gold
Silver
Copper

748748
Industry
10
Chapter 10
Concerning extractive industries for metallic minerals, from 2005 to
2012 annual mining production of iron ore, gold, silver, and copper
increased by 10 %, 1 %, 2 %, and 2 % respectively (Kelly and Matos,
2013). Most of the countries in Africa, Latin America, and the tran-
sition economies produce more than they use; whereas use is being
driven mainly by consumption in China, India, and developed coun-
tries (UNCTAD, 2008)
1
. Extractive industries of rare earths are gain-
ing importance because of their various uses in high-tech industry
(Moldoveanu and Papangelakis, 2012). New mitigation technologies,
such as hybrid and electric vehicles (EVs), electricity storage and
renewable technologies, increase the demand for certain miner-
als, such as lithium, gallium, and phosphates (Bebbington and Bury,
2009). Concerns over depletion of these minerals have been raised,
but important research on extraction methods as well as increasing
recycling rates are leading to increasing reserve estimates for these
materials (Graedel etal., 2011; Resnick Institute, 2011; Moldoveanu
and Papangelakis, 2012; Eckelman et al., 2012). China accounts for
97 % of global rare earth extraction (130 Mt in 2010) (Kelly and
Matos, 2013).
Regarding manufacturing production, the annual global production
growth rate of steel, cement, ammonia, aluminium, and paper — the
most energy-intensive industries — ranged from 2 % to 6 % between
2005 and 2012 (Table 10.1). Many trends are responsible for this devel-
opment (e. g., urbanization significantly triggered demand on construc-
tion materials). Over the last decades, as a general trend, the world has
witnessed decreasing industrial activity in developed countries with a
major downturn in industrial production due to the economic reces-
sion in 2009 (Kelly and Matos, 2013). There is continued increase in
industrial activity and trade of some developing countries. The increase
in manufacturing production and consumption has occurred mostly in
Asia. China is the largest producer of the main industrial outputs. In
many middle-income countries industrialization has stagnated, and in
general Africa and Least Developed Countries (LDCs) have remained
marginalized (UNIDO, 2009; WSA, 2012a). In 2012, 1.5 billion tonnes
of steel (212 kg / cap) were manufactured; 46 % was produced and
consumed in mainland China (522 kg / cap). China also dominates
global cement production, producing 2.2 billion tonnes (1,561 kg / cap)
in 2012, followed by India with only 250 Mt (202 kg / cap) (Kelly and
Matos, 2013; UNDESA, 2013). More subsector specific trends are in
Section 10.4.
Globally large-scale production dominates energy-intensive indus-
tries; however small- and medium-sized enterprises are very impor-
tant in many developing countries. This brings additional challenges
for mitigation efforts (Worrell etal., 2009; Roy, 2010; Ghosh and Roy,
2011).
1
For example, in 2008, China imported 50 % of the world’s total iron ore exports
and produced about 50 % of the world’s pig iron (Kelly and Matos, 2013). India
demanded 35 % of world´s total gold production in 2011 (WGC, 2011), and the
United States consumed 33 % of world´s total silver production in 2011 (Kelly and
Matos, 2013).
Table 10�1 | Total production of energy-intensive industrial goods for the world top-5
producers of each commodity: 2005, 2012, and average annual growth rate (AAGR)
(FAO, 2013; Kelly and Matos, 2013).
Commodity / Country
2005
[Mt]
2012
[Mt]
AAGR
Iron ore
World 1540 3000 10 %
China 420 1300 18 %
Australia 262 525 10 %
Brazil 280 375 4 %
India 140 245 8 %
Russia 97 100 0.4 %
Steel
World 1130 1500 4 %
China 349 720 11 %
Japan 113 108 – 1 %
U. S. 95 91 – 1 %
India 46 76 8 %
Russia 66 76 2 %
Cement
World 2310 3400 6 %
China 1040 2150 11 %
India 145 250 8 %
U. S. 101 74 – 4 %
Brazil 37 70 10 %
Iran 33 65 10 %
Ammonia
World 121.0 137.0 2 %
China 37.8 44.0 2 %
India 10.8 12.0 2 %
Russia 10.0 10.0 0 %
U. S. 8.0 9.5 2 %
Trinidad & Tobago 4.2 5.5 4 %
Aluminium
World 31.9 44.9 5 %
China 7.8 19.0 14 %
Russia 3.7 4.2 2 %
Canada 2.9 2.7 – 1 %
U. S. 2.5 2.0 – 3 %
Australia 1.9 1.9 0 %
Paper
World 364.7 401.1 1 %
China 60.4 106.3 8 %
U. S. 83.7 75.5 – 1 %
Japan 31.0 26.0 – 2 %
Germany 21.7 22.6 1 %
Indonesia 7.2 11.5 7 %

749749
Industry
10
Chapter 10
Another important change in the world´s industrial output over the
last decades has been the rise in the proportion of international
trade. Manufactured products are not only traded, but the produc-
tion process is increasingly broken down into tasks that are them-
selves outsourced and / or traded; i. e., production is becoming less
vertically integrated. In addition to other drivers such as population
growth, urbanization, and income increase, the rise in the propor-
tion of trade has been driving production increase for certain coun-
tries (Fisher-Vanden et al., 2004; Liu and Ang, 2007; Reddy and
Ray, 2010; OECD, 2011). The economic recession of 2009 reduced
industrial production worldwide because of consumption reduction,
low optimism in credit market, and a decline in world trade (Nis-
sanke, 2009). More discussion on GHG emissions embodied in trade
is presented in Chapter 14. Similar to industry, the service sector is
heterogeneous and has significant proportion of small and medium
sized enterprises. The service sector covers activities such as public
administration, finance, education, trade, hotels, restaurants, and
health. Activity growth in developing countries and structural shift
with rising income is driving service sector growth (Fisher-Vanden
etal., 2004; Liu and Ang, 2007; Reddy and Ray, 2010; OECD, 2011).
OECD countries are shifting from manufacturing towards service-ori-
ented economies (Sun, 1998; Schäfer, 2005; US EIA, 2010), however,
this is also true for some non-OECD countries. For example, India has
almost 64 % – 66 % of GDP contribution from service sector (World
Bank, 2013).
10.3 New developments
in emission trends
and drivers
In 2010, the industry sector accounted for around 28 % of final energy
use (IEA, 2013). Global industry and waste / wastewater GHG emis-
sions grew from 10.37 GtCO
2
eq in 1990 to 13.04 GtCO
2
eq in 2005 to
15.44 GtCO
2
eq in 2010. These emissions are larger than the emissions
from either the buildings or transport end-use sectors and represent
just over 30 % of global GHG emissions in 2010 (just over 40 % if
AFOLU emissions are not included). These total emissions are com-
prised of:
• Direct energy-related CO
2
emissions for industry
2
• Indirect CO
2
emissions from production of electricity and heat for
industry
3
• Process CO
2
emissions
• Non-CO
2
GHG emissions
• Direct emissions for waste / wastewater
2
This also includes CO
2
emissions from non-energy uses of fossil fuels.
3
The methodology for calculating indirect CO
2
emissions is based on de la Rue du
Can and Price (2008) and described in AnnexII.5.
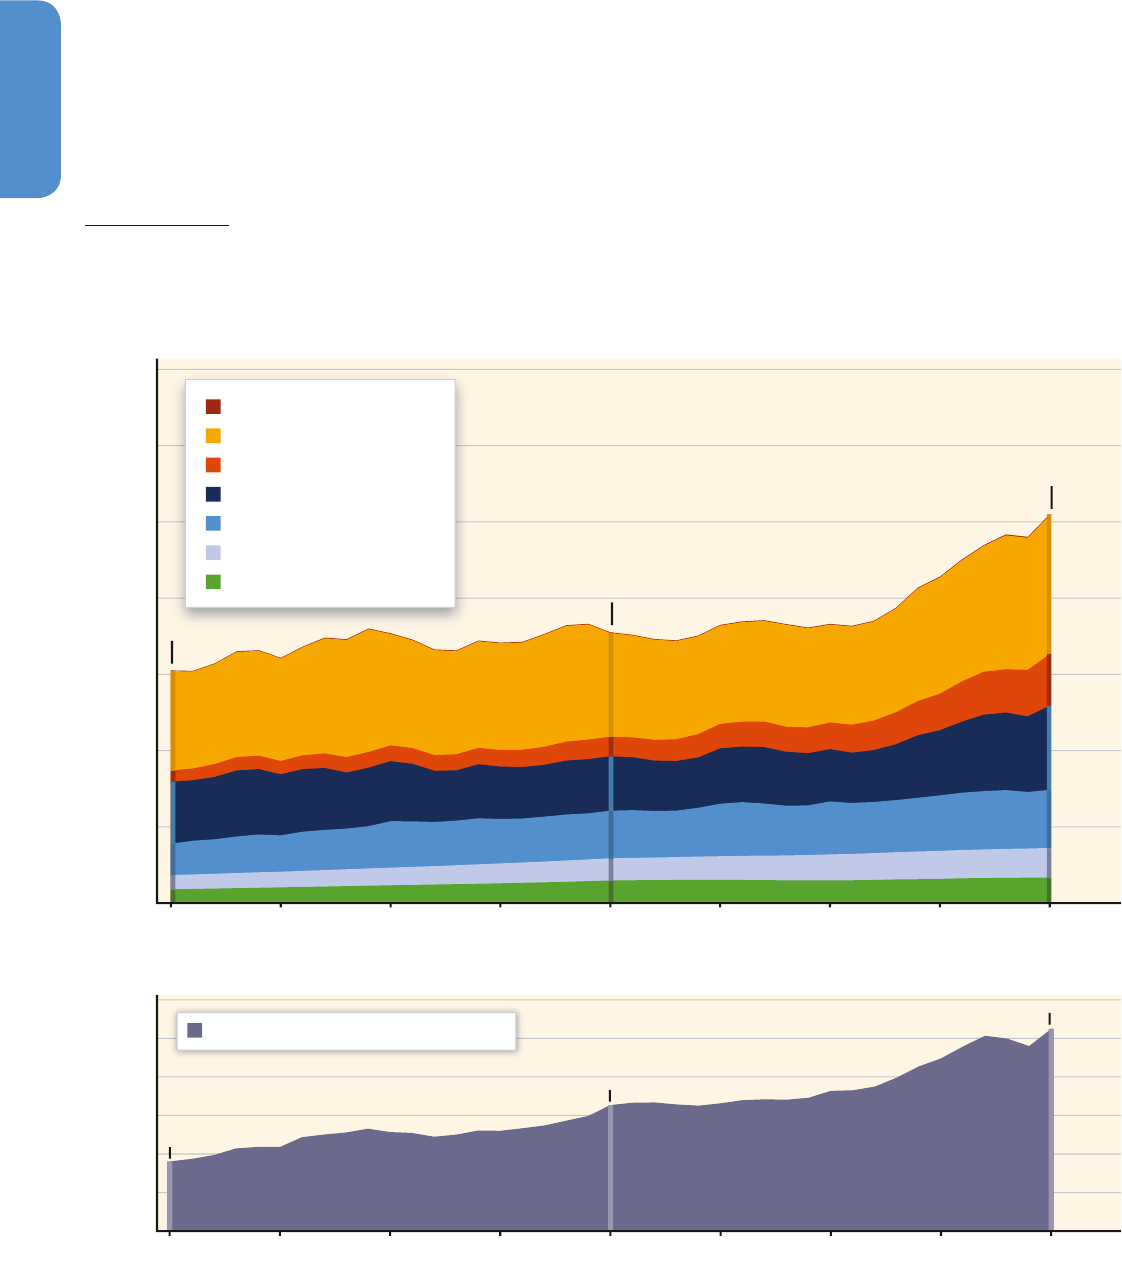
Figure 10.4 shows global industry and waste / wastewater direct and
indirect GHG emissions by source from 1970 to 2010. Table 10.2 shows
primary energy
4
and GHG emissions for industry by emission type
(direct energy-related, indirect from electricity and heat production,
process CO
2
, and non-CO
2
), and for waste / wastewater for five world
regions and the world total.
5
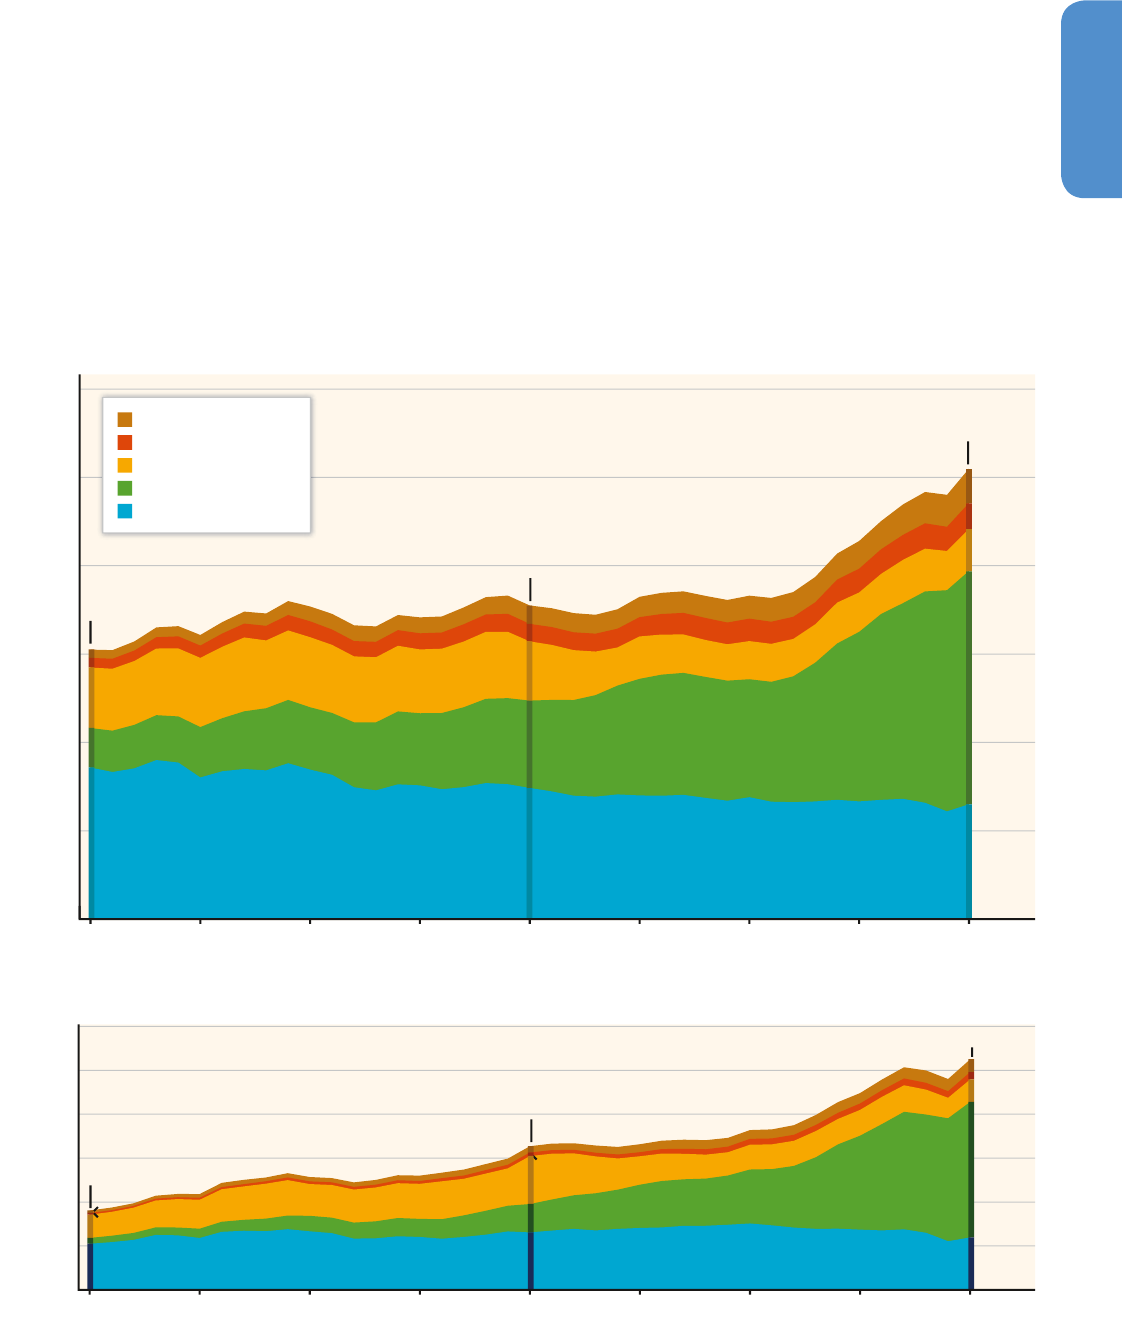
Figure 10.5 shows global industry and waste / wastewater direct and
indirect GHG emissions by region from 1970 to 2010. This regional
breakdown shows that:
• Over half (52 %) of global direct GHG emissions from industry and
waste / wastewater are from the ASIA region, followed by OECD-
1990 (25 %), EIT (9.4 %), MAF (7.6 %), and LAM (5.7 %).
• Between 2005 and 2010, GHG emissions from industry grew at an
average annual rate of 3.5 % globally, comprised of 7.0 % average
annual growth in the ASIA region, followed by MAF (4.4 %), LAM
(2.0 %), and the EIT countries (0.1 %), but declined in the OECD-
1990 countries (– 1.1 %).
Regional trends are further discussed in Chapter 5, Section 5.2.1.
Table 10.3 provides 2010 direct and indirect GHG emissions by source
and gas. 2010 direct and indirect emissions were dominated by CO
2
(85.1 %), followed by methane (CH
4
) (8.6 %), hydrofluorocarbons (HFC)
(3.5 %), nitrous oxide (N
2
O) (2.0 %), Perfluorocarbons (PFC) (0.5 %)
and sulphur hexafluoride (SF
6
) (0.4 %) emissions.
10�3�1 Industrial CO
2
emissions
As shown in Table 10.3, industrial CO
2
emissions were 13.14 GtCO
2
in 2010. These emissions were comprised of 5.27 GtCO
2
direct
energy-related emissions, 5.25 GtCO
2
indirect emissions from elec-
tricity and heat production, 2.59 GtCO
2
from process CO
2
emissions
and 0.03 GtCO
2
from waste / wastewater. Process CO
2
emissions are
comprised of process-related emissions of 1.352 GtCO
2
from cement
production,
6
0.477 GtCO
2
from production of chemicals, 0.242 GtCO
2
from lime production, 0.134 GtCO
2
from coke ovens, 0.074 GtCO
2
from
non-ferrous metals production, 0.072 GtCO
2
from iron and steel produc-
tion, 0.061 GtCO
2
from ferroalloy production, 0.060 GtCO
2
from lime-
stone and dolomite use, 0.049 GtCO
2
from solvent and other product
use, 0.042 GtCO
2
from production of other minerals and 0.024 GtCO
2
from non-energy use of lubricants / waxes (JRC / PBL, 2013). Total indus-
trial CO
2
values include emissions from mining and quarrying, from
manufacturing, and from construction.
4
See Glossary in AnnexI for definition of primary energy.
5
The IEA also recently published CO
2
emissions with electricity and heat allocated
to end-use sectors (IEA, 2012a). However, the methodology used in this report
differs slightly from the IEA approach as explained in Annex II.5
6
Another source, Boden et al., 2013, indicates that cement process CO
2
emissions
in 2010 were 1.65 GtCO
2
.
750750
Industry
10
Chapter 10
Energy-intensive processes in the mining sector include excavation,
mine operation, material transfer, mineral preparation, and separa-
tion. Energy consumption for mining
7
and quarrying, which is included
in ‘other industries’ in Figure 10.4, represents about 2.7 % of world-
wide industrial energy use, varying regionally, and a significant share
of national industrial energy use in Botswana and Namibia (around
80 %), Chile (over 50 %), Canada (30 %), Zimbabwe (18.6 %), Mongo-
lia (16.5 %), and South Africa (almost 15 %) in 2010 (IEA, 2012b; c).
7
Discussion of extraction of energy carriers (e. g., coal, oil, and natural gas) takes
place in Chapter 7.
Manufacturing is a subset of industry that includes production of all
products (e. g., steel, cement, machinery, textiles) except for energy
products, and does not include energy used for construction. Manu-
facturing is responsible for about 98 % of total direct CO
2
emissions
from the industrial sector (IEA, 2012b; c). Most manufacturing CO
2
emissions arise due to chemical reactions and fossil fuel combustion
largely used to provide the intense heat that is often required to bring
about the physical and chemical transformations that convert raw
materials into industrial products. These industries, which include pro-
duction of chemicals and petrochemicals, iron and steel, cement, pulp
and paper, and aluminium, usually account for most of the sector’s
Figure 10�4 | Total global industry and waste / wastewater direct and indirect GHG emissions by source, 1970 – 2010 (GtCO
2
eq / yr) (de la Rue du Can and Price, 2008; IEA, 2012a;
JRC / PBL, 2013). See also AnnexII.9, AnnexII.5.
Note: For statistical reasons ‘Cement production’ only covers process CO
2
emissions (i. e., emissions from cement-forming reactions); energy-related direct emissions from cement
production are included in ‘other industries’ CO
2
emissions.
0
1
2
3
4
5
6
2
4
6
8
10
12
201020052000199519901985198019751970
201020052000199519901985198019751970
GHG Emissions [GtCO
2
eq/yr] GHG Emissions [GtCO
2
eq/yr]
0.26%
43%
4.8%
27%
13%
6.1%
5.9%
0.24%
38%
7.2%
20%
18%
8.2%
8.3%
0.24%
36%
13%
22%
15%
7.6%
6.6%
Indirect Emissions
Direct Emissions
Indirect Emissions from Heat & Electricity Production
N
2
O Emissions from Industry
Other Industries
Wastewater Treatment
Landfill, Waste Incineration and Others
Cement Production
Chemicals
Ferrous and Non-Ferrous Metals
Total 1.8
Total 3.3
Total 5.3
Total 6.1
Total 7.1
Total 10
751751
Industry
10
Chapter 10
energy consumption in many countries. In India, the share of energy
use by energy-intensive manufacturing industries in total manufactur-
ing energy consumption is 62 % (INCCA, 2010), while it is about 80 %
in China (NBS, 2012).
Overall reductions in industrial energy use / manufacturing value-
added were found to be greatest in developing economies during
1995 – 2008. Low-income developing economies had the highest
industrial energy intensity values while developed economies had the
lowest. Reductions in intensity were realized through technological
changes (e. g., changes in product mix, adoption of energy-efficient
technologies, etc.) and structural change in the share of energy-
intensive industries in the economy. During 1995 – 2008, developing
economies had greater reductions in energy intensity while developed
economies had greater reductions through structural change (UNIDO,
2011).
The share of non-energy use of fossil fuels (e. g., the use of fossil fuels
as a chemical industry feedstock, of refinery and coke oven products,
and of solid carbon for the production of metals and inorganic chemi-
cals) in total manufacturing final energy use has grown from 20 % in
2000 to 24 % in 2009 (IEA, 2012b; c). Fossil fuels used as raw materi-
Figure 10�5 | Total global industry and waste / wastewater direct and indirect GHG emissions by region, 1970 – 2010 (GtCO
2
eq / yr) (de la Rue du Can and Price, 2008; IEA, 2012a;
JRC / PBL, 2013). See also AnnexII.9, AnnexII.5.
Total 1.8
Total 3.3
Total 5.2
0.06
0.04
0.53
0.13
1.0
0.14
0.08
1.1
0.65
1.3
0.29
0.17
0.51
3.1
1.2
201020052000199519901985198019751970
2010200520001995199019851980
19751970
0
2
4
6
8
10
12
GHG Emissions [GtCO
2
eq/yr]
Indirect Emissions
Middle East and Africa
Latin America and Carribean
Economies in Transition
Asia
OECD-1990 Countries
Direct Emissions
GHG Emissions [GtCO
2
eq/yr]
3.1%
3.6%
22%
15%
56%
5.9%
5.6%
19%
28%
42%
7.6%
5.7%
9.4%
52%
25%
Total 6.1
Total 7.1
Total 10
0
1
2
3
4
5
6

752752
Industry
10
Chapter 10
als / feedstocks in the chemical industry may result in CO
2
emissions at
the end of their life-span in the disposal phase if they are not recovered
or recycled (Patel etal., 2005). These emissions need to be accounted
for in the waste disposal sector’s emissions, although data on waste
imports / exports and ultimate disposition are not consistently compiled
or reliable (Masanet and Sathaye, 2009). Subsector specific details are
also in Section 10.4.
Trade is an important factor that influences production choice deci-
sions and hence CO
2
emissions at the country level. Emission invento-
ries based on consumption rather than production reflect the fact that
products produced and exported for consumption in developed coun-
tries are an important contributing factor of the emission increase for
certain countries such as China, particularly since 2000 (Ahmad and
Wyckoff, 2003; Wang and Watson, 2007; Peters and Hertwich, 2008;
Table 10�2 | Industrial Primary Energy (EJ) and GHG emissions (GtCO
2
eq) by emission type (direct energy-related, indirect from electricity and heat production, process CO
2
, and
non-CO
2
), and waste / wastewater for five world regions and the world total (IEA, 2012a; b; c; JRC / PBL, 2013; see Annex II.9). For definitions of regions see AnnexII.2.
Primary Energy (EJ) GHG Emissions (Gt CO
2
eq)
1990 2005 2010 1990 2005 2010
ASIA
Direct (energy-related) 20.89 42.83 56.80 1.21 2.08 2.92
Indirect (electricity + heat) 5.25 15.11 24.38 0.65 2.14 3.08
Process CO
2
emissions 0.36 0.96 1.49
Non-CO
2
GHG emissions 0.05 0.25 0.27
Waste / wastewater 0.35 0.54 0.60
Total 26�14 57�93 81�17 2�62 5�98 8�36
EIT
Direct (energy-related) 21.98 13.47 13.68 0.79 0.41 0.45
Indirect (electricity + heat) 6.84 4.10 3.42 1.09 0.59 0.51
Process CO
2
emissions 0.32 0.23 0.23
Non-CO
2
GHG emissions 0.11 0.12 0.12
Waste / wastewater 0.12 0.13 0.15
Total 28�82 17�56 17�10 2�43 1�48 1�47
LAM
Direct (energy-related) 5.85 8.64 9.45 0.19 0.26 0.28
Indirect (electricity + heat) 0.97 1.67 1.93 0.08 0.15 0.17
Process CO
2
emissions 0.08 0.11 0.13
Non-CO
2
GHG emissions 0.03 0.03 0.03
Waste / wastewater 0.10 0.14 0.14
Total 6�82 10�31 11�38 0�48 0�68 0�75
MAF
Direct (energy-related) 5.59 8.91 11.43 0.22 0.30 0.37
Indirect (electricity + heat) 1.12 1.99 2.58 0.14 0.24 0.29
Process CO
2
emissions 0.08 0.15 0.21
Non-CO
2
GHG emissions 0.02 0.02 0.02
Waste / wastewater 0.10 0.16 0.17
Total 6�71 10�90 14�01 0�56 0�86 1�07
OECD-1990
Direct (energy-related) 40.93 45.63 42.45 1.55 1.36 1.24
Indirect (electricity + heat) 11.25 10.92 9.71 1.31 1.37 1.19
Process CO
2
emissions 0.57 0.56 0.52
Non-CO
2
GHG emissions 0.35 0.35 0.44
Waste / wastewater 0.50 0.40 0.39
Total 52�18 56�55 52�16 4�28 4�04 3�79
World
Direct (energy-related) 95.25 119.47 133.81 3.96 4.41 5.27
Indirect (electricity + heat) 25.42 33.78 42.01 3.27 4.48 5.25
Process CO
2
emissions 1.42 2.01 2.59
Non-CO
2
GHG emissions 0.55 0.77 0.89
Waste / wastewater 1.17 1.37 1.45
Total 120�67 153�25 175�82 10�37 13�04 15�44
Note: Includes energy and non-energy use. Non-energy use covers those fuels that are used as raw materials in the different sectors and are not consumed as a fuel or transformed
into another fuel. Also includes construction.

753753
Industry
10
Chapter 10
Weber etal., 2008). Chapter 14 provides an in-depth discussion and
review of the literature related to trade, embodied emissions, and con-
sumption-based emissions inventories.
10�3�2 Industrial non-CO
2
GHG emissions
Table 10.4 provides emissions of non-CO
2
gases for some key industrial
processes (JRC / PBL, 2013). N
2
O emissions from adipic acid and nitric acid
production and PFC emissions from aluminium production decreased
while emissions from HFC-23 from HCFC-22 production increased
from 0.075 GtCO
2
eq in 1990 to 0.207 GtCO
2
eq in 2010. In the period
from 1990 – 2010, fluorinated gases (F-gases) and N
2
O were the most
important non-CO
2
GHG emissions in manufacturing industry. Most of
the F-gases arise from the emissions from different processes including
the production of aluminium and HCFC-22 and the manufacturing of
flat panel displays, magnesium, photovoltaics, and semiconductors. The
rest of the F-gases correspond mostly to HFCs that are used in refrigera-
tion equipment used in industrial processes. Most of the N
2
O emissions
from the industrial sector are contributed by the chemical industry, par-
ticularly from the production of nitric and adipic acids (EPA, 2012a). A
summary of the issues and trends that concern developing countries and
Least Developed Countries (LDCs) in this chapter is found in Box 10.1.
10.4 Mitigation technology
options, practices and
behavioural aspects
Figure 10.2, and its associated identity, define six options for climate
change mitigation in industry.
• Energy efficiency (E / M): Energy is used in industry to drive chem-
ical reactions, to create heat, and to perform mechanical work. The
required chemical reactions are subject to thermodynamic limits.
The history of industrial energy efficiency is one of innovating to
Table 10�4 | Emissions of non-CO
2
GHGs for key industrial processes (JRC / PBL, 2013)
1
Process
Emissions (MtCO
2
eq)
1990 2005 2010
HFC-23 from HCFC-22 production 75 194 207
ODS substitutes (Industrial process refrigeration)
2
0 13 21
PFC, SF
6
, NF
3
from flat panel display manufacturing 0 4 6
N
2
O from adipic acid and nitric acid production 232 153 104
PFCs and SF
6
from photovoltaic manufacturing 0 0 1
PFCs from aluminium production 107 70 52
SF
6
from manufacturing of electrical equipment 12 7 10
HFCs, PFCs, SF
6
and NF
3
from semiconductor manufacturing 7 21 17
SF
6
from magnesium manufacturing 12 9 8
CH
4
and N
2
O from other industrial processes 3 5 6
Note:
1
the data from US EPA (EPA, 2012a) show emissions of roughly the same mag-
nitude, but differ in total amounts per source as well as the growth trends. The
differences are significant in some particular sources like HFC-23 from HCFC-22
production, PFCs from aluminium production and N
2
O from adipic acid and nitric
acid production.
2
Ozone depleting substances (ODS) substitutes values from EPA (2012a).
Table 10�3 | Industry and waste / wastewater direct and indirect GHG emissions by
source and gas, 2010 (in MtCO
2
eq) (IEA, 2012a; JRC / PBL, 2013).
Source Gas
2010 Emissions
(MtCO
2
eq)
Ferrous and non ferrous metals
CO
2
2,127
CH
4
18.87
SF
6
8.77
PFC 52.45
N
2
O 4.27
Chemicals
CO
2
1,159
HFC 206.9
N
2
O 139.71
SF
6
11.86
CH
4
4.91
Cement* CO
2
1,352.35
Indirect (electricity + heat) CO
2
5,246.79
Landfill, Waste Incineration
and Others
CH
4
627.34
CO
2
32.50
N
2
O 11.05
Wastewater treatment
CH
4
666.75
N
2
O 108.04
Other industries
CO
2
3,222.24
SF
6
40.59
N
2
O 15.96
CH
4
9.06
PFC 20.48
HFC 332.38
Indirect N
2
O 24.33
Gas
2010 Emissions
(MtCO
2
eq)
Carbon dioxide CO
2
13,139
Methane CH
4
1,326.93
Hydrofluorocarbons HFC 539.28
Nitrous oxide N
2
O 303.35
Perfluorocarbons PFC 72.93
Sulphur hexafluoride SF
6
61.21
Carbon Dioxide Equivalent
(total of all gases)
CO
2
eq 15,443
Note: CO
2
emissions from cement-forming reactions only; cement energy-related direct
emissions are included in ‘other industries’ CO
2
emissions.

754754
Industry
10
Chapter 10
Box 10�1 | Issues regarding Developing and Least Developed Countries (LDCs)
Reductions in energy intensity (measured as final energy use per
industrial GDP) from 1995 to 2008 were larger in developing
economies than in developed economies (UNIDO, 2011). The shift
from energy-intensive industries towards high-tech sectors (struc-
tural change) was the main driving force in developed economies,
while the energy intensity reductions in large developing econo-
mies such as China, India, and Mexico and transition economies
such as Azerbaijan and Ukraine were related to technological
changes (Reddy and Ray, 2010; Price etal., 2011; UNIDO, 2011;
Sheinbaum-Pardo etal., 2012; Roy etal., 2013). Brazil is a special
case were industrial energy intensity increased (UNIDO, 2011;
Sheinbaum etal., 2011). The potential for industrial energy effi-
ciency is still very important for developing countries (see Sections
10.4 and 10.7), and possible industrialization development opens
the opportunity for the installation of new plants with highly
efficient energy and material technologies and processes (UNIDO,
2011).
Other strategies for mitigation in developing countries such as
emissions efficiency (e. g., fuel switching) depend on the fuel mix
and availability for each country. Product-service efficiency (e. g.,
using products more intensively) and reducing overall demand
for product services must be accounted differently depending on
the country’s income and development levels. Demand reduction
strategies are more relevant for developed countries because
of higher levels of consumption. However, some strategies for
material efficiency such as manufacturing lighter products (e. g.,
cars) and modal shifts in the transport sector that reduce energy
consumption in industry can have an important role in future
energy demand (see Chapter 8.4.2.2).
LDCs have to be treated separately because of their small
manufacturing production base. The share of manufacturing value
added (MVA) in the GDP of LDCs in 2011 was 9.7 % (7.2 % Africa
LDCs; Asia and the Pacific LDCs 13.3 % and no data for Haiti),
while it was 21.8 % in developing countries and 16.5 % in devel-
oped countries. The LDCs’ contribution to world MVA represented
only 0.46 % in 2010 (UNIDO, 2011; UN, 2013).
In most LDCs, the share of extractive industries has increased (in
many cases with important economic, social, and environmental
problems (Maconachie and Hilson, 2013)), while that of manu-
facturing either decreased in importance or stagnated, with the
exceptions of Tanzania and Ethiopia where their relative share of
agriculture decreased while manufacturing, services, and mining
increased (UNCTAD, 2011; UN, 2013).
Developed and developing countries are changing their industrial
structure, from low technology to medium and high technology
products (level of technology in production process), but LDCs
remain highly concentrated in low technology products. The
share of low technology products in the years 1995 and 2009 in
LDCs MVA was 68 % and 71 %, while in developing countries it
was 38 % and 30 % and in developed countries 33 % and 21 %,
respectively (UNIDO, 2011).
Among other development strategies, two alternative possible
scenarios could be envisaged for the industrial sector in LDCs:
(1) continuing with the present situation of concentration in
labour intensive and resource intensive industries or (2) moving
towards an increase in the production share of higher technol-
ogy products (following the trend in developing countries). The
future evolution of the industrial sector will be successful only
if the technologies adopted are consistent with the resource
endowments of LDCs. However, the heterogeneity of LDCs
circumstances needs to be taken into account when analyzing
major trends in the evolution of the group. A report prepared by
the United Nations Framework Convention on Climate Change
(UNFCCC) Secretariat summarizes the findings of 70 Technology
Needs Assessments (TNA) submitted, including 24 from LDCs.
Regarding the relationship between low carbon and sustainable
development, the relevant technologies for most of the LDCs are
related to poverty and hunger eradication, avoiding the loss of
resources, time and capital. Almost 80 % of LDCs considered the
industrial structure in their TNA, evidencing that they consider
this sector as a key element in their development strategies. The
technologies identified in the industrial sector and the propor-
tion of countries selecting them are: fuel switching (42 %),
energy efficiency (35 %), mining (30 %), high efficiency motors
(25 %), and cement production (25 %) (UNFCCC SBSTA, 2009).
A low carbon development strategy facilitated by access to
financial resources, technology transfer, technologies, and
capacity building would contribute to make the deployment of
national mitigation efforts politically viable. As adaptation is the
priority in almost all LDCs, industrial development strategies and
mitigation actions look for synergies with national adaptation
strategies.
create ‘best available technologies’ and implementing these tech-
nologies at scale to define a reference ‘best practice technology’,
and investing in and controlling installed equipment to raise ‘aver-
age performance’ nearer to ‘best practice’ (Dasgupta etal., 2012).
Energy efficiency has been an important strategy for industry for
various reasons for a long time. Over the last four decades there
has been continued improvement in energy efficiency in energy-
intensive industries and ‘best available technologies’ are increas-

755755
Industry
10
Chapter 10
ingly approaching technical limits. However, many options for
energy efficiency improvement remain and there is still significant
potential to reduce the gap between actual energy use and the
best practice in many industries and in most countries. For all, but
particularly for less energy intensive industries, there are still many
energy efficiency options both for process and system-wide tech-
nologies and measures. Several detailed analyses related to par-
ticular sectors estimate the technical potential of energy efficiency
measures in industry to be approximately up to 25 % (Schäfer,
2005; Allwood et al., 2010; UNIDO, 2011; Saygin et al., 2011b;
Gutowski etal., 2013). Through innovation, additional reductions
of approximately up to 20 % in energy intensity may potentially be
realized before approaching technological limits in some energy-
intensive industries (Allwood etal., 2010).
In industry, energy efficiency opportunities are found within sector-
specific processes as well as in systems such as steam systems,
process heating systems (furnaces and boilers), and electric motor
systems (e. g., pumps, fans, air compressor, refrigerators, material
handling). As a class of technology, electronic control systems help
to optimize performance of motors, compressors, steam combus-
tion, heating, etc. and improve plant efficiency cost-effectively with
both energy savings and emissions benefits, especially for SMEs
(Masanet, 2010).
Opportunities to improve heat management include better heat
exchange between hot and cold gases and fluids, improved insula-
tion, capture and use of heat in hot products, and use of exhaust
heat for electricity generation or as an input to lower temperature
processes (US DoE, 2004a, 2008). However, the value of these
options is in many cases limited by the low temperature of ‘waste
heat’ — industrial heat exchangers generally require a temperature
difference of ~200 °C — and the difficulty of exchanging heat out
of solid materials.
Recycling can also help to reduce energy demand, as it can be a
strategy to create material with less energy. Recycling is already
widely applied for bulk metals (steel, aluminium, and copper in
particular), paper, and glass and leads to an energy saving when
producing new material from old avoids the need for further
energy intensive chemical reactions. Plastics recycling rates in
Europe are currently around 25 % (Plastics Europe, 2012) due to
the wide variety of compositions in common use in small prod-
ucts, and glass recycling saves little energy as the reaction energy
is small compared to that needed for melting (Sardeshpande
etal., 2007). Recycling is applied when it is cost effective, but in
many cases leads to lower quality materials, is constrained by lack
of supply because collection rates, while high for some materi-
als (particularly steel), are not 100 %, and because with growing
global demand for material, available supply of scrap lags total
demand. Cement cannot be recycled, although concrete can be
crushed and down-cycled into aggregates or engineering fill. How-
ever, although this saves on aggregate production, it may lead to
increased emissions, due to energy used in concrete crushing and
refinement and because more cement is required to achieve target
properties (Dosho, 2008).
• Emissions efficiency (G / E): In 2008, 42 % of industrial energy
supply was from coal and oil, 20 % from gas, and the remainder
from electricity and direct use of renewable energy sources. These
shares are forecast to change to 30 % and 24 % respectively by
2035 (IEA, 2011a) resulting in lower emissions per unit of energy,
as discussed in Chapter 7. Switching to natural gas also favours
more efficient use of energy in industrial combined heat and
power (CHP) installations (IEA, 2008, 2009a). For several renew-
able sources of energy, CHP (IEA, 2011b) offers useful load bal-
ancing opportunities if coupled with low-grade heat storage; this
issue is discussed further in Chapter 7. The use of wastes and
biomass in the energy industry is currently limited, but forecast
to grow (IEA, 2009b). The cement industry incinerates (with due
care for e. g., dioxins / furans) municipal solid waste and sewage
sludge in kilns, providing ~17 % of the thermal energy required
by European Union (EU) cement production in 2004 (IEA ETSAP,
2010). The European paper industry reports that over 50 % of its
energy supply is from biomass (CEPI, 2012). If electricity genera-
tion is decarbonized, greater electrification, for example appro-
priate use of heat pumps instead of boilers (IEA, 2009b; HPTCJ,
2010), could also reduce emissions. Solar thermal energy for dry-
ing, washing, and evaporation may also be developed further (IEA,
2009c) although to date this has not been implemented widely
(Sims etal., 2011).
The International Energy Agency (IEA) forecasts that a large part
of emission reduction in industry will occur by carbon dioxide cap-
ture and storage (CCS) (up to 30 % in 2050) (IEA, 2009c). Carbon
dioxide capture and storage is largely discussed in Chapter 7. In
gas processing (Kuramochi etal., 2012a) and parts of the chemical
industry (ammonia production without downstream use of CO
2
),
there might be early opportunities for application of CCS as the
CO
2
in vented gas is already highly concentrated (up to 85 %),
compared to cement or steel (up to 30 %). Industrial utilization of
CO
2
was assessed in the IPCC Special Report on Carbon Dioxide
Capture and Storage (SRCCS) (Mazzotti etal., 2005) and it was
found that potential industrial use of CO
2
was rather small and the
storage time of CO
2
in industrial products often short. Therefore
industrial uses of CO
2
are unlikely to contribute to a great extent
to climate change mitigation. However, currently CO
2
use is subject
of various industrial RD&DD projects (Research and Development,
Demonstration and Diffusion).
• In terms of non-CO
2
-emissions from industry, HFC-23 emis-
sions, which arise in HCFC-22 production, can be reduced by
process optimization and by thermal destruction. N
2
O emis-
sions from adipic and nitric acid production have decreased
almost by half between 1990 and 2010 (EPA, 2012a) due to the
implementation of thermal destruction and secondary catalysts.

756756
Industry
10
Chapter 10
Box 10�2 | Service demand reduction and mitigation opportunities in industry sector:
Besides technological mitigation measures, an additional mitiga-
tion option (see Figure 10.2.) for the industry sector involves the
end uses of industrial products that provide services to consumers
(e. g., diet, mobility, shelter, clothing, amenities, health care and ser-
vices, hygiene). Assessment of the mitigation potential associated
with this option is nascent, however, and important knowledge
gaps exist (for a more general review of sustainable consumption
and production (SCP) policies, see Section 10.11.3 and 4.4.3). The
nature of the linkage between service demand and the demand
for industrial products is different and shown here through two
examples representing both a direct and an indirect link:
• clothing demand, which is linked directly to the textile indus-
try products (strong link)
• tourism demand, which is linked directly to mobility and shel-
ter demand but also indirectly to industrial materials demand
(weak link)
Clothing demand: Even in developed economies, consumers
appear to have no absolute limit to their demand for clothing, and
if prices fall, will continue to purchase more garments: during the
period 2000 – 2005, the advent of ‘fast fashion’ in the UK led to
a drop in prices, but an increase in sales equivalent to one third
more garments per year per person with consequent increases
in material production and hence industrial emissions (Allwood
etal., 2008). This growth in demand relates to ‘fashion’ and
‘conspicuous consumption’ (Roy and Pal, 2009) rather than ‘need’,
and has triggered a wave of interest in concepts like ‘sustainable
lifestyle / fashion’. While much of this interest is related to market-
ing new fabrics linked to environmental claims, authors such as
Fletcher (2008) have examined the possibility that ‘commodity’
clothing, which can be discarded easily, would be used for longer
and valued more, if given personal meaning by some shared activ-
ity or association.
Tourism demand: GHG emissions triggered by tourism signifi-
cantly contribute to global anthropogenic CO
2
emissions. Esti-
mates show a range between 3.9 % to 6 % of global emissions,
with a best estimate of 4.9 % (UNWTO etal., 2008). Worldwide,
three quarters (75 %) of tourism-related emissions are generated
by transport and just over 20 % by accommodation (UNWTO etal.,
2008). A minority of travellers (frequent travellers using the plane
over long distances) (Gössling etal., 2009) are responsible for the
greater share of these emissions (Gössling etal., 2005; TEC and
DEEE, 2008; de Bruijn etal., 2010) (see Sections 8.1.2 and 8.2.1).
Mitigation options for tourism (Gössling, 2010; Becken and Hay,
2012) include technical, behavioural, and organizational aspects.
Many mitigation options and potentials are the same as those
identified in the transport and buildings chapters (see Chapters 8
and 9). However, the demand reduction of direct tourism-related
products delivered by the industry in addition to products for
buildings and other infrastructure e. g., snow-lifts and associated
accessories, artificial snow, etc. can also impact the industry sector
as they determine product and material demand of the sector.
Thus, the industry sector has only limited influence on emissions
from tourism (via reduction of the embodied emissions), but
is affected by decisions in mitigation measures in tourism. For
example, a sustainable lifestyle resulting in a lower demand for
transportation can reduce demand for steel to manufacture cars
and contribute to reducing emissions in the industry sector.
A business-as-usual (BAU) scenario (UNWTO etal., 2008) projects
emissions from tourism to grow by 130 % from 2005 to 2035
globally; notably the emissions of air transport and accommoda-
tion will triple. Two alternative scenarios show that the contribu-
tion of technology is limited in terms of achievable mitigation
potentials and that even when combining technological and
behavioural potentials, no significant reduction can be achieved
in 2035 compared to 2005. Insufficient technological mitigation
potential and the need for drastic changes in the forms of tourism
(e. g., reduction in long haul travel; UNWTO etal., 2008), in the
place of tourism (Gössling etal., 2010; Peeters and Landré, 2011)
and in the uses of leisure time, implying changes in lifestyles
(Ceron and Dubois, 2005; Dubois etal., 2011) are the limiting
factors.
Several studies show that for some countries (e. g., the UK) an
unrestricted growth of tourism would consume the whole carbon
budget compatible with the +2 °C target by 2050 (Bows etal.,
2009; Scott etal., 2010). However, some authors also point out
that by reducing demand in some small subsectors of tourism
(e. g., long haul, cruises) effective emission reductions may be
reached with a minimum of damage to the sector (Peeters and
Dubois, 2010).
Tourism is an example of human activity where the discussion of
mitigation is not only technology-driven, but strongly correlated
with lifestyles. For many other activities, the question is how
certain mitigation goals would result in consequences for the
activity level with indirect implications for industry sector emis-
sions.

757757
Industry
10
Chapter 10
Hydrofluorocarbons used as refrigerants can be replaced by
alternatives (e. g., ammonia, hydrofluoro-olefins, HC, CO
2
).
Replacement is also an appropriate measure to reduce HFC emis-
sions from foams (use of alternative blowing agents) or solvent
uses. Emission reduction (in the case of refrigerants) is possible
by leak repair, refrigerant recovery and recycling, and proper dis-
posal. Emissions of PFCs, SF
6
and nitrogen trifluoride (NF
3
) are
growing rapidly due to flat panel display manufacturing. Ninety-
eight percent of these emissions are in China (EPA, 2012a) and
can be countered by fuelled combustion, plasma, and catalytic
technologies.
• Material efficiency in production (M / P): Material effi-
ciency — delivering services with less new material — is a signifi-
cant opportunity for industrial emissions abatement, that has had
relatively little attention to date (Allwood etal., 2012). Two key
strategies would significantly improve material efficiency in manu-
facturing existing products:
• Reducing yield losses in materials production, manufactur-
ing, and construction. Approximately one-tenth of all paper, a
quarter of all steel, and a half of all aluminium produced each
year is scrapped (mainly in downstream manufacturing) and
internally recycled — see Figure 10.2� This could be reduced by
process innovations and new approaches to design (Milford
etal., 2011).
• Re-using old material. A detailed study (Allwood etal., 2012)
on re-use of structural steel in construction concluded that
there are no insurmountable technical barriers to re-use, that
there is a profit opportunity, and that the potential supply is
growing.
• Material efficiency in product design (M / P): Although new
steels and production techniques have allowed relative light-
weighting of cars, in practice cars continue to become heavier as
they are larger and have more features. However, many products
could be one-third lighter without loss of performance in use (Car-
ruth etal., 2011) if design and production were optimized. At pres-
ent, the high costs of labour relative to materials and other barri-
ers inhibit this opportunity, except in industries such as aerospace
where the cost of design and manufacture for lightness is paid back
through reduced fuel use. Substitution of one material by another
is often technically possible (Ashby, 2009), but options for material
substitution as an abatement strategy are limited: global steel and
cement production exceeds 200 and 380 (kg / cap) / yr respectively,
and no other materials capable of delivering the same functions
are available in comparable quantities; epoxy based composite
materials and magnesium alloys have significantly higher embod-
ied energy than steel or aluminium (Ashby, 2009) (although for
vehicles this may be worthwhile if it allows significant savings in
energy during use); wood is kiln dried, so in effect is energy inten-
sive (Puettmann and Wilson, 2005); and blast furnace slag and fly
ash from coal-fired power stations can substitute to some extent
for cement clinker.
• Using products more intensively (P / S): Products, such as food,
that are intended to be consumed in use are in many cases used
inefficiently, and estimates show that up to one-third of all food in
developed countries is wasted (Gustavsonn etal., 2011). This indi-
cates the opportunity for behaviour change to reduce significantly
the demand for industrial production of what currently becomes
waste without any service provision. In contrast to these consum-
able products, most durable goods are owned in order to deliver a
‘product service’ rather than for their own sake, so potentially the
same level of service could be delivered with fewer products. Using
products for longer could reduce demand for replacement goods,
and hence reduce industrial emissions (Allwood etal., 2012). New
business models could foster dematerialization and more intense
use of products. The ambition of the ‘sustainable consumption’
agenda and policies (see Sections 10.11 and 4.4.3) aims towards
this goal, although evidence of its application in practice remains
scarce.
• Reducing overall demand for product services (S) (see Box
10.2): Industrial emissions would be reduced if overall demand
for product services were reduced (Kainuma etal., 2013) — if the
population chose to travel less (e. g., through more domestic tour-
ism or telecommuting), heat or cool buildings only to the degree
required, or reduce unnecessary consumption or products. Clear
evidence that, beyond some threshold of development, popula-
tions do not become ‘happier’ (as reflected in a wide range of
socio-economic measures) with increasing wealth, suggests that
reduced overall consumption might not be harmful in developed
economies (Layard, 2011; Roy and Pal, 2009; GEA, 2012), and a
literature questioning the ultimate policy target of GDP growth is
growing, albeit without clear prescriptions about implementation
(Jackson, 2011).
In the rest of this section, the application of these six strategies, where
it exists, is reviewed for the major emitting industrial sectors.
10�4�1 Iron and steel
Steel continues to dominate global metal production, with total crude
steel production of around 1,490 Mt in 2011. In 2011, China produced
46 % of the world’s steel. Other significant producers include the
EU-27 (12 %), the United States (8 %), Japan (7 %), India (5 %) and
Russia (5 %) (WSA, 2012b). Seventy percent (70 %) of all steel is made
from pig iron produced by reducing iron oxide in a blast furnace using
coke or coal before reduction in an oxygen blown converter (WSA,
2011). Steel is also made from scrap (23 %) or from iron oxide reduced
in solid state (direct reduced iron, 7 %) melted in electric-arc furnaces
before refining. The specific energy intensity of steel production var-
ies by technology and region. Global steel sector emissions were esti-

758758
Industry
10
Chapter 10
mated to be 2.6 GtCO
2
in 2006, including direct and indirect emissions
(IEA, 2009c; Oda etal., 2012).
Energy efficiency. The steel industry is pursuing: improved heat and
energy recovery from process gases, products and waste streams;
improved fuel delivery through pulverized coal injection; improved fur-
nace designs and process controls; and reduced number of temperature
cycles through better process coupling such as in Endless Strip Produc-
tion (ESP) (Arvedi etal., 2008) and use of various energy efficiency
technologies (Worrell etal., 2010; Xu etal., 2011a) including coke dry
quenching and top pressure recovery turbines (LBNL and AISI, 2010).
Efforts to promote energy efficiency and to reduce the production of
hazardous wastes are the subject of both international guidelines on
environmental monitoring (International Finance Corporation, 2007)
and regional benchmarks on best practice techniques (EC, 2012a).
Emissions efficiency: The coal and coke used in conventional iron-mak-
ing is emissions intensive; switching to gas-based direct reduced iron
(DRI) and oil and natural gas injection has been used, where economic
and practicable. However, DRI production currently occurs at smaller
scale than large blast furnaces (Cullen etal., 2012), and any emissions
benefit depends on the emissions associated with increased electric-
ity use for the required electric arc furnace (EAF) process. Charcoal,
another coke substitute, is currently used for iron-making, notably in
Brazil (Taibi etal.; Henriques Jr. etal., 2010), and processing to improve
charcoal’s mechanical properties is another substitute under develop-
ment, although extensive land area is required to produce wood for
charcoal. Other substitutions include use of ferro-coke as a reductant
(Takeda etal., 2011) and the use of biomass and waste plastics to dis-
place coal (IEA, 2009c). The Ultra-Low CO
2
Steelmaking (ULCOS) pro-
gramme has identified four production routes for further development:
top-gas recycling applied to blast furnaces, HIsarna (a smelt reduc-
tion technology), advanced direct reduction, and electrolysis. The first
three of these routes would require CCS (discussion of the costs, risks,
deployment barriers and policy aspects of CCScan be found in Sections
7.8.2, 7.9, 7.10, and 7.12), and the fourth would reduce emissions only
if powered by low carbon electricity. Hydrogen fuel might reduce emis-
sions if a cost effective emissions free source of hydrogen were avail-
able at scale, but at present this is not the case. Hydrogen reduction
is being investigated in the United States (Pinegar etal., 2011) and
in Japan as Course 50 (Matsumiya, 2011). Course 50 aims to reduce
CO
2
emissions by approximately 30 % by 2050 through capture, sepa-
ration and recovery. Molten oxide electrolysis (Wang etal., 2011) could
reduce emissions if a low or CO
2
-free electricity source was available.
However this technology is only at the very early stages of develop-
ment and identifying a suitable anode material has proved difficult.
Material efficiency: Material efficiency offers significant potential for
emissions reductions (Allwood et al., 2010) and cost savings (Roy et
al., 2013) in the iron and steel sector. Milford etal. (2011) examined
the impact of yield losses along the steel supply chain and found that
26 % of global liquid steel is lost as process scrap, so its elimination
could have reduced sectoral CO
2
emissions by 16 % in 2008. Cooper
etal. (2012) estimate that nearly 30 % of all steel produced in 2008
could be re-used in future. However, in many economies steel is rela-
tively cheap in comparison to labour, and this difference is amplified by
tax policy, so economic logic currently drives a preference for material
inefficiency to reduce labour costs (Skelton and Allwood, 2013b).
Reduced product and service demand: Commercial buildings in
developed economies are currently built with up to twice the steel
required by safety codes, and are typically replaced after around
30 – 60 years (Michaelis and Jackson, 2000; Hatayama et al., 2010;
Pauliuk etal., 2012). The same service (e. g., office space provision)
could be achieved with one quarter of the steel, if safety codes were
met accurately and buildings replaced not as frequently, but after 80
years. Similarly, there is a strong correlation between vehicle fuel con-
sumption and vehicle mass. For example, in the UK, 4- or 5-seater cars
are used for an average of around 4 hours per week by 1.6 people
(DfT, 2011), so a move towards smaller, lighter fuel efficient vehicles
(FEVs), used for more hours per week by more people could lead to a
four-fold or more reduction in steel requirements, while providing a
similar mobility service. There is a well-known tradeoff between the
emissions embodied in producing goods and those generated during
use, so product life extension strategies should account for different
anticipated rates of improvement in embodied and use-phase emis-
sions (Skelton and Allwood, 2013a).
10�4�2 Cement
Emissions in cement production arise from fuel combustion (to heat
limestone, clay, and sand to 1450 °C) and from the calcination reaction.
Fuel emissions (0.8 GtCO
2
(IEA, 2009d), around 40 % of the total) can be
reduced through improvements in energy efficiency and fuel switching
while process emissions (the calcination reaction, ~50 % of the total) are
unavoidable, so can be reduced only through reduced demand, including
through improved material efficiency. The remaining 10 % of CO
2
emis-
sions arise from grinding and transport (Bosoaga etal., 2009).
Energy efficiency: Estimates of theoretical minimum primary energy
consumption for thermal (fuel) energy use ranges between 1.6 and
1.85 GJ / t (Locher, 2006). For large new dry kilns, the ‘best possible’
energy efficiency is 2.7 GJ / t clinker with electricity consumption of 80
kWh / t clinker or lower (Muller and Harnish, 2008). ‘International best
practice’ final energy ranges from 1.8 to 2.1 to 2.9 GJ / t cement and
primary energy ranges from 2.15 to 2.5 to 3.4 GJ / t cement for produc-
tion of blast furnace slag, fly ash, and Portland cement, respectively
(Worrell etal., 2008b). Klee etal. (2011) shows that CO
2
emissions
intensities have declined in most regions of the world, with a 2009
global average intensity (excluding emissions from the use of alterna-
tive fuels) of 633 kg CO
2
per tonne of cementitious product, a decline
of 6 % since 2005 and 16 % since 1990. Many options still exist to
improve the energy efficiency of cement manufacturing (Muller and
Harnish, 2008; Worrell etal., 2008a; Worrell and Galitsky, 2008; APP,
2010).

759759
Industry
10
Chapter 10
Emissions efficiency and fuel switching: The majority of cement kilns
burn coal (IEA / WBCSD, 2009), but fossil or biomass wastes can also be
burned. While these alternatives have a lower CO
2
intensity depend-
ing on their exact composition (Sathaye etal., 2011) and can result in
reduced overall CO
2
emissions from the cement industry (CEMBUREAU,
2009), their use can also increase overall energy use per tonne of clin-
ker produced if the fuels require pre-treatment such as drying (Hand,
2007). Waste fuels have been used in cement production for the past
20 years in Europe, Japan, the United States, and Canada (GTZ / Holcim,
2006; Genon and Brizio, 2008); the Netherlands and Switzerland use
83 % and 48 % waste, respectively, as a cement fuel (WBCSD, 2005). It
is important that wastes are burned in accordance with strict environ-
mental guidelines as emissions resulting from such wastes can cause
adverse environmental impacts such as extremely high concentrations
of particulates in ambient air, ground-level ozone, acid rain, and water
quality deterioration (Karstensen, 2007)
8
.
Cement kilns can be fitted to harvest CO
2
, which could then be stored,
but this has yet to be piloted and “commercial-scale CCS in the cement
industry is still far from deployment” (Naranjo etal., 2011). CCS poten-
tial in the cement sector has been investigated in several recent stud-
ies: IEAGHG, 2008; Barker etal., 2009; Croezen and Korteland, 2010;
Bosoaga et al., 2009. A number of emerging technologies aim to
reduce emissions and energy use in cement production (Hasanbeigi
etal., 2012b), but there are regulatory, supply chain, product confi-
dence and technical barriers to be overcome before such technologies
(such as geopolymer cement) could be widely adopted (Van Deventer
etal., 2012).
Material efficiency: Almost all cement is used in concrete to construct
buildings and infrastructure (van Oss and Padovani, 2002). For con-
crete, which is formed by mixing cement, water, sand, and aggregates,
two applicable material efficiency strategies are: using less cement
initially and reusing concrete components at end of first product life
(distinct from down-cycling of concrete into aggregate which is widely
applied). Less cement can be used by placing concrete only where
necessary, for example Orr etal. (2010) use curved fabric moulds to
reduce concrete mass by 40 % compared with a standard, prismatic
shape. By using higher-strength concrete, less material is needed; CO
2
savings of 40 % have been reported on specific projects using ‘ultra-
high-strength’ concretes (Muller and Harnish, 2008). Portland cement
comprises 95 % clinker and 5 % gypsum, but cement can be produced
with lower ratios of clinker through use of additives such as blast fur-
nace slag, fly ash from power plants, limestone, and natural or artifi-
cial pozzolans. The weighted average clinker-to-cement ratio for the
companies participating in the WBCSD GNR project was 76 % in 2009
(WBCSD, 2011). In China, this ratio was 63 % in 2010 (NDRC, 2011a).
In India the ratio is 80 % but computer optimization is improving this
(India Planning Commission, 2007). Reusing continuous concrete ele-
ments is difficult because it requires elements to be broken up but
8
See also: http: / / www2. epa. gov / enforcement / cement-manufacturing-enforce
ment-initiative
remain undamaged. Concrete blocks can be reused, as masonry blocks
and bricks are reused already, but to date there is little published lit-
erature in this area.
Reduced product and service demand: Cement, in concrete, is used in
the construction of buildings and infrastructure. Reducing demand for
these products can be achieved by extending their lifespans or using
them more intensely. Buildings and infrastructure have lifetimes less
than 80 years — less than 40 years in East Asia — (Hatayama et al.,
2010), however their core structural elements (those that drive demand
for concrete) could last over 200 years if well maintained. Reduced
demand for building and infrastructure services could be achieved by
human settlement design, increasing the number of people living and
working in each building, or decreasing per-capita demand for utilities
(water, electricity, waste), but has as yet had little attention.
10�4�3 Chemicals (plastics / fertilizers / others)
The chemicals industry produces a wide range of different products on
scales ranging over several orders of magnitude. This results in meth-
odological and data collection challenges, in contrast to other sectors
such as iron and steel or cement (Saygin etal., 2011a). However, emis-
sions in this sector are dominated by a relatively small number of key
outputs: ethylene, ammonia, nitric acid, adipic acid and caprolactam
used in producing plastics, fertilizer, and synthetic fibres. Emissions
arise both from the use of energy in production and from the venting
of by-products from the chemical processes. The synthesis of chlorine
in chlor-alkali electrolysis is responsible for about 40 % of the electric-
ity demand of the chemical industry.
Energy efficiency: Steam cracking for the production of light olefins,
such as ethylene and propylene, is the most energy consuming process
in the chemical industry, and the pyrolysis section of steam cracking
consumes about 65 % of the total process energy (Ren etal., 2006).
Upgrading all steam cracking plants to best practice technology could
reduce energy intensity by 23 % (Saygin etal., 2011a; b) with a fur-
ther 12 % saving possible with best available technology. Switching
to a biomass-based route to avoid steam cracking could reduce CO
2
intensity (Ren and Patel, 2009) but at the cost of higher energy use,
and with high land-use requirements. Fertilizer production accounts
for around 1.2 % of world energy consumption (IFA, 2009), mostly
to produce ammonia (NH
3
). 22 % energy savings are possible (Say-
gin etal., 2011b) by upgrading all plants to best practice technology.
Nitrous oxide (N
2
O) is emitted during production of adipic and nitric
acids. By 2020 annual emissions from these industries are estimated
to be 125 MtCO
2
eq (EPA, 2012a). Many options exist to reduce emis-
sions, depending on plant operating conditions (Reimer etal., 2000).
A broad survey of options in the petrochemicals industry is given by
Neelis etal. (2008). Plastics recycling saves energy, but to produce a
high value recycled material, a relatively pure waste stream is required:
impurities greatly degrade the properties of the recycled material.
Some plastics can be produced from mixed waste streams, but gen-

760760
Industry
10
Chapter 10
erally have a lower value than virgin material. A theoretical estimate
suggest that increasing use of combined heat and power plants in the
chemical and petrochemical sector from current levels of 10 to 25 %
up to 100 % would result in energy savings up to 2 EJ for the activity
level in 2006 (IEA, 2009e).
Emissions efficiency: There are limited opportunities for innovation
in the current process of ammonia production via the Haber-Bosch
process (Erisman et al., 2008). Possible improvements relate to the
introduction of new N
2
O emission reduction technologies in nitric
acid production such as high-temperature catalytic N
2
O decomposi-
tion (Melián-Cabrera etal., 2004) which has been shown to reduce
N
2
O emissions by up to 70 – 90 % (BIS Production Partner, 2012; Yara,
2012). While implementation of this technology has been largely
completed in regions pursuing carbon emission reduction (e. g., the
EU through the Emissions Trading Scheme (ETS) or China and other
developing countries through Clean Development Mechanism (CDM),
the implementation of this technology still offers large mitigation
potential in other regions like the former Soviet Union and the United
States (Kollmus and Lazarus, 2010). Fuel switching can also lead to
significant emission reductions and energy savings. For example, natu-
ral gas based ammonia production results in 36 % emission reductions
compared to naphtha, 47 % compared to fuel oil and 58 % compared
to coal. The total potential mitigation arising from this fuel switch-
ing would amount to 27 MtCO
2
eq / year GHG emissions savings (IFA,
2009).
Material efficiency: Many of the material efficiency measures identi-
fied above can be applied to the use of plastics, but this has had little
attention to date, although Hekkert etal. (2000) anticipate a potential
51 % saving in emissions associated with the use of plastic packaging
in the Netherlands from application of a number of material efficiency
strategies. More efficient use of fertilizer gives benefits both in reduced
direct emissions of N
2
O from the fertilizer itself and from reduced fertil-
izer production (Smith etal., 2008).
10�4�4 Pulp and paper
Global paper production has increased steadily during the last three
decades (except for a minor production decline associated with the
2008 financial crisis) (FAO, 2013), with global demand expansion cur-
rently driven by developing nations. Fuel and energy use are the main
sources of GHG emissions during the forestry, pulping, and manufac-
turing stages of paper production.
Energy efficiency: A broad range of energy efficiency technologies are
available for this sector, reviewed by Kramer etal. (2009), and Laurijs-
sen etal. (2012). Over half the energy used in paper making is to create
heat for drying paper after it has been laid and Laurijssen etal. (2010)
estimate that this could be reduced by ~32 % by the use of additives,
an increased dew point, and improved heat recovery. Energy savings
may also be obtained from emerging technologies (Jacobs and IPST,
2006; Worrell etal., 2008b; Kong etal., 2012) such as black liquor gas-
ification, which uses the by-product of the chemical pulping process
to increase the energy efficiency of pulp and paper mills (Naqvi etal.,
2010). With commercial maturity expected within the next decade
(Eriksson and Harvey, 2004), black liquor gasification can be used as
a waste-to-energy method with the potential to achieve higher over-
all energy efficiency (38 % for electricity generation) than the conven-
tional recovery boiler (9 – 14 % efficiency) while generating an energy-
rich syngas from the liquor (Naqvi etal., 2010). The syngas can also be
utilized as a feedstock for production of renewable motor fuels such
as bio-methanol, dimethyl ether, and FT-diesel or hydrogen (Pettersson
and Harvey, 2012). Gasification combined cycle systems have poten-
tial disadvantages (Kramer etal., 2009), including high energy invest-
ments to concentrate sufficient black liquor solids and higher lime kiln
and causticizer loads compared to Tomlinson systems. Paper recycling
generally saves energy and may reduce emissions (although electric-
ity in some primary paper making is derived from biomass-powered
CHP plants) and rates can be increased (Laurijssen etal., 2010b). Paper
recycling is also important as competition for biomass will increase
with population growth and increased use of biomass for fuel.
Emissions efficiency: Direct CO
2
emissions from European pulp and
paper production reduced from 0.57 to 0.34 ktCO
2
per kt of paper
between 1990 and 2011, while indirect emissions reduced from 0.21
to 0.09 ktCO
2
per kt of paper (CEPI, 2012). Combined heat and power
(CHP) accounted for 95 % of total on-site electricity produced by EU
paper makers in 2011, compared to 88 % in 1990 (CEPI, 2012), so has
little further potential in Europe, but may offer opportunities glob-
ally. The global pulp and paper industry usually has ready access to
biomass resources and it generates approximately a third of its own
energy needs from biomass (IEA, 2009c), 53 % in the EU (CEPI, 2012).
Paper recycling can have a positive impact on energy intensity and CO
2
emissions over the total lifecycle of paper production (Miner, 2010;
Laurijssen etal., 2010). Recycling rates in Europe and North America
reached 70 % and 67 % in 2011, respectively
9
(CEPI, 2012), leaving a
small range for improvement when considering the limit of 81 % esti-
mated by CEPI (2006). In Europe, the share of recovered paper used
in paper manufacturing has increased from roughly 33 % in 1991 to
around 44 % in 2009 (CEPI, 2012). GHG fluxes from forestry are dis-
cussed in Section 11.2.3.
Material efficiency: Higher material efficiency could be achieved
through increased use of duplex printing, print on demand, improved
recycling yields and the manufacturing of lighter paper. Recycling yields
could be improved by the design of easy to remove inks and adhesives
and less harmful de-inking chemicals; paper weights for newspapers
and office paper could be reduced from 45 and 80 g / m
2
to 42 and 70
g / m
2
respectively and might lead to a 37 % saving in paper used for
current service levels (Van den Reek, 1999; Hekkert etal., 2002).
9
American Forest and Paper Association, Paper Recycles — Statistics — Paper &
Paperboard Recovery http: / / www. paperrecycles. org / statistics / paper-paperboard-
recovery.

761761
Industry
10
Chapter 10
Reduced demand: Opportunities to reduce demand for paper prod-
ucts in the future include printing on demand, removing print to allow
paper re-use (Leal-Ayala etal., 2012), and substituting e-readers for
paper. The latter has been the subject of substantial academic research
(e. g., Gard and Keoleian, 2002; Reichart and Hischier, 2003) although
the substitution of electronic media for paper has mixed environmental
outcomes, with no clear statistics yet on whether such media reduces
paper demand, or whether it leads to a net reduction in emissions.
10�4�5 Non-ferrous (aluminium / others)
Annual production of non-ferrous metals is small compared to steel,
and is dominated by aluminium, with 56 Mt made globally in 2009, of
which 18 Mt was through secondary (recycled) production. Production
is expected to rise to 97 Mt by 2020 (IAI, 2009). Magnesium is also
significant, but with global primary production of only 653 Kt in 2009
(IMA, 2009), is dwarfed by aluminium.
Energy efficiency: Aluminium production is particularly associated with
high electricity demand. Indirect (electricity-related) emissions account
for over 80 % of total GHG emissions in aluminium production. The
sector accounts for 3.5 % of global electricity consumption (IEA 2008)
and energy accounts for nearly 40 % of aluminium production costs.
Aluminium can be made from raw materials (bauxite) or through
recycling. Best practice primary aluminium production — from alu-
mina production through ingot casting — consumes 174 GJ / t primary
energy (accounting for electricity production, transmission, distribu-
tion losses) and 70.6 GJ / t final energy (Worrell etal., 2008b). Best
practice for electrolysis — which consumes roughly 85 % of the energy
used for production of primary aluminium — is about 47 GJ / t final
energy while the theoretical energy requirement is 22 GJ / t final energy
(BCS Inc., 2007). Best practice for recycled aluminium production is 7.6
GJ / t primary energy and 2.5 GJ / t final energy (Worrell etal., 2008b),
although in reality, recycling uses much more energy due to pre-pro-
cessing of scrap, ‘sweetening’ with virgin aluminium and downstream
processing after casting. The U. S. aluminium industry consumes
almost three times the theoretical minimum energy level (BCS Inc.,
2007). The options for new process development in aluminium pro-
duction — multipolar electrolysis cells, inert anodes and carbothermic
reactions — have not yet reached commercial scale (IEA, 2012d). The
IEA estimates that application of best available technology can reduce
energy use for aluminium production by about 10 % compared with
current levels (IEA, 2012d).
At present, post-consumer scrap makes up only 20 % of total alu-
minium recycling (Cullen and Allwood, 2013), which is dominated by
internal ‘home’ or ‘new’ scrap (see Figure 10.2). As per capita stock
levels saturate in the 21st century, there could be a shift from primary
to secondary aluminium production (Liu etal., 2012a) if recycling rates
can be increased, and the accumulation of different alloying elements
in the scrap stream can be controlled. These challenges will require
improved end of life management and even new technologies for sep-
arating the different alloys (Liu etal., 2012a).
Emissions efficiency: Data on emissions intensities for a range of non-
ferrous metals are given by (Sjardin, 2003). The aluminium industry
alone contributed 3 % of CO
2
emissions from industry in 2006 (Allwood
etal., 2010). In addition to CO
2
emissions resulting from electrode and
reductant use, the production of non-ferrous metals can result in the
emission of high-global warming potential (GWP) GHGs, for example
PFCs (such as CF
4
) in aluminium or SF
6
in magnesium. PFCs result from
carbon in the anode and fluorine in the cryolite. The reaction can be
minimized by controlling the process to prevent a drop in alumina con-
centrations, which triggers the process
10
.
Material efficiency: For aluminium, there are significant carbon abate-
ment opportunities in the area of material efficiency and demand
reduction. From liquid aluminium to final product, the yield in form-
ing and fabrication is only 59 %, which could be improved by near-net
shape casting and blanking and stamping process innovation (Milford
etal., 2011). For chip scrap produced from machining operations (in
aluminium, for example (Tekkaya etal., 2009), or magnesium (Wu etal.,
2010)) extrusion, processes are being developed to bond scrap in the
solid state to form a relatively high quality product potentially offering
energy savings of up to 95 % compared to re-melting. Aluminium build-
ing components (window frames, curtain walls, and cladding) could be
reused when a building is demolished (Cooper and Allwood, 2012) and
more modular product designs would allow longer product lives and
an overall reduction in demand for new materials (Cooper etal., 2012).
10�4�6 Food processing
The food industry as discussed in this chapter includes all process-
ing beyond the farm gate, while everything before is in the agricul-
ture industry and discussed in Chapter 11. In the developed world,
the emissions released beyond the farm gate are approximately equal
to those released before. Garnett (2011) suggests that provision of
human food drives around 17.7 GtCO
2
eq in total.
Energy efficiency: The three largest uses of energy in the food industry
in the United States are animal slaughtering and processing, wet corn
milling, and fruit and vegetable preservation, accounting for 19 %,
15 %, and 14 % of total use, respectively (US EIA, 2009). Increased use
of heat exchanger networks or heat pumps (Fritzson and Berntsson,
2006; Sakamoto et al., 2011), combined heat and power, mechani-
cal dewatering compared to rotary drying (Masanet etal., 2008), and
thermal and mechanical vapour recompression in evaporation further
enhanced by use of reverse osmosis can deliver energy use efficiency.
Many of these technologies could also be used in cooking and drying
in other parts of the food industry. Savings in energy for refrigeration
10
http: / / www. aluminum. org / Content / NavigationMenu / TheIndustry / Environment /
ReducingPFCEmissionsintheAluminumIndustry / default.html.

762762
Industry
10
Chapter 10
could be made with better insulation and reduced ventilation in fridges
and freezers. Dairy processing is also among the most energy- and
carbon-intensive activities within the global food production industry,
with estimated annual emissions of over 128 MtCO
2
(Xu and Flapper,
2009, 2011). Within dairy processing, cheese production is the most
energy intensive sector (Xu et al., 2009). Ramirez and Block (2006)
report that EU dairy operations, having improved in the 1980s and
1990s, are now reaching a plateau of energy intensity, but Brush etal.
(2011) provide a survey of best practice opportunities for energy effi-
ciency in dairy operations.
Emissions efficiency: The most cost effective reduction in CO
2
emis-
sions from food production is by switching from heavy fuel oil to nat-
ural gas. Other ways of improving emissions efficiency involve using
lower-emission modes of transport (Garnett, 2011). In transporting
food, there is a tradeoff between local sourcing and producing the
food in areas where there are other environmental benefits (Sim etal.,
2007; Edwards-Jones etal., 2008). Landfill emissions associated with
food waste could be reduced by use of anaerobic digestion processes
(Woods etal., 2010).
Demand reduction: Overall demand for food could be reduced without
sacrificing well-being (GEA, 2012). Up to one-third of food produced
for human consumption is wasted in either in the production / retail-
ing stage, or by consumers (Gunders (2012) estimates 40 % waste in
the United States). Gustavsonn etal. (2011) suggest that, in developed
countries, consumer behaviour could be changed, and ‘best-before-
dates’ reviewed. Increasing cooling demand, the globalization of the
food system with corresponding transport distances, and the growing
importance of processed convenience food are also important drivers
(GEA, 2012). Globally, approximately 1.5 billion out of 5 billion people
over the age of 20 are overweight and 500 million are obese (Bed-
dington etal., 2011). Demand for high-emission food such as meat and
dairy products could be replaced by demand for other, lower-emission
foods. Meat and dairy products contribute to half of the emissions from
food (when the emissions from the up-stream processes are included)
according to Garnett (2009), while Stehfest etal. (2009) puts the figure
at 18 % of global GHG emissions, and Wirsenius (2003) estimates that
two-thirds of food-related phytomass is consumed by animals, which
provide just 13 % of the gross energy of human diets. Furthermore,
demand is set to double by 2050, as developing nations grow wealth-
ier and eat more meat and dairy foods (Stehfest etal., 2009; Garnett,
2009). In order to maintain a constant total demand for meat and
dairy, Garnett (2009) suggests that by 2050 average per capita con-
sumption should be around 0.5 kg meat and 1 litre of milk per week,
which is around the current averages in the developing world today.
10�4�7 Textiles and leather
In 2009, textiles and leather manufacturing consumed 2.15 EJ final
energy globally. Global consumption is dominated by Asia, which
was responsible for 65 % of total world energy use for textiles and
leather manufacturing in 2009. In the United States, about 45 % of
the final energy used for textile mills is natural gas, about 35 % is net
electricity (site), and 14 % coal (US EIA, 2009). In China, final energy
consumption for textiles production is dominated by coal (39 %) and
site electricity (38 %) (NBS, 2012). In the US textile industry, motor
driven systems and steam systems dominate energy end uses. Around
36 % of the energy input to the US textile industry is lost onsite,
with motor driven systems responsible for 13 %, followed by energy
distribution and boiler losses of 8 % and 7 %, respectively (US DoE,
2004b).
Energy and emissions efficiency: Numerous energy efficiency tech-
nologies and measures exist that are applicable to the textile indus-
try (CIPEC, 2007; Hasanbeigi and Price, 2012). For Taiwan, Province of
China, Hong etal. (2010) report energy savings of about 1 % in tex-
tile industry following the adoption of energy-saving measures in 303
firms (less than 10 % of the total number of local textile firms in 2005)
(Chen Chiu, 2009). In India, CO
2
emissions reductions of at least 13 %
were calculated based on implementation of operations and mainte-
nance improvements, fuel switching, and adoption of five energy-effi-
cient technologies (Velavan etal., 2009).
Demand reduction: see Box 10.2.
10�4�8 Mining
Energy efficiency: The energy requirements of mining are dominated
by grinding (comminution) and the use of diesel-powered material
handling equipment (US DoE, 2007; Haque and Norgate, 2013). The
major area of energy usage — up to 40 % of the total — is in elec-
tricity for comminution (Smith, 2012). Underground mining requires
more energy than surface mining due to greater requirements for
hauling, ventilation, water pumping, and other operations (US DoE,
2007). Strategies for GHG mitigation are diverse. An overall scheme
to reduce energy consumption is the implementation of strategies
that upgrade the ore body concentration before crushing and grind-
ing, through resource characterization by geo-metallurgical data and
methods (Bye, 2005, 2007, 2011; CRC ORE, 2011; Smith, 2012). Selec-
tive blast design, combined with ore sorting and gangue rejection,
significantly improve the grade of ore being fed to the crusher and
grinding mill, by as much as 2.5 fold. This leads to large reductions of
energy usage compared to business-as-usual (CRC ORE, 2011; Smith,
2012).
There is also a significant potential to save energy in comminution
through the following options: more crushing, less grinding, using
more energy-efficient crushing technologies, removing minerals and
gangue from the crushing stage, optimizing the particle size feed for
grinding mills from crushing mills, selecting target product size(s) at
each stage of the circuit, using advanced flexible comminution circuits,
using more efficient grinding equipment, and by improving the design
of new comminution equipment (Smith, 2012).

763763
Industry
10
Chapter 10
Other important energy savings opportunities are in the following areas:
a) separation processes — mixers, agitators and froth flotation cells, b)
drying and dewatering in mineral processing, c) materials movement, d)
air ventilation and conditioning opportunities, e) processing site energy
demand management and waste heat recovery options, f) technology
specific for lighting, motors, pumps and fans and air compressor sys-
tems, and g) improvement in energy efficiency of product transport
from mine site to port (Rathmann, 2007; Raaz and Mentges, 2009; Dan-
iel etal., 2010; Norgate and Haque, 2010; DRET, 2011; Smith, 2012).
Recycling represents an important source of world’s metal supply and
it can be increased as a means of waste reduction (see Section 10.14)
and thus energy saving in metals production. In recent years, around
36 % of world’s gold supply was from recycled scrap (WGC, 2011),
25 % of silver (SI and GFMS, 2013), and 35 % of copper (ICSG, 2012).
Emissions efficiency: Substitution of onsite fossil fuel electricity gener-
ators with renewable energy is an important mitigation strategy. Cost
effectiveness depends on the characteristics of each site (Evans & Peck,
2011; Smith, 2012).
Material efficiency: In the extraction of metal ores, one of the greatest
challenges for energy efficiency enhancement is that of the recovery
ratio, which refers to the percentage of valuable ore within the total
mine material. Lower grades inevitably require greater amounts of
material to be moved per unit of product. The recovery ratio for metals
averages about 4.5 % (US DoE, 2007). The ‘grade’ of recyclable materi-
als is often greater than the one of ores being currently mined; for
this reason, advancing recycling for mineral commodities would bring
improvements in the overall energy efficiency (IIED, 2002).
10.5 Infrastructure and
systemic perspectives
Improved understanding of interactions among different industries,
and between industry and other economic sectors, is becoming more
important in a mitigation and sustainable development context. Strat-
egies adopted in other sectors may lead to increased (or decreased)
emissions from the industry sector. Collaborative activities within and
across the sector may enhance the outcome of climate change miti-
gation. Initiatives to adopt a system-wide view face a barrier as cur-
rently practiced system boundaries often pose a challenge. A systemic
approach can be at different levels, namely, at the micro-level (within
a single company, such as process integration and cleaner production),
the meso-level (between three or more companies, such as eco-indus-
trial parks) and the macro-level (cross-sectoral cooperation, such as
urban symbiosis or regional eco-industrial network). Systemic collab-
orative activities can reduce the total consumption of materials and
energy and can contribute to the reduction of GHG emissions. The rest
of this section focuses mainly on the meso- and macro-levels as micro-
level options have already been covered in Section 10.4.
10�5�1 Industrial clusters and parks
( meso-level)
Small and medium enterprises (SMEs) often suffer not only from dif-
ficulties arising due to their size and lack of access to information, but
also from being isolated while in operation (Sengenberger and Pyke,
1992). Clustering of SMEs usually in the form of industrial parks can
facilitate growth and competitiveness (Schmitz, 1995). In terms of
implementation of mitigation options, SMEs in clusters / parks can bene-
fit from by-products exchange (including waste heat) and infrastructure
sharing, as well as joint purchase (e. g., of energy efficient technolo-
gies). Cooperation in eco-industrial parks (EIPs) reduces the cumulative
environmental impact of the whole industrial park (Geng and Dober-
stein, 2008). Such an initiative reduces the total consumption of virgin
materials and final waste and improves the efficiency of companies and
their competitiveness. Since the extraction and transformation of virgin
materials is usually energy intensive, EIP efforts can abate industrial
GHG emissions. For example, in order to encourage target-oriented
cooperation, Chinese ‘eco-industrial park standards’ contain quantita-
tive indicators for material reduction and recycling, as well as pollu-
tion control (Geng etal., 2009). Two pioneering eco-industrial parks in
China achieved over 80 % solid waste reuse ratio and over 82 % indus-
trial water reuse ratio during 2002 – 2005 (Geng etal., 2008). The Japa-
nese eco-town project in Kawasaki achieved substitution of 513,000
tonnes of raw material, resulting in the avoidance of 1 % of the current
total landfill in Japan during 1997 – 2006 (van Berkel etal., 2009).
In order to encourage industrial symbiosis
11
at the industrial cluster
level, different kinds of technical infrastructure (e. g., pipelines) as well
as non-technical infrastructure (e. g., information exchange platforms)
are necessary so that both material and energy use can be optimized
(Côté and Hall, 1995). Although additional investment for infrastruc-
ture building is unavoidable, such an investment can bring both eco-
nomic and environmental benefits. In India there have been several
instances where the government has taken proactive approaches to
provide land and infrastructure, access to water, non-conventional
(MSW-based) power to private sector industries (such as chemicals,
textile, paper, pharmaceutical companies, cement) operating in clusters
(IBEF, 2013). A case study in the Tianjin Economic Development Area in
northern China indicates that the application of an integrated water
optimization model (e. g., reuse of treated wastewater by other firms)
can reduce the total water related costs by 10.4 %, fresh water con-
sumption by 16.9 % and wastewater discharge by 45.6 % (Geng etal.,
2007). As an additional consequence, due to the strong energy-water
nexus, energy use and release of GHG emissions related to fresh water
provision or wastewater treatment can be reduced.
11
Note that industrial symbiosis is further covered in Chapter 4 (Sustainable Devel-
opment and Equity), Section 4.4.3.3

764764
Industry
10
Chapter 10
10�5�2 Cross-sectoral cooperation (macro-level)
Besides inter-industry cooperation, opportunities arise from the geo-
graphic proximity of urban and industrial areas, leading to transfer
of urban refuse as a resource to industrial applications, and vice
versa (Geng et al., 2010a). For instance, the cement industry can
accept as their inputs not only virgin materials such as limestone
and coal, but also various wastes / industrial by-products (see Sec-
tion 10.4), thus contributing up to 15 – 20 % CO
2
emission reduction
(Morimoto etal., 2006; Hashimoto etal., 2010). In Northern Europe
(e. g., Sweden, Finland, and Denmark), for example, both exhaust
heat from industries and heat generated from burning municipal
wastes are supplied to local municipal users through district heat-
ing (Holmgren and Gebremedhin, 2004). Industrial waste can also
be used to reduce conventional fuel demand in other sectors. For
example, the European bio-DME project
12
aims to supply heavy-duty
trucks and industry with dimethyl-ether fuel made from black liquor
produced by the pulp industry. However, careful design of regional
recycling networks has to be undertaken because different types of
waste have different characteristics and optimal collection and recy-
cling boundaries and therefore need different infrastructure support
(Chen etal., 2012).
The reuse of materials recovered from urban infrastructures can reduce
the demand for primary products (e. g., ore) and thus contribute to cli-
mate change mitigation in extractive industries (Klinglmair and Fellner,
2010). So far, reuse of specific materials is only partly established and
the potential for future urban mining is growing as the urban stock
of materials still increases. While in the 2011 fiscal year in Japan only
5.79 Mt of steel scrap came from the building sector, 13.6 Mt were
consumed by the building sector. In total, urban stock of steel is esti-
mated to be 1.33 Gt in Japan where the total annual crude steel pro-
duction was 0.106 Gt (NSSMC, 2013).
10�5�3 Cross-sectoral implications of mitigation
efforts
Currently much attention is focused on improving energy efficiency
within the industry sector (Yeo and Gabbai, 2011). However, many mit-
igation strategies adopted in other sectors significantly affect activities
of the industrial sector and industry-related GHG emissions. For exam-
ple, consumer preference for lightweight cars can incentivize material
substitution for car manufacturing (e. g., potential lightweight materi-
als: see Chapter 8), growing demand for rechargeable vehicle batter-
ies (see Chapter 8) and the demand for new materials (e. g., innovative
building structures or thermal insulation for buildings: see Chapter
9; high-temperature steel demand by power plants: see Chapter 7).
These materials or products consume energy at the time of manufac-
turing, so changes outside the industry sector that lead to changes in
12
Production of DME from biomass and utilization of fuel for transport and industrial
use. Project website at: http: / / www. biodme. eu.
demand for energy-saving products within the industry sector can be
observed over a long period of time (ICCA, 2009). Thus, for a careful
assessment of mitigation options, a lifecycle perspective is needed so
that a holistic emission picture (including embodied emissions) can be
presented. For instance, the increase in GHG emissions from increased
aluminium production could under specific circumstances be larger
than the GHG savings from vehicle weight reduction (Geyer, 2008).
Kim etal. (2010) have, however, indicated that in about two decades,
closed-loop recycling can significantly reduce the impacts of alumin-
ium-intensive vehicles.
Increasing demand on end-use related mitigation technologies could
contribute to potential material shortages. Moss etal. (2011) exam-
ined market and political risks for 14 metals that are used in signifi-
cant quantities in the technologies of the EU’s Strategic Energy Tech-
nology Plan (SET Plan) so that metal requirements and associated
bottlenecks in green technologies, such as electric vehicles, low-car-
bon lighting, electricity storage and fuel cells and hydrogen, can be
recognized.
Following a systemic perspective enables the identification of unex-
pected outcomes and even potential conflicts between different tar-
gets when implementing mitigation options. For example, the quality
of many recycled metals is maintained solely through the addition of
pure primary materials (Verhoef etal., 2004), thus perpetuating the use
of these materials and creating a challenge for the set up of closed
loop recycling (e. g., automotive aluminium; Kim etal., 2011). Addition-
ally, due to product retention (the period of use) and growing demand,
secondary materials needed for recycling are limited.
10.6 Climate change feed-
back and interaction
with adaptation
There is currently a distinct lack of knowledge on how climate change
feedbacks may impact mitigation options and potentials as well as
costs in industry
13
.
Insights into potential synergy effects (how adaptation options
could reduce emissions in industry) or tradeoffs (how adaptation
options could lead to additional emissions in industry) are also
lacking. However, it can be expected that many adaptation options
will generate additional industrial product demand and will lead
to additional emissions in the sector. Improving flood defence, for
example, in response to sea level rise may lead to a growing demand
13
There is limited literature on the impacts of climate change on industry (e. g., avail-
ability of water for the food industry and in general for cooling and processing in
many different industries), and these are dealt within WG 2 of AR 5, Chapter 10.

765765
Industry
10
Chapter 10
for materials for embankment and similar infrastructure. Manufac-
turers of textile products, machinery for agriculture or construction,
and heating / cooling equipment may be affected by changing prod-
uct requirements in both number and quality due to climate change.
There is as yet no comprehensive assessment of these effects, nor
any estimate on market effects resulting from changes in demand
for products.
10.7 Costs and potentials
The six main categories of mitigation options discussed in Section
10.4 for manufacturing industries can deliver GHG emission reduction
benefits at varying levels and at varying costs over varying time peri-
ods across subsectors and countries. There is not much comparable,
comprehensive, detailed quantitative information and literature on
costs and potentials associated with each of the mitigation options.
Available mitigation potential assessments (e. g., UNIDO, 2011; IEA,
2012d) are not always supplemented by cost estimates. Also, available
cost estimates (e. g., McKinsey&Company, 2009; Akashi etal., 2011)
are not always comparable across studies due to differences in the
treatment of costs and energy price estimates across regions. There
are many mitigation potential assessments for individual industries
(examples are included in Section 10.4) with varying time horizons;
some studies report the mitigation potential of energy efficiency mea-
sures with associated initial investment costs which do not account
for the full life time energy cost savings benefits of investments, while
other studies report marginal abatement costs (MACs) based on
selected technological options. Many sector- or system-specific miti-
gation potential studies use the concept of cost of conserved energy
(CCE) that accounts for annualized initial investment costs, operation
and maintenance (O&M) costs, and energy savings using either social
or private discount rates (Hasanbeigi etal., 2010b). Those mitigation
options with a CCE below the unit cost of energy are referred to as
‘cost-effective’. Some studies (e. g., McKinsey&Company, 2009) iden-
tify ‘negative abatement costs’ by including the energy cost savings in
the abatement cost calculation.
The sections below provide an assessment of option-specific poten-
tial and associated cost estimates using information available in
the literature (including underlying databases used by some of such
studies) and expert judgement (see Annex III, Technology-specific
cost and performance parameters) and distinguish mitigation of CO
2
and non-CO
2
emissions. Generally, the assessment of costs is rela-
tively more uncertain but some indicative results convey information
about the wide cost range (costs per tonne of CO
2
reduction) within
which various options can deliver GHG reduction benefit. The inclu-
sion of additional multiple benefits of mitigation measures might
change the cost-effectiveness of a technology completely, but are
not included in this section. Co-benefits are discussed in Section
10.8.
10�7�1 CO
2
emissions
Quantitative assessments of CO
2
emission reduction potential for
the industrial sector explored in this section are mainly based on: (1)
studies with a global scope (e. g., IEA, UNIDO), (2) MAC studies and
(3) various information sources on available technology at industrial
units along with plant level and country specific data. IEA estimates
a global mitigation potential for the overall industry sector of 5.5 to
7.5 GtCO
2
for the year 2050 (IEA, 2012d)
14
. The IEA report (2012d)
shows a range of 50 % reduction in four key sectors (iron and steel,
cement, chemicals, and paper) and in the range of 20 % for the alu-
minium sector. From a regional perspective, China and India comprise
44 % of this potential. In terms of how different options contribute to
industry mitigation potential, with regard to CO
2
emissions reduction
compared with 2007 values, the IEA (2009c) shows implementation of
end use fuel efficiency can achieve 40 %, fuel and feedstock switch-
ing can achieve 21 %, recycling and energy recovery can achieve 9 %,
and CCS can achieve 30 %. McKinsey (2009) provides a global mitiga-
tion potential estimate for the overall industry sector of 6.9 GtCO
2
for
2030. The potential is found to be the largest for iron and steel, fol-
lowed by chemicals and cement at 2.4, 1.9 and 1.0 GtCO
2
for the year
2030, respectively (McKinsey&Company, 2010). The United Nations
Industrial Development Organization (UNIDO) analyzed the poten-
tial of energy savings based on universal application of best avail-
able technologies. All the potential mitigation values are higher in
developing countries (30 to 35 %) compared with developed countries
(15 %) (UNIDO, 2011).
Other studies addressing the industrial sector as a whole found
potential for future improvements in energy intensity of industrial
production to be in the range of up to 25 % of current global indus-
trial final energy consumption per unit output (Schäfer, 2005; Allwood
etal., 2010; UNIDO, 2011; Saygin etal., 2011b; Gutowski etal., 2013)
(see Section 10.4). Additional savings can be realized in the future
through adoption of emerging technologies currently under devel-
opment or that have not yet been fully commercialized (Kong etal.,
2012; Hasanbeigi etal., 2012b, 2013a). Examples of industries from
India show that specific energy consumption is steadily declining in
all energy intensive sectors (Roy etal., 2013), and a wide variety of
measures at varying costs have been adopted by the energy intensive
industries (Figure 10.6). However, all sectors still have energy savings
potential when compared to world best practice (Dasgupta et al.,
2012).
Bottom-up country analyses provide energy savings estimates for
specific industrial sub-sectors based on individual energy efficiency
technologies and measures. Because results vary among studies, these
estimates should not be considered as the upper bound of energy sav-
ing potential but rather should give an orientation about the general
possibilities.
14
Expressed here in the form of a deployment potential (difference between the 6 °C
and 2 °C scenarios, 6DS and 2DS) rather than the technical potential.

766766
Industry
10
Chapter 10
In the cement sector, global weighted average thermal energy inten-
sity could drop to 3.2 GJ / t clinker and electric energy intensity to 90
kWh / t cement by 2050 (IEA / WBCSD, 2009). Emissions of 510 MtCO
2
would be saved if all current cement kilns used best available technol-
ogy and increased use of clinker substitutes (IEA, 2009c). Oda etal.
(2012) found large differences in regional thermal energy consump-
tion for cement manufacture, with the least efficient region consum-
ing 75 % more energy than the best in 2005. Even though process-
ing alternative fuels requires additional electricity consumption (Oda
et al., 2012), their use could reduce cement sector emissions by
0.16 GtCO
2
eq per year by 2030 (Vattenfall, 2007) although increasing
costs may in due course limit uptake (IEA / WBCSD, 2009). Implement-
ing commercial-scale CCS in the cement industry could contribute to
climate change mitigation, but would increase cement production
costs by 40 – 90 % (IEAGHG, 2008). From the cumulative energy sav-
ings potential for China’s cement industry (2010 to 2030), 90 % is
assessed as cost-effective using a discount rate of 15 % (Hasanbeigi
etal., 2012a). Electricity and fuel savings of 6 and 1.5 times the total
electricity and fuel use in the Indian cement industry in 2010, respec-
tively, can be realized for the period 2010 – 2030, almost all of which
is assessed as cost-effective using a discount rate of 15 % (Morrow III
etal., 2013a). About 50 % of the electricity used by Thailand’s cement
industry in 2005 could have been saved (16 % cost-effectively), while
about 20 % of the fuel use could have been reduced (80 % cost-effec-
tively using a discount rate of 30 %) (Hasanbeigi etal., 2010a, 2011).
Some subnational level information also shows negative CO
2
abate-
ment costs associated with emissions reductions in the cement sector
(e. g., CCAP, 2005).
Nearly 60 % of the estimated electricity savings and all of the fuel
savings of the Chinese steel industry for the period 2010 – 2030 can
be realized cost-effectively using a discount rate of 15 % (Hasanbeigi
et al., 2013c). Total technical primary energy savings potential of
the Indian steel industry from 2010 – 2030 is equal to around 87 %
of total primary Indian steel industry energy use in 2007, of which
91 % of the electricity savings and 64 % of the fuel savings can be
achieved cost-effectively using a discount rate of 15 % (Morrow III
etal., 2013b). Akashi et al. (2011) indicate that the largest poten-
tial for CO
2
emissions savings for some energy-intensive industries
remains in China and India. They also indicate that with associated
costs under 100 USD / tCO
2
in 2030, the use of efficient blast furnaces
in the steel industry in China and India can reduce total emissions by
186 MtCO
2
and 165 MtCO
2
, respectively. This represents a combined
total of 75 % of the global CO
2
emissions reduction potential for this
technology.
Total technical electricity and fuel savings potential for China’s pulp
and paper industry in 2010 are estimated to be 4.3 % and 38 %, respec-
tively. All of the electricity and 70 % of the fuel savings can be realized
cost-effectively using a discount rate of 30 % (Kong etal., 2013). Fleiter
et al. (2012a) found energy saving potentials for the German pulp
and paper industry of 21 % and 16 % of fuel and electricity demand
in 2035, respectively. The savings result in 3 MtCO
2
emissions reduc-
tion with two-thirds of this having negative private abatement cost
(Fleiter etal., 2012a). Zafeiris (2010) estimates energy saving potential
of 6.2 % of the global energy demand of the pulp and paper industry in
year 2030. More than 90 % of the estimated savings potential can be
realized at negative cost using a discount rate of 30 % (Zafeiris, 2010).
The energy intensity of the European pulp and paper industry reduced
from 16 to 13.5 GJ per tonne of paper between 1990 and 2008 (All-
wood etal., 2012, p.318; CEPI, 2012). However, energy intensity of the
European pulp and paper industry has now stabilized, and few signifi-
cant future efficiency improvements are forecasted.
In non-ferrous production (aluminium / others), energy accounts for
nearly 40 % of aluminium production costs. The IEA forecasts a max-
imum possible 12 % future saving in energy requirements by future
efficiencies. In food processing, reductions between 5 % and 35 %
of total CO
2
emissions can be made by investing in increased heat
exchanger networks or heat pumps (Fritzson and Berntsson, 2006).
Combined heat and power can reduce energy demand by 20 – 30 %.
Around 83 % of the energy used in wet corn milling is for dewatering,
drying, and evaporation processes (Galitsky etal., 2003), while 60 % of
that used in fruit and vegetable processing is in boilers (Masanet etal.,
2008). Thermal and mechanical vapour recompression in drying allows
for estimated 15 – 20 % total energy savings, which could be increased
further by use of reverse osmosis (Galitsky etal., 2003). Cullen etal.
(2011) suggest that about 88 % savings in energy for refrigeration
could be made with better insulation, and reduced ventilation in refrig-
erators and freezers.
There is very little data available on mineral extractive industries in
general. Some analyses reveal that investments in state-of-the-art
equipment and further research could reduce energy consumption by
almost 50 % (SWEEP, 2011; US DoE, 2007).
Figure 10�6 | Range of unit cost of avoided CO
2
emissions (USD
2010
/ tCO
2
) in India.
Source: Database of energy efficiency measures adopted by the winners of the National
Awards on Energy Conservations for aluminium (26 measures), cement (42), chemicals
(62), ISP: integrated steel plant (30), pulp and paper (46), and textile (75) industry in
India during the period of 2007 – 2012 (BEE, 2012).
0 20 40 60 80 100
Aluminium
Cement
Chemical
Integrated Steel Plant
Pulp and Paper
Textile
Shares of Cost Categories of All Measures Adopted [%]
Industries
60-80 (USD
2010
/tCO
2
)
0-20 (USD
2010
/tCO
2
)
20-40 (USD
2010
/tCO
2
)
40-60 (USD
2010
/tCO
2
)
80-100 (USD
2010
/tCO
2
)
Above 100 (USD
2010
/tCO
2
)

767767
Industry
10
Chapter 10
Allwood etal. (2010) assessed different strategies to achieve a 50 %
cut in the emissions of five sectors (cement, steel, paper, aluminium,
and plastics) assuming doubling of demand by 2050. They found that
gains in efficiency could result in emissions intensity reductions in
the range of 21 % – 40 %. Further reductions to reach the required
75 % reduction in emissions intensity can only be achieved by imple-
menting strategies at least partly going beyond the sectors bound-
aries: i. e., non destructive recycling, reducing demand through light
weighting, product life extension, increasing intensity of product use
or substitution for other materials, and radical process innovations,
notwithstanding significant implementation barriers (see Section
10.9).
Mitigation options can also be analyzed from the perspective of some
industry-wide technologies. Around two-thirds of electricity consump-
tion in the industrial sector is used to drive motors (McKane and Hasan-
beigi, 2011). Steam generation represents 30 % of global final indus-
trial energy use. Efficiency of motor systems and steam systems can
be improved by 20 – 25 % and 10 %, respectively (GEA, 2012; Brown
etal., 2012). Improvements in the design and especially the operation
of motor systems, which include motors and associated system com-
ponents in compressed air, pumping, and fan systems (McKane and
Hasanbeigi, 2010, 2011; Saidur, 2010), have the potential to save 2.58
EJ in final energy use globally (IEA, 2007). McKane and Hasanbeigi
(2011) developed energy efficiency supply curve models for the United
States, Canada, the European Union, Thailand, Vietnam, and Brazil and
found that the cost-effective potential for electricity savings in motor
system energy use compared to the base year varied between 27 %
and 49 % for pumping, 21 % and 47 % for compressed air, and 14 %
and 46 % for fan systems. The total technical saving potential varied
between 43 % and 57 % for pumping, 29 % and 56 % for compressed
air, and 27 % and 46 % for fan systems. Ways to reduce emissions from
many industries include more efficient operation of process heating
systems (LBNL and RDC, 2007; Hasanuzzaman etal., 2012) and steam
systems (NREL et al., 2012), minimized waste heat loss and waste
heat recovery (US DoE, 2004a, 2008), advanced cooling systems, use
of cogeneration (or combined heat and power) (Oland, 2004; Shipley
etal., 2008; Brown etal., 2013), and use of renewable energy sources.
Recent analysis show, for example, that recuperators can reduce fur-
nace energy use by 25 % while economizers can reduce boiler energy
use by 10 % to 20 %, both with payback periods typically under two
years (Hasanuzzaman etal., 2012).
According to data from McKinsey (2010) on MACs for cement, iron,
and steel and chemical sectors, and from Akashi et al. (2011) for
cement and iron and steel, around 40 % mitigation potential in indus-
try can be realized cost-effectively. Due to methodological reasons,
MACs always have to be discussed with caution. It has to be consid-
ered that the information about the direct additional cost associated
with additional reduction of CO
2
through technological options is lim-
ited. Moreover, system perspectives and system interdependencies are
not typically taken into account for MACs (McKinsey&Company, 2010;
Akashi etal., 2011).
Unless barriers to mitigation in industry are resolved, the pace and
extent of mitigation in industry will be limited, and even cost-effective
measures will remain untapped. Various barriers that block technol-
ogy adoption despite low direct costs are often not appropriately
accounted for in mitigation cost assessments. Such barriers are dis-
cussed in Section 10.9.
In the long term, however, it may be more relevant to look at radically
new ways of producing energy-intensive products. Low-carbon cement
and concrete might become relevant (Hasanbeigi etal., 2012b); how-
ever, from current perspective cost assessments for these technologies
are connected with high uncertainties.
10�7�2 Non-CO
2
emissions
Emissions of non-CO
2
gases from different industrial sources are pro-
jected to be 0.70 GtCO
2
eq in the year 2030 (EPA, 2013), dominated
by HFC-23 from HCFC-22 production (46 %) and N
2
O from nitric acid
and from adipic acid (24 %). In 2030, it is projected that HFC-23 emis-
sions will be related mainly to the production of HCFC-22 for feedstock
use, as its use as refrigerant will be phased out in 2035 (Miller and
Kuijpers, 2011). The EPA (2013) provides MACs for all non-CO
2
emis-
sions. Emissions resulting from the production of flat panel displays
and from photovoltaic cell manufacturing are projected to be small (2
and 12 MtCO
2
eq respectively in 2030), but particularly uncertain due
to limited information on emissions rates, use of fluorinated gases, and
production growth rates.
10�7�3 Summary results on costs and potentials
Based on the available bottom-up information from literature and
through expert consultation, a global picture of the four industrial
key sub-sectors (cement, steel, chemicals, and pulp and paper) is
assessed and presented in Figures 10.7 to 10.10 below. Detailed jus-
tification of the figures and description of the options are provided in
AnnexIII. Globally, in 2010, these four selected sub-sectors contrib-
uted 5.3 GtCO
2
direct energy- and process-related CO
2
emissions (see
Section 10.3): iron and steel 1.9 GtCO
2
, non-metallic minerals (which
includes cement) 2.6 GtCO
2
, chemicals and petrochemicals 0.6 GtCO
2
,
and pulp and paper 0.2 GtCO
2
. This amounts to 73 % of all direct
15
energy- and process-related CO
2
emissions from the industry sector.
For each of the sub-sectors, only selected mitigation options are cov-
ered (for other feasible options in the industry sector refer to Section
10.4): energy efficiency, shift in raw material use to less carbon-inten-
sive alternatives (e. g., reducing the clinker to cement ratio, recycling
etc.), fuel mix options, end-of-pipe emission abatement options such
15
These values do not include indirect emissions from electricity and heat produc-
tion.

768768
Industry
10
Chapter 10
Figure 10�7 | Indicative CO
2
emission intensities and levelized cost of conserved carbon in cement production for various production practices / technologies and in 450 ppm sce-
narios of selected models (AIM, DNE21+, IEA ETP 2DS) (for data and methodology, see AnnexIII).
Indicative Cost of Conserved Carbon[USD
2010
/tCO
2
]
Scenarios Reaching 450 ppm CO
2
eq in 2100 in Integrated Models
Currently Commercially Available Technologies
Technologies in Pre-Commercial Stage
>15050-15020-500-20<0
0.0
0.10.20.30.40.50.60.7
0.8
Global Average (2010)
Emission Intensity [tCO
2
/t Cement]
Global Average, 2030
Global Average, 2050
Best Practice Energy Intensity
Best Practice Clinker Substitution
Improvements in Non-Electric Fuel Mix
Best Practice Energy Intensity and Clinker
Substitution Combined
Decarbonization of Electricity Supply
CCS
CCS and Fully Decarbonized Electricity
Supply Combined
Measure Affects Direct and Indirect Emissions
Measure Affects Indirect Emissions
Measure Affects Direct Emissions
Effect from Increased Use of Biomass as Non-Electric Fuel*
Data from Integrated Models
* Assuming for Simplicity that Biomass Burning is Carbon Neutral
Figure 10�8 | Indicative CO
2
emission intensities and levelized cost of conserved carbon in steel production for various production practices / technologies and in 450 ppm scenarios
of selected models (AIM, DNE21+, and IEA ETP 2DS) (for data and methodology, see AnnexIII).
Currently Commercially Available Technologies
Technologies in Pre-Commercial Stage
Scenarios Reaching 450 ppm CO
2
eq in 2100 in Integrated Models
Indicative Cost of Conserved Carbon[USD
2010
/tCO
2
]
Measure Affects Direct and Indirect EmissionsMeasure Affects Indirect EmissionsMeasure Affects Direct EmissionsData from Integrated Models
>15050-15020-500-20<00.01.01.52.02.5
0.5
Global Average (2010)
Emission Intensity [tCO
2
/t Crude Steel]
Global Average (2030)
Global Average (2050)
Advanced Blast Furnace Route
Natural Gas DRI Route
Scrap Based EAF
Decarbonization of
Electricity Supply
CCS
CCS and Fully Decarbonized
Electricity Supply Combined

769769
Industry
10
Chapter 10
Figure 10�9 | Indicative global indirect (left) and direct (right) CO
2
eq emissions and levelized cost of conserved carbon resulting from chemicals production for various production
practices / technologies and CO
2
emissions in IEA ETP 2DS scenario (for data and methodology, see AnnexIII).
Notes: Graph includes energy-related emissions (including process emissions from ammonia production), N
2
O emissions from nitric and adipic acid production and HFC-23 emis-
sions from HFC-22 production. Costs for N
2
O abatement from nitric / adipic acid production and for HFC-23 abatement in HFC-22 production based on EPA (2013) and Miller and
Kuijpers (2011), respectively.
Indicative Cost of Conserved Carbon[USD
2010
/tCO
2
eq]
Measure Affects Direct and Indirect Emissions
Measure Affects Indirect Emissions
Measure Affects Direct Emissions
Effect from Increased Use of Biomass as Non-Electric Fuel*
Data from Integrated Models
* Assuming for Simplicity that Biomass Burning is Carbon Neutral
>15050-15020-500-20<0
Currently Commercially Available Technologies
Technologies in Pre-Commercial Stage
IEA ETP 2DS Scenario
Direct Emissions [GtCO
2
eq]Indirect Emissions
[GtCO
2
eq]
Global Average (2010)Global Average (2010)
0.00.51.01.52.00.00.5
Global Total (2030)
Global Total (2050)
Best Practice Energy Intensity
Enhanced Recycling, Cogeneration
and Process Intensification
Abatement of N
2
O from Nitric
and Adipic Acid
Abatement of HFC-23 Emissions
from HFC-22 Production
CCS for Ammonia Production
Improvements in Non-Electric Fuel Mix
Decarbonization of Electricity Supply
CCS Applied to Non-Electric
Fuel-Related Emissions
Figure 10�10 | Indicative global indirect (left) and direct (right) CO
2
emission intensities and levelized cost of conserved carbon in paper production for various production prac-
tices / technologies and in IEA ETP 2DS scenario (for data and methodology, see AnnexIII).
Indicative Cost of Conserved Carbon[USD
2010
/tCO
2
]
Measure Affects Direct and Indirect EmissionsMeasure Affects Indirect EmissionsMeasure Affects Direct EmissionsData from Integrated Models
>15050-15020-500-20<0
Currently Commercially Available Technologies
IEA ETP 2DS Scenario
Technologies in Pre-Commercial Stage
Global Average (2030)
Global Average (2050)
Best Practice Energy Intensity
Cogeneration
Decarbonization of Electricity Supply
CCS
0.00.10.20.30.40.50.60.00.10.20.30.40.50.6
Direct Emission Intensity [tCO
2
/t Paper]Indirect Emission Intensity [tCO
2
/t Paper]
Global Average (2010)Global Average (2010)

770770
Industry
10
Chapter 10
as carbon dioxide capture and storage (CCS), use of decarbonized
electricity and options for the two most important current sources
of non-CO
2
GHG emissions (HFC 23 emissions from HFC 22 produc-
tion and N
2
O emissions from nitric and adipic acid production) in
the chemical industry. The potentials are given related to the 2010
emission intensity or absolute emissions. Cost estimates relate to the
current costs (expressed in USD
2010
) of the abatement options unless
otherwise stated.
Potentials and costs to decarbonize the electricity sector are covered
in Chapter 7. To ensure consistency with that chapter, no estimates are
given for the costs related to decarbonizing the electricity mix for the
industrial sector.
Costs and potentials are global averages, but based on region-specific
information. The technology options are given relative to the global
average emission intensity. Some options are not mutually exclusive
and potentials can therefore not always be added. As such, none of
the individual options can yield full GHG emission abatement, because
of the multiple emission sources included (e. g., in the chemical sector
CCS and fuel mix improvements cannot reduce N
2
O emissions).
Costs relate to costs of abatement taking into account total incremen-
tal operational and capital costs. The figures give indicatively the costs
of implementing different options; they also exclude options related
to material efficiency (e. g., reduction of demand), but include some
recycling options (although not in pulp and paper). Figure 10.7 about
cement production includes process CO
2
emissions.
Emissions after implementing potential options to reduce the GHG
emission intensity of cement, steel, pulp and paper sectors are pre-
sented in tCO
2
/ t product compared to 2010 global average respec-
tively. Future relevant scenarios are also presented. However, for the
chemical sector, due to its heterogeneity in terms of products and pro-
cesses, the information is presented in terms of total emissions. This
can be an under-representation of relatively higher mitigation poten-
tial in e. g., ammonia production. In addition, unknown / unexplored
options such as hydrogen / electricity-based chemicals and fuels are
not included, so it is worth noting that the options are exemplary. In
the cement industry (Figure 10.7), the potential and costs for clinker
substitution and fuel mix changes are dependent on regional availabil-
ity and the price of clinker substitutes and alternative fuels. Negative
cost options in cement manufacturing are in switching to best practice
clinker-to-cement ratio. In the iron and steel industry (Figure 10.8), a
shift from blast furnace based steelmaking to electric arc furnace steel-
making provides significant negative cost opportunities. However, this
potential is highly dependent on scrap availability. The chemical sec-
tor (Figure 10.9) includes options related to energy efficiency improve-
ments and options related to reduction of N
2
O emissions from nitric
and adipic acid production and HFC-23 emissions from HFC-22 produc-
tion. In pulp and paper manufacturing (Figure 10.10), the estimates
exclude increased recycling because the effect on CO
2
emissions is
uncertain.
The costs of the abatement options shown in Figure 10.7 vary widely
between individual regions and from plant to plant in the cement
industry. Factors influencing the costs include typical capital stock
turnover rates (some measures can only be applied when plants are
replaced), relative energy costs, etc. For clinker substitution and fuel
mix improvements, costs depend heavily on the regional availability
and price of clinker substitutes and alternative fuels.
For all subsectors, negative abatement cost options exist to a certain
extent for shifting to best practice technologies and for fuel shift-
ing. While options in cost ranges of 0 – 20 and 20 – 50 USD
2010
/ tCO
2
eq
are somewhat limited, larger opportunities exist in the 50 – 150
USD
2010
/ tCO
2
eq range (particularly since CCS is included here). The
feasibility of CCS depends on global CCS developments. CCS is cur-
rently not yet applied (with some exceptions) at commercial scale in
the cement, iron and steel, chemical, or pulp / paper industries.
10.8 Co-benefits, risks
and spillovers
In addition to mitigation costs and potentials (see Section 10.7), the
deployment of mitigation measures will depend on a variety of other
factors that relate to broader economic, social, and environmen-
tal objectives that drive decisions in the industry sector and policy
choices. The implementation of mitigation measures can have posi-
tive or negative effects on these other objectives. To the extent that
these side-effects are positive, they can be deemed ‘co-benefits’; if
adverse and uncertain, they imply risks.
16
Co-benefits and adverse
side-effects of mitigation measures (10.8.1), the associated techni-
cal risks and uncertainties (10.8.2) as well as their public perception
(10.8.3) and technological spillovers (10.8.4), can significantly affect
investment decisions, individual behaviour, and policymaker priori-
ties. Table 10.5 provides an overview of the potential co-benefits and
adverse side-effects of the mitigation measures that are assessed
in this chapter. In accordance with the three sustainable develop-
ment pillars described in Chapter 4, the table presents effects on
objectives that may be economic, social, environmental, and health
related. The extent to which co-benefits and adverse side-effects will
materialize in practice as well as their net effect on social welfare
differ greatly across regions, and is strongly dependent on local cir-
cumstances and implementation practices, as well as on the scale
and pace of the deployment of the different mitigation measures
(see Section 6.6).
16
Co-benefits and adverse side-effects describe effects in non-monetary units
without yet evaluating the net effect on overall social welfare. Please refer to the
respective sections in the framing chapters (particularly Sections 2.4, 3.6.3, and
4.8) as well as to the glossary in AnnexI for concepts and definitions.

771771
Industry
10
Chapter 10
10�8�1 Socio-economic and environmental
effects
Social embedding of technologies depends on compatibility with exist-
ing systems, social acceptance, divisibility, eco-friendliness, relative
advantage, etc. (Geels and Schot, 2010; Roy et al., 2013). A typical
example is the tradeoff or the choice that is made between investing
in mitigation in industry and adaptation in the absence of right incen-
tives for mitigation action (Chakraborty and Roy, 2012a). Slow diffu-
sion of mitigation options (UNIDO, 2011) can be overcome by focusing
on, and explicit consideration of, non-direct cost-related characteristics
of the technologies (Fleiter etal., 2012c). It is unanimously understood
that maintaining competitiveness of industrial products in the market
place is an important objective of industries, so implementation of
mitigation measures will be a major favoured strategy for industries if
they contribute to cost reduction (Bernstein etal., 2007; Winkler etal.,
2007; Bassi etal., 2009). Increasing demand for energy in many coun-
tries has led to imports and increasing investment in high-cost reliable
electric power generation capacity; so mitigation via implementation
of energy efficiency measures help to reduce import dependency and
investment pressure (Winkler etal., 2007). Labour unions are increas-
ingly expressing their desire for policies to address climate change and
support for a transition to ‘green’ jobs (Räthzel and Uzzell, 2012). Local
air and water pollution in areas near industries have led to regulatory
restrictions in almost all countries. In many countries, new industrial
developments face increasing public resistance and litigation. If miti-
gation options deliver local air pollution benefits, they will have indi-
rect value and greater acceptance.
The literature (cited in the following sections and in Table 10.5) docu-
ments that mitigation measures interact with multiple economic, social,
and environmental objectives, although these associated impacts
are not always quantified. In general, quantifying the corresponding
welfare effects that a mitigation technology or practice entails is chal-
lenging, because they are very localized and different stakeholders
may have different perspectives of the corresponding losses and gains
(Fleiter etal., 2012c) (see Sections 2.4, 3.6.3, 4.2, and 6.6). It is impor-
tant to note that co-benefits need to be assessed together with direct
benefits to overcome barriers in implementation of the mitigation
options (e. g., training requirements, losses during technology instal-
lation) (Worrell etal., 2003), which may appear otherwise larger for
SMEs or isolated enterprises (Crichton, 2006; Zhang and Wang, 2008;
Ghosh and Roy, 2011).
Energy efficiency (E / M): Energy efficiency includes a wide variety
of measures that also achieve economic efficiency and natural / energy
resource saving, which contribute to the achievement of environ-
mental goals and other macro benefits (Roy etal., 2013). At the com-
pany level, the impact of energy efficient technology is often found
to enhance productivity growth (Zuev etal., 1998; Boyd and Pang,
2000; Murphy, 2001; Worrell et al., 2003; Gallagher, 2006; Winkler
etal., 2007; Zhang and Wang, 2008; May etal., 2013). Other ben-
efits to companies, industry, and the economy as a whole come in the
form of reduced fuel consumption requirements
17
and imports as well
as reduced requirements for new electricity general capacity addition
(Sarkar etal., 2003; Geller etal., 2006; Winkler etal., 2007; Sathaye
and Gupta, 2010) which contribute to energy security (see Sections
6.6.2.2 and 7.9.1). Energy security in the industrial sector is primarily
affected by concerns related to the sufficiency of resources to meet
national energy demand at competitive and stable prices. Supply-side
vulnerabilities in this sector arise if there is a high share of imported
fuels in the industrial energy mix (Cherp etal., 2012a). Cherp etal.
(2012a) estimate that the overall vulnerability of industrial energy
consumption is lower than in the transport and residential and com-
mercial (R&C) sectors in most countries. Nevertheless, since mitigation
policies in industry would likely lead to higher energy efficiency, they
may reduce exposure to energy supply and price shocks (Gnansou-
nou, 2008; Kruyt etal., 2009; Sovacool and Brown, 2010; Cherp etal.,
2012b).
Reduced fossil fuel burning brings associated reduced costs (Winkler
etal., 2007), and reduced local impacts on ecosystems related to fossil
fuel extraction and waste disposal liability (Liu and Diamond, 2005;
Zhang and Wang, 2008; Chen etal., 2012; Ren et al., 2012; Hasan-
beigi etal., 2013b; Lee and van de Meene, 2013; Xi etal., 2013; Liu
etal., 2013) (see also Sections 7.9.2 and 7.9.3). In addition, other pos-
sible benefits of reduced reliance on fossil fuels include increases in
employment and national income (Sathaye and Gupta, 2010) with new
business opportunities (Winkler etal., 2007; Nidumolu etal., 2009; Wei
etal., 2010; Horbach and Rennings, 2013).
There is wide consensus in the literature on local air pollution reduc-
tion benefits from energy efficiency measures in industries (Winkler
etal., 2007; Bassi etal., 2009; Ren etal., 2012), such as positive health
effects, increased safety and working conditions, and improved job sat-
isfaction (Getzner, 2002; Worrell etal., 2003; Wei etal., 2010; Walz,
2011; Zhang etal., 2011; Horbach and Rennings, 2013) (see also Sec-
tions 7.9.2, 7.9.3 and WGII 11.9). Energy efficient technologies can
also have positive impacts on employment (Getzner, 2002; Wei etal.,
2010; UNIDO, 2011; OECD / IEA, 2012). Despite these multiple co-ben-
efits, sometimes the relatively large initial investment required and
the relatively long payback period of some energy efficiency measures
can be a disincentive and an affordability issue, especially for SMEs,
since the co-benefits are often not monetized (Brown, 2001; Thollander
etal., 2007; Ghosh and Roy, 2011; UNIDO, 2011).
Emission efficiency (G / E): The literature documents well that
increases in emissions efficiency can lead to multiple benefits (see
Table 10.5). Local air pollution reduction is well documented as co-
benefit of emissions efficiency measures (Winkler etal., 2007; Bassi
etal., 2009; Ren etal., 2012). Associated health benefits (Aunan etal.,
2004; Haines etal., 2009) and reduced ecosystem impacts (please refer
to Section 7.9.2 for details) are society-wide benefits, while reduc-
17
Please see Section 10.4 and references cited therein (e. g., Schäfer, 2005; Allwood
et al., 2010; UNIDO, 2011; Saygin et al., 2011b; Gutowski et al., 2013).

772772
Industry
10
Chapter 10
tions in emission-related taxes or payment liabilities (Metcalf, 2009)
are specific to industries, even though compliance costs might increase
(Dasgupta etal., 2000; Mestl etal., 2005; Rivers, 2010). The net effect
of these benefits and costs has not been studied comprehensively.
Quantification of benefits is often done on a case-by-case basis. For
example, Mestl etal. (2005) found that the environmental and health
benefits of using electric arc furnaces for steel production in the city
of Tiyuan (China) could potentially lead to higher benefits than other
options, despite being the most costly option. For India, a detailed
study (Chakraborty and Roy, 2012b) of 13 energy-intensive industrial
units showed that several measures to reduce GHG emissions were
adopted because the industries could realize positive effects on their
own economic competitiveness, resource conservation such as water,
and an enhanced reputation / public image for their commitment to
corporate social responsibility towards a global cause.
If existing barriers (see Section 10.9) can be overcome, industrial appli-
cations of CCS deployed in the future could provide environmental co-
benefits because CCS-enabled facilities have very low emissions rates
for critical pollutants even without specific policies being in place for
those emissions (Kuramochi etal., 2012b) (see Section 7.9.2 and Figure
7.8 for the air pollution effects of CCS deployment in power plants).
Mitigations options to reduce PFC emissions from aluminium pro-
duction, N
2
O emissions from adipic and nitric acid production (EPA,
2010a), and PFC emissions from semiconductor manufacturing (ISMI,
2005) have proven to enhance productivity and reduce the cost of pro-
duction. Simultaneously, these measures provide health benefits and
better working conditions for labour and local ambient air quality (Hei-
jnes etal., 1999).
18
Material efficiency (M / P): There is a wide range of benefits to be
harnessed from implementing material efficiency options. Private ben-
efits to industry in terms of cost reduction (Meyer etal., 2007) can
enhance competitiveness, but national and subnational sales revenue
might decline in the medium term due to reduction in demand for inter-
mediate products used in manufacturing (Thomas, 2003). Material use
efficiency increases can often be realized via cooperation in industrial
clusters (see Section 10.5), while associated infrastructure develop-
ment (new industrial parks) and associated cooperation schemes lead
to additional societal gains (e. g., more efficient use of land through
bundling activities) (Lowe, 1997; Chertow, 2000). With the reduction
in need for virgin materials (Allwood etal., 2013; Stahel, 2013) and
the prioritization of prevention in line with the waste management
hierarchy (see Section 10.14.2, Figure 10.16), mining-related social
conflicts can decrease (Germond-Duret, 2012), health and safety can
be enhanced, recycling-related employment can increase, the amount
of waste material (see Section 10.14.2.1 and Figure 10.17) going
into landfills can decrease, and new business opportunities related to
material efficiency can emerge (Clift and Wright, 2000; Rennings and
18
See also EPA Voluntary Aluminum Industrial Partnership: http: / / www. epa.
gov / highgwp / aluminum-pfc / faq.html.
Zwick, 2002; Widmer etal., 2005; Clift, 2006; Zhang and Wang, 2008;
Walz, 2011; Allwood etal., 2011; Raghupathy and Chaturvedi, 2013;
Menikpura etal., 2013).
Demand reductions (P / S and S): Demand reduction through adop-
tion of new diverse lifestyles (see Section 10.4) (Roy and Pal, 2009;
GEA, 2012; Kainuma etal., 2012; Allwood etal., 2013) and implemen-
tation of healthy eating (see Section 11.4.3) and sufficiency goals can
result in multiple co-benefits related to health that enhance human
well-being (GEA, 2012). Well-being indicators can be developed to
evaluate industrial economic activities in terms of multiple effects of
sustainable consumption on a range of policy objectives (GEA, 2012).
10�8�2 Technological risks and uncertainties
There are some specific risks and uncertainties with adoption of miti-
gation options in industry. Potential health, safety, and environmental
risks could arise from additional mining activities as some mitigation
technologies could substantially increase the need for specific materi-
als (e. g., rare earths, see Section 7.9.2) and the exploitation of new
extraction locations or methods. Industrial production is closely linked
to extractive industry (see Figure 10.2) and there are risks associated
with closing mines if post-closure measures for environmental pro-
tection are not adopted due to a lack of appropriate technology or
resources. Carbon dioxide capture and storage for industry is an exam-
ple of a technological option subject to several risks and uncertainties
(see Sections 10.7, 7.5.5, 7.6.4 and 7.9.4 for more in-depth discussion
on CO
2
storage, transport, and the public perception thereof, respec-
tively).
Specific literature on accidents and technology failure related to miti-
gation measures in the industry sector is lacking. In general, industrial
activities are subject to the main categories of risks and emergencies,
namely natural disasters, malicious activities, and unexpected conse-
quences arising from overly complex systems (Mitroff and Alpaslan,
2003; Olson and Wu, 2010). For example, process safety is still a major
issue for the chemical industry. Future improvements in process safety
will likely involve a holistic integration of complementary activities and
be supported by several layers of detail (Pitblado, 2011).
10�8�3 Public perception
From a socio-constructivist perspective, the social response to
industrial activity depends on three sets of factors related to: 1)
the dynamics of regional development and the historical place of
industry in the community, 2) the relationship between residents
and the industry and local governance capacities, and 3) the social
or socio-economic impacts experienced (Fortin and Gagnon, 2006).
Public hearings and stakeholder participation — especially on envi-
ronmental and social impact assessments — prior to issuance of per-
mission to operate has become mandatory in almost all countries,
Table 10�5 | Overview of potential co-benefits (green arrows) and adverse side-effects (orange arrows) of the main mitigation measures in the industry sector. Arrows pointing
up / down denote positive / negative effect on the respective objective or concern. Co-benefits and adverse side-effects depend on local circumstances as well as on the implementa-
tion practice, pace, and scale (see Section 6.6). For possible upstream effects of low-carbon energy supply (incl. CCS), see Section 7.9. For possible upstream effects of biomass
supply, see Sections 11.7 and 11.13.6. For an assessment of macroeconomic, cross-sectoral effects associated with mitigation policies (e. g., on energy prices, consumption, growth,
and trade), see Sections 3.9, 6.3.6, 13.2.2.3, and 14.4.2. Numbers correspond to references below the table.
Mitigation measures
Effect on additional objectives / concerns
Economic Social (including health) Environmental
Technical energy
efficiency improvements
via new processes
and technologies
↑
↑
↑
↑
Energy security (via reduced energy
intensity) [1, 2, 3, 4, 13, 29, 57];
Employment impact [14, 15, 19, 28]
Competitiveness and Productivity
[4, 5, 6, 7, 8, 9, 10, 11, 12]
Technological spillovers in DCs (due to
supply chain linkages) [59, 60, 61]
↓
↑
↑
↑
Health impact via reduced local pollution [16]
New business opportunities [4, 17 – 20]
Water availability and quality [26]
Safety, working conditions and
job satisfaction [5, 19, 20]
↓
↓
↓
Ecosystem impact via
Fossil fuel extraction [21]
Local pollution [11, 22 – 24, 25] and
Waste [11, 27]
CO
2
and non-CO
2
GHG emissions
intensity reduction
↑
Competitiveness [31, 55] and
productivity [52, 53]
↓
Health impact via reduced local air pollution
[30, 31, 32, 33, 53] and better work
conditions (for PFCs from aluminium) [58]
↓
↓
↑
Ecosystem impact via
Local air pollution [4, 25, 30, 31, 34, 52]
Water pollution [54]
Water conservation [56]
Material efficiency
of goods, recycling
↓
↑
↑
↑
National sales tax revenue
in medium term [35]
Employment impact in waste
recycling market [44, 45]
New infrastructure for industrial
clusters [36, 37]
Competitiveness in manufacturing [38]
↑
↓
↓
New business opportunities [11, 39 – 43]
Local conflicts (reduced
resource extraction) [58]
Health impacts and safety concerns [49]
↓
↓
Ecosystem impact via reduced local
air and water pollution and waste
material disposal [42, 46]
Use of raw / virgin materials and
natural resources implying reduced
unsustainable resource mining [47, 48]
Product demand
reductions
↓
National sales tax revenue
in medium term [35]
↑
Wellbeing via new diverse
lifestyle choices [48, 50, 51]
↓
Post consumption waste [48]
[1] Sovacool and Brown, 2010; [2] Geller etal., 2006; [3] Gnansounou, 2008; [4] Winkler etal., 2007; [5] Worrell etal., 2003; [6] Boyd and Pang, 2000; [7] May etal., 2013; [8]
Goldemberg, 1998; [9] Murphy, 2001; [10] Gallagher, 2006; [11] Zhang and Wang, 2008; [12] Roy etal., 2013; [13] see Section 10.4 and references cited therein; [14] UNIDO,
2011; [15] OECD / IEA, 2012; [16] Zhang etal., 2011; [17] Nidumolu etal., 2009; [18] Horbach and Rennings, 2013; [19] Getzner, 2002; [20] Wei etal., 2010; [21] Liu and Diamond,
2005; [22] Hasanbeigi etal., 2013a; [23] Xi etal., 2013; [24] Chen etal., 2012; [25] Ren etal., 2012; [26] Zhelev, 2005; [27] Lee and van de Meene, 2013; [28] Sathaye and
Gupta, 2010; [29] Sathaye and Gupta, 2010; [30] Mestl etal., 2005; [31] Chakraborty and Roy, 2012a; [32] Haines etal., 2009; [33] Aunan etal., 2004; [34] Bassi etal., 2009; [35]
Thomas, 2003; [36] Lowe, 1997; [37] Chertow, 2000; [38] Meyer etal., 2007; [39] Widmer etal., 2005; [40] Raghupathy and Chaturvedi, 2013; [41] Clift and Wright, 2000; [42]
Allwood etal., 2011; [43] Clift, 2006; [44] Walz, 2011; [45] Rennings and Zwick, 2002; [46] Menikpura etal., 2013; [47] Stahel, 2013; [48] Allwood etal., 2013; [49] GEA, 2012;
[50] Kainuma etal., 2012; [51] Roy and Pal, 2009; [52] EPA, 2010b; [53] ISMI, 2005; [54] Heijnes etal., 1999; [55] Rivers, 2010; [56] Chakraborty and Roy, 2012b; [57] Sarkar
etal., 2003; [58] Germond-Duret, 2012; [59] Kugler, 2006; [60] Bitzer and Kerekes, 2008; [61] Zhao etal., 2010.

773773
Industry
10
Chapter 10
and industry expenditures for social corporate responsibility are now
often disclosed. Mitigation measures in the industry sector might be
considered socially acceptable if associated with co-benefits, such
as reducing GHG emissions while also improving local environmen-
tal quality as a whole (e. g., energy efficiency measures that reduce
local emissions). Public perception related to mitigation actions can
be influenced by national political positions in international negotia-
tions and media.
Research on public perception and acceptance with regard to indus-
trial applications of CCS is lacking (for the general discussion of CCS
see Chapter 7). To date, broad evidence related to whether public per-
ception of CCS for industrial applications will be significantly different
from CCS in power generation units is not available, since CCS is not
yet in place in the industry sector (Section 10.7).
Mining activities have generated social conflicts in different parts of
the world (Martinez-Alier, 2001; World Bank, 2007; Germond-Duret,
2012; Guha, 2013). The Observatory of Mining Conflicts in Latin
America (OMCLA) reported more than 150 active mining conflicts in
the region, most of which started in the 2000s
19
. Besides this general
experience, the potential for interactions between social tensions and
mitigation initiatives in this sector are unknown.
19
Observatorio de Conflictos Mineros de América Latina. Available at: http: / / www.
conflictosmineros. net.
Zwick, 2002; Widmer etal., 2005; Clift, 2006; Zhang and Wang, 2008;
Walz, 2011; Allwood etal., 2011; Raghupathy and Chaturvedi, 2013;
Menikpura etal., 2013).
Demand reductions (P / S and S): Demand reduction through adop-
tion of new diverse lifestyles (see Section 10.4) (Roy and Pal, 2009;
GEA, 2012; Kainuma etal., 2012; Allwood etal., 2013) and implemen-
tation of healthy eating (see Section 11.4.3) and sufficiency goals can
result in multiple co-benefits related to health that enhance human
well-being (GEA, 2012). Well-being indicators can be developed to
evaluate industrial economic activities in terms of multiple effects of
sustainable consumption on a range of policy objectives (GEA, 2012).
10�8�2 Technological risks and uncertainties
There are some specific risks and uncertainties with adoption of miti-
gation options in industry. Potential health, safety, and environmental
risks could arise from additional mining activities as some mitigation
technologies could substantially increase the need for specific materi-
als (e. g., rare earths, see Section 7.9.2) and the exploitation of new
extraction locations or methods. Industrial production is closely linked
to extractive industry (see Figure 10.2) and there are risks associated
with closing mines if post-closure measures for environmental pro-
tection are not adopted due to a lack of appropriate technology or
resources. Carbon dioxide capture and storage for industry is an exam-
ple of a technological option subject to several risks and uncertainties
(see Sections 10.7, 7.5.5, 7.6.4 and 7.9.4 for more in-depth discussion
on CO
2
storage, transport, and the public perception thereof, respec-
tively).
Specific literature on accidents and technology failure related to miti-
gation measures in the industry sector is lacking. In general, industrial
activities are subject to the main categories of risks and emergencies,
namely natural disasters, malicious activities, and unexpected conse-
quences arising from overly complex systems (Mitroff and Alpaslan,
2003; Olson and Wu, 2010). For example, process safety is still a major
issue for the chemical industry. Future improvements in process safety
will likely involve a holistic integration of complementary activities and
be supported by several layers of detail (Pitblado, 2011).
10�8�3 Public perception
From a socio-constructivist perspective, the social response to
industrial activity depends on three sets of factors related to: 1)
the dynamics of regional development and the historical place of
industry in the community, 2) the relationship between residents
and the industry and local governance capacities, and 3) the social
or socio-economic impacts experienced (Fortin and Gagnon, 2006).
Public hearings and stakeholder participation — especially on envi-
ronmental and social impact assessments — prior to issuance of per-
mission to operate has become mandatory in almost all countries,
Table 10�5 | Overview of potential co-benefits (green arrows) and adverse side-effects (orange arrows) of the main mitigation measures in the industry sector. Arrows pointing
up / down denote positive / negative effect on the respective objective or concern. Co-benefits and adverse side-effects depend on local circumstances as well as on the implementa-
tion practice, pace, and scale (see Section 6.6). For possible upstream effects of low-carbon energy supply (incl. CCS), see Section 7.9. For possible upstream effects of biomass
supply, see Sections 11.7 and 11.13.6. For an assessment of macroeconomic, cross-sectoral effects associated with mitigation policies (e. g., on energy prices, consumption, growth,
and trade), see Sections 3.9, 6.3.6, 13.2.2.3, and 14.4.2. Numbers correspond to references below the table.
Mitigation measures
Effect on additional objectives / concerns
Economic Social (including health) Environmental
Technical energy
efficiency improvements
via new processes
and technologies
↑
↑
↑
↑
Energy security (via reduced energy
intensity) [1, 2, 3, 4, 13, 29, 57];
Employment impact [14, 15, 19, 28]
Competitiveness and Productivity
[4, 5, 6, 7, 8, 9, 10, 11, 12]
Technological spillovers in DCs (due to
supply chain linkages) [59, 60, 61]
↓
↑
↑
↑
Health impact via reduced local pollution [16]
New business opportunities [4, 17 – 20]
Water availability and quality [26]
Safety, working conditions and
job satisfaction [5, 19, 20]
↓
↓
↓
Ecosystem impact via
Fossil fuel extraction [21]
Local pollution [11, 22 – 24, 25] and
Waste [11, 27]
CO
2
and non-CO
2
GHG emissions
intensity reduction
↑
Competitiveness [31, 55] and
productivity [52, 53]
↓
Health impact via reduced local air pollution
[30, 31, 32, 33, 53] and better work
conditions (for PFCs from aluminium) [58]
↓
↓
↑
Ecosystem impact via
Local air pollution [4, 25, 30, 31, 34, 52]
Water pollution [54]
Water conservation [56]
Material efficiency
of goods, recycling
↓
↑
↑
↑
National sales tax revenue
in medium term [35]
Employment impact in waste
recycling market [44, 45]
New infrastructure for industrial
clusters [36, 37]
Competitiveness in manufacturing [38]
↑
↓
↓
New business opportunities [11, 39 – 43]
Local conflicts (reduced
resource extraction) [58]
Health impacts and safety concerns [49]
↓
↓
Ecosystem impact via reduced local
air and water pollution and waste
material disposal [42, 46]
Use of raw / virgin materials and
natural resources implying reduced
unsustainable resource mining [47, 48]
Product demand
reductions
↓
National sales tax revenue
in medium term [35]
↑
Wellbeing via new diverse
lifestyle choices [48, 50, 51]
↓
Post consumption waste [48]
[1] Sovacool and Brown, 2010; [2] Geller etal., 2006; [3] Gnansounou, 2008; [4] Winkler etal., 2007; [5] Worrell etal., 2003; [6] Boyd and Pang, 2000; [7] May etal., 2013; [8]
Goldemberg, 1998; [9] Murphy, 2001; [10] Gallagher, 2006; [11] Zhang and Wang, 2008; [12] Roy etal., 2013; [13] see Section 10.4 and references cited therein; [14] UNIDO,
2011; [15] OECD / IEA, 2012; [16] Zhang etal., 2011; [17] Nidumolu etal., 2009; [18] Horbach and Rennings, 2013; [19] Getzner, 2002; [20] Wei etal., 2010; [21] Liu and Diamond,
2005; [22] Hasanbeigi etal., 2013a; [23] Xi etal., 2013; [24] Chen etal., 2012; [25] Ren etal., 2012; [26] Zhelev, 2005; [27] Lee and van de Meene, 2013; [28] Sathaye and
Gupta, 2010; [29] Sathaye and Gupta, 2010; [30] Mestl etal., 2005; [31] Chakraborty and Roy, 2012a; [32] Haines etal., 2009; [33] Aunan etal., 2004; [34] Bassi etal., 2009; [35]
Thomas, 2003; [36] Lowe, 1997; [37] Chertow, 2000; [38] Meyer etal., 2007; [39] Widmer etal., 2005; [40] Raghupathy and Chaturvedi, 2013; [41] Clift and Wright, 2000; [42]
Allwood etal., 2011; [43] Clift, 2006; [44] Walz, 2011; [45] Rennings and Zwick, 2002; [46] Menikpura etal., 2013; [47] Stahel, 2013; [48] Allwood etal., 2013; [49] GEA, 2012;
[50] Kainuma etal., 2012; [51] Roy and Pal, 2009; [52] EPA, 2010b; [53] ISMI, 2005; [54] Heijnes etal., 1999; [55] Rivers, 2010; [56] Chakraborty and Roy, 2012b; [57] Sarkar
etal., 2003; [58] Germond-Duret, 2012; [59] Kugler, 2006; [60] Bitzer and Kerekes, 2008; [61] Zhao etal., 2010.

774774
Industry
10
Chapter 10
10�8�4 Technological spillovers
Spillovers are difficult to measure, but existing studies (Bouoiyour and
Akhawayn, 2005) show that a technology gap is one of the conditions
for positive spillovers. Sections 10.4 and 10.7 have already shown that
there is gap between the world best practices in energy efficiency and
industrial practices in many countries. As such, cross-country invest-
ment in mitigation technologies can enhance positive spillovers in host
countries. In the industrial technology context, multinational compa-
nies try to minimize imitation probability and technology leakage, but
studies show that spillover works faster through supply chain link-
age inter-industry (Kugler, 2006; Bitzer and Kerekes, 2008; Zhao etal.,
2010). In general, studies suggest that technology spillovers in the
mitigation context depend on additional technology policies besides
direct investment (Gillingham etal., 2009; Le and Pomfret, 2011; Wang
etal., 2012a; Costantini etal., 2013; Jeon etal., 2013). These results are
relevant for investments on industrial mitigation technologies as well.
10.9 Barriers and opportunities
Besides uncertainties in financial costs of mitigation options assessed
in 10.7, a number of non-financial barriers and opportunities assessed
in this section hinder or facilitate implementation of measures to
reduce GHG emissions in industry. Barriers must be overcome to allow
implementation (see Flannery and Kheshgi, 2005), however, in general
they are not sufficiently captured in integrated model studies and sce-
narios (see Section 10.10). Barriers that are often common across sec-
tors are given in Chapter 3. Table 10.6 summarizes barriers and oppor-
tunities for the major mitigation options listed in Section 10.4.
Typically, barriers and opportunities can be distinguished into the fol-
lowing categories:
• Technology: includes maturity, reliability, safety, performance, cost
of technology options and systems, and gaps in information
• Physical: includes availability of infrastructure, geography, and
space available
• Institutional and legal: includes regulatory frameworks and institu-
tions that may enable investment
• Cultural: includes public acceptance, workforce capacity (e. g., edu-
cation, training, and knowledge), and cultural norms.
10�9�1 Energy efficiency for reducing energy
requirements
Even though energy consumption can be a significant cost for indus-
try, a number of barriers limit industrial sector steps to minimize
energy use via energy efficiency measures. These barriers include:
failure to recognize the positive impact of energy efficiency on profit-
ability, short investment payback thresholds (two to eight years; IEA,
2012e), industrial organizational and behavioural barriers to imple-
menting change; limited access to capital; impact of non-energy poli-
cies on energy efficiency; public acceptance of unconventional manu-
facturing processes; and a wide range of market failures (Bailey etal.,
2009; IEA, 2009d). While large energy-intensive industries — such as
iron and steel, and mineral processing — are often aware of potential
cost savings and consider energy efficiency in investment decisions,
this is less common in the commercial and service sectors where the
energy cost share is usually low, or for smaller companies where over-
head costs for energy management and training personnel can be
prohibitive (UNIDO, 2011; Ghosh and Roy, 2011; Schleich and Gruber,
2008; Fleiter etal., 2012d; Hasanbeigi etal., 2009). Of course, invest-
ment decisions also consider investment risks, which are generally not
reflected in the cost estimates assessed in Section 10.7. The impor-
tance of barriers depends on specific circumstances. For example, by
surveying the Swedish foundry industry, Rohdin etal. (2007) found
that access to capital was reported to be the largest barrier, followed
by technical risk and other barriers.
Cogeneration, or combined heat and power (CHP), is an energy effi-
ciency option that can not only reduce GHG emissions by improving
system energy efficiency, but can also reduce system cost and decrease
dependence on grid power. For industry, however, (IEA, 2009d) CHP
faces a complex set of economic, regulatory, social, and political bar-
riers that restrain its wider use including: market restriction securing
a fair market value for electricity exported to the grid; high upfront
costs compared to large power plants; difficulty concentrating suitable
heat loads and lack of integrated planning; grid access; non-transpar-
ent and technically demanding interconnection procedures; lack of
consumer and policymaker knowledge about CHP energy, cost and
emission savings; and industry perceptions that CHP is an investment
outside their core business. Regulatory barriers can stem from taxes,
tariffs, or permits. For a cogeneration project of an existing facility, the
electricity price paid to a cogeneration facility is the most important
variable in determining the project’s success — more so than capital
costs, operating and maintenance cost, and even fuel costs (Meidel,
2005). Prices are affected by rules for electricity markets, which differ
from region to region, and which can form either incentives or barriers
for cogeneration (Meidel, 2005).
10�9�2 Emissions efficiency, fuel switching, and
carbon dioxide capture and storage
There are a number of challenges associated with feedstock and
energy substitution in industry. Waste materials and biomass as fuel
and feedstock substitutes are limited by their availability, and hence
competition could drive up prices and make industrial applications less
attractive (IEA, 2009b). A decarbonized power sector would offer new
opportunities to reduce CO
2
intensity of some industrial processes via
use of electricity, however, decarbonization of power also has barriers
(assessed in Section 7.10).

775775
Industry
10
Chapter 10
The application of CCS to the industries covered in this chapter share
many of the barriers to its application to power generation (see Sec-
tion 7.10). Barriers for application of CCS in industry include space
constraints when applied in retrofit situations (Concawe, 2011); high
capital costs and long project development times; investment risk
associated with poorly defined liability; the trade-exposed nature of
many industries, which can limit viable CCS business models; current
lack in general of financial incentives to offset the additional cost of
CCS; and the immaturity of CO
2
capture technology for cement, iron
and steel, and petrochemical industries (Kheshgi etal., 2012).
10�9�3 Material efficiency
There are technically feasible opportunities to improve material effi-
ciency in industry (Allwood etal., 2011). One opportunity is a circu-
lar economy, which is a growing model across various countries and
which aims to systematically fulfil the hierarchy principles of material
efficiency “reduce, re-use, recycle” (see Section 10.14). This approach
however, has barriers which include a lack of human and institutional
capacities to encourage management decisions and public participa-
tion (Geng and Doberstein, 2008), as well as fragmented and weak
Table 10�6 | Barriers (–) and opportunities (+) for GHG emission reduction options in industry. References and discussion appear in respective sub-sections of 10.9.
Energy efficiency for reducing
energy requirements
Emissions efficiency, fuel
switching and CCS
Material efficiency
Product demand
reduction
Non-CO
2
GHGs
Technological
Aspects:
Technology
+ many options available
– technical risk
+ cogeneration mature in heavy industry
– non-transparent and technically demanding
interconnection procedures for cogeneration
+ fuels and technologies readily available
– retrofit challenges
+ large potential scope for CCS in cement
production, iron and steel, and petrochemicals
– limited CCS technology development,
demonstration and maturity
for industry applications
+ options available – slower technology
turnover can
slow technology
improvement
and operational
emission reduction
+ /– approaches and
technologies available
for some sources
– lack of lower cost
technology for PFC
emission reduction in
existing aluminium
production plants
Technological
Aspects:
Physical
+ less energy and fuel use, lower
cooling needs, smaller size
– concentrating suitable heat
loads for cogeneration
– retrofit constraints on cogeneration
– lack of sufficient feedstock to meet demand
– CCS retrofit constraints
– lack of CO
2
pipeline infrastructure
– limited scope and lifetime for
industrial CO
2
utilization
+ reduction in raw
and waste materials
– transport
infrastructure and
industry proximity for
material / waste reuse
+ reduction in
raw materials and
disposed products
– lack of control
of HFC leakage in
refrigeration systems
Institutional
and Legal
– impact of non-energy policies
+ energy efficiency policies (10.11)
– market barriers
– regulatory, tax / tariff and
permitting of cogeneration
+ /– grid access for cogeneration
– fragmented and
weak institutions
– regulatory and legal
instruments generally
do not take account
of externalities
– lack of certification of
refrigeration systems
– regulatory barriers
to HFC alternatives
in aerosols
Cultural
– lack of trained personnel
+ / – attention to energy efficiency
– lack of acceptance of unconventional
manufacturing processes
– cogeneration outside core business
– lack of consumer and policymaker
knowledge of cogeneration
– social acceptance of CCS + / – public
participation
– human capacity
for management
decisions
+ /– user preferences
drive demand
– lack of
information / education
about solvent
replacements
– lack of awareness of
alternative refrigerants
Financial
– access to capital and short
investment payback requirements
– high overhead costs for small or
less energy intensive industries
+ /– factoring in efficiency into investment
decisions (e. g., energy management)
+ cogeneration economic in many cases
+ /– market value of grid power for cogeneration
– high capital cost for cogeneration
– lack of sufficient financial incentive
for widespread CCS deployment
– liability risk for CCS
– high CCS capital cost and long
project development times
– upfront cost and
potentially longer
payback period
+ reduced
production costs
– businesses,
governments,
and labour favour
increased production
– recycled HFCs not
cost competitive
with new HFCs
– cost of HFC
incineration

776776
Industry
10
Chapter 10
institutions (Geng etal., 2010b). Improving material efficiency by inte-
grating different industries (see Section 10.5) is often limited by spe-
cific local conditions, infrastructure requirements (e. g., pipelines) and
the complexity of multiple users (Geng etal., 2010b).
10�9�4 Product demand reduction
Improved product design or material properties, respectively, can
help to extend the product’s lifetime and can lead to lower product
demand. However it has to be considered that extended lifetime may
not actually satisfy current user preferences, and the user may choose
to replace an older, functioning product with a new one (van Nes and
Cramer, 2006; Allwood etal., 2011). In addition, continually provid-
ing newer products may result in lower operational emissions (e. g.,
improved energy efficiency). In this case, longer product lifetimes
might not automatically lead to lower overall emissions. For example,
from a lifecycle balance point of view, it may be better to replace
specific energy-intensive products such as washing machines, before
their end-of-life to make use of more efficient substitutes (Scholl etal.,
2010; Intlekofer etal., 2010; Fischer etal., 2012; Agrawal etal., 2012).
Businesses are rewarded for growing sales volumes and can prefer
process innovation over product innovation (e. g., EIO 2011; 2012).
Existing markets generally do not take into account negative exter-
nalities associated with resource use nor do they adequately incor-
porate the risks of resource-related conflicts (Bleischwitz etal., 2012;
Transatlantic Academy, 2012), yet existing national accounting sys-
tems based on GDP indicators also support the pursuit of actions
and policies that aim to increase demand spending for more prod-
ucts (Jackson, 2009; Roy and Pal, 2009). Labour unions often have
an ambivalent position in terms of environmental policies and partly
see environmental goals as a threat for their livelihood (Räthzel and
Uzzell, 2012).
10�9�5 Non-CO
2
greenhouse gases
Non-CO
2
greenhouse gas emissions are an important contributor to
industry process emissions (note that emissions of CO
2
from calcina-
tion are another important contributor: for barriers to controlling these
emissions by CO
2
capture and storage see Section 10.9.2). Barriers to
preventing or avoiding the release of HFCs, CFCs, HCFCs, PFC, and SF
6
in industry and from its products include: lack of awareness of alterna-
tive refrigerants and lack of guidance as to their use in a given or new
system (UNEP and EC, 2010); lack of certification and control of leak-
age of HFCs from refrigeration (Heijnes etal., 1999); cost of recycled
HFCs in markets where there is direct competition from newly pro-
duced HFCs (Heijnes etal., 1999); lack of information and communica-
tion and education about solvent replacements (Heijnes etal., 1999;
IPCC / TEAP, 2005); cost of adaptation of existing aluminium production
for PFC emission reduction and the absence of lower cost technologies
in such situations (Heijnes etal., 1999); cost of incineration of HFCs
emitted in HCFC production (Heijnes etal., 1999); regulatory barriers
to alternatives to some HFC use in aerosols (IPCC / TEAP, 2005). UNEP
(2010) found that there are technically and economically feasible
substitutes for HCFCs, however, transitional costs remain a barrier for
smaller enterprises.
10.10 Sectoral implications
of transformation
pathways and sustain-
able development
This section assesses transformation pathways for the industry sector
over the 21st century by examining a wide range of published scenar-
ios. This section builds upon scenarios which were collated by Chapter
6 in the WG III AR5 Scenario Database (see Annex II.10), which span
a wide range of possible energy future pathways and which rely on a
wide range of assumptions (e. g., population, economic growth, poli-
cies, and technology development and its acceptance). Against that
background, scenarios for the industrial sector over the 21st century
associated with different atmospheric CO
2
eq concentrations in 2100
are assessed in Section 10.10.1, and corresponding implications for
sustainable development and investment are assessed in Section
10.10.2 from a sector perspective.
10�10�1 Industry transformation pathways
The different possible trajectories for industry final energy demand
(globally and for different regions), emissions, and carbon intensity
under a wide range of CO
2
eq concentrations over the 21st century are
shown in Figure 10.11, Figure 10.12 and Figure 10.13
20
. These scenar-
ios exhibit economic growth in general over the 21st century as well
as growth specifically in the industry sector. Detailed scenarios of the
industry sector extend to 2050 and exhibit increasing material produc-
tion, e. g., iron / steel and cement (Sano etal., 2013; IEA, 2009b; Akashi
et al., 2013). Scenarios generated by general equilibrium models,
which include economic feedbacks (see Table 6.1), implicitly include
changes in material flow due to, for example, changes in prices that
may be driven by a price on carbon; however, these models do not gen-
erally provide detailed subsectoral material flows. Options for reduc-
ing material demand and inter-input substitution elasticities (Roy etal.,
20
This section builds upon emissions scenarios which were collated by Chapter 6
in the WGIII AR5 scenario database (see Section 6.2.2), and compares them to
detailed scenarios for industry referenced in this section. The scenarios included both
baseline and mitigation scenarios. As described in more detail in Section 6.3.2, the
scenarios shown in this section are categorized into bins based on 2100 concentra-
tions: between 430 – 530 ppm CO
2
eq, 530 – 650 ppm CO
2
eq, and >650 ppm CO
2
eq
by 2100. The relation between these bins of emission scenarios and the increase in
global mean temperature since pre-industrial times is reviewed in Section 6.3.2.
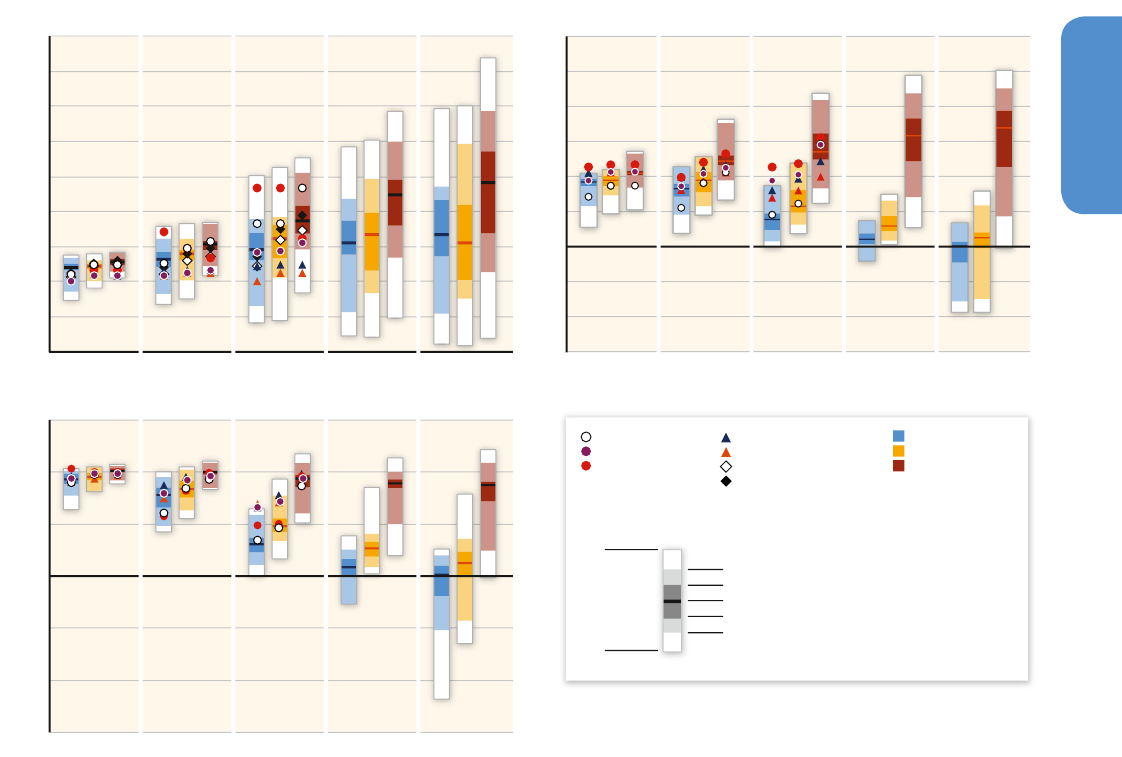
777777
Industry
10
Chapter 10
2006; Sanstad etal., 2006) are used with various assumptions in the
models that can better be characterized as gaps in integrated models
currently in use.
Final energy (FE) demand from industry increases in most scenarios,
as seen in Figure 10.11(a) driven by the growth of the industry sector;
however, FE is weakly dependent on the 2100 CO
2
eq concentration in
the scenarios, and the range of FE demand spanned by the scenarios
becomes wide in the latter half of the century (compare also Figure
6.37). In these scenarios, energy productivity improvements help to
limit the increase in FE. For example, results of the DNE21+ and AIM
models include a 56 % and 114 % increase in steel produced from
2010 to 2050 and a decrease in FE per unit production of 20 – 22 %
and 28 – 34 % (these are the ranges spanned by the reference, 550 and
450 ppm CO
2
eq scenarios for each model), respectively (Akashi etal.,
2013; Sano etal., 2013). While energy efficiency of industry improves
with time, the growth of CCS in some scenarios leads to increases in
FE demand. Growth of final energy for cement production to 2050, for
example, is seen in Figure 10.11(a) due to energy required for CCS in
the cement industry mitigation scenarios (i. e., going from AIM cement
>650 ppm CO
2
eq scenario to the <650 ppm CO
2
eq scenarios).
After 2050, emissions from industry, including indirect emissions
resulting from industrial electricity demand become very low, and in
some scenarios even negative as seen in Figure 10.11(b). The emis-
sion intensity of FE shown in Figure 10.11(c) decreases in most sce-
narios over the century, and decreases more strongly for low CO
2
eq
concentration levels. A decrease in emission intensity is generally the
dominant mechanism for decrease in direct plus indirect emissions in
the <650 ppm CO
2
eq scenarios shown in Figure 10.11. In scenarios
Figure 10�11 | Industry sector scenarios over the 21st century that lead to low (430 – 530 ppm CO
2
eq), medium (530 – 650 ppm CO
2
eq) and high (>650 ppm CO
2
eq) atmospheric
CO
2
eq concentrations in 2100 (see Table 6.3 for definitions of categories). All results are indexed relative to 2010 values for each scenario. Panels show: (a) final energy demand;
(b) direct plus indirect CO
2
eq emissions; (c) emission intensity (emissions from (b) divided by energy from (a)). Indirect emissions are emissions from industrial electricity demand.
The median scenario (horizontal line symbol) surrounded by the darker colour bar (inner quartiles of scenarios) and lighter bar (full range) represent those 120 scenarios assessed
in Chapter 6 with model default technology assumptions which submitted detailed final energy and emissions data for the industrial sector; white bars show the full range of
scenarios including an additional 408, with alternate economic, resource, and technology assumptions (e. g., altering the economic and population growth rates, excluding some
technology options or increasing response of energy efficiency improvement) (Source: WG III AR5 Scenario Database, see Annex II.10). Symbols are provided for selected scenarios
for industry and industry sub-sectors (iron and steel, cement) for the IEA ETP (IEA, 2012d), AIM Enduse (Akashi etal., 2013 and Table A.II.14) and DNE21+ models (Sano etal.,
2013a, b; and Table A.II.14) for their baseline, 550 ppm and 450 ppm CO
2
eq scenarios to 2050.
a)
b)
c)
Relative Change in Emission Intensity [2010=1]
-1.5
-1
-0.5
0
0.5
1
1.5
AIM Industry
AIM Iron/Steel
AIM Cement
120 Scenarios528 Scenarios
430-530 ppm CO
2
eq
530-650 ppm CO
2
eq
>650 ppm CO
2
eq
2010 Values= 1
DNE21+ Iron/Steel
DNE21+ Cement
IEA Low
IEA High
-1.5
-1
-0.5
0
0.5
1
1.5
2
2.5
3
Relative Change in Direct plus Indirect Emissions [2010=1]
2020 2030 2050 2070 2100
2020 2030 2050 2070 2100 2020 2030 2050 2070 2100
0
0.5
1
1.5
2
2.5
3
3.5
4
4.5
Relative Change in Final Energy [2010=1]
Min
75
th
Percentile
Max
Median
25
th
Percentile
Min
Max
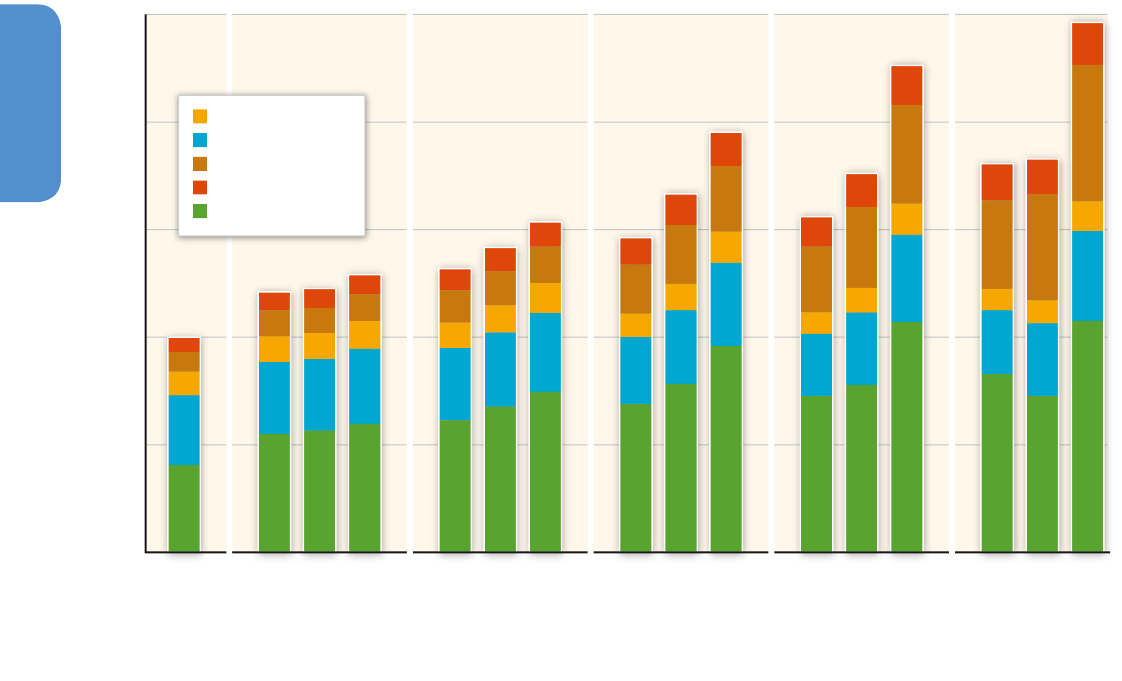
778778
Industry
10
Chapter 10
with strong decreases in emission intensity, this is generally due to
some combination of application of CCS to direct industry emissions,
and a shift to a lower-carbon carrier of energy — for example, a shift
to low- or negative-carbon sources of electricity. Low carbon electric-
ity is assessed in Chapter 7 and bioenergy with CCS — which could in
theory result in net CO
2
removal from the atmosphere — is assessed in
Chapter 11, Section 11.13.
Figure 10.12 shows the regional breakdown of final energy demand
by world regions for different scenarios for the industrial sector. Over
the 21st century, scenarios indicate that the growth of industry FE
demand continues to be greatest in Asia, followed by the Middle East
and Africa, although at a slower growth rate than seen over the last
decade (see Section 10.3). The OECD-1990, Latin America, and Reform-
ing Economies regions are expected to comprise a decreasing fraction
of the world’s industrial FE.
Figure 10.13 shows the projected changes in the shares of industry
sector energy carriers — electricity, solids (primarily coal), and liquids,
gases and hydrogen — from 2010 to 2100 for 120 scenarios (com-
pare also Figure 6.38 with low carbon fuel shares in industrial final
energy). Scenarios for all CO
2
eq concentration levels show an increase
in the share of electricity in 2100 compared to 2010, and generally
show a decrease in the share of liquids / gases / hydrogen. Some of the
<650 ppm CO
2
eq scenarios show an increase in the share of solids in
2100 compared to 2010 and some show a decrease. For the >650 ppm
CO
2
eq scenarios, the change in shares from 2010 to 2100 is generally
smaller than the change in shares for the <650 ppm CO
2
eq scenarios.
A shift towards solids could lead to reduced emissions if the scenarios
include the application of CCS to the emissions from solids. A shift
towards electricity could lead to reduced emissions if the electricity
generation is from low emission energy sources. The strong decrease
in indirect emissions from electricity demand in most 430 – 530 ppm
CO
2
eq scenarios is shown in Figure 6.34 (see Section 6.8), with elec-
tricity emissions already negative in some scenarios by 2050. Each
pathway implies some degree of lock-in of technology types and their
supporting infrastructure, which has important implications; e. g.,
iron / steel in the basic oxygen furnace (BOF) route might follow a path-
way with a higher solid fuel share but with CCS for direct emissions
reduction by the industry. A decarbonized power sector provides the
means to reduce the emission intensity of electricity use in the indus-
trial sector, but barriers, such as a lack of a sufficient carbon price, exist
(IEA, 2009b; Bassi etal., 2009). Barriers to decarbonization of electric-
ity are discussed in more detail in Section 7.10.
Figure 10�12 | Final energy demand from the industry sector shown for the RC5 regions (see AnnexII.2 for definition) over the 21st century. Bars are compiled using information
from 105 of the 120 scenarios assessed in Chapter 6, with model default technology assumptions that submitted detailed final energy and emissions data for the industrial sector.
Bar height corresponds to the median scenario with respect to final energy demand relative to 2010; breakdown fractions correspond to the mean of scenarios. Source: WG III AR5
Scenario Database (see Annex II.10)
210020702050203020202010
0.0
0.5
1.0
1.5
2.0
2.5
Relative Change in Final Energy [2010=1]
430-530 ppm CO
2
eq
530-650 ppm CO
2
eq
>650 ppm CO
2
eq
430-530 ppm CO
2
eq
530-650 ppm CO
2
eq
>650 ppm CO
2
eq
430-530 ppm CO
2
eq
530-650 ppm CO
2
eq
>650 ppm CO
2
eq
430-530 ppm CO
2
eq
530-650 ppm CO
2
eq
>650 ppm CO
2
eq
430-530 ppm CO
2
eq
530-650 ppm CO
2
eq
>650 ppm CO
2
eq
Economies in Transition
Middle East and Africa
Asia
OECD-1990 Countries
Latin America
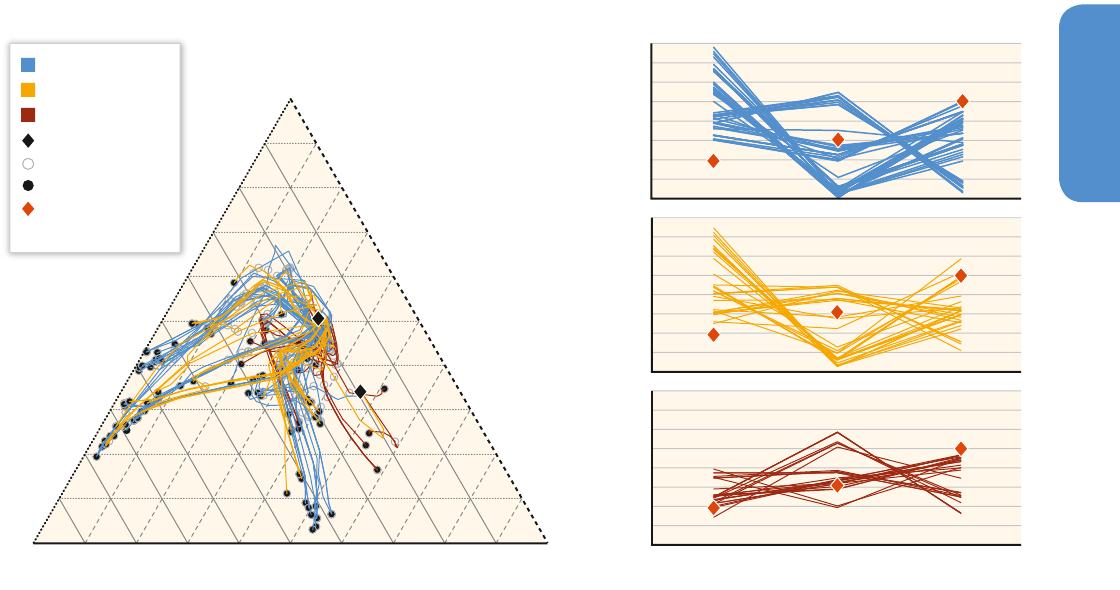
779779
Industry
10
Chapter 10
The IEA (2012d) 2DS scenario (Figure 10.14) shows a primary contri-
bution to mitigation in 2050 from energy efficiency followed by recy-
cling and energy recovery, fuel and feedstock switching, and a strong
application of CCS to direct emissions. Carbon dioxide capture and
storage has limited application before 2030, since CO
2
capture has yet
to be applied at commercial scale in major industries such as cement
or iron / steel and faces various barriers (see Section 10.9). Increased
application of CCS is a precondition for rapid transitions and associ-
ated high levels of technology development and investment as well
as social acceptance. The AIM 450 CO
2
eq scenario (Akashi etal., 2013)
has, for example, a stronger contribution from CCS than the IEA 2DS
from 2030 onward, whereas the DNE21+ 450 ppm CO
2
eq scenario
(Sano etal., 2013) has a weaker contribution as shown in Figure 10.14�
These more detailed industry sector scenarios fall within the range of
the full set of scenarios shown in Figure 10.11�
10�10�2 Transition, sustainable development,
and investment
Transitions in industry will require significant investment and offer
opportunities for sustainable development (e. g., employment). Invest-
ment and development opportunities may be greatest in regions where
industry is growing, particularly because investment in new facilities
provides the opportunity to ‘leapfrog’, or avoid the use of less-efficient
higher emissions technologies present in existing facilities, thus offer-
ing the opportunity for more sustainable development (for discussion
of co-benefits and adverse side-effects when implementing mitigation
options, see Section 10.8).
The wide range of scenarios implies that there will be massive invest-
ments in the industry sector over the 21st century. Mitigation scenarios
generally imply an even greater investment in industry with shifts in
investment focus. For example, due to an intensive use of mitigation
technologies in the IEA’s Blue Scenarios (IEA, 2009d), global invest-
ments in industry are 2 – 2.5 trillion USD higher by the middle of the
century than in the reference case; successfully deploying these tech-
nologies requires not only consideration of competing investment
options, but also removal of barriers and seizing of new opportunities
(see Section 10.9).
The stringent mitigation scenarios discussed in Section 10.10.1 envis-
age emission intensity reductions, in particular due to deployment of
CCS. However, public acceptance of widespread diffusion of CCS might
hinder the realization of such scenarios. Taking the potential resistance
into account, some alternative mitigation scenarios may require reduc-
Figure 10�13 | The ternary panel on the left provides the industry final energy share trajectories across three groups of energy carriers: electricity, solids, and liquids-gases-hydrogen. The
path of each scenario’s trajectory is shown by a single line with symbols at the start in 2010 (the diamond towards the lower right accounts for 3 of 120 trajectories generated from one
model that start in 2010 at a higher solids and lower liquids, gases, hydrogen share than the remainder of the trajectories which start at the upper diamond), in 2050 and at the end in
2100. The lines in the three panels on the right show the shares of energy carriers for each of the trajectories in the ternary diagram in 2100; the diamonds show the average share across
a panel’s models in 2010. Results are shown for those 120 scenarios assessed in Chapter 6, with model default technology assumptions that submitted detailed final energy and emis-
sions data for the industrial sector. Source: WG III AR5 Scenario Database (see Annex II.10)
0%
20%
40%
60%
80%
Electricity Solids Liquids, Gases,
Hydrogen
0%
20%
40%
60%
80%
0%
20%
40%
60%
80%
100%
100%
100%
80%
80%
80%
60%
60%
60%40%
40%
40%
20%
20%
20%
0%
0%
0%
Liquids, Gases,
Hydrogen
Solids
Electricity
Shares of Carriers in Final Energy in Industry
>650 ppm CO
2
eq
530-650 ppm CO
2
eq
430-530 ppm CO
2
eq
Average Share
in 2010
2100
2050
2010
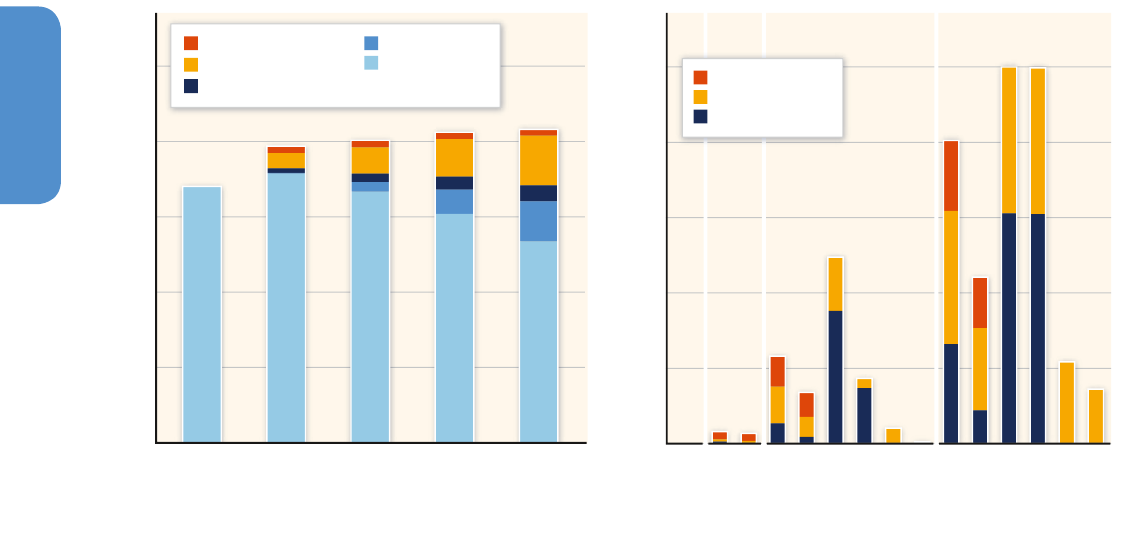
780780
Industry
10
Chapter 10
tion of energy service demand (Kainuma etal., 2013). For the industry
sector, options to reduce material demand or reduce demand for prod-
ucts become important as the latter do not rely on investment chal-
lenges, although they face a different set of barriers and can have high
transaction costs (see Section 10.9).
Industry-related climate change mitigation options vary widely and
may positively or negatively affect employment. Identifying mitiga-
tion options that enhance positive effects (e. g., due to some energy
efficiency improvements) and minimize the negative outcomes is
therefore critical. Some studies have argued that climate change
mitigation policies can lead to unemployment and economic down-
turn (e. g. Babiker and Eckaus, 2007; Chateau etal., 2011) because
such policies can threaten labour demand (e. g. Martinez-Fernandez
et al., 2010) and can be regressive (Timilsina, 2009). Alternatively,
other studies suggest that environmental regulation could stimulate
eco-innovation and investment in more efficient production tech-
niques and result in increased employment (OECD, 2009). Particu-
larly, deployment of efficient energy technologies can lead to higher
employment (Wei etal., 2010; UNIDO, 2011) depending on how redis-
tribution of investment funds takes place within an economy (Sath-
aye and Gupta, 2010).
10.11 Sectoral policies
It is important to note that there is no single policy that can address
the full variety of mitigation options for the industry sector. In addition
to overarching policies (see Chapter 15 in particular, and Chapters 14
and 16), combinations of sectoral policies are needed. The diverse and
relatively even mix of policy types in the industrial sector reflects the
fact that there are numerous barriers to energy and material efficiency
in the sector (see Section 10.9), and that industry is quite heteroge-
neous. In addition, the level of energy efficiency of industrial facili-
ties varies significantly, both within subsectors and within and across
regions. Most countries or regions use a mix of policy instruments,
many of which interact. For example, energy audits for energy-inten-
sive manufacturing firms are regularly combined with voluntary / nego-
tiated agreements and energy management schemes (Anderson and
Newell, 2004; Price and Lu, 2011; Rezessy and Bertoldi, 2011; Sten-
qvist and Nilsson, 2012). Tax exemptions are often combined with an
obligation to conduct energy audits (Tanaka, 2011). Current practice
acknowledges the importance of policy portfolios (e. g., Brown etal.,
2011), as well as the necessity to consider national contexts and unin-
Figure 10�14 | Mitigation of direct CO
2
eq annual emissions in five major industrial sectors: iron / steel, cement, chemicals / petrochemicals, pulp / paper, and aluminium. The left panel
shows results from IEA scenarios (IEA, 2012d), broken down by mitigation option. The tops of the bars show the IEA 4DS low demand scenario, the light blue bars show the 2DS
low demand scenario. The bar layers show the mitigation options that contribute to the emission difference from the 4DS to the 2DS low demand scenario. The right panel shows
mitigation by CCS of direct industrial emissions in IEA, AIM Enduse (Akashi etal., 2013 and Table A.II.14) and DNE21+ (Sano etal., 2013a, b; and Table A.II.14) models. Scenarios
are shown for those subsectors where CCS was reported.
Mitigation Potential [MtCO
2
eq]
Mitigation Potential [MtCO
2
eq]
0
2000
4000
6000
8000
10,000
0
500
1000
1500
2000
2500
ETP2012 2DS low
ETP2012 4DS low
ETP2012 2DS low
ETP2012 4DS low
AIM 450 CO
2
eq
AIM 550 CO
2
eq
DNE21+ 450 CO
2
eq
DNE21+ 550 CO
2
eq
ETP2012 2DS low
ETP2012 4DS low
AIM 450 CO
2
eq
AIM 550 CO
2
eq
DNE21+ 450 CO
2
eq
DNE21+ 550 CO
2
eq
2010 2020 2030 20502040
2010 2020 2030 2050
Chemicals/Petrochemicals
Iron/Steel
Cement
Recycling and Energy Recovery
Energy Efficiency
Fuel and Feedstock Switching
CCS
Total 5 Sectors 2DS low

781781
Industry
10
Chapter 10
tended behaviour of industrial companies. In terms of the latter, carbon
leakage is relevant in the discussion of policies for industry (for a more
in-depth analysis of carbon leakage see Chapter 5).
So far, only a few national governments have evaluated their industry-
specific policy mixes (Reinaud and Goldberg, 2011). For the UK, Barker
etal. (2007) modelled the impact of the UK Climate Change Agree-
ments (CCAs) and estimated that from 2000 to 2010 they would result
in a reduction of total final demand for energy of 2.6 % and a reduc-
tion in CO
2
emissions of 3.3 %. The CCAs established targets for indus-
trial energy-efficiency improvements in energy-intensive industrial sec-
tors; firms that met the targets qualified for a reduction of 80 % on
the Climate Change Levy (CCL) rates on energy use in these sectors.
Barker etal. (2007) also show that the macro-economic effect on the
UK economy from the policies was positive.
In addition to dedicated sector-specific mitigation policies, co-benefits
(see Section 10.8 and this report’s framing chapters) should be consid-
ered. For example, local air quality standards have an indirect effect
on mitigation as they set incentives for substitution of inefficient pro-
duction technologies. Given the priorities of many governments, these
indirect policies have played a relatively more effective role than cli-
mate policies, e. g. in India (Roy, 2010).
10�11�1 Energy efficiency
The use of energy efficiency policy in industry has increased appre-
ciably in many IEA countries as well as major developing countries
since the late 1990s (Roy, 2007; Worrell etal., 2009; Tanaka, 2011;
Halsnæs etal., 2014). A review of 575 policy measures found that,
as of 2010, information programmes are the most prevalent (40 %),
followed by economic instruments (35 %), and measures such as
regulatory approaches and voluntary actions (24 %) (Tanaka, 2011).
Identification of energy efficiency opportunities through energy audits
is the most popular measure, followed by subsidies, regulations for
equipment efficiency, and voluntary / negotiated agreements. A classi-
fication of the various types of policies and their coverage are shown
in Figure 10.15 and experiences in a range of these policies are ana-
lyzed below.
Figure 10�15 | Selected policies for energy efficiency in industry and their coverage (from Tanaka, 2011).
Equipment Process Whole EconomyIndustryEntityFactory/Works
Subsidies
Preferential Loans
Energy Saving Target
Benchmark Target
Energy Management
Control Retrofit/Replace, Mandated Technologies
Benchmark Target
Energy ManagementPerformance Standards
Cooperative
Measures
Data Collection, Auditing, Monitoring
Benchmarking
Promotion
Capacity
Building
Government Procurement
Training, Education
Install Efficient Technology
Partnership, Programme
Identification of
Opportunity
Tradable Allowances
Cap & Trade Scheme
Specific Tax Credit,
Exemption, Deduction
Energy/Carbon Tax
Tax
Agreement
Regulation
Direct
Financial
Incentive
Regulatory
Approaches
Government
Provision of Public
Goods or Services
Information
Programmes
Economic
Instruments
Voluntary
Actions

782782
Industry
10
Chapter 10
Greenhouse gas cap-and-trade and carbon tax schemes that aim to
enhance energy efficiency in energy-intensive industry have been
established in developed countries, particularly in the last decade, and
are recently emerging in some developing countries. The largest exam-
ple of these economic instruments by far is the European Emissions
Trading Scheme (ETS). A more in-depth analysis of these overarching
mechanisms is provided in Chapter 15.
Among regulatory approaches, regulations and energy efficiency stan-
dards for equipment have increased dramatically since 1992 (Tanaka,
2011). With regards to target-driven policies, one of the key initiatives
for realizing the energy intensity reduction goals in China was the Top-
1,000 Energy-Consuming Enterprises programme that required the
establishment of energy-saving targets, energy use reporting systems
and energy conservation plans, adoption of incentives and investments,
and audits and training. The programme resulted in avoided CO
2
emis-
sions of approximately 400 MtCO
2
compared to a business-as-usual
baseline, and has been expanded to include more facilities under the
new Top-10,000 enterprise programme. (Lin etal., 2011; Price etal.,
2011; NDRC, 2011b)
Many firms (in particular SMEs) with rather low energy costs as a
share of their revenue allocate fewer resources to improving energy
efficiency, resulting in a low level of knowledge about the availabil-
ity of energy-efficiency options (Gruber and Brand, 1991; Ghosh and
Roy, 2011). Energy audits help to overcome such information barriers
(Schleich, 2004) and can result in the faster adoption of energy-effi-
cient measures (Fleiter etal., 2012b). The effectiveness of 22 industrial
energy auditing programmes in 15 countries has been reviewed by
Price and Lu (2011), who give recommendations on the success factors
(e. g., use of public databases for benchmarking, use of incentives for
participation in audits).
Energy Management Systems (EnMS) are a collection of business
processes, carried out at plants and firms, designed to encourage
and facilitate systematic improvement in energy efficiency. The typi-
cal elements of EnMS include maintenance checklists, measurement
processes, performance indicators and benchmarks, progress reporting,
and on-site energy managers (McKane, 2007). The adoption of EnMS
schemes in industry can be mandatory, as in Japan, Italy, Turkey, or
Portugal (Tanaka, 2011) or voluntary, and can be guided by standards,
such as the international standard ISO 50001
21
. Backlund etal. and
Thollander and Palm (2012; 2013) argue that improvement in practices
identified by EnMS and audits should be given a greater role in studies
of potential for energy efficiency, as most studies concentrate only on
the technological and economic potentials.
There are a number of case studies that argue for the environmen-
tal and economic effectiveness of EnMS and energy audits (Ander-
son and Newell, 2004; Ogawa etal., 2011; Shen etal., 2012). Some
21
http: / / www. iso. org / iso / home / standards / management-standards / iso50001.htm.
studies report very quick payback for energy efficiency investments
identified during such assessments (Price etal., 2008). For example, a
programme in Germany offering partial subsidies to SMEs for energy
audits was found to have saved energy at a cost to the German gov-
ernment of 2.4 – 5.7 USD
2010
/ tCO
2
(Fleiter etal., 2012b). In another case,
the energy audit program by the Energy Conservation Centre of Japan
(ECCJ), was found to provide positive net benefits for society, defined
as the net benefit to private firms minus the costs to government, of
65 USD
2010
/ tCO
2
(Kimura and Noda, 2010). On the other hand, there
are also studies that report mixed results of some mandatory EMS and
energy audits, where some companies did not achieve any energy effi-
ciency improvements (Kimura and Noda, 2010).
Many countries use benchmarking to compare energy use among
different facilities within a particular sector (Tanaka, 2008; Price and
McKane, 2009). In the Netherlands, for example, the Benchmarking
Covenants encourage companies to compare themselves to others and
to commit to becoming among the most energy-efficient in the world.
However, in many countries high-quality energy efficiency data for
benchmarking is lacking (Saygin etal., 2011b).
Negotiated, or voluntary agreements (VAs), have been found in
various assessments to be effective and cost-efficient (Rezessy and
Bertoldi, 2011). Agreement programmes (e. g., in Ireland, France,
the Netherlands, Denmark, UK, Sweden) were often responsible for
increasing the adoption of energy-efficiency and mitigation technolo-
gies by industries beyond what would have been otherwise adopted
without the programmes (Price et al., 2010; Stenqvist and Nilsson,
2012). Some key factors contributing to successful VAs appear to be
a strong institutional framework, a robust and independent moni-
toring and evaluation system, credible mechanisms for dealing with
non-compliance, capacity-building and — very importantly — accom-
panying measures such as free or subsidized energy audits, manda-
tory energy management plans, technical assistance, information and
financing for implementation (Rezessy and Bertoldi, 2011), as well as
dialogue between industry and government (Yamaguchi, 2012). Fur-
ther discussion and examples of the effectiveness of VAs can be found
in Chapter 15.
10�11�2 Emissions efficiency
Policies directed at increasing energy efficiency (discussed above) most
often result in reduction of CO
2
intensity as well, in particular when the
aim is to make the policy part of a wider policy mix addressing multiple
policy objectives. Examples of emissions efficiency policy strategies
include support schemes and fiscal incentives for fuel switching, R&D
programmes for CCS, and inclusion of reduction of non-CO
2
gases in
voluntary agreements (e. g., Japanese voluntary action plan Keidanren,
see Chapter 15).
Regarding gases with a relatively high GWP such as HFCs, PFCs,
and SF
6
, successful policy examples exist for capture in the power

783783
Industry
10
Chapter 10
sector (e. g., Japan; Nishimura and Sugiyama, 2008), but there is
not much experience in the industry sector. The CDM has driven
abatement of the industrial gases HFC-23 and N
2
O in developing
countries because of monetary incentives (Michaelowa and Buen,
2012)
22
. Including high GWP emissions within the same cap and
trade programme (and therefore prices) as energy-related emissions
may draw opposition from the industries concerned, so special pro-
grammes for these gases could be a better alternative (Hall, 2007).
Another option suggested is to charge an upfront fee that would
then be refunded when the gases are later captured and destroyed
(Hall, 2007).
10�11�3 Material efficiency
Policy instruments for material or resource use efficiency in general
are only just starting to be promoted for mitigation of GHG emissions
in industry; consequently, effective communication to industry on the
need and potential for an integrated approach is still lacking (Letten-
meier etal., 2009). Similarly, waste management policies are still not
driven by climate concerns, although the potential for GHG emission
reductions through waste management is increasingly recognized
and accounted for (see Section 10.14, e. g., Worrell and van Sluisveld,
2013). Several economic instruments (e. g., taxes and charges) related
to waste disposal have been shown to be effective in preventing waste,
although they do not necessarily lead to improved design measures
being taken further upstream (Hogg etal., 2011).
A number of policy packages are directly and indirectly aimed
at reducing material input per unit of product or unit of service
demand. Some examples are the European Action Plan on Sustain-
able Consumption and Production (SCP) and Sustainable Industry
(EC, 2008a), the EU’s resource efficiency strategy and roadmap (EC,
2011, 2012b), and Germany’s resource efficiency programme, Prog-
Ress (BMU, 2012). SCP policies
23
include both voluntary and regula-
tory instruments, such as the EU Eco-design Directive, as well as the
Green Public Procurement policies. Aside from setting a framework
and long-term goals for future legislation and setting up networks
and knowledge bases, these packages include few specific policies
and, most importantly, do not set quantitative targets nor explic-
itly address the link between material efficiency and GHG emission
reductions.
Some single policies (as opposed to policy packages) related to mate-
rial efficiency do include an assessment of their impacts in terms of
GHG emissions. For example, the UK’s National Industrial Symbiosis
Programme (NISP) brokers the exchange of resources between com-
panies (for an explanation of industrial symbiosis, see Section 10.5).
22
For a more in-depth analysis of CDM as a policy instrument, see Chapter 13,
Sections 13.7.2 and 13.13.1.2.
23
SCP policies are also covered in Chapter 4 (Sustainable Development and Equity,
Section 4.4.3.1 SCP policies and programmes)
An assessment of the savings through the NISP estimated that over 6
MtCO
2
eq were saved over the first five years (Laybourn and Morrissey,
2009). The PIUS-Check initiative by the German state of North Rhine-
Westphalia (NRW) offers audits to companies where the relevant
material flows are analyzed and recommendations for improvements
are made. These PIUS-checks have been particularly successful in metal
processing industries, and it is estimated that they have saved 20 thou-
sand tonnes of CO
2
(EC, 2009).
In the Asia and Pacific region there are a number of region-specific
policy instruments for climate change mitigation through SCP, such
as the China Refrigerator Project, which realized emissions reductions
of about 11 MtCO
2
between 1999 and 2005 by combining several
practices including sustainable product design, technological innova-
tion, eco-labelling, and awareness raising of consumers and retailers
(SWITCH-Asia Network Facility, 2009). However, there is still a lack of
solid ex-post assessments on SCP policy impacts.
Besides industry-specific policies there are policies with a different sec-
tor focus that influence industrial activity indirectly, by reducing the
need for products (e. g., car pooling incentive schemes can lead to
the production of less cars) or industrial materials (e. g., vehicle fuel
economy targets can incentivize the design of lighter vehicles). A stra-
tegic approach in order to reflect the economy-wide resource use and
the global risks may consist of national accounting systems beyond
GDP
24
(Jackson, 2009; Roy and Pal, 2009; Arrow et al., 2010; GEA,
2012), including systems to account for increasing resource productiv-
ity (OECD, 2008; Bringezu and Bleischwitz, 2009) and of new inter-
national initiatives to spur systemic eco-innovations in key areas such
as cement and steel production, light-weight cars, resource efficient
construction, and reducing food waste.
10.12 Gaps in knowledge
and data
The key challenge for making an assessment of the industry sector is
the diversity in practices, which results in uncertainty, lack of com-
parability, incompleteness, and quality of data available in the pub-
lic domain on process and technology specific energy use and costs.
This diversity makes assessment of mitigation potential with high con-
fidence at global and regional scales extremely difficult. Sector data
are generally collected by industry / trade associations (international
or national), are highly aggregated, and generally give little informa-
tion about individual processes. The enormous variety of processes
and technologies adds to the complexity of assessment (Tanaka, 2008,
2012; Siitonen etal., 2010).
24
For example, the EU’s “Beyond GDP Initiative”: http: / / www. beyond-gdp. eu /

784784
Industry
10
Chapter 10
Other major gaps in knowledge identified are:
• A systematic approach and underlying methodologies to avoid
double counting due to the many different ways of attributing
emissions (10.1).
• An in-depth assessment of mitigation potential and associated
costs achievable particularly through material efficiency and
demand-side options (10.4).
• Analysis of climate change impacts on industry and industry-spe-
cific mitigation options, as well as options for adaptation (10.6).
• Comprehensive information on sector and sub-sector specific
option-based mitigation potential and associated costs based on a
comparable methodology and transparent assumptions (10.7).
• Effect on long-term scenarios of demand reduction strategies
through an improved modelling of material flows, inclusion of
regional producer behaviour model parameters in integrated mod-
els (10.10).
• Understanding of the net impacts of different types of policies,
the mitigation potential of linked policies e. g., resource effi-
ciency / energy efficiency policies, as well as policy as drivers of car-
bon leakage effects (10.11).
10.13 Frequently Asked
Questions
FAQ 10�1 How much does the industry sector
contribute to GHG emissions?
Global industrial GHG emissions accounted for just over 30 % of
global GHG emissions in 2010. Global industry and waste / wastewater
GHG emissions grew from 10 GtCO
2
eq in 1990 to 13 GtCO
2
eq in 2005
to 15 GtCO
2
eq in 2010. Over half (52 %) of global direct GHG emis-
sions from industry and waste / wastewater are from the ASIA region,
followed by OECD-1990 (25 %), EIT (9 %), MAF (8 %), and LAM (6 %).
GHG emissions from industry grew at an average annual rate of 3.5 %
globally between 2005 and 2010. This included 7 % average annual
growth in the ASIA region, followed by MAF (4.4 %) and LAM (2 %),
and the EIT countries (0.1 %), but declined in the OECD-1990 coun-
tries (– 1.1 %). (10.3)
In 2010, industrial GHG emissions were comprised of direct energy-
related CO
2
emissions of 5.3 GtCO
2
eq, 5.2 GtCO
2
eq indirect CO
2
emis-
sions from production of electricity and heat for industry, process CO
2
emissions of 2.6 GtCO
2
eq, non-CO
2
GHG emissions of 0.9 GtCO
2
eq,
and waste / wastewater emissions of 1.4 GtCO
2
eq. (10.3)
2010 direct and indirect emissions were dominated by CO
2
(85.1 %)
followed by CH
4
(8.6 %), HFC (3.5 %), N
2
O (2.0 %), PFC (0.5 %) and SF
6
(0.4 %) emissions. Between 1990 and 2010, N
2
O emissions from adipic
acid and nitric acid production and PFC emissions from aluminium pro-
duction decreased while HFC-23 emissions from HCFC-22 production
increased. In the period 1990 – 2005, fluorinated gases (F-gases) were
the most important non-CO
2
GHG source in manufacturing industry.
(10.3)
FAQ 10�2 What are the main mitigation options
in the industry sector and what is the
potential for reducing GHG emissions?
Most industry sector scenarios indicate that demand for materials
(steel, cement, etc.) will increase by between 45 % to 60 % by 2050
relative to 2010 production levels. To achieve an absolute reduc-
tion in emissions from the industry sector will require a broad set
of mitigation options going beyond current practices. Options for
mitigation of GHG emissions from industry fall into the following
categories: energy efficiency, emissions efficiency (including fuel and
feedstock switching, carbon dioxide capture and storage), material
efficiency (for example through reduced yield losses in production),
re-use of materials and recycling of products, more intensive and
longer use of products, and reduced demand for product services.
(10.4, 10.10)
In the last two to three decades there have been strong improve-
ments in energy and process efficiency in industry, driven by the rela-
tively high share of energy costs. Many options for energy efficiency
improvement still remain, and there is still potential to reduce the gap
between actual energy use and the best practice in many industries.
Based on broad deployment of best available technologies, the GHG
emissions intensity of the sector could be reduced through energy effi-
ciency by approximately 25 %. Through innovation, additional reduc-
tions of approximately 20 % in energy intensity may potentially be
realized before approaching technological limits in some energy inten-
sive industries. (10.4, 10.7)
In addition to energy efficiency, material efficiency — using less new
material to provide the same final service — is an important and prom-
ising option for GHG reductions that has had little attention to date.
Long-term step-change options, including a shift to low carbon elec-
tricity or radical product innovations (e. g., alternatives to cement), may
have the potential to contribute to significant mitigation in the future.
(10.4)
FAQ 10�3 How will the level of product demand,
interactions with other sectors, and
collaboration within the industry sector
affect emissions from industry?
The level of demand for new and replacement products has a sig-
nificant effect on the activity level and resulting GHG emissions in
the industry sector. Extending product life and using products more

785785
Industry
10
Chapter 10
intensively could contribute to reduction of product demand without
reducing the service. However, assessment of such strategies needs
a careful net-balance (including calculation of energy demand in the
production process and associated GHG emissions). Absolute emis-
sion reductions can also come about through changes in lifestyle and
their corresponding demand levels, be it directly (e. g., for food, tex-
tiles) or indirectly (e. g., for product / service demand related to tour-
ism). (10.4)
Mitigation strategies in other sectors may lead to increased emissions
in industry if they require enhanced use of energy intensive materials
(e. g., higher production of solar cells (PV) and insulation materials for
buildings). Moreover, collaborative interactions within the industry sec-
tor and between the industry sector and other economic sectors have
significant potential for mitigation (e. g., heat cascading). In addition,
inter-sectoral cooperation, i. e., collaborative interactions among indus-
tries in industrial parks or with regional eco-industrial networks, can
contribute to mitigation. (10.5)
FAQ 10�4 What are the barriers to reducing emis-
sions in industry and how can these be
overcome? Are there any co-benefits
associated with mitigation actions in
industry?
Implementation of mitigation measures in industry faces a variety of
barriers. Typical examples include: the expectation of high return on
investment (short payback period); high capital costs and long proj-
ect development times for some measures; lack of access to capital
for energy efficiency improvements and feedstock / fuel change; fair
market value for cogenerated electricity to the grid; and costs / lack
of awareness of need for control of HFC leakage. In addition, busi-
nesses today are mainly rewarded for growing sales volumes and
can prefer process innovation over product innovation. Existing
national accounting systems based on GDP indicators also support
the pursuit of actions and policies that aim to increase demand for
products and do not trigger product demand reduction strategies.
(10.9)
Addressing the causes of investment risk, and better provisioning of
user demand in the pursuit of human well-being could enable the
reduction of industry emissions. Improvements in technologies, effi-
cient sector specific policies (e. g., economic instruments, regulatory
approaches and voluntary agreements), and information and energy
management programmes could all contribute to overcome tech-
nological, financial, institutional, legal, and cultural barriers. (10.9,
10.11)
Implementation of mitigation measures in industries and related poli-
cies might gain momentum if co-benefits (10.8) are considered along
with direct economic costs and benefits (10.7). Mitigation actions can
improve cost competitiveness, lead to new market opportunities, and
enhance corporate reputation through indirect social and environmen-
tal benefits at the local level. Associated positive health effects can
enhance public acceptance. Mitigation can also lead to job creation
and wider environmental gains such as reduced air and water pollu-
tion and reduced extraction of raw materials which in turn leads to
reduced GHG emissions. (10.8)
10.14 Appendix: Waste
10�14�1 Introduction
Waste generation and reuse is an integral part of human activity.
Figure 10.2 and Section 10.4 have shown how industries enhance
resource use efficiency through recycling or reuse before discarding
resources to landfills, which follows the waste hierarchy shown in Fig-
ure 10.16� Several mitigation options exist at the pre-consumer stage.
Most important is reduction in waste during production processes.
With regard to post-consumer waste, associated GHG emissions heav-
ily depend on how waste is treated.
This section provides a summary of knowledge on current emissions
from wastes generated from various economic activities (focusing on
solid waste and wastewater) and discusses the mitigation options
to reduce emissions and recover materials and energy from solid
wastes.
10�14�2 Emissions trends
10�14�2�1 Solid waste disposal
The ‘hierarchy of waste management’ as shown in Figure 10.16, places
waste reduction at the top, followed by re-use, recycling, energy recov-
ery (including anaerobic digestion), treatment without energy recov-
ery (including incineration and composting) and four types of land-
fills ranging from modern sanitary landfills that treat liquid effluents
and also attempt to capture and use the generated biogas, through
to traditional non-sanitary landfills (waste designated sites that lack
controlled measures) and open burning. Finally, at the bottom of the
pyramid are crude disposal methods in the form of waste dumps
(designated or non-designated waste disposal sites without any kind
of treatment) that are still dominant in many parts of the world. The
hierarchy shown in Figure 10.16 provides general guidance. However,
lifecycle assessment of the overall impacts of a waste management
strategy for specific waste composition and local circumstances may
change the priority order (EC, 2008b).
Municipal solid wastes (MSW) are the most visible and trouble-
some residues of human society. The total amount of MSW gener-

786786
Industry
10
Chapter 10
ated globally has been estimated at about 1.5 Gt per year (Theme-
lis, 2007) and it is expected to increase to approximately 2.2 Gt by
2025 (Hoornweg and Bhada-Tata, 2012). Of the current amount,
approximately 300 Mt are recycled, 200 Mt are treated with energy
recovery, another 200 Mt are disposed in sanitary landfills, and the
remaining 800 Mt are discarded in non-sanitary landfills or dumps.
Thus, much of the recoverable matter in MSW is dispersed through
mixing with other materials and exposure to reactive environmental
conditions. The implications for GHG and other emissions are related
not only to the direct emissions from waste management, but also
to the emissions from production of materials to replace those lost
in the waste.
Figure 10.17 presents global emissions from waste from 1970 until
2010 based on EDGAR version 4.2. Methane emissions from solid
waste disposal almost doubled between 1970 and 2010. The drop in
CH
4
emissions from solid waste disposal sites (SWDS) starting around
1990 is most likely related to the decrease in such emissions in Europe
and the United States. However, it is important to note that the First
Order Decay (FOD) model used in estimating emissions from solid
waste disposal sites in the EDGAR database does not account for cli-
mate and soil micro-climate conditions like California Landfill Methane
Inventory Model (CALMIM) (see Spokas etal., 2011; Spokas and Bog-
ner, 2011; Bogner etal., 2011).
Global waste emissions per unit of GDP decreased 27 % from 1970 to
1990 and 34 % from 1990 to 2010, with a decrease of 48 % for the
entire period (1970 – 2010). Global waste emissions per capita
increased 10 % between 1970 and 1990, decreased 5 % from 1990 to
2010, with a net increase of 5 % for the entire period 1970 – 2010 (Fig-
ure 10.17). Several reasons may explain these trends: GHG emissions
from waste in EU, mainly from solid waste disposal on land and waste-
water handling decreased by 19.4 % in the decade 2000 – 2009; the
decline is notable when compared to total EU27 emissions over the
same period, which decreased by 9.3 %
25
. Energy production from
waste in the EU in 2009 was more than double that generated in 2000,
while biogas has experienced a 270 % increase in the same period.
With the introduction of the Landfill Directive 10 1999 / 31 / EC, the EU
has established a powerful tool to reduce the amount of biodegrad-
able municipal waste disposed in landfills (Blodgett and Parker, 2010).
Moreover, methane emissions from landfills in the United States
25
Eurostat 2013, available at http: / / epp.eurostat.ec.europa.eu / statistics_
explained / index.php / Climate_change_-_driving_forces.
Figure 10�16 | The hierarchy of waste management. The priority order and colour coding is based on the five main groups of waste hierarchy classification (Prevention; Preparing
for Re-Use; Recycling; Other Recovery e. g., Energy Recovery; and Disposal) outlined by the European Commission (EC, 2008b).
Waste Dump
Unsanitary Landfill/Open Burning
Landfill with Methane Escape
Landfill with Methane Flared
Treatment without Energy Recovery
Landfill with Methane Recovery and Use
Energy Recovery
Recycling
Re-Use
Waste Avoidance and Reduction
Disposal
Other Recovery
Recycling
Preparing for Re-use
Prevention
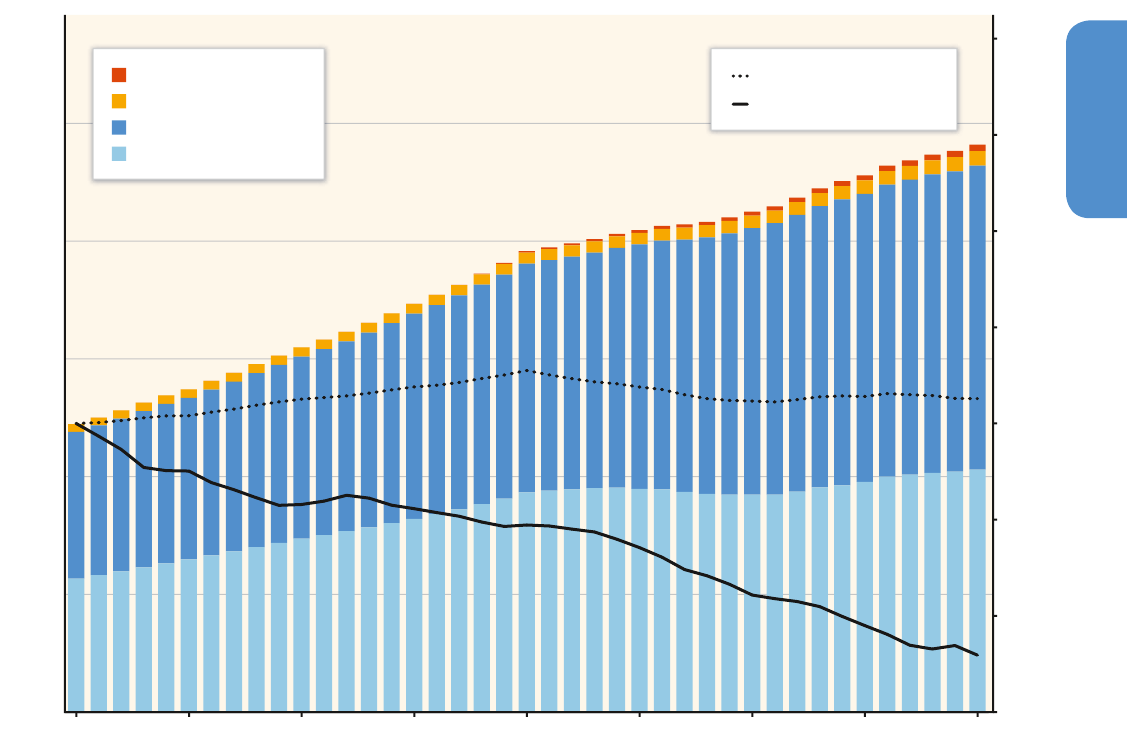
787787
Industry
10
Chapter 10
decreased by approximately 27 % from 1990 to 2010. This net emis-
sions decrease can be attributed to many factors, including changes in
waste composition, an increase in the amount of landfill gas collected
and combusted, a higher frequency of composting, and increased rates
of recovery of degradable materials for recycling, e. g., paper and
paperboard (EPA, 2012b).
China’s GHG emissions in the waste sector increased rapidly in the
1981 to 2009 period, along with the growing scale of waste genera-
tion by industries as well as households in urban and rural areas (Qu
and Yang, 2011). A 79 % increase in landfill methane emissions was
estimated between 1990 (2.4 Mt) and 2000 (4.4 Mt) due to changes
in both the amount and composition of municipal waste gener-
ated (Streets etal., 2001) and emission of China’s waste sector will
peak at 33.2 MtCO
2
eq in 2024 (Qu and Yang, 2011). In India (INCCA,
2010), the waste sector contributed 3 % of total national CO
2
emis-
sion equivalent of which 22 % is from municipal solid waste and the
rest are from domestic wastewater (40 %) and industrial wastewater
(38 %). Domestic wastewater is the dominant source of CH
4
in India.
The decrease of GHG emissions in the waste sector in the EU and the
United States from 1990 to 2009 has not been enough to compensate
for the increase of emissions in other regions resulting in an overall
increasing trend of total waste-related GHG emissions in that period.
10�14�2�2 Wastewater
Methane and nitrous oxide emissions from wastewater steadily
increased during the last decades reaching 667 and 108 MtCO
2
eq in
2010, respectively. Methane emissions from domestic / commercial
and industrial categories are responsible for 86 % of wastewater GHG
emissions during the period 1970 – 2010, while the domestic / commer-
cial sector was responsible for approximately 80 % of the methane
emissions from wastewater category.
Figure 10�17 | Global waste emissions MtCO
2
eq / year, global waste emissions per GDP and global waste emissions per capita referred to 1970 values. Based on JRC / PBL (2013),
see AnnexII.9.
20102005199519851975 2000199019801970
GHG Emissions [MtCO
2
eq/yr]
Waste Emissions Index [1970=1]
0.4
0.6
0.8
1.0
1.8
1.6
1.4
1.2
0
300
600
900
1200
1500
Other Waste Handling
Waste Incineration
Wastewater Handling
Solid Waste Disposal on Land
Waste Emissions per Capita
Waste Emissions / GDP Total

788788
Industry
10
Chapter 10
10�14�3 Technological options for mitigation of
emissions from waste
10�14�3�1 Pre-consumer waste
Waste reduction
Pre-consumer (or post-industrial) waste is the material diverted from
the waste stream during a manufacturing process that does not reach
the end user. This does not include the reutilization of materials gener-
ated in a process that can be re-used as a substitute for raw materials
(10.4) without being modified in any way. Waste reduction at the pre-
consumer stage can be achieved by optimizing the use of raw materi-
als, e. g., arranging the pattern of pieces to be cut on a length of fabric
or metal sheet enable maximum utilization of material with minimum
of waste.
Recycling and reuse
Material substitution through waste generated from an industrial
process or manufacturing chain can lead to reduction in total energy
requirements (10.4) and hence emissions. Section 10.4 discusses
options for recycling and reuse in the manufacturing industries. The
same section also discusses the use of municipal solid waste as
energy source or feedstock, e. g., for the cement industry, as well as
the possible use of industrial waste for mineralization approaches for
CCS.
10�14�3�2 Post-consumer waste
Pre-consumer (or post-industrial) waste is the material resulting from
a manufacturing process, which joins the waste stream and does not
reach the end use. The top priority of the post-consumer waste man-
agement is reduction followed by re-use and recycling.
Waste reduction
To a certain extent, the amount of post-consumer waste is related to
lifestyle. On a per capita basis, Japan and the EU have about 60 % of
the US waste generation rates based significantly on different con-
sumer behavior and regulations. Globally, a visionary goal of ‘zero
waste’ assists countries in designing waste reduction strategies, tech-
nologies, and practices, keeping in mind other resource availability like
land. Home composting has been successfully used in some regions,
which reduces municipal waste generation rates (Favoino and Hogg,
2008; Andersen etal., 2010).
Non-technological behavioural strategies aim to avoid or reduce
waste, for instance by decoupling waste generation from economic
activity levels such as GDP (Mazzanti and Zoboli, 2008). In addition,
strategies are in place that aim to enhance the use of materials and
products that are easy to recycle, reuse, and recover (Sections 10.4,
10.11) in close proximity facilities.
Post-consumer waste can be linked with pre-consumer material
through the principle of Extended Producer Responsibility in order
to divert the waste going to landfills. This principle or policy is the
explicit attribution of responsibility to the waste-generating par-
ties, preferably already in the pre-consumer phase. In Germany, for
example, the principle of producer responsibility for their products in
the post-consuming phase is made concrete by the issuing of regula-
tions (de Jong, 1997). Sustainable consumption and production and
its influence on waste minimization are discussed also in Section
10.11.
Recycling / reuse
If reduction of post-consumer waste cannot be achieved, reuse and
recycling is the next priority in order to reduce the amount of waste
produced and to divert it from disposal (Valerio, 2010). Recycling of
post-consumer waste can be achieved with high economic value to
protect the environment and conserve the natural resources (El-Hag-
gar, 2010). Section 10.4 discusses this in the context of reuse in indus-
tries.
As cities have become hotspots of material flows and stock density
(Baccini and Brunner, 2012, p. 31) (see Chapter 12), MSW can be
seen as a material reservoir that can be mined. This can be done
not only through current recycling and / or energy recovery processes
(10.4), but also by properly depositing and concentrating substances
(e. g., metals, paper, plastic) in order to make their recuperation tech-
nically and economically viable in the future. The current amount
of materials accumulated mainly in old / mature settlements, for the
most part located in developed countries (Graedel, 2010), exceeds
the amount of waste currently produced (Baccini and Brunner, 2012,
p.50).
With a high degree of agreement, it has been suggested that urban
mining (as a contribution towards a zero waste scenario) could
reduce important energy inputs of material future demands in con-
trast to domestically produced and, even more important for some
countries, imported materials, while contributing to future material
accessibility.
Landfilling and methane capture from landfills
It has been estimated (Themelis and Ulloa, 2007) that annually about
50 Mt of methane is generated in global landfills, 6 Mt of which are
captured at sanitary landfills. Sanitary landfills that are equipped to
capture methane at best capture 50 % of the methane generated;
however, significantly higher collection efficiencies have been dem-
onstrated at certain well designed and operated landfills with final
caps / covers of up to 95 %.
The capital investment needed to build a sanitary landfill is less than
30 % of a waste-to-energy (WTE) plant of the same daily capacity.
However, because of the higher production of electricity (average of
0.55 MWh of electricity per metric tonne of MSW in the U. S. vs 0.1

789789
Industry
10
Chapter 10
MWh for a sanitary landfill), a WTE plant is usually more economic
over its lifetime of 30 years or more (Themelis and Ulloa, 2007). In
other regions, however, the production of methane from landfills may
be lower due to the reduction of biodegradable fraction entering the
landfills or operating costs may be lower. Therefore, economics of both
options may be different in such cases.
Landfill aeration
Landfill aeration can be considered as an effective method for GHG
emissions reduction in the future (Ritzkowski and Stegmann, 2010). In
situ aeration is one technology that introduces ambient air into MSW
landfills to enhance biological processes and to inhibit methane pro-
duction (Chai etal., 2013). Ambient air is introduced in the landfill via
a system of gas wells, which results in accelerated aerobic stabilization
of deposited waste. The resulting gas is collected and treated (Heyer
etal., 2005; Prantl etal., 2006). Biological stabilization of the waste
using in-situ aeration provides the possibility to reduce both the actual
emissions and the emission potential of the waste material (Prantl
etal., 2006).
Landfill aeration, which is not widely applied yet, is a promising tech-
nology for treating the residual methane from landfills utilizing land-
fill gas for energy when energy recovery becomes economically unat-
tractive (Heyer etal., 2005; Ritzkowski etal., 2006; Rich etal., 2008).
In the absence of mandatory environmental regulations that require
the collection and flaring of landfill gas, landfill aeration might be
applied to closed landfills or landfill cells without prior gas collection
and disposal or utilization. For an in situ aerated landfill in north-
ern Germany, for example, landfill aeration achieved a reduction in
methane emissions by 83 % to 95 % under strictly controlled condi-
tions (Ritzkowski and Stegmann, 2010). Pinjing etal. (2011) show
that landfill aeration is associated with increased N
2
O emissions.
Composting and anaerobic digestion
Municipal solid waste (MSW) contains ‘green’ wastes such as leaves,
grass, and other garden and park residues, and also food wastes.
Generally, green wastes are source-separated and composted aer-
obically (i. e., in presence of oxygen) in windrows. However, food
wastes contain meat and other substances that, when composted
in windrows, emit unpleasant odours. Therefore, food wastes need
to be anaerobically digested in closed biochemical reactors. The
methane generated in these reactors can be used in a gas engine to
produce electricity, or for heating purposes. Source separation, col-
lection, and anaerobic digestion of food wastes are costly and so far
have been applied to small quantities of food wastes in a few cit-
ies (e. g., Barcelona, Toronto, Vienna; Arsova, 2010), except in cases
where some food wastes are co-digested with agricultural residues.
In contrast, windrow composting is practiced widely; for example,
62 %of the U. S. green wastes (22.7 million tonnes) were compos-
tedaerobically in 2006 (Arsova etal., 2008), while only 0.68 million
tonnes of food wastes (i. e., 2.2 % of total food wastes; EPA, 2006a)
were recovered.
Energy recovery from waste
With the exception of metals, glass, and other inorganic materials,
MSW consists of biogenic and petrochemical compounds made of car-
bon and hydrogen atoms.
The energy contained in solid wastes can be recovered by means of
several thermal treatment technologies including combustion of as-
received solid wastes on a moving grate, shredding of MSW and com-
bustion on a grate or fluidized bed, mechanical-biological treatment
(MBT) of MSW into compost, refuse-derived fuel (RDF) or biogas from
anaerobic digestion, partial combustion and gasification to a synthetic
gas that is then combusted in a second chamber, and pyrolysis of
source-separated plastic wastes to a synthetic oil. At this time, an esti-
mated 90 % of the world’s WTE capacity (i. e., about 180 Mt per year) is
based on combustion of as-received MSW on a moving grate; the same
is true of the nearly 120 new WTE plants that were built worldwide in
the period of 2000 – 2007 (Themelis, 2007).
WTE plants require sophisticated Air Pollution Control (APC) sys-
tems that constitute a large part of the plant. In the last twenty
years, because of the elaborate and costly APC systems, modern WTE
plants have become one of the cleanest high temperature industrial
processes (Nzihou et al., 2012). Source separation of high moisture
organic wastes from the MSW increases the thermal efficiency of WTE
plants.
Most of the mitigation options mentioned above require expenditures
and, therefore, are more prevalent in developed countries with higher
GDP levels. A notable exception to this general rule is China, where
government policy has encouraged the construction of over 100 WTE
plants during the first decade of the 21st century (Dong, 2011). Figure
10.18 shows the share of different management practices concern-
ing the MSW generated in several nations (Themelis and Bourtsalas,
2013). China, with 18 % WTE and less than 3 % recycling, is at the level
of Slovakia.
The average chemical energy stored in MSW is about 10 MJ / kg (lower
heating value, LHV), corresponding to about 2.8 MWh per tonne. The
average net thermal efficiency of U. S. WTE plants (i. e., electricity to
the grid) is 20 %, which corresponds to 0.56 MWh per tonne of MSW.
However, additional energy can be recovered from the exhaust steam
of the turbine generator. For example, some plants in Denmark and
elsewhere recover 0.5 MWh of electricity plus 1 MWh of district heat-
ing. A full discussion of the R1 factor, used in the EU for defining over-
all thermal efficiency of a WTE plant can be found in Themelis etal.
(2013).
Studies of the biogenic and fossil-based carbon based on C14-C12
measurements on stack gas of nearly forty WTE plants in the United
States have shown that about 65 % of the carbon content of MSW
is biogenic (i. e., from paper, food wastes, wood, etc.) (Themelis etal.,
2013) .
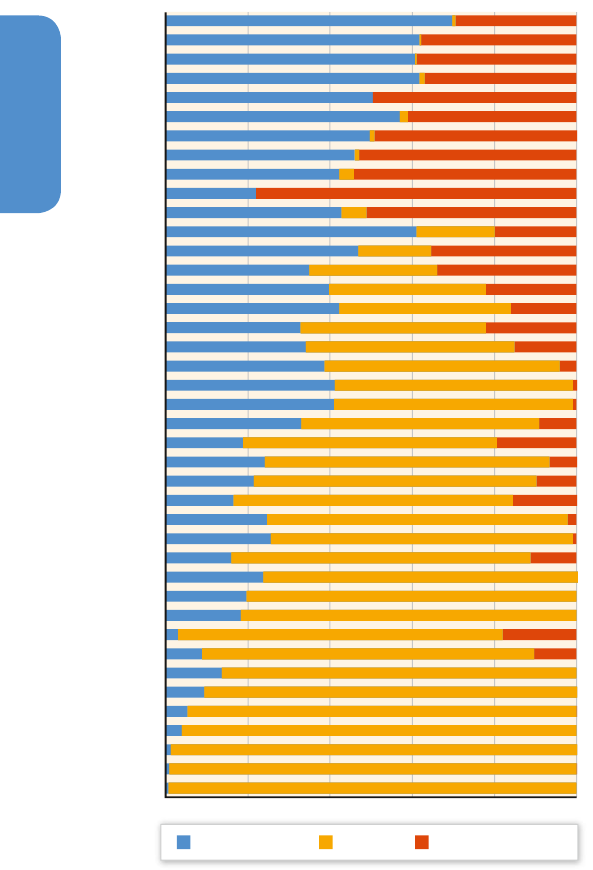
790790
Industry
10
Chapter 10
10�14�3�3 Wastewater
As a preventive measure, primary and secondary aerobic and land treat-
ment help reduce CH
4
emissions during wastewater treatment. Alter-
natively, CH
4
emissions from wastewater, including sludge treatment
under anaerobic conditions, can be captured and used as an energy
source (Karakurt etal., 2012). Nitrous oxide is mainly released during
biological nitrogen removal in wastewater treatment plants, primarily
in aerated zones thus improved plant design and operational strategies
(availability of dissolved oxygen, chemical oxygen demand and nitro-
gen ratio COD / N) have to be achieved in order to avoid the stripping of
nitrous emissions (Kampschreur etal., 2009; Law etal., 2012).
Most developed countries rely on centralized aerobic / anaerobic waste-
water treatment plants to handle their municipal wastewater. In devel-
oping countries, there is little or no collection and treatment of waste-
water, anaerobic systems such as latrines, open sewers, or lagoons
(Karakurt etal., 2012). Approximately 47 % of wastewater produced
in the domestic and manufacturing sectors is untreated, particularly
in South and Southeast Asia, but also in Northern Africa as well as
Central and South America (Flörke etal., 2013). Wastewater treatment
plants are highly capital-intensive but inflexible to adapt to growing
demands, especially in rapidly expanding cities. Therefore, innovations
related to decentralized wastewater infrastructure are becoming prom-
ising. These innovations include satellite systems, actions to achieve
reduced wastewater flows, recovery and utilization of the energy con-
tent present in wastewater, recovery of nutrients, and the production
of water for recycling, which will be needed to address the impacts of
population growth and climate change (Larsen etal., 2013).
Industrial wastewater from the food industry usually has both high
biochemical and chemical oxygen demand and suspended solid con-
centrations of organic origin that induce a higher GHG production
per volume of wastewater treated compared to municipal wastewa-
ter treatment. The characteristics of the wastewater and the off-site
GHG emissions have a significant impact on the total GHG emis-
sions attributed to the wastewater treatment plants (Bani Shahabadi
etal., 2009). For example, in the food processing industry with aero-
bic / anaerobic / hybrid process, the biological processes in the treat-
ment plant made for the highest contribution to GHG emissions in the
aerobic treatment system, while off-site emissions are mainly due to
material usage and represent the highest emissions in anaerobic and
hybrid treatment systems. Industrial cluster development in develop-
ing countries like China and India are enhancing wastewater treatment
and recycling (see also Section 10.5).
Regional variation in wastewater quality matters in terms of perfor-
mance of technological options. Conventional systems may be tech-
nologically inadequate to handle the locally produced sewage in arid
areas like the Middle East. In these areas, domestic wastewater are up
to five times more concentrated in the amount of biochemical and / or
chemical oxygen demand per volume of sewage in comparison with
United States and Europe, causing large amounts of sludge production.
In these cases, choosing an appropriate treatment technology for the
community could be a sustainable solution for wastewater manage-
ment and emissions control. Example solutions include upflow anaero-
bic sludge blanket, hybrid reactors, soil aquifer treatment, approaches
based on pathogens treatment, and reuse of the treated effluent for
agricultural reuse (Bdour etal., 2009).
Wetlands can be a sustainable solution for municipal wastewater
treatment due to their low cost, simple operation and maintenance,
minimal secondary pollution, favourable environmental appearance,
and other ecosystem service benefits (Mukherjee, 1999; Chen etal.,
2008, 2011; Mukherjee and Gupta, 2011). It has been demonstrated
that wetlands are a less energy intensive option than conventional
wastewater treatment systems despite differences in costs across tech-
nologies and socio-economic contexts (Gao etal., 2012), but such sys-
Figure 10�18 | Management practices concerning MSW in several nations (based on
World Bank and national statistics, methodology described in Themelis and Bourtsalas
(2013).
% Recycled/Composted % Landfilled % WtE
200 40 60 80 100
Austria
Germany
Netherlands
Belgium
Switzerland
Singapore
Sweden
Taiwan
Denmark
Japan
Norway
Korea
Luxembourg
France
EU (27 countries)
United Kingdom
Finland
Italy
Ireland
Slovenia
Australia
Spain
Portugal
United States
Hungary
Czech Republic
Canada
Poland
Iceland
Estonia
Cyprus
Greece
China
Slovakia
Malta
Latvia
Lithuania
Russia
Romania
Brasil
Turkey

791791
Industry
10
Chapter 10
tems are facing challenges in urban areas from demand for land for
other economic activities (Mukherjee, 1999).
It has been highlighted that wastewater treatment with anaerobic
sludge digestion and methane recovery and use for energy purposes
reduces methane emissions (Bani Shahabadi etal., 2009; Foley etal.,
2010; Massé etal., 2011; Fine and Hadas, 2012; Abbasi etal., 2012; Liu
etal., 2012b; Wang etal., 2012b). Anaerobic digestion also provides an
efficient means to reduce pollutant loads when high-strength organic
wastewater (food waste, brewery, animal manure) have to be treated
(Shin etal., 2011), although adequate regulatory policy incentives are
needed for widespread implementation in developed and developing
countries (Massé etal., 2011).
Advanced treatment technologies such as membrane filtration, ozona-
tion, aeration efficiency, bacteria mix, and engineered nanomaterials
(Xu etal., 2011b; Brame et al., 2011) may enhance GHG emissions
reduction in wastewater treatment, and some such technologies, for
example membranes, have increased the competitiveness and decen-
tralization (Fane, 2007; Libralato etal., 2012).
The existence of a shared location and infrastructure can also facilitate
the identification and implementation of more synergy opportunities
to reduce industrial water provision and wastewater treatment, there-
fore abating GHG emissions from industry. The concept of eco-indus-
trial parks is discussed in Section 10.5.
10�14�4 Summary results on costs and potentials
Figure 10.19 and Figure 10.20 present the potentials and costs of
selected mitigation options to reduce the GHG emissions of the two
waste sectors that represent 90 % of waste related emissions: solid
waste disposal (0.67 GtCO
2
eq) and domestic wastewater
(0.77 GtCO
2
eq)
emissions (JRC / PBL, 2013). For solid waste, potentials
are presented in tCO
2
eq / t solid waste and for wastewater and in
tCO
2
eq / t BOD
5
as % compared to current global average.
Six mitigation options for solid waste and three mitigation options for
wastewater are assessed and presented in the figures. The reference
case and the basis for mitigation potentials were derived from IPCC
2006 guidelines. Abatement costs and potentials are based on EPA
(2006b; 2013).
The actual costs and potentials of the abatement options vary widely
across regions and design of a treatment methodology. Given that
technology options to reduce emissions from industrial and municipal
waste are the same, it is not further distinguished in the approach.
Furthermore, the potential of reductions from emissions from land-
fills are directly related to climatic conditions as well as to the age
and amount of landfill, both of which are not included in the chosen
approach. Emission factors are global annual averages (derived from
IPCC 2006 guideline aggregated regional averages). The actual emis-
sion factor differs between types of waste, climatic regions, and age of
Figure 10�19 | Indicative CO
2
eq emission intensities and levelized cost of conserved carbon of municipal solid waste disposal practices / technologies (for data and methodology,
see AnnexIII).
Indicative Cost of Conserved Carbon[USD
2010
/tCO
2
eq]
>15050-15020-500-20<0
Emission Intensity [tCO
2
eq/t MSW]
CH
4
Capture Plus Heat/Electricity Generation
CH
4
Flaring
In-Situ Aeration
Biocover
Anaerobic Digestion
Composting
Landfill at MSW Disposal Site
0.00.30.60.91.21.5
Figure 10�20 | Indicative CO
2
eq emission intensities and levelized cost of conserved carbon of different wastewater treatments (for underlying data and methodology, see
AnnexIII).
Indicative Cost of Conserved Carbon[USD
2010
/tCO
2
eq]
>15050-15020-500-20<0
0246810
Anaerobic Biomass Digester with
CH
4
Collection
Aerobic Wastewater Plant (WWTP)
Centralised Wastewater Collection
and WWTP
Untreated System: Stagnant Sewer
(Open and Warm)
Emission Intensity [tCO
2
eq/t BOD
5
]

792792
Industry
10
Chapter 10
the landfill, explaining the wide range for each technology. The mitiga-
tion potential for waste is derived by comparing the emission range
from a reference technology (e. g., a landfill) with the emission range
for a chosen technology. The GHG coverage for solid waste is focused
on methane, which is the most significant emission from landfilling;
other GHG gases such as N
2
O only play a minor role in the landfill
solid waste sector and are neglected in this study (except for compost-
ing).
In the case of landfills, the top five emitting countries account for
27 % of the total abatement potential in the sector (United States 2 %,
China 6 %, Mexico 9 %, Malaysia 3 %, and Russia 2 %). The distribu-
tion of the remaining potential per region is: Africa 16 %, Central and
South America 9 %, Middle East 9 %, Europe 19 %, Eurasia 2 %, Asia
15 %, and North America 4 % (EPA, 2013).
In the case of wastewater, 58 % of the abatement potential is concen-
trated in the top five emitting countries (United States 7 %, Indonesia
9 %, Mexico 10 %, Nigeria 10 %, and China 23 %). The distribution of
the remaining potential per region is: Africa 5 %, Central and South
America 5 %, Middle East 14 %, Europe 5 %, Eurasia 4 %, and Asia
10 % (EPA, 2013).
The United States EPA has produced two studies with cost estimates of
abatement in the solid waste sector (EPA, 2006b, 2013) which found a
large range for options to reduce landfill (e. g., incineration, anaerobic
digestion, and composting) of up to 590 USD
2010
/ tCO
2
eq if the technol-
ogy is only implemented for the sake of GHG emission reduction. How-
ever, the studies highlight that there are significant opportunities for
CH
4
reductions in the landfill sector at carbon prices below 20 USD
2010
.
Improving landfill practices mainly by flaring and CH
4
utilization are
low cost options, as both generate costs in the lower range (0 — 50
USD
2010
/ tCO
2
eq).
The costs of the abatement options shown vary widely between indi-
vidual regions and from plant to plant. The cost estimates should, for
that reason, be regarded as indicative only and depend on a number of
factors including capital stock turnover, relative energy costs, regional
climate conditions, waste fee structures, etc. Furthermore, the method
does not reflect the time variation in solid waste disposal and the deg-
radation process as it assumes that all potential methane is released
the year the solid waste is disposed.
The unit tonne biological oxygen demand (t BOD) stands for the
organic content of wastewater (‘loading’) and represents the oxy-
gen consumed by wastewater during decomposition. The average for
domestic wastewater is in a range of 110 – 400 mg / l and is directly
connected to climate conditions. Costs and potentials are global aver-
ages, but based on region-specific information. Options that are more
often used in developing countries are not considered since data avail-
ability is limited. However, options like septic tanks, open sewers, and
lagoons are low cost options with an impact of reducing GHG emission
compared to untreated wastewater that is stored in a stagnant sewer
under open and warm conditions.
The methane correction factor applied is based on the IPCC guidelines
and gives an indication of the amount of methane that is released by
applying the technology; furthermore emissions from N
2
O have not
been included as they play an insignificant role in domestic wastewa-
ter. Except in countries with advanced centralized wastewater treat-
ment plants with nitrification and denitrification steps (IPCC, 2006),
establishing a structured collection system for wastewater will always
have an impact on GHG emissions in the waste sector.
Cost estimates of abatement in the domestic wastewater are provided
in EPA (2006b; 2013), which find a large range for the options of 0 to
530 USD
2010
/ tCO
2
eq with almost no variation across options. The actual
costs of the abatement options shown vary widely between individ-
ual regions and from the design set up of a treatment methodology.
Especially for wastewater treatment, the cost ranges largely depend on
national circumstances like climate conditions (chemical process will
be accelerated under warm conditions), economic development, and
cultural aspects. The data availability for domestic wastewater options,
especially on costs, is very low and would result in large ranges, which
imply large uncertainties for each of the option. Mitigation potentials
for landfills (in terms of % of potential above emissions for 2030) is
double compared with wastewater (EPA, 2013). The mitigation poten-
tial for wastewater tends to concentrate in the higher costs options
due to the significant costs of constructing public wastewater collec-
tion systems and centralized treatment facilities.

793793
Industry
10
Chapter 10
References
Abbasi T�, S� M� Tauseef, and S� A� Abbasi (2012)� Anaerobic digestion for global
warming control and energy generation — An overview. Renewable and Sus-
tainable Energy Reviews 16, 3228 – 3242. doi: 10.1016 / j.rser.2012.02.046,
ISSN: 1364-0321.
Agrawal V� V�, M� Ferguson, L� B� Toktay, and V� M� Thomas (2012)� Is
Leasing Greener Than Selling? Management Science 58, 523 – 533. doi:
10.1287 / mnsc.1110.1428, ISSN: 0025-1909.
Ahmad N�, and A� Wyckoff (2003)� Carbon Dioxide Emissions Embodied in Inter-
national Trade of Goods. Organisation for Economic Co-Operation and Devel-
opment, Paris. Available at: http: / / www. oecd-ilibrary. org / content / workingpa
per / 421482436815.
Akashi O�, T� Hanaoka, T� Masui, and M� Kainuma (2013)� Halving global GHG
emissions by 2050 without depending on nuclear and CCS. Climatic Change,
1 – 12. doi: 10.1007 / s10584 - 013 - 0942-x, ISSN: 0165-0009, 1573 – 1480.
Akashi O�, T� Hanaoka, Y� Matsuoka, and M� Kainuma (2011)� A projection for
global CO
2
emissions from the industrial sector through 2030 based on activ-
ity level and technology changes. Energy 36, 1855 – 1867. doi: 10.1016 / j.
energy.2010.08.016, ISSN: 0360-5442.
Allwood J� M�, M� F� Ashby, T� G� Gutowski, and E� Worrell (2011)� Material effi-
ciency: A white paper. Resources, Conservation and Recycling 55, 362 – 381. doi:
10.1016 / j.resconrec.2010.11.002, ISSN: 0921-3449.
Allwood J� M�, M� F� Ashby, T� G� Gutowski, and E� Worrell (2013)� Material effi-
ciency: providing material services with less material production. Philosophical
Transactions of the Royal Society A: Mathematical, Physical and Engineering
Sciences 371, 2 – 15. doi: 10.1098 / rsta.2012.0496.
Allwood J� M�, J� M� Cullen, M� A� Carruth, D� R� Cooper, M� McBrien, R� L� Mil-
ford, M� Moynihan, and A� C� H� Patel (2012)� Sustainable Materials: With
Both Eyes Open. UIT Cambridge Ltd, Cambridge, England, 373 pp. ISBN:
9781906860059.
Allwood J� M�, J� M� Cullen, and R� L� Milford (2010)� Options for Achieving a
50 % Cut in Industrial Carbon Emissions by 2050. Environmental Science &
Technology 44, 1888 – 1894. doi: 10.1021 / es902909k, ISSN: 0013-936X.
Allwood J� M�, S� E� Laursen, S� N� Russell, C� M� de Rodríguez, and N� M� P�
Bocken (2008)� An approach to scenario analysis of the sustainability of an
industrial sector applied to clothing and textiles in the UK. Journal of Cleaner
Production 16, 1234 – 1246. doi: 10.1016 / j.jclepro.2007.06.014, ISSN: 0959-
6526.
Andersen J� K�, A� Boldrin, T� H� Christensen, and C� Scheutz (2010)� Greenhouse
gas emissions from home composting of organic household waste. Waste Man-
agement (New York, N. Y.) 30, 2475 – 2482. doi: 10.1016 / j.wasman.2010.07.004,
ISSN: 1879-2456.
Anderson S�, and R� G� Newell (2004)� Information programs for technology
adoption: the case of energy-efficiency audits. Resource and Energy Economics
26, 27 – 50.
APP (2010)� Energy Efficiency and Resource Saving Technologies in the Cement
Industry. Asia Pacific Partnership on Clean Development and Climate, 232 pp.
Available at: http: / / www. asiapacificpartnership. org / pdf / Projects / Cement / APP_
Booklet_of_Cement_Technology.pdf.
Arrow K� J�, P� Dasgupta, L� H� Goulder, K� J� Mumford, and K� Oleson (2010)�
Sustainability and the Measurement of Wealth. National Bureau of Economic
Research, Cambridge, MA, 42 pp. Available at: http: / / www. nber. org / papers /
w16599.
Arsova L� (2010)� Anaerobic digestion of food waste: Current status, problems and
an alternative product. Columbia University.
Arsova L�, R� van Haaren, N� Golstein, S� M� Kaufman, and N� J� Theme-
lis (2008)� State of Garbage in America. BioCycle 49, 22 – 27. Available at:
http: / / www. biocycle. net / 2008 / 12 / 22 / the-state-of-garbage-in-america-3 / .
Arvedi G�, F� Mazzolari, A� Bianchi, G� Holleis, J� Siegl, and A� Angerbauer
(2008)� The Arvedi Endless Strip Production line (ESP): from liquid steel to
hot-rolled coil in seven minutes. Revue de Métallurgie 105, 398 – 407. doi:
10.1051 / metal:2008057, ISSN: 0035-1563, 1156 – 3141.
Ashby M� F� (2009)� Materials and the Environment: Eco-Informed Material Choice.
Butterworth-Heinemann, Burlington, MA, USA, ISBN: 978 - 1856176088.
Aunan K�, J� Fang, H� Vennemo, K� Oye, and H� M� Seip (2004)� Co-benefits of
climate policy — lessons learned from a study in Shanxi, China. Energy Policy
32, 567 – 581. doi: 10.1016 / S0301 - 4215(03)00156 - 3, ISSN: 0301-4215.
Babiker M� H�, and R� S� Eckaus (2007)� Unemployment effects of climate
policy. Environmental Science & Policy 10, 600 – 609. doi: 10.1016 / j.
envsci.2007.05.002, ISSN: 1462-9011.
Baccini P�, and P� H� Brunner (2012)� Metabolism of the Anthroposphere: Analysis,
Evaluation, Design. MIT Press, Cambridge, MA, 405 pp. ISBN: 9780262016650.
Backlund S�, P� Thollander, J� Palm, and M� Ottosson (2012)� Extend-
ing the energy efficiency gap. Energy Policy 51, 392 – 396. doi: 10.1016 / j.
enpol.2012.08.042, ISSN: 0301-4215.
Bailey M�, R� Lauman, G� Wicks, and B� Crumrine (2009)� Get ‘er Done! How to
Implement Energy Efficiency Projects by Understanding Organizational Behav-
ior and Decision Making.
Bajželj B�, J� M� Allwood, and J� M� Cullen (2013)� Designing Climate Change Miti-
gation Plans That Add Up. Environmental Science & Technology 47, 8062 – 8069.
doi: 10.1021 / es400399h, ISSN: 0013-936X.
Bani Shahabadi M�, L� Yerushalmi, and F� Haghighat (2009)� Impact of process
design on greenhouse gas (GHG) generation by wastewater treatment plants.
Water Research 43, 2679 – 2687. doi: 10.1016 / j.watres.2009.02.040, ISSN:
0043-1354.
Barker T�, P� Ekins, and T� Foxon (2007)� Macroeconomic effects of efficiency
policies for energy-intensive industries: The case of the UK Climate Change
Agreements, 2000 – 2010. Energy Economics 29, 760 – 778. doi: 10.1016 / j.
eneco.2006.12.008, ISSN: 0140-9883.
Barker D� J�, S� A� Turner, P� A� Napier-Moore, M� Clark, and J� E� Davison (2009)�
CO
2
Capture in the Cement Industry. Energy Procedia 1, 87 – 94. doi: 16 / j.egy-
pro.2009.01.014, ISSN: 1876-6102.
Bassi A� M�, J� S� Yudken, and M� Ruth (2009)� Climate policy impacts on the
competitiveness of energy-intensive manufacturing sectors. Energy Policy 37,
3052 – 3060. doi: 10.1016 / j.enpol.2009.03.055, ISSN: 0301-4215.
BCS Inc� (2007)� U. S. Energy Requirements for Aluminum Production: Historical Per-
spective, Theoretical Limits and Current Practices. Technical Report Prepared for
the United States Department of Energy, Industrial Technologies Program. U. S.
Department of Energy, Washington, DC. Available at: http: / / www1. eere. energy.
gov / manufacturing / industries_technologies / aluminum / pdfs / al_theoretical.pdf.

794794
Industry
10
Chapter 10
Bdour A� N�, M� R� Hamdi, and Z� Tarawneh (2009)� Perspectives on sustain-
able wastewater treatment technologies and reuse options in the urban areas
of the Mediterranean region. Desalination 237, 162 – 174. doi: 10.1016 / j.
desal.2007.12.030, ISSN: 0011-9164.
Bebbington A� J�, and J� T� Bury (2009)� Institutional challenges for mining and
sustainability in Peru. Proceedings of the National Academy of Sciences 106,
17296 – 17301. doi: 10.1073 / pnas.0906057106.
Becken S�, and J� E� Hay (2012)� Climate Change and Tourism: From Policy to Prac-
tice. Routledge, London, UK, 344 pp. ISBN: 9781136471742.
Beddington J�, M� Asaduzzaman, A� Fernandez, M� Clark, M� Guillou, M� Jahn,
L� Erda, T� Mamo, N� van Bo, C� A� Nobre, R� Scholes, Sharma R, and J� Wak-
hungu (2011)� Achieving Food Security in the Face of Climate Change: Summary
for Policymakers from the Commission on Sustainable Agriculture and Climate
Change. Copenhagen, 20 pp. Available at: http: / / cgspace.cgiar.org / bitstream / han-
dle / 10568 / 10701 / Climate_food_commission-SPM-Nov2011.pdf?sequence=6.
BEE (2012)� Database of energy efficiency measures adopted by the winners of
the National Awards on Energy Conservations (Years 2008 – 2012). Bureau
of Energy Efficiency, Ministry of Power, Government of India. Available at:
http: / / www. emt-india. net / eca2013 / 2013.html.
Van Berkel R�, T� Fujita, S� Hashimoto, and Y� Geng (2009)� Industrial and urban sym-
biosis in Japan: Analysis of the Eco-Town program 1997 – 2006. Journal of Envi-
ronmental Management 90, 1544 – 1556. doi: 10.1016 / j.jenvman.2008.11.010,
ISSN: 0301-4797.
Bernstein L�, J� Roy, K� C� Delhotal, J� Harnisch, R� Matsuhashi, L� Price, K�
Tanaka, E� Worrell, F� Yamba, and Z� Fengqi (2007)� Industry. In: Climate
Change 2007: Mitigation. Contribution of Working Group III to the Fourth
Assessment Report of the Intergovernmental Panel on Climate Change [B.
Metz, O. R. Davidson, P. R. Bosch, R. Dave, L. A. Meyer (eds)]. Cambridge Univer-
sity Press, Cambridge, United Kingdom and New York, NY, USA, pp. 449 – 488.
ISBN: 978 0 521 70598 1.
BIS Production Partner (2012)� Strong reduction in emissions with the help of BIS
Production Partner. Bilfinger Berger Industrial Services. Available at: http: / / en.
productionpartner.com / About-us / News / Strong-reduction-in-emissions-with-
the-help-of-BIS-Production-Partner.
Bitzer J�, and M� Kerekes (2008)� Does foreign direct investment transfer tech-
nology across borders? New evidence. Economics Letters 100, 355 – 358. doi:
10.1016 / j.econlet.2008.02.029, ISSN: 0165-1765.
Bleischwitz R�, B� Bahn-Walkowiak, F� Ekardt, H� Feldt, and L� Fuhr (2012)�
International Resource Politics. New Challenges Demanding New Governance
Approaches for a Green Economy. Heinrich Böll Stiftung, Berlin, 95 pp. Available
at: http: / / www. boell. de / ecology / resources / resource-governance-ecology-pub
lication-international-resource-politics-14873.html.
Blodgett J�, and L� Parker (2010)� Greenhouse Gas Emission Drivers: Popula-
tion, Economic Development and Growth, and Energy Use. Congressional
Research Service, Washington, DC, 36 pp. Available at: http: / / crs.ncseonline.
org / NLE / CRSreports / 10Apr / RL33970.pdf.
BMU (2012)� German Resource Efficiency Programme (ProgRess). Federal German
Ministry for the Environment, Nature Conservation and Nuclear Safety (Bundesmi-
nisterium Für Umwelt, Naturschutz Und Reaktorsicherheit, BMU), Berlin, 124 pp.
Available at: http: / / www. bmu. de / fileadmin / bmu-import / files / pdfs / allgemein /
application / pdf / progress_en_bf.pdf.
Boden T� A�, G� Marland, and R� J� Andres (2013)� Global, Regional, and National
Fossil-Fuel CO
2
Emissions. Carbon Dioxide Information Analysis Center, Oak
Ridge National Laboratory, U. S. Department of Energy, Oakridge, Tenn. USA, 1
pp. Available at: http: / / cdiac.ornl.gov / trends / emis / tre_glob.html.
Bogner J� E�, K� A� Spokas, and J� P� Chanton (2011)� Seasonal greenhouse gas
emissions (methane, carbon dioxide, nitrous oxide) from engineered landfills:
daily, intermediate, and final California cover soils. Journal of Environmental
Quality 40, 1010 – 1020. doi: 10.2134 / jeq2010.0407, ISSN: 0047-2425.
Bosoaga A�, O� Masek, and J� E� Oakey (2009)� CO
2
Capture Technologies for
Cement Industry. Energy Procedia 1, 133 – 140. doi: 16 / j.egypro.2009.01.020,
ISSN: 1876-6102.
Bouoiyour J�, and A� Akhawayn (2005)� Labour Productivity, Technological Gap
and Spillovers Evidence from Moroccan Manufacturing Industries. The African
Finance Journal 7, 1 – 17. Available at: http: / / ideas.repec.org / a / afj / journl / v7y2
005i2p1 - 17.html.
Bows A�, K� Anderson, and P� Peeters (2009)� Air Transport, Climate Change
and Tourism. Tourism and Hospitality Planning & Development 6, 7 – 20. doi:
10.1080 / 14790530902847012.
Boyd G� A�, and J� X� Pang (2000)� Estimating the linkage between energy effi-
ciency and productivity. Energy Policy 28, 289 – 296.
Brame J�, Q� Li, and P� J� J� Alvarez (2011)� Nanotechnology-enabled water treat-
ment and reuse: emerging opportunities and challenges for developing
countries. Trends in Food Science & Technology 22, 618 – 624. doi: 10.1016 / j.
tifs.2011.01.004, ISSN: 0924-2244.
Bringezu S�, and R� Bleischwitz (2009)� Sustainable Resource Management:
Global Trends, Visions and Policies. Greenleaf Publishing, 345 pp. ISBN:
9781906093266.
Brown M� A� (2001)� Market failures and barriers as a basis for clean energy poli-
cies. Energy Policy 29, 1197 – 1207.
Brown M� A�, M� Cox, and P� Baer (2013)� Reviving manufacturing with a
federal cogeneration policy. Energy Policy 52, 264 – 276. doi: 10.1016 / j.
enpol.2012.08.070, ISSN: 0301-4215.
Brown T�, A� Gambhir, N� Florin, and P� Fennell (2012)� Reducing CO
2
Emis-
sions from Heavy Industry: A Review of Technologies and Considerations
for Policy Makers. Imperial College London, London, UK, 32 pp. Available at:
http: / / www3. imperial. ac. uk / climatechange / publications.
Brown M� A�, R� Jackson, M� Cox, R� Cortes, B� Deitchman, and M� V� Lapsa
(2011)� Making Industry Part of the Climate Solution: Policy Options to Promote
Energy Efficiency. Oak Ridge National Laboratory (ORNL), Oakridge, Tenn. USA,
299 pp. Available at: http: / / info.ornl.gov / sites / publications / Files / Pub23821.pdf.
De Bruijn K�, R� Dirven, E� Eijgelaar, and P� Peeters (2010)� Travelling Large in
2008: The Carbon Footprint of Dutch Holidaymakers in 2008 and the Develop-
ment since 2002. NHTV-NRIT Research-NBTC-NIPO Research, Vlissigen, Nether-
lands, 43 pp. Available at: http: / / books.google.com / books?id=MVSvYgEACAAJ.
Brush A�, E� Masanet, and E� Worrell (2011)� Energy Efficiency Improvement and
Cost Saving Opportunities for the Dairy Processing Industry. Lawrence Berke-
ley National Laboratory, Berkeley, CA, 137 pp. Available at: http: / / escholarship.
org / uc / item / 3pb7n796.
Bye A� (2005)� The development and application of a 3D geotechnical model for
mining optimisation, sandsloot open pit platinum mine, South Africa. Society
for Mining, Metallurgy and Exploration, Littleton, Colorado, USA. 8 pp. Avail-
able at: www. saimm. co. za / Journal / v106n02p097.pdf.

795795
Industry
10
Chapter 10
Bye A� (2007)� The application of multi-parametric block models to the mining
process. Journal of The South African Institute of Mining and Metallurgy 107,
51 – 58.
Bye A� (2011)� Case Studies Demonstrating Value from Geometallurgy Initia-
tives. Available at: http: / / www. ausimm. com. au / publications / epublication.
aspx?ID=12887.
Carruth M� A�, J� M� Allwood, and M� C� Moynihan (2011)� The technical poten-
tial for reducing metal requirements through lightweight product design.
Resources, Conservation and Recycling 57, 48 — 60. doi: 10.1016 / j.rescon-
rec.2011.09.018, ISSN: 0921-3449.
CCAP (2005)� Reducing CO
2
Emissions from California’s Cement Sector. Cen-
ter for Clean Air Policy, Washington, DC, 13 pp. Available at: http: / / ccap.
org / assets / Reducing-CO2-Emissions-from-Californias-Cement-Sector_CCAP-
October-2005.pdf.
CEMBUREAU (2009)� Sustainable Cement Production — Co-Processing of Alter-
native Fuels and Raw Materials in the European Cement Industry. CEMBU-
REAU, Brussels, Belgium, 19 pp. Available at: http: / / www. cembureau. eu / sites /
default / files / Sustainable%20cement%20production%20Brochure.pdf.
CEPI (2006)� Europe Global Champion in Paper Recycling: Paper Industries Meet
Ambitious Target. Confederation of European Paper Industries, Brussels, Bel-
gium. Available at: http: / / www. cepi. org / system / files / public / documents / press
releases / recycling / 2006 / PRRECYCLING.pdf.
CEPI (2012)� Key Statistics 2011 — European Pulp and Paper Industry. Confed-
eration of European Paper Industries, Brussels, Belgium, 32 pp. Available
at: http: / / www. cepi. org / system / files / public / documents / publications / statis
tics / Key%20Statistics%202011 %20FINAL.pdf.
Ceron J�-P�, and G� Dubois (2005)� More mobility means more impact on cli-
mate change: prospects for household leisure mobility in France. Belgeo 1 – 2,
103 – 120. Available at: http: / / en.youscribe.com / catalogue / tous / practical-life /
more-mobility-means-more-impact-on-climate-change-prospects-for-382812.
Chai X�, Y� Hao, T� Shimaoka, H� Nakayama, T� Komiya, and Y� Zhao (2013)�
The effect of aeration position on the spatial distribution and reduction of pol-
lutants in the landfill stabilization process — a pilot scale study. Waste Man-
agement & Research: The Journal of the International Solid Wastes and Public
Cleansing Association, ISWA 31, 41 – 49. doi: 10.1177 / 0734242X12462285,
ISSN: 1399-3070.
Chakraborty D�, and J� Roy (2012a)� Climate Change Adaptation and Mitiga-
tion Strategies: Responses from Select Indian Energy Intensive Industrial Units.
Department of Management Studies, Indian Institute of Science, Bangalore and
Public Affairs Centre, Bangalore.
Chakraborty D�, and J� Roy (2012b)� Accounting for Corporate Water Use: Esti-
mating Water Footprint of an Indian Paper Production Unit. Journal of Indian
Accounting Review 16, 34 – 42.
Chateau J�, A� Saint-Martin, and T� Manfredi (2011)� Employment Impacts of
Climate Change Mitigation Policies in OECD: A General-Equilibrium Per-
spective. OECD Environment Working Papers 32, 32. doi: http: / / dx.doi.
org / 10.1787 / 5kg0ps847h8q-en, ISSN: 1997-0900 (online).
Chen Z� M�, B� Chen, J� B� Zhou, Z� Li, Y� Zhou, X� R� Xi, C� Lin, and G� Q� Chen
(2008)� A vertical subsurface-flow constructed wetland in Beijing. Communi-
cations in Nonlinear Science and Numerical Simulation 13, 1986 – 1997. doi:
10.1016 / j.cnsns.2007.02.009, ISSN: 10075704.
Chen Chiu L� (2009)� Industrial Policy and Structural Change in Taiwan’s Tex-
tile and Garment Industry. Journal of Contemporary Asia 39, 512 – 529. doi:
10.1080 / 00472330903076743.
Chen X�, T� Fujita, S� Ohnishi, M� Fujii, and Y� Geng (2012)� The Impact of Scale,
Recycling Boundary, and Type of Waste on Symbiosis and Recycling. Journal of
Industrial Ecology 16, 129 – 141. doi: 10.1111 / j.1530 - 9290.2011.00422.x, ISSN:
1530-9290.
Chen G� Q�, L� Shao, Z� M� Chen, Z� Li, B� Zhang, H� Chen, and Z� Wu (2011)�
Low-carbon assessment for ecological wastewater treatment by a constructed
wetland in Beijing. Ecological Engineering 37, 622 – 628. doi: 10.1016 / j.eco-
leng.2010.12.027, ISSN: 0925-8574.
Cherp A�, A� Adenikinju, A� Goldthau, F� Hernandez, L� Hughes, J� Jansen, J�
Jewell, M� Olshanskaya, R� Soares de Oliveira, B� Sovacool, and S� Vaku-
lenko (2012a)� Chapter 5 — Energy and Security. In: Global Energy Assess-
ment — Toward a Sustainable Future.Cambridge University Press, Cambridge,
UK and New York, NY, USA and the International Institute for Applied Systems
Analysis, Laxenburg, Austria, pp. 325 – 384. ISBN: 9781 10700 5198 hardback
9780 52118 2935 paperback.
Cherp A�, A� Adenikinju, A� Goldthau, F� Hernandez, L� Hughes, J� Jansen, J�
Jewell, M� Olshanskaya, R� Soares de Oliveira, B� Sovacool, and S� Vaku-
lenko (2012b)� Energy and Security. In: Global Energy Assessment: Toward
a Sustainable Future. N. Nakicenovic, A. Patwardhan, L. Gomez-Echeverri, T.
Johansson, (eds.), Cambridge Univeristy Press, Laxenburg, Austria; Cambridge,
UK & New York, USA, pp. 325 – 384.
Chertow M� R� (2000)� INDUSTRIAL SYMBIOSIS: Literature and Taxonomy. Annual
Review of Energy and the Environment 25, 313 – 337.
CIPEC (2007)� Benchmarking and Best Practices in Canadian Wet-Processing.
Canadian Industry Program for Energy Conservation, Ottawa, Canada, 40 pp.
Available at: http: / / publications.gc.ca / collections / collection_2013 / rncan-
nrcan / M4 - 43 - 2006-eng.pdf.
Clift R� (2006)� Sustainable development and its implications for chemical engi-
neering. Chemical Engineering Science 61, 4179 – 4187. doi: 10.1016 / j.
ces.2005.10.017, ISSN: 0009-2509.
Clift R�, and L� Wright (2000)� Relationships Between Environmental Impacts and
Added Value Along the Supply Chain. Technological Forecasting and Social
Change 65, 281 – 295. doi: 10.1016 / S0040 - 1625(99)00055 - 4, ISSN: 0040-1625.
Concawe (2011)� The Potential for Application of CO
2
Capture and Storage in EU
Oil Refineries. Brussels, 65 pp. Available at: http: / / bellona.org / ccs / uploads / med
ia / Report_11 - 7-2011_CCS_in_EU_refineries.pdf.
Cooper D� R�, and J� M� Allwood (2012)� Reusing steel and aluminum components
at end of product life. Environmental Science & Technology 46, 10334 – 10340.
doi: 10.1021 / es301093a, ISSN: 1520-5851.
Cooper D� R�, A� C� H� Patel, M� Moynihan, J� M� Allwood, and T� Cooper (2012)�
Increasing the life of steel and aluminium (products) to save carbon. To Be Sub-
mitted to the Journal of Resources, Conservation and Recycling.
Costantini V�, M� Mazzanti, and A� Montini (2013)� Environmental performance,
innovation and spillovers. Evidence from a regional NAMEA. Ecological Eco-
nomics 89, 101 – 114. doi: 10.1016 / j.ecolecon.2013.01.026, ISSN: 0921-8009.
Côté R�, and J� Hall (1995)� Industrial parks as ecosystems. Journal of Cleaner Pro-
duction 3, 41 – 46. doi: 10.1016 / 0959 - 6526(95)00041-C, ISSN: 0959-6526.

796796
Industry
10
Chapter 10
CRC ORE (2011)� Annual Report: Transforming Resource Extraction, 2010 – 11.
Cooperative Research Center for Optimising Resource Extraction, St Lucia,
Queensland, Australia, 68 pp. Available at: http: / / issuu.com / melraas
sina / docs / crc_ore_annual_report_2010 - 11.
Crichton D� (2006)� Climate Change and Its Effects on Small Businesses in the UK.
AXA Insurance UK plc., London, UK, ISBN: 978 - 0-9554108 - 0-2.
Croezen H�, and M� Korteland (2010)� Technological Developments in Europe:
A Long-Term View of CO
2
Efficient Manufacturing in the European Region. CE
Delft, Delft, 87 pp. Available at: www. ce. nl.
Cullen J� M�, and J� M� Allwood (2013)� Mapping the Global Flow of Aluminum:
From Liquid Aluminum to End-Use Goods. Environmental Science & Technology
47, 3057 – 3064. doi: 10.1021 / es304256s, ISSN: 0013-936X.
Cullen J� M�, J� M� Allwood, and M� D� Bambach (2012)� Mapping the Global Flow
of Steel: From Steelmaking to End-Use Goods. Environmental Science & Tech-
nology 46, 13048 – 13055. doi: 10.1021 / es302433p, ISSN: 0013-936X.
Cullen J� M�, J� M� Allwood, and E� H� Borgstein (2011)� Reducing Energy
Demand: What Are the Practical Limits? Environmental Science & Technology
45, 1711 – 1718. doi: 10.1021 / es102641n, ISSN: 0013-936X.
Daniel M�, G� Lane, and E� McLean (2010)� Efficiency, Economics, Energy and
Emissions — Emerging Criteria for Comminution Circuit Decision Making. Coali-
tion for Eco-Efficient Comminution, Brisbane, QLD, Australia. 9 pp. Available
at: http: / / www. ceecthefuture. org / wp-content / uploads / 2013 / 01 / Daniel_711_
p3523.pdf.
Dasgupta S�, H� Hettige, and D� Wheeler (2000)� What Improves Environmental
Compliance? Evidence from Mexican Industry. Journal of Environmental Eco-
nomics and Management 39, 39 – 66.
Dasgupta S�, J� Roy, A� Bera, A� Sharma, and P� Pandey (2012)� Growth
accounting for six energy intensive industries in India. The Journal of Indus-
trial Statistics, Central Statistics Office, Ministry of Statistics and Programme
Implementation, Government of India 1, 1 – 15. Available at: http: / / mospi.nic.
in / mospi_new / upload / JIS_2012 / Gr_Acc_Six_En_I.pdf.
Van Deventer J� S� J�, J� L� Provis, and P� Duxson (2012)� Technical and commer-
cial progress in the adoption of geopolymer cement. Minerals Engineering 29,
89 – 104. doi: 10.1016 / j.mineng.2011.09.009, ISSN: 0892-6875.
DfT (2011)� National Travel Survey 2010. Department for Transport, London, UK, 9
pp. Available at: https: / / www. gov. uk / government / publications / national-travel-
survey-2010.
Dong Y� (2011)� Development of Waste-To-Energy in China; and Case Study of
the Guangzhou Likeng WTE plant. Columbia University and the Global WTERT
Council, New York, 94 pp.
Dosho Y� (2008)� Sustainable concrete waste recycling. Proceedings of the
ICE — Construction Materials 161, 47 – 62. doi: 10.1680 / coma.2008.161.2.47,
ISSN: 1747-650X, 1747 – 6518.
DRET (2011)� Analyses of Diesel Use for Mine Haul and Transport Operations.
Department of Resources, Energy and Tourism, Australian Government, Can-
berra, 20 pp. Available at: http: / / energyefficiencyopportunities.gov.au / industry-
sectors / mining / .
Dubois G�, P� Peeters, J�-P� Ceron, and S� Gössling (2011)� The future tourism
mobility of the world population: Emission growth versus climate policy. Trans-
portation Research Part A: Policy and Practice 45, 1031 – 1042. doi: 10.1016 / j.
tra.2009.11.004, ISSN: 0965-8564.
EC (2008a)� Sustainable Consumption and Production and Sustainable Industrial Pol-
icy Action Plan. {SEC(2008) 2110} {SEC(2008) 2111}. European Commission, DG
Environment, Copenhagen, 13 pp. Available at: http: / / ec.europa.eu / environment /
eussd / escp_en.htm.
EC (2008b)� Directive 2008 / 98 / EC of the European Parliament and of the Council
of 19 November 2008 on waste and repealing certain Directives. Official Jour-
nal of the European Communities, L312, 51, 3 – 30. Available at: http: / / eur-lex.
europa.eu / JOHtml.do?uri=OJ:L:2008:312:SOM:EN:HTML.
EC (2009)� Economic Analysis of Resource Efficiency Policies. European Commis-
sion, DG Environment, Copenhagen, 97 pp. Available at: http: / / ec.europa.
eu / environment / enveco / resource_efficiency / .
EC (2011)� A Resource-Efficient Europe — Flagship Initiative under the Europe 2020
Strategy. European Commission, Brussels, 17 pp.
EC (2012a)� Best Available Technologies (BAT) Reference Document for Iron and
Steel Production, Industrial Emissions Directive 2010 / 75 / EU (Integrated Pollu-
tion Prevention and Control). European Commission, Brussels, 623 pp.
EC (2012b)� Roadmap to a Resource Efficient Europe. European Commission, Brus-
sels. Available at: http: / / ec.europa.eu / environment / resource_efficiency / index_
en.htm.
Eckelman M� J�, B� K� Reck, and T� E� Graedel (2012)� Exploring the Global Jour-
ney of Nickel with Markov Chain Models. Journal of Industrial Ecology 16,
334 – 342. doi: 10.1111 / j.1530 - 9290.2011.00425.x, ISSN: 1530-9290.
Edwards-Jones G�, L� Milà i Canals, N� Hounsome, M� Truninger, G� Koerber, B�
Hounsome, P� Cross, E� H� York, A� Hospido, K� Plassmann, I� M� Harris, R� T�
Edwards, G� A� S� Day, A� D� Tomos, S� J� Cowell, and D� L� Jones (2008)� Test-
ing the assertion that “local food is best”: the challenges of an evidence-based
approach. Trends in Food Science & Technology 19, 265 – 274. doi: 10.1016 / j.
tifs.2008.01.008, ISSN: 0924-2244.
EIO (2011)� The Eco-Innovation Challenge: Pathways to a Resource-Efficient
Europe. Eco-Innovation Observatory, Funded by the European Commission, DG
Environment, Brussels, 124 pp.
EIO (2012)� The Eco-Innovation Gap: An Economic Opportunity for Business. Eco-
Innovation Observatory, Funded by the European Commission, DG Environ-
ment, Brussels, 86 pp.
El-Haggar S� (2010)� Sustainable Industrial Design and Waste Management: Cra-
dle-to-Cradle for Sustainable Development. Elsevier Academic Press, San Diego,
CA, 421 pp. ISBN: 9780080550145.
EPA (2006a)� Municipal Solid Waste Generation, Recycling, and Disposal in the
United States: Facts and Figures for 2006. U. S. Environmental Protection
Agency, Washington, DC.
EPA (2006b)� Global Mitigation of Non-CO
2
Greenhouse Gas Emissions. United
States Environmental Protection Agency Office of Air and Radiation, Washing-
ton, D. C., USA, 438 pp.
EPA (2010a)� Available and Emerging Technologies for Reducing Greenhouse Gas
Emissions from the Nitric Acid Production Industry. U. S. Environmental Protec-
tion Agency, Washington, DC, 31 pp. Available at: http: / / www. epa. gov / nsr / ghg
docs / nitricacid.pdf.
EPA (2010b)� Available and Emerging Technologies for Reducing Greenhouse Gas
Emissions from the Iron and Steel Industry. U. S. Environmental Protection
Agency.

797797
Industry
10
Chapter 10
EPA (2012a)� Global Anthropogenic Non-CO
2
Greenhouse Gas Emissions:
1990 – 2030. U. S. Environmental Protection Agency, Washington, DC, 188 pp.
Available at: http: / / www. epa. gov / climatechange / Downloads / EPAactivities /
EPA_Global_NonCO2_Projections_Dec2012.pdf.
EPA (2012b)� Inventory of U. S. Greenhouse Gas Emissions and Sinks: 1990 – 2010.
U. S. Environmental Protection Agency, Washington, DC, 28 pp. Available at:
http: / / www. epa. gov / climatechange / ghgemissions / usinventoryreport / archive.
html.
EPA (2013)� Global Mitigation of Non-CO
2
Greenhouse Gases: 2010 – 2030. United
States Environmental Protection Agency, Washington, D. C., USA, 410 pp. Avail-
able at: http: / / www. epa. gov / climatechange / Downloads / EPAactivities / MAC_
Report_2013.pdf.
Eriksson H�, and S� Harvey (2004)� Black liquor gasification — conse-
quences for both industry and society. Energy 29, 581 – 612. doi: 10.1016 / j.
energy.2003.09.005, ISSN: 0360-5442.
Erisman J� W�, M� A� Sutton, J� Galloway, Z� Klimont, and W� Winiwarter (2008)�
How a century of ammonia synthesis changed the world. Nature Geoscience 1,
636 – 639. doi: 10.1038 / ngeo325, ISSN: 1752-0894.
Evans & Peck (2011)� Assessment of the Potential for Renewable Energy Projects
and Systems in the Pilbara. Autralian Department of Industry, Canberra, 230 pp.
Available at: http: / / www. innovation. gov. au / energy / documents / clean-energy-
program / acre / studies / warrea-pilbara.pdf.
Fane A� G� (2007)� Sustainability and membrane processing of wastewater for reuse.
Desalination 202, 53 – 58. doi: 10.1016 / j.desal.2005.12.038, ISSN: 0011-9164.
FAO (2013)� FAOSTAT. Available at: http: / / faostat.fao.org / site / 626 / DesktopDefault.
aspx?PageID=626#ancor.
Favoino E�, and D� Hogg (2008)� The potential role of compost in reducing green-
house gases. Waste Management & Research: The Journal of the International
Solid Wastes and Public Cleansing Association, ISWA 26, 61 – 69. ISSN: 0734-
242X.
Fine P�, and E� Hadas (2012)� Options to reduce greenhouse gas emissions dur-
ing wastewater treatment for agricultural use. Science of The Total Environment
416, 289 – 299. doi: 10.1016 / j.scitotenv.2011.11.030, ISSN: 0048-9697.
Fischer S�, S� Steger, N� D� Jordan, M� O’Brien, and P� Schepelmann (2012)�
Leasing Society. European Parliement, Directorate General for Internal Poli-
cies, Brussels, 62 pp. Available at: http: / / www. europarl. europa. eu / commit
tees / en / studies.html.
Fisher-Vanden K�, G� H� Jefferson, H� Liu, and Q� Tao (2004)� What is driving
China’s decline in energy intensity? Resource and Energy Economics 26, 77 – 97.
doi: 10.1016 / j.reseneeco.2003.07.002, ISSN: 0928-7655.
Flannery B� P�, and H� S� Kheshgi (2005)� An industry perspective on successful
deployment and global commercialization of innovative technologies for GHG
management. Intergovernmental Panel on Climate Change, Tokyo, Japan. 24 pp.
Fleiter T�, D� Fehrenbach, E� Worrell, and W� Eichhammer (2012a)� Energy effi-
ciency in the German pulp and paper industry — A model-based assessment of
saving potentials. Energy 40, 84 – 99. doi: 10.1016 / j.energy.2012.02.025, ISSN:
0360-5442.
Fleiter T�, E� Gruber, W� Eichhammer, and E� Worrell (2012b)� The German
energy audit program for firms—a cost-effective way to improve energy effici-
ency? Energy Efficiency 5, 447–469. doi: 10.1007/s12053-012-9157-7, ISSN:
1570-646X, 1570-6478.
Fleiter T�, S� Hirzel, and E� Worrell (2012c)� The characteristics of energy-efficiency
measures — a neglected dimension. Energy Policy 51, 502 – 513. doi: 10.1016 /
j.enpol.2012.08.054, ISSN: 0301-4215.
Fleiter T�, J� Schleich, and P� Ravivanpong (2012d)� Adoption of energy-efficiency
measures in SMEs — An empirical analysis based on energy audit data from
Germany. Energy Policy 51, 863 – 875. doi: 10.1016 / j.enpol.2012.09.041, ISSN:
0301-4215.
Fletcher K� (2008)� Sustainable Fashion and Textiles: Design Journeys. Earthscan,
Oxford, UK, 254 pp. ISBN: 9781844074815.
Flörke M�, E� Kynast, I� Bärlund, S� Eisner, F� Wimmer, and J� Alcamo (2013)�
Domestic and industrial water uses of the past 60 years as a mirror of socio-
economic development: A global simulation study. Global Environmental
Change 23, 144 – 156. doi: 10.1016 / j.gloenvcha.2012.10.018, ISSN: 0959-3780.
Foley J�, D� de Haas, K� Hartley, and P� Lant (2010)� Comprehensive life cycle
inventories of alternative wastewater treatment systems. Water Research 44,
1654 – 1666. doi: 10.1016 / j.watres.2009.11.031, ISSN: 0043-1354.
Fortin M�-J�, and C� Gagnon (2006)� Interpreting major industrial landscapes:
Social follow-up on meanings, the case of two aluminium smelters, Alcan
(Alma, Canada) and Pechiney (Dunkirk, France). Environmental Impact Assess-
ment Review 26, 725 – 745. doi: 10.1016 / j.eiar.2006.06.002, ISSN: 0195-9255.
Fritzson A�, and T� Berntsson (2006)� Energy efficiency in the slaughter and
meat processing industry — opportunities for improvements in future
energy markets. Journal of Food Engineering 77, 792 – 802. doi: 10.1016 / j.
jfoodeng.2005.08.005, ISSN: 02608774.
Galitsky C�, E� Worrell, and M� Ruth (2003)� Energy Efficiency Improvement and
Cost Saving Opportunities for the Corn Wet Milling Industry. US Environmental
Protection Agency, Washington, DC, 92 pp.
Gallagher K� S� (2006)� Limits to leapfrogging in energy technologies? Evidence
from the Chinese automobile industry. Energy Policy 34, 383 – 394.
Gao R� Y�, L� Shao, J� S� Li, S� Guo, M� Y� Han, J� Meng, J� B� Liu, F� X� Xu, and C� Lin
(2012)� Comparison of greenhouse gas emission accounting for a constructed
wetland wastewater treatment system. Ecological Informatics 12, 85 – 92. doi:
10.1016 / j.ecoinf.2012.05.007, ISSN: 1574-9541.
Gard D� L�, and G� A� Keoleian (2002)� Digital versus Print: Energy Performance
in the Selection and Use of Scholarly Journals. Journal of Industrial Ecology 6,
115 – 132. doi: 10.1162 / 108819802763471825, ISSN: 1530-9290.
Garnett T� (2009)� Livestock-related greenhouse gas emissions: impacts and
options for policy makers. Environmental Science & Policy 12, 491 – 503. doi:
10.1016 / j.envsci.2009.01.006, ISSN: 1462-9011.
Garnett T� (2011)� Where are the best opportunities for reducing greenhouse gas
emissions in the food system (including the food chain)? Food Policy 36, Sup-
plement 1, S23 – S32. doi: 10.1016 / j.foodpol.2010.10.010, ISSN: 0306-9192.
GEA (2012)� Global Energy Assessment Toward a Sustainable Future. Cambridge
University Press, Cambridge UK and New York, NY, USA and the International
Institute for Applied Systems Analysis, Laxenburg, Austria, 1882 pp. ISBN: 9780
52118 2935.
Geels F� W�, and J� W� Schot (2010)� Part 1: The Dynamics of Transitions: A Socio-
Technical Perspective. In: Transitions to sustainable development : new direc-
tions in the study of long term transformative change (eds. J. Grin, J. Rot-
mans and J. W. Schot). Routledge, New York, pp. 397. ISBN: 9780415876759
0415876753.

798798
Industry
10
Chapter 10
Geller H�, P� Harrington, A� H� Rosenfeld, S� Tanishima, and F� Unander (2006)�
Polices for increasing energy efficiency: Thirty years of experience in OECD
countries. Energy Policy 34, 556 – 573. doi: 10.1016 / j.enpol.2005.11.010, ISSN:
0301-4215.
Geng Y�, R� Côté, and F� Tsuyoshi (2007)� A quantitative water resource plan-
ning and management model for an industrial park level. Regional Environmen-
tal Change 7, 123 – 135. doi: 10.1007 / s10113 - 007 - 0026 - 4, ISSN: 1436-3798,
1436 – 378X.
Geng Y�, and B� Doberstein (2008)� Developing the circular economy in China:
Challenges and opportunities for achieving “leapfrog development.” Interna-
tional Journal of Sustainable Development & World Ecology 15, 231 – 239. doi:
10.3843 / SusDev.15.3:6, ISSN: 1350-4509.
Geng Y�, T� Fujita, and X� Chen (2010a)� Evaluation of innovative municipal solid
waste management through urban symbiosis: a case study of Kawasaki. Journal
of Cleaner Production 18, 993 – 1000. doi: 10.1016 / j.jclepro.2010.03.003, ISSN:
0959-6526.
Geng Y�, X� Wang, Q� Zhu, and H� Zhao (2010b)� Regional initiatives on promot-
ing cleaner production in China: a case of Liaoning. Journal of Cleaner Produc-
tion 18, 1502 – 1508. doi: 10.1016 / j.jclepro.2010.06.028, ISSN: 0959-6526.
Geng Y�, P� Zhang, R� P� Côté, and T� Fujita (2009)� Assessment of the National
Eco-Industrial Park Standard for Promoting Industrial Symbiosis in China. Jour-
nal of Industrial Ecology 13, 15 – 26. doi: 10.1111 / j.1530 - 9290.2008.00071.x,
ISSN: 1530-9290.
Geng Y�, P� Zhang, R� P� Côté, and Y� Qi (2008)� Evaluating the applicability of
the Chinese eco-industrial park standard in two industrial zones. Interna-
tional Journal of Sustainable Development & World Ecology 15, 543 – 552. doi:
10.1080 / 13504500809469850, ISSN: 1350-4509.
Genon G�, and E� Brizio (2008)� Perspectives and limits for cement kilns as a
destination for RDF. Waste Management (New York, N. Y.) 28, 2375 – 2385. doi:
10.1016 / j.wasman.2007.10.022, ISSN: 0956-053X.
Germond-Duret C� (2012)� Extractive Industries and the Social Dimension of Sus-
tainable Development: Reflection on the Chad – Cameroon Pipeline. Sustainable
Development. doi: 10.1002 / sd.1527, ISSN: 1099-1719.
Getzner M� (2002)� The quantitative and qualitative impacts of clean technologies
on employment. Journal of Cleaner Production 10, 305 – 319.
Geyer R� (2008)� Parametric assessment of climate change impacts of auto-
motive material substitution. Environmental Science and Technology 42,
6973 – 6979. Available at: http: / / www. scopus. com / inward / record.url?eid=2-
s2.0 - 51949084412&partnerID=40&md5=44228ce12a2f785fd87a95a269
81c779.
Ghosh D�, and J� Roy (2011)� Approach to Energy Efficiency among Micro, Small
and Medium Enterprises in India: Results of a Field Survey. United Nations
Industrial Development Organization, Vienna, 42 pp.
Gillingham K�, R� G� Newell, and K� Palmer (2009)� Energy Efficiency Econom-
ics and Policy. National Bureau of Economic Research, Cambridge, MA, 40 pp.
Available at: http: / / www. nber. org / papers / w15031.
Gnansounou E� (2008)� Assessing the energy vulnerability: Case of industrialised
countries. Energy Policy 36, 3734 – 3744. Available at: http: / / ideas.repec.
org / a / eee / enepol / v36y2008i10p3734 - 3744.html.
Goldemberg J� (1998)� Leapfrog energy technologies. Energy Policy 26, 729 – 741.
Gössling S� (2010)� Carbon Management in Tourism: Mitigating the Impacts on
Climate Change. Routledge, New York, 358 pp. ISBN: 978 - 0-415 - 56633 - 9.
Gössling S�, J�-P� Ceron, G� Dubois, and M� C� Hall (2009)� Hypermobile travellers.
In: Climate change and aviation. Issues, Challenges and solutions. Eds Upham,
P. and Gössling, S. Earthscan, London, pp. 131 – 151. ISBN: 9781844076208.
Gössling S�, C� M� Hall, P� M� Peeters, and D� Scott (2010)� The Future of Tour-
ism: Can Tourism Growth and Climate Policy be Reconciled? A Climate Change
Mitigation Perspective. Tourism Recreation Research 35, 119 – 130. ISSN: 0250-
8281.
Gössling S�, P� Peeters, J�-P� Ceron, G� Dubois, T� Patterson, and R� B� Richard-
son (2005)� The eco-efficiency of tourism. Ecological Economics 54, 417 – 434.
doi: 10.1016 / j.ecolecon.2004.10.006, ISSN: 0921-8009.
Graedel T� E� (2010)� Metal Stocks in Society: Scientific Synthesis. United Nations
Environment Programme, Nairobi, Kenya, 48 pp. ISBN: 9789280730821.
Graedel T� E�, J� Allwood, J�-P� Birat, M� Buchert, C� Hagelüken, B� K� Reck, S� F�
Sibley, and G� Sonnemann (2011)� What Do We Know About Metal Recycling
Rates? Journal of Industrial Ecology 15, 355 – 366. doi: 10.1111 / j.1530 - 9290.20
11.00342.x, ISSN: 1530-9290.
Gruber E�, and M� Brand (1991)� Promoting energy conservation in small and
medium-sized companies. Energy Policy 19, 279 – 287.
GTZ / Holcim (2006)� Guidelines on Co-Processing Waste Materials in Cement
Production. Deutsche Gesellschaft Für Tchnische Zusammenarbeit GmbH,
Eschborn, 135 pp. Available at: http: / / www. coprocem. org / Guidelines / unterord
ner / guideline_coprocem_v06 - 06.pdf / view.
Guha A� (2013)� The Macro-Costs of Forced Displacement of the Farmers in India:
A Micro-Level Study. European Journal of Development Research advance
online publication 31 January 2013. doi: 10.1057 / ejdr.2012.37.
Gunders D� (2012)� Wasted: How America Is Losing Up to 40 Percent of Its Food
from Farm to Fork to Landfill. National Resources Defence Council, Washington,
DC, 26 pp. Available at: http: / / www. nrdc. org / food / files / wasted-food-IP.pdf.
Gustavsonn J�, C� Cederberg, U� Sonesson, R� van Otterdijk, and A� Meybeck
(2011)� Global Food Losses and Food Waste. United Nations Food and Agricul-
ture Organization. Düsseldorf, 38 pp.
Gutowski T� G�, S� Sahni, J� M� Allwood, M� F� Ashby, and E� Worrell (2013)� The
energy required to produce materials: constraints on energy-intensity improve-
ments, parameters of demand. Philosophical Transactions of the Royal Soci-
ety A: Mathematical, Physical and Engineering Sciences 371, 20120003. doi:
10.1098 / rsta.2012.0003, ISSN: 1364-503X, 1471 – 2962.
Haines A�, A� J� McMichael, K� R� Smith, I� Roberts, J� Woodcock, A� Markan-
dya, B� G� Armstrong, D� Campbell-Lendrum, A� D� Dangour, M� Davies, N�
Bruce, C� Tonne, M� Barrett, and P� Wilkinson (2009)� Public health benefits
of strategies to reduce greenhouse-gas emissions: overview and implications
for policy makers. The Lancet 374, 2104 – 2114.
Hall D� S� (2007)� Mandatory Regulation of Nontraditional Greenhouse Gases:
Policy Options for Industrial Process Emissions and Non-CO
2
Gases. Resources
for the Future, Washington, DC, 6 pp. Available at: http: / / www. rff. org / Publica
tions / Pages / CPF_AssessingUSClimatePolicyOptions_IB14.aspx.
Halsnæs K�, A� Garg, J� Christensen, H� Y� Føyn, M� Karavai, E� L� Rovere, M�
Bramley, X� Zhu, C� Mitchell, J� Roy, K� Tanaka, H� Katayama, C� Mena,
I� Obioh, I� Bashmakov, S� Mwakasonda, M�-K� Lee, M� Vinluan, Y� J�
Huang, and L� Segafredo (2014)� Climate change mitigation policy para-
digms — national objectives and alignments. Mitigation and Adaptation Strat-
egies for Global Change 19, 45 – 71. doi: 10.1007 / s11027 - 012 - 9426-y, ISSN:
1381-2386, 1573 – 1596.

799799
Industry
10
Chapter 10
Hand A� (2007)� Technology Options for the Cement Industry with the Use of Alter-
native Fuels. KHD Humboldt Wedag GmbH, Athens, Greece. 35 pp. Available at:
http: / / alf-cemind.com / docs / presentations / KHD%20presentation.pdf.
Haque N�, and T� Norgate (2013)� Estimation of greenhouse gas emissions
from ferroalloy production using life cycle assessment with particular refer-
ence to Australia. Journal of Cleaner Production 39, 220 – 230. doi: 10.1016 / j.
jclepro.2012.08.010, ISSN: 0959-6526.
Hasanbeigi A�, M� Arens, and L� Price (2013a)� Emerging Energy-Efficiency
and Greenhouse Gas Mitigation Technologies for the Iron and Steel Industry.
Lawrence Berkeley National Laboratory, Berkeley, CA, 125 pp. Available at:
http: / / china.lbl.gov / sites / all / files / 6106e-steel-tech.pdf.
Hasanbeigi A�, A� Lobscheid, H� Lu, L� Price, and Y� Dai (2013b)� Quantifying
the co-benefits of energy-efficiency policies: A case study of the cement indus-
try in Shandong Province, China. Science of The Total Environment 458 – 460,
624 – 636.
Hasanbeigi A�, C� Menke, and P� Pont (2009)� Barriers to energy efficiency
improvement and decision-making behavior in Thai industry. Energy Efficiency
3, 33 – 52. doi: 10.1007 / s12053 - 009 - 9056 - 8, ISSN: 1570-646X, 1570 – 6478.
Hasanbeigi A�, C� Menke, and A� Therdyothin (2010a)� The use of conservation
supply curves in energy policy and economic analysis: The case study of Thai
cement industry. Energy Policy 38, 392 – 405. doi: 10.1016 / j.enpol.2009.09.030,
ISSN: 0301-4215.
Hasanbeigi A�, C� Menke, and A� Therdyothin (2011)� Technical and cost assess-
ment of energy efficiency improvement and greenhouse gas emission reduction
potentials in Thai cement industry. Energy Efficiency 4, 93 – 113. doi: 10.1007 /
s12053 - 010 - 9079 - 1, ISSN: 1570-646X, 1570 – 6478.
Hasanbeigi A�, W� Morrow, E� Masanet, J� Sathaye, and T� Xu (2012a)� Assess-
ment of Energy Efficiency Improvement and CO
2
Emission Reduction Potentials
in the Cement Industry in China. Lawrence Berkeley National Laboratory, Berke-
ley, CA, 51 pp.
Hasanbeigi A�, W� Morrow, J� Sathaye, E� Masanet, and T� Xu (2013c)� A bot-
tom-up model to estimate the energy efficiency improvement and CO
2
emis-
sion reduction potentials in the Chinese iron and steel industry. Energy 50,
315 – 325. doi: 10.1016 / j.energy.2012.10.062, ISSN: 0360-5442.
Hasanbeigi A�, and L� Price (2012)� A review of energy use and energy effi-
ciency technologies for the textile industry. Renewable and Sustainable Energy
Reviews 16, 3648 – 3665. doi: 10.1016 / j.rser.2012.03.029, ISSN: 1364-0321.
Hasanbeigi A�, L� Price, and E� Lin (2012b)� Emerging energy-efficiency and CO
2
emission-reduction technologies for cement and concrete production: A techni-
cal review. Renewable and Sustainable Energy Reviews 16, 6220 – 6238. doi:
10.1016 / j.rser.2012.07.019, ISSN: 1364-0321.
Hasanbeigi A�, L� Price, H� Lu, and W� Lan (2010b)� Analysis of energy-effi-
ciency opportunities for the cement industry in Shandong Province, China:
A case study of 16 cement plants. Energy 35, 3461 – 3473. doi: 10.1016 / j.
energy.2010.04.046, ISSN: 0360-5442.
Hasanuzzaman M�, N� A� Rahim, M� Hosenuzzaman, R� Saidur, I� M� Mahbubul,
and M� M� Rashid (2012)� Energy savings in the combustion based process
heating in industrial sector. Renewable and Sustainable Energy Reviews 16,
4527 – 4536. doi: 10.1016 / j.rser.2012.05.027, ISSN: 1364-0321.
Hashimoto S�, T� Fujita, Y� Geng, and E� Nagasawa (2010)� Realizing CO
2
emis-
sion reduction through industrial symbiosis: A cement production case study for
Kawasaki. Resources Conservation and Recycling 54, 704 – 710. doi: 10.1016 / j.
resconrec.2009.11.013.
Hatayama H�, I� Daigo, Y� Matsuno, and Y� Adachi (2010)� Outlook of the World
Steel Cycle Based on the Stock and Flow Dynamics. Environmental Science &
Technology 44, 6457 – 6463. doi: 10.1021 / es100044n, ISSN: 0013-936X.
He P�, N� Yang, H� Gu, H� Zhang, and L� Shao (2011)� N
2
O and NH
3
emissions from
a bioreactor landfill operated under limited aerobic degradation conditions.
Journal of Environmental Sciences 23, 1011 – 1019. doi: 10.1016 / S1001 - 0742
(10)60574 - 8, ISSN: 1001-0742.
Heijnes H�, M� van Brummelen, and K� Blok (1999)� Reduction of the Emissions
of HFC’s, PFC’s and SF6 in the European Union. Ecofys, Utrecht, Netherlands,
58 pp.
Hekkert M� P�, L� A� Joosten, E� Worrell, and W� C� Turkenburg (2000)� Reduction
of CO
2
emissions by improved management of material and product use: the
case of primary packaging. Resources, Conservation and Recycling 29, 33 – 64.
doi: 10.1016 / S0921 - 3449(99)00056 - 7, ISSN: 0921-3449.
Hekkert M� P�, J� van den Reek, E� Worrell, and W� C� Turkenburg (2002)� The
impact of material efficient end-use technologies on paper use and carbon
emissions. Resources, Conservation and Recycling 36, 241 – 266. doi: 10.1016 / S
0921 - 3449(02)00081 - 2, ISSN: 0921-3449.
Henriques Jr� M� F�, F� Dantas, and R� Schaeffer (2010)� Potential for reduction
of CO
2
emissions and a low-carbon scenario for the Brazilian industrial sector.
Energy Policy 38, 1946 – 1961. doi: 10.1016 / j.enpol.2009.11.076, ISSN: 0301-
4215.
Heyer K�-U�, K� Hupe, M� Ritzkowski, and R� Stegmann (2005)� Pollutant release
and pollutant reduction — Impact of the aeration of landfills. Waste Manage-
ment 25, 353 – 359. doi: 10.1016 / j.wasman.2005.02.007, ISSN: 0956-053X.
Hogg D�, C� Sherrington, and T� Vergunst (2011)� A Comparative Study on Eco-
nomic Instruments Promoting Waste Prevention. Eunomia Research and Con-
sulting Ltd, Bristol, 185 pp. Available at: http: / / www. eunomia. co. uk / shopim-
ages / Waste%20Prevention%20Final%20Report%2023.12.2011.pdf.
Holmgren K�, and A� Gebremedhin (2004)� Modelling a district heating system:
Introduction of waste incineration, policy instruments and co-operation with an
industry. Energy Policy 32, 1807 – 1817. doi: 10.1016 / S0301 - 4215(03)00168-X,
ISSN: 0301-4215.
Hong G�-B�, T�-L� Su, J�-D� Lee, T�-C� Hsu, and H�-W� Chen (2010)� Energy conser-
vation potential in Taiwanese textile industry. Energy Policy 38, 7048 – 7053.
doi: 10.1016 / j.enpol.2010.07.024, ISSN: 0301-4215.
Hoornweg D�, and P� Bhada-Tata (2012)� What a Waste: A Global Review of
Solid Waste Management. World Bank, Washington D. C., 116 pp. Available at:
http: / / go.worldbank.org / BCQEP0TMO0.
Horbach J�, and K� Rennings (2013)� Environmental innovation and employ-
ment dynamics in different technology fields — an analysis based on the Ger-
man Community Innovation Survey 2009. Journal of Cleaner Production 57,
158 – 165.
HPTCJ (2010)� Survey of Availability of Heat Pumps in the Food and Beverage Sec-
tor. Heat Pump and Thermal Technology Centre of Japan, Tokyo, Japan, 61 pp.
Available at: http: / / www. hptcj. or. jp / e / publication / tabid / 360 / Default.aspx.
IAI (2009)� Global Aluminium Recycling: A Cornerstone of Sustainable Develop-
ment. International Aluminium Institute, London, UK, 36 pp. Available at:
http: / / www. world-aluminium. org / cache / fl0000181.pdf.
IBEF (2013)� MSMEs and the Growing Role of Industrial Clusters. A Report by
Indian Brand Equity Foundation. India Brand Equity Foundation, Haryana, India,
10 pp. Available at: http: / / www. ibef. org / download / MSME-040213.pdf.

800800
Industry
10
Chapter 10
ICCA (2009)� Innovations for Greenhouse Gas Reductions — Life Cycle Quantifica-
tion of Carbon Abatement Solutions Enabled by the Chemical Industry. Interna-
tional Council of Chemical Associations, Brussels, 108 pp.
ICSG (2012)� The World Copper Factbook 2012. International Copper Study Group,
Lisbon, Portugal, 59 pp. Available at: http: / / www. icsg. org / index.php / compo
nent / jdownloads / finish / 170 / 1188.
IEA (2007)� Tracking Industrial Energy Efficiency and CO
2
Emissions. International
Energy Agency, Paris, 324 pp.
IEA (2008)� Combined Heat and Power: Evaluating the Benefits of Greater Global
Investment. International Energy Agency, Paris, France, 39 pp. Available at:
http: / / www. iea. org / publications / freepublications / publication / chp_report.pdf.
IEA (2009a)� Cogeneration and District Energy. Sustainable Energy Technologies
for Today... and Tomorrow. International Energy Agency, Paris, France, 42 pp.
Available at: http: / / www. oecd-ilibrary. org / energy / cogeneration-and-district-
energy_9789264077171-en.
IEA (2009b)� Energy Technology Perspectives 2010. Scenarios and Strategies to
2050. International Energy Agency, Paris, 710 pp. Available at: http: / / www. iea.
org / publications / freepublications / publication / name,26100,en.html.
IEA (2009c)� Energy Technology Transitions for Industry. Strategies for the Next
Industrial Revolution. International Energy Agency, Paris.
IEA (2009d)� Energy Technology Transitions for Industry. Strategies for the Next
Industrial Revolution. International Energy Agency, Paris, 6 pp. Available at:
http: / / www. iea. org / Textbase / npsum / industry2009sum.pdf.
IEA (2009e)� Chemical and Petrochemical Sector: Potential of Best Practice Technol-
ogy and Other Measures for Improving Energy Efficiency. International Energy
Agency, Paris, 60 pp. Available at: http: / / www. iea. org / publications / freepublica-
tions / publication / chemical_petrochemical_sector.pdf.
IEA (2011a)� World Energy Outlook 2011 Special Report: Are We Entering a Golden
Age of Gas? International Energy Agency, Paris. Available at: http: / / www.
worldenergyoutlook. org / goldenageofgas / .
IEA (2011b)� Co-Generation and Renewables: Solutions for a Low-Carbon
Energy Future. International Energy Agency, Paris, France, 35 pp. Available at:
http: / / www. iea. org / publications / freepublications / publication / name,3980,en.
html.
IEA (2012a)� CO
2
Emissions from Fuel Combustion. Beyond 2020 Online Data-
base. 2012 Edition. International Energy Agency, Paris, 83 pp. Available at:
http: / / data.iea.org.
IEA (2012b)� Energy Balances of OECD Countries. International Energy Agency,
Paris, 330 pp. ISBN: 9789264180390 (PDF); 9789264173828 (print).
IEA (2012c)� Energy Balances of Non-OECD Countries. International Energy Agency,
Paris, 540 pp. ISBN: 9789264174672 (PDF); 9789264174665 (print).
IEA (2012d)� Energy Technology Perspectives 2012: Pathways to a Clean Energy
System. International Energy Agency (IEA), Paris, France, 690 pp. ISBN:
978 - 92 - 64 - 17488 - 7.
IEA (2012e)� World Energy Outlook 2012. Organisation for Economic Co-opera-
tion and Development, Paris, France, 690 pp. ISBN: 9789264181342 (PDF) ;
9789264180840 (print).
IEA (2013)� World Energy Balances – 2013 Edition. Database and documentation.
Available at: http: / / iea.org / statistics / topics / energybalances / .
IEA ETSAP (2010)� Cement Production. International Energy Agency Energy Tech-
nology Network, Paris, 8 pp. Available at: www. etsap. org.
IEA / WBCSD (2009)� Cement Technology Roadmap 2009: Carbon Emissions
Reductions up to 2050. International Energy Agency / World Business Council
for Sustainable Development, Paris, 36 pp. Available at: http: / / www. wbcsd.
org / Pages / EDocument / EDocumentDetails.aspx?ID=11423&NoSearchContextK
ey=true.
IEAGHG (2008)� CO
2
Capture in the Cement Industry. IEA Greenhouse Gas R&D
Programme, Cheltenham, UK, 221 pp. Available at: www. ieagreen. org. uk.
IFA (2009)� Fertilizers, Climate Change and Enhancing Agricultural Productivity Sus-
tainably. International Fertilizer Industry Association, Paris, France. Available at:
www. fertilizer. org / ifa / content / download / 23000 / 329421 / version / 1 / file / 2009_
ifa_climate_change.pdf.
IIED (2002)� The Report of the Mining, Minerals and Sustainable Development
Project. International Institute for Environment and Development, London, 476
pp. Available at: http: / / www. iied. org / sustainable-markets / key-issues / business-
and-sustainable-development / mining-minerals-and-sustainable-development.
IMA (2009)� Year Ending Statistics: 2009. International Magnesium Association,
Wauconda, IL, 1 pp. Available at: http: / / www. intlmag. org / files / yend2009rev.
pdf.
INCCA (2010)� India: Greenhouse Gas Emissions 2007. Indian Network for Climate
Change Assessment. Ministry of Environment and Forests, Government of India,
New Delhi, India, 84 pp. Available at: http: / / moef.nic.in / downloads / public-
information / Report_INCCA.pdf.
India Planning Commission (2007)� Report of the Task Force for the Eleventh
Five Year Plan (2007 – 12) on Cement Submitted to the Planning Commission
of India. India Planning Commission, New Delhi, India, 154 pp. Available at:
http: / / planningcommission.nic.in / aboutus / committee / wrkgrp11 / wg11_
cement.pdf.
International Finance Corporation (2007)� Environmental, Health and
Safety Guidelines for Integrated Steel Mills. International Finance Corpora-
tion, Washington, DC, 27 pp. Available at: http: / / www. ifc. org / wps / wcm /
connect / 0b9c2500488558848064d26a6515bb18 / Final%2B-%2BIntegrated
%2BSteel%2BMills.pdf?MOD=AJPERES&id=1323161945237.
Intlekofer K�, B� Bras, and M� Ferguson (2010)� Energy Implications of Prod-
uct Leasing. Environmental Science & Technology 44, 4409 – 4415. doi:
10.1021 / es9036836, ISSN: 0013-936X.
IPCC (2006)� Chapter 2: Stationary Combustion, Table 2.2 [D. R. Gomez, J. D. Wat-
terson, B. B. Americano, C. Ha, G. Marland, E. Matsika, L. N. Namayanga,
B. Osman-Elasha, J. D. Kalenga Saka, K. Treanton (eds.)]. In: IPCC Guide-
lines for Greenhouse Gas Inventories Volume 2: Energy. pp. 15. Available at:
http: / / www. ipcc-nggip. iges. or. jp / public / 2006gl / pdf / 2_Volume2 / V2_2_Ch2_
Stationary_Combustion.pd.
IPCC (2007)� Climate Change Mitigation. Contribution of Working Group III to the
Fourth Assessment Report of the Intergovernmental Panel on Climate Change
[B. Metz, O. R. Davidson, P. R. Bosch, R. Dave, L. A. Meyer (eds)]. Cambridge Uni-
versity Press, Cambridge, United Kingdom and New York, NY, USA, 862pp. Avail-
able at: http: / / www. ipcc. ch / publications_and_data / ar4 / wg3 / en / contents.html.
IPCC / TEAP (2005)� Special Report on Safeguarding the Ozone Layer and the Global
Climate System: Issues Related to Hydrofluorocarbons and Perfluorocarbons [D.
de Jager, M. Manning, L. Kuijpers (eds.)]. Intergovernmental Panel on Climate
Change, Addis Ababa, 720 pp.
ISMI (2005)� Reduction of Perfluorocompound (PFC) Emissions: 2005 State-of-the-
Technology Report. Sematech, Inc., New York, 80 pp. Available at: http: / / www.
sematech. org / docubase / document / 4693aeng.pdf.

801801
Industry
10
Chapter 10
Jackson T� (2009)� Prosperity without Growth: Economics for a Finite Planet. Earth-
scan Publications, London, 264 pp. ISBN: 9781844078943.
Jackson T� (2011)� Societal transformations for a sustainable economy. Natural
Resources Forum 35, 155 – 164. doi: 10.1111 / j.1477 - 8947.2011.01395.x, ISSN:
1477-8947.
Jacobs, and IPST (2006)� Pulp and Paper Industry: Energy Bandwidth Study. Report
for American Institute of Chemical Engineers (AIChE). Jacobs Greenville and
Institute of Paper Science and Technology (IPST) at Georgia Institute of Tech-
nology, Atlanta, 116 pp. Available at: http: / / www1. eere. energy. gov / industry /
forest / pdfs / doe_bandwidth.pdf.
Jeon Y�, B� I� Park, and P� N� Ghauri (2013)� Foreign direct investment spillover
effects in China: Are they different across industries with different tech-
nological levels? China Economic Review 26, 105 – 117. doi: 10.1016 / j.
chieco.2013.05.001, ISSN: 1043-951X.
De Jong P� (1997)� The Structure of the Dutch Waste Sector and Impediments
for Waste Reduction. Waste Management & Research 15, 641 – 658. ISSN:
0734242x.
JRC / PBL (2013)� Emission Database for Global Atmospheric Research (EDGAR),
Release Version 4.2 FT2010. European Commission, Joint Research Cen-
tre (JRC) / PBL Netherlands Environmental Assessment Agency. Available at:
http: / / edgar.jrc.ec.europa.eu.
Kainuma M�, K� Miwa, T� Ehara, O� Akashi, and Y� Asayama (2013)� A low carbon
society: global visions, pathways, and challenges. Climate Policy 13, 6 – 22.
Kainuma M�, P� R� Shukla, and K� Jiang (2012)� Framing and modeling of a low
carbon society: An overview. Energy Economics 34, Supplement 3, 316 – 324.
Kampschreur M� J�, H� Temmink, R� Kleerebezem, M� S� M� Jetten, and M� C� M�
van Loosdrecht (2009)� Nitrous oxide emission during wastewater treatment.
Water Research 43, 4093 – 4103. doi: 10.1016 / j.watres.2009.03.001, ISSN:
0043-1354.
Karakurt I�, G� Aydin, and K� Aydiner (2012)� Sources and mitigation of meth-
ane emissions by sectors: A critical review. Renewable Energy 39, 40 – 48. doi:
10.1016 / j.renene.2011.09.006, ISSN: 0960-1481.
Karstensen K� H� (2007)� A Literature Review on Co-Processing of Alternative
Fuels and Raw Materials and Hazardous Wastes in Cement Kilns. Depart-
ment for Environmental Affairs and Tourism, Republic of South Africa, Preto-
ria, South Africa, 420 pp. Available at: http: / / www. aitec-ambiente. org / Por
tals / 2 / docs / pubblici / Documenti / Raccolta%20bibliografica / Coprocessing%20
literature%20review%202007.pdf.
Kelly T� D�, and G� R� Matos (2013)� Historical statistics for mineral and material
commodities in the United States (2013 version): U. S. Geological Survey Data
Series 140. Available at: http: / / minerals.usgs.gov / ds / 2005 / 140 / .
Kheshgi H� S�, H� Thomann, N� A� Bhore, R� B� Hirsch, M� E� Parker, and G�
Teletzke (2012)� Perspectives on CCS Cost and Economics. SPE Economics &
Management 4, pp. 24 – 31. Available at: https: / / www. onepetro. org / journal-
paper / SPE-139716-PA.
Kim H�-J�, G� A� Keoleian, and S� J� Skerlos (2011)� Economic Assessment of
Greenhouse Gas Emissions Reduction by Vehicle Lightweighting Using Alumi-
num and High-Strength Steel. Journal of Industrial Ecology 15, 64 – 80. Available
at: http: / / www. scopus. com / inward / record.url?eid=2-s2.0 - 79951741778&part
nerID=40&md5=75f547396a1bb6a3fe9752ca3305352e.
Kim H�-J�, C� McMillan, G� A� Keoleian, and S� J� Skerlos (2010)� Greenhouse
Gas Emissions Payback for Lightweighted Vehicles Using Aluminum and
High-Strength Steel. Journal of Industrial Ecology 14, 929 – 946. Available at:
http: / / www. scopus. com / inward / record.url?eid=2-s2.0 - 78650144733&partnerI
D=40&md5=9aed1688a221972175249aabd21d91ad.
Kimura O�, and F� Noda (2010)� Effectiveness of Energy Audit Programs in Japan.
Central Research Institute of the Electric Power Industry (CRIEPI), Tokyo, Japan,
48 pp. Available at: http: / / criepi.denken.or.jp / jp / kenkikaku / report / detail /
Y09009.html.
Klee H�, R� Hunziker, R� van der Meer, and R� Westaway (2011)� Getting the
numbers right: a database of energy performance and carbon dioxide emissions
for the cement industry. Greenhouse Gas Measurement and Management 1,
109 – 118. doi: 10.1080 / 20430779.2011.579357.
Klinglmair M�, and J� Fellner (2010)� Urban Mining in Times of Raw Material
Shortage. Journal of Industrial Ecology 14, 666 – 679. doi: 10.1111 / j.1530 - 9290
.2010.00257.x, ISSN: 1530-9290.
Kollmus A�, and M� Lazarus (2010)� Industrial N
2
O Projects Under the CDM: The
Case of Nitric Acid Production. Stockholm Environment Institute, Stockholm, 3
pp.
Kong L�, A� Hasanbeigi, and L� Price (2012)� Emerging Energy-Efficiency and
Greenhouse Gas Mitigation Technologies for the Pulp and Paper Industry.
Lawrence Berkeley National Laboratory, Berkeley, CA, 111 pp. Available at:
http: / / china.lbl.gov / sites / all / files / lbl-5956e-pulp-and-paperrev-dec-2012.pdf.
Kong L�, A� Hasanbeigi, L� Price, and H� Liu (2013)� Analysis of Energy-Efficiency
Opportunities for the Pulp and Paper Industry in China. Lawrence Berke-
ley National Laboratory, Berkeley, CA, 49 pp. Available at: http: / / china.lbl.
gov / sites / all / files / 6107e-ppi-csc.pdf.
Kramer K� J�, E� Masanet, T� Xu, and E� Worrell (2009)� Energy Efficiency
Improvement and Cost Saving Opportunities for the Pulp and Paper Industry:
An ENERGY STAR Guide for Energy and Plant Managers. Lawrence Berkeley
National Laboratory, Berkeley, CA, 176 pp. Available at: http: / / www. energystar.
gov / ia / business / industry / downloads / Pulp_and_Paper_Energy_Guide.pdf.
Kruyt B�, D� P� van Vuuren, H� J� M� de Vries, and H� Groenenberg (2009)� Indica-
tors for energy security. Energy Policy 37, 2166 – 2181.
Kugler M� (2006)� Spillovers from foreign direct investment: Within or between
industries? Journal of Development Economics 80, 444 – 477. Available at:
http: / / ideas.repec.org / a / eee / deveco / v80y2006i2p444 - 477.html.
Kuramochi T�, A� Ramírez, W� Turkenburg, and A� Faaij (2012a)� Comparative
assessment of CO
2
capture technologies for carbon-intensive industrial pro-
cesses. Progress in Energy and Combustion Science 38, 87 – 112. doi: 10.1016 /
j.pecs.2011.05.001, ISSN: 0360-1285.
Kuramochi T�, A� Ramírez, W� Turkenburg, and A� Faaij (2012b)� Effect of CO
2
capture on the emissions of air pollutants from industrial processes. Inter-
national Journal of Greenhouse Gas Control 10, 310 – 328. doi: 10.1016 /
j.ijggc.2012.05.022, ISSN: 1750-5836.
Larsen T� A�, K� M� Udert, and Lienert Judit (2013)� Source Separation and Decen-
tralization for Wastewater Management. IWA Publishing Alliance House, Lon-
don, UK, 491 pp. ISBN: 9781843393481.
Laurijssen J�, A� Faaij, and E� Worrell (2012)� Benchmarking energy use in the
paper industry: a benchmarking study on process unit level. Energy Efficiency 6,
49 – 63. doi: 10.1007 / s12053 - 012 - 9163 - 9, ISSN: 1570-646X, 1570 – 6478.

802802
Industry
10
Chapter 10
Laurijssen J�, F� J� De Gram, E� Worrell, and A� Faaij (2010a)� Optimizing the
energy efficiency of conventional multi-cylinder dryers in the paper industry.
Energy 35, 3738 – 3750. doi: 10.1016 / j.energy.2010.05.023, ISSN: 0360-5442.
Laurijssen J�, M� Marsidi, A� Westenbroek, E� Worrell, and A� Faaij (2010b)�
Paper and biomass for energy?: The impact of paper recycling on energy and
CO
2
emissions. Resources, Conservation and Recycling 54, 1208 – 1218. doi:
10.1016 / j.resconrec.2010.03.016, ISSN: 0921-3449.
Law Y�, L� Ye, Y� Pan, and Z� Yuan (2012)� Nitrous oxide emissions from wastewater
treatment processes. Philosophical Transactions of the Royal Society of London.
Series B, Biological Sciences 367, 1265 – 1277. doi: 10.1098 / rstb.2011.0317,
ISSN: 1471-2970.
Layard R� (2011)� Happiness: Lessons from a New Science. Penguin Books, London,
UK, 384 pp. ISBN: 9780241952795.
Laybourn P�, and M� Morrissey (2009)� National Industrial Symbiosis Pro-
gramme — The Pathway to a Low Carbon Sustainable Economy. National
Industrial Symbiosis Programme, Birmingham, 53 pp. Available at: www. wrap.
org. uk / sites / files / wrap / Pathway%20Report.pdf.
LBNL, and AISI (2010)� The State-of-the-Art Clean Technologies (SOACT) for
Steelmaking Handbook, 2nd Edition. Lawrence Berkeley National Laboratory
Berkeley, California American Iron and Steel Institute, Washington, DC, 138 pp.
Available at: http: / / asiapacificpartnership.org / pdf / Projects / Steel / SOACT-Hand
book-2nd-Edition.pdf.
LBNL, and RDC (2007)� Improving Process Heating System Performance: A Source-
book for Industry. Second Edition. Lawrence Berkeley National Laboratory
and Resource Dynamics Corporation, Washington, DC, 114 pp. Available at:
http: / / www1. eere. energy. gov / manufacturing / tech_deployment / pdfs / process_
heating_sourcebook2.pdf.
Le H� Q�, and R� Pomfret (2011)� Technology spillovers from foreign direct invest-
ment in Vietnam: horizontal or vertical spillovers? Journal of the Asia Pacific
Economy 16, 183 – 201. doi: 10.1080 / 13547860.2011.564746, ISSN: 1354-
7860.
Leal-Ayala D� R�, J� M� Allwood, M� Schmidt, and I� Alexeev (2012)� Toner-
Print Removal from Paper by Long and Ultrashort Pulsed Lasers. Proceedings
of the Royal Society A: Mathematical, Physical and Engineering Science 468,
2272 – 2293. doi: 10.1098 / rspa.2011.0601, ISSN: 1364-5021, 1471 – 2946.
Lee T�, and S� van de Meene (2013)� Comparative studies of urban climate co-
benefits in Asian cities: an analysis of relationships between CO
2
emissions and
environmental indicators. Journal of Cleaner Production 58, 15 – 24.
Lettenmeier M� T�, S� Samus, S� Veuro, and H� Rohn (2009)� Connection between
material and energy efficiency. Vienna.
Libralato G�, A� Volpi Ghirardini, and F� Avezzù (2012)� To centralise or to decen-
tralise: an overview of the most recent trends in wastewater treatment man-
agement. Journal of Environmental Management 94, 61 – 68. doi: 10.1016 /
j.jenvman.2011.07.010, ISSN: 1095-8630.
Lin J�, D� He, P� He, M� Hu, and H� Lu (2011)� The Race Is On: China Kick-Starts
Its Clean Economy. ClimateWorks Foundation, San Francisco, 20 pp. Avail-
able at: http: / / www. climateworks. org / download / ?id=86f8db38 - 1272 - 41
da-8fe9 - 4f9aa0021d13.
Liu N�, and B� W� Ang (2007)� Factors shaping aggregate energy intensity trend for
industry: Energy intensity versus product mix. Energy Economics 29, 609 – 635.
doi: 10.1016 / j.eneco.2006.12.004, ISSN: 0140-9883.
Liu G�, C� E� Bangs, and D� B� Müller (2012a)� Stock dynamics and emission path-
ways of the global aluminium cycle. Nature Climate Change. doi: 10.1038 /
nclimate1698, ISSN: 1758-678X.
Liu J�, and J� Diamond (2005)� China’s environment in a globalizing world. Nature
435, 1179 – 1186. doi: 10.1038 / 4351179a, ISSN: 0028-0836.
Liu X�, X� Gao, W� Wang, L� Zheng, Y� Zhou, and Y� Sun (2012b)� Pilot-scale
anaerobic co-digestion of municipal biomass waste: Focusing on biogas pro-
duction and GHG reduction. Renewable Energy 44, 463 – 468. doi: 10.1016 /
j.renene.2012.01.092, ISSN: 0960-1481.
Liu F�, Z� Klimont, Q� Zhang, J� Cofala, L� Zhao, H� Huo, B� Nguyen, W� Schöpp,
R� Sander, B� Zheng, C� Hong, K� He, M� Amann, and C� Heyes (2013)� Inte-
grating mitigation of air pollutants and greenhouse gases in Chinese cities:
development of GAINS-City model for Beijing. Journal of Cleaner Production
58, 25 – 33. doi: 10.1016 / j.jclepro.2013.03.024, ISSN: 0959-6526.
Locher F� W� (2006)� Cement: Principles of Production and Use. Verlag Bau+Technik,
Düsseldorf, 535 pp. ISBN: 9783764004200.
Lowe E� A� (1997)� Creating by-product resource exchanges: Strategies for eco-
industrial parks. Journal of Cleaner Production 5, 57 – 65.
Maconachie R�, and G� Hilson (2013)� Editorial introduction: the extractive indus-
tries, community development and livelihood change in developing countries.
Community Development Journal 48, 347 – 359. doi: 10.1093 / cdj / bst018, ISSN:
0010-3802, 1468 – 2656.
Martinez-Alier J� (2001)� Mining conflicts, environmental justice, and valuation.
Journal of Hazardous Materials 86, 153 – 170. doi: 10.1016 / S0304 - 3894(01)00
252 - 7, ISSN: 0304-3894.
Martinez-Fernandez C�, C� Hinojosa, and G� Miranda (2010)� Green Jobs and
Skills: The Local Labour Market Implications of Addressing Climate Change.
Organisation for Economics Cooperation and Development, Paris, France, 55 pp.
Available at: http: / / www. oecd. org / regional / leed / 44683169.pdf.
Masanet E� (2010)� Energy Benefits of Electronic Controls at Small and Medium
Sized U. S. Manufacturers. Journal of Industrial Ecology 14, 696 – 702. doi: 10.11
11 / j.1530 - 9290.2010.00286.x, ISSN: 1530-9290.
Masanet etal� (2008)� Energy Efficiency Improvements and Cost Saving Oppor-
tunities for the Fruit and Vegetable Processing Industry. Lawrence Berkeley
National Laboratory Berkeley, California American Iron and Steel Institute,
Berkeley, CA, 175 pp.
Masanet E�, and J� Sathaye (2009)� Challenges and opportunities in accounting
for non-energy use CO
2
emissions: an editorial comment. Climatic Change 95,
395 – 403. doi: 10.1007 / s10584 - 009 - 9636 - 9, ISSN: 0165-0009, 1573 – 1480.
Massé D� I�, G� Talbot, and Y� Gilbert (2011)� On farm biogas production: A
method to reduce GHG emissions and develop more sustainable livestock
operations. Animal Feed Science and Technology 166 – 167, 436 – 445. doi:
10.1016 / j.anifeedsci.2011.04.075, ISSN: 0377-8401.
Matsumiya T� (2011)� Steelmaking technology for a sustainable society. Calphad
35, 627 – 635. doi: 10.1016 / j.calphad.2011.02.009, ISSN: 0364-5916.
May G�, M� Taisch, B� Stahl, and V� Sadr (2013)� Toward Energy Efficient Manu-
facturing: A Study on Practices and Viewpoint of the Industry. IFIP Advances in
Information and Communication Technology. In: Advances in Production Man-
agement Systems. Competitive Manufacturing for Innovative Products and Ser-
vices. C. Emmanouilidis, M. Taisch, D. Kiritsis, (eds.), Springer Berlin Heidelberg,
pp. 1 – 8.

803803
Industry
10
Chapter 10
Mazzanti M�, and R� Zoboli (2008)� Waste generation, waste disposal and policy
effectiveness Evidence on decoupling from the European Union. Resources, Con-
servation and Recycling 52, 1221 – 1234. doi: 10.1016 / j.resconrec.2008.07.003.
Mazzotti M�, J� Abanades, R� Allam, K� Lackner, F� Meunier, E� Rubin, J� San-
chez, K� Yogo, and R� Zevenhoven (2005)� Mineral carbonation and indus-
trial uses of CO
2
. In: IPCC Special Report on Carbon dioxide Capture and Stor-
age [B. Metz, O. Davidson, H. de Coninck, M. Loos, L. Meyer (eds.)]. Cambridge
University Press, Cambridge, UK and New York, USA, pp. 320 – 338.
McKane A� (2007)� Industrial Energy Management: Issues Paper. United Nations
Industrial Development Organization, Vienna, Austria. Available at: http: / / www.
unido. org / fileadmin / import / 63563_EM_Issues_Paper031207.pdf.
McKane A�, and A� Hasanbeigi (2010)� Motor Systems Efficiency Supply Curves:
Assessment the Energy Efficiency Potential of Industrial Motor Systems. United
Nations Industrial Development Organization, Vienna, 112 pp. Available at:
http: / / industrial-energy.lbl.gov / files / industrial-energy / active / 0 / UNIDO%20
Motor%20Systems%20Efficiency%20Supply%20Curves.pdf.
McKane A�, and A� Hasanbeigi (2011)� Motor systems energy efficiency sup-
ply curves: A methodology for assessing the energy efficiency potential
of industrial motor systems. Energy Policy 39, 6595 – 6607. doi: 10.1016 /
j.enpol.2011.08.004, ISSN: 0301-4215.
McKinsey&Company (2009)� Pathways to a Low-Carbon Economy: Version 2 of
the Global Greenhouse Gas Abatement Cost Curve. McKinsey Company, New
York, 20 pp. Available at: www. mckinsey. com / ~ / media / mckinsey / dotcom / cli
ent_service / sustainability / cost curve pdfs / pathways_lowcarbon_economy_
version2.
McKinsey&Company (2010)� Impact of the Financial Crisis on Carbon Economics.
Version 2.1 of the Global Greenhouse Gas Abatement Cost Curve. McKinsey
Company, New York, 14 pp. Available at: http: / / www. mckinsey. com / client_ser
vice / sustainability / latest_thinking / greenhouse_gas_abatement_cost_curves.
Meidel R� W� (2005)� Oil company makes CHP work. Cogeneration and On-Site
Power Production, pp.49 – 56.
Melián-Cabrera I�, R� W� van den Brink, J� A� Z� Pieterse, G� Mul, F� Kapteijn, and
J� A� Moulijn (2004)� Decomposition of N
2
O in the nitric acid industry: Defi-
nition of structure-activity relations as a tool to develop new catalysts. Paris,
France. Available at: ftp: / / nrg-nl.com / pub / www / library / report / 2005 / rx05080.
pdf.
Menikpura S� N� M�, J� Sang-Arun, and M� Bengtsson (2013)� Integrated Solid
Waste Management: an approach for enhancing climate co-benefits through
resource recovery. Journal of Cleaner Production 58, 34 – 42. doi: 10.1016 / j.
jclepro.2013.03.012, ISSN: 0959-6526.
Mestl H� E� S�, K� Aunan, J� Fang, H� M� Seip, J� M� Skjelvik, and H� Vennemo
(2005)� Cleaner production as climate investment — integrated assessment in
Taiyuan City, China. Journal of Cleaner Production 13, 57 – 70. doi: 10.1016 /
j.jclepro.2003.08.005, ISSN: 0959-6526.
Metcalf G� E� (2009)� Designing a Carbon Tax to Reduce U. S. Greenhouse Gas Emis-
sions. Review of Environmental Economics and Policy 3, 63 – 83.
Meyer B�, M� Distelkamp, and M� I� Wolter (2007)� Material efficiency and eco-
nomic-environmental sustainability. Results of simulations for Germany with
the model PANTA RHEI. Ecological Economics 63, 192 – 200.
Michaelis P�, and T� Jackson (2000)� Material and energy flow through the UK iron
and steel sector. Part 1: 1954 – 1994. Resources, Conservation and Recycling 29,
131 – 156. doi: 10.1016 / S0921 - 3449(00)00048 - 3, ISSN: 0921-3449.
Michaelowa A�, and J� Buen (2012)� The Clean Development Mechanism gold
rush. In: Carbon Markets or Climate Finance?: Low Carbon and Adaptation
Investment Choices for the Developing World. Routledge, Abingdon, pp. 1 – 38.
ISBN: 978 - 1-84971 - 474 - 7.
Milford R� L�, J� M� Allwood, and J� M� Cullen (2011)� Assessing the potential
of yield improvements, through process scrap reduction, for energy and CO
2
abatement in the steel and aluminium sectors. Resources, Conservation and
Recycling 55, 1185 — 1195. doi: 10.1016 / j.resconrec.2011.05.021, ISSN: 0921-
3449.
Miller B� R�, and L� J� M� Kuijpers (2011)� Projecting future HFC-23 emissions. Atmo-
spheric Chemistry and Physics 11, 13259 – 13267. doi: 10.5194 / acp-11 - 13259 -
2011, ISSN: 1680-7324.
Mitroff I� I�, and M� C� Alpaslan (2003)� Preparing for evil. Harvard Business
Review 81, 109 – 115, 124. ISSN: 0017-8012.
Moldoveanu G� A�, and V� G� Papangelakis (2012)� Recovery of rare earth ele-
ments adsorbed on clay minerals: I. Desorption mechanism. Hydrometallurgy
117 – 118, 71 – 78.
Morimoto K�, H� X� Nguyen, M� Chihara, T� Honda, and R� Yamamoto (2006)�
Proposals for Classification and an Environmental Impact Evaluation Method
for Eco-services: Case Study of Municipal Waste Treatment in Cement Pro-
duction. Journal of Life Cycle Assessment, Japan 2, 347 – 354. Available at:
http: / / www. jstage. jst. go. jp / article / lca / 2 / 4 / 2_347 / _article.
Morrow III W� R�, A� Hasanbeigi, J� Sathaye, and T� Xu (2013a)� Assessment of
Energy Efficiency Improvement and CO
2
Emission Reduction Potentials in the
Cement Industry in India. Lawrence Berkeley National Laboratory, Berkeley,
CA, 43 pp. Available at: http: / / eetd.lbl.gov / publications / assessment-of-energy-
efficiency-impro.
Morrow III W� R�, A� Hasanbeigi, J� Sathaye, and T� Xu (2013b)� Assessment of
Energy Efficiency Improvement and CO
2
Emission Reduction Potentials in India’s
Iron and Steel Industry. Lawrence Berkeley National Laboratory, Berkeley, CA
USA, 33 pp. Available at: http: / / ies.lbl.gov / sites / all / files / lbnl-6338e_pdf_0.pdf.
Moss R� L�, E� Tzimas, H� Kara, P� Willis, and J� Kooroshy (2011)� Critical Met-
als in Strategic Energy Technologies. Assessing Rare Metals as Supply-Chain
Bottlenecks in Low-Carbon Energy Technologies. EU Joint Research Centre, The
Hague, 164 pp.
Mukherjee D� (1999)� An Economic Evaluation of the East Calcutta Wetlands in
Environmental Economics. In: Environmental Economics in India- Concepts and
Problems. S. Ganguly, G. Gupta, J. Roy, (eds.), Allied Publishers, pp. 124.
Mukherjee V�, and G� Gupta (2011)� Toxicity and Profitability of Rice Cultivation
under Waste-Water Irrigation: The Case of the East Calcutta Wetlands. South
Asian Network for Development and Environmental Economics, Kathmandu,
Nepal, 24 pp. Available at: http: / / ideas.repec.org / p / ess / wpaper / id4634.html.
Muller N�, and J� Harnish (2008)� A Blueprint for a Climate-Friendly Cement
Industry: How to Turn Around the Trend of Cement Related Emissions in the
Developing World. WWF International, Gland, Switzerland, 101 pp. Available at:
http: / / wwf.panda.org / about_our_earth / all_publications / ?151621 / A-blueprint-
for-a-climate-friendly-cement-industry.
Murphy J� T� (2001)� Making the energy transition in rural east Africa: Is leapfrog-
ging an alternative? Technological Forecasting and Social Change, 173 – 193.
doi: 10.1016 / S0040 - 1625(99)00091 - 8.
Naqvi M�, J� Yan, and E� Dahlquist (2010)� Black liquor gasification integrated
in pulp and paper mills: A critical review. Bioresource Technology 101,
8001 – 8015. doi: 10.1016 / j.biortech.2010.05.013, ISSN: 0960-8524.

804804
Industry
10
Chapter 10
Naranjo M�, D� T� Brownlow, and A� Garza (2011)� CO
2
capture and sequestra-
tion in the cement industry. Energy Procedia 4, 2716 – 2723. doi: 10.1016 / j.egy-
pro.2011.02.173, ISSN: 1876-6102.
NBS (2012)� China Energy Statistical Yearbook 2011. China Statistics Press, Beijing,
China, 352 pp. ISBN: 978 - 7-5037 - 6459 - 2.
NDRC (2011a)� Further Structural Optimization of Building Materials Industry in
China. National Development and Reform Commission. Available at: http: / / gys.
ndrc.gov.cn / gzdt / t20110130_393698.htm.
NDRC (2011b)� Review of the Eleventh Five-Year Plan: Top 1000 Program Exceeded
Targets. National Development and Reform Commission. Available at:
http: / / www. gov. cn / gzdt / 2011 - 09 / 30 / content_1960586.htm.
Neelis M�, E� Worrell, and E� Masanet (2008)� Energy Efficiency Improvement and
Cost Saving Opportunities for the Petrochemical Industry An ENERGY STAR®
Guide for Energy and Plant Managers. Lawrence Berkeley National Laboratory,
Berkeley, CA, 141 pp. Available at: http: / / escholarship.org / uc / item / 8dg961x6.
Van Nes N�, and J� Cramer (2006)� Product lifetime optimization: a challenging
strategy towards more sustainable consumption patterns. Journal of Cleaner
Production 14, 1307 – 1318. doi: 10.1016 / j.jclepro.2005.04.006, ISSN: 0959-
6526.
Nidumolu R�, C� K� Prahalad, and M� R� Rangaswami (2009)� Why Sustainabil-
ity Is Now the Key Driver of Innovation. Harvard Business Review. Available
at: http: / / hbr.org / 2009 / 09 / why-sustainability-is-now-the-key-driver-of-innova
tion / .
Nishimura W�, and T� Sugiyama (2008)� Mitigation of Non-CO
2
Greenhouse Gases.
Central Research Institute of the Electric Power Industry (CRIEPI), Tokyo, 38 pp.
Available at: http: / / criepi.denken.or.jp / jp / kenkikaku / report / detail / Y07012.html.
Nissanke M� (2009)� The Global Financial Crisis and the Developing World:
Transmission Channels and Fall-outs for Industrial Development. Available
at: http: / / www. unido. org / fileadmin / user_media / Publications / RSF_DPR /
WP062009_Ebook.pdf.
Norgate T�, and N� Haque (2010)� Energy and greenhouse gas impacts of mining
and mineral processing operations. Journal of Cleaner Production 18, 266 – 274.
doi: 10.1016 / j.jclepro.2009.09.020, ISSN: 0959-6526.
NREL, LBNL, and RDC (2012)� Improving Steam System Performance: A Sourcebook
for Industry. National Renewable Energy Laboratory, Lawrence Berkeley National
Laboratory, and Resource Dynamics Corporation, Washington, DC, 64 pp. Avail-
able at: http: / / www1. eere. energy. gov / manufacturing / tech_deployment / pdfs /
steamsourcebook.pdf.
NSSMC (2013)� Sustainability Report 2013. Nippon Steel & Sumitomo Metal Corpo-
ration, Tokyo, Japan, 27 pp.
Nzihou A�, N� J� Themelis, M� Kemiha, and Y� Benhamou (2012)� Dioxin emissions
from municipal solid waste incinerators (MSWIs) in France. Waste Management
32, 2273 – 2277. doi: 10.1016 / j.wasman.2012.06.016, ISSN: 1879-2456.
Oda J�, K� Akimoto, T� Tomoda, M� Nagashima, K� Wada, and F� Sano (2012)�
International comparisons of energy efficiency in power, steel, and cement
industries. Energy Policy 44, 118 – 129. doi: 10.1016 / j.enpol.2012.01.024, ISSN:
0301-4215.
OECD (2008)� Measuring Material Flows and Resource Productivity (Volumes I-III
and Synthesis Report). Organisation for Economic Co-operation and Develop-
ment, Paris, France, 101 pp. Available at: http: / / www. oecd. org / redirect / datao
ecd / 55 / 12 / 40464014.pdf.
OECD (2009)� Sustainable Manufacturing and Eco-Innovation: Towards a Green
Economy. Organisation for Economics Cooperation and Development, Paris,
France, 1 – 8 pp.
OECD (2011)� OECD Science, Technology and Industry Scoreboard 2011: Inno-
vation and Growth in Knowledge Economies.Paris, France, 204 pp. ISBN:
978 - 92 - 64 - 11165 - 3.
OECD / IEA (2012)� SPREADING THE NET: THE MULTIPLE BENEFITS OF ENERGY
EFFICIENCY IMPROVEMENTS. Organisation for Economic Co-Operation
and Development, Paris, 37 pp. Available at: http: / / www. iea. org / publica
tions / insights / ee_improvements.pdf.
Ogawa J�, F� Noda, and Y� Yamashita (2011)� Fact-Finding Study on Japan’s Energy
Management Policies: Proposal for Developing Countries. Institute of Energy
Economics Japan, Tokyo, 42 pp. Available at: eneken.ieej.or.jp / data / 3357.pdf.
Oland C� B� (2004)� Guide to Combined Heat and Power. Oak Ridge National Labo-
ratory, Oak Ridge, 207 pp. Available at: http: / / www1. eere. energy. gov / manu
facturing / tech_deployment / pdfs / guide_chp_boiler.pdf.
Olson D� L�, and D� D� Wu (2010)� A review of enterprise risk management in sup-
ply chain. Kybernetes 39, 694 – 706. doi: 10.1108 / 03684921011043198, ISSN:
0368-492X.
Orr J�, A� Darby, T� Ibell, M� Evernden, and M� Otlet (2010)� Concrete structures
using fabric formwork. The Structural Engineer 89, 21 – 28.
Van Oss H� G�, and A� C� Padovani (2002)� Cement Manufacture and the Environ-
ment: Part I: Chemistry and Technology. Journal of Industrial Ecology 6, 89 – 105.
doi: 10.1162 / 108819802320971650, ISSN: 1530-9290.
Patel M� K�, M� L� Neelis, D� Gielen, J� G� J� Olivier, T� Simmons, and J� Theunis
(2005)� Carbon dioxide emmissions from non energy use of fossil fuels: Sum-
mary of key issues and conclusions from the country analyses. Resources Con-
servation and Recycling 45, 195 – 209. ISSN: 0921-3449.
Pauliuk S�, T� Wang, and D� B� Müller (2012)� Moving toward the circular economy:
the role of stocks in the Chinese steel cycle. Environmental Science & Technol-
ogy 46, 148 – 154. doi: 10.1021 / es201904c, ISSN: 1520-5851.
Peeters P�, and G� Dubois (2010)� Tourism travel under climate change mitiga-
tion constraints. Journal of Transport Geography 18, 447 – 457. doi: 10.1016 /
j.jtrangeo.2009.09.003, ISSN: 0966-6923.
Peeters P�, and M� Landré (2011)� The Emerging Global Tourism Geography — An
Environmental Sustainability Perspective. Sustainability 4, 42 – 71. doi:
10.3390 / su4010042, ISSN: 2071-1050.
Peters G� P�, and E� G� Hertwich (2008)� CO
2
Embodied in International Trade with
Implications for Global Climate Policy. Environmental Science & Technology 42,
1401 – 1407. doi: 10.1021 / es072023k, ISSN: 0013-936X.
Pettersson K�, and S� Harvey (2012)� Comparison of black liquor gasification with
other pulping biorefinery concepts — Systems analysis of economic performance
and CO
2
emissions. Energy 37, 136 – 153. doi: 10.1016 / j.energy.2011.10.020,
ISSN: 0360-5442.
Pinegar H� K�, M� S� Moats, and H� Y� Sohn (2011)� Process Simulation and Eco-
nomic Feasibility Analysis for a Hydrogen-Based Novel Suspension Ironmak-
ing Technology. Steel Research International 82, 951 – 963. doi: 10.1002 /
srin.201000288, ISSN: 1869-344X.
Pitblado R� (2011)� Global process industry initiatives to reduce major accident
hazards. Journal of Loss Prevention in the Process Industries 24, 57 – 62. doi:
10.1016 / j.jlp.2010.08.006, ISSN: 0950-4230.

805805
Industry
10
Chapter 10
Plastics Europe (2012)� Plastics — the Facts 2012. An Analysis of European Plas-
tics Production, Demand and Waste Data for 2011. Plastics Europe, Brussels,
40 pp. Available at: http: / / www. plasticseurope. org / Document / plastics-the-
facts-2012.aspx?Page=SEARCH&FolID=2.
Prantl R�, M� Tesar, M� Huber-Humer, and P� Lechner (2006)� Changes in carbon
and nitrogen pool during in-situ aeration of old landfills under varying condi-
tions. Waste Management 26, 373 – 380. doi: 10.1016 / j.wasman.2005.11.010,
ISSN: 0956-053X.
Price L�, C� Galitsky, and K� J� Kramer (2008)� International Experience with
Key Program Elements of Industrial Energy Efficiency or Greenhouse Gas
Emissions Reduction Target-Setting Programs. Lawrence Berkeley National
Laboratory, Berkeley, CA, 50 pp. Available at: http: / / www. escholarship.
org / uc / item / 8fz166bg.
Price L�, M� D� Levine, N� Zhou, D� Fridley, N� Aden, H� Lu, M� McNeil, N� Zheng,
Y� Qin, and P� Yowargana (2011)� Assessment of China’s energy-saving and
emission-reduction accomplishments and opportunities during the 11th Five
Year Plan. Energy Policy 39, 2165 – 2178. doi: 10.1016 / j.enpol.2011.02.006.
Price L�, and H� Lu (2011)� Industrial Energy Auditing and Assessments: A Sur-
vey of Programs Around the World. Lawrence Berkeley National Laboratory,
Berkeley, CA. 12 pp. Available at: http: / / proceedings.eceee.org / visabstrakt.
php?event=1&doc=3 - 049 - 11.
Price L�, and A� T� McKane (2009)� Policies and Measures to Realise Industrial
Energy Efficiency and Mitigate Climate Change. United Nations Energy Energy
Efficiency Cluster, Vienna, 45 pp. Available at: http: / / www. unido. org / fileadmin /
user_media / Services / Energy_and_Climate_Change / EPU / UN%20Energy%20
2009 %20Policies%20and%20Measures%20to%20realise%20Industrial%20
Energy%20Efficiency%20and%20mitigate%20Climate%20Change_small.pdf.
Price L�, S� de la Rue du Can, and H� Lu (2010)� Evaluation of Efficiency Activi-
ties in the Industrial Sector Undertaken in Response to Greenhouse Gas Emis-
sion Reduction Target. Lawrence Berkeley National Laboratory. Available at:
http: / / china.lbl.gov / sites / china.lbl.gov / files / LBNL-3551E.pdf.
Puettmann M�, and J� Wilson (2005)� Life-cycle Analysis of Wood Products: Cra-
dle-to-gate Lci of Residential Wood Building Materials. Wood and Fiber Science
37, 18 – 29. ISSN: 0735-6161.
Qu S�, and D� Yang (2011)� A Study on China’s GHG Emission from Waste Sec-
tor: Trend and Peak Value. China Industrial Economics, 37 – 47. Available at:
http: / / en.cnki.com.cn / Article_en / CJFDTOTAL-GGYY201111005.htm.
Raaz V�, and U� Mentges (2009)� Comparison of Energy Efficiency and CO
2
Emis-
sions for Trucks Haulage versus In-Pit Crushing and Conveying of Materials:
Calculation, Methods and Case Studies. ThyssenKrupp Fördertechnik GmbH,
Essen, Germany, 6 pp. Available at: http: / / mine-planning.com / Homepage /
publications_documents / Energy%20Efficiency%20&%20CO2 %20Emissi
ons%20in%20Open%20Pit%20Mines%202011 %20SME%20Anual%20
Meeting.pdf.
Raghupathy L�, and A� Chaturvedi (2013)� Secondary resources and recycling in
developing economies. Science of The Total Environment 461 – 462, 830 – 834.
Ramírez C� A�, M� Patel, and K� Blok (2006)� From fluid milk to milk powder:
Energy use and energy efficiency in the European dairy industry. Energy 31,
1984 – 2004. doi: 10.1016 / j.energy.2005.10.014, ISSN: 0360-5442.
Rathmann B� (2007)� Retrofit of an Electric Shovel or Dragline — a cost sav-
ing alternative between frequent repairs and the purchase of a new
machine. Society for Mining, Metallurgy and Exploration, Denver, CO.
Available at: http: / / www05. abb. com / global / scot / scot244.nsf / veritydis-
play / e4d71de93711bdcac12576730045d8eb / $file / sme%202007 %20refit%20
of%20an%20electric%20shovel.pdf.
Räthzel N�, and D� Uzzell (2012)� Trade Unions in the Green Economy: Working
for the Environment. Routledge, New York, 288 pp. ISBN: 978 - 1-84971 - 464 - 8.
Reddy B� S�, and B� K� Ray (2010)� Decomposition of energy consumption and
energy intensity in Indian manufacturing industries. Energy for Sustainable
Development 14, 35 – 47. doi: 10.1016 / j.esd.2009.12.001, ISSN: 0973-0826.
Van den Reek J� A� (1999)� Reduction of CO
2
Emissions by Reduction of Paper Use
for Publication Applications. Universiteit Utrecht, Utrecht, Netherlands, 79 pp.
ISBN: OCLC-Nummer: 67747781.
Reichart I�, and R� Hischier (2003)� The environmental impact of getting the
news: a comparison of on-line, television, and newspaper information delivery.
Journal of Industrial Ecology 6, 185 – 200.
Reimer R� A�, C� S� Slaten, M� Seapan, A� Koch, and V� G� Triner (2000)� Adipic
Acid Industry — N
2
O Abatement, Non-CO
2
Gases: Scientific Understanding, Con-
trol and Implementation. Kluwer Academic Publishers, 347 – 358.
Reinaud J�, and A� Goldberg (2011)� Ten Key Messages for Effective Policy Pack-
ages — Sharing Best Practices in Industrial Energy Efficiency Policies. Institute
for Industrial Productivity, Washington, DC, 61 pp. Available at: http: / / www.
iipnetwork. org / publications#tenkey.
Ren W�, Y� Geng, B� Xue, T� Fujita, Z� Ma, and P� Jiang (2012)� Pursuing co-bene-
fits in China’s old industrial base: A case of Shenyang. Urban Climate 1, 55 – 64.
doi: 10.1016 / j.uclim.2012.07.001, ISSN: 2212-0955.
Ren T�, and M� K� Patel (2009)� Basic petrochemicals from natural gas, coal and
biomass: Energy use and CO
2
emissions. Resources, Conservation and Recycling
53, 513 – 528. doi: 10.1016 / j.resconrec.2009.04.005, ISSN: 0921-3449.
Ren T�, M� Patel, and K� Blok (2006)� Olefins from conventional and heavy feed-
stocks: Energy use in steam cracking and alternative processes. Energy 31,
425 – 451. doi: 10.1016 / j.energy.2005.04.001, ISSN: 0360-5442.
Rennings K�, and T� Zwick (2002)� Employment Impact of Cleaner Production
on the Firm Level: Empirical Evidence from a Survey in Five European Coun-
tries. International Journal of Innovation Management 06, 319 – 342. doi:
10.1142 / S1363919602000604, ISSN: 1363-9196, 1757 – 5877.
Resnick Institute (2011)� Critical Materials For Sustainable Energy Applications.
California Institute of Technology, Pasadena, 46 pp. Available at: http: / / www.
resnick. caltech. edu / learn / docs / ri_criticalmaterials_report.pdf.
Rezessy S�, and P� Bertoldi (2011)� Voluntary agreements in the field of energy effi-
ciency and emission reduction: Review and analysis of experiences in the Euro-
pean Union. Energy Policy 39, 7121 – 7129. doi: 10.1016 / j.enpol.2011.08.030,
ISSN: 0301-4215.
Rich C�, J� Gronow, and N� Voulvoulis (2008)� The potential for aeration of MSW
landfills to accelerate completion. Waste Management 28, 1039 – 1048. doi:
10.1016 / j.wasman.2007.03.022, ISSN: 0956-053X.
Ritzkowski M�, K�-U� Heyer, and R� Stegmann (2006)� Fundamental processes
and implications during in situ aeration of old landfills. Waste Management
(New York, N. Y.) 26, 356 – 372. doi: 10.1016 / j.wasman.2005.11.009, ISSN:
0956-053X.
Ritzkowski, and R� Stegmann (2010)� Generating CO
2
-credits through landfill in
situ aeration. Waste Management (New York NY) 30, 702 – 706.

806806
Industry
10
Chapter 10
Rivers N� (2010)� Impacts of climate policy on the competitiveness of Canadian
industry: How big and how to mitigate? Energy Economics 32, 1092 – 1104. doi:
10.1016 / j.eneco.2010.01.003, ISSN: 0140-9883.
Rohdin P�, P� Thollander, and P� Solding (2007)� Barriers to and drivers for energy
efficiency in the Swedish foundry industry. Energy Policy 35, 672 – 677. doi:
10.1016 / j.enpol.2006.01.010.
Roy J� (2007)� De-Linking Economic Growth From GHG Emissions Through Energy
Efficiency Route- How far are we in India? Bulletin on Energy Efficiency 7,
52 – 57. Available at: http: / / www. indianjournals. com / ijor.aspx?target=ijor:bee
&volume=7&issue=annual&article=019.
Roy J� (2010)� Iron and Steel Sectoral Approaches to the Mitigation of Climate
Change, Perform, Achieve and Trade (PAT) in India. Climate Strategies. Available
at: http: / / www. climatestrategies. org.
Roy J�, S� Dasgupta, and Debalina Chakrabarty (2013)� Energy Efficiency:
Technology, Behavior and Development. In: The handbook of global energy
policy. A. Golthau, (ed.), Wiley-Blackwell, Boston, MA, pp. 282 – 302. ISBN:
978 - 0-470 - 67264 - 8.
Roy J�, and S� Pal (2009)� Lifestyles and climate change: link awaiting activation.
Current Opinion in Environmental Sustainability 1, 192 – 200. doi: 10.1016 /
j.cosust.2009.10.009, ISSN: 1877-3435.
Roy J�, A� H� Sanstad, J� A� Sathaye, and R� Khaddaria (2006)� Substitution and
price elasticity estimates using inter-country pooled data in a translog cost
model. Energy Economics 28, 706 – 719. doi: 10.1016 / j.eneco.2006.05.008,
ISSN: 0140-9883.
De la Rue du Can S�, and L� Price (2008)� Sectoral trends in global energy use
and greenhouse gas emissions. Energy Policy 36, 1386 – 1403. doi: 10.1016 / j.
enpol.2007.12.017, ISSN: 0301-4215.
Saidur R� (2010)� A review on electrical motors energy use and energy savings.
Renewable and Sustainable Energy Reviews 14, 877 – 898. doi: 10.1016 /
j.rser.2009.10.018, ISSN: 1364-0321.
Sakamoto Y�, M� Sasaki, H� Nishihata, T� Suzuki, and K� Ikeda (2011)� Analysis
Methodology Proposal for CO
2
and Primary Energy Reductions Potential with
Heat Pump Technologies in the Food and Beverage Sector and its Results in
Major Countries. Journal of Environment and Engineering 6, 830 – 845. doi:
10.1299 / jee.6.830.
Sano F�, K� Akimoto, and K� Wada (2013)� Impacts of different diffusion sce-
narios for mitigation technology options and of model representations regard-
ing renewables intermittency on evaluations of CO
2
emissions reductions.
Climatic Change, 1 – 12. doi: 10.1007 / s10584 - 013 - 0896-z, ISSN: 0165-0009,
1573 – 1480.
Sano F�, K� Wada, K� Akimoto, and J� Oda (2013)� Assessments of GHG emission
reduction scenarios of different levels and different short-term pledges through
macro- and sectoral decomposition analyses. Technological Forecasting and
Social Change. doi: 10.1016 / j.techfore.2013.11.002, ISSN: 0040-1625.
Sanstad A� H�, J� Roy, and J� A� Sathaye (2006)� Estimating energy-augmenting
technological change in developing country industries. Energy Economics 28,
720 – 729. doi: 10.1016 / j.eneco.2006.07.005, ISSN: 0140-9883.
Sardeshpande V�, U� N� Gaitonde, and R� Banerjee (2007)� Model based energy
benchmarking for glass furnace. Energy Conversion and Management 48,
2718 – 2738. doi: 10.1016 / j.enconman.2007.04.013, ISSN: 0196-8904.
Sarkar M� A� R�, M� Ehsan, and M� A� Islam (2003)� Issues relating to energy con-
servation and renewable energy in Bangladesh. Energy for Sustainable Devel-
opment 7, 77 – 87. doi: 10.1016 / S0973 - 0826(08)60357 - 9, ISSN: 0973-0826.
Sathaye J�, and A� Gupta (2010)� Eliminating Electricity Deficit through Energy
Efficiency in India: An Evaluation of Aggregate Economic and Carbon Benefits.
Lawrence Berkeley National Laboratory, Berkeley, CA, 31 pp.
Sathaye J�, T� Xu, and C� Galitsky (2011)� Bottom-up Representation of Industrial
Energy Efficiency Technologies in Integrated Assessment Models for the Cement
Sector. Lawrence Berkeley National Laboratory, Berkeley, CA, 59 pp. Available
at: http: / / www. escholarship. org / uc / item / 0xt5x113.
Saygin D�, M� K� Patel, E� Worrell, C� Tam, and D� J� Gielen (2011a)� Poten-
tial of best practice technology to improve energy efficiency in the global
chemical and petrochemical sector. Energy 36, 5779 – 5790. doi: 10.1016 /
j.energy.2011.05.019, ISSN: 0360-5442.
Saygin D�, E� Worrell, M� K� Patel, and D� J� Gielen (2011b)� Benchmarking the
energy use of energy-intensive industries in industrialized and in developing
countries. Energy 36, 6661 – 6673. doi: 10.1016 / j.energy.2011.08.025, ISSN:
0360-5442.
Schäfer A� (2005)� Structural change in energy use. Energy Policy 33, 429 – 437. doi:
10.1016 / j.enpol.2003.09.002, ISSN: 0301-4215.
Schleich J� (2004)� Do energy audits help reduce barriers to energy efficiency? An
empirical analysis for Germany. International Journal Energy Technology and
Policy 2, 226 – 239.
Schleich J�, and E� Gruber (2008)� Beyond case studies: Barriers to energy effi-
ciency in commerce and the services sector. Energy Economics 30, 449 – 464.
doi: 10.1016 / j.eneco.2006.08.004, ISSN: 0140-9883.
Schmitz H� (1995)� Collective efficiency: Growth path for small-scale industry. Jour-
nal of Development Studies 31, 529 – 566. doi: 10.1080 / 00220389508422377,
ISSN: 0022-0388, 1743 – 9140.
Scholl G�, L� Schulz, E� Süßbauer, and S� Otto (2010)� Consumer-Oriented
Approaches to Foster Resource Efficiency. Wuppertal Institute for Climate, Envi-
ronment and Energy, Wuppertal, 80 pp. Available at: http: / / epub.wupperinst.
org / frontdoor / index / index / docId / 4336.
Scott D�, P� Peeters, and S� Gössling (2010)� Can tourism deliver its “aspirational”
greenhouse gas emission reduction targets? Journal of Sustainable Tourism 18,
393 – 408. doi: 10.1080 / 09669581003653542, ISSN: 0966-9582, 1747 – 7646.
Sengenberger W�, and F� Pyke (1992)� Industrial Districts and Local Economic
Regeneration. International Institute for Labour Studies, Geneva, 297 pp.
Sheinbaum C�, B� J� Ruíz, and L� Ozawa (2011)� Energy consumption and related
CO
2
emissions in five Latin American countries: Changes from 1990 to 2006
and perspectives. Energy 36, 3629 – 3638. doi: 10.1016 / j.energy.2010.07.023,
ISSN: 0360-5442.
Sheinbaum-Pardo C�, S� Mora-Pérez, and G� Robles-Morales (2012)� Decom-
position of energy consumption and CO
2
emissions in Mexican manufacturing
industries: Trends between 1990 and 2008. Energy for Sustainable Develop-
ment 16, 57 – 67. doi: 10.1016 / j.esd.2011.08.003, ISSN: 0973-0826.
Shen B�, L� Price, and H� Lu (2012)� Energy audit practices in China: National
and local experiences and issues. Energy Policy 46, 346 – 358. doi: 10.1016 / j.
enpol.2012.03.069, ISSN: 0301-4215.
Shin S� G�, B� W� Zhou, S� Lee, W� Kim, and S� Hwang (2011)� Variations in metha-
nogenic population structure under overloading of pre-acidified high-strength
organic wastewaters. Process Biochemistry 46, 1035 – 1038. doi: 10.1016 /
j.procbio.2011.01.009, ISSN: 1359-5113.
Shipley A�, A� Hampson, B� Hedman, P� Garland, and P� Bautista (2008)� Com-
bined Heat and Power: Effective Energy Solutions for a Sustainable Future. Oak
Ridge National Laboratory, Oak Ridge, 40 pp.

807807
Industry
10
Chapter 10
SI, and GFMS (2013)� World Silver Survey 2013. The Silver Institute and Thomson
Reuters GFMS, Washington, DC, 12 pp. Available at: https: / / www. silverinstitute.
org / site / wp-content / uploads / 2013 / 06 / WSS2013Summary.pdf.
Siitonen S�, M� Tuomaala, and P� Ahtila (2010)� Variables affecting energy effi-
ciency and CO
2
emissions in the steel industry. Energy Policy 38, 2477 – 2485.
doi: 10.1016 / j.enpol.2009.12.042.
Sim S�, M� Barry, R� Clift, and S� Cowell (2007)� The relative importance of
transport in determining an appropriate sustainability strategy for food sourc-
ing. The International Journal of Life Cycle Assessment 12, 422 – 431. doi:
10.1065 / lca2006.07.259, ISSN: 0948-3349.
Sims R�, P� Mercado, W� Krewitt, G� Bhuyan, D� Flynn, H� Holttinen, G� Jan-
nuzzi, S� Khennas, Y� Liu, L� J� Nilsson, J� Ogden, K� Ogimoto, M� O’Malley,
H� Outhred, � Ulleberg, and F� van Hulle (2011)� Integration of Renew-
able Energy into Present and Future Energy Systems. In: IPCC Special Report
on Renewable Energy Sources and Climate Change Mitigation [O. Edenhofer,
R. Pichs-Madruga, Y. Sokona, K. Seyboth, P. Matschoss, S. Kadner, T. Zwickel, P.
Eickemeier, G. Hansen, S. Schlömer, C. von Stechow (eds.)]. Cambridge Univer-
sity Press, Cambridge, United Kingdom and New York, NY, USA, pp. 609 – 706.
Sjardin M� (2003)� CO
2
Emission Factors for Non-Energy Use in the Non-Ferrous
Metal, Ferroalloys and Inorganics Industry. Copernicus Institute, Utrecht, Neth-
erlands, 63 pp.
Skelton A� C� H�, and J� M� Allwood (2013a)� Product life trade-offs: what if
products fail early? Environmental Science & Technology 47, 1719 – 1728. doi:
10.1021 / es3034022, ISSN: 1520-5851.
Skelton A� C� H�, and J� M� Allwood (2013b)� The incentives for supply chain col-
laboration to improve material efficiency in the use of steel: An analysis using
input output techniques. Ecological Economics 89, 33 – 42. doi: 10.1016 / j.ecole-
con.2013.01.021, ISSN: 0921-8009.
Smith H� M� (2012)� The Mining Sector — Energy Efficiency Best Practice Guide for
the Australian Federal and State Government Energy Efficiency Exchange. Avail-
able at: http: / / eex.gov.au / industry-sectors / mining / .
Smith P�, D� Martino, Z� Cai, D� Gwary, H� Janzen, P� Kumar, B� McCarl, S� Ogle,
F� O’Mara, C� Rice, B� Scholes, O� Sirotenko, M� Howden, T� McAllister,
G� Pan, V� Romanenkov, U� Schneider, S� Towprayoon, M� Wattenbach,
and J� Smith (2008)� Greenhouse Gas Mitigation in Agriculture. Philosophi-
cal Transactions of the Royal Society B: Biological Sciences 363, 789 – 813. doi:
10.1098 / rstb.2007.2184, ISSN: 0962-8436, 1471 – 2970.
Sovacool B� K�, and M� A� Brown (2010)� Competing Dimensions of Energy Secu-
rity: An International Perspective. Social Science Research Network, Rochester,
NY, 77 – 108 pp. Available at: http: / / papers.ssrn.com / abstract=1707238.
Spokas K� A�, and J� E� Bogner (2011)� Limits and dynamics of methane oxida-
tion in landfill cover soils. Waste Management 31, 823 – 832. doi: 10.1016 /
j.wasman.2009.12.018, ISSN: 0956-053X.
Spokas K�, J� Bogner, and J� Chanton (2011)� A process-based inventory
model for landfill CH
4
emissions inclusive of seasonal soil microclimate and
CH
4
oxidation. Journal of Geophysical Research: Biogeosciences 116. doi:
10.1029 / 2011JG001741, ISSN: 2156-2202.
Stahel W� R� (2013)� Policy for material efficiency — sustainable taxation as a
departure from the throwaway society. Philosophical Transactions of the Royal
Society A: Mathematical, Physical and Engineering Sciences 371, 2 – 15.
Stehfest E�, L� Bouwman, D� van Vuuren, M� den Elzen, B� Eickhout, and P�
Kabat (2009)� Climate benefits of changing diet. Climatic Change 95, 83 – 102.
doi: 10.1007 / s10584 - 008 - 9534 - 6, ISSN: 0165-0009.
Stenqvist C�, and L� Nilsson (2012)� Energy efficiency in energy-intensive indus-
tries — an evaluation of the Swedish voluntary agreement PFE. Energy Effi-
ciency 5, 225 – 241.
Streets D� G�, K� Jiang, X� Hu, J� E� Sinton, X�-Q� Zhang, D� Xu, M� Z� Jacobson,
and J� E� Hansen (2001)� Recent Reductions in China’s Greenhouse Gas Emis-
sions. Science 294, 1835 – 1837. doi: 10.1126 / science.1065226, ISSN: 0036-
8075, 1095 – 9203.
Sun J� W� (1998)� Changes in energy consumption and energy intensity: A complete
decomposition model. Energy Economics 20, 85 – 100. doi: 10.1016 / S0140 - 988
3(97)00012 - 1, ISSN: 0140-9883.
SWEEP (2011)� Southwest Energy Efficiency Project. Energy Efficiency Guide for
Colorado Businesses — Recommendations by Sector: Mining. Southwest Energy
Efficiency Project. Available at: http: / / swenergy.org / .
SWITCH-Asia Network Facility (2009)� A Key Solution to Climate Change: Sus-
tainable Consumption and Production. Making the Link. SWITCH-Asia Pro-
gramme, Wuppertal, Germany, 23 pp. Available at: http: / / ec.europa.eu / europe-
aid / infopoint / publications / europeaid / documents / 160a_en.pdf.
Taibi E�, D� Gielen, and M� Bazilian The potential for renewable energy in indus-
trial applications. Renewable and Sustainable Energy Reviews. doi: 10.1016 / j.
rser.2011.08.039, ISSN: 1364-0321.
Takeda K�, T� Anyashiki, T� Sato, N� Oyama, S� Watakabe, and M� Sato
(2011)� Recent Developments and Mid- and Long-Term CO
2
Mitigation Proj-
ects in Ironmaking. Steel Research International 82, 512 – 520. doi: 10.1002 /
srin.201100034, ISSN: 1869-344X.
Tanaka K� (2008)� Assessment of energy efficiency performance measures in
industry and their application for policy. Energy Policy 36, 2887 – 2902. doi:
10.1016 / j.enpol.2008.03.032, ISSN: 0301-4215.
Tanaka K� (2011)� Review of policies and measures for energy efficiency in industry
sector. Energy Policy 39, 6532 – 6550. doi: 10.1016 / j.enpol.2011.07.058, ISSN:
0301-4215.
Tanaka K� (2012)� A comparison study of EU and Japan methods to assess CO
2
emission reduction and energy saving in the iron and steel industry. Energy
Policy 51, 578 – 585. doi: 10.1016 / j.enpol.2012.08.075, ISSN: 0301-4215.
TEC, and DEEE (2008)� Déplacements Touristiques Des Français: Hyper Concentra-
tion Des Comportements Les plus Émetteurs de Gaz À Effet de Serre. Minstère
de l’écologie, TEC (Tourism Transports Territoires Environment Conseil) and
Direction des études et de l’évaluation Environnementale, Paris, 4 pp.
Tekkaya A� E�, M� Schikorra, D� Becker, D� Biermann, N� Hammer, and K�
Pantke (2009)� Hot profile extrusion of AA-6060 aluminum chips. Journal of
Materials Processing Technology 209, 3343 – 3350. doi: 10.1016 / j.jmatpro-
tec.2008.07.047, ISSN: 0924-0136.
Themelis N� J� (2007)� Introduction to waste-to-energy. Encyclopedia of Sustain-
ability of Science and Technology 17, 11828 – 11838.
Themelis N� J�, and A� Bourtsalas (2013)� UK Waste Management: Growing old or
Growing Clean? Waste Management World. Available at: http: / / www. waste-
management-world. com / articles / print / volume-14 / issue-3 / features / uk-waste-
management-growing-old-or-growing-clean.html.
Themelis N� J�, M� E� B� Diaz, P� Estevez, and M� G� Velasco (2013)� WTE Guide-
book for Latin America and The Caribbean. Inter-American Development Bank,
New York, 228 pp. Available at: www. wtert. org / wteguidebook_IDB.pdf.
Themelis N� J�, and P� A� Ulloa (2007)� Methane generation in landfills. Renewable
Energy 32, 1243 – 1257. doi: 10.1016 / j.renene.2006.04.020, ISSN: 0960-1481.

808808
Industry
10
Chapter 10
Thollander P�, M� Danestig, and P� Rohdin (2007)� Energy policies for increased
industrial energy efficiency: Evaluation of a local energy programme for manu-
facturing SMEs. Energy Policy 35, 5774 – 5783.
Thollander P�, and J� Palm (2013)� Concluding Discussion: Elaborating on
the Energy Efficiency Gap. In: Improving Energy Efficiency in Industrial
Energy Systems. Springer London, pp. 135 – 145. ISBN: 978 - 1-4471 - 4161 - 7,
978 - 1-4471 - 4162 - 4.
Thomas V� M� (2003)� Demand and Dematerialization Impacts of Second-Hand
Markets. Journal of Industrial Ecology 7, 65 – 78.
Timilsina G� R� (2009)� Carbon tax under the Clean Development Mechanism: a
unique approach for reducing greenhouse gas emissions in developing coun-
tries. Climate Policy 9, 139 – 154. doi: 10.3763 / cpol.2008.0546.
Transatlantic Academy (2012)� The Global Resource Nexus: The Struggles for
Land, Energy, Food, Water, and Materials. Transatlantic Academy, Washington
DC, USA, 100 pp.
UN (2013)� Implementation of the Programme of Action for the Least Developed
Countries for the Decade 2011 – 2020. Report of the Secretary-General to the
UN ECOSOC General Assembly, Sixty-Eighth Session. United Nations Eco-
nomic and Social Council, New York, 64 pp. Available at: http: / / www. unohrlls.
org / docs / ohrlls / ldcs / 2013_SG_Report_on_Istanbul_PoA_UNEDITED.pdf.
UNCTAD (2008)� World Investment Report 2008. Transnational Corporations,
and the Infrastructure Challenge. United Nations, New York, 294 pp. ISBN:
9789211127553.
UNCTAD (2011)� The Least Developed Countries Report 2011: The Potential Role
of South-South Cooperation for Inclusive and Sustainable Development. United
Nations Conference on Trade and Development (UNCTAD), New York, 166 pp.
ISBN: 9789210551564.
UNDESA (2013)� World Population Prospects: The 2012 Revision. Available at:
http: / / esa.un.org / unpd / wpp / Excel-Data / population.htm.
UNEP (2010)� 2010 Assessment Report of the Technology and Economic Assessment
Panel. UNEP (Montreal Protocol on Substances That Deplete the Ozone Layer),
Nairobi, Kenya, 91 pp. Available at: http: / / ozone.unep.org / teap / Reports / TEAP_
Reports / TEAP-Assessment-report-2010.pdf.
UNEP, and EC (2010)� Barriers to the Use of Low-GWP Refrigerants in Develop-
ing Countries and Opportunities to Overcome These. United Nations Environ-
ment Programme Division on Technology, Industry and Economics. Available at:
http: / / www. unep. fr / ozonaction / information / mmcfiles / 7477-e-Summary-low-
GWPbarriers.pdf.
UNFCCC SBSTA (2009)� Second Synthesis Report on Technology Needs Identified
by Parties Not Included in AnnexI to the Convention. Subsidiary Body for Sci-
entific and Technological Advice, United Nations Framework Convention on
Climate Change, Bonn, 58 pp. Available at: http: / / unfccc.int / resource / docs /
2009 / sbsta / eng / inf01.pdf.
UNIDO (2009)� Industrial Development Report 2009: Breaking In and Mov-
ing Up — New Industrial Challenges for the Bottom Billion and the Middle-
Income Countries. United Nations Publications, Vienna, Austria, 161 pp. ISBN:
9789211064452.
UNIDO (2011)� Industrial Development Report 2011 Industrial Energy Efficiency
for Sustainable Wealth Creation: Capturing Environmental, Economic and
Social Dividends. United Nations Publications, Vienna, Austria, 259 pp. ISBN:
9789211064483 9211064481.
UNWTO, UNEP, and WMO (2008)� Climate Change and Tourism: Respond-
ing to Global Challenges. UNEP / Earthprint, London, UK, 276 pp. ISBN:
9789284412341.
US DoE (2004a)� Waste Heat Reduction and Recovery for Improving Furnace Effi-
ciency Productivity and Emissions Performance. A Best Practices Process Heat-
ing Technical Brief. US Department of Energy, Washington, D. C., USA, 10 pp.
Available at: http: / / www1. eere. energy. gov / manufacturing / tech_deployment /
pdfs / 35876.pdf.
US DoE (2004b)� Energy Use, Loss and Opportunities Analysis: U. S. Manufacturing
& Mining. US Department of Energy, Washington, D. C., USA, 169 pp. Available
at: https: / / www. eecbg. energy. gov / industry / intensiveprocesses / pdfs / energy_
use_loss_opportunities_analysis.pdf.
US DoE (2007)� Mining Industry Energy Bandwith Study. International Industrial
Program — US Department of Energy, Washington, D. C., USA, 47 pp. Available
at: http: / / www1. eere. energy. gov / industry / mining / pdfs / mining_bandwidth.pdf.
US DoE (2008)� Waste Heat Recovery: Technology and Opportunities in U. S. Indus-
try. US Department of Energy, Washington, D. C., USA, 112 pp. Available at:
http: / / www1. eere. energy. gov / manufacturing / intensiveprocesses / pdfs / waste_
heat_recovery.pdf.
US EIA (2009)� Manufacturing Energy Consumption Survey. Available at:
http: / / www. eia. gov / consumption / manufacturing / data / 2010 / .
US EIA (2010)� International Energy Outlook 2010. US International Energy
Agency, Washington, D. C., USA, 301 pp. Available at: http: / / www. eia. gov / oiaf /
ieo / index.html.
Valerio F� (2010)� Environmental impacts of post-consumer material manage-
ments: Recycling, biological treatments, incineration. Waste Management 30,
2354 – 2361. doi: 10.1016 / j.wasman.2010.05.014, ISSN: 0956-053X.
Vattenfall (2007)� Global Mapping of Greenhouse Gas Abatement Opportunities
up to 2030 Industry Sector Deep-Dive. Vattenfall AB, Stockholm, 75 pp.
Velavan R�, R� Rudramoorthy, and S� Balachandran (2009)� CO
2
Emission reduc-
tion opportunities for small and medium scale textile sector in India. Journal of
Scientific and Industrial Research 68, 630 – 633. ISSN: 0022-4456.
Verhoef E� V�, G� P� J� Dijkema, and M� A� Reuter (2004)� Process Knowledge, Sys-
tem Dynamics, and Metal Ecology. Journal of Industrial Ecology 8, 23 – 43. doi:
10.1162 / 1088198041269382.
Walz R� (2011)� Employment and structural impacts of material efficiency strate-
gies: results from five case studies. Journal of Cleaner Production 19, 805 – 815.
Wang C�, Z� Deng, M� I� Kafouros, and Y� Chen (2012a)� Reconceptualiz-
ing the spillover effects of foreign direct investment: A process-dependent
approach. International Business Review 21, 452 – 464. doi: 10.1016 /
j.ibusrev.2011.05.006, ISSN: 0969-5931.
Wang D�, A� J� Gmitter, and D� R� Sadoway (2011)� Production of Oxygen Gas and
Liquid Metal by Electrochemical Decomposition of Molten Iron Oxide. Jour-
nal of The Electrochemical Society 158, E51. doi: 10.1149 / 1.3560477, ISSN:
00134651.
Wang X�, J� Liu, N�-Q� Ren, and Z� Duan (2012b)� Environmental profile of typi-
cal anaerobic / anoxic / oxic wastewater treatment systems meeting increasingly
stringent treatment standards from a life cycle perspective. Bioresource Tech-
nology 126, 31 – 40. doi: 10.1016 / j.biortech.2012.09.009, ISSN: 0960-8524.
Wang T�, and T� Watson (2007)� Who Owns China’s Carbon Emissions? Tyndall
Centre, Norwich, UK, 7 pp. Available at: http: / / www. tyndall. ac. uk / content /
who-owns-chinas-carbon-emissions.

809809
Industry
10
Chapter 10
WBCSD (2005)� Guidelines for the Selection and Use of Fuels and Raw Materials
in the Cement Manufacturing Process. World Business Council for Sustainable
Development. Available at: http: / / www. wbcsdcement. org / index.php / publica
tions.
WBCSD (2011)� Cement Sustainability Initiative: Global Cement Database on
CO
2
and Energy Information. World Business Council for Sustainable Devel-
opment, Geneva, 32 pp. Available at: http: / / www. wbcsdcement. org / index.
php?option=com_content&task=view&id=57&Itemid=118.
Weber C� L�, G� P� Peters, D� Guan, and K� Hubacek (2008)� The contribution
of Chinese exports to climate change. Energy Policy 36, 3572 – 3577. doi:
10.1016 / j.enpol.2008.06.009, ISSN: 0301-4215.
Wei M�, S� Patadia, and D� M� Kammen (2010)� Putting renewables and energy
efficiency to work: How many jobs can the clean energy industry generate in
the US? Energy Policy 38, 919 – 931. doi: 10.1016 / j.enpol.2009.10.044.
WGC W� G� C� (2011)� Gold demand trends. Full year 2011. Available at: http: / / www.
gold. org / media / publications / .
Widmer R�, H� Oswald-Krapf, D� Sinha-Khetriwal, M� Schnellmann, and H�
Böni (2005)� Global perspectives on e-waste. Environmental Impact Assess-
ment Review 25, 436 – 458.
Winkler H�, M� Howells, and K� Baumert (2007)� Sustainable development poli-
cies and measures: institutional issues and electrical efficiency in South Africa.
Climate Policy 7, 212 – 229. doi: 10.1080 / 14693062.2007.9685650, ISSN: 1469-
3062.
Wirsenius S� (2003)� The Biomass Metabolism of the Food System: A Model-Based
Survey of the Global and Regional Turnover of Food Biomass. Journal of Indus-
trial Ecology 7, 47 – 80. doi: 10.1162 / 108819803766729195, ISSN: 1530-9290.
Woods J�, A� Williams, J� K� Hughes, M� Black, and R� Murphy (2010)� Energy
and the Food System. Philosophical Transactions of the Royal Society B: Biologi-
cal Sciences 365, 2991 – 3006. doi: 10.1098 / rstb.2010.0172, ISSN: 0962-8436,
1471 – 2970.
World Bank (2007)� Towards Sustainable Mineral-Intensive Growth in Orissa: Man-
aging Environmental and Social Impacts. World Bank, Washington, DC, 78 pp.
Available at: https: / / openknowledge.worldbank.org / handle / 10986 / 7657.
World Bank (2013)� World Bank data — Economic Policy & External Debt. Available
at: http: / / data.worldbank.org / topic / economic-policy-and-external-debt.
Worrell E�, L� Bernstein, J� Roy, L� Price, and J� Harnisch (2009)� Industrial
energy efficiency and climate change mitigation. Energy Efficiency 2, 109 – 123.
doi: 10.1007 / s12053 - 008 - 9032 - 8, ISSN: 1570-646X, 1570 – 6478.
Worrell E�, P� Blinde, M� Neelis, E� Blomen, and E� Masanet (2010)� Energy Effi-
ciency Improvement and Cost Saving Opportunities for the U. S. Iron and Steel
Industry. Lawrence Berkeley National Laboratory, Berkeley, CA, 161 pp. Avail-
able at: http: / / escholarship.org / uc / item / 4gm
2
d35x.
Worrell E�, and C� Galitsky (2008)� Energy Efficiency Improvement and Cost Sav-
ing Opportunities for Cement Making. An ENERGY STAR Guide for Energy and
Plant Managers. Lawrence Berkeley National Laboratory, Berkeley, CA. Avail-
able at: http: / / china.lbl.gov / publications / energy-efficiency-improvement-and-
cost-saving-opportunities-cement-making.
Worrell E�, C� Galitsky, and L� Price (2008a)� Energy Efficiency Improvement
Opportunities for the Cement Industry. Lawrence Berkeley National Labora-
tory, Berkeley, CA. Available at: http: / / china.lbl.gov / sites / china.lbl.gov / files /
CementEEMs.Compilation.English.pdf.
Worrell E�, J� A� Laitner, M� Ruth, and H� Finman (2003)� Productivity benefits of
industrial energy efficiency measures. Energy 28, 1081 – 1098. doi: 10.1016 / S03
60 - 5442(03)00091 - 4, ISSN: 0360-5442.
Worrell E�, L� Price, M� Neelis, C� Galitsky, and N� Zhou (2008b)� World Best
Practice Energy Intensity Values for Selected Industrial Sectors. Lawrence
Berkeley National Laboratory, Berkeley, CA. Available at: http: / / china.lbl.
gov / sites / china.lbl.gov / files / LBNL62806.World_Best_Practice.Feb2008.pdf.
Worrell E�, and M� A� E� van Sluisveld (2013)� Material efficiency in Dutch pack-
aging policy. Philosophical Transactions. Series A, Mathematical, Physical, and
Engineering Sciences 371, 20110570. doi: 10.1098 / rsta.2011.0570, ISSN:
1364-503X.
WSA (2011)� Steel’s Contribution to a Low Carbon Future — Position Paper. World
Steel Association, Brussels, 6 pp. Available at: http: / / www. worldsteel. org / publi
cations / position-papers / Steel-s-contribution-to-a-low-carbon-future.html.
WSA (2012a)� World Steel Association, statistics archive. Available at: http: / / www.
worldsteel. org / statistics / statistics-archive.html.
WSA (2012b)� Crude steel production 2011. World Steel Association. Available at:
https: / / www. worldsteel. org / statistics / statistics-archive / monthly-steel-archive.
html.
Wu S�, Z� Ji, S� Rong, and M� Hu (2010)� Microstructure and mechanical properties
of AZ31B magnesium alloy prepared by solid-state recycling process from chips.
Transactions of Nonferrous Metals Society of China 20, 783 – 788. doi: 10.1016 /
S1003 - 6326(09)60214 - 4, ISSN: 1003-6326.
Xi Y�, T� Fei, and W� Gehua (2013)� Quantifying co-benefit potentials in the Chinese
cement sector during 12th Five Year Plan: an analysis based on marginal abate-
ment cost with monetized environmental effect. Journal of Cleaner Production
58, 102 – 111.
Xu T�, and J� Flapper (2009)� Energy use and implications for efficiency strate-
gies in global fluid-milk processing industry. Energy Policy 37, 5334 – 5341. doi:
10.1016 / j.enpol.2009.07.056, ISSN: 0301-4215.
Xu T�, and J� Flapper (2011)� Reduce energy use and greenhouse gas emis-
sions from global dairy processing facilities. Energy Policy 39, 234 – 247. doi:
10.1016 / j.enpol.2010.09.037, ISSN: 0301-4215.
Xu T�, J� Flapper, and K� J� Kramer (2009)� Characterization of energy use and
performance of global cheese processing. Energy 34, 1993 – 2000. doi: 10.1016 /
j.energy.2009.08.014, ISSN: 0360-5442.
Xu T�, J� Sathaye, and C� Galitsky (2011a)� Development of Bottom-up Repre-
sentation of Industrial Energy Efficiency Technologies in Integrated Assessment
Models for the Iron and Steel Sector. Lawrence Berkeley National Laboratory,
Berkeley, CA, 67 pp. Available at: http: / / escholarship.org / uc / item / 8n82s7j3.
Xu T�, J� W� Slaa, and J� Sathaye (2011b)� Developing Information on Energy Sav-
ings and Associated Costs and Benefits of Energy Efficient Emerging Technolo-
gies Applicable in California. Lawrence Berkeley National Laboratory, Berkeley,
CA, 54 pp. Available at: http: / / escholarship.org / uc / item / 38v358h9.
Yamaguchi M� (Ed.) (2012)� Climate Change Mitigation — A Balanced Approach to
Climate Change. Springer, 262 pp. ISBN: 978 - 1-4471 - 4228 - 7.
Yara (2012)� Environmental efforts. Available at: http: / / www. yaracanada. ca / en /
sustainability / health_environment_safety / environmental_efforts / index.aspx.
Yeo D�, and R� D� Gabbai (2011)� Sustainable design of reinforced concrete
structures through embodied energy optimization. Energy and Buildings 43,
2028 – 2033. doi: 10.1016 / j.enbuild.2011.04.014, ISSN: 0378-7788.
Zafeiris T� (2010)� Global CO
2
abatement potential in the pulp and paper industry
up to 2030. Utrecht University, Utrecht, Netherlands, 86 pp.

810810
Industry
10
Chapter 10
Zhang D�, K� Aunan, H� Martin Seip, and H� Vennemo (2011)� The energy inten-
sity target in China’s 11th Five-Year Plan period — Local implementation and
achievements in Shanxi Province. Energy Policy 39, 4115 – 4124.
Zhang J�, and G� Wang (2008)� Energy saving technologies and productive effi-
ciency in the Chinese iron and steel sector. Energy 33, 525 – 537. doi: 10.1016 / j.
energy.2007.11.002, ISSN: 0360-5442.
Zhao W�, L� Liu, and T� Zhao (2010)� The contribution of outward direct investment
to productivity changes within China, 1991 – 2007. Journal of International
Management 16, 121 – 130. doi: 10.1016 / j.intman.2010.03.003, ISSN: 1075-
4253.
Zhelev T� K� (2005)� Water conservation through energy management. Journal of
Cleaner Production 13, 1395 – 1404.
Zuev V� V�, V� D� Burlakov, A� V� El’nikov, and J� Goldemberg (1998)� Leapfrog
energy technologies. Energy Policy 26, 729 – 741. doi: 10.1016 / S0301 - 4215(98)
00025 - 1.
