Topic 2

Future Climate Changes, Risks and Impacts

Continued emission of greenhouse gases will cause further warming and long-lasting changes in all components of the climate system, increasing the likelihood of severe, pervasive and irreversible impacts for people and ecosystems. Limiting climate change would require substantial and sustained reductions in greenhouse gas emissions which, together with adaptation, can limit climate change risks. 

Edit
Scroll
Edit

Topic 2 assesses projections of future climate change and the resulting risks and impacts. Factors that determine future climate change, including scenarios for future greenhouse gas (GHG) emissions, are outlined in Section 2.1. Descriptions of the methods and tools used to make projections of climate, impacts and risks, and their development since the IPCC Fourth Assessment Report (AR4), are provided in Boxes 2.1 to 2.3. Details of projected changes in the climate system, including the associated uncertainty and the degree of expert confidence in the projections are provided in Section 2.2. The future impacts of climate change on natural and human systems and associated risks are assessed in Section 2.3. Topic 2 concludes with an assessment of irreversible changes, abrupt changes and changes beyond 2100 in Section 2.4.

2.1. Key drivers of future climate and the basis on which projections are made

Cumulative emissions of CO2 largely determine global mean surface warming by the late 21st century and beyond. Projections of greenhouse gas emissions vary over a wide range, depending on both socio-economic development and climate policy. 

Edit

Climate models are mathematical representations of processes important in the Earth’s climate system. Results from a hierarchy of climate models are considered in this report; ranging from simple idealized models, to models of intermediate complexity, to comprehensive General Circulation Models (GCMs), including Earth System Models (ESMs) that also simulate the carbon cycle. The GCMs simulate many climate aspects, including the temperature of the atmosphere and the oceans, precipitation, winds, clouds, ocean currents, and sea-ice extent. The models are extensively tested against historical observations (Box 2.1). {WGI 1.5.2, 9.1.2, 9.2, 9.8.1}

In order to obtain climate change projections, the climate models use information described in scenarios of GHG and air pollutant emissions and land use patterns. Scenarios are generated by a range of approaches, from simple idealised experiments to Integrated Assessment Models (IAMs, see Glossary). Key factors driving changes in anthropogenic GHG emissions are economic and population growth, lifestyle and behavioural changes, associated changes in energy use and land use, technology and climate policy, which are fundamentally uncertain. {WGI 11.3, 12.4, WGIII 5, 6, 6.1}

Box 2.1 Advances, confidence and uncertainty in modelling the Earth’s climate system

Edit

Improvements in climate models since the IPCC Fourth Assessment Report (AR4) are evident in simulations of continental-scale surface temperature, large-scale precipitation, the monsoon, Arctic sea ice, ocean heat content, some extreme events, the carbon cycle, atmospheric chemistry and aerosols, the effects of stratospheric ozone and the El Niño-Southern Oscillation. Climate models reproduce the observed continental-scale surface temperature patterns and multi-decadal trends, including the more rapid warming since the mid-20th century and the cooling immediately following large volcanic eruptions (very high confidence). The simulation of large-scale patterns of precipitation has improved somewhat since the AR4, although models continue to perform less well for precipitation than for surface temperature. Confidence in the representation of processes involving clouds and aerosols remains low. {WGI SPM D.1, 7.2.3, 7.3.3, 7.6.2, 9.4, 9.5, 9.8, 10.3.1}

The ability to simulate ocean thermal expansion, glaciers and ice sheets, and thus sea level, has improved since the AR4, but significant challenges remain in representing the dynamics of the Greenland and Antarctic ice sheets. This, together with advances in scientific understanding and capability, has resulted in improved sea level projections in this report, compared with the AR4. {WGI SPM E.6, 9.1.3, 9.2, 9.4.2, 9.6, 9.8, 13.1, 13.4, 13.5}

There is overall consistency between the projections from climate models in AR4 and AR5 for large-scale patterns of change and the magnitude of the uncertainty has not changed significantly, but new experiments and studies have led to a more complete and rigorous characterization of the uncertainty in long-term projections. {WGI 12.4}

The standard set of scenarios used in the AR5 is called Representative Concentration Pathways (RCPs, Box 2.2). {WGI Box SPM.1}

Box 2.2 The Representative Concentration Pathways (RCPs)
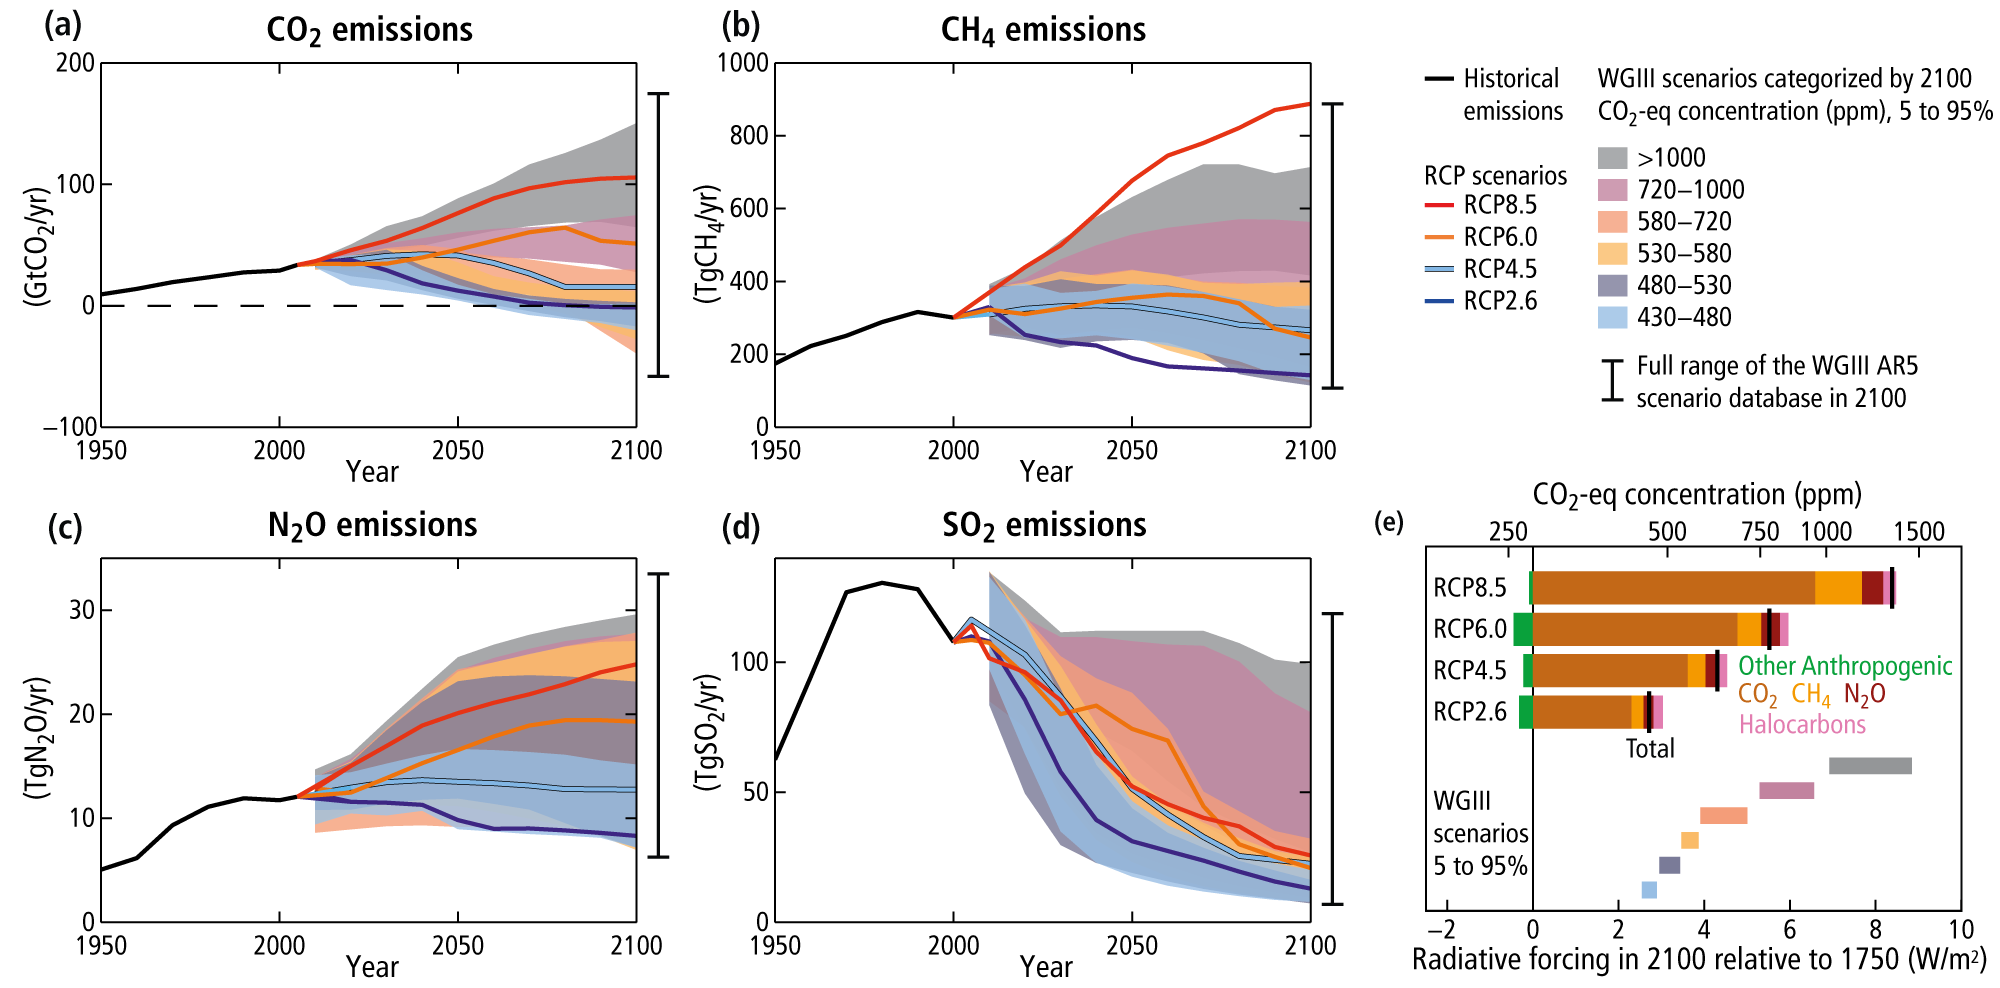
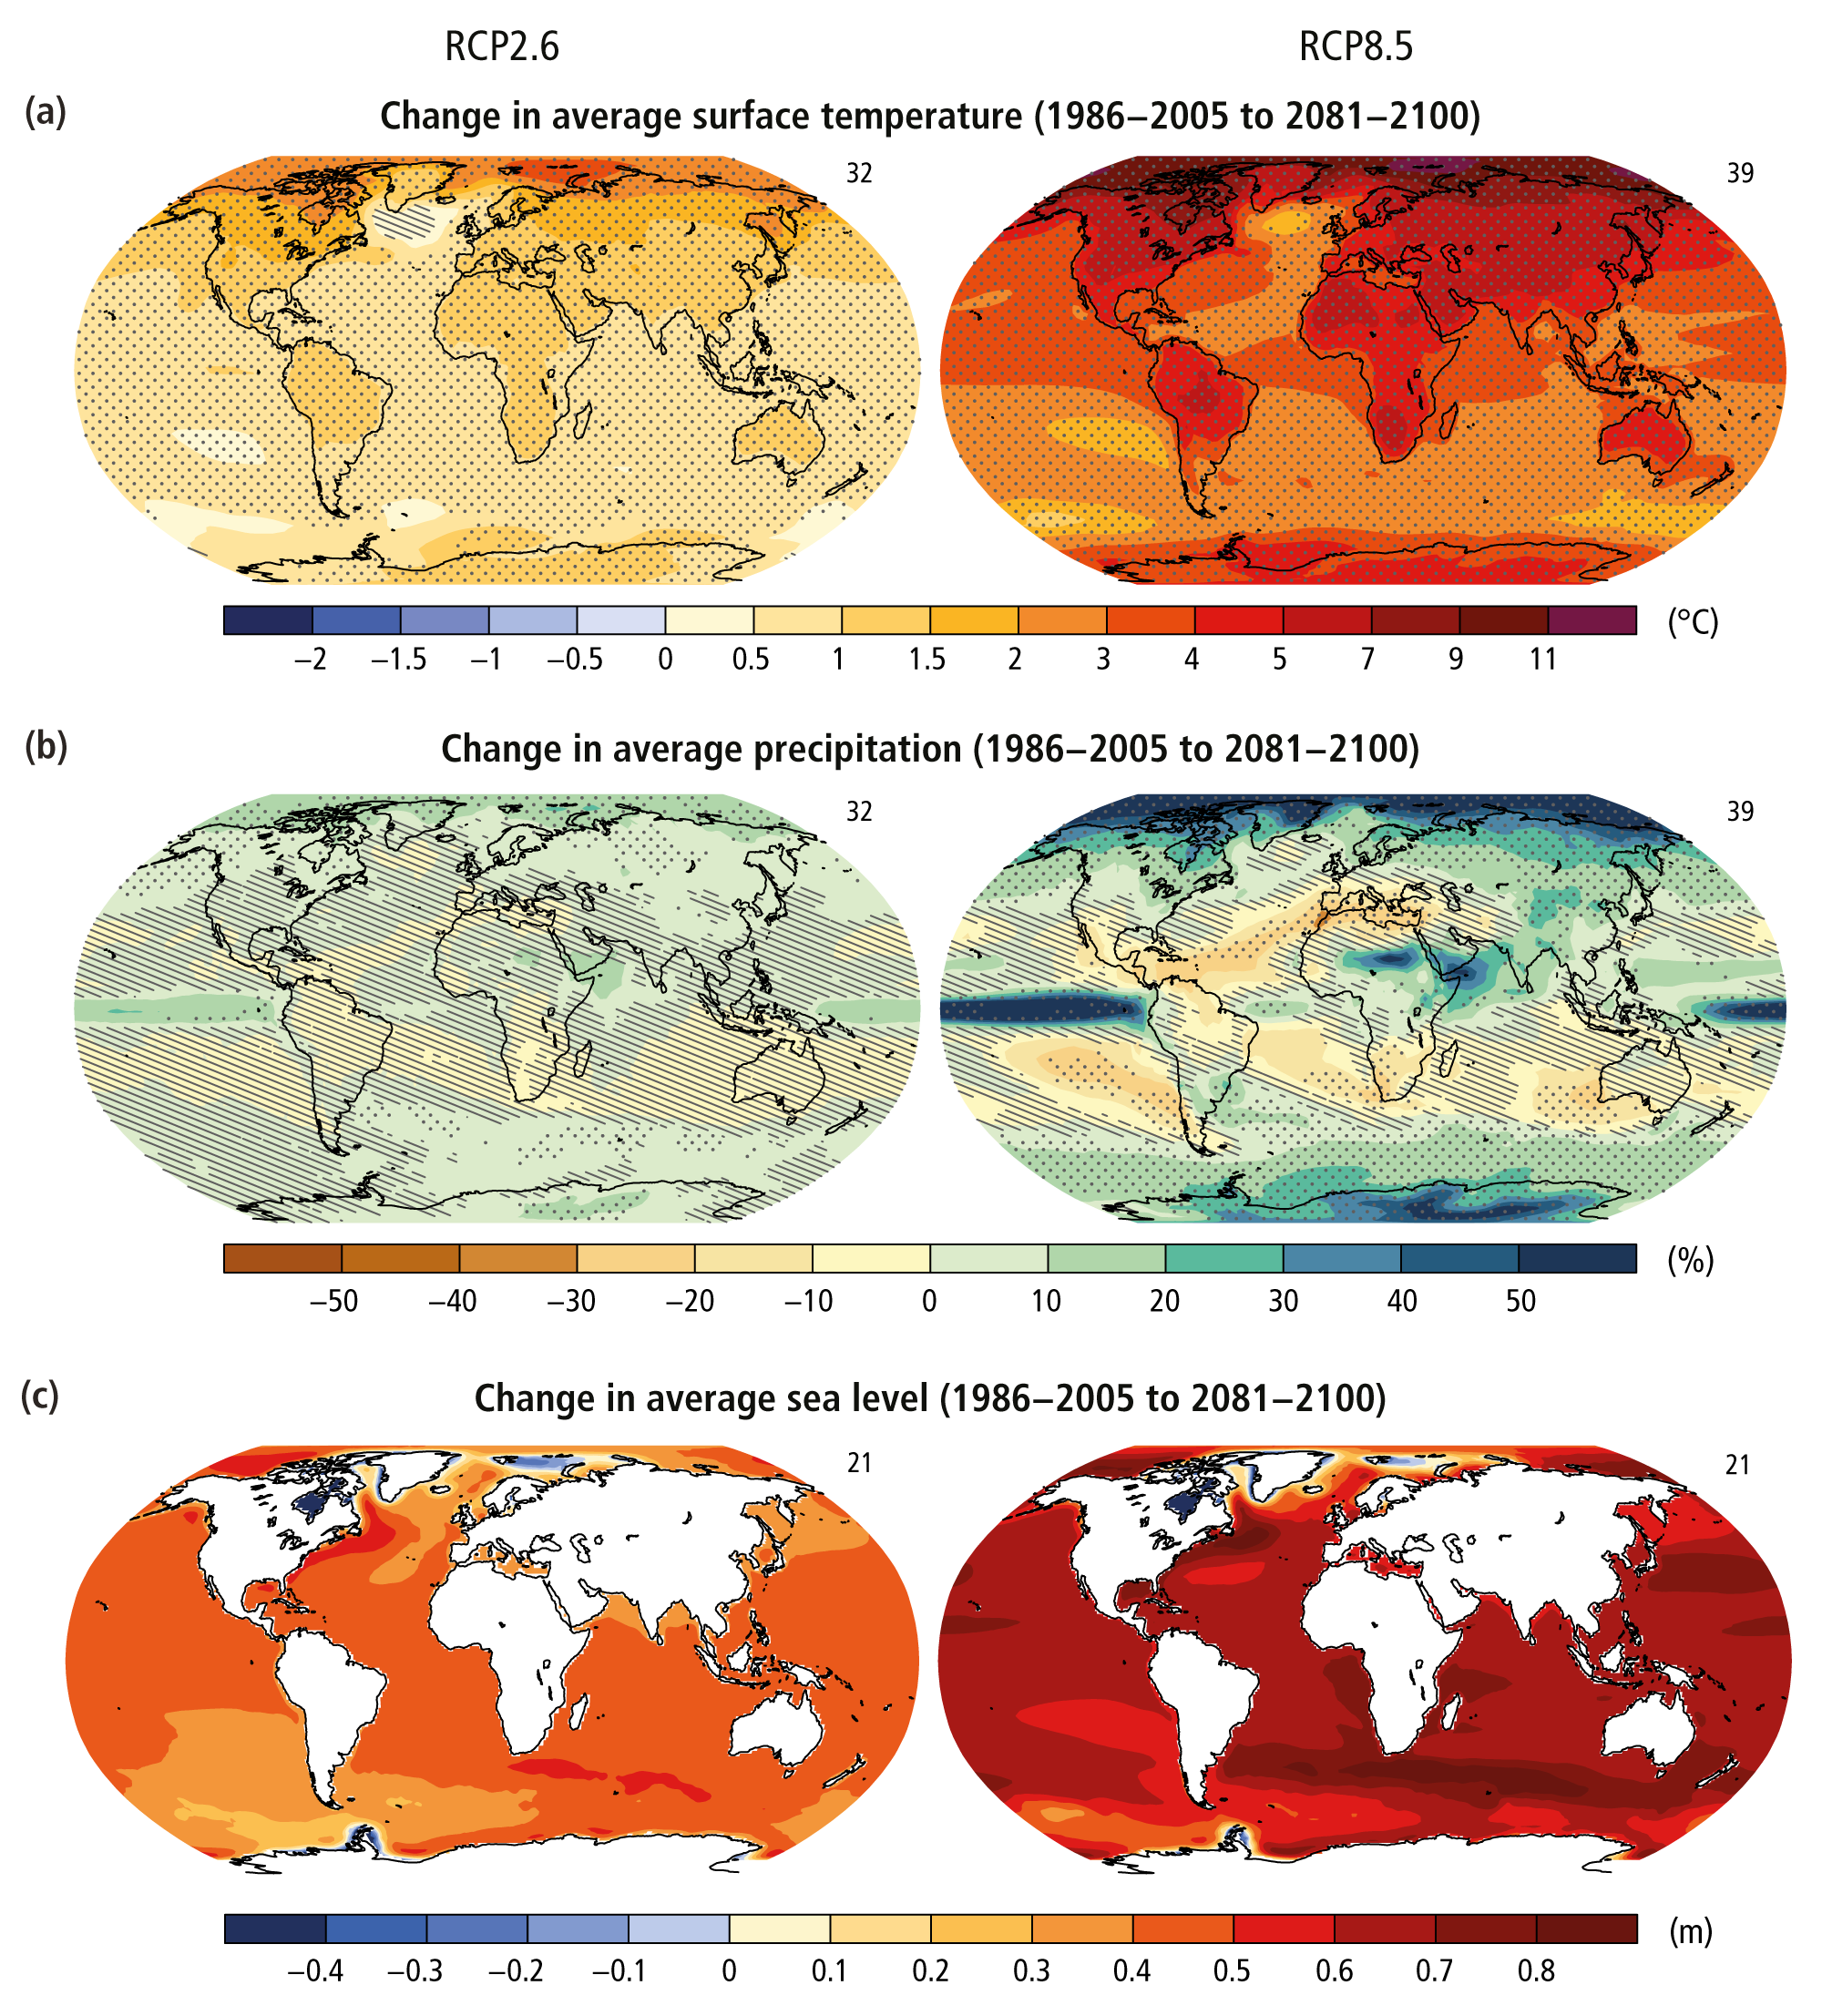
Edit

The Representative Concentration Pathways (RCPs) describe four different 21st century pathways of greenhouse gas (GHG) emissions and atmospheric concentrations, air pollutant emissions and land use. The RCPs have been developed using Integrated Assessment Models (IAMs) as input to a wide range of climate model simulations to project their consequences for the climate system. These climate projections, in turn, are used for impacts and adaptation assessment. The RCPs are consistent with the wide range of scenarios in the mitigation literature assessed by WGIII1The scenarios are used to assess the costs associated with emission reductions consistent with particular concentration pathways. The RCPs represent the range of GHG emissions in the wider literature well (Box 2.2, Figure 1); they include a stringent mitigation scenario (RCP2.6), two intermediate scenarios (RCP4.5 and RCP6.0), and one scenario with very high GHG emissions (RCP8.5). Scenarios without additional efforts to constrain emissions (‘baseline scenarios’) lead to pathways ranging between RCP6.0 and RCP8.5. RCP2.6 is representative of a scenario that aims to keep global warming likely below 2°C above pre-industrial temperatures. The majority of models indicate that scenarios meeting forcing levels similar to RCP2.6 are characterized by substantial net negative emissions2 by 2100, on average around 2 GtCO2/yr. The land use scenarios of RCPs, together, show a wide range of possible futures, ranging from a net reforestation to further deforestation, consistent with projections in the full scenario literature. For air pollutants such as sulfur dioxide (SO2), the RCP scenarios assume a consistent decrease in emissions as a consequence of assumed air pollution control and GHG mitigation policy (Box 2.2, Figure 1). Importantly, these future scenarios do not account for possible changes in natural forcings (e.g. volcanic eruptions) (see Box 1.1). {WGI Box SPM 1, 6.4, 8.5.3, 12.3, Annex II, WGII 19, 21, WGIII 6.3.2, 6.3.6}

The RCPs cover a wider range than the scenarios from the Special Report on Emissions Scenarios (SRES) used in previous assessments, as they also represent scenarios with climate policy. In terms of overall forcing, RCP8.5 is broadly comparable to the SRES A2/A1FI scenario, RCP6.0 to B2 and RCP4.5 to B1. For RCP2.6, there is no equivalent scenario in SRES. As a result, the differences in the magnitude of AR4 and AR5 climate projections are largely due to the inclusion of the wider range of emissions assessed. {WGI TS Box TS.6, 12.4.9

Box 2.2 Figure 1

Edit

Box 2.2, Figure 1 | Emission scenarios and the resulting radiative forcing levels for the Representative Concentration Pathways (RCPs, lines) and the associated scenarios categories used in WGIII (coloured areas, see Table 3.1). Panels a to d show the emissions of carbon dioxide (CO2), methane (CH4), nitrous oxide (N2O) and sulfur dioxide (SO2). Panel e shows future radiative forcing levels for the RCPs calculated using the simple carbon cycle climate model, Model for the Assessment of Greenhouse Gas Induced Climate Change (MAGICC), for the RCPs (per forcing agent) and for the WGIII scenario categories (total) {WGI 8.2.2, 8.5.3, Figure 8.2, Annex II, WGIII Table SPM.1, Table 6.3}The WGIII scenario categories summarize the wide range of emission scenarios published in the scientific literature and are defined based on total CO2-equivalent concentrations (in ppm) in 2100 (Table 3.1). The vertical lines to the right of the panels (panel a–d) indicate the full range of the WGIII AR5 scenario database.

The methods used to estimate future impacts and risks resulting from climate change are described in Box 2.3. Modelled future impacts assessed in this report are generally based on climate-model projections using the RCPs, and in some cases, the older Special Report on Emissions Scenarios (SRES). {WGI Box SPM.1, WGII 1.1, 1.3, 2.2-2.3, 19.6, 20.2, 21.3, 21.5, 26.2, Box CC-RC}

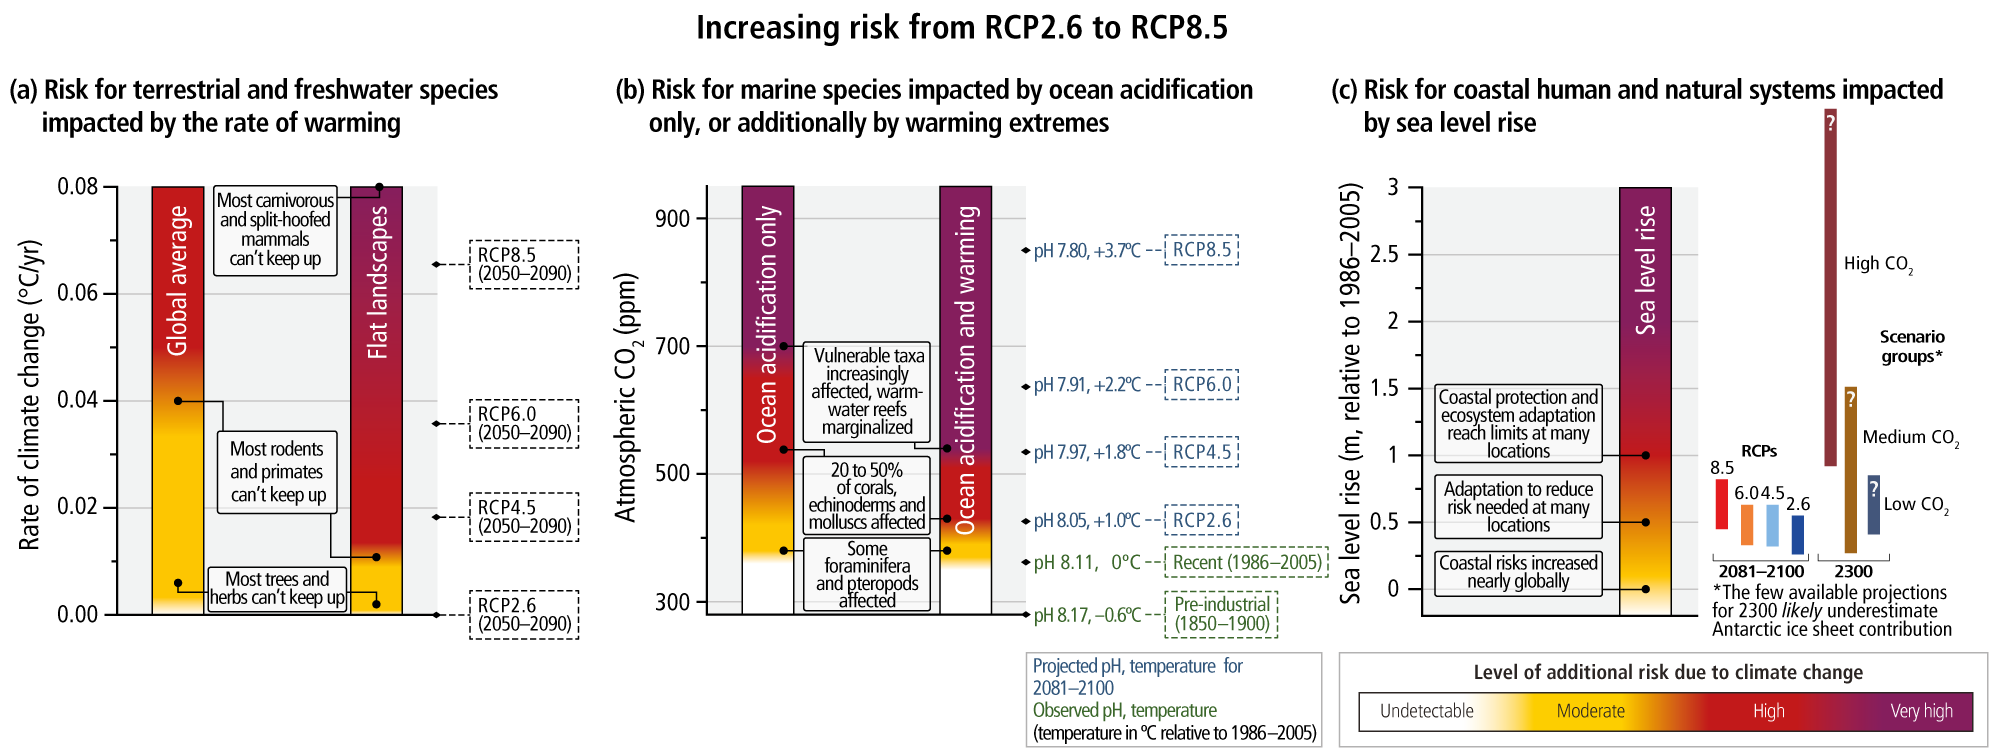
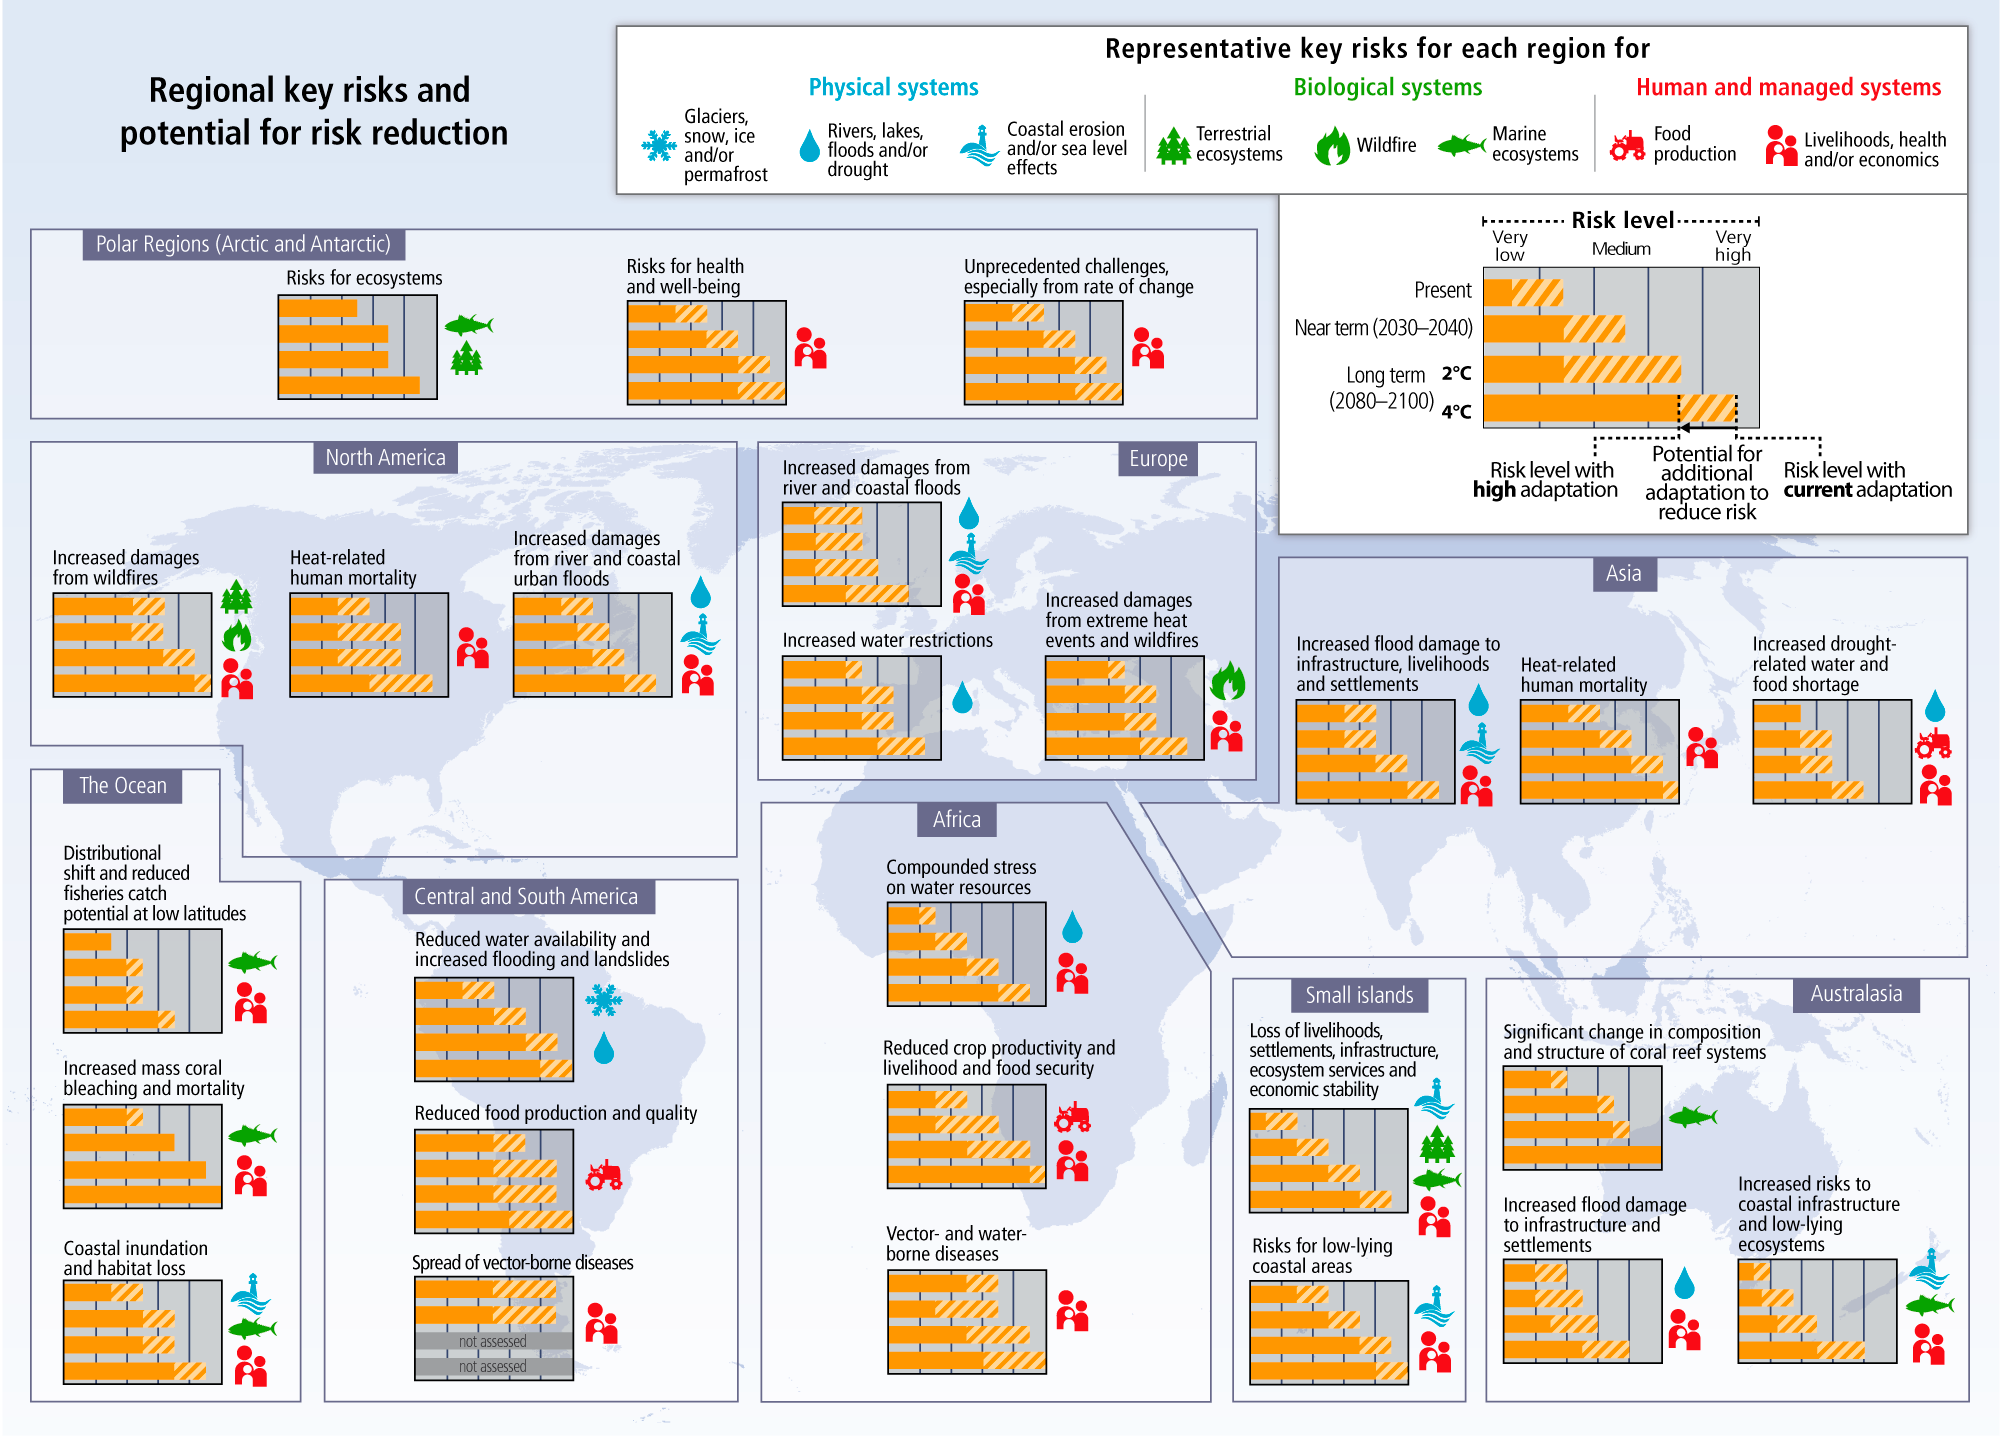
Risk of climate-related impacts results from the interaction between climate-related hazards (including hazardous events and trends) and the vulnerability and exposure of human and natural systems. Alternative development paths influence risk by changing the likelihood of climatic events and trends, through their effects on GHGs, pollutants and land use, and by altering vulnerability and exposure. {WGII SPM, 19.2.4, Figure 19-1, Box 19-2}

Experiments, observations and models used to estimate future impacts and risks have improved since the AR4, with increasing understanding across sectors and regions. For example, an improved knowledge base has enabled expanded assessment of risks for human security and livelihoods and for the oceans. For some aspects of climate change and climate change impacts, uncertainty about future outcomes has narrowed. For others, uncertainty will persist. Some of the persistent uncertainties are grounded in the mechanisms that control the magnitude and pace of climate change. Others emerge from potentially complex interactions between the changing climate and the underlying vulnerability and exposure of people, societies and ecosystems. The combination of persistent uncertainty in key mechanisms plus the prospect of complex interactions motivates a focus on risk in this report. Because risk involves both probability and consequence, it is important to consider the full range of possible outcomes, including low-probability, high-consequence impacts that are difficult to simulate. {WGII 2.1-2.4, 3.6, 4.3, 11.3, 12.6, 19.2, 19.6, 21.3-21.5, 22.4, 25.3-25.4, 25.11, 26.2}

Edit

2.2. Projected changes in the climate system

Surface temperature is projected to rise over the 21st century under all assessed emission scenarios. It is very likely that heat waves will occur more often and last longer, and that extreme precipitation events will become more intense and frequent in many regions. The ocean will continue to warm and acidify, and global mean sea level to rise. 

The projected changes in Section 2.2 are for 2081-2100 relative to 1986-2005, unless otherwise indicated. 

Edit

2.2.1. Air temperature

The global mean surface temperature change for the period 2016– 2035 relative to 1986–2005 is similar for the four RCPs, and will likely be in the range 0.3°C to 0.7°C (medium confidence)3 ºC warmer than the period 1850-1900. {WGI SPM E, 2.4.3}*]. This range assumes no major volcanic eruptions or changes in some natural sources (e.g., methane (CH4) and nitrous oxide (N2O)), or unexpected changes in total solar irradiance. Future climate will depend on commited warming caused by anthropogenic emissions and natural climate variability. By the mid-21st century, the magnitude of the projected climate change is substantially affected by the choice of emissions scenarios. Climate change continted warming caused by past anthropogenic emissions, as well as future ues to diverge among the scenarios through to 2100 and beyond  (Table 2.1, Figure 2.1). The ranges provided for particular RCPs (Table 2.1), and those given below in Section 2.2, primarily arise from differences in the sensitivity of climate models to the imposed forcing. {WGI SPM E.1, 11.3.2, 12.4.1}

Box 2.3 Models and Methods for Estimating Climate Change Risks, Vulnerability and Impacts

Edit

Future climate-related risks, vulnerabilities and impacts are estimated in the AR5 through experiments, analogies and models, as in previous assessments. ‘Experiments’ involve deliberately changing one or more climate-system factors affecting a subject of interest to reflect anticipated future conditions, while holding the other factors affecting the subject constant. ‘Analogies’ make use of existing variations and are used when controlled experiments are impractical due to ethical constraints, the large area or long time required or high system complexity. Two types of analogies are used in projections of climate and impacts. Spatial analogies identify another part of the world currently experiencing similar conditions to those anticipated to be experienced in the future. Temporal analogies use changes in the past, sometimes inferred from paleo-ecological data, to make inferences about changes in the future. ‘Models’ are typically numerical simulations of real-world systems, calibrated and validated using observations from experiments or analogies, and then run using input data representing future climate. Models can also include largely descriptive narratives of possible futures, such as those used in scenario construction. Quantitative and descriptive models are often used together. Impacts are modelled, among other things, for water resources, biodiversity and ecosystem services on land, inland waters, the oceans and ice bodies, as well as for urban infrastructure, agricultural productivity, health, economic growth and poverty. {WGII 2.2.1, 2.4.2, 3.4.1, 4.2.2, 5.4.1, 6.5, 7.3.1, 11.3.6, 13.2.2}

Risks are evaluated based on the interaction of projected changes in the Earth system with the many dimensions of vulnerability in societies and ecosystems. The data are seldom sufficient to allow direct estimation of probabilities of a given outcome; therefore, expert judgment using specific criteria (large magnitude, high probability or irreversibility of impacts; timing of impacts; persistent vulnerability or exposure contributing to risks; or limited potential to reduce risks through adaptation or mitigation) is used to integrate the diverse information sources relating to the severity of consequences and the likelihood of occurrence into a risk evaluation, considering exposure and vulnerability in the context of specific hazards. {WGII 11.319.2, 21.1, 21.3-21.5, 25.3-25.4, 25.11, 26.2}

Relative to 1850–1900, global surface temperature change for the end of the 21st century (2081–2100) is projected to likely exceed 1.5°C for RCP4.5, RCP6.0 and RCP8.5 (high confidence). Warming is likely to exceed 2°C for RCP6.0 and RCP8.5 (high confidence), more likely than not to exceed 2°C for RCP4.5 (medium confidence), but unlikely to exceed 2°C for RCP2.6 (medium confidence). {WGI SPM E.1, 12.4.1, Table 12.3}

The Arctic region will continue to warm more rapidly than the global mean (Figure 2.2(very high confidence). The mean warming over land will be larger than over the ocean (very high confidence) and larger than global average warming (Figure 2.2). {WGI SPM E.1, 11.3.2, 12.4.3, 14.8.2}

It is virtually certain that there will be more frequent hot and fewer cold temperature extremes over most land areas on daily and seasonal timescales, as global mean surface temperature increases. It is very likely that heat waves will occur with a higher frequency and longer duration. Occasional cold winter extremes will continue to occur. {WGI SPM E.1, 12.4.3}

Edit

Figure 2.1

Edit

Figure 2.1 | (a) Time series of global annual change in mean surface temperature for the 1900–2300 period (relative to 1986–2005) from Coupled Model Intercomparison Project Phase 5 (CMIP5) concentration-driven experiments. Projections are shown for the multi-model mean (solid lines) and the 5% to 95% range across the distribution of individual models (shading). Grey lines and shading represent the CMIP5 historical simulations. Discontinuities at 2100 are due to different numbers of models performing the extension runs beyond the 21st century and have no physical meaning. (b) Same as (a) but for the 2006–2100 period (relative to 1986–2005). (c) Change in Northern Hemisphere September sea-ice extent (5 year running mean). The dashed line represents nearly ice-free conditions (i.e., when September sea-ice extent is less than 106 km2 for at least five consecutive years). (d) Change in global mean sea level. (e) Change in ocean surface pH. For all panels, changes are relative to the 1986–2005 period; time series of projections and a measure of uncertainty (shading) are shown for scenarios RCP2.6 (blue) and RCP8.5 (red). The number of CMIP5 models used to calculate the multi-model mean is indicated. The mean and associated uncertainties averaged over the 2081–2100 period are given for all RCP scenarios as coloured vertical bars on the right hand side of panels (b) to (e). For sea-ice extent (c), the projected mean and uncertainty (minimum–maximum range) is only given for the subset of models that most closely reproduce the climatological mean state and the 1979–2012 trend in the Arctic sea ice. For sea level (d), based on current understanding (from observations, physical understanding and modelling), only the collapse of marine-based sectors of the Antarctic ice sheet, if initiated, could cause global mean sea level to rise substantially above the likely range during the 21st century. However, there is medium confidence that this additional contribution would not exceed several tenths of a meter of sea-level rise during the 21st century. {WGI Figure SPM.7, Figure SPM.9, Figure 12.5, 6.4.4, 12.4.1, 13.4.4, 13.5.1}

Table 2.1

Edit

Table 2.1 | Projected change in global mean surface temperature and global mean sea-level rise for the mid and late 21st century, relative to the 1986–2005 period. {WGI Table SPM.212.4.113.5.1Table 12.2Table 13.5}

  2046–2065 2081–2100
  Scenario Mean Likely rangec Mean Likely rangec
Global Mean Surface Temperature Change (°C)a RCP2.6 1.0 0.4 to 1.6 1.0 0.3 to 1.7
RCP4.5 1.4 0.9 to 2.0 1.8 1.1 to 2.6
RCP6.0 1.3 0.8 to 1.8 2.2 1.4 to 3.1
RCP8.5 2.0 1.4 to 2.6 3.7 2.6 to 4.8
  Scenario Mean Likely ranged Mean Likely ranged
Global Mean Sea-level Rise (m)b RCP2.6 0.24 0.17 to 0.32 0.40 0.26 to 0.55
RCP4.5 0.26 0.19 to 0.33 0.47 0.32 to 0.63
RCP6.0 0.25 0.18 to 0.32 0.48 0.33 to 0.63
RCP8.5 0.30 0.22 to 0.38 0.63 0.45 to 0.82


Notes:

a Based on the Coupled Model Intercomparison Project Phase 5 (CMIP5) ensemble; changes calculated with respect to the 1986–2005 period. Using Hadley Centre Climatic Research Unit Gridded Surface Temperature Data Set 4 (HadCRUT4) and its uncertainty estimate (5 to 95% confidence interval), the observed warming from 1850–1900 to the reference period 1986–2005 is 0.61 [0.55 to 0.67] °C. Likely ranges have not been assessed here with respect to earlier reference periods because methods are not generally available in the literature for combining the uncertainties in models and observations. Adding projected and observed changes does not account for potential effects of model biases compared to observations, and for natural internal variability during the observational reference period. {WGI 2.4.311.2.2, 12.4.1Table 12.2, Table 12.3}

b Based on 21 CMIP5 models; changes calculated with respect to the 1986–2005 period. Based on current understanding (from observations, physical understanding and modelling), only the collapse of marine-based sectors of the Antarctic ice sheet, if initiated, could cause global mean sea level to rise substantially above the likely range during the 21st century. There is medium confidence that this additional contribution would not exceed several tenths of a metre of sea-level rise during the 21st century. 

c Calculated from projections as 5% to 95% model ranges. These ranges are then assessed to be likely ranges after accounting for additional uncertainties or different levels of confidence in models. For projections of global mean surface temperature change in 2046–2065, confidence is medium, because the relative importance of natural internal variability, and uncertainty in non-greenhouse gas forcing and response, are larger than for the 2081–2100 period. The likely ranges for 2046–2065 do not take into account the possible influence of factors that lead to the assessed range for near-term (2016–2035) change in global mean surface temperature that is lower than the 5% to 95% model range, because the influence of these factors on longer term projections has not been quantified due to insufficient scientific understanding. {WGI 11.3.1}

d Calculated from projections as 5% to 95% model ranges. These ranges are then assessed to be likely ranges after accounting for additional uncertainties or different levels of confidence in models. For projections of global mean sea-level rise confidence is medium for both time horizons.

2.2.2. Water cycle

Changes in precipitation in a warming world will not be uniform. The high latitudes and the equatorial Pacific are likely to experience an increase in annual mean precipitation by the end of this century under the RCP8.5 scenario. In many mid-latitude and subtropical dry regions, mean precipitation will likely decrease, while in many mid-latitude wet regions, mean precipitation will likely increase under the RCP8.5 scenario (Figure 2.2). {WGI SPM E.2, 7.6.2, 12.4.5, 14.3.1, 14.3.5}

Extreme precipitation events over most mid-latitude land masses and over wet tropical regions will very likely become more intense and more frequent as global mean surface temperature increases. {WGI SPM E.2, 7.6.2, 12.4.5}

Globally, in all RCPs, it is likely that the area encompassed by monsoon systems will increase and monsoon precipitation is likely to intensify and El Niño-Southern Oscillation (ENSO) related precipitation variability on regional scales will likely intensify. {WGI SPM E.2, 14.2, 14.4}

Edit

2.2.3. Ocean, cryosphere and sea level

The global ocean will continue to warm during the 21st century. The strongest ocean warming is projected for the surface in tropical and Northern Hemisphere subtropical regions. At greater depth the warming will be most pronounced in the Southern Ocean (high confidence). {WGI SPM E.4, 6.4.5, 12.4.7}

Figure 2.2

Edit

Figure 2.2 | Coupled Model Intercomparison Project Phase 5 (CMIP5) multi-model mean projections (i.e., the average of the model projections available) for the 2081–2100 period under the RCP2.6 (left) and RCP8.5 (right) scenarios for (a) change in annual mean surface temperature and (b) change in annual mean precipitation, in percentages, and (c) change in average sea level. Changes are shown relative to the 1986–2005 period. The number of CMIP5 models used to calculate the multi-model mean is indicated in the upper right corner of each panel. Stippling (dots) on (a) and (b) indicates regions where the projected change is large compared to natural internal variability (i.e., greater than two standard deviations of internal variability in 20-year means) and where 90% of the models agree on the sign of change. Hatching (diagonal lines) on (a) and (b) shows regions where the projected change is less than one standard deviation of natural internal variability in 20-year means. {WGI Figure SPM.8, Figure 13.20, Box 12.1}

It is very likely that the Atlantic Meridional Overturning Circulation (AMOC) will weaken over the 21st century, with best estimates and model ranges for the reduction of 11% (1 to 24%) for the RCP2.6 scenario, 34% (12 to 54%) for the RCP8.5. Nevertheless, it is very unlikely that the AMOC will undergo an abrupt transition or collapse in the 21st century. {WGI SPM E.4, 12.4.7.2}

Year-round reductions in Arctic sea ice are projected for all RCP scenarios. The subset of models that most closely reproduce the observations4 project that a nearly ice-free Arctic Ocean5 in September is likely for RCP8.5 before mid-century (medium confidence) (Figure 2.1). In the Antarctic, a decrease in sea ice extent and volume is projected with low confidence{WGI SPM E.5, WGI 12.4.6.1}

The area of Northern Hemisphere spring snow cover is likely to decrease by 7% for RCP2.6 and by 25% in RCP8.5 by the end of the 21st century for the multi-model average (medium confidence). {WGI SPM E.5, WGI 12.4.6}

It is virtually certain that near-surface permafrost extent at high northern latitudes will be reduced as global mean surface temperature increases. The area of permafrost near the surface (upper 3.5 m) is likely to decrease by 37% (RCP2.6) to 81% (RCP8.5) for the multi-model average (medium confidence). {WGI SPM E.5, WGI 12.4.6}

The global glacier volume, excluding glaciers on the periphery of Antarctica (and excluding the Greenland and Antarctic ice sheets), is projected to decrease by 15 to 55% for RCP2.6 and by 35 to 85% for RCP8.5 (medium confidence). {WGI SPM E.5, WGI 13.4.2, 13.5.1}

Global mean sea level will continue to rise during the 21st century  (Table 2.1, Figure 2.1). There has been significant improvement in understanding and projection of sea level change since the AR4. Under all RCP scenarios, the rate of sea level rise will very likely exceed the observed rate of 2.0 [1.7–2.3] mm/yr during 1971–2010, with the rate of rise for RCP8.5 during 2081–2100 of 8 to 16 mm/yr (medium confidence). {WGI SPM B4, SPM E.6, WGI 13.5.1}

Sea level rise will not be uniform across regions. By the end of the 21st century, it is very likely that sea level will rise in more than about 95% of the ocean area. Sea level rise depends on the pathway of CO2 emissions, not only on the cumulative total; reducing emissions earlier rather than later, for the same cumulative total, leads to a larger mitigation of sea level rise. About 70% of the coastlines worldwide are projected to experience sea level change within ±20% of the global mean (Figure 2.2). It is very likely that there will be a significant increase in the occurrence of future sea level extremes in some regions by 2100. {WGI SPM E.6, TS 5.7.1, 12.4.1, 13.4.1, 13.5.1, 13.6.5, 13.7.2, Table 13.5}

Edit

2.2.4. Carbon cycle and biogeochemistry

Ocean uptake of anthropogenic CO2 will continue under all four RCPs through to 2100, with higher uptake for higher concentration pathways (very high confidence). The future evolution of the land carbon uptake is less certain. A majority of models projects a continued land carbon uptake under all RCPs, but some models simulate a land carbon loss due to the combined effect of climate change and land use change. {WGI SPM E.7, 6.4.2, 6.4.3}

Based on Earth System Models, there is high confidence that the feedback between climate change and the carbon cycle will amplify global warming. Climate change will partially offset increases in land and ocean carbon sinks caused by rising atmospheric CO2. As a result more of the emitted anthropogenic CO2 will remain in the atmosphere, reinforcing the warming. {WGI SPM E.7, 6.4.2, 6.4.3}

Earth System Models project a global increase in ocean acidification for all RCP scenarios by the end of the 21st century, with a slow recovery after mid-century under RCP2.6. The decrease in surface ocean pH is in the range of 0.06 to 0.07 (15 to 17% increase in acidity) for RCP2.6, 0.14 to 0.15 (38 to 41%) for RCP4.5, 0.20 to 0.21 (58 to 62%) for RCP6.0, and 0.30 to 0.32 (100 to 109%) for RCP8.5 (Figure 2.1). {WGI SPM E.7, WGI 6.4.4}

It is very likely that the dissolved oxygen content of the ocean will decrease by a few percent during the 21st century in response to surface warming, predominantly in the subsurface mid-latitude oceans. There is no consensus on the future volume of low oxygen waters in the open ocean because of large uncertainties in potential biogeochemical effects and in the evolution of tropical ocean dynamics. {WGI TS 5.6, 6.4.5, WGII TS B-26.1}

Edit

2.2.5. Climate system responses

Climate system properties that determine the response to external forcing have been estimated both from climate models and from analysis of past and recent climate change. The equilibrium climate sensitivity (ECS)6 is likely in the range 1.5°C to 4.5°C, extremely unlikely less than 1°C, and very unlikely greater than 6°C. {WGI SPM D.2, TS TFE.6, 10.8.1, 10.8.2, 12.5.4, Box 12.2}

Cumulative emissions of CO2 largely determine global mean surface warming by the late 21st century and beyond. Multiple lines of evidence indicate a strong and consistent near-linear relationship across all scenarios considered between net cumulative CO2 emissions (including the impact of CO2 removal) and projected global temperature change to the year 2100 (Figure 2.3). Past emissions and observed warming support this relationship within uncertainties. Any given level of warming is associated with a range of cumulative CO2 emissions (depending on non-CO2 drivers), and therefore, for example, higher emissions in earlier decades imply lower emissions later. {WGI SPM E.8, TS TFE.8, 12.5.4}

Figure 2.3

Edit

Figure 2.3 | Global mean surface temperature increase as a function of cumulative total global carbon dioxide (CO2) emissions from various lines of evidence. Multi-model results from a hierarchy of climate carbon-cycle models for each Representative Concentration Pathway (RCP) until 2100 are shown (coloured lines). Model results over the historical period (1860 to 2010) are indicated in black. The coloured plume illustrates the multi-model spread over the four RCP scenarios and fades with the decreasing number of available models in RCP8.5. Dots indicate decadal averages, with selected decades labelled. Ellipses show total anthropogenic warming in 2100 versus cumulative CO2 emissions from 1870 to 2100 from a simple climate model (median climate response) under the scenario categories used in WGIII. Temperature values are always given relative to the 1861–1880 period, and emissions are cumulative since 1870. Black filled ellipse shows observed emissions to 2005 and observed temperatures in the decade 2000–2009 with associated uncertainties. {WGI SPM E.8, TS TFE.8 Figure 1, TS.SM.10, 12.5.4, Figure 12.45, WGIII Table SPM.1, Table 6.3}

The global mean peak surface temperature change per trillion tonnes of carbon (1000 GtC) emitted as CO2 is likely in the range of 0.8°C to 2.5°C. This quantity, called the transient climate response to cumulative carbon emissions (TCRE), is supported by both modelling and observational evidence and applies to cumulative emissions up to about 2000 GtC. {WGI SPM D.2, TS TFE.6, 12.5.4, Box 12.2}

Warming caused by CO2 emissions is effectively irreversible over multi-century timescales unless measures are taken to remove CO2 from the atmosphere. Ensuring CO2-induced warming remains likely less than 2°C requires cumulative CO2 emissions from all anthropogenic sources to remain below about 3650 GtCO2 (1000 GtC), over half of which were already emitted by 2011. {WGI SPM E.8, TS TFE.8, 12.5.2, 12.5.3, 12.5.4}

Multi-model results show that limiting total human-induced warming (accounting for both CO2 and other human influences on climate) to less than 2°C relative to the period 1861–1880 with a probability of >66% would require total CO2 emissions from all anthropogenic sources since 1870 to be limited to about 2900 GtCO2 when accounting for non-CO2 forcing as in the RCP2.6 scenario, with a range of 2550 to 3150 GtCO2 arising from variations in non-CO2 climate drivers across the scenarios considered by WGIII (Table 2.2). About 1900 [1650 to 2150] GtCO2 were emitted by 2011, leaving about 1000 GtCO2 to be consistent with this temperature goal. Estimated total fossil carbon reserves exceed this remaining amount by a factor of 4 to 7, with resources much larger still. {WGI SPM E.8, TS TFE.8 Figure 1, TS.SM.10Figure 12.45, WGIII Table SPM.1, Table 6.3, Table 7.2}

Edit

Table 2.2

Edit

Table 2.2 | Cumulative carbon dioxide (CO2) emission consistent with limiting warming to less than stated temperature limits at different levels of probability, based on different lines of evidence. {WGI 12.5.4, WGIII 6}

Cumulative CO2 emissions from 1870 in GtCO2
Net anthropogenic warminga <1.5ºC <2ºC <3ºC
Fraction of simulations meeting goalb 66% 50% 33% 66% 50% 33% 66% 50% 33%
Complex models, RCP scenarios onlyc 2250 2250 2550 2900 3000 3300 4200 4500 4850
Simple model, WGIII scenariosd No data 2300–2350 2400–2950 2550–3150 2900–3200 2950–3800 n.a.e 4150–5750 5250–6000
Cumulative CO2 emissions from 2011 in GtCO2
Complex models, RCP scenarios onlyc 400 550 850 1000 1300 1500 2400 2800 3250
Simple model, WGIII scenariosd No data 550–600 600–1150 750–1400 1150–1400 1150–2050 n.a.e 2350–4000 3500–4250
Total fossil carbon available in 2011f : 3670–7100 GtCO2 (reserves) & 31300–50050 GtCO2 (resources)


Notes:

a Warming due to CO2 and non-CO2 drivers. Temperature values are given relative to the 1861–1880 base period. 

b Note that the 66% range in this table should not be equated to the likelihood statements in Table SPM.1 and Table 3.1 and WGIII Table SPM.1. The assessment in these latter tables is not only based on the probabilities calculated for the full ensemble of scenarios in WGIII using a single climate model, but also the assessment in WGI of the uncertainty of the temperature projections not covered by climate models. 

c Cumulative CO2 emissions at the time the temperature threshold is exceeded that are required for 66%, 50% or 33% of the Coupled Model Intercomparison Project Phase 5 (CMIP5) complex models Earth System Model (ESM) and Earth System Models of Intermediate Complexity (EMIC) simulations, assuming non-CO2 forcing follows the RCP8.5 scenario. Similar cumulative emissions are implied by other RCP scenarios. For most scenario–threshold combinations, emissions and warming continue after the threshold is exceeded. Nevertheless, because of the cumulative nature of CO2 emissions, these figures provide an indication of the cumulative CO2 emissions implied by the CMIP5 model simulations under RCP-like scenarios. Values are rounded to the nearest 50.

d Cumulative CO2 emissions at the time of peak warming from WGIII scenarios for which a fraction of greater than 66% (66 to 100%), greater than 50% (50 to 66%) or greater than 33% (33 to 50%) of climate simulations keep global mean temperature increase to below the stated threshold. Ranges indicate the variation in cumulative CO2 emissions arising from differences in non-CO2 drivers across the WGIII scenarios. The fraction of climate simulations for each scenario is derived from a 600-member parameter ensemble of a simple carbon-cycle climate model, Model for the Assessment of Greenhouse Gas Induced Climate Change (MAGICC), in a probabilistic mode. Parameter and scenario uncertainty are explored in this ensemble. Structural uncertainties cannot be explored with a single model set-up. Ranges show the impact of scenario uncertainty, with 80% of scenarios giving cumulative CO2 emissions within the stated range for the given fraction of simulations. Simple model estimates are constrained by observed changes over the past century, do not account for uncertainty in model structure and may omit some feedback processes: they are hence slightly higher than the CMIP5 complex models estimates. Values are rounded to the nearest 50. 

e The numerical results for the cumulative CO2 emissions for staying below 3°C with greater than 66% (66 to 100%) is greatly influenced by a large number of scenarios that would also meet the 2°C objective and therefore not comparable with numbers provided for the other temperature threshold. 

f Reserves are quantities able to be recovered under existing economic and operating conditions; resources are those where economic extraction is potentially feasible. {WGIII Table 7.2}

2.3. Future risks and impacts caused by a changing climate

Climate change will amplify existing risks and create new risks for natural and human systems. Risks are unevenly distributed and are generally greater for disadvantaged people and communities in countries at all levels of development. Increasing magnitudes of warming increase the likelihood of severe, pervasive and irreversible impacts for people, species and ecosystems. Continued high emissions would lead to mostly negative impacts for biodiversity, ecosystem services and economic development and amplify risks for livelihoods and for food and human security.

Edit

Risk of climate-related impacts results from the interaction of climate-related hazards (including hazardous events and trends) with the vulnerability and exposure of human and natural systems, including their ability to adapt. Rising rates and magnitudes of warming and other changes in the climate system, accompanied by ocean acidification, increase the risk of severe, pervasive, and in some cases, irreversible detrimental impacts. Future climate change will amplify existing climate-related risks and create new risks. {WGII SPM B, Figure SPM.1}

Key risks are potentially severe impacts relevant to understanding dangerous anthropogenic interference with the climate system. Risks are considered key due to high hazard or high vulnerability of societies and systems exposed, or both. Their identification is based on large magnitude or high probability of impacts; irreversibility or timing of impacts; persistent vulnerability or exposure; or limited potential to reduce risks. Some risks are particularly relevant for individual regions (Figure 2.4), while others are global (Table 2.3). For risk assessment it is important to evaluate the widest possible range of impacts, including low-probability outcomes with large consequences. Risk levels often increase with temperature (Box 2.3) and are sometimes more directly linked to other dimensions of climate change, such as the rate of warming, as well as the magnitudes and rates of ocean acidification and sea level rise (Figure 2.5). {WGII SPM A-3, B-1}

Figure 2.4

Edit

Figure 2.4 | Representative key risks for each region, including the potential for risk reduction through adaptation and mitigation, as well as limits to adaptation. Identification of key risks was based on expert judgment using the following specific criteria: large magnitude, high probability or irreversibility of impacts; timing of impacts; persistent vulnerability or exposure contributing to risks; or limited potential to reduce risks through adaptation or mitigation. Risk levels are assessed as very low, low, medium, high or very high for three timeframes: the present, near term (here, for 2030–2040) and long term (here, for 2080–2100). In the near term, projected levels of global mean temperature increase do not diverge substantially across different emission scenarios. For the long term, risk levels are presented for two possible futures (2°C and 4°C global mean temperature increase above pre-industrial levels). For each time frame, risk levels are indicated for a continuation of current adaptation and assuming high levels of current or future adaptation. Risk levels are not necessarily comparable, especially across regions. {WGII SPM Assessment Box SPM.2 Table 1}

Key risks that span sectors and regions include the following (high confidence) {WGII SPM B-1}:

  1. Risk of severe ill-health and disrupted livelihoods resulting from storm surges, sea level rise and coastal flooding; inland flooding in some urban regions; and periods of extreme heat.
  2. Systemic risks due to extreme weather events leading to break-down of infrastructure networks and critical services.
  3. Risk of flood and water insecurity and loss of rural livelihoods and income, particularly for poorer populations.
  4. Risk of loss of ecosystems, biodiversity and ecosystem goods, functions and services. 

The overall risks of future climate change impacts can be reduced by limiting the rate and magnitude of climate change, including ocean acidification. Some risks are considerable even at 1°C global mean temperature increase above pre-industrial levels. Many global risks are high to very high for global temperature increases of 4°C or more (see Box 2.4). These risks include severe and widespread impacts on unique and threatened systems, the extinction of many species, large risks to food security and compromised normal human activities, including growing food or working outdoors in some areas for parts of the year, due to the combination of high temperature and humidity. The precise levels of climate change sufficient to trigger abrupt and irreversible change remain uncertain, but the risk associated with crossing such thresholds in the earth system or in interlinked human and natural systems increases with rising temperature (medium confidence) {WGII SPM B-1}

Adaptation can substantially reduce the risks of climate change impacts, but greater rates and magnitude of climate change increase the likelihood of exceeding adaptation limits (high confidence). The potential for adaptation, as well as constraints and limits to adaptation, varies among sectors, regions, communities and ecosystems. The scope for adaptation changes over time and is closely linked to socio-economic development pathways and circumstances. See Figure 2.4 and Table 2.3, along with Topic 3 and Topic 4. {WGII SPM B, SPM C, TS B, TS C}

Edit

2.3.1. Ecosystems and their services in the oceans, along coasts, on land and in freshwater

Risks of harmful impacts on ecosystems and human systems increase with the rates and magnitudes of warming, ocean acidification, sea level rise and other dimensions of climate change (high confidence). Future risk is indicated to be high by the observation that natural global climate change at rates lower than current anthropogenic climate change caused significant ecosystem shifts and species extinctions during the past millions of years on land and in the oceans (high confidence). Many plant and animal species will be unable to adapt locally or move fast enough during the 21st century to track suitable climates under mid- and high range rates of climate change (RCP4.5, RCP6.0 and RCP8.5) (medium confidence) (Figure 2.5a). Coral reefs and polar ecosystems are highly vulnerable. {WGII SPM A-1SPM B-24.3-4, 5.4, 6.1, 6.3, 6.5, 25.6, 26.4, 29.4, Box CC-CR, Box CC-MBBox CC-RF}

A large fraction of terrestrial, freshwater and marine species faces increased extinction risk due to climate change during and beyond the 21st century, especially as climate change interacts with other stressors (high confidence). Extinction risk is increased relative to pre-industrial and present periods, under all RCP scenarios, as a result of both the magnitude and rate of climate change (high confidence). Extinctions will be driven by several climate-associated drivers (warming, sea-ice loss, variations in precipitation, reduced river flows, ocean acidification and lowered ocean oxygen levels) and the interactions among these drivers and their interaction with simultaneous habitat modification, over-exploitation of stocks, pollution, eutrophication and invasive species (high confidence). {WGII SPM B-2, 4.3-4.4, 6.1, 6.3, 6.5, 25.6, 26.4, Box CC-RF, Box CC-MB}

Global marine species redistribution and marine biodiversity reduction in sensitive regions, under climate change, will challenge the sustained provision of fisheries productivity and other ecosystem services, especially at low latitudes (high confidence). By the mid-21st century, under 2°C global warming relative to pre-industrial temperatures, shifts in the geographical range of marine species will cause species richness and fisheries catch potential to increase, on average, at mid and high latitudes (high confidence) and to decrease at tropical latitudes and in semi-enclosed seas (Figure 2.6a) (medium confidence). The progressive expansion of Oxygen Minimum Zones and anoxic ‘dead zones’ in the oceans will further constrain fish habitats (medium confidence). Open-ocean net primary production is projected to redistribute and to decrease globally, by 2100, under all RCP scenarios (medium confidence). Climate change adds to the threats of over-fishing and other non-climatic stressors (high confidence). {WGII SPM B-2, 6.3-6.5, 7.4, 25.6, 28.3, 29.3, 30.6-7, Box CC-MBBox CC-PP}

Marine ecosystems, especially coral reefs and polar ecosystems, are at risk from ocean acidification (medium to high confidence). Ocean acidification has impacts on the physiology, behaviour and population dynamics of organisms. The impacts on individual species and the number of species affected in species groups increase from RCP4.5 to RCP8.5. Highly calcified molluscs, echinoderms and reef-building corals are more sensitive than crustaceans (high confidence) and fishes (low confidence) (Figure 2.6b). Ocean acidification acts together with other global changes (e.g., warming, progressively lower oxygen levels) and with local changes (e.g., pollution, eutrophication) (high confidence), leading to interactive, complex and amplified impacts for species and ecosystems. (Figure 2.5b). {WGII SPM B-2Figure SPM.6B5.4, 6.3.2, 6.3.5, 22.3, 25.6, 28.3, 30.5, Figure 6-10, Boxes CC-CR, CC-OA, Box TS.7}

Carbon stored in the terrestrial biosphere is susceptible to loss to the atmosphere as a result of climate change, deforestation and ecosystem degradation (high confidence). The aspects of climate change with direct effects on stored terrestrial carbon include high temperatures, drought and windstorms; indirect effects include increased risk of fires, pest and disease outbreaks. Increased tree mortality and associated forest dieback is projected to occur in many regions over the 21st century (medium confidence), posing risks for carbon storage, biodiversity, wood production, water quality, amenity and economic activity. There is a high risk of substantial carbon and methane emissions as a result of permafrost thawing. {WGII SPM, 4.2-4.3, Figure 4-8, Box 4-2, Box 4-3, Box 4-4}

Coastal systems and low-lying areas will increasingly experience submergence, flooding and erosion throughout the 21st century and beyond, due to sea level rise (very high confidence). The population and assets projected to be exposed to coastal risks as well as human pressures on coastal ecosystems will increase significantly in the coming decades due to population growth, economic development and urbanization (high confidence). Climatic and non-climatic drivers affecting coral reefs will erode habitats, increase coastline exposure to waves and storms and degrade environmental features important to fisheries and tourism (high confidence). Some low-lying developing countries and small island states are expected to face very high impacts that could have associated damage and adaptation costs of several percentage points of gross domestic product (GDP) (Figure 2.5c). {WGII 5.3-5.5, 22.3, 24.4, 25.6, 26.3, 26.8, 29.4, Table 26-1, Boxes 25-1Box CC-CR}

Edit

Figure 2.5

Edit

Figure 2.5 | The risks of: (a) disruption of the community composition of terrestrial and freshwater ecosystems due to the rate of warming; (b) marine organisms impacted by ocean acidification (OA) or warming extremes combined with OA; and (c) coastal human and natural systems impacted by sea level rise. The risk level criteria are consistent with those used in Box 2.4 and their calibration is illustrated by the annotations to each panel. (a) At high rates of warming, major groups of terrestrial and freshwater species are unable to move fast enough to stay within the spatially shifting climate envelopes to which they are adapted. The median observed or modelled speeds at which species populations move (km/ decade) are compared against the speed at which climate envelopes move across the landscape, given the projected climate change rates for each Representative Concentration Pathway (RCP) over the 2050–2090 period. The results are presented for the average of all landscapes, globally, as well as for flat landscapes, where the climate envelope moves especially fast. (b) Sensitivity to ocean acidification is high in marine organisms building a calcium carbonate shell. The risks from OA increase with warming because OA lowers the tolerated levels of heat exposure, as seen in corals and crustaceans. (c) The height of a 50-year flood event has already increased in many coastal locations. A 10- to more than 100-fold increase in the frequency of floods in many places would result from a 0.5 m rise in sea level in the absence of adaptation. Local adaptation capacity (and, in particular, protection) reaches its limits for ecosystems and human systems in many places under a 1 m sea level rise. (2.2.4, Table 2.1, Figure 2.8) {WGI 3.7.53.8, 6.4.4, Figure 13.25, WGII Figure SPM.5, Figure 4-5, Figure 6-10, Box CC-OA, 4.4.2.5, 5.2, 5.3-5, 5.4.4, 5.5.6, 6.3}

2.3.2. Water, food and urban systems, human health, security and livelihoods

The fractions of the global population that will experience water scarcity and be affected by major river floods are projected to increase with the level of warming in the 21st century (robust evidence, high agreement). {WGII 3.4-3.5, 26.3, 29.4, Table 3-2, Box 25-8}

Figure 2.6

Edit

Figure 2.6 | Climate change risks for fisheries. (a) Projected global redistribution of maximum catch potential of ~1000 species of exploited fishes and invertebrates, comparing the 10-year averages over 2001–2010 and 2051–2060, using ocean conditions based on a single climate model under a moderate to high warming scenario (2°C warming relative to pre-industrial temperatures), without analysis of potential impacts of overfishing or ocean acidification. (b) Marine mollusc and crustacean fisheries (present-day estimated annual catch rates ≥0.005 tonnes/km2) and known locations of cold- and warm-water corals, depicted on a global map showing the projected distribution of surface ocean acidification by 2100 under RCP8.5. The bottom panel compares the percentage of species sensitive to ocean acidification for corals, molluscs and crustaceans, vulnerable animal phyla with socio-economic relevance (e.g., for coastal protection and fisheries). The number of species analysed across studies is given on top of the bars for each category of elevated CO2. For 2100, RCP scenarios falling within each pCO2 category are as follows: RCP4.5 for 500 to 650 μatm, RCP6.0 for 651 to 850 μatm and RCP8.5 for 851 to 1370 μatm. By 2150, RCP8.5 falls within the 1371 to 2900 μatm category. The control category corresponds to 380 μatm (The unit μatm is approximately equivalent to ppm in the atmosphere). {WGI Figure SPM.8Box SPM.1, WGII SPM B-2, Figure SPM.6, 6.1, 6.3, 30.5, Figure 6-10, Figure 6-14}

Climate change over the 21st century is projected to reduce renewable surface water and groundwater resources in most dry subtropical regions (robust evidence, high agreement), intensifying competition for water among sectors (limited evidence, medium agreement). In presently dry regions, the frequency of droughts will likely increase by the end of the 21st century under RCP8.5 (medium confidence). In contrast, water resources are projected to increase at high latitudes (robust evidence, high agreement). The interaction of increased temperature; increased sediment, nutrient and pollutant loadings from heavy rainfall; increased concentrations of pollutants during droughts; and disruption of treatment facilities during floods will reduce raw water quality and pose risks to drinking water quality (medium evidence, high agreement). {WGI 12.4, WGII 3.2, 3.4-3.6, 22.3, 23.9, 25.5, 26.3, Table 3-2, Table 23-3, Box 25-2, Box CC-RF, Box CC-WE}

All aspects of food security are potentially affected by climate change, including food production, access, use and price stability (high confidence). For wheat, rice and maize in tropical and temperate regions, climate change without adaptation is projected to negatively impact production at local temperature increases of 2°C or more above late 20th century levels, although individual locations may benefit (medium confidence). Projected impacts vary across crops and regions and adaptation scenarios, with about 10% of projections for the 2030–2049 period showing yield gains of more than 10%, and about 10% of projections showing yield losses of more than 25%, compared with the late 20th century. Global temperature increases of ~4°C or more above late 20th century levels, combined with increasing food demand, would pose large risks to food security, both globally and regionally (high confidence) (Figure 2.4, Figure 2.7). The relationship between global and regional warming is explained in 2.2.1. {WGII 6.3-6.5, 7.4-5, 9.3, 22.3, 24.4, 25.7, 26.5, Table 7-2, Table 7-3, Figures 7-1, Figure 7-4, Figure 7-5, Figure 7-6, Figure 7-7, Figure 7-8, Box 7-1}

Until mid-century, projected climate change will impact human health mainly by exacerbating health problems that already exist (very high confidence). Throughout the 21st century, climate change is expected to lead to increases in ill-health in many regions and especially in developing countries with low income, as compared to a baseline without climate change (high confidence). Health impacts include greater likelihood of injury and death due to more intense heat waves and fires, increased risks from foodborne and waterborne diseases and loss of work capacity and reduced labour productivity in vulnerable populations (high confidence). Risks of undernutrition in poor regions will increase (high confidence). Risks from vector-borne diseases are projected to generally increase with warming, due to the extension of the infection area and season, despite reductions in some areas that become too hot for disease vectors (medium confidence). Globally, the magnitude and severity of negative impacts will increasingly outweigh positive impacts (high confidence). By 2100 for RCP8.5, the combination of high temperature and humidity in some areas for parts of the year is expected to compromise common human activities, including growing food and working outdoors (high confidence). {WGII SPM B-2, 8.2, 11.3-11.8, 19.3, 22.3, 25.8, 26.6, Figure 25-5, Box CC-HS}

In urban areas, climate change is projected to increase risks for people, assets, economies and ecosystems, including risks from heat stress, storms and extreme precipitation, inland and coastal flooding, landslides, air pollution, drought, water scarcity, sea level rise and storm surges (very high confidence). These risks will be amplified for those lacking essential infrastructure and services or living in exposed areas. {WGII 3.5, 8.2-8.4, 22.3, 24.4-24.5, 26.8, Table 8-2, Box 25-9, Box CC-HS}

Rural areas are expected to experience major impacts on water availability and supply, food security, infrastructure and agricultural incomes, including shifts in the production areas of food and non-food crops around the world (high confidence). These impacts will disproportionately affect the welfare of the poor in rural areas, such as female-headed households and those with limited access to land, modern agricultural inputs, infrastructure and education. {WGII 5.4, 9.3, 25.9, 26.8, 28.2, 28.4, Box 25-5}

Figure 2.7

Edit

Figure 2.7 | Summary of projected changes in crop yields (mostly wheat, maize, rice, and soy) due to climate change over the 21st century. The figure combines 1090 data points from crop model projections, covering different emission scenarios, tropical and temperate regions, and adaptation and no-adaptation cases. The projections are sorted into the 20-year periods (horizontal axis) during which their midpoint occurs. Changes in crop yields are relative to late 20th century levels, and data for each time period sum to 100%. Relatively few studies have considered impacts on cropping systems for scenarios where global mean temperatures increase by 4°C or more. {WGII Figure SPM.7}

Aggregate economic losses accelerate with increasing temperature (limited evidence, high agreement), but global economic impacts from climate change are currently difficult to estimate. With recognized limitations, the existing incomplete estimates of global annual economic losses for warming of ~2.5°C above pre-industrial levels are 0.2 to 2.0% of income (medium evidence, medium agreement). Changes in population, age structure, income, technology, relative prices, lifestyle, regulation and governance are projected to have relatively larger impacts than climate change, for most economic sectors (medium evidence, high agreement). More severe and/ or frequent weather hazards are projected to increase disaster-related losses and loss variability, posing challenges for affordable insurance, particularly in developing countries. International dimensions such as trade and relations among states are also important for understanding the risks of climate change at regional scales. (Box 3.1) {WGII 3.5, 10.2, 10.7, 10.9-10.10, 17.4-17.5, 25.7, 26.7-26.9Box 25-7}

From a poverty perspective, climate change impacts are projected to slow down economic growth, make poverty reduction more difficult, further erode food security and prolong existing poverty traps and create new ones, the latter particularly in urban areas and emerging hotspots of hunger (medium confidence). Climate change impacts are expected to exacerbate poverty in most developing countries and create new poverty pockets in countries with increasing inequality, in both developed and developing countries (Figure 2.4). {WGII 8.1, 8.3-8.4, 9.3, 10.9, 13.2-13.4, 22.3, 26.8

Climate change is projected to increase displacement of people (medium evidence, high agreement). Displacement risk increases when populations that lack the resources for planned migration experience higher exposure to extreme weather events, such as floods and droughts. Expanding opportunities for mobility can reduce vulnerability for such populations. Changes in migration patterns can be responses to both extreme weather events and longer term climate variability and change, and migration can also be an effective adaptation strategy. {WGII 9.3, 12.4, 19.4, 22.3, 25.9}

Climate change can indirectly increase risks of violent conflict by amplifying well-documented drivers of these conflicts, such as poverty and economic shocks (medium confidence). Multiple lines of evidence relate climate variability to some forms of conflict. {WGII SPM, 12.5, 13.2, 19.4}

Edit

Table 2.3

Edit

Table 2.3 | Examples of global key risks for different sectors, including the potential for risk reduction through adaptation and mitigation, as well as limits to adaptation. Each key risk is assessed as very low, low, medium, high or very high. Risk levels are presented for three time frames: present, near term (here, for 2030–2040) and long term (here, for 2080–2100). In the near term, projected levels of global mean temperature increase do not diverge substantially across different emission scenarios. For the long term, risk levels are presented for two possible futures (2°C and 4°C global mean temperature increase above pre-industrial levels). For each time frame, risk levels are indicated for a continuation of current adaptation and assuming high levels of current or future adaptation. Risk levels are not necessarily comparable, especially across regions. Relevant climate variables are indicated by icons. {WGII Table TS.4}

Box 2.4 Reasons for Concern Regarding Climate Change

Edit

Five Reasons For Concern (RFCs) have provided a framework for summarizing key risks since the IPCC Third Assessment Report. They illustrate the implications of warming and of adaptation limits for people, economies and ecosystems across sectors and regions. They provide one starting point for evaluating dangerous anthropogenic interference with the climate system. All warming levels in the text of Box 2.4 are relative to the 1986–2005 period. Adding ~0.6°C to these warming levels roughly gives warming relative to the 1850–1900 period, used here as a proxy for pre-industrial times (right-hand scale in (Box 2.4, Figure 1). {WGII Assessment Box SPM.1

The five RFCs are associated with:

  1. Unique and threatened systems: Some ecosystems and cultures are already at risk from climate change (high confidence). With additional warming of around 1°C, the number of unique and threatened systems at risk of severe consequences increases. Many systems with limited adaptive capacity, particularly those associated with Arctic sea ice and coral reefs, are subject to very high risks with additional warming of 2°C. In addition to risks resulting from the magnitude of warming, terrestrial species are also sensitive to the rate of warming, marine species to the rate and degree of ocean acidification and coastal systems to sea level rise  (Figure 2.5).

  2. Extreme weather events: Climate change related risks from extreme events, such as heat waves, heavy precipitation and coastal flooding, are already moderate (high confidence). With 1°C additional warming, risks are high (medium confidence). Risks associated with some types of extreme events (e.g., extreme heat) increase progressively with further warming (high confidence). 

  3. Distribution of impacts: Risks are unevenly distributed between groups of people and between regions; risks are generally greater for disadvantaged people and communities everywhere. Risks are already moderate because of regional differences in observed climate change impacts, particularly for crop production (medium to high confidence). Based on projected decreases in regional crop yields and water availability, risks of unevenly distributed impacts are high under additional warming of above 2°C (medium confidence). 

  4. Global aggregate impacts: Risks of global aggregate impacts are moderate under additional warming of between 1°C and 2°C, reflecting impacts on both the Earth’s biodiversity and the overall global economy (medium confidence). Extensive biodiversity loss, with associated loss of ecosystem goods and services, leads to high risks at around 3°C additional warming (high confidence). Aggregate economic damages accelerate with increasing temperature (limited evidence, high agreement), but few quantitative estimates are available for additional warming of above 3°C. 

  5. Large-scale singular events: With increasing warming, some physical and ecological systems are at risk of abrupt and/or irreversible changes (see Section 2.4). Risks associated with such tipping points are moderate between 0 and 1°C additional warming, since there are signs that both warm-water coral reefs and Arctic ecosystems are already experiencing irreversible regime shifts (medium confidence). Risks increase at a steepening rate under an additional warming of 1 to 2°C and become high above 3°C, due to the potential for large and irreversible sea level rise from ice sheet loss. For sustained warming above some threshold greater than ~0.5°C additional warming (low confidence) but less than ~3.5°C (medium confidence), near-complete loss of the Greenland ice sheet would occur over a millennium or more, eventually contributing up to 7 m to global mean sea level rise. 

Box 2.4 Figure 1

Edit

Box 2.4, Figure 1 | Risks associated with Reasons For Concern at a global scale are shown for increasing levels of climate change. The colour shading indicates the additional risk due to climate change when a temperature level is reached and then sustained or exceeded. White indicates no associated impacts are detectable and attributable to climate change. Yellow indicates that associated impacts are both detectable and attributable to climate change with at least medium confidence. Red indicates severe and widespread impacts. Purple, introduced in this assessment, shows that very high risk is indicated by all key risk criteria. {WGII SPM Assessment Box 1, Figure 19-4}

2.4. Climate change beyond 2100, irreversibility and abrupt changes

Many aspects of climate change and its associated impacts will continue for centuries, even if anthropogenic emissions of greenhouse gases are stopped. The risks of abrupt or irreversible changes increase as the magnitude of the warming increases.

Edit

Warming will continue beyond 2100 under all RCP scenarios except RCP2.6. Surface temperatures will remain approximately constant at elevated levels for many centuries after a complete cessation of net anthropogenic COemissions (see Section 2.2.5 for the relationship between COemissions and global temperature change.). A large fraction of anthropogenic climate change resulting from COemissions is irreversible on a multi-century to millennial timescale, except in the case of a large net removal of CO2 from the atmosphere over a sustained period (Figure 2.8a, b). {WGI SPM E.1, SPM E.8, 12.5.2}

Stabilization of global average surface temperature does not imply stabilization for all aspects of the climate system. Shifting biomes, re-equilibrating soil carbon, ice sheets, ocean temperatures and associated sea level rise all have their own intrinsic long timescales that will result in ongoing changes for hundreds to thousands of years after global surface temperature has been stabilized. {WGI SPM E.8, 12.5.2-12.5.4, WGII 4.2}

Ocean acidification will continue for centuries if CO2 emissions continue, it will strongly affect marine ecosystems (high confidence), and the impact will be exacerbated by rising temperature extremes (Figure 2.5b). {WGI 3.8.2, 6.4.4, WGII SPM B-26.3.2, 6.3.5, 30.5, Box CC-OA}

Global mean sea level rise will continue for many centuries beyond 2100 (virtually certain). The few available analyses that go beyond 2100 indicate sea level rise to be less than 1 m above the pre-industrial level by 2300 for GHG concentrations that peak and decline and remain below 500 ppm CO2-eq, as in scenario RCP2.6. For a radiative forcing that corresponds to a CO2-eq concentration in 2100 that is above 700 ppm but below 1500 ppm, as in scenario RCP8.5, the projected rise is 1 m to more than 3 m by 2300 (medium confidence) (Figure 2.8c). There is low confidence in the available models’ ability to project solid ice discharge from the Antarctic ice sheet. Hence, these models likely underestimate the Antarctica ice sheet contribution, resulting in an underestimation of projected sea level rise beyond 2100. {WGI SPM E.8, 13.4.4, 13.5.4}

There is little evidence in global climate models of a tipping point or critical threshold in the transition from a perennially ice-covered to a seasonally ice-free Arctic Ocean, beyond which further sea-ice loss is unstoppable and irreversible. {WGI 12.5.5}

There is low confidence in assessing the evolution of the Atlantic Meridional Overturning Circulation beyond the 21st century because of the limited number of analyses and equivocal results. However, a collapse beyond the 21st century for large sustained warming cannot be excluded. {WGI SPM E.4, 12.4.7, 12.5.5}

Figure 2.8

Edit

Figure 2.8 | (a) Atmospheric carbon dioxide (CO2) and (b) projected global mean surface temperature change as simulated by Earth System Models of Intermediate Complexity (EMICs) for the four Representative Concentration Pathways (RCPs) up to 2300 (relative to 1986–2005) followed by a constant (year 2300 level) radiative forcing. A 10-year smoothing was applied. The dashed line on (a) indicates the pre-industrial CO2 concentration. (c) Sea level change projections grouped into three categories according to the concentration of greenhouse gas (in CO2-eq) in 2100 (low: concentrations that peak and decline and remain below 500 ppm, as in scenario RCP2.6; medium: 500 to 700 ppm, including RCP4.5; high: concentrations that are above 700 ppm but below 1500 ppm, as in scenario RCP6.0 and RCP8.5). The bars in (c) show the maximum possible spread that can be obtained with the few available model results (and should not be interpreted as uncertainty ranges). These models likely underestimate the Antarctica ice sheet contribution, resulting in an underestimation of projected sea level rise beyond 2100. {WGI Figure 12.43, Figure 13.13, Table 13.8, WGII SPM B-2}

Sustained mass loss by ice sheets would cause larger sea level rise, and part of the mass loss might be irreversible. There is high confidence that sustained global mean warming greater than a threshold would lead to the near-complete loss of the Greenland ice sheet over a millennium or more, causing a sea level rise of up to 7 m. Current estimates indicate that the threshold is greater than about 1°C (low confidence) but less than about 4°C (medium confidence) of global warming with respect to pre-industrial temperatures. Abrupt and irreversible ice loss from a potential instability of marine-based sectors of the Antarctic ice sheet in response to climate forcing is possible, but current evidence and understanding is insufficient to make a quantitative assessment. {WGI SPM E.8, WGI 5.6.2, 5.8.1, 13.4.3, 13.5.4}

Within the 21st century, magnitudes and rates of climate change associated with medium to high emission scenarios (RCP4.5, RCP6.0 and RCP8.5) pose a high risk of abrupt and irreversible regional-scale change in the composition, structure and function of marine, terrestrial and freshwater ecosystems, including wetlands (medium confidence), as well as warm water coral reefs (high confidence). Examples that could substantially amplify climate change are the boreal-tundra Arctic system (medium confidence) and the Amazon forest (low confidence). {WGII 4.3.3.1, Box 4.3, Box 4.4, 5.4.2.46.3.1-6.3.4, 6.4.2, 30.5.3-30.5.6, Box CC-CR, Box CC-MB}

A reduction in permafrost extent is virtually certain with continued rise in global temperatures. Current permafrost areas are projected to become a net emitter of carbon (CO2 and CH4) with a loss of 180 to 920 GtCO2 (50 to 250 GtC) under RCP8.5 over the 21st century (low confidence). {WGI TFE.5, 6.4.3.4, 12.5.5, WGII 4.3.3.4}

Edit

Footnotes

  1. Roughly 300 baseline scenarios and 900 mitigation scenarios are categorized by CO2-equivalent concentration (CO2-eq) by 2100. The CO2-eq includes the forcing due to all GHGs (including halogenated gases and tropospheric ozone), aerosols and albedo change (see Glossary)
  2. Net negative emissions can be achieved when more GHGs are sequestered than are released into the atmosphere (e.g., by using bio-energy in combination with carbon dioxide capture and storage)
  3. Climatological mean state and the 1979–2012 trend in Arctic sea-ice extent.
  4. When sea-ice extent is less than one million km2 for at least five consequtive years.
  5. Defined as the equilibrium global average surface warming following a doubling of CO2 concentration (relative to pre-industrial).
]t

The IPCC is experimenting with ways to make its reports more accessible to the public and easier to navigate for different stakeholder groups. We are pleased to release this beta version of a website to present the Synthesis Report. Among other things this site makes it easy to navigate between the Synthesis Report and the underlying Working Group contributions.

Users who wish to view the original versions of the reports in their official layout, with the full high-resolution graphics, are encouraged to go to ipcc.ch/report/ar5/ or the the Working Group microsites: Working Group I, Working Group II, and Working Group III.

As this is a beta version, users are encouraged to inform the IPCC of any errors on this site in representing the official versions of the reports. Please write to ipcc-sec@wmo.int.

Referencing this report

IPCC, 2014: Climate Change 2014: Synthesis Report. Contribution of Working Groups I, II and III to the Fifth Assessment Report of the Intergovernmental Panel o Climate Change [Core Writing Team, R.K. Pachauri and L.A. Meyer (eds.)]. IPCC, Geneva, Switzerland, 151 pp. in IPCC AR5 Synthesis Report website

Disclaimer

Unless otherwise stated, the information available on this website, including text, logos, graphics, maps, images, and electronic downloads is the property of the Intergovernmental Panel on Climate Change (IPCC) and is protected by intellectual property laws.

You may freely download and copy the material contained on this website for your personal, non-commercial use, provided that the original source is properly acknowledged, without any right to resell, redistribute, compile or create derivative works therefrom.

The designations employed and the presentation of material on maps do not imply the expression of any opinion whatsoever on the part of the IPCC concerning the legal status of any country, territory, city or area or of its authorities, or concerning the delimitation of its frontiers or boundaries.

Close