
35
TS
Technical Summary
Prepared under the leadership of the Working Group II Bureau:
Amjad Abdulla (Maldives), Vicente R. Barros (Argentina), Eduardo Calvo (Peru), Christopher B. Field (USA), José M. Moreno
(Spain), Nirivololona Raholijao (Madagascar), Sergey Semenov (Russian Federation), Neville Smith (Australia)
Coordinating Lead Authors:
Christopher B. Field (USA), Vicente R. Barros (Argentina), Katharine J. Mach (USA),
Michael D. Mastrandrea (USA)
Lead Authors:
Maarten K. van Aalst (Netherlands), W. Neil Adger (UK), Douglas J. Arent (USA), Jonathon Barnett
(Australia), Richard A. Betts (UK), T. Eren Bilir (USA), Joern Birkmann (Germany), JoAnn Carmin
(USA), Dave D. Chadee (Trinidad and Tobago), Andrew J. Challinor (UK), Monalisa Chatterjee
(USA/India), Wolfgang Cramer (Germany/France), Debra J. Davidson (Canada), Yuka Otsuki Estrada
(USA/Japan), Jean-Pierre Gattuso (France), Yasuaki Hijioka (Japan), Ove Hoegh-Guldberg (Australia),
He-Qing Huang (China), Gregory E. Insarov (Russian Federation), Roger N. Jones (Australia),
R. Sari Kovats (UK), Joan Nymand Larsen (Iceland), Iñigo J. Losada (Spain), José A. Marengo
(Brazil), Roger F. McLean (Australia), Linda O. Mearns (USA), Reinhard Mechler (Germany/Austria),
John F. Morton (UK), Isabelle Niang (Senegal), Taikan Oki (Japan), Jane Mukarugwiza Olwoch
(South Africa), Maggie Opondo (Kenya), Elvira S. Poloczanska (Australia), Hans-O. Pörtner
(Germany), Margaret Hiza Redsteer (USA), Andy Reisinger (New Zealand), Aromar Revi (India),
Patricia Romero-Lankao (Mexico), Daniela N. Schmidt (UK), M. Rebecca Shaw (USA), William Solecki
(USA), Dáithí A. Stone (Canada/South Africa/USA), John M.R. Stone (Canada), Kenneth M. Strzepek
(UNU/USA), Avelino G. Suarez (Cuba), Petra Tschakert (USA), Riccardo Valentini (Italy),
Sebastián Vicuña (Chile), Alicia Villamizar (Venezuela), Katharine E. Vincent (South Africa),
Rachel Warren (UK), Leslie L. White (USA), Thomas J. Wilbanks (USA), Poh Poh Wong (Singapore),
Gary W. Yohe (USA)
Review Editors:
Paulina Aldunce (Chile), Jean Pierre Ometto (Brazil), Nirivololona Raholijao (Madagascar),
Kazuya Yasuhara (Japan)
This Technical Summary should be cited as:
Field
, C.B., V.R. Barros, K.J. Mach, M.D. Mastrandrea, M. van Aalst, W.N. Adger, D.J. Arent, J. Barnett, R. Betts,
T.E. Bilir, J. Birkmann, J. Carmin, D.D. Chadee, A.J. Challinor, M. Chatterjee, W. Cramer, D.J. Davidson, Y.O. Estrada,
J.-P. Gattuso, Y. Hijioka, O. Hoegh-Guldberg, H.Q. Huang, G.E. Insarov, R.N. Jones, R.S. Kovats, P. Romero-Lankao,
J.N. Larsen, I.J. Losada, J.A. Marengo, R.F. McLean, L.O. Mearns, R. Mechler, J.F. Morton, I. Niang, T. Oki, J.M. Olwoch,
M. Opondo, E.S. Poloczanska, H.-O. Pörtner, M.H. Redsteer, A. Reisinger, A. Revi, D.N. Schmidt, M.R. Shaw,
W. Solecki, D.A. Stone, J.M.R. Stone, K.M. Strzepek, A.G. Suarez, P. Tschakert, R. Valentini, S. Vicuña, A. Villamizar,
K.E. Vincent, R. Warren, L.L. White, T.J. Wilbanks, P.P. Wong, and G.W. Yohe, 2014: Technical summary. In: Climate
Change 2014: Impacts, Adaptation, and Vulnerability. Part A: Global and Sectoral Aspects. Contribution of Working
Group II to the Fifth Assessment Report of the Intergovernmental Panel on Climate Change [Field, C.B., V.R. Barros,
D.J. Dokken, K.J. Mach, M.D. Mastrandrea, T.E. Bilir, M. Chatterjee, K.L. Ebi, Y.O. Estrada, R.C. Genova, B. Girma,
E.S. Kissel, A.N. Levy, S. MacCracken, P.R. Mastrandrea, and L.L. White (eds.)]. Cambridge University Press,
Cambridge, United Kingdom and New York, NY, USA, pp. 35-94.

Contents
36
Technical Summary
Assessing and Managing the Risks of Climate Change ...................................................................................................... 37
Box TS.1. Context for the Assessment ............................................................................................................................................................. 38
Box TS.2. Terms Central for Understanding the Summary ................................................................................................................................ 39
Box TS.3. Communication of the Degree of Certainty in Assessment Findings ................................................................................................ 41
A: Observed Impacts, Vulnerability, and Adaptation in a Complex and Changing World ............................................. 37
A-1. Observed Impacts, Vulnerability, and Exposure ........................................................................................................................................ 40
Box TS.4. Multidimensional Inequality and Vulnerability to Climate Change ................................................................................................... 50
A-2. Adaptation Experience ............................................................................................................................................................................. 51
A-3. The Decision-making Context .................................................................................................................................................................. 54
B: Future Risks and Opportunities for Adaptation ........................................................................................................ 59
B-1. Key Risks across Sectors and Regions ...................................................................................................................................................... 59
Box TS.5. Human Interference with the Climate System .................................................................................................................................. 61
Box TS.6. Consequences of Large Temperature Increase .................................................................................................................................. 63
B-2. Sectoral Risks and Potential for Adaptation ............................................................................................................................................. 62
Box TS.7. Ocean Acidification .......................................................................................................................................................................... 74
B-3. Regional Risks and Potential for Adaptation ............................................................................................................................................ 75
C: Managing Future Risks and Building Resilience ....................................................................................................... 85
C-1. Principles for Effective Adaptation ........................................................................................................................................................... 85
C-2. Climate-resilient Pathways and Transformation ....................................................................................................................................... 87
Box TS.8. Adaptation Limits and Transformation ............................................................................................................................................. 89
Box TS.9. The Water–Energy–Food Nexus ........................................................................................................................................................ 92
Working Group II Frequently Asked Questions ......................................................................................................... 93

37
Technical Summary
TS
ASSESSING AND MANAGING THE RISKS
OF CLIMATE CHANGE
Human interference with the climate system is occurring (WGI AR5 SPM
S
ection D.3; WGI AR5 Sections 2.2, 6.3, 10.3 to 10.6, 10.9). Climate
change poses risks for human and natural systems (Figure TS.1). The
assessment of impacts, adaptation, and vulnerability in the Working
Group II contribution to the IPCC’s Fifth Assessment Report (WGII AR5)
evaluates how patterns of risks and potential benefits are shifting due
to climate change. It considers how impacts and risks related to climate
change can be reduced and managed through adaptation and mitigation.
The report assesses needs, options, opportunities, constraints, resilience,
limits, and other aspects associated with adaptation. It recognizes that
risks of climate change will vary across regions and populations, through
space and time, dependent on myriad factors including the extent of
adaptation and mitigation.
Climate change involves complex interactions and changing likelihoods
of diverse impacts. A focus on risk, which is new in this report, supports
decision making in the context of climate change and complements
other elements of the report. People and societies may perceive or rank
risks and potential benefits differently, given diverse values and goals.
Compared to past WGII reports, the WGII AR5 assesses a substantially
larger knowledge base of relevant scientific, technical, and socioeconomic
l
iterature. Increased literature has facilitated comprehensive assessment
across a broader set of topics and sectors, with expanded coverage of
human systems, adaptation, and the ocean. See Box TS.1.
Section A of this summary characterizes observed impacts, vulnerability
and exposure, and adaptive responses to date. Section B examines future
risks and potential benefits across sectors and regions, highlighting where
choices matter for reducing risks through mitigation and adaptation.
Section C considers principles for effective adaptation and the broader
interactions among adaptation, mitigation, and sustainable development.
Box TS.2 defines central concepts. To convey the degree of certainty in key
findings, the report relies on the consistent use of calibrated uncertainty
language, introduced in Box TS.3. Chapter references in brackets indicate
support for findings, figures, and tables in this summary.
A: OBSERVED IMPACTS, VULNERABILITY,
AND ADAPTATION IN A COMPLEX
AND CHANGING WORLD
This section presents observed effects of climate change, building from
understanding of vulnerability, exposure, and climate-related hazards
as determinants of impacts. The section considers the factors, including
development and non-climatic stressors, that influence vulnerability and
EMISSIONS
and Land-use Change
Vulnerability
Exposure
RISK
Hazards
Anthropogenic
Climate Change
Socioeconomic
Pathways
Adaptation and
Mitigation
Actions
Governance
IMPACTS
Natural
Variability
SOCIOECONOMIC
PROCESSES
CLIMATE
R
Figure TS.1 | Illustration of the core concepts of the WGII AR5. Risk of climate-related impacts results from the interaction of climate-related hazards (including hazardous events
and trends) with the vulnerability and exposure of human and natural systems. Changes in both the climate system (left) and socioeconomic processes including adaptation and
mitigation (right) are drivers of hazards, exposure, and vulnerability. [19.2, Figure 19-1]
38
Technical Summary
TS
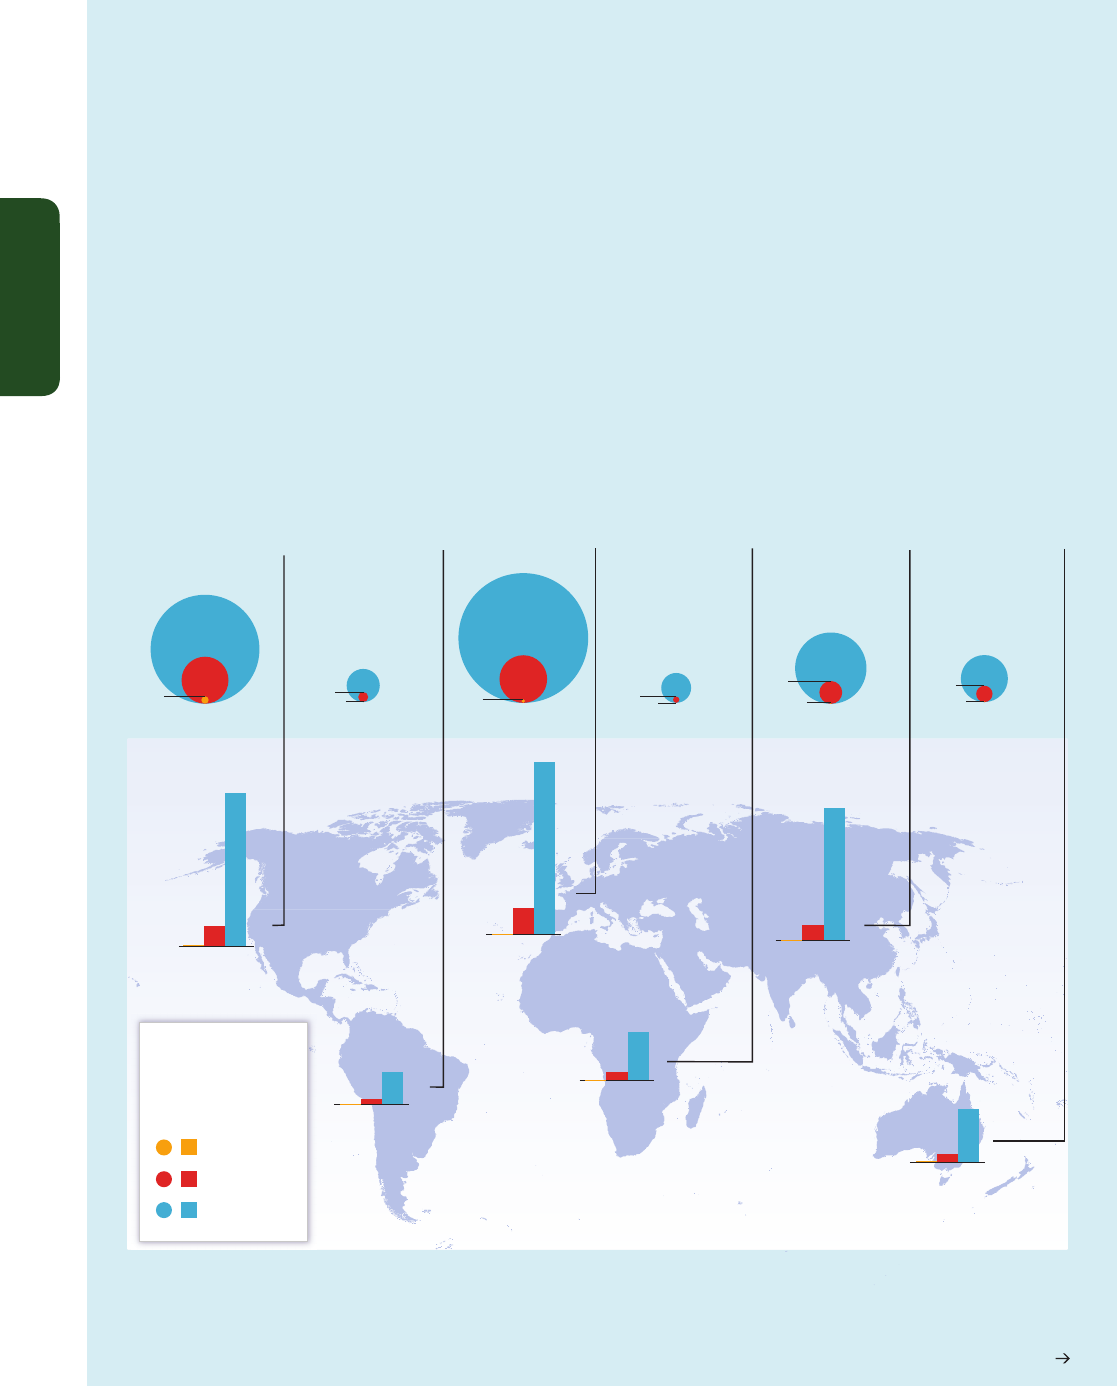
Box TS.1 | Context for the Assessment
For the past 2 decades, IPCC’s Working Group II has developed assessments of climate change impacts, adaptation, and vulnerability.
The WGII AR5 builds from the WGII contribution to the IPCC’s Fourth Assessment Report (WGII AR4), published in 2007, and the
Special Report on Managing the Risks of Extreme Events and Disasters to Advance Climate Change Adaptation (SREX), published in
2012. It follows the Working Group I contribution to the AR5 (WGI AR5). The WGII AR5 is presented in two parts (Part A: Global and
Sectoral Aspects, and Part B: Regional Aspects), reflecting the expanded literature basis and multidisciplinary approach, increased
focus on societal impacts and responses, and continued regionally comprehensive coverage. [1.1 to 1.3]
The number of scientific publications available for assessing climate change impacts, adaptation, and vulnerability more
than doubled between 2005 and 2010, with especially rapid increases in publications related to adaptation, allowing
for a more robust assessment that supports policymaking (high confidence).
The diversity of the topics and regions covered has
similarly expanded, as has the geographic distribution of authors contributing to the knowledge base for climate change assessments
(Box TS.1 Figure 1). Authorship of climate change publications from developing countries has increased, although it still represents a
small fraction of the total. The unequal distribution of publications presents a challenge to the production of a comprehensive and
balanced global assessment. [1.1, Figure 1-1]
Continued next page
(b) Climate change literature by region(b) Climate change literature by region
Total : 76,173
Total : 6459 Total : 5324 Total : 30,302
Total : 13,394Total : 103,171
58
9329
1228
6
1987
315
42
3255
446
34
10,544
1595
44
2982
536
33
8101
940
1981–1990
1991–2000
2001–2010
290
63,985
11,898
71
9
0,844
12,256
4815
509
9
27,472
2821
7
11,944
1443
2
5915
542
EUROPE ASIA AUSTRALASIAAFRICANORTH AMERICA SOUTH AMERICA
(A) Author affiliation
Number of climate change
publications (A) by country
affiliation of authors and
(B) by region
Publication period
(B) Climate change literature by region
0
Box TS.1 Figure 1 | Number of climate change publications listed in the Scopus bibliographic database. (A) Number of climate change publications in English (as of July 2011)
summed by country affiliation of all authors of the publications and sorted by region. Each publication can be counted multiple times (i.e., the number of different countries in the
author affiliation list). (B) Number of climate change publications in English with individual countries mentioned in title, abstract, or key words (as of July 2011) sorted by region for
the decades 1981–1990, 1991–2000, and 2001–2010. Each publication can be counted multiple times if more than one country is listed. [Figure 1-1]

39
Technical Summary
TS
Box TS.1 (continued)
Adaptation has emerged as a central area in climate change research, in country-level planning, and in implementation
of climate change strategies (high confidence). The body of literature, including government and private sector reports, shows
an increased focus on adaptation opportunities and the interrelations between adaptation, mitigation, and alternative sustainable
pathways. The literature shows an emergence of studies on transformative processes that take advantage of synergies between
adaptation planning, development strategies, social protection, and disaster risk reduction and management. [1.1]
As a core feature and innovation of IPCC assessment, major findings are presented with defined, calibrated language
that communicates the strength of scientific understanding, including uncertainties and areas of disagreement (Box
TS.3).
Each finding is supported by a traceable account of the evaluation of evidence and agreement. [1.1, Box 1-1]
Box TS.2 | Terms Central for Understanding the Summary
Central concepts defined in the WGII AR5 glossary and used throughout the report include the following terms. Reflecting progress in
science, some definitions differ in breadth and focus from the definitions used in the AR4 and other IPCC reports.
Climate change: Climate change refers to a change in the state of the climate that can be identified (e.g., by using statistical tests)
by changes in the mean and/or the variability of its properties, and that persists for an extended period, typically decades or longer.
Climate change may be due to natural internal processes or external forcings such as modulations of the solar cycles, volcanic
eruptions, and persistent anthropogenic changes in the composition of the atmosphere or in land use. Note that the Framework
Convention on Climate Change (UNFCCC), in its Article 1, defines climate change as: “a change of climate which is attributed directly
or indirectly to human activity that alters the composition of the global atmosphere and which is in addition to natural climate
variability observed over comparable time periods.” The UNFCCC thus makes a distinction between climate change attributable to
human activities altering the atmospheric composition, and climate variability attributable to natural causes.
Hazard: The potential occurrence of a natural or human-induced physical event or trend or physical impact that may cause loss of
life, injury, or other health impacts, as well as damage and loss to property, infrastructure, livelihoods, service provision, ecosystems,
and environmental resources. In this report, the term hazard usually refers to climate-related physical events or trends or their physical
impacts.
Exposure: The presence of people, livelihoods, species or ecosystems, environmental functions, services, and resources, infrastructure,
or economic, social, or cultural assets in places and settings that could be adversely affected.
Vulnerability: The propensity or predisposition to be adversely affected. Vulnerability encompasses a variety of concepts including
sensitivity or susceptibility to harm and lack of capacity to cope and adapt.
Impacts: Effects on natural and human systems. In this report, the term impacts is used primarily to refer to the effects on natural
and human systems of extreme weather and climate events and of climate change. Impacts generally refer to effects on lives,
livelihoods, health, ecosystems, economies, societies, cultures, services, and infrastructure due to the interaction of climate changes or
hazardous climate events occurring within a specific time period and the vulnerability of an exposed society or system. Impacts are
also referred to as consequences and outcomes. The impacts of climate change on geophysical systems, including floods, droughts,
and sea level rise, are a subset of impacts called physical impacts.
Continued next page

40
Technical Summary
TS
exposure, evaluating the sensitivity of systems to climate change. The
section also identifies challenges and options based on adaptation
experience, looking at what has motivated previous adaptation actions
in the context of climate change and broader objectives. It examines
current understanding of decision making as relevant to climate
change.
A-1. Observed Impacts, Vulnerability, and Exposure
In recent decades, changes in climate have caused impacts on
natural and human systems on all continents and across the
oceans.
This conclusion is strengthened by more numerous and
improved observations and analyses since the AR4. Evidence of climate-
change impacts is strongest and most comprehensive for natural
systems. Some impacts on human systems have also been attributed to
climate change, with a major or minor contribution of climate change
distinguishable from other influences such as changing social and
economic factors. In many regions, impacts on natural and human
systems are now detected even in the presence of strong confounding
factors such as pollution or land use change. See Figure TS.2 and
Table TS.1 for a summary of observed impacts, illustrating broader
trends presented in this section. Attribution of observed impacts in the
WGII AR5 generally links responses of natural and human systems to
observed climate change, regardless of its cause. Most reported
impacts of climate change are attributed to warming and/or to shifts in
precipitation patterns. There is also emerging evidence of impacts of
ocean acidification. Relatively few robust attribution studies and meta-
analyses have linked impacts in physical and biological systems to
anthropogenic climate change. [18.1, 18.3 to 18.6]
Differences in vulnerability and exposure arise from non-climatic
factors and from multidimensional inequalities often produced
by uneven development processes (very high confidence). These
differences shape differential risks from climate change.
See
Figure TS.1 and Box TS.4. Vulnerability and exposure vary over time and
across geographic contexts. Changes in poverty or socioeconomic
status, ethnic composition, age structure, and governance have had a
significant influence on the outcome of past crises associated with
climate-related hazards. [8.2, 9.3, 12.2, 13.1, 13.2, 14.1 to 14.3, 19.2,
19.6, 26.8, Box CC-GC]
Impacts from recent climate-related extremes, such as heat
waves, droughts, floods, cyclones, and wildfires, reveal significant
vulnerability and exposure of some ecosystems and many human
systems to current climate variability (very high confidence).
Impacts of such climate-related extremes include alteration of ecosystems,
disruption of food production and water supply, damage to infrastructure
and settlements, morbidity and mortality, and consequences for mental
health and human well-being. For countries at all levels of development,
these impacts are consistent with a significant lack of preparedness
for current climate variability in some sectors. The following examples
Box TS.2 (continued)
Risk: The potential for consequences where something of value is at stake and where the outcome is uncertain, recognizing the
diversity of values. Risk is often represented as probability of occurrence of hazardous events or trends multiplied by the impacts if
these events or trends occur. Risk results from the interaction of vulnerability, exposure, and hazard (see Figure TS.1). In this report,
the term risk is used primarily to refer to the risks of climate-change impacts.
Adaptation: The process of adjustment to actual or expected climate and its effects. In human systems, adaptation seeks to moderate
or avoid harm or exploit beneficial opportunities. In some natural systems, human intervention may facilitate adjustment to expected
climate and its effects.
Incremental adaptation: Adaptation actions where the central aim is to maintain the essence and integrity of a system or
process at a given scale.
Transformational adaptation: Adaptation that changes the fundamental attributes of a system in response to climate and
its effects.
Transformation: A change in the fundamental attributes of natural and human systems.
Resilience: The capacity of social, economic, and environmental systems to cope with a hazardous event or trend or disturbance,
responding or reorganizing in ways that maintain their essential function, identity, and structure, while also maintaining the capacity
for adaptation, learning, and transformation.

41
Technical Summary
TS
Box TS.3 | Communication of the Degree of Certainty in Assessment Findings
Based on the Guidance Note for Lead Authors of the IPCC Fifth Assessment Report on Consistent Treatment of Uncertainties, the
WGII AR5 relies on two metrics for communicating the degree of certainty in key findings:
• Confidence in the validity of a finding, based on the type, amount, quality, and consistency of evidence (e.g., data, mechanistic
understanding, theory, models, expert judgment) and the degree of agreement. Confidence is expressed qualitatively.
• Quantified measures of uncertainty in a finding expressed probabilistically (based on statistical analysis of observations or
model results, or both, and expert judgment).
Each finding has its foundation in evaluation of associated
evidence and agreement. The summary terms to describe
evidence are: limited, medium, or robust; and agreement:
low, medium, or high. These terms are presented with some
key findings. In many cases, assessment authors in addition
evaluate their confidence about the validity of a finding,
providing a synthesis of the evaluation of evidence and
agreement. Levels of confidence include five qualifiers:
very low, low, medium, high, and very high. Box TS.3 Figure 1
illustrates the flexible relationship between the summary
terms for evidence and agreement and the confidence metric.
For a given evidence and agreement statement, different
confidence levels could be assigned, but increasing levels of
evidence and degrees of agreement are correlated with increasing confidence.
When assessment authors evaluate the likelihood, or probability, of some well-defined outcome having occurred or occurring in the future,
a finding can include likelihood terms (see below) or a more precise presentation of probability. Use of likelihood is not an alternative
to use of confidence. Unless otherwise indicated, findings assigned a likelihood term are associated with high or very high confidence.
Term Likelihood of the outcome
Virtually certain 99–100% probability
Extremely likely 95–100% probability
Very likely 90–100% probability
Likely 66–100% probability
More likely than not >50–100% probability
About as likely as not 33–66% probability
Unlikely 0–33% probability
Very unlikely 0–10% probability
Extremely unlikely 0–5% probability
Exceptionally unlikely 0–1% probability
Where appropriate, findings are also formulated as statements of fact without using uncertainty qualifiers.
Within paragraphs of this summary, the confidence, evidence, and agreement terms given for a key finding apply to subsequent
statements in the paragraph, unless additional terms are provided.
[1.1, Box 1-1]
High agreement
Limited evidence
High agreement
Medium evidence
High agreement
Robust evidence
Medium agreement
Robust evidence
Medium agreement
Medium evidence
Medium agreement
Limited evidence
Low agreement
Limited evidence
Low agreement
Medium evidence
Low agreement
Robust evidence
Evidence (type, amount, quality, consistency)
Agreement
Confidence
Scale
Box TS.3 Figure 1 | Evidence and agreement statements and their relationship to
confidence. The shading increasing toward the top right corner indicates increasing
confidence. Generally, evidence is most robust when there are multiple, consistent
independent lines of high-quality evidence. [Figure 1-3]
42
Technical Summary
TS
i
llustrate impacts of extreme weather and climate events experienced
across regional contexts:
• In Africa, extreme weather and climate events including droughts
and floods have significant impacts on economic sectors, natural
resources, ecosystems, livelihoods, and human health. The floods of
the Zambezi River in Mozambique in 2008, for example, displaced
90,000 people, and along the Zambezi River Valley, with
approximately 1 million people living in the flood-affected areas,
temporary displacement is taking on permanent characteristics.
[22.3, 22.4, 22.6]
• Recent floods in Australia and New Zealand caused severe damage
to infrastructure and settlements and 35 deaths in Queensland
alone (2011). The Victorian heat wave (2009) increased heat-related
morbidity and was associated with more than 300 excess deaths,
while intense bushfires destroyed more than 2000 buildings and
led to 173 deaths. Widespread drought in southeast Australia
(1997–2009) and many parts of New Zealand (2007–2009;
2012–2013) resulted in economic losses (e.g., regional GDP in the
southern Murray-Darling Basin was below forecast by about
5.7% in 2007–2008, and New Zealand lost about NZ$3.6 billion in
d
irect and off-farm output in 2007–2009). [13.2, 25.6, 25.8, Table
25-1, Boxes 25-5, 25-6, and 25-8]
• In Europe, extreme weather events currently have significant impacts
in multiple economic sectors as well as adverse social and health
effects (high confidence). [Table 23-1]
• In North America, most economic sectors and human systems have
been affected by and have responded to extreme weather, including
hurricanes, flooding, and intense rainfall (high confidence). Extreme
heat events currently result in increases in mortality and morbidity
(very high confidence), with impacts that vary by age, location, and
socioeconomic factors (high confidence).Extreme coastal storm
events have caused excess mortality and morbidity, particularly
along the east coast of the United States, and the gulf coast of both
Mexico and the United States. Much North American infrastructure
is currently vulnerable to extreme weather events (medium
confidence), with deteriorating water-resource and transportation
infrastructure particularly vulnerable (high confidence). [26.6, 26.7,
Figure 26-2]
• In the Arctic, extreme weather events have had direct and indirect
adverse health effects for residents (high confidence). [28.2]
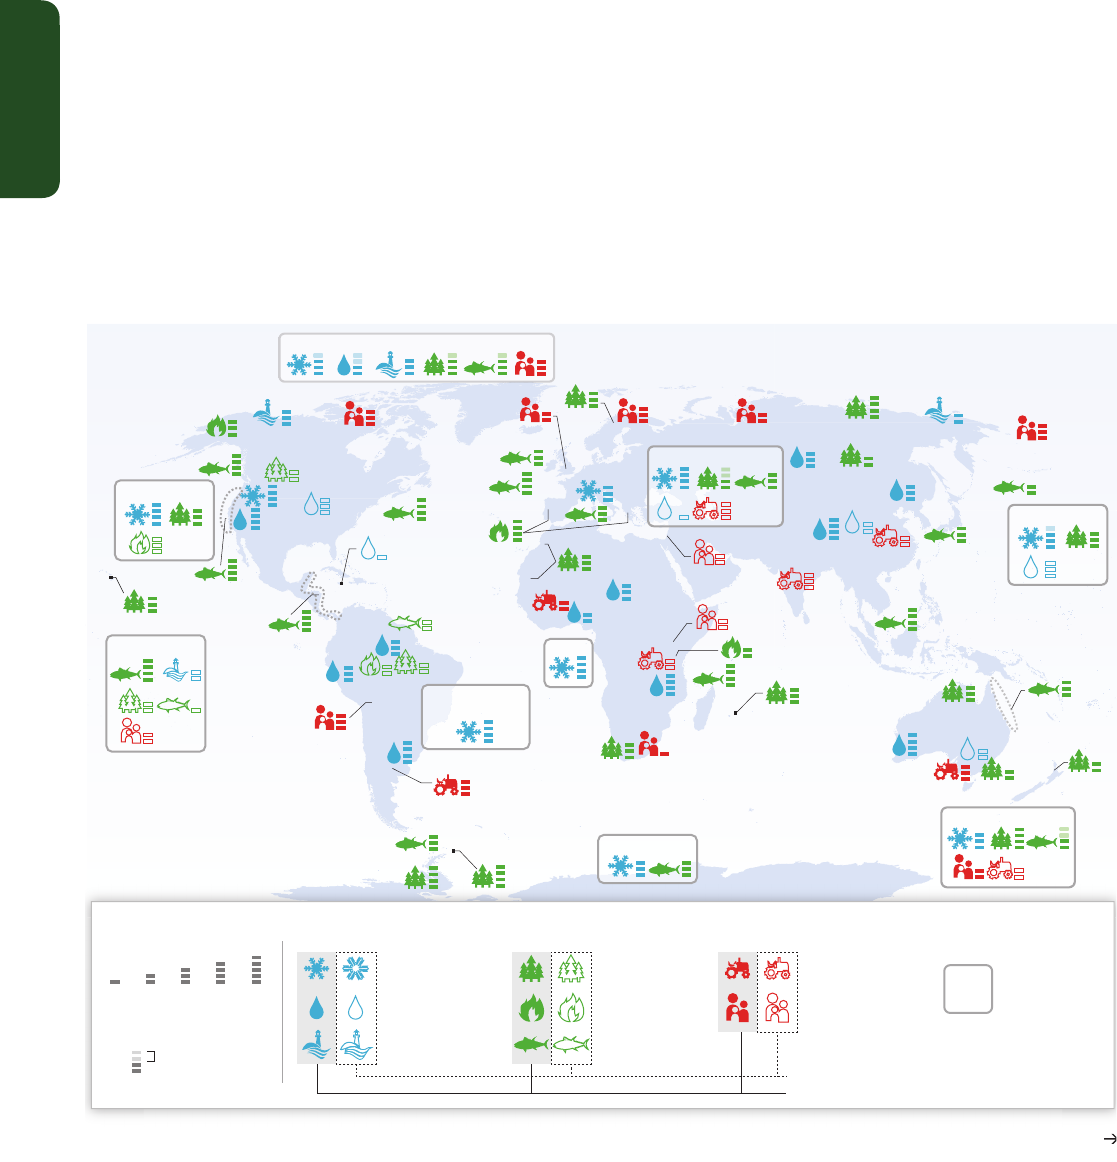
A
RCTIC
EUROPE
medlow
very
high
very
low
high
Glaciers, snow, ice,
and/or permafrost
indicates
confidence range
Rivers, lakes, floods,
and/or drought
Terrestrial ecosystems
Regional-scale
impacts
Marine ecosystems
Coastal erosion
and/or sea level effects
Wildfire
Livelihoods, health,
and/or economics
Food production
Physical systems Biological systems Human and managed systems
Filled symbols = Major contribution of climate change
Outlined symbols = Minor contribution of climate change
Confidence in attribution
to climate change
Observed impacts attributed to climate change for
SMALL ISLANDS
AUSTRALASIA
AFRICA
CENTRAL & SOUTH
AMERICA
NORTH AMERICA
ASIA
ANTARCTIC
(A)
Continued next page
Figure TS.2
43
Technical Summary
TS
0
19701960 1980 1990 2000 2010
–20
–16
–12
–8
–4
4
Glacier mass-budget rate (water-equivalent meters per decade)
Global average (excluding
Greenland, Antarctica)
Himalaya local measurements
Average of local
measurements
H
imalaya-wide measurement
Locations of substantial drought- and heat-induced tree mortality since 1970
A
reas with forest cover
Other areas with tree cover
Areas without tree cover
Distribution change (km per decade)
(90)
(20)
(46)
(29)
(9)
(3)
(13)
(29)
(9)
(111) (359)
CoolerWarmer
Benthic a
lga
e
Be
nthic
cnida
ria
ns
Be
nthic
m
ollusks
Bent
h
ic crustacea
Benthic invert. (other)
Phytoplankton
Zooplankton
Larval bony fishes
Non-bony fishes
B
ony
fi
shes
All t
a
x
a
75
th
percentile
90
th
percentile
10
th
percentile
Median
25
th
percentile
Standard error
Mean
Standard error
(E) (D)
(C)(B)
−6
−4
–2
0
2
0
20
400
100
–20
MaizeRiceSoyWheatTemperate
Region Crop type
Tropical
(12)(13)(10)(18)(27)(19)
Yield impact (% change per decade)
Figure TS.2 (continued)
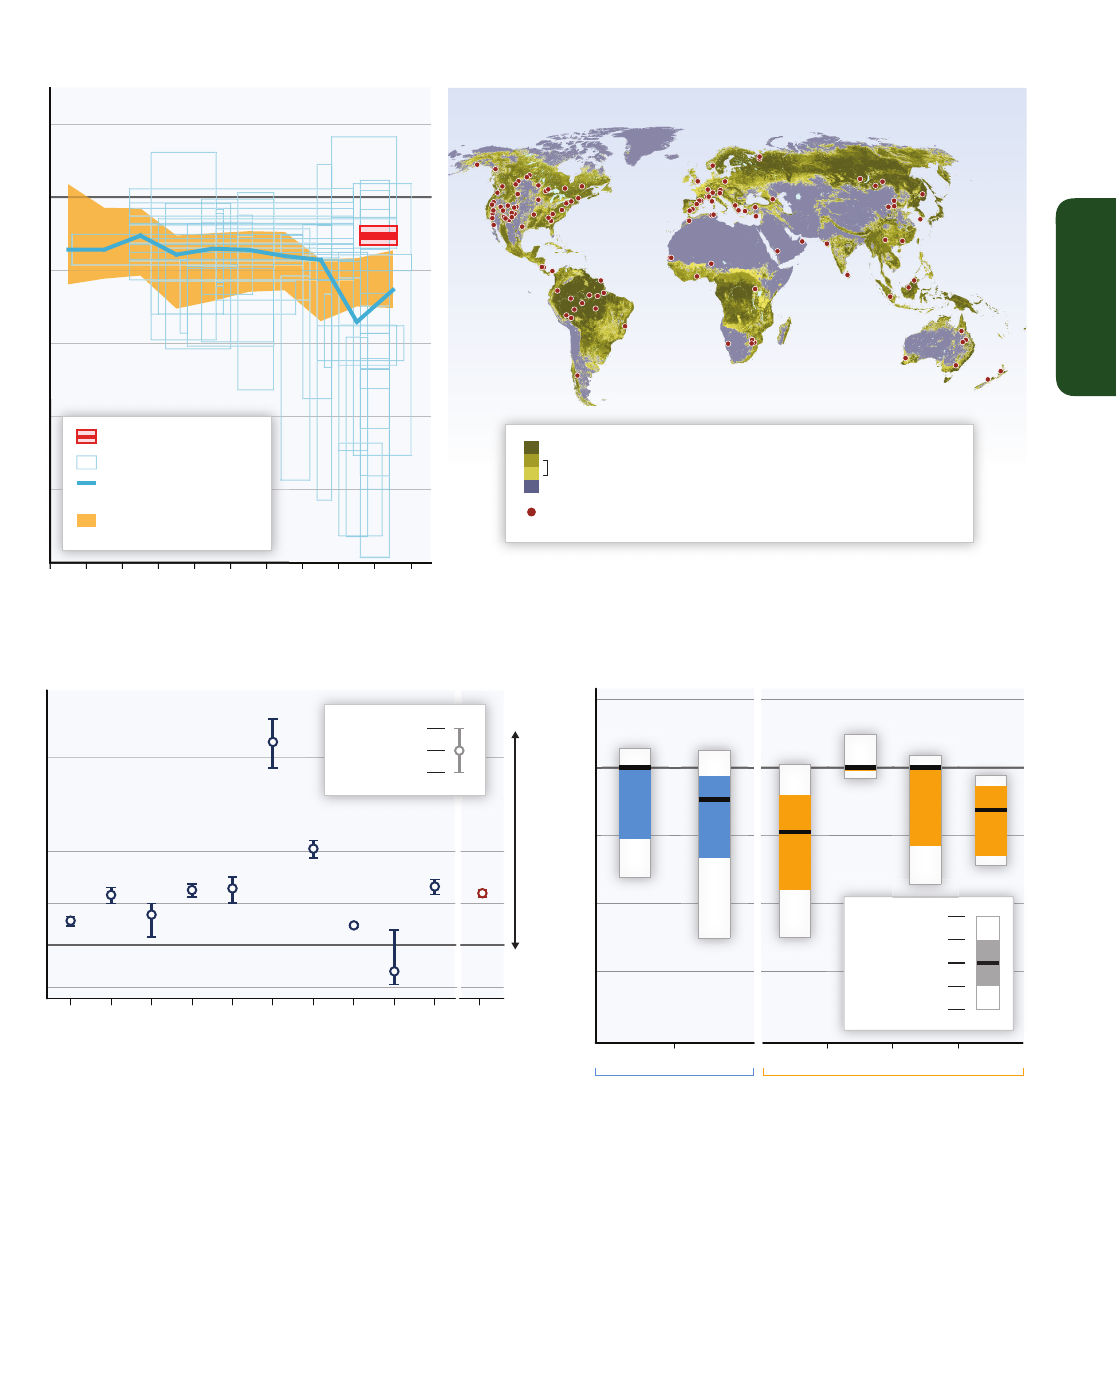
Figure TS.2 | Widespread impacts in a changing world. (A) Global patterns of impacts in recent decades attributed to climate change, based on studies since the AR4. Impacts
are shown at a range of geographic scales. Symbols indicate categories of attributed impacts, the relative contribution of climate change (major or minor) to the observed impact,
and confidence in attribution. See Table TS.1 for descriptions of the impacts. (B) Changes in glacier mass from all published measurements for Himalayan glaciers. Negative values
indicate loss of glacier mass. Local measurements are mostly for small, accessible Himalayan glaciers. The blue box for each local Himalaya measurement is centered vertically on
its average, and has a height of ±1 standard deviation for annual measurements and a height of ±1 standard error for multiannual measurements. Himalaya-wide measurement
(red) was made by satellite laser altimetry. For reference, global average glacier mass change estimates from WGI AR5 4.3 are also shown, with shading indicating ±1 standard
deviation. (C) Locations of substantial drought- and heat-induced tree mortality around the globe over 1970–2011. (D) Average rates of change in distribution (km per decade)
for marine taxonomic groups based on observations over 1900–2010. Positive distribution changes are consistent with warming (moving into previously cooler waters, generally
poleward). The number of responses analyzed is given within parentheses for each category. (E) Summary of estimated impacts of observed climate changes on yields over
1960–2013 for four major crops in temperate and tropical regions, with the number of data points analyzed given within parentheses for each category. [Figures 3-3, 4-7, 7-2,
18-3, and MB-2]

44
Technical Summary
TS
Freshwater Resources
In many regions, changing precipitation or melting snow and ice
are altering hydrological systems, affecting water resources in
terms of quantity and quality (medium confidence).
Glaciers
continue to shrink almost worldwide due to climate change (high
confidence) (e.g., Figure TS.2B), affecting runoff and water resources
downstream (medium confidence). Climate change is causing permafrost
warming and thawing in high-latitude regions and in high-elevation
regions (high confidence). There is no evidence that surface water and
groundwater drought frequency has changed over the last few decades,
although impacts of drought have increased mostly due to increased
water demand. [3.2, 4.3, 18.3, 18.5, 24.4, 25.5, 26.2, 28.2, Tables 3-1
and 25-1, Figures 18-2 and 26-1]
Terrestrial and Freshwater Ecosystems
Many terrestrial and freshwater plant and animal species have
shifted their geographic ranges and seasonal activities and
altered their abundance in response to observed climate change
over recent decades, and they are doing so now in many regions
(high confidence).
Increased tree mortality, observed in many places
worldwide, has been attributed to climate change in some regions
(Figure TS.2C). Increases in the frequency or intensity of ecosystem
disturbances such as droughts, wind storms, fires, and pest outbreaks
have been detected in many parts of the world and in some cases are
attributed to climate change (medium confidence). While recent climate
change contributed to the extinction of some species of Central American
amphibians (medium confidence), most recent observed terrestrial
Continued next page
Africa
Snow & Ice,
Rivers & Lakes,
Floods & Drought
•
R
etreat of tropical highland glaciers in East Africa ( high confi dence, major contribution from climate change)
• Reduced discharge in West African rivers ( low confi dence, major contribution from climate change)
•
L
ake surface warming and water column stratifi cation increases in the Great Lakes and Lake Kariba ( high confi dence, major contribution from climate change)
• Increased soil moisture drought in the Sahel since 1970, partially wetter conditions since 1990 ( medium confi dence, major contribution from climate change)
[22.2, 22.3, Tables 18-5, 18-6, and 22-3]
Terrestrial
Ecosystems
• Tree density decreases in western Sahel and semi-arid Morocco, beyond changes due to land use ( medium confi dence, major contribution from climate change)
• Range shifts of several southern plants and animals, beyond changes due to land use ( medium confi dence, major contribution from climate change)
• Increases in wildfi res on Mt. Kilimanjaro ( low confi dence, major contribution from climate change)
[22.3, Tables 18-7 and 22-3]
Coastal Erosion
& Marine
Ecosystems
• Decline in coral reefs in tropical African waters, beyond decline due to human impacts ( high confi dence, major contribution from climate change)
[Table 18-8]
Food Production
& Livelihoods
• Adaptive responses to changing rainfall by South African farmers, beyond changes due to economic conditions ( very low confi dence, major contribution from climate
change)
• Decline in fruit-bearing trees in Sahel ( low confi dence, major contribution from climate change)
• Malaria increases in Kenyan highlands, beyond changes due to vaccination, drug resistance, demography, and livelihoods ( low confi dence, minor contribution from
climate change)
• Reduced fi sheries productivity of Great Lakes and Lake Kariba, beyond changes due to fi sheries management and land use ( low confi dence, minor contribution from
climate change)
[7.2, 11.5, 13.2, 22.3, Table 18-9]
Europe
Snow & Ice,
Rivers & Lakes,
Floods & Drought
• Retreat of Alpine, Scandinavian, and Icelandic glaciers ( high confi dence, major contribution from climate change)
• Increase in rock slope failures in western Alps ( medium confi dence, major contribution from climate change)
• Changed occurrence of extreme river discharges and fl oods ( very low confi dence, minor contribution from climate change)
[18.3, 23.2, 23.3, Tables 18-5 and 18-6; WGI AR5 4.3]
Terrestrial
Ecosystems
• Earlier greening, leaf emergence, and fruiting in temperate and boreal trees ( high confi dence, major contribution from climate change)
• Increased colonization of alien plant species in Europe, beyond a baseline of some invasion ( medium confi dence, major contribution from climate change)
• Earlier arrival of migratory birds in Europe since 1970 ( medium confi dence, major contribution from climate change)
• Upward shift in tree-line in Europe, beyond changes due to land use ( low confi dence, major contribution from climate change)
• Increasing burnt forest areas during recent decades in Portugal and Greece, beyond some increase due to land use ( high confi dence, major contribution from climate
change)
[4.3, 18.3, Tables 18-7 and 23-6]
Coastal Erosion
& Marine
Ecosystems
• Northward distributional shifts of zooplankton, fi shes, seabirds, and benthic invertebrates in northeast Atlantic ( high confi dence, major contribution from climate
change)
• Northward and depth shift in distribution of many fi sh species across European seas ( medium confi dence, major contribution from climate change)
• Plankton phenology changes in northeast Atlantic ( medium confi dence, major contribution from climate change)
• Spread of warm water species into the Mediterranean, beyond changes due to invasive species and human impacts ( medium confi dence, major contribution from
climate change)
[6.3, 23.6, 30.5, Tables 6-2 and 18-8, Boxes 6-1 and CC-MB]
Food Production
& Livelihoods
• Shift from cold-related mortality to heat-related mortality in England and Wales, beyond changes due to exposure and health care ( low confi dence, major contribution
from climate change)
• Impacts on livelihoods of Sámi people in northern Europe, beyond effects of economic and sociopolitical changes ( medium confi dence, major contribution from
climate change)
• Stagnation of wheat yields in some countries in recent decades, despite improved technology ( medium confi dence, minor contribution from climate change)
• Positive yield impacts for some crops mainly in northern Europe, beyond increase due to improved technology ( medium confi dence, minor contribution from climate
change)
• Spread of bluetongue virus in sheep and of ticks across parts of Europe ( medium confi dence, minor contribution from climate change)
[18.4, 23.4, 23.5, Table 18-9, Figure 7-2]
Table TS.1 | Observed impacts attributed to climate change reported in the scientifi c literature since the AR4. These impacts have been attributed to climate change with very
low, low, medium, or high confi dence, with the relative contribution of climate change to the observed change indicated (major or minor), for natural and human systems across
eight major world regions over the past several decades. [Tables 18-5 to 18-9] Absence from the table of additional impacts attributed to climate change does not imply that
such impacts have not occurred.

45
Technical Summary
TS
Continued next page
Asia
Snow & Ice,
Rivers & Lakes,
Floods & Drought
• Permafrost degradation in Siberia, Central Asia, and Tibetan Plateau ( high confi dence, major contribution from climate change)
•
S
hrinking mountain glaciers across most of Asia ( medium confi dence, major contribution from climate change)
•
C
hanged water availability in many Chinese rivers, beyond changes due to land use ( low confi dence, minor contribution from climate change)
• Increased fl ow in several rivers due to shrinking glaciers ( high confi dence, major contribution from climate change)
•
E
arlier timing of maximum spring fl ood in Russian rivers ( medium confi dence, major contribution from climate change)
• Reduced soil moisture in north-central and northeast China (1950 – 2006) ( medium confi dence, major contribution from climate change)
•
S
urface water degradation in parts of Asia, beyond changes due to land use ( medium confi dence, minor contribution from climate change)
[24.3, 24.4, 28.2, Tables 18-5, 18-6, and SM24-4, Box 3-1; WGI AR5 4.3, 10.5]
Terrestrial
Ecosystems
•
C
hanges in plant phenology and growth in many parts of Asia (earlier greening), particularly in the north and east ( medium confi dence, major contribution from
climate change)
•
D
istribution shifts of many plant and animal species upwards in elevation or polewards, particularly in the north of Asia ( medium confi dence, major contribution from
c
limate change)
• Invasion of Siberian larch forests by pine and spruce during recent decades ( low confi dence, major contribution from climate change)
•
A
dvance of shrubs into the Siberian tundra ( high confi dence, major contribution from climate change)
[4.3, 24.4, 28.2, Table 18-7, Figure 4-4]
Coastal Erosion
& Marine
Ecosystems
•
D
ecline in coral reefs in tropical Asian waters, beyond decline due to human impacts ( high confi dence, major contribution from climate change)
• Northward range extension of corals in the East China Sea and western Pacifi c, and of a predatory fi sh in the Sea of Japan ( medium confi dence, major contribution
from climate change)
•
S
hift from sardines to anchovies in the western North Pacifi c, beyond fl uctuations due to fi sheries ( low confi dence, major contribution from climate change)
• Increased coastal erosion in Arctic Asia ( low confi dence, major contribution from climate change)
[
6.3, 24.4, 30.5, Tables 6-2 and 18-8]
Food Production
& Livelihoods
• Impacts on livelihoods of indigenous groups in Arctic Russia, beyond economic and sociopolitical changes ( low confi dence, major contribution from climate change)
•
N
egative impacts on aggregate wheat yields in South Asia, beyond increase due to improved technology ( medium confi dence, minor contribution from climate change)
• Negative impacts on aggregate wheat and maize yields in China, beyond increase due to improved technology ( low confi dence, minor contribution from climate change)
• Increases in a water-borne disease in Israel ( low confi dence, minor contribution from climate change)
[
7.2, 13.2, 18.4, 28.2, Tables 18-4 and 18-9, Figure 7-2]
Australasia
Snow & Ice,
Rivers & Lakes,
Floods & Drought
• Signifi cant decline in late-season snow depth at 3 of 4 alpine sites in Australia (1957– 2002) ( medium confi dence, major contribution from climate change)
• Substantial reduction in ice and glacier ice volume in New Zealand ( medium confi dence, major contribution from climate change)
• Intensifi cation of hydrological drought due to regional warming in southeast Australia ( low confi dence, minor contribution from climate change)
• Reduced infl ow in river systems in southwestern Australia (since the mid-1970s) ( high confi dence, major contribution from climate change)
[25.5, Tables 18-5, 18-6, and 25-1; WGI AR5 4.3]
Terrestrial
Ecosystems
• Changes in genetics, growth, distribution, and phenology of many species, in particular birds, butterfl ies, and plants in Australia, beyond fl uctuations due to variable
local climates, land use, pollution, and invasive species ( high confi dence, major contribution from climate change)
• Expansion of some wetlands and contraction of adjacent woodlands in southeast Australia ( low confi dence, major contribution from climate change)
• Expansion of monsoon rainforest at expense of savannah and grasslands in northern Australia ( medium confi dence, major contribution from climate change)
• Migration of glass eels advanced by several weeks in Waikato River, New Zealand ( low confi dence, major contribution from climate change)
[Tables 18-7 and 25-3]
Coastal Erosion
& Marine
Ecosystems
• Southward shifts in the distribution of marine species near Australia, beyond changes due to short-term environmental fl uctuations, fi shing, and pollution ( medium
confi dence, major contribution from climate change)
• Change in timing of migration of seabirds in Australia ( low confi dence, major contribution from climate change)
• Increased coral bleaching in Great Barrier Reef and western Australian reefs, beyond effects from pollution and physical disturbance ( high confi dence, major
contribution from climate change)
• Changed coral disease patterns at Great Barrier Reef, beyond effects from pollution ( medium confi dence, major contribution from climate change)
[6.3, 25.6, Tables 18-8 and 25-3]
Food Production
& Livelihoods
• Advanced timing of wine-grape maturation in recent decades, beyond advance due to improved management ( medium confi dence, major contribution from climate
change)
• Shift in winter vs. summer human mortality in Australia, beyond changes due to exposure and health care ( low confi dence, major contribution from climate change)
• Relocation or diversifi cation of agricultural activities in Australia, beyond changes due to policy, markets, and short-term climate variability ( low confi dence, minor
contribution from climate change)
[11.4, 18.4, 25.7, 25.8, Tables 18-9 and 25-3, Box 25-5]
North America
Snow & Ice,
Rivers & Lakes,
Floods & Drought
• Shrinkage of glaciers across western and northern North America ( high confi dence, major contribution from climate change)
• Decreasing amount of water in spring snowpack in western North America (1960 – 2002) ( high confi dence, major contribution from climate change)
• Shift to earlier peak fl ow in snow dominated rivers in western North America ( high confi dence, major contribution from climate change)
• Increased runoff in the midwestern and northeastern US ( medium confi dence, minor contribution from climate change)
[Tables 18-5 and 18-6; WGI AR5 2.6, 4.3]
Terrestrial
Ecosystems
• Phenology changes and species distribution shifts upward in elevation and northward across multiple taxa ( medium confi dence, major contribution from climate change)
• Increased wildfi re frequency in subarctic conifer forests and tundra ( medium confi dence, major contribution from climate change)
• Regional increases in tree mortality and insect infestations in forests ( low confi dence, minor contribution from climate change)
• Increase in wildfi re activity, fi re frequency and duration, and burnt area in forests of the western US and boreal forests in Canada, beyond changes due to land use
and fi re management ( medium confi dence, minor contribution from climate change)
[26.4, 28.2, Table 18-7, Box 26-2]
Coastal Erosion
& Marine
Ecosystems
• Northward distributional shifts of northwest Atlantic fi sh species ( high confi dence, major contribution from climate change)
• Changes in musselbeds along the west coast of US ( high confi dence, major contribution from climate change)
• Changed migration and survival of salmon in northeast Pacifi c ( high confi dence, major contribution from climate change)
• Increased coastal erosion in Alaska and Canada ( medium confi dence, major contribution from climate change)
[18.3, 30.5, Tables 6-2 and 18-8]
Food Production
& Livelihoods
• Impacts on livelihoods of indigenous groups in the Canadian Arctic, beyond effects of economic and sociopolitical changes ( medium confi dence, major contribution
from climate change)
[18.4, 28.2, Tables 18-4 and 18-9]
Table TS.1 (continued)

46
Technical Summary
TS
Central and South America
Snow & Ice,
Rivers & Lakes,
Floods & Drought
• Shrinkage of Andean glaciers ( high confi dence, major contribution from climate change)
•
C
hanges in extreme fl ows in Amazon River ( medium confi dence, major contribution from climate change)
• Changing discharge patterns in rivers in the western Andes ( medium confi dence, major contribution from climate change)
•
I
ncreased streamfl ow in sub-basins of the La Plata River, beyond increase due to land-use change ( high confi dence, major contribution from climate change)
[
27.3, Tables 18-5, 18-6, and 27-3; WGI AR5 4.3]
Terrestrial
Ecosystems
• Increased tree mortality and forest fi re in the Amazon ( low confi dence, minor contribution from climate change)
•
R
ainforest degradation and recession in the Amazon, beyond reference trends in deforestation and land degradation ( low confi dence, minor contribution from climate
change)
[
4.3, 18.3, 27.2, 27.3, Table 18-7]
Coastal Erosion
& Marine
Ecosystems
• Increased coral bleaching in western Caribbean, beyond effects from pollution and physical disturbance ( high confi dence, major contribution from climate change)
•
M
angrove degradation on north coast of South America, beyond degradation due to pollution and land use ( low confi dence, minor contribution from climate change)
[27.3, Table 18-8]
Food Production
& Livelihoods
• More vulnerable livelihood trajectories for indigenous Aymara farmers in Bolivia due to water shortage, beyond effects of increasing social and economic stress
( medium confi dence, major contribution from climate change)
•
I
ncrease in agricultural yields and expansion of agricultural areas in southeastern South America, beyond increase due to improved technology ( medium confi dence,
major contribution from climate change)
[
13.1, 27.3, Table 18-9]
Polar Regions
Snow & Ice,
Rivers & Lakes,
Floods & Drought
• Decreasing Arctic sea ice cover in summer ( high confi dence, major contribution from climate change)
•
R
eduction in ice volume in Arctic glaciers ( high confi dence, major contribution from climate change)
• Decreasing snow cover extent across the Arctic ( medium confi dence, major contribution from climate change)
• Widespread permafrost degradation, especially in the southern Arctic ( high confi dence, major contribution from climate change)
•
I
ce mass loss along coastal Antarctica ( medium confi dence, major contribution from climate change)
• Increased river discharge for large circumpolar rivers (1997–2007) ( low confi dence, major contribution from climate change)
•
I
ncreased winter minimum river fl ow in most of the Arctic ( medium confi dence, major contribution from climate change)
• Increased lake water temperatures 1985–2009 and prolonged ice-free seasons ( medium confi dence, major contribution from climate change)
•
D
isappearance of thermokarst lakes due to permafrost degradation in the low Arctic. New lakes created in areas of formerly frozen peat ( high confi dence, major
contribution from climate change)
[28.2, Tables 18-5 and 18-6; WGI AR5 4.2 to 4.4, 4.6, 10.5]
Terrestrial
Ecosystems
• Increased shrub cover in tundra in North America and Eurasia ( high confi dence, major contribution from climate change)
• Advance of Arctic tree-line in latitude and altitude ( medium confi dence, major contribution from climate change)
• Changed breeding area and population size of subarctic birds, due to snowbed reduction and/or tundra shrub encroachment ( medium confi dence, major contribution
from climate change)
• Loss of snow-bed ecosystems and tussock tundra ( high confi dence, major contribution from climate change)
• Impacts on tundra animals from increased ice layers in snow pack, following rain-on-snow events ( medium confi dence, major contribution from climate change)
• Increased plant species ranges in the West Antarctic Peninsula and nearby islands over the past 50 years ( high confi dence, major contribution from climate change)
• Increased phytoplankton productivity in Signy Island lake waters ( high confi dence, major contribution from climate change)
[28.2, Table 18-7]
Coastal Erosion
& Marine
Ecosystems
• Increased coastal erosion across Arctic ( medium confi dence, major contribution from climate change)
• Negative effects on non-migratory Arctic species ( high confi dence, major contribution from climate change)
• Decreased reproductive success in Arctic seabirds ( medium confi dence, major contribution from climate change)
• Decline in Southern Ocean seals and seabirds ( medium confi dence, major contribution from climate change)
• Reduced thickness of foraminiferal shells in southern oceans, due to ocean acidifi cation ( medium confi dence, major contribution from climate change)
• Reduced krill density in Scotia Sea ( medium confi dence, major contribution from climate change)
[6.3, 18.3, 28.2, 28.3, Table 18-8]
Food Production
& Livelihoods
• Impact on livelihoods of Arctic indigenous peoples, beyond effects of economic and sociopolitical changes ( medium confi dence, major contribution from climate
change)
• Increased shipping traffi c across the Bering Strait ( medium confi dence, major contribution from climate change)
[18.4, 28.2, Tables 18-4 and 18-9, Figure 28-4]
Small Islands
Snow & Ice,
Rivers & Lakes,
Floods & Drought
• Increased water scarcity in Jamaica, beyond increase due to water use ( very low confi dence, minor contribution from climate change)
[Table 18-6]
Terrestrial
Ecosystems
• Tropical bird population changes in Mauritius ( medium confi dence, major contribution from climate change)
• Decline of an endemic plant in Hawai’i ( medium confi dence, major contribution from climate change)
• Upward trend in tree-lines and associated fauna on high-elevation islands ( low confi dence, minor contribution from climate change)
[29.3, Table 18-7]
Coastal Erosion
& Marine
Ecosystems
• Increased coral bleaching near many tropical small islands, beyond effects of degradation due to fi shing and pollution ( high confi dence, major contribution from
climate change)
• Degradation of mangroves, wetlands, and seagrass around small islands, beyond degradation due to other disturbances ( very low confi dence, minor contribution from
climate change)
• Increased fl ooding and erosion, beyond erosion due to human activities, natural erosion, and accretion ( low confi dence, minor contribution from climate change)
• Degradation of groundwater and freshwater ecosystems due to saline intrusion, beyond degradation due to pollution and groundwater pumping ( low confi dence,
minor contribution from climate change)
[29.3, Table 18-8]
Food Production
& Livelihoods
• Increased degradation of coastal fi sheries due to direct effects and effects of increased coral reef bleaching, beyond degradation due to overfi shing and pollution ( low
confi dence, minor contribution from climate change)
[18.3, 18.4, 29.3, 30.6, Table 18-9, Box CC-CR]
Table TS.1 (continued)

47
Technical Summary
TS
s
pecies extinctions have not been attributed to climate change (high
confidence). [4.2, 4.4, 18.3, 18.5, 22.3, 25.6, 26.4, 28.2, Figure 4-10,
Boxes 4-2, 4-3, 4-4, and 25-3]
Coastal Systems and Low-lying Areas
Coastal systems are particularly sensitive to changes in sea level
and ocean temperature and to ocean acidification (very high
confidence).
Coral bleaching and species range shifts have been
attributed to changes in ocean temperature. For many other coastal
changes, the impacts of climate change are difficult to identify given
other human-related drivers (e.g. land use change, coastal development,
pollution) (robust evidence, high agreement). [5.3 to 5.5, 18.3, 25.6,
26.4, Box 25-3]
Marine Systems
Warming has caused and will continue to cause shifts in the
abundance, geographic distribution, migration patterns, and
timing of seasonal activities of marine species (very high
confidence), paralleled by reduction in maximum body sizes
(medium confidence). This has resulted and will further result in
changing interactions between species, including competition and
predator-prey dynamics (high confidence).
Numerous observations
over the last decades in all ocean basins show global-scale changes
including large-scale distribution shifts of species (very high confidence)
and altered ecosystem composition (high confidence) on multi-decadal
time scales, tracking climate trends. Many fishes, invertebrates, and
phytoplankton have shifted their distribution and/or abundance
poleward and/or to deeper, cooler waters (Figure TS.2D). Some warm-
water corals and their reefs have responded to warming with species
replacement, bleaching, and decreased coral cover causing habitat
loss. Few field observations to date demonstrate biological responses
attributable to anthropogenic ocean acidification, as in many places
these responses are not yet outside their natural variability and may be
influenced by confounding local or regional factors. See also Box TS.7.
Natural global climate change at rates slower than current anthropogenic
climate change caused significant ecosystem shifts, including species
emergences and extinctions, during the past millions of years. [5.4, 6.1,
6.3 to 6.5, 18.3, 18.5, 22.3, 25.6, 26.4, 30.4, 30.5, Boxes 25-3, CC-OA,
CC-CR, and CC-MB]
Vulnerability of most marine organisms to warming is set by
their physiology, which defines their limited temperature ranges
and hence their thermal sensitivity (high confidence).
See Figure
TS.3. Temperature defines the geographic distribution of many species
and their responses to climate change. Shifting temperature means and
extremes alter habitat (e.g., sea ice and coastal habitat), and cause
changes in species abundances through local extinctions and latitudinal
distribution expansions or shifts of up to hundreds of kilometers per
decade (very high confidence). Although genetic adaptation occurs
(medium confidence), the capacity of fauna and flora to compensate
for or keep up with the rate of ongoing thermal change is limited (low
confidence). [6.3, 6.5, 30.5]
O
xygen minimum zones are progressively expanding in the
tropical Pacific, Atlantic, and Indian Oceans, due to reduced
ventilation and O
2
solubilities in more stratified oceans at higher
temperatures (high confidence).
In combination with human activities
that increase the productivity of coastal systems, hypoxic areas (“dead
zones”) are increasing in number and size. Regional exacerbation of
hypoxia causes shifts to hypoxia-tolerant biota and reduces habitat for
commercially relevant species, with implications for fisheries. [6.1, 6.3,
30.3, 30.5, 30.6; WGI AR5 3.8]
Food Security and Food Production Systems
Based on many studies covering a wide range of regions and
crops, negative impacts of climate change on crop yields have
been more common than positive impacts (high confidence).
The
smaller number of studies showing positive impacts relate mainly to
high-latitude regions, though it is not yet clear whether the balance of
impacts has been negative or positive in these regions. Climate change
has negatively affected wheat and maize yields for many regions and in
the global aggregate (medium confidence). Effects on rice and soybean
yield have been smaller in major production regions and globally, with
a median change of zero across all available data, which are fewer for
soy compared to the other crops. Observed impacts relate mainly
to production aspects of food security rather than access or other
components of food security. See Figure TS.2E. Since AR4, several
periods of rapid food and cereal price increases following climate
extremes in key producing regions indicate a sensitivity of current
markets to climate extremes among other factors (medium confidence).
Crop yields have a large negative sensitivity to extreme daytime
temperatures around 30°C, throughout the growing season (high
confidence). CO
2
has stimulatory effects on crop yields in most cases,
and elevated tropospheric ozone has damaging effects. Interactions
among CO
2
and ozone, mean temperature, extremes, water, and nitrogen
are non-linear and difficult to predict (medium confidence). [7.2, 7.3,
18.4, 22.3, 26.5, Figures 7-2, 7-3, and 7-7, Box 25-3]
Urban Areas
Urban areas hold more than half the world’s population and
most of its built assets and economic activities.
A high proportion
of the population and economic activities at risk from climate change
are in urban areas, and a high proportion of global greenhouse gas
emissions are generated by urban-based activities and residents. Cities
are composed of complex inter-dependent systems that can be leveraged
to support climate change adaptation via effective city governments
supported by cooperative multilevel governance (medium confidence). This
can enable synergies with infrastructure investment and maintenance,
land use management, livelihood creation, and ecosystem services
protection. [8.1, 8.3, 8.4]
Rapid urbanization and growth of large cities in developing
countries have been accompanied by expansion of highly
vulnerable urban communities living in informal settlements,
many of which are on land exposed to extreme weather (medium
confidence).
[8.2, 8.3]
48
Technical Summary
TS
Rural Areas
Climate change in rural areas will take place in the context of
many important economic, social, and land use trends (very high
confidence).
In different regions, absolute rural populations have
peaked or will peak in the next few decades. The proportion of the rural
population depending on agriculture is varied across regions, but
declining everywhere. Poverty rates in rural areas are higher than overall
poverty rates, but also falling more sharply, and the proportions of
population in extreme poverty accounted for by rural people are also
falling: in both cases with the exception of sub-Saharan Africa, where
these rates are rising. Accelerating globalization, through migration,
Latitudes (in °N)
Contraction
Expansion
0.00
0.04 0.08
Mean number of warm-temperate pseudo-oceanic
copepod species per assemblage
50
°
N
60
°
N
1958–1981 2003–2005
Impact of photoperiod
High
North
Low
South
(B)
Spatial dynamics during progressive warming
Species abundance
Spatial dynamics during progressive warming
P
henology
s
hift
Seasonal temperature dynamics in low latitude
T
emperature-dependent
time window
Seasonal temperature dynamics in high latitude
J
an Dec
J
an Dec
HighLow
Expansion Contraction
Contraction
Expansion
Temperature range
Temperature range
T
d
denaturation
T
opt
T
p
T
p
T
c
T
c
anaerobiosis
loss of performance
and abundance
Scope for aerobic performance
HighLow
(A)
Thermal windows for animals: limits and acclimatization
(C)
Performance curve under normal conditions
Performance curve options under
elevated CO
2
or in hypoxic water or both
T
opt
Optimum temperature (performance maximum)
T
p
Pejus temperatures (limit to long-term tolerance)
T
c
Critical temperatures (transition to anaerobic metabolism)
T
d
Denaturation temperatures (the onset of cell damage)
acclimatization
and adaptation
C
old
Cold
W
arm
Warm
threshold line
Figure TS.3 | Temperature specialization of species (A), which is influenced by other factors such as oxygen, causes warming-induced distribution shifts (B), for example, the
northward expansion of warm-temperate species in the northeast Atlantic (C). These distribution changes depend on species-specific physiology and ecology. Detailed
introduction of each panel follows: (A) The temperature tolerance range and performance levels of an organism are described by its performance curve. Each performance (e.g.,
exercise, growth, reproduction) is highest at optimum temperature (T
opt
) and lower at cooler or warmer temperatures. Surpassing temperature thresholds (T
p
) means going into
time-limited tolerance, and more extreme temperature changes lead to exceedance of thresholds that cause metabolic disturbances (T
c
) and ultimately onset of cell damage (T
d
).
These thresholds for an individual can shift (horizontal arrows), within limits, between summer and winter (seasonal acclimatization) or when the species adapts to a cooler or
warmer climate over generations (evolutionary adaptation). Under elevated CO
2
levels (ocean acidification) or low oxygen, thermal windows narrow (dashed gray curves). (B)
During climate warming, a species follows its normal temperatures as it moves or is displaced, typically resulting in a poleward shift of the biogeographic range (exemplified for
the Northern Hemisphere). The polygon delineates the distribution range in space and seasonal time; the level of gray denotes abundance. (C) Long-term changes in the mean
number of warm-temperate pseudo-oceanic copepod species in the northeast Atlantic from 1958 to 2005. [Figures 6-5, 6-7, and 6-8]
49
Technical Summary
TS
l
abor linkages, regional and international trade, and new information
and communication technologies, is bringing about economic
transformation in rural areas of developing and developed countries.
[9.3, Figure 9-2]
For rural households and communities, access to land and natural
resources, flexible local institutions, knowledge and information,
and livelihood strategies can contribute to resilience to climate
change (high confidence). Especially in developing countries,
rural people are subject to multiple non-climatic stressors,
including underinvestment in agriculture, problems with land
and natural resource policy, and processes of environmental
degradation (very high confidence).
In developed countries, there
are important shifts toward multiple uses of rural areas, especially
leisure uses, and new rural policies based on the collaboration of
multiple stakeholders, the targeting of multiple sectors, and a change
from subsidy-based to investment-based policy. [9.3, 22.4, Table 9-3]
Key Economic Sectors and Services
Economic losses due to extreme weather events have increased
globally, mostly due to increase in wealth and exposure, with a
possible influence of climate change (low confidence in attribution
to climate change).
Flooding can have major economic costs, both in
term of impacts (e.g., capital destruction, disruption) and adaptation (e.g.,
construction, defensive investment) (robust evidence, high agreement).
Since the mid-20th century, socioeconomic losses from flooding have
increased mainly due to greater exposure and vulnerability (high
confidence). [3.2, 3.4, 10.3, 18.4, 23.2, 23.3, 26.7, Figure 26-2, Box
25-7]
Human Health
At present the worldwide burden of human ill-health from climate
change is relatively small compared with effects of other stressors
and is not well quantified.
However, there has been increased heat-
related mortality and decreased cold-related mortality in some regions as
a result of warming (medium confidence). Local changes in temperature
and rainfall have altered the distribution of some waterborne illnesses
and disease vectors (medium confidence). [11.4 to 11.6, 18.4, 25.8]
The health of human populations is sensitive to shifts in
weather patterns and other aspects of climate change (very high
confidence).
These effects occur directly, due to changes in temperature
and precipitation and in the occurrence of heat waves, floods, droughts,
and fires. Health may be damaged indirectly by climate change-related
ecological disruptions, such as crop failures or shifting patterns of disease
vectors, or by social responses to climate change, such as displacement
of populations following prolonged drought. Variability in temperatures
is a risk factor in its own right, over and above the influence of average
temperatures on heat-related deaths. [11.4, 28.2]
Human Security
Challenges for vulnerability reduction and adaptation actions
are particularly high in regions that have shown severe difficulties
in governance (high confidence). Violent conflict increases
vulnerability to climate change (medium evidence, high agreement).
Large-scale violent conflict harms assets that facilitate adaptation,
including infrastructure, institutions, natural resources, social capital,
and livelihood opportunities. [12.5, 19.2, 19.6]
Climate change and
climate change responses
Socioeconomic
development pathways
Capacities and
opportunities
Resilient
HighLow
Privileged
At risk
Marginalized
Multidimensional
vulnerability
Class
Gender
Age
Ethnicity
(Dis)ability
Age
(Di
s)a
bil
ity
Race
Identity markers
and dimensions of
inequality
Intersecting
dimensions of
inequality
Multidimensional vulnerability
Population
Box TS.4 Figure 1 | Multidimensional vulnerability driven by intersecting dimensions of inequality. Vulnerability increases when people’s capacities and opportunities to adapt to
climate change and adjust to climate change responses are diminished. [Figure 13-5]

50
Technical Summary
TS
Box TS.4 | Multidimensional Inequality and Vulnerability to Climate Change
People who are socially, economically, culturally, politically, institutionally, or otherwise marginalized in society are especially vulnerable
to climate change and also to some adaptation and mitigation responses (medium evidence, high agreement). This heightened
vulnerability is rarely due to a single cause. Rather, it is the product of intersecting social processes that result in inequalities in
socioeconomic status and income, as well as in exposure. Such social processes include, for example, discrimination on the basis of
gender, class, race/ethnicity, age, and (dis)ability. See Box TS.4 Figure 1 on previous page. Understanding differential capacities and
opportunities of individuals, households, and communities requires knowledge of these intersecting social drivers, which may be
context-specific and clustered in diverse ways (e.g., class and ethnicity in one case, gender and age in another). Few studies depict
the full spectrum of these intersecting social processes and the ways in which they shape multidimensional vulnerability to climate
change.
Examples of inequality-driven impacts and risks of climate change and climate change responses (medium evidence, high agreement):
• Privileged members of society can benefit from climate change impacts and response strategies, given their flexibility in mobilizing
and accessing resources and positions of power, often to the detriment of others. [13.2, 13.3, 22.4, 26.8]
• Differential impacts on men and women arise from distinct roles in society, the way these roles are enhanced or constrained by
other dimensions of inequality, risk perceptions, and the nature of response to hazards. [8.2, 9.3, 11.3, 12.2, 13.2, 18.4, 19.6,
22.4, Box CC-GC]
• Both male and female deaths are recorded after flooding, affected by socioeconomic disadvantage, occupation, and culturally
imposed expectations to save lives. Although women are generally more sensitive to heat stress, more male workers are reported
to have died largely as a result of responsibilities related to outdoor and indoor work. [11.3, 13.2, Box CC-GC]
• Women often experience additional duties as laborers and caregivers as a result of extreme weather events and climate change,
as well as responses (e.g., male outmigration), while facing more psychological and emotional distress, reduced food intake,
adverse mental health outcomes due to displacement, and in some cases increasing incidences of domestic violence. [9.3, 9.4,
12.4, 13.2, Box CC-GC]
• Children and the elderly are often at higher risk due to narrow mobility, susceptibility to infectious diseases, reduced caloric
intake, and social isolation. While adults and older children are more severely affected by some climate-sensitive vector-borne
diseases such as dengue, young children are more likely to die from or be severely compromised by diarrheal diseases and
floods. The elderly face disproportional physical harm and death from heat stress, droughts, and wildfires. [8.2, 10.9, 11.1, 11.4,
11.5, 13.2, 22.4, 23.5, 26.6]
• In most urban areas, low-income groups, including migrants, face large climate change risks because of poor-quality, insecure,
and clustered housing, inadequate infrastructure, and lack of provision for health care, emergency services, flood exposure, and
measures for disaster risk reduction. [8.1, 8.2, 8.4, 8.5, 12.4, 22.3, 26.8]
• People disadvantaged by race or ethnicity, especially in developed countries, experience more harm from heat stress, often due
to low economic status and poor health conditions, and displacement after extreme events. [11.3, 12.4, 13.2]
• Livelihoods and lifestyles of indigenous peoples, pastoralists, and fisherfolk, often dependent on natural resources, are highly
sensitive to climate change and climate change policies, especially those that marginalize their knowledge, values, and activities.
[9.3, 11.3, 12.3, 14.2, 22.4, 25.8, 26.8, 28.2]
• Disadvantaged groups without access to land and labor, including female-headed households, tend to benefit less from climate
change response mechanisms (e.g., Clean Development Mechanism (CDM), Reduction of Emissions from Deforestation and
Forest Degradation (REDD+), large-scale land acquisition for biofuels, and planned agricultural adaptation projects). [9.3, 12.2,
12.5, 13.3, 22.4, 22.6]

51
Technical Summary
TS
Livelihoods and Poverty
Climate-related hazards exacerbate other stressors, often with
negative outcomes for livelihoods, especially for people living
in poverty (high confidence).
Climate-related hazards affect poor
people’s lives directly through impacts on livelihoods, reductions in crop
yields, or destruction of homes and indirectly through, for example,
increased food prices and food insecurity. Urban and rural transient
poor who face multiple deprivations can slide into chronic poverty as a
result of extreme events, or a series of events, when unable to rebuild
their eroded assets (limited evidence, high agreement). Observed
positive effects for poor and marginalized people, which are limited and
often indirect, include examples such as diversification of social
networks and of agricultural practices. [8.2, 8.3, 9.3, 11.3, 13.1 to 13.3,
22.3, 24.4, 26.8]
Livelihoods of indigenous peoples in the Arctic have been altered
by climate change, through impacts on food security and
traditional and cultural values (medium confidence).
There is
emerging evidence of climate change impacts on livelihoods of
indigenous people in other regions. [18.4, Table 18-9, Box 18-5]
A-2. Adaptation Experience
Throughout history, people and societies have adjusted to and coped
with climate, climate variability, and extremes, with varying degrees of
success. This section focuses on adaptive human responses to observed
and projected climate-change impacts, which can also address broader
risk-reduction and development objectives.
Adaptation is becoming embedded in some planning processes,
with more limited implementation of responses (high confidence).
Engineered and technological options are commonly implemented
adaptive responses, often integrated within existing programs such as
disaster risk management and water management. There is increasing
recognition of the value of social, institutional, and ecosystem-based
measures and of the extent of constraints to adaptation. Adaptation
options adopted to date continue to emphasize incremental adjustments
and co-benefits and are starting to emphasize flexibility and learning
(medium evidence, medium agreement). [4.4, 5.5, 6.4, 8.3, 9.4, 11.7,
14.1, 14.3, 15.2 to 15.5, 17.2, 17.3, 22.4, 23.7, 25.4, 25.10, 26.8, 26.9,
27.3, 30.6, Boxes 25-1, 25-2, 25-9, and CC-EA]
Most assessments of adaptation have been restricted to impacts,
vulnerability, and adaptation planning, with very few assessing the
processes of implementation or the effects of adaptation actions
(medium evidence, high agreement).
Vulnerability indicators define,
quantify, and weight aspects of vulnerability across regional units, but
methods of constructing indices are subjective, often lack transparency,
and can be difficult to interpret. There are conflicting views on the
choice of adaptation metrics, given differing values placed on needs
and outcomes, many of which cannot be captured in a comparable way
by metrics. Indicators proving most useful for policy learning are those
that track not just process and implementation, but also the extent to
which targeted outcomes are occurring. Multi-metric evaluations
including risk and uncertainty are increasingly used, an evolution from
a
previous focus on cost-benefit analysis and identification of “best
economic adaptations” (high confidence). Adaptation assessments best
suited to delivering effective adaptation measures often include both
top-down assessments of biophysical climate changes and bottom-up
assessments of vulnerability targeted toward local solutions to globally
derived risks and toward particular decisions. [4.4, 14.4, 14.5, 15.2, 15.3,
17.2, 17.3, 21.3, 21.5, 22.4, 25.4, 25.10, 26.8, 26.9, Box CC-EA]
Adaptation experience is accumulating across regions in the public
and private sector and within communities (high confidence).
Governments at various levels are starting to develop adaptation
plans and policies and to integrate climate-change considerations
into broader development plans.
Examples of adaptation across
regions and contexts include the following:
• Urban adaptation has emphasized city-based disaster risk
management such as early warning systems and infrastructure
investments; ecosystem-based adaptation and green roofs; enhanced
storm and wastewater management; urban and peri-urban agriculture
improving food security; enhanced social protection; and good-
quality, affordable, and well-located housing (high confidence). [8.3,
8.4, 15.4, 26.8, Boxes 25-9, CC-UR, and CC-EA]
• There is a growing body of literature on adaptation practices in
both developed and developing country rural areas, including
documentation of practical experience in agriculture, water, forestry,
and biodiversity and, to a lesser extent, fisheries (very high confidence).
Public policies supporting decision making for adaptation in rural
areas exist in developed and, increasingly, developing countries, and
there are also examples of private adaptations led by individuals,
companies, and nongovernmental organizations (NGOs) (high
confidence). Adaptation constraints, particularly pronounced in
developing countries, result from lack of access to credit, land,
water, technology, markets, information, and perceptions of the
need to change. [9.4, 17.3, Tables 9-7 and 9-8]
• In Africa, most national governments are initiating governance
systems for adaptation (high confidence). Progress on national and
subnational policies and strategies has initiated the mainstreaming
of adaptation into sectoral planning, but evolving institutional
frameworks cannot yet effectively coordinate the range of adaptation
initiatives being implemented. Disaster risk management, adjustments
in technologies and infrastructure, ecosystem-based approaches,
basic public health measures, and livelihood diversification are
reducing vulnerability, although efforts to date tend to be isolated.
[22.4]
• In Europe, adaptation policy has been developed at international
(EU), national, and local government levels, with limited systematic
information on current implementation or effectiveness (high
confidence). Some adaptation planning has been integrated into
coastal and water management, into environmental protection and
land planning, and into disaster risk management. [23.7, Boxes 5-1
and 23-3]
• In Asia, adaptation is being facilitated in some areas through
mainstreaming climate adaptation action into subnational
development planning, early warning systems, integrated water
resources management, agroforestry, and coastal reforestation of
mangroves (high confidence). [24.4 to 24.6, 24.9, Box CC-TC]
• In Australasia, planning for sea level rise, and in southern Australia
for reduced water availability, is becoming adopted widely. Planning

52
Technical Summary
TS
Continued next page
Early warning systems for heat
Exposure and vulnerability
Factors affecting exposure and vulnerability include age, preexisting health status, level of outdoor activity, socioeconomic factors including poverty and social
i
solation, access to and use of cooling, physiological and behavioral adaptation of the population, urban heat island effects, and urban infrastructure.
[
8.2.3, 8.2.4, 11.3.3, 11.3.4, 11.4.1, 11.7, 13.2.1, 19.3.2, 23.5.1, 25.3, 25.8.1, SREX Table SPM.1]
Climate information at the
global scale
O
bserved:
•
V
ery likely decrease in the number of cold days and nights and increase in the number of warm days and nights, on the global scale between 1951 and
2010. [WGI AR5 2.6.1]
•
M
edium confi dence that the length and frequency of warm spells, including heat waves, has increased globally since 1950. [WGI AR5 2.6.1]
Projected: Virtually certain that, in most places, there will be more hot and fewer cold temperature extremes as global mean temperatures increase, for
e
vents defi ned as extremes on both daily and seasonal time scales. [WGI AR5 12.4.3]
Climate information at the
regional scale
Observed:
•
L
ikely that heat wave frequency has increased since 1950 in large parts of Europe, Asia, and Australia. [WGI AR5 2.6.1]
• Medium confi dence in overall increase in heat waves and warm spells in North America since 1960. Insuffi cient evidence for assessment or spatially varying
trends in heat waves or warm spells for South America and most of Africa. [SREX Table 3-2; WGI AR5 2.6.1]
Projected:
• Likely that, by the end of the 21st century under Representative Concentration Pathway 8.5 (RCP8.5) in most land regions, a current 20-year high-
t
emperature event will at least double its frequency and in many regions occur every 2 years or annually, while a current 20-year low-temperature event
will become exceedingly rare. [WGI AR5 12.4.3]
•
V
ery likely more frequent and/or longer heat waves or warm spells over most land areas. [WGI AR5 12.4.3]
Description
Heat-health early warning systems are instruments to prevent negative health impacts during heat waves. Weather forecasts are used to predict situations
a
ssociated with increased mortality or morbidity. Components of effective heat wave and health warning systems include identifying weather situations
that adversely affect human health, monitoring weather forecasts, communicating heat wave and prevention responses, targeting notifi cations to vulnerable
populations, and evaluating and revising the system to increase effectiveness in a changing climate. Warning systems for heat waves have been planned and
i
mplemented broadly, for example in Europe, the United States, Asia, and Australia.
[11.7.3, 24.4.6, 25.8.1, 26.6, Box 25-6]
Broader context
• Heat-health warning systems can be combined with other elements of a health protection plan, for example building capacity to support communities most
at risk, supporting and funding health services, and distributing public health information.
• In Africa, Asia, and elsewhere, early warning systems have been used to provide warning of and reduce a variety of risks related to famine and food
insecurity; fl ooding and other weather-related hazards; exposure to air pollution from fi re; and vector-borne and food-borne disease outbreaks.
[7.5.1, 11.7, 15.4.2, 22.4.5, 24.4.6, 25.8.1, 26.6.3, Box 25-6]
Mangrove restoration to reduce fl ood risks and protect shorelines from storm surge
Exposure and vulnerability
Loss of mangroves increases exposure of coastlines to storm surge, coastal erosion, saline intrusion, and tropical cyclones. Exposed infrastructure, livelihoods,
and people are vulnerable to associated damage. Areas with development in the coastal zone, such as on small islands, can be particularly vulnerable.
[5.4.3, 5.5.6, 29.7.2, Box CC-EA]
Climate information at the
global scale
Observed:
• Likely increase in the magnitude of extreme high sea level events since 1970, mostly explained by rising mean sea level. [WGI AR5 3.7.5]
• Low confi dence in long-term (centennial) changes in tropical cyclone activity, after accounting for past changes in observing capabilities. [WGI AR5 2.6.3]
Projected:
• Very likely signifi cant increase in the occurrence of future sea level extremes by 2050 and 2100. [WGI AR5 13.7.2]
• In the 21st century, likely that the global frequency of tropical cyclones will either decrease or remain essentially unchanged. Likely increase in both global
mean tropical cyclone maximum wind speed and rainfall rates. [WGI AR5 14.6]
Climate information at the
regional scale
Observed: Change in sea level relative to the land (relative sea level) can be signifi cantly different from the global mean sea level change because of
changes in the distribution of water in the ocean and vertical movement of the land. [WGI AR5 3.7.3]
Projected:
• Low confi dence in region-specifi c projections of storminess and associated storm surges. [WGI AR5 13.7.2]
• Projections of regional changes in sea level reach values of up to 30% above the global mean value in the Southern Ocean and around North America, and
between 10% to 20% above the global mean value in equatorial regions. [WGI AR5 13.6.5]
• More likely than not substantial increase in the frequency of the most intense tropical cyclones in the western North Pacifi c and North Atlantic. [WGI AR5 14.6]
Description
Mangrove restoration and rehabilitation has occurred in a number of locations (e.g., Vietnam, Djibouti, and Brazil) to reduce coastal fl ooding risks and protect
shorelines from storm surge. Restored mangroves have been shown to attenuate wave height and thus reduce wave damage and erosion. They protect
aquaculture industry from storm damage and reduce saltwater intrusion.
[2.4.3, 5.5.4, 8.3.3, 22.4.5, 27.3.3]
Broader context
• Considered a low-regrets option benefi ting sustainable development, livelihood improvement, and human well-being through improvements for food
security and reduced risks from fl ooding, saline intrusion, wave damage, and erosion. Restoration and rehabilitation of mangroves, as well as of wetlands or
deltas, is ecosystem-based adaptation that enhances ecosystem services.
• Synergies with mitigation given that mangrove forests represent large stores of carbon.
• Well-integrated ecosystem-based adaptation can be more cost effective and sustainable than non-integrated physical engineering approaches.
[5.5, 8.4.2, 14.3.1, 24.6, 29.3.1, 29.7.2, 30.6.1, 30.6.2, Table 5-4, Box CC-EA]
Table TS.2 | Illustrative examples of adaptation experience, as well as approaches to reducing vulnerability and enhancing resilience. Adaptation actions can be infl uenced by
climate variability, extremes, and change, and by exposure and vulnerability at the scale of risk management. Many examples and case studies demonstrate complexity at the
level of communities or specifi c regions within a country. It is at this spatial scale that complex interactions between vulnerability, exposure, and climate change come to the fore.
[Table 21-4]

53
Technical Summary
TS
Continued next page
Community-based adaptation and traditional practices in small island contexts
Exposure and vulnerability
With small land area, often low elevation coasts, and concentration of human communities and infrastructure in coastal zones, small islands are particularly
v
ulnerable to rising sea levels and impacts such as inundation, saltwater intrusion, and shoreline change.
[29.3.1, 29.3.3, 29.6.1, 29.6.2, 29.7.2]
Climate information at the
global scale
O
bserved:
•
L
ikely increase in the magnitude of extreme high sea level events since 1970, mostly explained by rising mean sea level. [WGI AR5 3.7.5]
• Low confi dence in long-term (centennial) changes in tropical cyclone activity, after accounting for past changes in observing capabilities. [WGI AR5 2.6.3]
•
S
ince 1950 the number of heavy precipitation events over land has likely increased in more regions than it has decreased. [WGI AR5 2.6.2]
P
rojected:
•
V
ery likely signifi cant increase in the occurrence of future sea level extremes by 2050 and 2100. [WGI AR5 13.7.2]
• In the 21st century, likely that the global frequency of tropical cyclones will either decrease or remain essentially unchanged. Likely increase in both global
m
ean tropical cyclone maximum wind speed and rainfall rates. [WGI AR5 14.6]
• Globally, for short-duration precipitation events, likely shift to more intense individual storms and fewer weak storms. [WGI AR5 12.4.5]
Climate information at the
regional scale
O
bserved: Change in sea level relative to the land (relative sea level) can be signifi cantly different from the global mean sea level change because of
changes in the distribution of water in the ocean and vertical movement of the land. [WGI AR5 3.7.3]
P
rojected:
• Low confi dence in region-specifi c projections of storminess and associated storm surges. [WGI AR5 13.7.2]
• Projections of regional changes in sea level reach values of up to 30% above the global mean value in the Southern Ocean and around North America, and
b
etween 10% and 20% above the global mean value in equatorial regions. [WGI AR5 13.6.5]
• More likely than not substantial increase in the frequency of the most intense tropical cyclones in the western North Pacifi c and North Atlantic. [WGI AR5 14.6]
Description
T
raditional technologies and skills can be relevant for climate adaptation in small island contexts. In the Solomon Islands, relevant traditional practices include
elevating concrete fl oors to keep them dry during heavy precipitation events and building low aerodynamic houses with palm leaves as roofi ng to avoid
h
azards from fl ying debris during cyclones, supported by perceptions that traditional construction methods are more resilient to extreme weather. In Fiji after
Cyclone Ami in 2003, mutual support and risk sharing formed a central pillar for community-based adaptation, with unaffected households fi shing to support
those with damaged homes. Participatory consultations across stakeholders and sectors within communities and capacity building taking into account
t
raditional practices can be vital to the success of adaptation initiatives in island communities, such as in Fiji or Samoa. [29.6.2]
Broader context
• Perceptions of self-effi cacy and adaptive capacity in addressing climate stress can be important in determining resilience and identifying useful solutions.
•
T
he relevance of community-based adaptation principles to island communities, as a facilitating factor in adaptation planning and implementation, has
been highlighted, for example, with focus on empowerment and learning-by-doing, while addressing local priorities and building on local knowledge and
capacity. Community-based adaptation can include measures that cut across sectors and technological, social, and institutional processes, recognizing that
technology by itself is only one component of successful adaptation.
[5.5.4, 29.6.2]
Adaptive approaches to fl ood defense in Europe
Exposure and vulnerability
Increased exposure of persons and property in fl ood risk areas has contributed to increased damages from fl ood events over recent decades.
[5.4.3, 5.4.4, 5.5.5, 23.3.1, Box 5-1]
Climate information at the
global scale
Observed:
• Likely increase in the magnitude of extreme high sea level events since 1970, mostly explained by rising mean sea level. [WGI AR5 3.7.5]
• Since 1950 the number of heavy precipitation events over land has likely increased in more regions than it has decreased. [WGI AR5 2.6.2]
Projected:
• Very likely that the time-mean rate of global mean sea level rise during the 21st century will exceed the rate observed during 1971–2010 for all RCP
scenarios. [WGI AR5 13.5.1]
• Globally, for short-duration precipitation events, likely shift to more intense individual storms and fewer weak storms. [WGI AR5 12.4.5]
Climate information at the
regional scale
Observed:
• Likely increase in the frequency or intensity of heavy precipitation in Europe, with some seasonal and/or regional variations. [WGI AR5 2.6.2]
• Increase in heavy precipitation in winter since the 1950s in some areas of northern Europe (medium confi dence). Increase in heavy precipitation since the
1950s in some parts of west-central Europe and European Russia, especially in winter (medium confi dence). [SREX Table 3-2]
• Increasing mean sea level with regional variations, except in the Baltic Sea where the relative sea level is decreasing due to vertical crustal motion. [5.3.2,
23.2.2]
Projected:
• Over most of the mid-latitude land masses, extreme precipitation events will very likely be more intense and more frequent in a warmer world. [WGI AR5
12.4.5]
• Overall precipitation increase in northern Europe and decrease in southern Europe (medium confi dence). [23.2.2]
• Increased extreme precipitation in northern Europe during all seasons, particularly winter, and in central Europe except in summer (high confi dence).
[23.2.2; SREX Table 3-3]
Description
Several governments have made ambitious efforts to address fl ood risk and sea level rise over the coming century. In the Netherlands, government
recommendations include “soft” measures preserving land from development to accommodate increased river inundation; maintaining coastal protection
through beach nourishment; and ensuring necessary political-administrative, legal, and fi nancial resources. Through a multi-stage process, the British
government has also developed extensive adaptation plans to adjust and improve fl ood defenses to protect London from future storm surges and river
fl ooding. Pathways have been analyzed for different adaptation options and decisions, depending on eventual sea level rise, with ongoing monitoring of the
drivers of risk informing decisions.
[5.5.4, 23.7.1, Box 5-1]
Broader context
• The Dutch plan is considered a paradigm shift, addressing coastal protection by “working with nature” and providing “room for river.”
• The British plan incorporates iterative, adaptive decisions depending on the eventual sea level rise with numerous and diverse measures possible over the
next 50 to 100 years to reduce risk to acceptable levels.
• In cities in Europe and elsewhere, the importance of strong political leadership or government champions in driving successful adaptation action has been
noted.
[5.5.3, 5.5.4, 8.4.3, 23.7.1, 23.7.2, 23.7.4, Boxes 5-1 and 26-3]
Table TS.2 (continued)

54
Technical Summary
TS
for sea level rise has evolved considerably over the past 2 decades
and shows a diversity of approaches, although its implementation
remains piecemeal (high confidence). Adaptive capacity is generally
high in many human systems, but implementation faces major
constraints especially for transformational responses at local and
community levels. [25.4, 25.10, Table 25-2, Boxes 25-1, 25-2, and
25-9]
• In North America, governments are engaging in incremental
adaptation assessment and planning, particularly at the municipal
level (high confidence). Some proactive adaptation is occurring to
protect longer-term investments in energy and public infrastructure.
[26.7 to 26.9]
• In Central and South America, ecosystem-based adaptation including
protected areas, conservation agreements, and community
management of natural areas is occurring (high confidence).
Resilient crop varieties, climate forecasts, and integrated water
resources management are being adopted within the agricultural
sector in some areas. [27.3]
• In the Arctic, some communities have begun to deploy adaptive co-
management strategies and communications infrastructure,
combining traditional and scientific knowledge (high confidence).
[28.2, 28.4]
• In small islands, which have diverse physical and human attributes,
community-based adaptation has been shown to generate larger
benefits when delivered in conjunction with other development
activities (high confidence). [29.3, 29.6, Table 29-3, Figure 29-1]
• In both the open ocean and coastal areas, international cooperation
and marine spatial planning are starting to facilitate adaptation to
climate change, with constraints from challenges of spatial scale and
governance issues (high confidence). Observed coastal adaptation
includes major projects (e.g., Thames Estuary, Venice Lagoon, Delta
Works) and specific practices in some countries (e.g., Netherlands,
Australia, Bangladesh). [5.5, 7.3, 15.4, 30.6, Box CC-EA]
Table TS.2 presents examples of how climate extremes and
change, as well as exposure and vulnerability at the scale of
risk management, shape adaptation actions and approaches to
reducing vulnerability and enhancing resilience.
A-3. The Decision-making Context
Climate variability and extremes have long been important in many
decision-making contexts. Climate-related risks are now evolving over
Continued next page
Index-based insurance for agriculture in Africa
Exposure and vulnerability
Susceptibility to food insecurity and depletion of farmers’ productive assets following crop failure. Low prevalence of insurance due to absent or poorly
d
eveloped insurance markets or to amount of premium payments. The most marginalized and resource-poor especially may have limited ability to afford
insurance premiums.
[
10.7.6, 13.3.2, Box 22-1]
Climate information at the
global scale
O
bserved:
• Very likely decrease in the number of cold days and nights and increase in the number of warm days and nights, on the global scale between 1951 and
2
010. [WGI AR5 2.6.1]
• Medium confi dence that the length and frequency of warm spells, including heat waves, has increased globally since 1950. [WGI AR5 2.6.1]
•
S
ince 1950 the number of heavy precipitation events over land has likely increased in more regions than it has decreased. [WGI AR5 2.6.2]
• Low confi dence in a global-scale observed trend in drought or dryness (lack of rainfall). [WGI AR5 2.6.2]
P
rojected:
• Virtually certain that, in most places, there will be more hot and fewer cold temperature extremes as global mean temperatures increase, for events defi ned
a
s extremes on both daily and seasonal time scales. [WGI AR5 12.4.3]
• Regional to global-scale projected decreases in soil moisture and increased risk of agricultural drought are likely in presently dry regions, and are projected
with medium confi dence by the end of this century under the RCP8.5 scenario. [WGI AR5 12.4.5]
•
G
lobally, for short-duration precipitation events, likely shift to more intense individual storms and fewer weak storms. [WGI AR5 12.4.5]
Climate information at the
regional scale
Observed:
•
M
edium confi dence in increase in frequency of warm days and decrease in frequency of cold days and nights in southern Africa. [SREX Table 3-2]
• Medium confi dence in increase in frequency of warm nights in northern and southern Africa. [SREX Table 3-2]
P
rojected:
• Likely surface drying in southern Africa by the end of the 21st century under RCP8.5 (high confi dence). [WGI AR5 12.4.5]
•
L
ikely increase in warm days and nights and decrease in cold days and nights in all regions of Africa (high confi dence). Increase in warm days largest in
summer and fall (medium confi dence). [SREX Table 3-3]
• Likely more frequent and/or longer heat waves and warm spells in Africa (high confi dence). [SREX Table 3-3]
Description
A
recently introduced mechanism that has been piloted in a number of rural locations, including in Malawi, Sudan, and Ethiopia, as well as in India. When
physical conditions reach a particular predetermined threshold where signifi cant losses are expected to occur—weather conditions such as excessively high
o
r low cumulative rainfall or temperature peaks—the insurance pays out.
[9.4.2, 13.3.2, 15.4.4, Box 22-1]
Broader context
• Index-based weather insurance is considered well suited to the agricultural sector in developing countries.
• The mechanism allows risk to be shared across communities, with costs spread over time, while overcoming obstacles to traditional agricultural and disaster
insurance markets. It can be integrated with other strategies such as microfi nance and social protection programs.
• Risk-based premiums can help encourage adaptive responses and foster risk awareness and risk reduction by providing fi nancial incentives to policyholders
to reduce their risk profi le.
• Challenges can be associated with limited availability of accurate weather data and diffi culties in establishing which weather conditions cause losses.
Basis risk (i.e., farmers suffer losses but no payout is triggered based on weather data) can promote distrust. There can also be diffi culty in scaling up pilot
schemes.
• Insurance for work programs can enable cash-poor farmers to work for insurance premiums by engaging in community-identifi ed disaster risk reduction
projects.
[10.7.4 to 10.7.6, 13.3.2, 15.4.4, Table 10-7, Boxes 22-1 and 25-7]
Table TS.2 (continued)

55
Technical Summary
TS
time due to both climate change and development. This section builds
from existing experience with decision making and risk management.
It creates a foundation for understanding the report’s assessment of
future climate-related risks and potential responses.
Responding to climate-related risks involves decision making in
a changing world, with continuing uncertainty about the severity
and timing of climate-change impacts and with limits to the
effectiveness of adaptation (high confidence).
Iterative risk
management is a useful framework for decision making in complex
situations characterized by large potential consequences, persistent
uncertainties, long timeframes, potential for learning, and multiple
climatic and non-climatic influences changing over time. See Figure TS.4.
Assessment of the widest possible range of potential impacts, including
low-probability outcomes with large consequences, is central to
understanding the benefits and trade-offs of alternative risk management
actions. The complexity of adaptation actions across scales and contexts
means that monitoring and learning are important components of
effective adaptation. [2.1 to 2.4, 3.6, 14.1 to 14.3, 15.2 to 15.4, 16.2 to
16.4, 17.1 to 17.3, 17.5, 20.6, 22.4, 25.4, Figure 1-5]
Adaptation and mitigation choices in the near term will affect
the risks of climate change throughout the 21st century (high
confidence).
Figure TS.5 illustrates projected climate futures under a
low-emission mitigation scenario and a high-emission scenario
[Representative Concentration Pathways (RCPs) 2.6 and 8.5], along
with observed temperature and precipitation changes. The benefits of
adaptation and mitigation occur over different but overlapping
timeframes. Projected global temperature increase over the next few
decades is similar across emission scenarios (Figure TS.5A, middle panel)
(WGI AR5 Section 11.3). During this near-term era of committed climate
change, risks will evolve as socioeconomic trends interact with the
changing climate. Societal responses, particularly adaptations, will
influence near-term outcomes. In the second half of the 21st century
and beyond, global temperature increase diverges across emission
scenarios (Figure TS.5A, middle and bottom panels) (WGI AR5 Section
12.4 and Table SPM.2). For this longer-term era of climate options, near-
term and longer-term adaptation and mitigation, as well as development
pathways, will determine the risks of climate change. [2.5, 21.2, 21.3,
21.5, Box CC-RC]
Assessment of risks in the WGII AR5 relies on diverse forms of
evidence. Expert judgment is used to integrate evidence into
evaluations of risks.
Forms of evidence include, for example, empirical
observations, experimental results, process-based understanding,
statistical approaches, and simulation and descriptive models. Future
Relocation of agricultural industries in Australia
Exposure and vulnerability
Crops sensitive to changing patterns of temperature, rainfall, and water availability. [7.3, 7.5.2]
Climate information at the
global scale
Observed:
•
V
ery likely decrease in the number of cold days and nights and increase in the number of warm days and nights, on the global scale between 1951 and
2010. [WGI AR5 2.6.1]
•
M
edium confi dence that the length and frequency of warm spells, including heat waves, has increased globally since 1950. [WGI AR5 2.6.1]
•
M
edium confi dence in precipitation change over global land areas since 1950. [WGI AR5 2.5.1]
• Since 1950 the number of heavy precipitation events over land has likely increased in more regions than it has decreased. [WGI AR5 2.6.2]
•
L
ow confi dence in a global-scale observed trend in drought or dryness (lack of rainfall). [WGI AR5 2.6.2]
P
rojected:
•
V
irtually certain that, in most places, there will be more hot and fewer cold temperature extremes as global mean temperatures increase, for events defi ned
as extremes on both daily and seasonal time scales. [WGI AR5 12.4.3]
•
V
irtually certain increase in global precipitation as global mean surface temperature increases. [WGI AR5 12.4.1]
• Regional to global-scale projected decreases in soil moisture and increased risk of agricultural drought are likely in presently dry regions, and are projected
w
ith medium confi dence by the end of this century under the RCP8.5 scenario. [WGI AR5 12.4.5]
• Globally, for short-duration precipitation events, likely shift to more intense individual storms and fewer weak storms. [WGI AR5 12.4.5]
Climate information at the
regional scale
Observed:
•
C
ool extremes rarer and hot extremes more frequent and intense over Australia and New Zealand, since 1950 (high confi dence). [Table 25-1]
• Likely increase in heat wave frequency since 1950 in large parts of Australia. [WGI AR5 2.6.1]
•
L
ate autumn/winter decreases in precipitation in southwestern Australia since the 1970s and southeastern Australia since the mid-1990s, and annual
increases in precipitation in northwestern Australia since the 1950s (very high confi dence). [Table 25-1]
•
M
ixed or insignifi cant trends in annual daily precipitation extremes, but a tendency to signifi cant increase in annual intensity of heavy precipitation in
recent decades for sub-daily events in Australia (high confi dence). [Table 25-1]
P
rojected:
• Hot days and nights more frequent and cold days and nights less frequent during the 21st century in Australia and New Zealand (high confi dence). [Table
25-1]
•
A
nnual decline in precipitation over southwestern Australia (high confi dence) and elsewhere in southern Australia (medium confi dence). Reductions
strongest in the winter half-year (high confi dence). [Table 25-1]
•
I
ncrease in most regions in the intensity of rare daily rainfall extremes and in sub-daily extremes (medium confi dence) in Australia and New Zealand. [Table
25-1]
• Drought occurrence to increase in southern Australia (medium confi dence). [Table 25-1]
• Snow depth and snow area to decline in Australia (very high confi dence). [Table 25-1]
• Freshwater resources projected to decline in far southeastern and far southwestern Australia (high confi dence). [25.5.2]
Description
Industries and individual farmers are relocating parts of their operations, for example for rice, wine, or peanuts in Australia, or are changing land use in situ
in response to recent climate change or expectations of future change. For example, there has been some switching from grazing to cropping in southern
Australia. Adaptive movement of crops has also occurred elsewhere.
[7.5.1, 25.7.2, Table 9-7, Box 25-5]
Broader context
• Considered transformational adaptation in response to impacts of climate change.
• Positive or negative implications for the wider communities in origin and destination regions.
[25.7.2, Box 25-5]
Table TS.2 (continued)
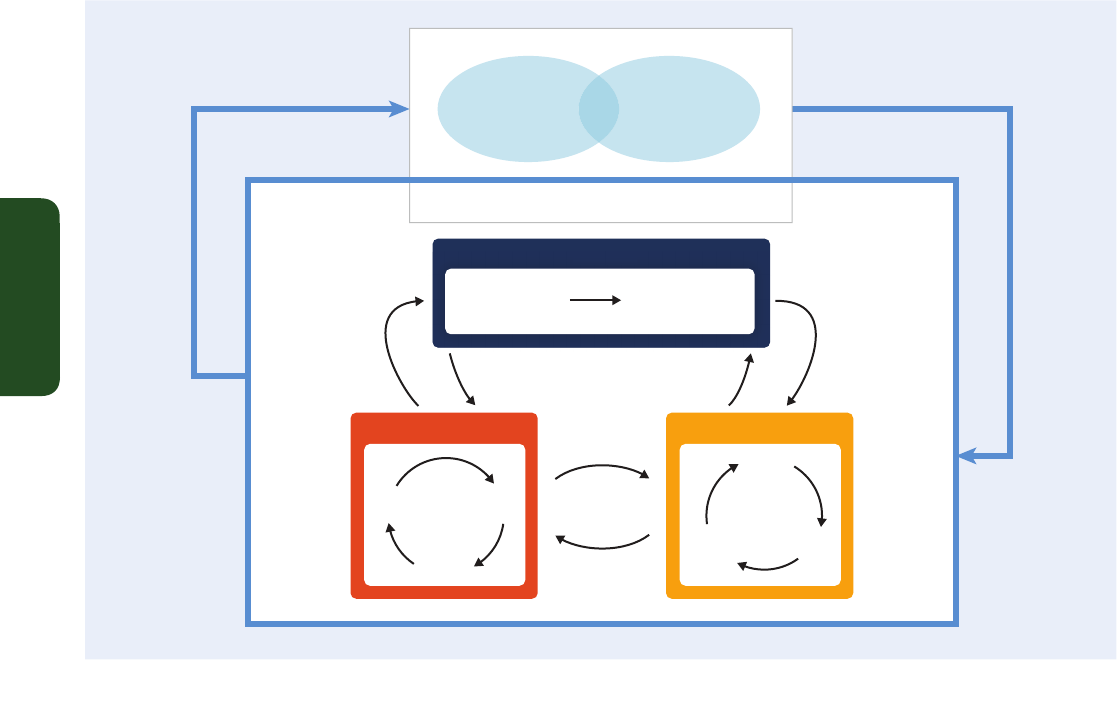
56
Technical Summary
TS
risks related to climate change vary substantially across plausible
alternative development pathways, and the relative importance of
development and climate change varies by sector, region, and time
period (high confidence). Scenarios are useful tools for characterizing
possible future socioeconomic pathways, climate change and its
risks, and policy implications. Climate-model projections informing
evaluations of risks in this report are generally based on the RCPs
(Figure TS.5), as well as the older IPCC Special Report on Emissions
Scenarios (SRES) scenarios. [1.1, 1.3, 2.2, 2.3, 19.6, 20.2, 21.3, 21.5, 26.2,
Box CC-RC; WGI AR5 Box SPM.1]
Scenarios can be divided into those that explore how futures
may unfold under various drivers (problem exploration) and
those that test how various interventions may play out (solution
exploration) (robust evidence, high agreement).
Adaptation
approaches address uncertainties associated with future climate and
socioeconomic conditions and with the diversity of specific contexts
(medium evidence, high agreement). Although many national studies
identify a variety of strategies and approaches for adaptation, they can
be classified into two broad categories: “top-down” and “bottom-up”
approaches. The top-down approach is a scenario-impact approach,
consisting of downscaled climate projections, impact assessments, and
formulation of strategies and options. The bottom-up approach is a
vulnerability-threshold approach, starting with the identification of
vulnerabilities, sensitivities, and thresholds for specific sectors or
communities. Iterative assessments of impacts and adaptation in the top-
down approach and building adaptive capacity of local communities
are typical strategies for responding to uncertainties. [2.2, 2.3, 15.3]
Uncertainties about future vulnerability, exposure, and responses
of interlinked human and natural systems are large (high
confidence). This motivates exploration of a wide range of
socioeconomic futures in assessments of risks.
Understanding
future vulnerability, exposure, and response capacity of interlinked human
and natural systems is challenging due to the number of interacting
social, economic, and cultural factors, which have been incompletely
considered to date. These factors include wealth and its distribution
across society, demographics, migration, access to technology and
information, employment patterns, the quality of adaptive responses,
societal values, governance structures, and institutions to resolve
conflicts. International dimensions such as trade and relations among
states are also important for understanding the risks of climate change
at regional scales. [11.3, 12.6, 21.3 to 21.5, 25.3, 25.4, 25.11, 26.2]
Knowledge
Context
People
Deliberative Process
Scoping
Implementation
Review
& learn
Implement
decision
Monitor
Assess
risks
Identify
options
Evaluate
tradeoffs
Analysis
Sc
op
p
p
in
g
g
g
Identify risks,
vulnerabilities,
& objectives
Establish decision-
making criteria
Figure TS.4 | Climate-change adaptation as an iterative risk management process with multiple feedbacks. People and knowledge shape the process and its outcomes. [Figure 2-1]
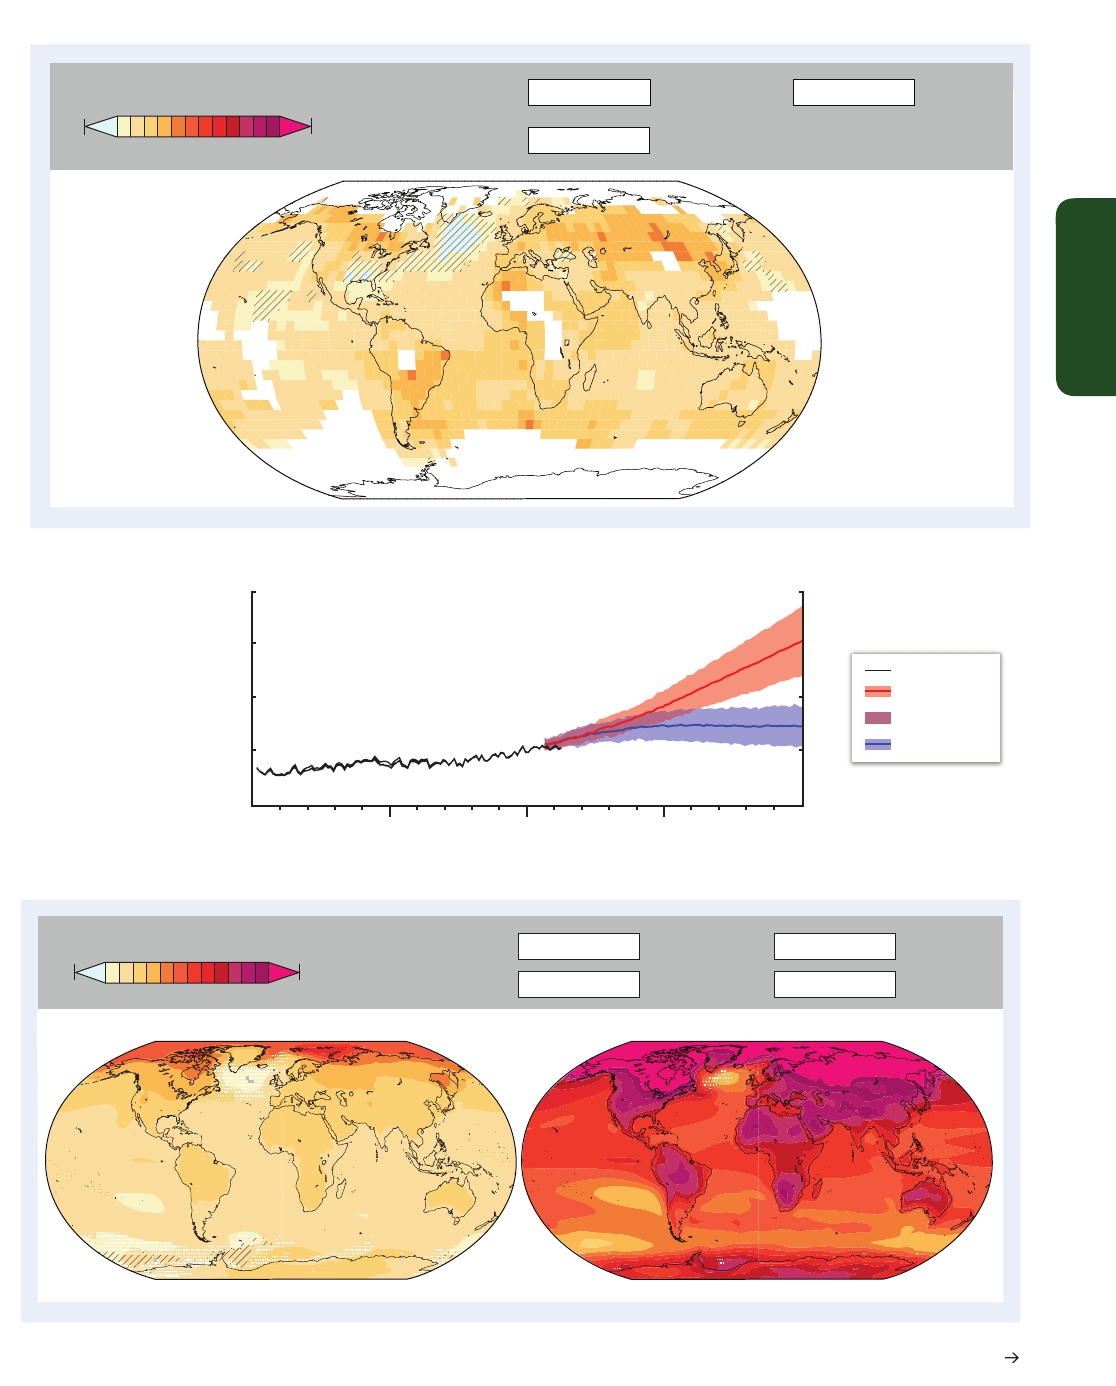
57
Technical Summary
TS
Difference from
1986–2005 mean (
˚
C)
Observed Temperature Change
Based on trend over
1901–2012 (
˚
C over period)
D
iagonal Lines
Trend not
statistically
significant
W
hite
I
nsufficient
data
Solid Color
Significant
trend
Projected Temperature Change
02 46
–
0.5 11.7
02 46
–0.5 11.7
Solid Color
Strong
agreement
Very strong
agreement
Little or
no change
Gray
Divergent
changes
Diagonal Lines
White Dots
(A)
RCP8.5 2081–2100RCP2.6 2081–2100
Global mean temperature change
(
˚
C relative to 1986–2005)
Observed
RCP2.6
RCP8.5
Overlap
1900 1950 2000 2050 2100
6
4
2
0
–2
Difference from
1986–2005 mean (
˚
C)
Continued next page
Figure TS.5
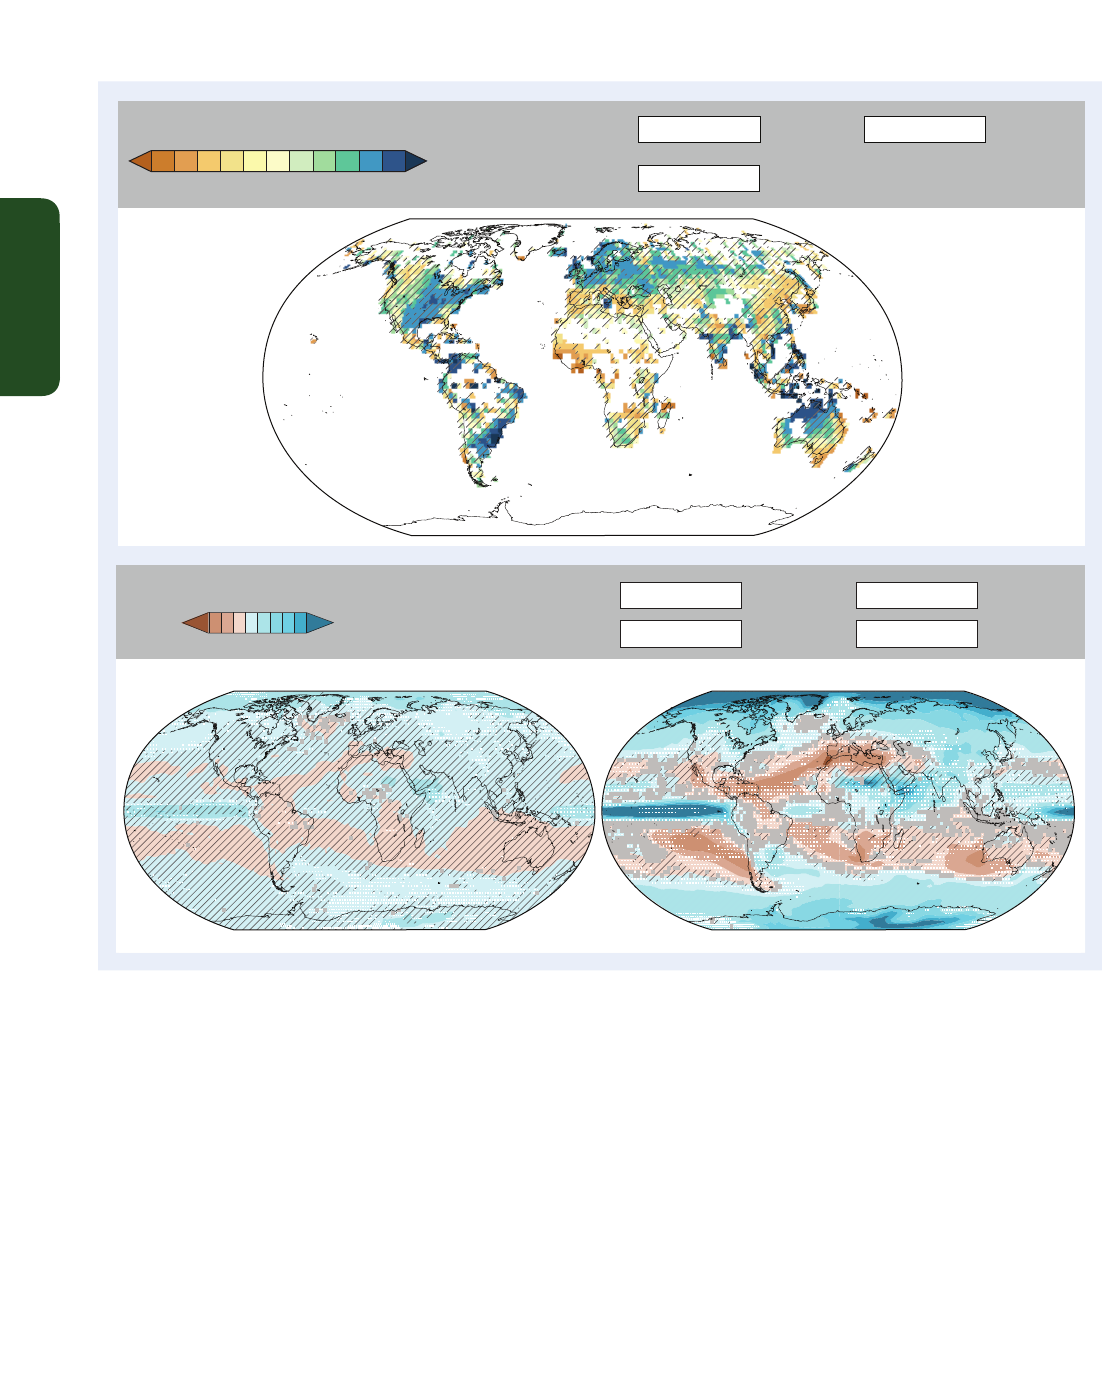
58
Technical Summary
TS
Diagonal Lines
Trend not
statistically
significant
White
Insufficient
data
Solid Color
Significant
trend
Observed Precipitation Change
Projected Precipitation Change
–5 0
5
2510
2.5
–2.5 50–10–50 –25–100
T
rend over 1951–2010
(
mm/year per decade)
Solid Color
Strong
agreement
Very strong
agreement
Little or
no change
Gray
Divergent
changes
Diagonal Lines
White Dots
(B)
Difference from
1986–2005 mean (%)
–
20 0 20 40
Figure TS.5 | Observed and projected changes in annual average surface temperature (A) and precipitation (B). This figure informs understanding of climate-related risks in the WGII
AR5. It illustrates changes observed to date and projected changes under continued high emissions and under ambitious mitigation.
Technical details: (A, top panel) Map of observed annual mean temperature change from 1901–2012, derived from a linear trend. Observed data (range of grid-point values: –0.53
to 2.50°C over period) are from WGI AR5 Figures SPM.1 and 2.21. (B, top panel) Map of observed annual precipitation change from 1951–2010, derived from a linear trend.
Observed data (range of grid-point values: –185 to 111 mm/year per decade) are from WGI AR5 Figures SPM.2 and 2.29. For observed temperature and precipitation, trends have
been calculated where sufficient data permit a robust estimate (i.e., only for grid boxes with greater than 70% complete records and more than 20% data availability in the first and
last 10% of the time period). Other areas are white. Solid colors indicate areas where trends are significant at the 10% level. Diagonal lines indicate areas where trends are not
significant. (A, middle panel) Observed and projected future global annual mean temperature relative to 1986–2005. Observed warming from 1850–1900 to 1986–2005 is 0.61°C
(5–95% confidence interval: 0.55 to 0.67°C). Black lines show temperature estimates from three datasets. Blue and red lines and shading denote the ensemble mean and ±1.64
standard deviation range, based on Coupled Model Intercomparison Project Phase 5 (CMIP5) simulations from 32 models for RCP2.6 and 39 models for RCP8.5. (A and B, bottom
panel) CMIP5 multi-model mean projections of annual mean temperature changes (A) and mean percent changes in annual mean precipitation (B) for 2081–2100 under RCP2.6 and
8.5, relative to 1986–2005. Solid colors indicate areas with very strong agreement, where the multi-model mean change is greater than twice the baseline variability (natural internal
variability in 20-yr means) and ≥90% of models agree on sign of change. Colors with white dots indicate areas with strong agreement, where ≥66% of models show change greater
than the baseline variability and ≥66% of models agree on sign of change. Gray indicates areas with divergent changes, where ≥66% of models show change greater than the
baseline variability, but <66% agree on sign of change. Colors with diagonal lines indicate areas with little or no change, where <66% of models show change greater than the
baseline variability, although there may be significant change at shorter timescales such as seasons, months, or days. For temperature projections, analysis uses model data (range of
grid-point values across RCP2.6 and 8.5: 0.06 to 11.71°C) from WGI AR5 Figure SPM.8. For precipitation projections, analysis uses model data (range of grid-point values: –9 to 22%
for RCP2.6 and –34 to 112% for RCP8.5) from WGI AR5 Figure SPM.8, Box 12.1, and Annex I. For a full description of methods, see Box CC-RC. See also Annex I of WGI AR5. [Boxes
21-2 and CC-RC; WGI AR5 2.4 and 2.5, Figures SPM.1, SPM.2, SPM.7, SPM.8, 2.21, and 2.29]
Figure TS.5 (continued)
RCP8.5 2081–2100RCP2.6 2081–2100

59
Technical Summary
TS
B: FUTURE RISKS AND
OPPORTUNITIES FOR ADAPTATION
This section presents future risks and more limited potential benefits
across sectors and regions, examining how they are affected by the
magnitude and rate of climate change and by socioeconomic choices.
It also assesses opportunities for reducing impacts and managing risks
through adaptation and mitigation. The section examines the distribution
of risks across populations with contrasting vulnerability and adaptive
capacity, across sectors where metrics for quantifying impacts may be
quite different, and across regions with varying traditions and resources.
The assessment features interactions across sectors and regions and
among climate change and other stressors. For different sectors and
regions, the section describes risks and potential benefits over the next
few decades, the near-term era of committed climate change. Over this
timeframe, projected global temperature increase is similar across
emission scenarios. The section also provides information on risks and
potential benefits in the second half of the 21st century and beyond,
the longer-term era of climate options. Over this longer term, global
temperature increase diverges across emission scenarios, and the
assessment distinguishes potential outcomes for 2°C and 4°C global mean
temperature increase above preindustrial levels. The section elucidates
how and when choices matter in reducing future risks, highlighting the
differing timeframes for mitigation and adaptation benefits.
B-1. Key Risks across Sectors and Regions
Key risks are potentially severe impacts relevant to Article 2 of the UN
Framework Convention on Climate Change, which refers to “dangerous
anthropogenic interference with the climate system.” Risks are considered
key due to high hazard or high vulnerability of societies and systems
exposed, or both. Identification of key risks was based on expert judgment
using the following specific criteria: large magnitude, high probability,
or irreversibility of impacts; timing of impacts; persistent vulnerability
or exposure contributing to risks; or limited potential to reduce risks
through adaptation or mitigation. Key risks are integrated into five
complementary and overarching reasons for concern (RFCs) in Box TS.5.
The key risks that follow, all of which are identified with high
confidence, span sectors and regions. Each of these key risks
contributes to one or more RFCs.
Roman numerals correspond to
entries in Table TS.3, which further illustrates relevant examples and
interactions. [19.2 to 19.4, 19.6, Table 19-4, Boxes 19-2 and CC-KR]
i) Risk of death, injury, ill-health, or disrupted livelihoods in low-lying
coastal zones and small island developing states and other small
islands, due to storm surges, coastal flooding, and sea level rise.
See RFCs 1 to 5. [5.4, 8.2, 13.2, 19.2 to 19.4, 19.6, 19.7, 24.4, 24.5,
26.7, 26.8, 29.3, 30.3, Tables 19-4 and 26-1, Figure 26-2, Boxes
25-1, 25-7, and CC-KR]
No. Hazard Key vulnerabilities Key risks Emergent risks
i Sea level rise and coastal
fl ooding including storm surges
[5.4.3, 8.1.4, 8.2.3, 8.2.4,
13.1.4, 13.2.2, 24.4, 24.5, 26.7,
26.8, 29.3, 30.3.1, Boxes 25-1
and 25-7; WGI AR5 3.7, 13.5,
Table 13-5]
High exposure of people, economic activity, and
in frastructure in low-lying coastal zones and Small
Island Developing States (SIDS) and other small
islands
Death, injury, and disruption to
livelihoods, food supplies, and
drinking water
Loss of common-pool resources,
sense of place, and identity,
especially among indigenous
populations in rural coastal zones
Interaction of rapid urbanization, sea
level rise, increasing economic activity,
disappearance of natural resources,
and limits of insurance; burden of risk
management shifted from the state to
those at risk leading to greater inequality
Urban population unprotected due to substandard
housing and inadequate insurance. Marginalized
rural population with multidimensional poverty
and limited alternative livelihoods
Insuffi cient local governmental attention to
disaster risk reduction
ii Extreme precipitation and
inland fl ooding
[3.2.7, 3.4.8, 8.2.3, 8.2.4,
13.2.1, 25.10, 26.3, 26.7, 26.8,
27.3.5, Box 25-8; WGI AR5
11.3.2]
Large numbers of people exposed in urban
areas to fl ood events, particularly in low-income
informal settlements
Death, injury, and disruption of
human security, especially among
children, elderly, and disabled
persons
Interaction of increasing frequency of
intense precipitation, urbanization,
and limits of insurance; burden of risk
management shifted from the state to
those at risk leading to greater inequality,
eroded assets due to infrastructure
damage, abandonment of urban districts,
and the creation of high risk / high poverty
spatial traps
Overwhelmed, aging, poorly maintained, and
inadequate urban drainage infrastructure
and limited ability to cope and adapt due to
marginalization, high poverty, and culturally
imposed gender roles
Inadequate governmental attention to disaster
risk reduction
iii Novel hazards yielding
systemic risks
[8.1.4, 8.2.4, 10.2, 10.3, 12.6,
23.9, 25.10, 26.7, 26.8; WGI
AR5 11.3.2]
Populations and infrastructure exposed and
lacking historical experience with these hazards
Failure of systems coupled to
electric power system, e.g., drainage
systems reliant on electric pumps
or emergency services reliant on
telecommunications. Collapse of
health and emergency services in
extreme events
Interactions due to dependence on
coupled systems lead to magnifi cation
of impacts of extreme events. Reduced
social cohesion due to loss of faith in
management institutions undermines
preparation and capacity for response.
Overly hazard-specifi c management planning
and infrastructure design, and/or low forecasting
capability
iv Increasing frequency and
intensity of extreme heat,
including urban heat island
effect
[8.2.3, 11.3, 11.4.1, 13.2, 23.5.1,
24.4.6, 25.8.1, 26.6, 26.8, Box
CC-HS; WGI AR5 11.3.2]
Increasing urban population of the elderly, the
very young, expectant mothers, and people with
chronic health problems in settlements subject to
higher temperatures
Increased mortality and morbidity
during periods of extreme heat
Interaction of demographic shifts with
changes in regional temperature extremes,
local heat island, and air pollution
Overloading of health and emergency
services. Higher mortality, morbidity, and
productivity loss among manual workers
in hot climates
Inability of local organizations that provide health,
emergency, and social services to adapt to new
risk levels for vulnerable groups
Table TS.3 | A selection of the hazards, key vulnerabilities, key risks, and emergent risks identifi ed in chapters of this report. The examples underscore the complexity of risks
determined by various interacting climate-related hazards, non-climatic stressors, and multifaceted vulnerabilities (see also Figure TS.1). Vulnerabilities identifi ed as key arise when
exposure to hazards combines with social, institutional, economic, or environmental vulnerability, as indicated by icons in the table. Emergent risks arise from complex system
interactions. Roman numerals correspond with key risks listed in Section B-1. [19.6, Table 19-4]
60
Technical Summary
TS
ii) Risk of severe ill-health and disrupted livelihoods for large urban
populations due to inland flooding in some regions. See RFCs 2 and
3. [3.4, 3.5, 8.2, 13.2, 19.6, 25.10, 26.3, 26.8, 27.3, Tables 19-4 and
26-1, Boxes 25-8 and CC-KR]
iii) Systemic risks due to extreme weather events leading to breakdown
of infrastructure networks and critical services such as electricity,
water supply, and health and emergency services. See RFCs 2 to 4.
[5.4, 8.1, 8.2, 9.3, 10.2, 10.3, 12.6, 19.6, 23.9, 25.10, 26.7, 26.8,
28.3, Table 19-4, Boxes CC-KR and CC-HS]
iv) Risk of mortality and morbidity during periods of extreme heat,
particularly for vulnerable urban populations and those working
outdoors in urban or rural areas. See RFCs 2 and 3. [8.1, 8.2, 11.3,
11.4, 11.6, 13.2, 19.3, 19.6, 23.5, 24.4, 25.8, 26.6, 26.8, Tables 19-4
and 26-1, Boxes CC-KR and CC-HS]
v) Risk of food insecurity and the breakdown of food systems linked
to warming, drought, flooding, and precipitation variability and
extremes, particularly for poorer populations in urban and rural
settings. See RFCs 2 to 4. [3.5, 7.4, 7.5, 8.2, 8.3, 9.3, 11.3, 11.6,
13.2, 19.3, 19.4, 19.6, 22.3, 24.4, 25.5, 25.7, 26.5, 26.8, 27.3, 28.2,
28.4, Table 19-4, Box CC-KR]
vi) Risk of loss of rural livelihoods and income due to insufficient
access to drinking and irrigation water and reduced agricultural
productivity, particularly for farmers and pastoralists with minimal
capital in semi-arid regions. See RFCs 2 and 3. [3.4, 3.5, 9.3, 12.2,
13.2, 19.3, 19.6, 24.4, 25.7, 26.8, Table 19-4, Boxes 25-5 and CC-KR]
vii) Risk of loss of marine and coastal ecosystems, biodiversity, and the
ecosystem goods, functions, and services they provide for coastal
livelihoods, especially for fishing communities in the tropics and the
No. Hazard Key vulnerabilities Key risks Emergent risks
v
Warming, drought, and
precipitation variability
[
7.3 to 7.5, 11.3, 11.6.1, 13.2,
19.3.2, 19.4.1, 22.3.4, 24.4,
2
6.8, 27.3.4; WGI AR5 11.3.2]
P
oorer populations in urban and rural settings are
susceptible to resulting food insecurity; includes
p
articularly farmers who are net food buyers and
p
eople in low-income, agriculturally dependent
economies that are net food importers. Limited
a
bility to cope among the elderly and female-
headed households
R
isk of harm and loss of life due
to reversal of progress in reducing
m
alnutrition
I
nteractions of climate changes,
population growth, reduced productivity,
b
iofuel crop cultivation, and food prices
w
ith persistent inequality, and ongoing
food insecurity for the poor increase
m
alnutrition, giving rise to larger burden
of disease. Exhaustion of social networks
r
educes coping capacity.
vi Drought
[
3.2.7, 3.4.8, 3.5.1, 8.2.3, 8.2.4,
9.3.3, 9.3.5, 13.2.1, 19.3.2,
2
4.4, 25.7, Box 25-5; WGI AR5
12.4.1, 12.4.5]
Urban populations with inadequate water services.
E
xisting water shortages (and irregular supplies),
and constraints on increasing supplies
Insuffi cient water supply for people
a
nd industry yielding severe harm
and economic impacts
Interaction of urbanization, infrastructure
i
nsuffi ciency, groundwater depletion
Lack of capacity and resilience in water
m
anagement regimes including rural–urban
linkages
Poorly endowed farmers in drylands or pastoralists
w
ith insuffi cient access to drinking and irrigation
water
Loss of agricultural productivity
a
nd/or income of rural people.
Destruction of livelihoods particularly
f
or those depending on water-
intensive agriculture. Risk of food
i
nsecurity
Interactions across human vulnerabilities:
d
eteriorating livelihoods, poverty traps,
heightened food insecurity, decreased
l
and productivity, rural outmigration, and
increase in new urban poor in developing
c
ountries. Potential tipping point in rain-
fed farming system and /or pastoralism
L
imited ability to compensate for losses in water-
dependent farming and pastoral systems, and
c
onfl ict over natural resources
Lack of capacity and resilience in water
management regimes, inappropriate land policy,
a
nd misperception and undermining of pastoral
livelihoods
v
ii Rising ocean temperature,
ocean acidifi cation, and loss of
A
rctic sea ice
[5.4.2, 6.3.1, 6.3.2, 7.4.2, 9.3.5,
22.3.2, 24.4, 25.6, 27.3.3, 28.2,
28.3, 29.3.1, 30.5, 30.6, Boxes
CC-OA and CC-CR; WGI AR5
11.3.3]
H
igh susceptibility of warm-water coral reefs
and respective ecosystem services for coastal
c
ommunities; high susceptibility of polar systems,
e.g., to invasive species
L
oss of coral cover, Arctic species, and
associated ecosystems with reduction
o
f biodiversity and potential losses
of important ecosystem services. Risk
of loss of endemic species, mixing
of ecosystem types, and increased
dominance of invasive organisms
I
nteractions of stressors such as
acidifi cation and warming on calcareous
o
rganisms enhancing risk
Susceptibility of coastal and SIDS fi shing
communities depending on these ecosystem
services; and of Arctic settlements and culture
viii Rising land temperatures,
and changes in precipitation
patterns and in frequency and
intensity of extreme heat
[4.3.4, 19.3.2, 22.4.5, 27.3,
Boxes 23-1 and CC-WE; WGI
AR5 11.3.2]
Susceptibility of human systems, agro-ecosystems,
and natural ecosystems to (1) loss of regulation
of pests and diseases, fi re, landslide, erosion,
fl ooding, avalanche, water quality, and local
climate; (2) loss of provision of food, livestock,
fi ber, and bioenergy; (3) loss of recreation, tourism,
aesthetic and heritage values, and biodiversity
Reduction of biodiversity and
potential losses of important
ecosystem services. Risk of loss of
endemic species, mixing of ecosystem
types, and increased dominance of
invasive organisms
Interaction of social-ecological systems
with loss of ecosystem services on which
they depend
Table TS.3 (continued)
Social
vulnerability
Economic
vulnerability
Environmental
vulnerability
Institutional
vulnerability
Exposure

61
Technical Summary
TS
Box TS.5 | Human Interference with the Climate System
Human influence on the climate system is clear (WGI AR5 SPM Section D.3; WGI AR5 Sections 2.2, 6.3, 10.3 to 10.6, 10.9). Yet
determining whether such influence constitutes “dangerous anthropogenic interference” in the words of Article 2 of the UNFCCC
involves both risk assessment and value judgments. Scientific assessment can characterize risks based on the likelihood, magnitude,
and scope of potential consequences of climate change. Science can also evaluate risks varying spatially and temporally across
alternative development pathways, which affect vulnerability, exposure, and level of climate change. Interpreting the potential danger
of risks, however, also requires value judgments by people with differing goals and worldviews. Judgments about the risks of climate
change depend on the relative importance ascribed to economic versus ecosystem assets, to the present versus the future, and to the
distribution versus aggregation of impacts. From some perspectives, isolated or infrequent impacts from climate change may not rise
to the level of dangerous anthropogenic interference, but accumulation of the same kinds of impacts could, as they become more
widespread, more frequent, or more severe. The rate of climate change can also influence risks. This report assesses risks across
contexts and through time, providing a basis for judgments about the level of climate change at which risks become dangerous.
Five integrative reasons for concern (RFCs) provide a framework for summarizing key risks across sectors and regions.
First identified in the IPCC Third Assessment Report, the RFCs illustrate the implications of warming and of adaptation limits for people,
economies, and ecosystems. They provide one starting point for evaluating dangerous anthropogenic interference with the climate
system. Risks for each RFC, updated based on assessment of the literature and expert judgments, are presented below and in Box
TS.5 Figure 1. All temperatures below are given as global average temperature change relative to 1986–2005 (“recent”).
1
[18.6, 19.6]
1)
Unique and threatened systems: Some unique and threatened systems, including ecosystems and cultures, are already at risk
from climate change (high confidence). The number of such systems at risk of severe consequences is higher with additional
warming of around 1°C. Many species and systems with limited adaptive capacity are subject to very high risks with additional
warming of 2°C, particularly Arctic-sea-ice and coral-reef systems.
2)
Extreme weather events: Climate-change-related risks from extreme events, such as heat waves, extreme precipitation, and
coastal flooding, are already moderate (high confidence) and high with 1°C additional warming (medium confidence). Risks
associated with some types of extreme events (e.g., extreme heat) increase further at higher temperatures (high confidence).
3)
Distribution of impacts: Risks are unevenly distributed and are generally greater for disadvantaged people and communities
in countries at all levels of development. Risks are already moderate because of regionally differentiated climate-change impacts
on crop production in particular (medium to high confidence). Based on projected decreases in regional crop yields and water
availability, risks of unevenly distributed impacts are high for additional warming above 2°C (medium confidence).
4)
Global aggregate impacts: Risks of global aggregate impacts are moderate for additional warming between 1–2°C, reflecting
impacts to both Earth’s biodiversity and the overall global economy (medium confidence). Extensive biodiversity loss with
associated loss of ecosystem goods and services results in high risks around 3°C additional warming (high confidence).
Aggregate economic damages accelerate with increasing temperature (limited evidence, high agreement), but few quantitative
estimates have been completed for additional warming around 3°C or above.
5)
Large-scale singular events: With increasing warming, some physical systems or ecosystems may be at risk of abrupt and
irreversible changes. Risks associated with such tipping points become moderate between 0–1°C additional warming, due to
early warning signs that both warm-water coral reef and Arctic ecosystems are already experiencing irreversible regime shifts
(medium confidence). Risks increase disproportionately as temperature increases between 1–2°C additional warming and
become high above 3°C, due to the potential for a large and irreversible sea level rise from ice sheet loss. For sustained warming
greater than some threshold,
2
near-complete loss of the Greenland ice sheet would occur over a millennium or more, contributing
up to 7 m of global mean sea level rise.
1
Observed warming from 1850–1900 to 1986–2005 is 0.61°C (5–95% confidence interval: 0.55 to 0.67°C). [WGI AR5 2.4]
2
Current estimates indicate that this threshold is greater than about 1°C (low confidence) but less than about 4°C (medium confidence)
sustained global mean warming above preindustrial levels. [WGI AR5 SPM, 5.8, 13.4, 13.5]
Continued next page
62
Technical Summary
TS
Arctic. See RFCs 1, 2, and 4. [5.4, 6.3, 7.4, 9.3, 19.5, 19.6, 22.3, 25.6,
27.3, 28.2, 28.3, 29.3, 30.5 to 30.7, Table 19-4, Boxes CC-OA, CC-CR,
CC-KR, and CC-HS]
viii) Risk of loss of terrestrial and inland water ecosystems, biodiversity,
and the ecosystem goods, functions, and services they provide for
livelihoods. See RFCs 1, 3, and 4. [4.3, 9.3, 19.3 to 19.6, 22.3, 25.6,
27.3, 28.2, 28.3, Table 19-4, Boxes CC-KR and CC-WE]
Many key risks constitute particular challenges for the least developed
countries and vulnerable communities, given their limited ability to
cope.
Increasing magnitudes of warming increase the likelihood of
severe, pervasive, and irreversible impacts.
Some risks of climate
change are considerable at 1°C or 2°C above preindustrial levels (as
shown in Box TS.5). Global climate change risks are high to very
high with global mean temperature increase of 4°C or more above
preindustrial levels in all reasons for concern (Box TS.5), and include
severe and widespread impacts on unique and threatened systems,
substantial species extinction, large risks to global and regional food
security, and the combination of high temperature and humidity
compromising normal human activities, including growing food or
working outdoors in some areas for parts of the year (high confidence).
See Box TS.6. The precise levels of climate change sufficient to trigger
tipping points (thresholds for abrupt and irreversible change) remain
uncertain, but the risk associated with crossing multiple tipping points
in the earth system or in interlinked human and natural systems
increases with rising temperature (medium confidence). [4.2, 4.3, 11.8,
19.5, 19.7, 26.5, Box CC-HS]
The overall risks of climate change impacts can be reduced by
limiting the rate and magnitude of climate change.
Risks are
reduced substantially under the assessed scenario with the lowest
temperature projections (RCP2.6 – low emissions) compared to the
highest temperature projections (RCP8.5 – high emissions), particularly
in the second half of the 21st century (very high confidence). Examples
include reduced risk of negative agricultural yield impacts; of water
scarcity; of major challenges to urban settlements and infrastructure
from sea level rise; and of adverse impacts from heat extremes, floods,
and droughts in areas where increased occurrence of these extremes
is projected. Reducing climate change can also reduce the scale of
adaptation that might be required. Under all assessed scenarios for
adaptation and mitigation, some risk from adverse impacts remains (very
high confidence). Because mitigation reduces the rate as well as the
magnitude of warming, it also increases the time available for adaptation
to a particular level of climate change, potentially by several decades,
but adaptation cannot generally overcome all climate change effects.
In addition to biophysical limits to adaptation for example under high
temperatures, some adaptation options will be too costly or resource
intensive or will be cost ineffective until climate change effects grow to
merit investment costs (high confidence). Some mitigation or adaptation
options also pose risks. [3.4, 3.5, 4.2, 4.4, 16.3, 16.6, 17.2, 19.7, 20.3,
22.4, 22.5, 25.10, Tables 3-2, 8-3, and 8-6, Boxes 16-3 and 25-1]
B-2. Sectoral Risks and Potential for Adaptation
For the near-term era of committed climate change (the next few
decades) and the longer-term era of climate options (the second half
°C
5
4
3
2
1
0
Unique &
t
hreatened
s
ystems
Extreme
w
eather
e
vents
Distribution
o
f impacts
Global
a
ggregate
i
mpacts
Large-scale
s
ingular
e
vents
1900 1950 2000 2050
°C
5
4
3
2
1
0
(
˚
C relative to 1850–1900, as an
approximation of preindustrial levels)
2003
–2012
2100
(
˚
C relative to 1850–1900, as an
approximation of preindustrial levels)
6
5
4
3
2
1
0
°C
-0.61
(
˚
C relative to 1986–2005)
Global mean temperature change
5
4
3
2
1
0
°C
-0.61
(
˚
C relative to 1986–2005)
Global mean temperature change
U
ndetectable
Very high
Level of additional risk due to climate change
M
oderate
High
Observed
RCP2.6 (a low-emission mitigation scenario)
RCP8.5 (a high-emission scenario)
Overlap
Box TS.5 Figure 1 | A global perspective on climate-related risks. Risks associated with reasons for concern are shown at right for increasing levels of climate change. The color
shading indicates the additional risk due to climate change when a temperature level is reached and then sustained or exceeded. Undetectable risk (white) indicates no
associated impacts are detectable and attributable to climate change. Moderate risk (yellow) indicates that associated impacts are both detectable and attributable to climate
change with at least medium confidence, also accounting for the other specific criteria for key risks. High risk (red) indicates severe and widespread impacts, also accounting for
the other specific criteria for key risks. Purple, introduced in this assessment, shows that very high risk is indicated by all specific criteria for key risks. [Figure 19-4] For reference,
past and projected global annual average surface temperature is shown at left, as in Figure TS.5. [Figure RC-1, Box CC-RC; WGI AR5 Figures SPM.1 and SPM.7] Based on the
longest global surface temperature dataset available, the observed change between the average of the period 1850–1900 and of the AR5 reference period (1986–2005) is
0.61°C (5–95% confidence interval: 0.55 to 0.67°C) [WGI AR5 SPM, 2.4], which is used here as an approximation of the change in global mean surface temperature since
preindustrial times, referred to as the period before 1750. [WGI and WGII AR5 glossaries]

63
Technical Summary
TS
of the 21st century and beyond), climate change will amplify existing
climate-related risks and create new risks for natural and human systems,
dependent on the magnitude and rate of climate change and on the
vulnerability and exposure of interlinked human and natural systems.
Some of these risks will be limited to a particular sector or region, and
others will have cascading effects. To a lesser extent, climate change
will also have some potential benefits. A selection of key sectoral risks
identified with medium to high confidence is presented in Table TS.4.
Box TS.6 | Consequences of Large Temperature Increase
This box provides a selection of salient climate change impacts projected for large temperature rise. Warming levels described here
(e.g., 4°C warming) refer to global mean temperature increase above preindustrial levels, unless otherwise indicated.
With 4°C warming, climate change is projected to become an increasingly important driver of impacts on ecosystems, becoming
comparable with land-use change. [4.2, 19.5] A number of studies project large increases in water stress, groundwater supplies, and
drought in a number of regions with greater than 4°C warming, and decreases in others, generally placing already arid regions at
greater water stress. [19.5]
Risks of large-scale singular events such as ice sheet disintegration, methane release from clathrates, and onset of long-term
droughts in areas such as southwest North America [19.6, Box 26-1; WGI AR5 12.4, 12.5, 13.4], as well as regime shifts in ecosystems
and substantial species loss [4.3, 19.6], are higher with increased warming. Sustained warming greater than some threshold would
lead to the near-complete loss of the Greenland ice sheet over a millennium or more, causing a global mean sea level rise of up to 7 m
(high confidence); current estimates indicate that the threshold is greater than about 1°C (low confidence) but less than about 4°C
(medium confidence) global mean warming. [WGI AR5 SPM, 5.8, 13.4, 13.5] Abrupt and irreversible ice loss from a potential instability
of marine-based areas of the Antarctic ice sheet in response to climate forcing is possible, but current evidence and understanding is
insufficient to make a quantitative assessment. [19.6; WGI AR5 SPM, 5.8, 13.4, 13.5] Sea level rise of 0.45 to 0.82 m (mean 0.63 m)
is likely by 2081–2100 under RCP8.5 (medium confidence) [WGI AR5 Tables SPM.2 and 13.5], with sea level continuing to rise beyond
2100.
The Atlantic Meridional Overturning Circulation (AMOC) will very likely weaken over the 21st century, with a best estimate of 34%
loss (range 12 to 54%) under RCP8.5. [WGI AR5 SPM, 12.4] The release of carbon dioxide (CO
2
) or methane (CH
4
) to the atmosphere
from thawing permafrost carbon stocks over the 21st century is assessed to be in the range of 50 to 250 GtC for Representative
Concentration Pathway 8.5 (RCP8.5) (low confidence). [WGI AR5 SPM, 6.4] A nearly ice-free Arctic Ocean in September before mid-
century is likely under RCP8.5 (medium confidence). [WGI AR5 SPM, 11.3, 12.4, 12.5]
By 2100 for the high-emission scenario RCP8.5, the combination of high temperature and humidity in some areas for parts of the
year is projected to compromise normal human activities, including growing food or working outdoors (high confidence). [11.8]
Global temperature increases of ~4°C or more above late-20th-century levels, combined with increasing food demand, would pose
large risks to food security globally and regionally (high confidence). [7.4, 7.5, Table 7-3, Figures 7-1, 7-4, and 7-7, Box 7-1]
Under 4°C warming, some models project large increases in fire risk in parts of the world. [4.3, Figure 4-6] 4°C warming implies a
substantial increase in extinction risk for terrestrial and freshwater species, although there is low agreement concerning the fraction
of species at risk. [4.3] Widespread coral reef mortality is expected with significant impacts on coral reef ecosystems (high confidence).
[5.4, Box CC-CR] Assessments of potential ecological impacts at and above 4°C warming imply a high risk of extensive loss of
biodiversity with concomitant loss of ecosystem services (high confidence). [4.3, 19.3, 19.5, Box 25-6]
Projected large increases in exposure to water stress, fluvial and coastal flooding, negative impacts on crop yields, and disruption of
ecosystem function and services would represent large, potentially compounding impacts of climate change on society generally and
on the global economy. [19.4 to 19.6]
64
Technical Summary
TS
Near term
(
2030–2040)
P
resent
Long term
(2080–2100)
2
°C
4°C
Very
low
Very
high
M
edium
Near term
(2030–2040)
Present
Long term
(2080–2100)
2°C
4°C
V
ery
low
Very
high
Medium
Near term
(2030–2040)
Present
Long term
(2080–2100)
2°C
4°C
Very
low
Very
high
Medium
Near term
(2030–2040)
Present
Long term
(2080–2100)
2°C
4°C
Very
low
Very
high
Medium
Near term
(2030–2040)
Present
Long term
(2080–2100)
2°C
4°C
Very
low
Very
high
Medium
Near term
(2030–2040)
Present
Long term
(2080–2100)
2°C
4°C
Very
low
Very
high
Medium
Key risk Adaptation issues & prospects
Climatic
drivers
Risk & potential for
adaptation
Timeframe
Global Risks
Carbon dioxide
fertilization
C
O
O
D
amaging
c
yclone
Ocean
acidification
C
O
O
Climate-related drivers of impacts
Warming
trend
Extreme
precipitation
Extreme
temperature
Level of risk & potential for adaptation
P
otential for additional adaptation
t
o reduce risk
R
isk level with
current adaptation
R
isk level with
high adaptation
Drying
trend
Flooding
Storm
surge
C
OO
C
OO
R
eduction in terrestrial carbon sink: Carbon stored in terrestrial
e
cosystems is vulnerable to loss back into the atmosphere, resulting from
i
ncreased fire frequency due to climate change and the sensitivity of
e
cosystem respiration to rising temperatures (medium confidence)
[
4.2, 4.3]
•
Adaptation options include managing land use
(
including deforestation), fire and other disturbances,
a
nd non-climatic stressors.
Boreal tipping point: Arctic ecosystems are vulnerable to abrupt
change related to the thawing of permafrost, spread of shrubs in
tundra, and increase in pests and fires in boreal forests
(medium confidence)
[4.3, Box 4-4]
• There are few adaptation options in the Arctic.
Amazon tipping point: Moist Amazon forests could change abruptly
to less-carbon-dense, drought- and fire-adapted ecosystems
(low confidence)
[4.3, Box 4-3]
• Policy and market measures can reduce deforestation
and fire.
Increased risk of species extinction: A large fraction of the species
assessed is vulnerable to extinction due to climate change, often in
interaction with other threats. Species with an intrinsically low
dispersal rate, especially when occupying flat landscapes where the
projected climate velocity is high, and species in isolated habitats such
as mountaintops, islands, or small protected areas are especially at
risk. Cascading effects through organism interactions, especially those
vulnerable to phenological changes, amplify risk (high confidence)
[4.3, 4.4]
• Adaptation options include reduction of habitat
modification and fragmentation, pollution,
over-exploitation, and invasive species; protected area
expansion; assisted dispersal; and ex situ conservation.
Marine biodiversity loss with high rate of climate change
(medium confidence)
[6.3, 6.4, Table 30-4, Box CC-MB]
• Adaptation options are limited to reducing other stresses,
mainly pollution, and limiting pressures from coastal human
activities such as tourism and fishing.
Reduced growth and survival of commercially valuable shellfish and
other calcifiers (e.g., reef-building corals, calcareous red algae) due to
ocean acidification (high confidence)
[5.3, 6.1, 6.3, 6.4, 30.3, Box CC-OA]
• Evidence for differential resistance and evolutionary
adaptation of some species exists, but they are likely to be
limited at higher CO
2
concentrations and temperatures.
• Adaptation options include exploiting more resilient
species or protecting habitats with low natural CO
2
levels,
as well as reducing other stresses, mainly pollution, and
limiting pressures from tourism and fishing.
Table TS.4 | Key sectoral risks from climate change and the potential for reducing risks through adaptation and mitigation. Key risks have been identified based on assessment of
the relevant scientific, technical, and socioeconomic literature detailed in supporting chapter sections. Identification of key risks was based on expert judgment using the following
specific criteria: large magnitude, high probability, or irreversibility of impacts; timing of impacts; persistent vulnerability or exposure contributing to risks; or limited potential to
reduce risks through adaptation or mitigation. Each key risk is characterized as very low to very high for three timeframes: the present, near term (here, assessed over
2030–2040), and longer term (here, assessed over 2080–2100). The risk levels integrate probability and consequence over the widest possible range of potential outcomes,
based on available literature. These potential outcomes result from the interaction of climate-related hazards, vulnerability, and exposure. Each risk level reflects total risk from
climatic and non-climatic factors. For the near-term era of committed climate change, projected levels of global mean temperature increase do not diverge substantially for
different emission scenarios. For the longer-term era of climate options, risk levels are presented for two scenarios of global mean temperature increase (2°C and 4°C above
preindustrial levels). These scenarios illustrate the potential for mitigation and adaptation to reduce the risks related to climate change. For the present, risk levels were estimated
for current adaptation and a hypothetical highly adapted state, identifying where current adaptation deficits exist. For the two future timeframes, risk levels were estimated for a
continuation of current adaptation and for a highly adapted state, representing the potential for and limits to adaptation. Climate-related drivers of impacts are indicated by
icons. Risk levels are not necessarily comparable because the assessment considers potential impacts and adaptation in different physical, biological, and human systems across
diverse contexts. This assessment of risks acknowledges the importance of differences in values and objectives in interpretation of the assessed risk levels.
Continued next page
65
Technical Summary
TS
Present
2°C
4°C
Very
l
ow
Very
h
igh
Medium
P
resent
2°C
4°C
V
ery
low
V
ery
high
Medium
Present
2°C
4°C
V
ery
low
V
ery
high
Medium
Present
2
°C
4°C
Very
low
Very
high
Medium
Present
2°C
4°C
Very
low
Very
high
Medium
Present
2°C
4°C
Very
low
Very
high
Medium
Present
2°C
4°C
Very
low
Very
high
Medium
Key risk
Adaptation issues & prospects
Climatic
drivers
Risk & potential for
adaptation
Timeframe
Global Risks
N
ear term
(2030–2040)
Long term
(2080–2100)
N
ear term
(2030–2040)
L
ong term
(
2080–2100)
Near term
(2030–2040)
Long term
(2080–2100)
Near term
(2030–2040)
Long term
(2080–2100)
Near term
(2030–2040)
Long term
(2080–2100)
Near term
(2030–2040)
Long term
(2080–2100)
Near term
(2030–2040)
Long term
(2080–2100)
U
rban risks associated with housing
(
high confidence)
[8.3]
•
Poor quality, inappropriately located housing is often most vulnerable to
e
xtreme events. Adaptation options include enforcement of building regulations
and upgrading. Some city studies show the potential to adapt housing and
promote mitigation, adaptation, and development goals simultaneously.
Rapidly growing cities, or those rebuilding after a disaster, especially have
opportunities to increase resilience, but this is rarely realized. Without
adaptation, risks of economic losses from extreme events are substantial in
cities with high-value infrastructure and housing assets, with broader economic
effects possible.
Declining work productivity, increasing
morbidity (e.g., dehydration, heat stroke, and
heat exhaustion), and mortality from
exposure to heat waves. Particularly at risk
are agricultural and construction workers as
well as children, homeless people, the
elderly, and women who have to walk long
hours to collect water (high confidence)
[13.2, Box 13-1]
• Adaptation options are limited for people who are dependent on agriculture
and cannot afford agricultural machinery.
• Adaptation options are limited in the construction sector where many poor
people work under insecure arrangements.
• Adaptation limits may be exceeded in certain areas in a +4
o
C world.
Reduced access to water for rural and urban
poor people due to water scarcity and
increasing competition for water
(high confidence)
[13.2, Box 13-1]
• Adaptation through reducing water use is not an option for the many people
already lacking adequate access to safe water. Access to water is subject to
various forms of discrimination, for instance due to gender and location. Poor
and marginalized water users are unable to compete with water extraction by
industries, large-scale agriculture, and other powerful users.
Adaptation options:
• Buffering rural incomes against climate shocks, for example through
livelihood diversification, income transfers, and social safety net provision
• Early warning mechanisms to promote effective risk reduction
• Well-established strategies for managing violent conflict that are effective
but require significant resources, investment, and political will
Violent conflict arising from deterioration in
resource-dependent livelihoods such as
agriculture and pastoralism (high confidence)
[12.5]
• Adaptation to extreme events is well understood, but poorly implemented
even under present climate conditions. Displacement and involuntary migration
are often temporary. With increasing climate risks, displacement is more likely
to involve permanent migration.
Displacement associated with extreme events
(high confidence)
[12.4]
• Most urban centers are energy intensive, with energy-related climate policies
focused only on mitigation measures. A few cities have adaptation initiatives
underway for critical energy systems. There is potential for non-adapted,
centralized energy systems to magnify impacts, leading to national and
transboundary consequences from localized extreme events.
Urban risks associated with energy systems
(high confidence)
[8.2, 8.4]
U
rban risks associated with water supply
s
ystems (high confidence)
[
8.2, 8.3]
•
Adaptation options include changes to network infrastructure as well as
demand-side management to ensure sufficient water supplies and quality,
increased capacities to manage reduced freshwater availability, and flood risk
reduction.
N
ear term
(2030–2040)
Present
L
ong term
(
2080–2100)
2°C
4°C
V
ery
low
V
ery
high
Medium
C
O
O
Negative impacts on average crop yields and
increases in yield variability due to climate
change (high confidence)
[7.2 to 7.5, Figure 7-5, Box 7-1]
• Projected impacts vary across crops and regions and adaptation scenarios,
with about 10% of projections for the period 2030–2049 showing yield gains
of more than 10%, and about 10% of projections showing yield losses of more
than 25%, compared to the late 20th century. After 2050 the risk of more
severe yield impacts increases and depends on the level of warming.
Table TS.4 (continued)
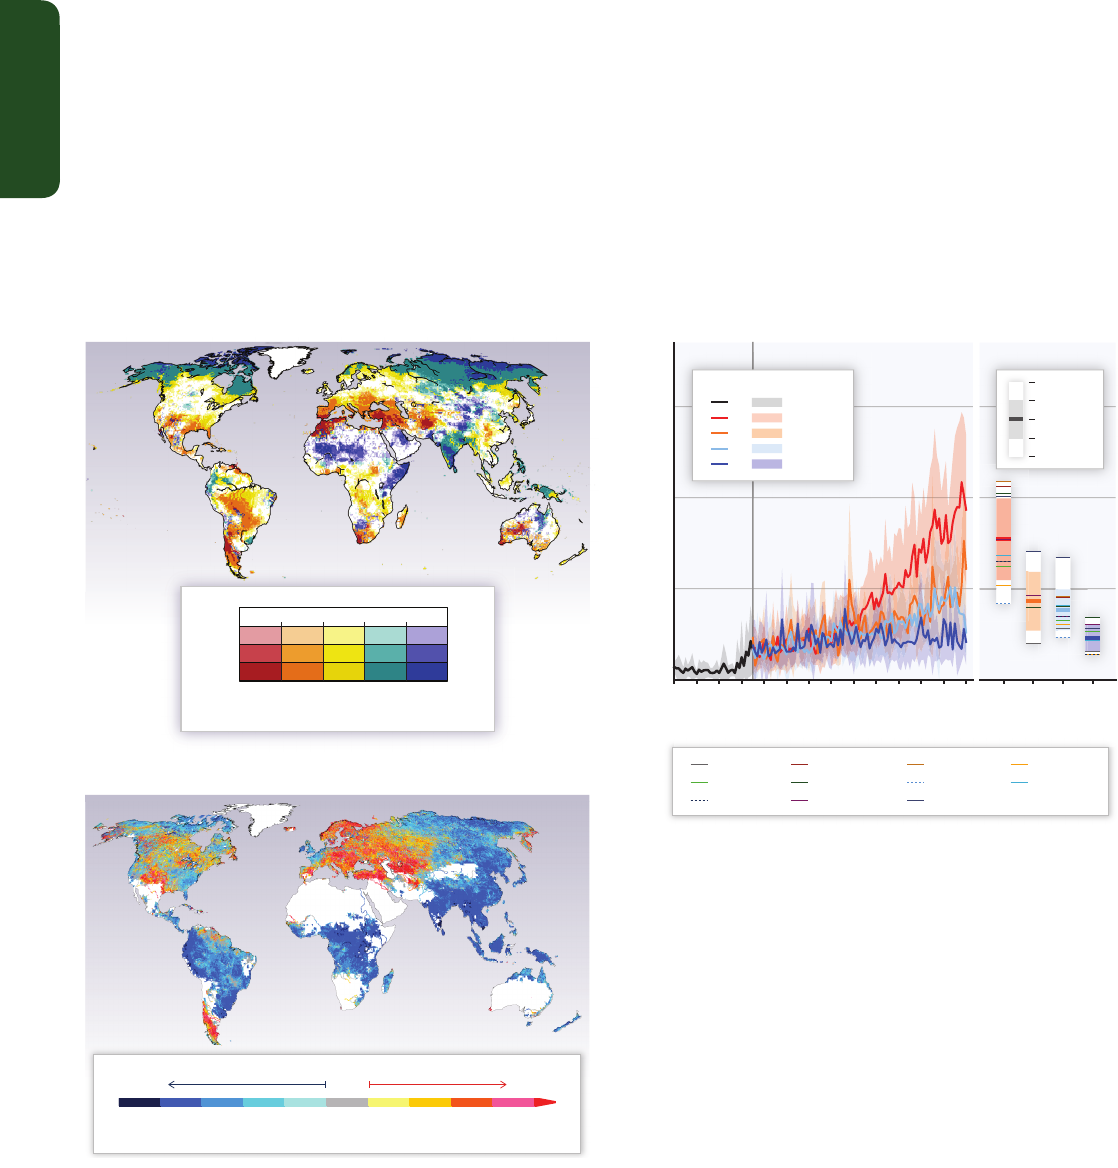
66
Technical Summary
TS
F
or extended summary of sectoral risks and the more limited potential
benefits, see introductory overviews for each sector below and also
Chapters 3 to 13.
Freshwater Resources
Freshwater-related risks of climate change increase significantly
with increasing greenhouse gas concentrations (robust evidence,
high agreement).
The fraction of global population experiencing water
scarcity and the fraction affected by major river floods increase with
the level of warming in the 21st century. See, for example, Figure TS.6.
[3.4, 3.5, 26.3, Table 3-2, Box 25-8]
Climate change over the 21st century is projected to reduce
renewable surface water and groundwater resources significantly
in most dry subtropical regions (robust evidence, high agreement),
intensifying competition for water among sectors (limited
evidence, medium agreement).
In presently dry regions, drought
f
requency will likely increase by the end of the 21st century
under RCP8.5 (medium confidence). In contrast, water resources are
projected to increase at high latitudes (robust evidence, high
agreement). Climate change is projected to reduce raw water quality
and pose risks to drinking water quality even with conventional
treatment, due to interacting factors: increased temperature; increased
sediment, nutrient, and pollutant loadings from heavy rainfall; increased
concentration of pollutants during droughts; and disruption of
treatment facilities during floods (medium evidence, high agreement).
[3.2, 3.4, 3.5, 22.3, 23.9, 25.5, 26.3, Tables 3-2 and 23-3, Boxes CC-RF
and CC-WE; WGI AR5 12.4]
Adaptive water management techniques, including scenario
planning, learning-based approaches, and flexible and low-regret
solutions, can help create resilience to uncertain hydrological
changes and impacts due to climate change (limited evidence,
high agreement).
Barriers to progress include lack of human and
institutional capacity, financial resources, awareness, and communication.
[3.6, Box 25-2]
<–50 –30 –10
50<3010
60
70
80
Relative change (%)
Agreement (%)
BCC-CSM1.1
CCCma-CanESM2
CMCC-CM
CNRM-CM5
CSIRO-Mk3.6.0 GFDL-ESM2G
INM-CM4
MIROC5
MPI-ESM-LR MRI-CGCM3
NCC-NorESM1-M
Return period (years)
DecreaseIncrease
Flood frequency
2525 50 75 95 105 125 250 500 1000
(B)
(A)
M
aximum
+
1 Std Dev
Mean
−1 Std Dev
Minimum
1
50
M
ean
±
1 Std Dev
100
50
H
istorical
RCP8.5
RCP6.0
RCP4.5
RCP2.6
(C)
P
rojected
1980 2000 2020 2040
Historical
R
CP8.5
RCP6.0
R
CP4.5
RCP2.6
2060 2080 2100
0
Number of people exposed to flood
(return period ≥100 years) (millions of people)
Figure TS.6 | (A) Percentage change of mean annual streamflow for a global mean
temperature rise of 2°C above 1980–2010. Color hues show the multi-model mean
change across 5 General Circulation Models (GCMs) and 11 Global Hydrological
Models (GHMs), and saturation shows the agreement on the sign of change across all
55 GHM–GCM combinations (percentage of model runs agreeing on the sign of
change). (B and C) Projected change in river flood return period and exposure, based
on one hydrological model driven by 11 GCMs and on global population in 2005. (B)
In the 2080s under RCP8.5, multi-model median return period (years) for the
20th-century 100-year flood. (C) Global exposure to the 20th-century 100-year flood
in millions of people. Left: Ensemble means of historical (black line) and future
simulations (colored lines) for each scenario. Shading denotes ±1 standard deviation.
Right: Maximum and minimum (extent of white), mean (thick colored lines), ±1
standard deviation (extent of shading), and projections of each GCM (thin colored
lines) averaged over the 21st century. [Figures 3-4 and 3-6]
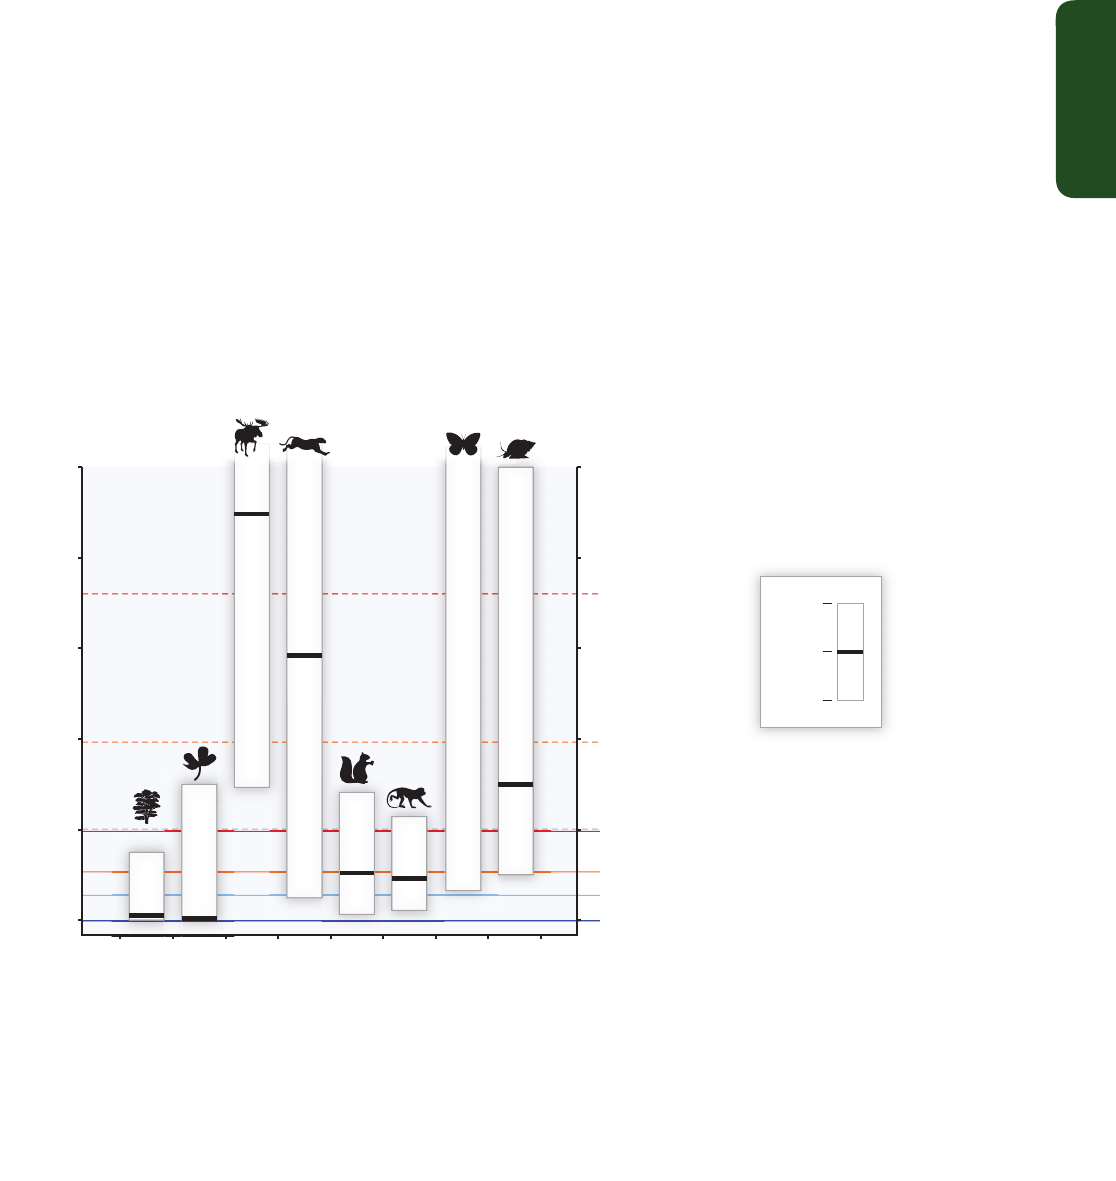
67
Technical Summary
TS
Terrestrial and Freshwater Ecosystems
Climate change is projected to be a powerful stressor on terrestrial
and freshwater ecosystems in the second half of the 21st century,
especially under high-warming scenarios such as RCP6.0 and
8.5 (high confidence). Through to 2040 globally, direct human
impacts such as land-use change, pollution, and water resource
development will continue to dominate threats to most
freshwater ecosystems (high confidence) and most terrestrial
ecosystems (medium confidence).
Many species will be unable to
track suitable climates under mid- and high-range rates of climate
change (i.e., RCP4.5, 6.0, and 8.5) during the 21st century (medium
confidence). Lower rates of change (i.e., RCP2.6) will pose fewer
problems. See Figure TS.7. Some species will adapt to new climates.
Those that cannot adapt sufficiently fast will decrease in abundance or
go extinct in part or all of their ranges. Increased tree mortality and
associated forest dieback is projected to occur in many regions over
the 21st century, due to increased temperatures and drought (medium
confidence). Forest dieback poses risks for carbon storage, biodiversity,
wood production, water quality, amenity, and economic activity.
Management actions, such as maintenance of genetic diversity, assisted
species migration and dispersal, manipulation of disturbance regimes
(e.g., fires, floods), and reduction of other stressors, can reduce, but not
eliminate, risks of impacts to terrestrial and freshwater ecosystems
d
ue to climate change, as well as increase the inherent capacity of
ecosystems and their species to adapt to a changing climate (high
confidence). [4.3, 4.4, 25.6, 26.4, Boxes 4-2, 4-3, and CC-RF]
A large fraction of both terrestrial and freshwater species faces
increased extinction risk under projected climate change during
and beyond the 21st century, especially as climate change
interacts with other stressors, such as habitat modification, over-
exploitation, pollution, and invasive species (high confidence).
Extinction risk is increased under all RCP scenarios, with risk increasing
with both magnitude and rate of climate change. Models project that the
risk of species extinctions will increase in the future due to climate change,
but there is low agreement concerning the fraction of species at increased
risk, the regional and taxonomic distribution of such extinctions, and the
timeframe over which extinctions could occur. Some aspects leading to
uncertainty in the quantitative projections of extinction risks were not
taken into account in previous models; as more realistic details are
included, it has been shown that the extinction risks may be either
under- or overestimated when based on simpler models. [4.3, 25.6]
Within this century, magnitudes and rates of climate change
associated with medium- to high-emission scenarios (RCP4.5,
6.0, and 8.5) pose high risk of abrupt and irreversible regional-
scale change in the composition, structure, and function of
Trees
Herbaceous
plants
Split-hoofed
mammals
Carnivorous
mammals
Rodents
Primates
Plant-feeding
insects
Freshwater
mollusks
Maximum speed at which species can move (km per decade)
Lower
bound
Upper
bound
Median
0
20
40
60
80
100
RCP8.5 flat areas
Average climate velocity
2050–2090
RCP6.0 flat areas
RCP6.0 global average
RCP8.5 global average
RCP2.6 flat areas and global average
RCP4.5 flat areas
RCP4.5 global average
Figure TS.7 | Maximum speeds at which species can move across landscapes (based on observations and models; vertical axis on left), compared with speeds at which
temperatures are projected to move across landscapes (climate velocities for temperature; vertical axis on right). Human interventions, such as transport or habitat fragmentation,
can greatly increase or decrease speeds of movement. White boxes with black bars indicate ranges and medians of maximum movement speeds for trees, plants, mammals,
plant-feeding insects (median not estimated), and freshwater mollusks. For RCP2.6, 4.5, 6.0, and 8.5 for 2050–2090, horizontal lines show climate velocity for the
global-land-area average and for large flat regions. Species with maximum speeds below each line are expected to be unable to track warming in the absence of human
intervention. [Figure 4-5]

68
Technical Summary
TS
t
errestrial and freshwater ecosystems, including wetlands
(medium confidence).
Examples that could lead to substantial
impact on climate are the boreal–tundra Arctic system (medium
confidence) and the Amazon forest (low confidence). For the
boreal–tundra system, continued climate change will transform the
species composition, land cover, drainage, and permafrost extent of the
boreal–tundra system, leading to decreased albedo and the release of
greenhouse gases (medium confidence), with adaptation measures
unable to prevent substantial change (high confidence). Increased
severe drought together with land-use change and forest fire would
cause much of the Amazon forest to transform to less-dense drought-
and fire-adapted ecosystems, increasing risk for biodiversity while
decreasing net carbon uptake from the atmosphere (low confidence).
Large reductions in deforestation, as well as wider application of
effective wildfire management, will lower the risk of abrupt change in
the Amazon, as well as potential negative impacts of that change
(medium confidence). [4.2, 4.3, Figure 4-8, Boxes 4-3 and 4-4]
The natural carbon sink provided by terrestrial ecosystems is
partially offset at the decadal timescale by carbon released
through the conversion of natural ecosystems (principally forests)
to farm and grazing land and through ecosystem degradation
(high confidence).
Carbon stored in the terrestrial biosphere (e.g., in
peatlands, permafrost, and forests) is susceptible to loss to the
atmosphere as a result of climate change, deforestation, and ecosystem
degradation. [4.2, 4.3, Box 4-3]
Coastal Systems and Low-lying Areas
Due to sea level rise projected throughout the 21st century and
beyond, coastal systems and low-lying areas will increasingly
experience adverse impacts such as submergence, coastal flooding,
and coastal erosion (very high confidence).
The population and
assets projected to be exposed to coastal risks as well as human pressures
on coastal ecosystems will increase significantly in the coming decades
due to population growth, economic development, and urbanization
(high confidence). The relative costs of coastal adaptation vary strongly
among and within regions and countries for the 21st century. Some
low-lying developing countries and small island states are expected to
face very high impacts that, in some cases, could have associated
damage and adaptation costs of several percentage points of GDP. [5.3
to 5.5, 8.2, 22.3, 24.4, 25.6, 26.3, 26.8, Table 26-1, Box 25-1]
Marine Systems
By mid 21st century, spatial shifts of marine species will cause
species richness and fisheries catch potential to increase, on
a
verage, at mid and high latitudes (high confidence) and to
decrease at tropical latitudes (medium confidence), resulting in
global redistribution of catch potential for fishes and invertebrates,
with implications for food security (medium confidence).
Spatial
shifts of marine species due to projected warming will cause high-
latitude invasions and high local-extinction rates in the tropics and
semi-enclosed seas (medium confidence). Animal displacements will
cause a 30 to 70% increase in the fisheries yield of some high-latitude
regions by 2055 (relative to 2005), a redistribution at mid latitudes, and
a drop of 40 to 60% in some of the tropics and the Antarctic, for 2°C
warming above preindustrial levels (medium confidence for direction
of fisheries’ yield trends, low confidence for the precise magnitudes of
yield change). See Figure TS.8A. The progressive expansion of oxygen
minimum zones and anoxic “dead zones” is projected to further
constrain the habitat of fishes and other O
2
-dependent organisms
(medium confidence). Open-ocean net primary production is projected
to redistribute and, by 2100, fall globally under all RCP scenarios. [6.3
to 6.5, 7.4, 25.6, 28.3, 30.4 to 30.6, Boxes CC-MB and CC-PP]
Due to projected climate change by the mid 21st century and
beyond, global marine-species redistribution and marine-
biodiversity reduction in sensitive regions will challenge the
sustained provision of fisheries productivity and other ecosystem
goods and services (high confidence).
Socioeconomic vulnerability
is highest in developing tropical countries, leading to risks from reduced
supplies, income, and employment from marine fisheries. [6.4, 6.5]
For medium- to high-emission scenarios (RCP4.5, 6.0, and 8.5),
ocean acidification poses substantial risks to marine ecosystems,
especially polar ecosystems and coral reefs, associated with
impacts on the physiology, behavior, and population dynamics
of individual species from phytoplankton to animals (medium to
high confidence).
See Box TS.7. Highly calcified mollusks, echinoderms,
and reef-building corals are more sensitive than crustaceans (high
confidence) and fishes (low confidence), with potentially detrimental
consequences for fisheries and livelihoods (Figure TS.8B). Ocean
acidification acts together with other global changes (e.g., warming,
decreasing oxygen levels) and with local changes (e.g., pollution,
eutrophication) (high confidence). Simultaneous drivers, such as warming
and ocean acidification, can lead to interactive, complex, and amplified
impacts for species and ecosystems. [5.4, 6.3 to 6.5, 22.3, 25.6, 28.3,
30.5, Boxes CC-CR and CC-OA]
Climate change adds to the threats of over-fishing and other
non-climatic stressors, thus complicating marine management
regimes (high confidence).
In the short term, strategies including
climate forecasting and early warning systems can reduce risks from
ocean warming and acidification for some fisheries and aquaculture
industries. Fisheries and aquaculture industries with high-technology
Figure TS.8 | Climate change risks for fisheries. (A) Projected global redistribution of maximum catch potential of ~1000 exploited fish and invertebrate species. Projections
compare the 10-year averages 2001–2010 and 2051–2060 using SRES A1B, without analysis of potential impacts of overfishing or ocean acidification. (B) Marine mollusk and
crustacean fisheries (present-day estimated annual catch rates ≥0.005 tonnes km
–2
) and known locations of cold- and warm-water corals, depicted on a global map showing the
projected distribution of ocean acidification under RCP8.5 (pH change from 1986–2005 to 2081–2100). [WGI AR5 Figure SPM.8] The bottom panel compares sensitivity to
ocean acidification across mollusks, crustaceans, and corals, vulnerable animal phyla with socioeconomic relevance (e.g., for coastal protection and fisheries). The number of
species analyzed across studies is given for each category of elevated CO
2
. For 2100, RCP scenarios falling within each CO
2
partial pressure (pCO
2
) category are as follows:
RCP4.5 for 500–650 μatm (approximately equivalent to ppm in the atmosphere), RCP6.0 for 651–850 μatm, and RCP8.5 for 851–1370 μatm. By 2150, RCP8.5 falls within the
1371–2900 μatm category. The control category corresponds to 380 μatm. [6.1, 6.3, 30.5, Figures 6-10 and 6-14; WGI AR5 Box SPM.1]
69
Technical Summary
TS
Change in maximum catch potential (2051–2060 compared to 2001–2010, SRES A1B)
> 100 %
< –50 % –21 to –50 %
–6 to –20 %
–1 to –5 %
20 to 49 % 50 to 100 %
5 to 19 %
0 to 4 %
no data
Mollusk and crustacean fisheries
(present-day annual catch rate
≥
0.005 tonnes km
-2
)
Cold-water
corals
Warm-water
corals
Change in pH (2081–2100 compared to 1986–2005, RCP8.5)
Positive effect
No effect
Negative effect
pCO
2
(μatm)
(A)
40 16 15 31
C
o
n
tr
o
l
5
0
0
–
6
5
0
6
51
–
8
5
0
8
5
1
–
1
3
7
0
0
20
40
60
80
100
Mollusks
13
7
1
–2
9
0
0
29
37 4918
Co
n
tr
o
l
5
0
0
–
6
5
0
6
51
–
8
5
0
8
5
1
–
1
3
7
0
0
20
40
60
80
100
Crustaceans
13
7
1
–2
9
0
0
23
Cold-water corals
7475
Co
n
tr
o
l
5
0
0
–
6
5
0
6
51
–
8
5
0
8
5
1
–
1
3
7
0
0
20
40
60
80
100
3
13
7
1
–
2
9
0
0
Species (%)
26 9 15 23
Co
n
tr
o
l
0
20
40
60
80
100
20
5
0
0
–
6
5
0
6
51
–
8
5
0
8
5
1
–
1
3
7
0
13
7
1
–
2
9
0
0
Warm-water corals
(B)
–
0.
0
5
–
0
.
1
0
–
0
.
1
5
–
0
.
2
0
–
0
.
2
5
–
0
.
3
0
–
0
.
3
5
–
0
.
4
0
–
0
.
4
5
–0
.
5
0
–0
.
5
5
–0
.
6
0
70
Technical Summary
TS
and/or large investments, as well as marine shipping and oil and gas
industries, have high capacities for adaptation due to greater development
of environmental monitoring, modeling, and resource assessments.
For smaller-scale fisheries and developing countries, building social
resilience, alternative livelihoods, and occupational flexibility represent
important strategies for reducing the vulnerability of ocean-dependent
human communities. [6.4, 7.3, 7.4, 25.6, 29.4, 30.6, 30.7]
Food Security and Food Production Systems
For the major crops (wheat, rice, and maize) in tropical and
temperate regions, climate change without adaptation is
projected to negatively impact aggregate production for local
temperature increases of 2°C or more above late-20th-century
levels, although individual locations may benefit (medium
confidence).
Projected impacts vary across crops and regions and
adaptation scenarios, with about 10% of projections for the period
2030–2049 showing yield gains of more than 10%, and about 10% of
projections showing yield losses of more than 25%, compared to the
late 20th century. After 2050 the risk of more severe yield impacts
increases and depends on the level of warming. See Figure TS.9. Climate
change is projected to progressively increase inter-annual variability of
crop yields in many regions. These projected impacts will occur in the
context of rapidly rising crop demand. [7.4, 7.5, 22.3, 24.4, 25.7, 26.5,
Table 7-2, Figures 7-4, 7-5, 7-6, 7-7, and 7-8]
All aspects of food security are potentially affected by climate
change, including food access, utilization, and price stability
(high confidence).
Redistribution of marine fisheries catch potential
towards higher latitudes poses risk of reduced supplies, income, and
employment in tropical countries, with potential implications for food
security (medium confidence). Global temperature increases of ~4°C or
more above late-20th-century levels, combined with increasing food
demand, would pose large risks to food security globally and regionally
(high confidence). Risks to food security are generally greater in low-
latitude areas. [6.3 to 6.5, 7.4, 7.5, 9.3, 22.3, 24.4, 25.7, 26.5, Table 7-3,
Figures 7-1, 7-4, and 7-7, Box 7-1]
Urban Areas
Many global risks of climate change are concentrated in urban
areas (medium confidence). Steps that build resilience and enable
sustainable development can accelerate successful climate-
change adaptation globally.
Heat stress, extreme precipitation,
inland and coastal flooding, landslides, air pollution, drought, and water
scarcity pose risks in urban areas for people, assets, economies, and
ecosystems (very high confidence). Risks are amplified for those lacking
essential infrastructure and services or living in poor-quality housing
and exposed areas. Reducing basic service deficits, improving housing,
and building resilient infrastructure systems could significantly reduce
vulnerability and exposure in urban areas. Urban adaptation benefits from
effective multi-level urban risk governance, alignment of policies and
incentives, strengthened local government and community adaptation
capacity, synergies with the private sector, and appropriate financing
and institutional development (medium confidence). Increased capacity,
voice, and influence of low-income groups and vulnerable communities
and their partnerships with local governments also benefit adaptation.
[3.5, 8.2 to 8.4, 22.3, 24.4, 24.5, 26.8, Table 8-2, Boxes 25-9 and CC-HS]
Rural Areas
Major future rural impacts are expected in the near term and
beyond through impacts on water availability and supply, food
security, and agricultural incomes, including shifts in production
areas of food and non-food crops across the world (high
Figure TS.9 | Summary of projected changes in crop yields, due to climate change over the 21st century. The figure includes projections for different emission scenarios, for
tropical and temperate regions, and for adaptation and no-adaptation cases combined. Relatively few studies have considered impacts on cropping systems for scenarios where
global mean temperatures increase by 4°C or more. For five timeframes in the near term and long term, data (n=1090) are plotted in the 20-year period on the horizontal axis
that includes the midpoint of each future projection period. Changes in crop yields are relative to late-20th-century levels. Data for each timeframe sum to 100%. [Figure 7-5]
0 to –5%
–5 to –10%
–10 to –25%
–25 to –50%
–50 to –100%
0 to 5%
5 to 10%
10 to 25%
25 to 50%
50 to 100%
R
ange of yield change
i
ncrease
in yield
decrease
in yield
Color Legend
Percentage of yield projections
2010–2029 2030–2049 2090–2109
0
20
40
60
80
100
2070–20892050–2069

71
Technical Summary
TS
c
onfidence).
T
hese impacts are expected to disproportionately affect the
welfare of the poor in rural areas, such as female-headed households
and those with limited access to land, modern agricultural inputs,
infrastructure, and education. Climate change will increase international
agricultural trade volumes in both physical and value terms (limited
evidence, medium agreement). Importing food can help countries adjust
to climate change-induced domestic productivity shocks while short-
term food deficits in developing countries with low income may have
to be met through food aid. Further adaptations for agriculture, water,
forestry, and biodiversity can occur through policies taking account of
rural decision-making contexts. Trade reform and investment can improve
market access for small-scale farms (medium confidence). Valuation of
non-marketed ecosystem services and limitations of economic valuation
models that aggregate across contexts pose challenges for valuing rural
impacts. [9.3, 25.9, 26.8, 28.2, 28.4, Box 25-5]
Key Economic Sectors and Services
For most economic sectors, the impacts of drivers such as changes
in population, age structure, income, technology, relative prices,
lifestyle, regulation, and governance are projected to be large
relative to the impacts of climate change (medium evidence,
high agreement).
Climate change is projected to reduce energy
demand for heating and increase energy demand for cooling in the
residential and commercial sectors (robust evidence, high agreement).
Climate change is projected to affect energy sources and technologies
differently, depending on resources (e.g., water flow, wind, insolation),
technological processes (e.g., cooling), or locations (e.g., coastal regions,
floodplains) involved. More severe and/or frequent extreme weather
events and/or hazard types are projected to increase losses and loss
variability in various regions and challenge insurance systems to offer
affordable coverage while raising more risk-based capital, particularly in
developing countries. Large-scale public-private risk reduction initiatives
and economic diversification are examples of adaptation actions. [3.5,
10.2, 10.7, 10.10, 17.4, 17.5, 25.7, 26.7 to 26.9, Box 25-7]
Climate change may influence the integrity and reliability of
pipelines and electricity grids (medium evidence, medium
agreement).
Climate change may require changes in design standards
for the construction and operation of pipelines and of power transmission
and distribution lines. Adopting existing technology from other
geographical and climatic conditions may reduce the cost of adapting
new infrastructure as well as the cost of retrofitting existing pipelines
and grids. Climate change may negatively affect transport infrastructure
(limited evidence, high agreement). All infrastructure is vulnerable
to freeze-thaw cycles; paved roads are particularly vulnerable to
temperature extremes, unpaved roads and bridges to precipitation
extremes. Transport infrastructure on ice or permafrost is especially
vulnerable. [10.2, 10.4, 25.7, 26.7]
Climate change will affect tourism resorts, particularly ski
resorts, beach resorts, and nature resorts (robust evidence, high
agreement), and tourists may spend their holidays at higher
altitudes and latitudes (medium evidence, high agreement).
The
economic implications of climate-change-induced changes in tourism
demand and supply entail gains for countries closer to the poles and
c
ountries with higher elevations and losses for other countries. [10.6,
25.7]
Global economic impacts from climate change are difficult to
estimate.
Economic impact estimates completed over the past 20 years
vary in their coverage of subsets of economic sectors and depend on a
large number of assumptions, many of which are disputable, and many
estimates do not account for catastrophic changes, tipping points, and
many other factors. With these recognized limitations, the incomplete
estimates of global annual economic losses for additional temperature
increases of ~2°C are between 0.2 and 2.0% of income (±1 standard
deviation around the mean) (medium evidence, medium agreement).
Losses are more likely than not to be greater, rather than smaller, than
this range (limited evidence, high agreement). Additionally, there are
large differences between and within countries. Losses accelerate
with greater warming (limited evidence, high agreement), but few
quantitative estimates have been completed for additional warming
around 3°C or above. Estimates of the incremental economic impact of
emitting carbon dioxide lie between a few dollars and several hundreds
of dollars per tonne of carbon
3
(robust evidence, medium agreement).
Estimates vary strongly with the assumed damage function and discount
rate. [10.9]
Human Health
Until mid-century, projected climate change will impact human
health mainly by exacerbating health problems that already exist
(very high confidence). Throughout the 21st century, climate
change is expected to lead to increases in ill-health in many
regions and especially in developing countries with low income, as
compared to a baseline without climate change (high confidence).
Examples include greater likelihood of injury, disease, and death due to
more intense heat waves and fires (very high confidence); increased
likelihood of under-nutrition resulting from diminished food production
in poor regions (high confidence); risks from lost work capacity and
reduced labor productivity in vulnerable populations; and increased risks
from food- and water-borne diseases (very high confidence) and vector-
borne diseases (medium confidence). Impacts on health will be reduced,
but not eliminated, in populations that benefit from rapid social and
economic development, particularly among the poorest and least
healthy groups (high confidence). Climate change will increase demands
for health care services and facilities, including public health programs,
disease prevention activities, health care personnel, infrastructure, and
supplies for treatment (medium evidence, high agreement). Positive
effects are expected to include modest reductions in cold-related
mortality and morbidity in some areas due to fewer cold extremes (low
confidence), geographical shifts in food production (medium confidence),
and reduced capacity of vectors to transmit some diseases. But globally
over the 21st century, the magnitude and severity of negative impacts
are projected to increasingly outweigh positive impacts (high confidence).
The most effective vulnerability reduction measures for health in the
near term are programs that implement and improve basic public
health measures such as provision of clean water and sanitation, secure
essential health care including vaccination and child health services,
3
1 tonne of carbon = 3.667 tonne of CO
2

72
Technical Summary
TS
increase capacity for disaster preparedness and response, and alleviate
poverty (very high confidence). By 2100 for the high-emission scenario
RCP8.5, the combination of high temperature and humidity in some
areas for parts of the year is projected to compromise normal human
activities, including growing food or working outdoors (high confidence).
See Figure TS.10. [8.2, 11.3 to 11.8, 19.3, 22.3, 25.8, 26.6, Figure 25-5,
Box CC-HS]
Human Security
Human security will be progressively threatened as the climate
changes (robust evidence, high agreement).
Human insecurity almost
never has single causes, but instead emerges from the interaction of
multiple factors. Climate change is an important factor in threats to human
security through (1) undermining livelihoods, (2) compromising culture
and identity, (3) increasing migration that people would rather have
avoided, and (4) challenging the ability of states to provide the conditions
necessary for human security. See Figure TS.11. [12.1 to 12.4, 12.6]
Climate change will compromise the cultural values that are
important for community and individual well-being (medium
evidence, high agreement).
The effect of climate change on culture
will vary across societies and over time, depending on cultural resilience
and the mechanisms for maintaining and transferring knowledge.
Changing weather and climatic conditions threaten cultural practices
Potential for
additional
adaptation to
reduce risk
Risk level with
current adaptation
Risk level with
high adaptation
Level of risk and potential for adaptation
2080–2100
"Era of climate options"
+ 4°C
Present
2030–2040
"Era of committed climate change"
V
ector-borne
d
iseases
Undernutrition
Heat
Food- and
water-borne
infections
Air quality
Extreme
weather
events
Mental health
and violence
Occupational
health
V
ector-borne
d
iseases
Undernutrition
Heat
Food- and
w
ater-borne
i
nfections
Air quality
Extreme
w
eather
e
vents
Mental health
a
nd violence
Occupational
health
Vector-borne
d
iseases
U
ndernutrition
H
eat
F
ood- and
water-borne
infections
A
ir quality
Extreme
w
eather
events
Mental health
a
nd violence
Occupational
health
Figure TS.10 | Conceptual presentation of health risks from climate change and the potential for risk reduction through adaptation. Risks are identified in eight health-related
categories based on assessment of the literature and expert judgments by authors of Chapter 11. The width of the slices indicates in a qualitative way relative importance in
terms of burden of ill-health globally at present. Risk levels are assessed for the present and for the near-term era of committed climate change (here, for 2030–2040). For some
categories, for example, vector-borne diseases, heat/cold stress, and agricultural production and undernutrition, there may be benefits to health in some areas, but the net impact
is expected to be negative. Risk levels are also presented for the longer-term era of climate options (here, for 2080–2100) for global mean temperature increase of 4°C above
preindustrial levels. For each timeframe, risk levels are estimated for the current state of adaptation and for a hypothetical highly adapted state, indicated by different colors.
[Figure 11-6]
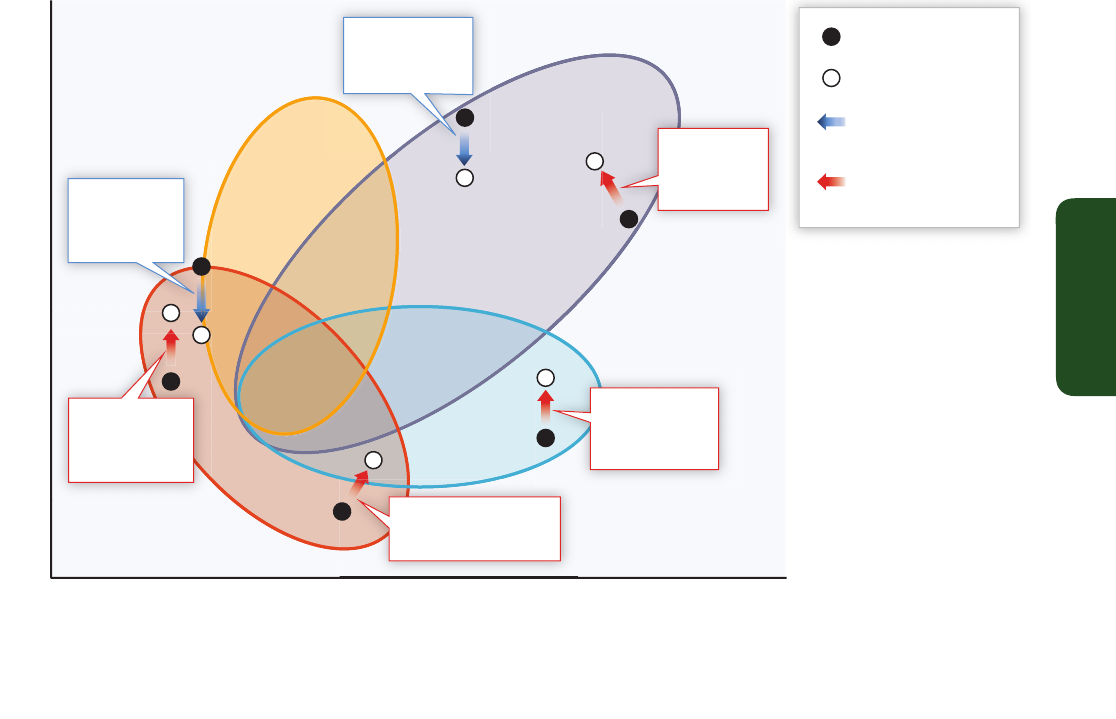
73
Technical Summary
TS
embedded in livelihoods and expressed in narratives, worldviews, identity,
community cohesion, and sense of place. Loss of land and displacement,
for example, on small islands and coastal communities, have well
documented negative cultural and well-being impacts. [12.3, 12.4]
Climate change over the 21st century is projected to increase
displacement of people (medium evidence, high agreement).
Displacement risk increases when populations that lack the resources
for planned migration experience higher exposure to extreme weather
events, in both rural and urban areas, particularly in developing countries
with low income. Expanding opportunities for mobility can reduce
vulnerability for such populations. Changes in migration patterns can
be responses to both extreme weather events and longer-term climate
variability and change, and migration can also be an effective adaptation
strategy. There is low confidence in quantitative projections of changes
in mobility, due to its complex, multi-causal nature. [9.3, 12.4, 19.4,
22.3, 25.9]
Climate change can indirectly increase risks of violent conflicts
in the form of civil war and inter-group violence by amplifying
well-documented drivers of these conflicts such as poverty and
economic shocks (medium confidence).
Multiple lines of evidence
relate climate variability to these forms of conflict. [12.5, 13.2, 19.4]
The impacts of climate change on the critical infrastructure and
territorial integrity of many states are expected to influence
national security policies (medium evidence, medium agreement).
For example, land inundation due to sea level rise poses risks to the
territorial integrity of small island states and states with extensive
coastlines. Some transboundary impacts of climate change, such as
changes in sea ice, shared water resources, and pelagic fish stocks, have
the potential to increase rivalry among states, but robust national and
intergovernmental institutions can enhance cooperation and manage
many of these rivalries. [12.5, 12.6, 23.9, 25.9]
Livelihoods and Poverty
Throughout the 21st century, climate-change impacts are projected
to slow down economic growth, make poverty reduction more
difficult, further erode food security, and prolong existing and
create new poverty traps, the latter particularly in urban areas
and emerging hotspots of hunger (medium confidence).
Climate-
change impacts are expected to exacerbate poverty in most developing
countries and create new poverty pockets in countries with increasing
inequality, in both developed and developing countries. In urban and
rural areas, wage-labor-dependent poor households that are net
buyers of food are expected to be particularly affected due to food
price increases, including in regions with high food insecurity and high
inequality (particularly in Africa), although the agricultural self-employed
could benefit. Insurance programs, social protection measures, and
disaster risk management may enhance long-term livelihood resilience
Climate stress
Local National
Scales of insecurity
Transboundary
Low
High
Conflict
Migration
and mobility
C
ultural
change
L
i
v
e
li
ho
o
d
s
Education for
women enhances
f
ood security
(
Section
1
2.2
)
I
ncome loss reduces
m
obility for low-
income pastoralists
(Section
12.2
)
L
and grabs
exacerbate land
t
enure conflicts
(Section
1
2.5)
Transboundary
i
nstitutions mediate
resource rivalry
(
Section
12.6
)
Planned resettlement
can disrupt identity
a
nd livelihood
(Section
1
2.4)
Climate stresses lead to
i
nvoluntary abandonment of
settlements
(
Section
12.4)
I
nitial conditions
Outcome of intervention
I
ntervention with net
increase in human security
I
ntervention with net
decrease in human security
Figure TS.11 | Schematic of climate change risks for human security and the interactions between livelihoods, conflict, culture, and migration. Interventions and policies are
indicated by the difference between initial conditions (solid black circles) and the outcome of intervention (white circles). Some interventions (blue arrows) show net increase in
human security while others (red arrows) lead to net decrease in human security. [Figure 12-3]

74
Technical Summary
TS
Box TS.7 | Ocean Acidification
Anthropogenic ocean acidification and global warming share the same primary cause, which is the increase of atmospheric CO
2
(Box TS.7 Figure 1A). [WGI AR5 2.2] Eutrophication, upwelling, and deposition of atmospheric nitrogen and sulfur contribute to ocean
acidification locally. [5.3, 6.1, 30.3] The fundamental chemistry of ocean acidification is well understood (robust evidence, high
agreement). [30.3; WGI AR5 3.8, 6.4] It has been more difficult to understand and project changes within the more complex coastal
systems. [5.3, 30.3]
Ocean acidification acts together with other global changes (e.g., warming, decreasing oxygen levels) and with local changes (e.g.,
pollution, eutrophication) (high confidence). Simultaneous drivers, such as warming and ocean acidification, can lead to interactive,
complex, and amplified impacts for species and ecosystems. A pattern of positive and negative impacts of ocean acidification
emerges for processes and organisms (high confidence; Box TS.7 Figure 1B), but key uncertainties remain from organismal to
ecosystem levels. A wide range of sensitivities exists within and across organisms, with higher sensitivity in early life stages. [6.3]
Lower pH decreases the rate of calcification of most, but not all, sea floor calcifiers, reducing their competitiveness with non-calcifiers
(robust evidence, medium agreement). [5.4, 6.3] Ocean acidification stimulates dissolution of calcium carbonate (very high confidence).
Growth and primary production are stimulated in seagrasses and some phytoplankton (high confidence), and harmful algal blooms
could become more frequent (limited evidence, medium agreement). Serious behavioral disturbances have been reported in fishes
Continued next page
Burning of fossil
fuels, cement
manufacture,
and land use
change
Increase in
atmospheric
CO
2
High certainty Low certainty
• Increased CO
2
,
bicarbonate
ions, and acidity
• Decreased
carbonate ions
and pH
• Reduced shell and
skeleton production
• Changes in
assemblages, food
webs, and ecosystems
• Biodiversity loss
• Changes in biogas
production and
feedback to climate
• Fisheries,
aquaculture, and
food security
• Coastal protection
• Tourism
• Climate regulation
• Carbon storage
• UN Framework Convention on
Climate Change: Conference
of the Parties, IPCC,
Conference on Sustainable
Development (Rio+20)
• Convention on Biological
Diversity
• Geoengineering
• Regional and local acts, laws,
and policies to reduce other
stresses
(A)
–0.75 –0.50 –0.25 0
0.25
Mean effect size (lnRR)
Abundance
Calcification
Development
Growth
Metabolism
Photosynthesis
Survival
(72)
(110)
(24)
(173)
(32)
(82)
(69)
(B)
Ocean acidification
Atmospheric
change
Changes to organisms
and ecosystems
Socioeconomic impacts
Ocean warming and deoxgenation
Policy options for actionDriver
Box TS.7 Figure 1 | (A) Overview of the chemical, biological, and
socioeconomic impacts of ocean acidification and of policy options. (B)
Effect of near-future acidification (seawater pH reduction of ≤0.5 units)
on major response variables estimated using weighted random effects
meta-analyses, with the exception of survival, which is not weighted. The
log-transformed response ratio (lnRR) is the ratio of the mean effect in
the acidification treatment to the mean effect in a control group. It
indicates which process is most uniformly affected by ocean acidification,
but large variability exists between species. Significance is determined
when the 95% bootstrapped confidence interval does not cross zero. The
number of experiments used in the analyses is shown in parentheses.
The * denotes a statistically significant effect. [Figure OA-1, Box CC-OA]
*
*
*
*
*

75
Technical Summary
TS
among poor and marginalized people, if policies address poverty and
multidimensional inequalities. [8.1, 8.3, 8.4, 9.3, 10.9, 13.2 to 13.4, 22.3,
26.8]
B-3. Regional Risks and Potential for Adaptation
Risks will vary through time across regions and populations, dependent
on myriad factors including the extent of adaptation and mitigation. A
selection of key regional risks identified with medium to high confidence
is presented in Table TS.5. Projected changes in climate and increasing
atmospheric CO
2
will have positive effects for some sectors in some
locations. For extended summary of regional risks and the more limited
potential benefits, see introductory overviews for each region below
and also WGII AR5 Part B: Regional Aspects, Chapters 21 to 30.
Africa. Climate change will amplify existing stress on water
availability and on agricultural systems particularly in semi-arid
environments (high confidence).
Increasing temperatures and changes
in precipitation are very likely to reduce cereal crop productivity with
strong adverse effects on food security (high confidence). Progress has
been achieved on managing risks to food production from current
climate variability and near-term climate change, but this will not be
sufficient to address long-term impacts of climate change. Adaptive
agricultural processes such as collaborative, participatory research that
includes scientists and farmers, strengthened communication systems
for anticipating and responding to climate risks, and increased flexibility
in livelihood options provide potential pathways for strengthening
adaptive capacities. Climate change is a multiplier of existing health
vulnerabilities including insufficient access to safe water and improved
sanitation, food insecurity, and limited access to health care and
education. Strategies that integrate consideration of climate change risks
with land and water management and disaster risk reduction bolster
resilient development. [22.3 to 22.4, 22.6]
Europe. Climate change will increase the likelihood of systemic
failures across European countries caused by extreme climate
events affecting multiple sectors (medium confidence).
Sea level rise
and increases in extreme rainfall are projected to further increase coastal
and river flood risks and without adaptive measures will substantially
increase flood damages (i.e., people affected and economic losses);
adaptation can prevent most of the projected damages (high confidence).
Heat-related deaths and injuries are likely to increase, particularly in
southern Europe (medium confidence). Climate change is likely to increase
cereal crop yields in northern Europe (medium confidence) but decrease
yields in southern Europe (high confidence). Climate change will increase
irrigation needs in Europe, and future irrigation will be constrained by
reduced runoff, demand from other sectors, and economic costs, with
integrated water management a strategy for addressing competing
demands. Hydropower production is likely to decrease in all sub-regions
except Scandinavia. Climate change is very likely to cause changes in
habitats and species, with local extinctions (high confidence), continental-
scale shifts in species distributions (medium confidence), and significantly
reduced alpine plant habitat (high confidence). Climate change is likely
to entail the loss or displacement of coastal wetlands. The introduction
and expansion of invasive species, especially those with high migration
rates, from outside Europe is likely to increase with climate change
(medium confidence). [23.2 to 23.9]
Box TS.7 (continued)
(high confidence). [6.3] Natural analogs at CO
2
vents indicate decreased species diversity, biomass, and trophic complexity. Shifts in
organisms’ performance and distribution will change both predator-prey and competitive interactions, which could impact food webs
and higher trophic levels (limited evidence, high agreement). [6.3]
A few studies provide limited evidence for adaptation in phytoplankton and mollusks. However, mass extinctions in Earth history
occurred during much slower rates of change in ocean acidification, combined with other drivers, suggesting that evolutionary rates
may be too slow for sensitive and long-lived species to adapt to the projected rates of future change (medium confidence). [6.1]
The biological, ecological, and biogeochemical changes driven by ocean acidification will affect key ecosystem services. The oceans
will become less efficient at absorbing CO
2
and hence moderating climate (very high confidence). [WGI AR5 Figure 6.26] The impacts
of ocean acidification on coral reefs, together with those of thermal stress (driving mass coral bleaching and mortality) and sea level
rise, will diminish their role in shoreline protection as well as their direct and indirect benefits to fishing and tourism industries (limited
evidence, high agreement). [Box CC-CR] The global cost of production loss of mollusks could be over US$100 billion by 2100 (low
confidence). The largest uncertainty is how the impacts on lower trophic levels will propagate through the food webs and to top
predators. Models suggest that ocean acidification will generally reduce fish biomass and catch (low confidence) and complex
additive, antagonistic, and/or synergistic interactions will occur with disruptive ramifications for ecosystems as well as for important
ecosystem goods and services.
76
Technical Summary
TS
A
sia. Climate change will cause declines in agricultural productivity
in many sub-regions of Asia, for crops such as rice (medium
confidence).
In Central Asia, cereal production in northern and eastern
Kazakhstan could benefit from the longer growing season, warmer
winters, and slight increase in winter precipitation, while droughts in
western Turkmenistan and Uzbekistan could negatively affect cotton
production, increase water demand for irrigation, and exacerbate
desertification. The effectiveness of potential and practiced agricultural
adaptation strategies is not well understood. Future projections of
precipitation at sub-regional scales and thus of freshwater availability
in most parts of Asia are uncertain (low confidence in projections), but
increased water demand from population growth, increased water
consumption per capita, and lack of good management will increase
water scarcity challenges for most of the region (medium confidence).
Adaptive responses include integrated water management strategies,
such as development of water-saving technologies, increased water
productivity, and water reuse. Extreme climate events will have an
i
ncreasing impact on human health, security, livelihoods, and poverty,
with the type and magnitude of impact varying across Asia (high
confidence). In many parts of Asia, observed terrestrial impacts, such as
permafrost degradation and shifts in plant species’ distributions, growth
rates, and timing of seasonal activities, will increase due to climate
change projected during the 21st century. Coastal and marine systems
in Asia, such as mangroves, seagrass beds, salt marshes, and coral reefs,
are under increasing stress from climatic and non-climatic drivers. In
the Asian Arctic, sea level rise interacting with projected changes in
permafrost and the length of the ice-free season will increase rates of
coastal erosion (medium evidence, high agreement). [24.4, 30.5]
Australasia. Without adaptation, further changes in climate,
atmospheric carbon dioxide, and ocean acidity are projected to
have substantial impacts on water resources, coastal ecosystems,
infrastructure, health, agriculture, and biodiversity (high
confidence).
Freshwater resources are projected to decline in far
Key risk Adaptation issues & prospects
Climatic
drivers
Risk & potential for
adaptation
Timeframe
Africa
Near term
(2030–2040)
Present
Long term
(2080–2100)
2°C
4°C
Very
low
Very
high
Medium
Near term
(2030–2040)
Present
Long term
(2080–2100)
2°C
4°C
Very
low
Very
high
Medium
Near term
(2030–2040)
Present
Long term
(2080–2100)
2°C
4°C
Very
low
Very
high
Medium
Carbon dioxide
fertilization
C
OO
Damaging
cyclone
Ocean
acidification
Precipitation
C
O
O
Climate-related drivers of impacts
Warming
trend
Extreme
precipitation
Extreme
temperature
Sea
level
Level of risk & potential for adaptation
Potential for additional adaptation
to reduce risk
Risk level with
current adaptation
Risk level with
high adaptation
Drying
trend
Snow
cover
Compounded stress on water resources facing
significant strain from overexploitation and
degradation at present and increased demand in the
future, with drought stress exacerbated in
drought-prone regions of Africa (high confidence)
[22.3, 22.4]
• Reducing non-climate stressors on water resources
• Strengthening institutional capacities for demand management,
groundwater assessment, integrated water-wastewater planning,
and integrated land and water governance
• Sustainable urban development
Reduced crop productivity associated with heat and
drought stress, with strong adverse effects on
regional, national, and household livelihood and food
security, also given increased pest and disease
damage and flood impacts on food system
infrastructure (high confidence)
[22.3, 22.4]
• Technological adaptation responses (e.g., stress-tolerant crop
varieties, irrigation, enhanced observation systems)
• Enhancing smallholder access to credit and other critical production
resources; Diversifying livelihoods
• Strengthening institutions at local, national, and regional levels to
support agriculture (including early warning systems) and
gender-oriented policy
• Agronomic adaptation responses (e.g., agroforestry, conservation
agriculture)
Changes in the incidence and geographic range of
vector- and water-borne diseases due to changes in
the mean and variability of temperature and
precipitation, particularly along the edges of their
distribution (medium confidence)
[22.3]
• Achieving development goals, particularly improved access to safe
water and improved sanitation, and enhancement of public health
functions such as surveillance
• Vulnerability mapping and early warning systems
• Coordination across sectors
• Sustainable urban development
Continued next page
Table TS.5 | Key regional risks from climate change and the potential for reducing risks through adaptation and mitigation. Key risks have been identified based on assessment of the relevant
scientific, technical, and socioeconomic literature detailed in supporting chapter sections. Identification of key risks was based on expert judgment using the following specific criteria: large
magnitude, high probability, or irreversibility of impacts; timing of impacts; persistent vulnerability or exposure contributing to risks; or limited potential to reduce risks through adaptation or
mitigation. Each key risk is characterized as very low to very high for three timeframes: the present, near term (here, assessed over 2030–2040), and longer term (here, assessed over 2080–2100).
The risk levels integrate probability and consequence over the widest possible range of potential outcomes, based on available literature. These potential outcomes result from the interaction of
climate-related hazards, vulnerability, and exposure. Each risk level reflects total risk from climatic and non-climatic factors. For the near-term era of committed climate change, projected levels of
global mean temperature increase do not diverge substantially for different emission scenarios. For the longer-term era of climate options, risk levels are presented for two scenarios of global mean
temperature increase (2°C and 4°C above preindustrial levels). These scenarios illustrate the potential for mitigation and adaptation to reduce the risks related to climate change. For the present,
risk levels were estimated for current adaptation and a hypothetical highly adapted state, identifying where current adaptation deficits exist. For the two future timeframes, risk levels were
estimated for a continuation of current adaptation and for a highly adapted state, representing the potential for and limits to adaptation. Climate-related drivers of impacts are indicated by icons.
Key risks and risk levels vary across regions and over time, given differing socioeconomic development pathways, vulnerability and exposure to hazards, adaptive capacity, and risk perceptions. Risk
levels are not necessarily comparable, especially across regions, because the assessment considers potential impacts and adaptation in different physical, biological, and human systems across
diverse contexts. This assessment of risks acknowledges the importance of differences in values and objectives in interpretation of the assessed risk levels.
77
Technical Summary
TS
southwest and far southeast mainland Australia (high confidence) and
for some rivers in New Zealand (medium confidence). Rising sea levels
and increasing heavy rainfall are projected to increase erosion and
inundation, with consequent damages to many low-lying ecosystems,
infrastructure, and housing (high confidence); increasing heat waves will
increase risks to human health; rainfall changes and rising temperatures
will shift agricultural production zones; and many native species will
suffer from range contractions and some may face local or even global
extinction. Uncertainty in projected rainfall changes remains large for
many parts of Australia and New Zealand, which creates significant
challenges for adaptation. Some sectors in some locations have the
potential to benefit from projected changes in climate and increasing
atmospheric CO
2
, for example due to reduced energy demand for winter
heating in New Zealand and southern parts of Australia, and due to
forest growth in cooler regions except where soil nutrients or rainfall
are limiting. Indigenous peoples in both Australia and New Zealand
have higher than average exposure to climate change due to a heavy
reliance on climate-sensitive primary industries and strong social
connections to the natural environment, and face additional constraints
to adaptation (medium confidence). [25.2, 25.3, 25.5 to 25.8, Boxes
25-1, 25-2, 25-5, and 25-8]
North America. Many climate-related hazards that carry risk,
particularly related to severe heat, heavy precipitation, and
declining snowpack, will increase in frequency and/or severity in
North America in the next decades (very high confidence).
Climate
Continued next page
Key risk Adaptation issues & prospects
Climatic
drivers
Risk & potential for
adaptation
Timeframe
Europe
N
ear term
(2030–2040)
Present
Long term
(
2080–2100)
2°C
4°C
Very
low
Very
high
Medium
Near term
(
2030–2040)
Present
L
ong term
(
2080–2100)
2°C
4°C
Very
low
Very
high
Medium
N
ear term
(2030–2040)
Present
Long term
(2080–2100)
2°C
4°C
Very
l
ow
Very
high
Medium
Increased economic losses and people affected by
flooding in river basins and coasts, driven by
increasing urbanization, increasing sea levels,
coastal erosion, and peak river discharges
(high confidence)
[23.2, 23.3, 23.7]
Adaptation can prevent most of the projected damages (high
confidence).
• Significant experience in hard flood-protection technologies and
increasing experience with restoring wetlands
• High costs for increasing flood protection
•
Potential barriers to implementation: demand for land in Europe
and environmental and landscape concerns
Increased water restrictions. Significant reduction in
water availability from river abstraction and from
groundwater resources, combined with increased
water demand (e.g., for irrigation, energy and industry,
domestic use) and with reduced water drainage and
runoff as a result of increased evaporative demand,
particularly in southern Europe (high confidence)
[23.4, 23.7]
• Proven adaptation potential from adoption of more water-efficient
technologies and of water-saving strategies (e.g., for irrigation, crop
species, land cover, industries, domestic use)
• Implementation of best practices and governance instruments in
river basin management plans and integrated water management
I
ncreased economic losses and people affected by
e
xtreme heat events: impacts on health and
w
ell-being, labor productivity, crop production, air
q
uality, and increasing risk of wildfires in southern
E
urope and in Russian boreal region
(
medium confidence)
[
23.3 to 23.7, Table 23-1]
•
Implementation of warning systems
•
Adaptation of dwellings and workplaces and of transport and
e
nergy infrastructure
•
Reductions in emissions to improve air quality
• Improved wildfire management
• Development of insurance products against weather-related yield
variations
Key risk Adaptation issues & prospects
Climatic
drivers
Risk & potential for
adaptation
Timeframe
Asia
Near term
(2030–2040)
Present
Long term
(2080–2100)
2°C
4°C
Very
low
Very
high
M
edium
Near term
(2030–2040)
Present
Long term
(2080–2100)
2°C
4°C
Very
l
ow
Very
high
Medium
Near term
(2030–2040)
Present
Long term
(2080–2100)
2°C
4°C
Very
low
Very
high
Medium
Increased riverine, coastal, and urban
flooding leading to widespread damage
to infrastructure, livelihoods, and
settlements in Asia (medium confidence)
[24.4]
• Exposure reduction via structural and non-structural measures, effective
land-use planning, and selective relocation
• Reduction in the vulnerability of lifeline infrastructure and services (e.g., water,
energy, waste management, food, biomass, mobility, local ecosystems,
telecommunications)
• Construction of monitoring and early warning systems; Measures to identify
exposed areas, assist vulnerable areas and households, and diversify livelihoods
• Economic diversification
Increased risk of heat-related mortality
(high confidence)
[24.4]
• Heat health warning systems
• Urban planning to reduce heat islands; Improvement of the built environment;
Development of sustainable cities
• New work practices to avoid heat stress among outdoor workers
Increased risk of drought-related water
and food shortage causing malnutrition
(high confidence)
[24.4]
• Disaster preparedness including early-warning systems and local coping
strategies
• Adaptive/integrated water resource management
• Water infrastructure and reservoir development
• Diversification of water sources including water re-use
• More efficient use of water (e.g., improved agricultural practices, irrigation
management, and resilient agriculture)
Table TS.5 (continued)
78
Technical Summary
TS
change will amplify risks to water resources already affected by non-
climatic stressors, with potential impacts associated with decreased
snowpack, decreased water quality, urban flooding, and decreased
water supplies for urban areas and irrigation (high confidence). More
adaptation options are available to address water supply deficits than
flooding and water quality concerns (medium confidence). Ecosystems
are under increasing stress from rising temperatures, CO
2
concentrations,
and sea levels, with particular vulnerability to climate extremes (very
high confidence). In many cases, climate stresses exacerbate other
anthropogenic influences on ecosystems, including land use changes,
non-native species, and pollution. Projected increases in temperature,
reductions in precipitation in some regions, and increased frequency
of extreme events would result in net productivity declines in major
North American crops by the end of the 21st century without
adaptation, although some regions, particularly in the north, may benefit.
Adaptation, often with mitigation co-benefits, could offset projected
negative yield impacts for many crops at 2°C global mean temperature
increase above preindustrial levels, with reduced effectiveness of
adaptation at 4°C (high confidence). Although larger urban centers
would have higher adaptive capacities, high population density,
inadequate infrastructures, lack of institutional capacity, and degraded
natural environments increase future climate risks from heat waves,
droughts, storms, and sea level rise (medium evidence, high agreement).
Future risks from climate extremes can be reduced, for example
through targeted and sustainable air conditioning, more effective
warning and response systems, enhanced pollution controls, urban
Continued next page
C
OO
Key risk Adaptation issues & prospects
Climatic
drivers
Risk & potential for
adaptation
Timeframe
Australasia
N
ear term
(
2030–2040)
P
resent
L
ong term
(
2080–2100)
2°C
4°C
Very
low
Very
high
Medium
Near term
(
2030–2040)
Present
Long term
(2080–2100)
2°C
4°C
Very
low
Very
h
igh
M
edium
N
ear term
(
2030–2040)
P
resent
L
ong term
(
2080–2100)
2°C
4°C
V
ery
low
Very
h
igh
Medium
S
ignificant change in community
c
omposition and structure of coral reef
s
ystems in Australia (high confidence)
[
25.6, 30.5, Boxes CC-CR and CC-OA]
•
Ability of corals to adapt naturally appears limited and insufficient to offset the
d
etrimental effects of rising temperatures and acidification.
•
Other options are mostly limited to reducing other stresses (water quality,
t
ourism, fishing) and early warning systems; direct interventions such as assisted
c
olonization and shading have been proposed but remain untested at scale.
I
ncreased frequency and intensity of flood
d
amage to infrastructure and settlements
i
n Australia and New Zealand
(
high confidence)
[
Table 25-1, Boxes 25-8 and 25-9]
•
Significant adaptation deficit in some regions to current flood risk.
•
Effective adaptation includes land-use controls and relocation as well as
p
rotection and accommodation of increased risk to ensure flexibility.
Increasing risks to coastal infrastructure
and low-lying ecosystems in Australia and
New Zealand, with widespread damage
towards the upper end of projected
sea-level-rise ranges (high confidence)
[25.6, 25.10, Box 25-1]
• Adaptation deficit in some locations to current coastal erosion and flood risk.
Successive building and protection cycles constrain flexible responses.
• Effective adaptation includes land-use controls and ultimately relocation as well
as protection and accommodation.
Near term
(2030–2040)
Present
Long term
(2080–2100)
2°C
4°C
Very
low
Very
high
Medium
Near term
(2030–2040)
Present
Long term
(2080–2100)
2°C
4°C
Very
low
Very
high
Medium
Heat-related human mortality
(high confidence)
[26.6, 26.8]
• Residential air conditioning (A/C) can effectively reduce risk. However,
availability and usage of A/C is highly variable and is subject to complete loss
during power failures. Vulnerable populations include athletes and outdoor
workers for whom A/C is not available.
• Community- and household-scale adaptations have the potential to reduce
exposure to heat extremes via family support, early heat warning systems,
cooling centers, greening, and high-albedo surfaces.
Urban floods in riverine and coastal areas,
inducing property and infrastructure
damage; supply chain, ecosystem, and
social system disruption; public health
impacts; and water quality impairment, due
to sea level rise, extreme precipitation, and
cyclones (high confidence)
[26.2 to 26.4, 26.8]
• Implementing management of urban drainage is expensive and disruptive to
urban areas.
• Low-regret strategies with co-benefits include less impervious surfaces leading
to more groundwater recharge, green infrastructure, and rooftop gardens.
• Sea level rise increases water elevations in coastal outfalls, which impedes
drainage. In many cases, older rainfall design standards are being used that need
to be updated to reflect current climate conditions.
• Conservation of wetlands, including mangroves, and land-use planning
strategies can reduce the intensity of flood events.
Key risk Adaptation issues & prospects
Climatic
drivers
Risk & potential for
adaptation
Timeframe
North America
Near term
(2030–2040)
Present
Long term
(2080–2100)
2°C
4°C
Very
low
Very
high
Medium
Wildfire-induced loss of ecosystem
integrity, property loss, human morbidity,
and mortality as a result of increased
drying trend and temperature trend
(high confidence)
[26.4, 26.8, Box 26-2]
• Some ecosystems are more fire-adapted than others. Forest managers and
municipal planners are increasingly incorporating fire protection measures (e.g.,
prescribed burning, introduction of resilient vegetation). Institutional capacity to
support ecosystem adaptation is limited.
• Adaptation of human settlements is constrained by rapid private property
development in high-risk areas and by limited household-level adaptive capacity.
• Agroforestry can be an effective strategy for reduction of slash and burn
practices in Mexico.
Table TS.5 (continued)
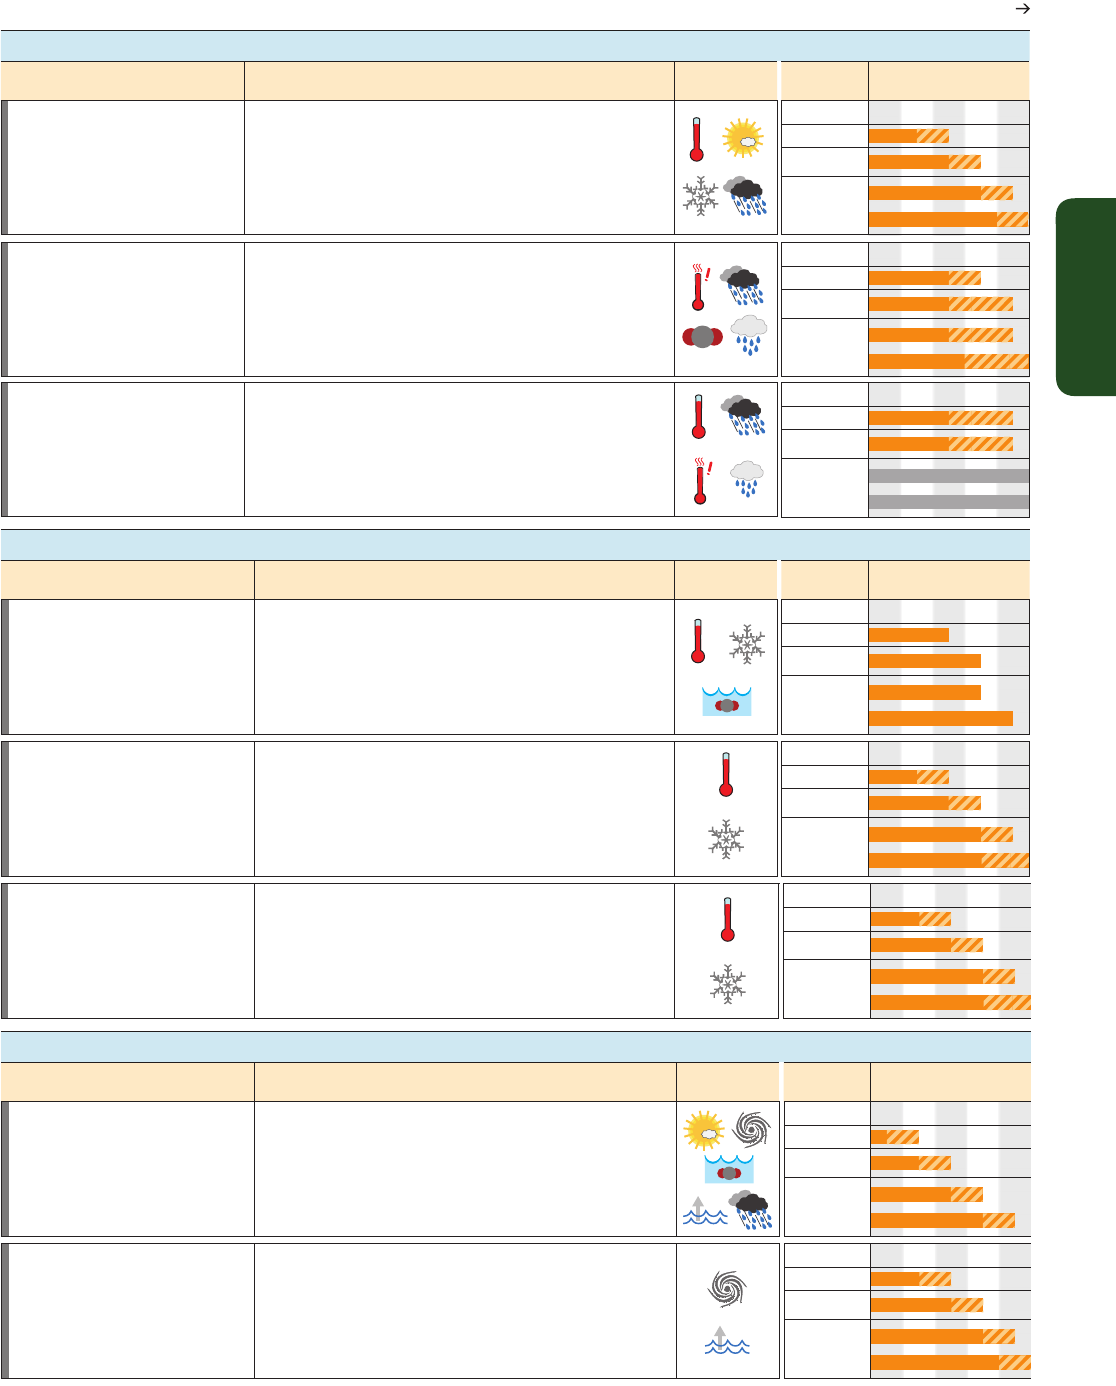
79
Technical Summary
TS
Continued next page
n
ot available
not available
Key risk Adaptation issues & prospects
Climatic
drivers
Risk & potential for
adaptation
Timeframe
Central and South America
N
ear term
(
2030–2040)
P
resent
L
ong term
(
2080–2100)
2°C
4°C
Very
low
Very
high
Medium
Near term
(
2030–2040)
Present
Long term
(2080–2100)
2°C
4°C
Very
low
Very
h
igh
Medium
C
O
O
W
ater availability in semi-arid and
g
lacier-melt-dependent regions and Central
A
merica; flooding and landslides in urban
a
nd rural areas due to extreme precipitation
(
high confidence)
[
27.3]
•
Integrated water resource management
•
Urban and rural flood management (including infrastructure), early warning
s
ystems, better weather and runoff forecasts, and infectious disease control
Decreased food production and food quality
(medium confidence)
[
27.3]
• Development of new crop varieties more adapted to climate change
(temperature and drought)
• Offsetting of human and animal health impacts of reduced food quality
•
Offsetting of economic impacts of land-use change
•
Strengthening traditional indigenous knowledge systems and practices
Near term
(
2030–2040)
P
resent
Long term
(2080–2100)
2°C
4°C
V
ery
low
V
ery
high
Medium
S
pread of vector-borne diseases in altitude
a
nd latitude (high confidence)
[27.3]
• Development of early warning systems for disease control and mitigation
b
ased on climatic and other relevant inputs. Many factors augment
v
ulnerability.
•
Establishing programs to extend basic public health services
Very
low
Very
high
Medium
Key risk Adaptation issues & prospects
Climatic
drivers
Risk & potential for
adaptation
Timeframe
Small Islands
Near term
(2030–2040)
Present
Long term
(2080–2100)
2°C
4°C
Very
low
Very
high
Medium
Near term
(2030–2040)
Present
Long term
(2080–2100)
2°C
4°C
Very
low
Very
high
Medium
Key risk Adaptation issues & prospects
Climatic
drivers
Risk & potential for
adaptation
Timeframe
Polar Regions
Near term
(2030–2040)
Present
Long term
(2080–2100)
2°C
4°C
Very
low
Very
high
Medium
Near term
(2030–2040)
Present
Long term
(2080–2100)
2°C
4°C
Very
low
Very
high
Medium
C
OO
C
OO
Loss of livelihoods, coastal settlements,
infrastructure, ecosystem services, and
economic stability (high confidence)
[29.6, 29.8, Figure 29-4]
• Significant potential exists for adaptation in islands, but additional external
resources and technologies will enhance response.
• Maintenance and enhancement of ecosystem functions and services and of
water and food security
• Efficacy of traditional community coping strategies is expected to be
substantially reduced in the future.
The interaction of rising global mean sea level
in the 21st century with high-water-level
events will threaten low-lying coastal areas
(high confidence)
[29.4, Table 29-1; WGI AR5 13.5, Table 13.5]
• High ratio of coastal area to land mass will make adaptation a significant
financial and resource challenge for islands.
• Adaptation options include maintenance and restoration of coastal landforms
and ecosystems, improved management of soils and freshwater resources, and
appropriate building codes and settlement patterns.
Risks for freshwater and terrestrial ecosystems
(high confidence) and marine ecosystems
(medium confidence), due to changes in ice,
snow cover, permafrost, and freshwater/ocean
conditions, affecting species´ habitat quality,
ranges, phenology, and productivity, as well as
dependent economies
[28.2 to 28.4]
• Improved understanding through scientific and indigenous knowledge,
producing more effective solutions and/or technological innovations
• Enhanced monitoring, regulation, and warning systems that achieve safe and
sustainable use of ecosystem resources
• Hunting or fishing for different species, if possible, and diversifying income
sources
Risks for the health and well-being of Arctic
residents, resulting from injuries and illness
from the changing physical environment,
food insecurity, lack of reliable and safe
drinking water, and damage to
infrastructure, including infrastructure in
permafrost regions (high confidence)
[28.2 to 28.4]
• Co-production of more robust solutions that combine science and technology
with indigenous knowledge
• Enhanced observation, monitoring, and warning systems
• Improved communications, education, and training
• Shifting resource bases, land use, and/or settlement areas
Near term
(2030–2040)
Present
Long term
(2080–2100)
2°C
4°C
Unprecedented challenges for northern
communities due to complex inter-linkages
between climate-related hazards and societal
factors, particularly if rate of change is faster
than social systems can adapt
(high confidence)
[28.2 to 28.4]
• Co-production of more robust solutions that combine science and
technology with indigenous knowledge
• Enhanced observation, monitoring, and warning systems
• Improved communications, education, and training
• Adaptive co-management responses developed through the settlement of
land claims
Table TS.5 (continued)

80
Technical Summary
TS
planning strategies, and resilient health infrastructure (high confidence).
[26.3 to 26.6, 26.8]
Central and South America. Despite improvements, high and
persistent levels of poverty in most countries result in high
vulnerability to climate variability and change (high confidence).
Climate change impacts on agricultural productivity are expected to
exhibit large spatial variability, for example with sustained or increased
productivity through mid-century in southeast South America and
decreases in productivity in the near term (by 2030) in Central America,
threatening food security of the poorest populations (medium confidence).
Reduced precipitation and increased evapotranspiration in semi-arid
regions will increase risks from water-supply shortages, affecting cities,
hydropower generation, and agriculture (high confidence). Ongoing
adaptation strategies include reduced mismatch between water supply
and demand, and water-management and coordination reforms (medium
confidence). Conversion of natural ecosystems, a driver of anthropogenic
climate change, is the main cause of biodiversity and ecosystem loss
(high confidence). Climate change is expected to increase rates of
species extinction (medium confidence). In coastal and marine systems,
sea level rise and human stressors increase risks for fish stocks,
corals, mangroves, recreation and tourism, and control of diseases (high
confidence). Climate change will exacerbate future health risks given
regional population growth rates and vulnerabilities due to pollution,
food insecurity in poor regions, and existing health, water, sanitation,
and waste collection systems (medium confidence). [27.2, 27.3]
Polar Regions. Climate change and often-interconnected non-
climate-related drivers, including environmental changes,
demography, culture, and economic development, interact in the
Arctic to determine physical, biological, and socioeconomic
risks, with rates of change that may be faster than social systems
can adapt (high confidence).
Thawing permafrost and changing
precipitation patterns have the potential to affect infrastructure and
related services, with particular risks for residential buildings, for
example in Arctic cities and small rural settlements. Climate change will
especially impact Arctic communities that have narrowly based
economies limiting adaptive choices. Increased Arctic navigability and
expanded land- and freshwater-based transportation networks will
increase economic opportunities. Impacts on the informal, subsistence-
based economy will include changing sea ice conditions that increase
the difficulty of hunting marine mammals. Polar bears have been and
will be affected by loss of annual ice over continental shelves, decreased
ice duration, and decreased ice thickness. Already, accelerated rates of
change in permafrost thaw, loss of coastal sea ice, sea level rise, and
increased intensity of weather extremes are forcing relocation of some
indigenous communities in Alaska (high confidence). In the Arctic and
Antarctic, some marine species will shift their ranges in response to
changing ocean and sea ice conditions (medium confidence). Climate
change will increase the vulnerability of terrestrial ecosystems to invasions
by non-indigenous species (high confidence). [6.3, 6.5, 28.2 to 28.4]
Small Islands. Small islands have high vulnerability to climatic
and non-climatic stressors (high confidence).
Diverse physical and
human attributes and their sensitivity to climate-related drivers lead to
variable climate change risk profiles and adaptation from one island
region to another and among countries in the same region. Risks can
originate from transboundary interactions, for example associated with
existing and future invasive species and human health challenges. Sea
level rise poses one of the most widely recognized climate change
threats to low-lying coastal areas on islands and atolls. Projected sea
level rise at the end of the 21st century, superimposed on extreme-
sea-level events, presents severe coastal flooding and erosion risks for
low-lying coastal areas and atoll islands. Wave over-wash will degrade
groundwater resources. Coral reef ecosystem degradation associated
with increasing sea surface temperature and ocean acidification will
Key risk
Adaptation issues & prospects
Climatic
drivers
Risk & potential for
adaptation
Timeframe
The Ocean
N
ear term
(2030–2040)
P
resent
L
ong term
(
2080–2100)
2°C
4°C
Very
low
Very
high
M
edium
N
ear term
(2030–2040)
Present
L
ong term
(
2080–2100)
2°C
4°C
Very
l
ow
Very
high
M
edium
Near term
(
2030–2040)
P
resent
Long term
(2080–2100)
2°C
4°C
Very
l
ow
Very
h
igh
Medium
C
O
O
C
OO
D
istributional shift in fish and invertebrate
s
pecies, and decrease in fisheries catch
p
otential at low latitudes, e.g., in equatorial
u
pwelling and coastal boundary systems and
s
ub-tropical gyres (high confidence)
[
6.3, 30.5, 30.6, Tables 6-6 and 30-3, Box
CC-MB]
•
Evolutionary adaptation potential of fish and invertebrate species to warming
i
s limited as indicated by their changes in distribution to maintain temperatures.
• Human adaptation options: Large-scale translocation of industrial fishing
activities following the regional decreases (low latitude) vs. possibly transient
increases (high latitude) in catch potential; Flexible management that can react
to variability and change; Improvement of fish resilience to thermal stress by
reducing other stressors such as pollution and eutrophication; Expansion of
s
ustainable aquaculture and the development of alternative livelihoods in some
r
egions.
R
educed biodiversity, fisheries abundance,
a
nd coastal protection by coral reefs due to
h
eat-induced mass coral bleaching and
m
ortality increases, exacerbated by ocean
a
cidification, e.g., in coastal boundary systems
a
nd sub-tropical gyres (high confidence)
[
5.4, 6.4, 30.3, 30.5, 30.6, Tables 6-6 and
3
0-3, Box CC-CR]
•
Evidence of rapid evolution by corals is very limited. Some corals may migrate
t
o higher latitudes, but entire reef systems are not expected to be able to track
t
he high rates of temperature shifts.
• Human adaptation options are limited to reducing other stresses, mainly by
enhancing water quality, and limiting pressures from tourism and fishing. These
options will delay human impacts of climate change by a few decades, but their
efficacy will be severely reduced as thermal stress increases.
Coastal inundation and habitat loss due to
sea level rise, extreme events, changes in
precipitation, and reduced ecological
resilience, e.g., in coastal boundary systems
and sub-tropical gyres
(medium to high confidence)
[5.5, 30.5, 30.6, Tables 6-6 and 30-3, Box
CC-CR]
• Human adaptation options are limited to reducing other stresses, mainly by
reducing pollution and limiting pressures from tourism, fishing, physical
destruction, and unsustainable aquaculture.
•
Reducing deforestation and increasing reforestation of river catchments and
c
oastal areas to retain sediments and nutrients
•
Increased mangrove, coral reef, and seagrass protection, and restoration to
p
rotect numerous ecosystem goods and services such as coastal protection,
t
ourist value, and fish habitat
Table TS.5 (continued)

81
Technical Summary
TS
Continued next page
Region /
region code
Trends in daytime temperature extremes
(
frequency of hot and cool days)
Trends in heavy precipitation (rain, snow) Trends in dryness and drought
O
bserved Projected Observed Projected Observed Projected
West North
America
WNA, 3
V
ery likely large increases in
hot days (large decreases in
c
ool days)
a
V
ery likely increase in hot
days (decrease in cool days)
b
S
patially varying trends.
General increase, decrease in
s
ome areas
a
I
ncrease in 20-year return
value of annual maximum
d
aily precipitation and other
metrics over northern part of
the region (Canada)
b
Less confi dence in southern
part of the region, due to
inconsistent signal in these
other metrics
b
N
o change or overall slight
decrease in dryness
a
I
nconsistent signal
b
Central North
A
merica
CNA, 4
Spatially varying trends:
small increases in hot days
in the north, decreases in
the south
a
Very likely increase in hot
days (decrease in cool days)
b
Very likely increase since
1950
a
Increase in 20-year return
value of annual maximum
daily precipitation
b
Inconsistent signal in other
heavy precipitation days
metrics
b
Likely decrease
a, c
Increase in consecutive dry
days and soil moisture in
southern part of central
North America
b
Inconsistent signal in the rest
of the region
b
East North
America
ENA, 5
Spatially varying trends.
Overall increases in hot days
(decreases in cool days),
opposite or insignifi cant
signal in a few areas
a
Very likely increase in hot
days (decrease in cool days)
b
Very likely increase since
1950
a
Increase in 20-year return
value of annual maximum
daily precipitation. Additional
metrics support an increase
in heavy precipitation over
northern part of the region.
b
No signal or inconsistent
signal in these other metrics
in the southern part of the
region
b
Slight decrease in dryness
since 1950
a
Inconsistent signal in
consecutive dry days, some
consistent decrease in soil
moisture
b
Alaska/
Northwest
Canada
ALA, 1
Very likely large increases
in hot days (decreases in
cool days)
a
Very likely increase in hot
days (decrease in cool days)
b
Slight tendency for increase
a
No signifi cant trend in
southern Alaska
a
Likely increase in heavy
precipitation
b
Inconsistent trends
a
Increase in dryness in part of
the region
a
Inconsistent signal
b
East Canada,
Greenland,
Iceland
CGI, 2
Likely increases in hot days
(decreases in cool days) in
some areas, decrease in hot
days (increase in cool days)
in others
a
Very likely increase in hot
days (decrease in cool days)
b
Increase in a few areas
a
Likely increase in heavy
precipitation
b
Insuffi cent evidence
a
Inconsistent signal
b
Northern
Europe
NEU, 11
Increase in hot days
(decrease in cool days), but
generally not signifi cant at
the local scale
a
Very likely increase in hot
days (decrease in cool days)
[but smaller trends than
in central and southern
Europe]
b
Increase in winter in some
areas, but often insignifi cant
or inconsistent trends at sub-
regional scale, particularly in
summer
a
Likely increase in 20-year
return value of annual
maximum daily precipitation.
Very likely increases in heavy
preciptation intensity and
frequency in winter in the
north
b
Spatially varying trends.
Overall only slight or no
increase in dryness, slight
decrease in dryness in part of
the region
a
No major changes in
dryness
b
Table TS.6 | Observed and projected future changes in some types of temperature and precipitation extremes over 26 sub-continental regions as defi ned in the IPCC Special
R
eport on Managing the Risks of Extreme Events and Disasters to Advance Climate Change Adaptation (SREX). Confi dence levels are indicated by symbol color. Likelihood
terms are given only for high or very high confi dence statements. Observed trends in temperature and precipitation extremes, including dryness and drought, are generally
calculated from 1950, using 1961–1990 as the reference period, unless otherwise indicated. Future changes are derived from global and regional climate model projections for
2071–2100 compared with 1961–1990 or for 2080–2100 compared with 1980–2000. Table entries are summaries of information in SREX Tables 3-2 and 3-3 supplemented
with or superseded by material from WGI AR5 2.6, 14.8, and Table 2.13 and WGII AR5 Table 25-1. The source(s) of information for each entry are indicated by superscripts: (a)
SREX Table 3-2; (b) SREX Table 3-3; (c) WGI AR5 2.6 and Table 2.13; (d) WGI AR5 14.8; (e) WGII AR5 Table 25-1. [Tables 21-7 and SM21-2, Figure 21-4]
Increasing trend
or signal
Decreasing
trend or signal
Medium
confidence
Both increasing and
decreasing trend or signal
Inconsistent trend or signal
or insufficient evidence
No change or only
slight change
Low
confidence
High
confidence
Level of confidence in findings
Symbols

82
Technical Summary
TS
Continued next page
Region /
r
egion code
Trends in daytime temperature extremes
(
frequency of hot and cool days)
T
rends in heavy precipitation (rain, snow) Trends in dryness and drought
Observed Projected Observed Projected Observed Projected
Central
Europe
C
EU, 12
Likely overall increase in hot
days (decrease in cool days)
i
n most regions. Very likely
increase in hot days (likely
decrease in cool days) in
west-central Europe
a
Lower confi dence in trends
in east-central Europe
(due to lack of literature,
partial lack of access to
observations, overall weaker
signals, and change point
in trends)
a
Very likely increase in hot
days (decrease in cool days)
b
Increase in part of the region,
in particular central western
E
urope and European Russia,
especially in winter.
a
I
nsignifi cant or inconsistent
trends elsewhere, in
particular in summer
a
Likely increase in 20-year
return value of annual
m
aximum daily precipitation.
Additional metrics support
an increase in heavy
precipitation in large part of
the region in winter.
b
Less confi dence in summer,
due to inconsistent evidence
b
Spatially varying trends.
Increase in dryness in part of
the region but some regional
v
ariation in dryness trends
and dependence of trends
on studies considered (index,
time period)
a
Increase in dryness in central
Europe and increase in short-
t
erm droughts
b
Southern
E
urope and
Mediterranean
MED, 13
Likely increase in hot days
(decrease in cool days) in
m
ost of the region. Some
regional and temporal
variations in the signifi cance
of the trends. Likely strongest
and most signifi cant trends
i
n Iberian peninsula and
southern France
a
Smaller or less signifi cant
trends in southeastern
Europe and Italy due to
change point in trends,
strongest increase in hot
days since 1976
a
Very likely increase in hot
days (decrease in cool days)
b
Inconsistent trends across
the region and across
s
tudies
a
Inconsistent changes and/or
regional variations
b
Overall increase in dryness,
likely increase in the
M
editerranean
a
, c
Increase in dryness.
Consistent increase in area
o
f drought
b
, d
West Africa
WAF, 15
Signifi cant increase in
temperature of hottest day
and coolest day in some
parts
a
Insuffi cient evidence in other
parts
a
Likely increase in hot days
(decrease in cool days)
b
Rainfall intensity increased
a
Slight or no change in heavy
precipitation indicators in
most areas
b
Low model agreement in
northern areas
b
Likely increase but 1970s
Sahel drought dominates the
trend; greater inter-annual
variation in recent years
a
, c
Inconsistent signal
b
East Africa
EAF, 16
Lack of evidence due to lack
of literature and spatially
non-uniform trends
a
Increases in hot days in
southern tip (decreases in
cool days)
a
Likely increase in hot days
(decrease in cool days)
b
Insuffi cient evidence
a
Likely increase in heavy
precipitation
b
Spatially varying trends in
dryness
a
Decreasing dryness in large
areas
b
Southern
Africa
SAF, 17
Likely increase in hot days
(decrease in cool days)
a, c
Likely increase in hot days
(decrease in cool days)
b
Increases in more regions
than decreases but spatially
varying trends
a,c
Lack of agreement in signal
for region as a whole
b
Some evidence of increase
in heavy precipitation in
southeast regions
b
General increase in dryness
a
Increase in dryness, except
eastern part
b, d
Consistent increase in area
of drought
b
Sahara
SAH, 14
Lack of literature
a
Likely increase in hot days
(decrease in cool days)
b
Insuffi cient evidence
a
Low agreement
b
Limited data, spatial
variation of the trends
a
Inconsistent signal of
change
b
Central
America and
Mexico
CAM, 6
Increases in the number of
hot days, decreases in the
number of cool days
a
Likely increase in hot days
(decrease in cool days)
b
Spatially varying trends.
Increase in many areas,
decrease in a few others
a
Inconsistent trends
b
Varying and inconsistent
trends
a
Increase in dryness in Central
America and Mexico, with
less confi dence in trend in
extreme south of region
b
Table TS.6 (continued)

83
Technical Summary
TS
Region /
region code
Trends in daytime temperature extremes
(
frequency of hot and cool days)
Trends in heavy precipitation (rain, snow) Trends in dryness and drought
Observed Projected Observed Projected Observed Projected
Amazon
AMZ, 7
Insuffi cient evidence to
identify trends
a
Hot days likely to increase
(
cool days likely to decrease)
b
Increase in many areas,
d
ecrease in a few
a
Tendency for increases in
h
eavy precipitation events in
some metrics
b
Decrease in dryness for much
o
f the region. Some opposite
trends and inconsistencies
a
Inconsistent signals
b
N
ortheastern
Brazil
NEB, 8
I
ncreases in the number of
h
ot days
a
H
ot days likely to increase
(
cool days likely to decrease)
b
I
ncrease in many areas,
d
ecrease in a few
a
S
light or no change
b
V
arying and inconsistent
t
rends
a
I
ncrease in dryness
b
Southeastern
South
A
merica
SSA, 10
Spatially varying trends
(
increases in hot days in
some areas, decreases in
others)
a
Hot days likely to increase
(
cool days likely to decrease)
b
Increase in northern areas
a
Insuffi cient evidence in
s
outhern areas
a
Increases in northern areas
b
Insuffi cient evidence in
s
outhern areas
b
Varying and inconsistent
t
rends
a
Inconsistent signals
b
West Coast
South
A
merica
WSA, 9
Spatially varying trends
(
increases in hot days in
some areas, decreases in
others)
a
Hot days likely to increase
(
cool days likely to decrease)
b
Decrease in many areas,
i
ncrease in a few areas
a
Increases in tropics
b
Low confi dence in
extratropics
b
Varying and inconsistent
t
rends
a
Decrease in consecutive
d
ry days in the tropics, and
increase in the extratropics
b
I
ncrease in consecutive dry
days and soil moisture in
s
outhwest South America
b
North Asia
NAS, 18
Likely increases in hot days
(decreases in cool days)
a
Likely increase in hot days
(decrease in cool days)
b
Increase in some regions, but
spatial variation
a
Likely increase in heavy
precipitation for most
regions
b
Spatially varying trends
a
Inconsistent signal of
change
b
Central Asia
CAS, 20
Likely increases in hot days
(decreases in cool days)
a
Likely increase in hot days
(decrease in cool days)
b
Spatially varying trends
a
Inconsistent signal in
models
b
Spatially varying trends
a
Inconsistent signal of
change
b
East Asia
EAS, 22
Likely increases in hot days
(decreases in cool days)
a
Likely increase in hot days
(decrease in cool days)
b
Spatially varying trends
a
Increases in heavy
precipitation across the
region
b
Tendency for increased
dryness
a
Inconsistent signal of
change
b
Southeast
Asia
SEA, 24
Increases in hot days
(decreases in cool days) for
northern areas
a
Insuffi cient evidence for
Malay Archipelago
a
Likely increase in hot days
(decrease in cool days)
b
Spatially varying trends,
partial lack of evidence
a
Increases in most metrics
over most (especially non-
continental) regions. One
metric shows inconsistent
signals of change.
b
Spatially varying trends
a
Inconsistent signal of
change
b
South Asia
SAS, 23
Increase in hot days
(decrease in cool days)
a
Likely increase in hot days
(decrease in cool days)
b
Mixed signal in India
a
More frequent and intense
heavy precipitation days over
parts of South Asia. Either no
change or some consistent
increases in other metrics
b
Inconsistent signal for
different studies and indices
a
Inconsistent signal of
change
b
West Asia
WAS, 19
Very likely increase in hot
days (decrease in cool days
more likely than not)
a
Likely increase in hot days
(decrease in cool days)
b
Decrease in heavy
precipitation events
a
Inconsistent signal of
change
b
Lack of studies, mixed
results
a
Inconsistent signal of
change
b
Tibetan
Plateau
TIB, 21
Likely increase in hot days
(decrease in cool days)
a
Likely increase in hot days
(decrease in cool days)
b
Insuffi cient evidence
a
Increase in heavy
precipitation
b
Insuffi cient evidence.
Tendency to decreased
dryness
a
Inconsistent signal of
change
b
North
Australia
NAU, 25
Likely increase in hot days
(decrease in cool days).
Weaker trends in northwest
a
Very likely increase in hot
days (decrease in cool days)
b
Spatially varying trends,
which mostly refl ect changes
in mean rainfall
e
Increase in most regions
in the intensity of extreme
(i.e., current 20-year return
period) heavy rainfall events
e
No signifi cant change in
drought occurrence over
Australia (defi ned using
rainfall anomalies)
e
Inconsistent signal
b
Table TS.6 (continued)
Continued next page

84
Technical Summary
TS
negatively impact island communities and livelihoods, given the
dependence of island communities on coral reef ecosystems for coastal
protection, subsistence fisheries, and tourism. [29.3 to 29.5, 29.9, 30.5,
Figure 29-1, Table 29-3, Box CC-CR]
The Ocean. Warming will increase risks to ocean ecosystems
(high confidence).
Coral reefs within coastal boundary systems, semi-
enclosed seas, and subtropical gyres are rapidly declining as a result of
local non-climatic stressors (i.e., coastal pollution, overexploitation) and
climate change. Projected increases in mass coral bleaching and
mortality will alter or eliminate ecosystems, increasing risks to coastal
livelihoods and food security (medium to high confidence). An analysis
of the CMIP5 ensemble projects loss of coral reefs from most sites
globally to be very likely by 2050 under mid to high rates of ocean
warming. Reducing non-climatic stressors represents an opportunity to
strengthen ecological resilience. The highly productive high-latitude
spring bloom systems in the northeastern Atlantic are responding
to warming (medium evidence, high agreement), with the greatest
changes being observed since the late 1970s in the phenology,
distribution, and abundance of plankton assemblages, and the
reorganization of fish assemblages, with a range of consequences for
fisheries (high confidence). Projected warming increases the likelihood
of greater thermal stratification in some regions, which can lead to
reduced O
2
ventilation and encourage the formation of hypoxic zones,
especially in the Baltic and Black Seas (medium confidence). Changing
surface winds and waves, sea level, and storm intensity will increase
the vulnerability of ocean-based industries such as shipping, energy,
and mineral extraction. New opportunities as well as international
issues over access to resources and vulnerability may accompany
warming waters particularly at high latitudes. [5.3, 5.4, 6.4, 28.2, 28.3,
30.3, 30.5, 30.6, Table 30-1, Figures 30-4 and 30-10, Boxes 6-1, CC-CR,
and CC-MB]
Understanding of extreme events and their interactions with
climate change is particularly important for managing risks in a
regional context.
Table TS.6 provides a summary of observed and
projected trends in some types of temperature and precipitation
extremes.
Region /
region code
Trends in daytime temperature extremes
(
frequency of hot and cool days)
T
rends in heavy precipitation (rain, snow) Trends in dryness and drought
Observed Projected Observed Projected Observed Projected
South
Australia/
N
ew Zealand
SAU, 26
Very likely increase in hot
days (decrease in cool
days)
a
Very likely increase in hot
days (decrease in cool
days)
b
Spatially varying trends in
southern Australia, which
mostly refl ect changes in
mean rainfall
e
S
patially varying trends
in New Zealand, which
mostly refl ect changes in
m
ean rainfall
e
Increase in most regions
in the intensity of extreme
(i.e., current 20-year return
period) heavy rainfall
e
vents
e
No signifi cant change in
drought occurrence over
A
ustralia (defi ned using
rainfall anomalies)
e
N
o trend in drought
occurrence over New
Zealand (defi ned using a
s
oil–water balance model)
since 1972
e
Increase in drought
frequency in southern
Australia, and in many
regions of New Zealand
e
T
able TS.6 (continued)

85
Technical Summary
TS
C: MANAGING FUTURE RISKS
AND BUILDING RESILIENCE
Managing the risks of climate change involves adaptation and mitigation
decisions with implications for future generations, economies, and
environments. Figure TS.12 provides an overview of responses for
addressing risk related to climate change.
Starting with principles for effective adaptation, this section evaluates
the ways that interlinked human and natural systems can build resilience
through adaptation, mitigation, and sustainable development. It
describes understanding of climate-resilient pathways, of incremental
versus transformational changes, and of limits to adaptation, and it
considers co-benefits, synergies, and trade-offs among mitigation,
adaptation, and development.
C-1. Principles for Effective Adaptation
The report assesses a wide variety of approaches for reducing and
managing risks and building resilience. Strategies and approaches to
climate change adaptation include efforts to decrease vulnerability or
exposure and/or increase resilience or adaptive capacity. Mitigation is
assessed in the WGIII AR5. Specific examples of responses to climate
change are presented in Table TS.7.
Adaptation is place- and context-specific, with no single
approach for reducing risks appropriate across all settings (high
confidence).
Effective risk reduction and adaptation strategies consider
the dynamics of vulnerability and exposure and their linkages with
socioeconomic processes, sustainable development, and climate change.
[2.1, 8.3, 8.4, 13.1, 13.3, 13.4, 15.2, 15.3, 15.5, 16.2, 16.3, 16.5, 17.2,
17.4, 19.6, 21.3, 22.4, 26.8, 26.9, 29.6, 29.8]
A
daptation planning and implementation can be enhanced
through complementary actions across levels, from individuals to
governments (high confidence).
National governments can coordinate
adaptation efforts of local and subnational governments, for example
by protecting vulnerable groups, by supporting economic diversification,
and by providing information, policy and legal frameworks, and financial
support (robust evidence, high agreement). Local government and the
private sector are increasingly recognized as critical to progress in
adaptation, given their roles in scaling up adaptation of communities,
households, and civil society and in managing risk information and
financing (medium evidence, high agreement). [2.1 to 2.4, 3.6, 5.5, 8.3,
8.4, 9.3, 9.4, 14.2, 15.2, 15.3, 15.5, 16.2 to 16.5, 17.2, 17.3, 22.4, 24.4,
25.4, 26.8, 26.9, 30.7, Tables 21-1, 21-5, and 21-6, Box 16-2]
A first step towards adaptation to future climate change is
reducing vulnerability and exposure to present climate variability
(high confidence). Strategies include actions with co-benefits for
other objectives.
Available strategies and actions can increase
resilience across a range of possible future climates while helping to
improve human health, livelihoods, social and economic well-being, and
environmental quality. Examples of adaptation strategies that also
strengthen livelihoods, enhance development, and reduce poverty
include improved social protection, improved water and land governance,
enhanced water storage and services, greater involvement in planning,
and elevated attention to urban and peri-urban areas heavily affected
by migration of poor people. See Table TS.7. [3.6, 8.3, 9.4, 14.3, 15.2,
15.3, 17.2, 20.4, 20.6, 22.4, 24.4, 24.5, 25.4, 25.10, 27.3 to 27.5, 29.6,
Boxes 25-2 and 25-6]
Adaptation planning and implementation at all levels of
governance are contingent on societal values, objectives, and risk
perceptions (high confidence). Recognition of diverse interests,
circumstances, social-cultural contexts, and expectations can
EMISSIONS
and Land-use Change
Hazards
Anthropogenic
Climate Change
Socioeconomic
Pathways
Adaptation and
Mitigation
Actions
Governance
IMPACTS
Natural
Variability
SOCIOECONOMIC
PROCESSES
CLIMATE
Socioeconomic Pathways
Adaptation & Interactions
with Mitigation
Governance
•
Diverse values & objectives [A-3]
•
Climate-resilient pathways [C-2]
•
Transformation [C-2]
•
Decision making under
uncertainty [A-3]
•
Learning, monitoring, & flexibility
[A-2, A-3, C-1]
•
Coordination across scales [A-2, C-1]
•
Incremental & transformational
adaptation
[A-2, A-3, C-2]
•
Co-benefits, synergies, &
tradeoffs [A-2, C-1, C-2]
•
Context-specific adaptation [C-1]
•
Complementary actions [C-1]
•
Limits to adaptation [C-2]
Exposure
Vulnerability
RISK
Vulnerability & Exposure
Risk
• Vulnerability & exposure
reduction
[C-1]
• Low-regrets strategies &
actions [C-1]
• Addressing multidimensional
inequalities
[A-1, C-1]
• Risk assessment [B]
• Iterative risk management
[A-3]
• Risk perception [A-3, C-1]
Anthropogenic
Climate Change
• Mitigation [WGIII AR5]
RIS
K
R
Figure TS.12 | The solution space. Core concepts of the WGII AR5, illustrating overlapping entry points and approaches, as well as key considerations, in managing risks related to
climate change, as assessed in the report and presented throughout this summary. Bracketed references indicate sections of the summary with corresponding assessment findings.

86
Technical Summary
TS
Overlapping
Approaches
Category Examples Chapter Reference(s)
Human
development
Improved access to education, nutrition, health facilities, energy, safe housing & settlement structures,
&
social support structures; Reduced gender inequality & marginalization in other forms.
8
.3, 9.3, 13.1 to 13.3, 14.2, 14.3, 22.4
Poverty alleviation
I
mproved access to & control of local resources; Land tenure; Disaster risk reduction; Social safety nets
& social protection; Insurance schemes.
8.3, 8.4, 9.3, 13.1 to 13.3
Livelihood security
I
ncome, asset, & livelihood diversifi cation; Improved infrastructure; Access to technology & decision-
making fora; Increased decision-making power; Changed cropping, livestock, & aquaculture practices;
R
eliance on social networks.
7.5, 9.4, 13.1 to 13.3, 22.3, 22.4, 23.4,
26.5, 27.3, 29.6, Table SM24-7
Disaster risk
management
Early warning systems; Hazard & vulnerability mapping; Diversifying water resources; Improved
drainage; Flood & cyclone shelters; Building codes & practices; Storm & wastewater management;
T
ransport & road infrastructure improvements.
8.2 to 8.4, 11.7, 14.3, 15.4, 22.4, 24.4,
26.6, 28.4, Table 3-3, Box 25-1
Ecosystem
management
Maintaining wetlands & urban green spaces; Coastal afforestation; Watershed & reservoir
m
anagement; Reduction of other stressors on ecosystems & of habitat fragmentation; Maintenance
of genetic diversity; Manipulation of disturbance regimes; Community-based natural resource
m
anagement.
4.3, 4.4, 8.3, 22.4, Table 3-3, Boxes
4-3, 8-2, 15-1, 25-8, 25-9, & CC-EA
Spatial or land-use
planning
Provisioning of adequate housing, infrastructure, & services; Managing development in fl ood prone &
other high risk areas; Urban planning & upgrading programs; Land zoning laws; Easements; Protected
a
reas.
4.4, 8.1 to 8.4, 22.4, 23.7, 23.8, 27.3,
B
ox 25-8
Structural/physical
Engineered & built-environment options: Sea walls & coastal protection structures; Flood levees;
W
ater storage; Improved drainage; Flood & cyclone shelters; Building codes & practices; Storm &
wastewater management; Transport & road infrastructure improvements; Floating houses; Power plant
&
electricity grid adjustments.
3.5, 3.6, 5.5, 8.2, 8.3, 10.2, 11.7, 23.3,
2
4.4, 25.7, 26.3, 26.8, Boxes 15-1,
25-1, 25-2, & 25-8
Technological options: New crop & animal varieties; Indigenous, traditional, & local knowledge,
technologies, & methods; Effi cient irrigation; Water-saving technologies; Desalinization; Conservation
agriculture; Food storage & preservation facilities; Hazard & vulnerability mapping & monitoring; Early
warning systems; Building insulation; Mechanical & passive cooling; Technology development, transfer,
& diffusion.
7
.5, 8.3, 9.4, 10.3, 15.4, 22.4, 24.4,
26.3, 26.5, 27.3, 28.2, 28.4, 29.6, 29.7,
Tables 3-3 & 15-1, Boxes 20-5 & 25-2
Ecosystem-based options: Ecological restoration; Soil conservation; Afforestation & reforestation;
Mangrove conservation & replanting; Green infrastructure (e.g., shade trees, green roofs);
Controlling overfi shing; Fisheries co-management; Assisted species migration & dispersal; Ecological
corridors; Seed banks, gene banks, & other ex situ conservation; Community-based natural resource
management.
4.4, 5.5, 6.4, 8.3, 9.4, 11.7, 15.4, 22.4,
2
3.6, 23.7, 24.4, 25.6, 27.3, 28.2, 29.7,
30.6, Boxes 15-1, 22-2, 25-9, 26-2,
& CC-EA
Services: Social safety nets & social protection; Food banks & distribution of food surplus; Municipal
services including water & sanitation; Vaccination programs; Essential public health services; Enhanced
emergency medical services.
3.5, 3.6, 8.3, 9.3, 11.7, 11.9, 22.4, 29.6,
Box 13-2
Institutional
Economic options: Financial incentives; Insurance; Catastrophe bonds; Payments for ecosystem
services; Pricing water to encourage universal provision and careful use; Microfi nance; Disaster
contingency funds; Cash transfers; Public-private partnerships.
8.3, 8.4, 9.4, 10.7, 11.7, 13.3, 15.4,
17.5, 22.4, 26.7, 27.6, 29.6, Box 25-7
Laws & regulations: Land zoning laws; Building standards & practices; Easements; Water regulations
& agreements; Laws to support disaster risk reduction; Laws to encourage insurance purchasing;
Defi ned property rights & land tenure security; Protected areas; Fishing quotas; Patent pools &
technology transfer.
4.4, 8.3, 9.3, 10.5, 10.7, 15.2, 15.4,
17.5, 22.4, 23.4, 23.7, 24.4, 25.4, 26.3,
27.3, 30.6, Table 25-2, Box CC-CR
National & government policies & programs: National & regional adaptation plans including
mainstreaming; Sub-national & local adaptation plans; Economic diversifi cation; Urban upgrading
programs; Municipal water management programs; Disaster planning & preparedness; Integrated
water resource management; Integrated coastal zone management; Ecosystem-based management;
Community-based adaptation.
2.4, 3.6, 4.4, 5.5, 6.4, 7.5, 8.3, 11.7,
15.2 to 15.5, 22.4, 23.7, 25.4, 25.8,
26.8, 26.9, 27.3, 27.4, 29.6, Tables 9-2
& 17-1, Boxes 25-1, 25-2, & 25-9
Social
Educational options: Awareness raising & integrating into education; Gender equity in education;
Extension services; Sharing indigenous, traditional, & local knowledge; Participatory action research &
social learning; Knowledge-sharing & learning platforms.
8.3, 8.4, 9.4, 11.7, 12.3, 15.2 to 15.4,
22.4, 25.4, 28.4, 29.6, Tables 15-1
& 25-2
Informational options: Hazard & vulnerability mapping; Early warning & response systems;
Systematic monitoring & remote sensing; Climate services; Use of indigenous climate observations;
Participatory scenario development; Integrated assessments.
2.4, 5.5, 8.3, 8.4, 9.4, 11.7, 15.2 to 15.4,
22.4, 23.5, 24.4, 25.8, 26.6, 26.8, 27.3,
28.2, 28.5, 30.6, Table 25-2, Box 26-3
Behavioral options: Household preparation & evacuation planning; Migration; Soil & water
conservation; Storm drain clearance; Livelihood diversifi cation; Changed cropping, livestock, &
aquaculture practices; Reliance on social networks.
5.5, 7.5, 9.4, 12.4, 22.3, 22.4, 23.4,
23.7, 25.7, 26.5, 27.3, 29.6, Table
SM24-7, Box 25-5
Spheres of change
Practical: Social & technical innovations, behavioral shifts, or institutional & managerial changes that
produce substantial shifts in outcomes.
8.3, 17.3, 20.5, Box 25-5
Political: Political, social, cultural, & ecological decisions & actions consistent with reducing
vulnerability & risk & supporting adaptation, mitigation, & sustainable development.
14.2, 14.3, 20.5, 25.4, 30.7, Table 14-1
Personal: Individual & collective assumptions, beliefs, values, & worldviews infl uencing climate-change
responses.
14.2, 14.3, 20.5, 25.4, Table 14-1
Vulnerability & Exposure Reduction
through development, planning, & practices including many low-regrets measures
Adaptation
including incremental & transformational adjustments
Transformation
Table TS.7 | Approaches for managing the risks of climate change. These approaches should be considered overlapping rather than discrete, and they are often pursued
simultaneously. Mitigation is considered essential for managing the risks of climate change. It is not addressed in this table as mitigation is the focus of WGIII AR5. Examples are
presented in no specifi c order and can be relevant to more than one category. [14.2, 14.3, Table 14-1]

87
Technical Summary
TS
b
enefit decision-making processes.
A
wareness that climate change
may exceed the adaptive capacity of some people and ecosystems may
have ethical implications for mitigation decisions and investments.
Economic analysis of adaptation is moving away from a unique emphasis
on efficiency, market solutions, and benefit/cost analysis to include
consideration of non-monetary and non-market measures, risks,
inequities, behavioral biases, barriers and limits, and ancillary benefits
and costs. [2.2 to 2.4, 9.4, 12.3, 13.2, 15.2, 16.2 to 16.4, 16.6, 16.7,
17.2, 17.3, 21.3, 22.4, 24.4, 24.6, 25.4, 25.8, 26.9, 28.2, 28.4, Table
15-1, Boxes 16-1, 16-4, and 25-7]
Indigenous, local, and traditional knowledge systems and practices,
including indigenous peoples’ holistic view of community and
environment, are a major resource for adapting to climate change
(robust evidence, high agreement).
Natural resource dependent
communities, including indigenous peoples, have a long history of
adapting to highly variable and changing social and ecological conditions.
But the salience of indigenous, local, and traditional knowledge will be
challenged by climate change impacts. Such forms of knowledge have
not been used consistently in existing adaptation efforts. Integrating such
forms of knowledge with existing practices increases the effectiveness
of adaptation. [9.4, 12.3, 15.2, 22.4, 24.4, 24.6, 25.8, 28.2, 28.4, Table
15-1]
Decision support is most effective when it is sensitive to context
and the diversity of decision types, decision processes, and
constituencies (robust evidence, high agreement).
Organizations
bridging science and decision making, including climate services, play
an important role in the communication, transfer, and development of
climate-related knowledge, including translation, engagement, and
knowledge exchange (medium evidence, high agreement). [2.1 to 2.4,
8.4, 14.4, 16.2, 16.3, 16.5, 21.2, 21.3, 21.5, 22.4, Box 9-4]
Integration of adaptation into planning and decision making can
promote synergies with development and disaster risk reduction
(high confidence).
Such mainstreaming embeds climate-sensitive
thinking in existing and new institutions and organizations. Adaptation
can generate larger benefits when connected with development activities
and disaster risk reduction (medium confidence). [8.3, 9.3, 14.2, 14.6,
15.3, 15.4, 17.2, 20.2, 20.3, 22.4, 24.5, 29.6, Box CC-UR]
Existing and emerging economic instruments can foster adaptation
by providing incentives for anticipating and reducing impacts
(medium confidence).
Instruments include public–private finance
partnerships, loans, payments for environmental services, improved
resource pricing, charges and subsidies, norms and regulations, and risk
sharing and transfer mechanisms. Risk financing mechanisms in the public
and private sector, such as insurance and risk pools, can contribute to
increasing resilience, but without attention to major design challenges,
they can also provide disincentives, cause market failure, and decrease
equity. Governments often play key roles as regulators, providers, or
insurers of last resort. [10.7, 10.9, 13.3, 17.4, 17.5, Box 25-7]
Constraints can interact to impede adaptation planning and
implementation (high confidence).
Common constraints on
i
mplementation arise from the following: limited financial and human
resources; limited integration or coordination of governance; uncertainties
about projected impacts; different perceptions of risks; competing
values; absence of key adaptation leaders and advocates; and limited
tools to monitor adaptation effectiveness. Another constraint includes
insufficient research, monitoring, and observation and the finance to
maintain them. Underestimating the complexity of adaptation as a
social process can create unrealistic expectations about achieving
intended adaptation outcomes. [3.6, 4.4, 5.5, 8.4, 9.4, 13.2, 13.3, 14.2,
14.5, 15.2, 15.3, 15.5, 16.2, 16.3, 16.5, 17.2, 17.3, 22.4, 23.7, 24.5, 25.4,
25.10, 26.8, 26.9, 30.6, Table 16-3, Boxes 16-1 and 16-3]
Poor planning, overemphasizing short-term outcomes, or failing
to sufficiently anticipate consequences can result in maladaptation
(medium evidence, high agreement).
Maladaptation can increase
the vulnerability or exposure of the target group in the future, or the
vulnerability of other people, places, or sectors. Narrow focus on
quantifiable costs and benefits can bias decisions against the poor,
against ecosystems, and against those in the future whose values can
be excluded or are understated. Some near-term responses to increasing
risks related to climate change may also limit future choices. For
example, enhanced protection of exposed assets can lock in dependence
on further protection measures. [5.5, 8.4, 14.6, 15.5, 16.3, 17.2, 17.3,
20.2, 22.4, 24.4, 25.10, 26.8, Table 14-4, Box 25-1]
Limited evidence indicates a gap between global adaptation
needs and funds available for adaptation (medium confidence).
There is a need for a better assessment of global adaptation costs,
funding, and investment. Studies estimating the global cost of adaptation
are characterized by shortcomings in data, methods, and coverage (high
confidence). [14.2, 17.4, Tables 17-2 and 17-3]
C-2. Climate-resilient Pathways and Transformation
Climate-resilient pathways are sustainable-development trajectories
that combine adaptation and mitigation to reduce climate change and
its impacts. They include iterative processes to ensure that effective risk
management can be implemented and sustained. See Figure TS.13. [2.5,
20.3, 20.4]
Prospects for climate-resilient pathways for sustainable
development are related fundamentally to what the world
accomplishes with climate-change mitigation (high confidence).
Since mitigation reduces the rate as well as the magnitude of warming,
it also increases the time available for adaptation to a particular level
of climate change, potentially by several decades. Delaying mitigation
actions may reduce options for climate-resilient pathways in the future.
[1.1, 19.7, 20.2, 20.3, 20.6, Figure 1-5]
Greater rates and magnitude of climate change increase the
likelihood of exceeding adaptation limits (high confidence).
See
Box TS.8. Limits to adaptation occur when adaptive actions to avoid
intolerable risks for an actor’s objectives or for the needs of a system
are not possible or are not currently available. Value-based judgments
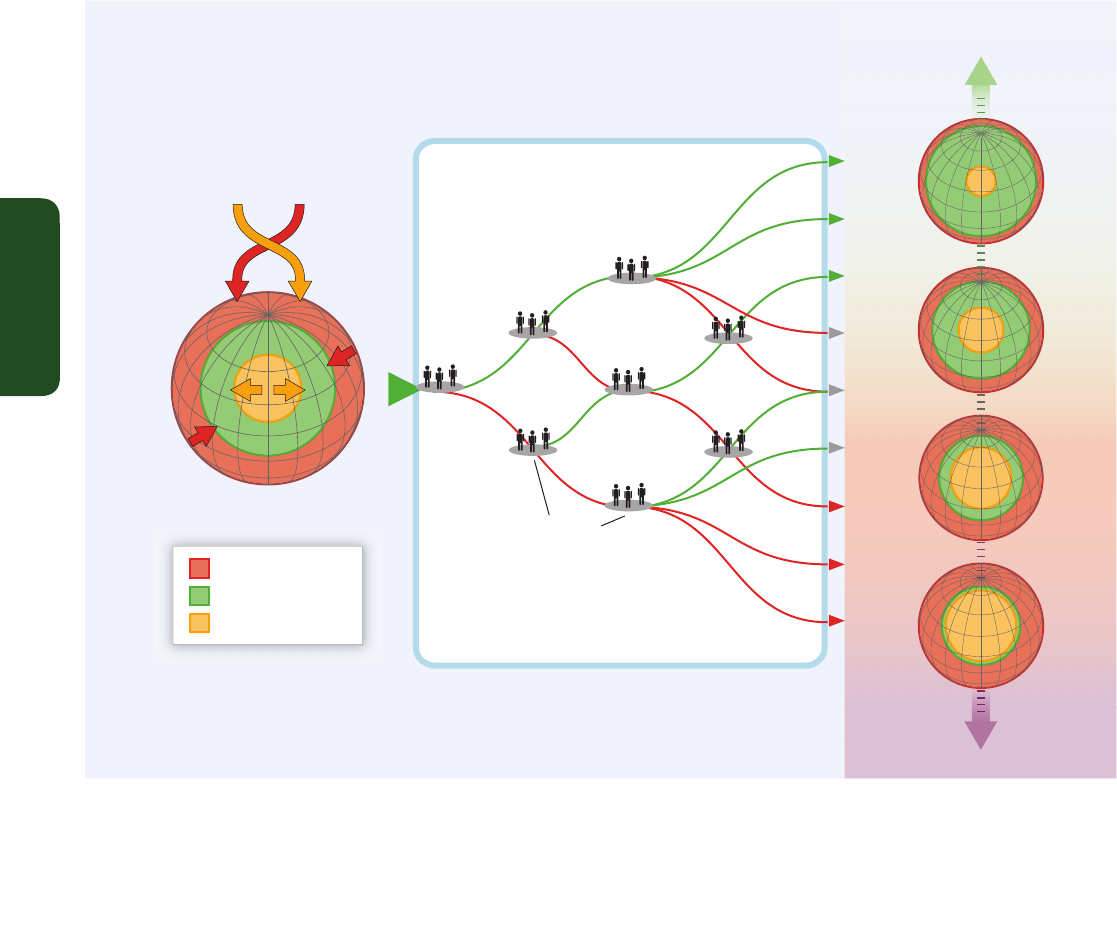
88
Technical Summary
TS
of what constitutes an intolerable risk may differ. Limits to adaptation
emerge from the interaction among climate change and biophysical
and/or socioeconomic constraints. Opportunities to take advantage of
positive synergies between adaptation and mitigation may decrease
with time, particularly if limits to adaptation are exceeded. In some parts
of the world, insufficient responses to emerging impacts are already
eroding the basis for sustainable development. [1.1, 11.8, 13.4, 16.2 to
16.7, 17.2, 20.2, 20.3, 20.5, 20.6, 25.10, 26.5, Boxes 16-1, 16-3, and
16-4]
Transformations in economic, social, technological, and political
decisions and actions can enable climate-resilient pathways
(high confidence).
Specific examples are presented in Table TS.7. See
also Box TS.8. Strategies and actions can be pursued now that will move
towards climate-resilient pathways for sustainable development, while
at the same time helping to improve livelihoods, social and economic
well-being, and responsible environmental management. Transformations
in response to climate change may involve, for example, introduction
of new technologies or practices, formation of new structures or systems
of governance, or shifts in the types or locations of activities. The scale
and magnitude of transformational adaptations depend on mitigation
and on development processes. Transformational adaptation is an
important consideration for decisions involving long life- or lead-times,
and it can be a response to adaptation limits. At the national level,
transformation is considered most effective when it reflects a country’s
own visions and approaches to achieving sustainable development in
accordance with its national circumstances and priorities. Transformations
to sustainability are considered to benefit from iterative learning,
deliberative processes, and innovation. Societal debates about many
aspects of transformation may place new and increased demands on
governance structures. [1.1, 2.1, 2.5, 8.4, 14.1, 14.3, 16.2 to 16.7, 20.5,
22.4, 25.4, 25.10, Figure 1-5, Boxes 16-1 and 16-4]
L
ow risk High resilience
(D) Decision points
(E) Climate-resilient pathways
Low resilience High risk
(B) Opportunity space
(F) Pathways that lower resilience
(C) Possible futures
Resilience space
Multiple stressors
including
climate change
(A) Our world
Social stressors
Biophysical stressors
Figure TS.13 | Opportunity space and climate-resilient pathways. (A) Our world [Sections A-1 and B-1] is threatened by multiple stressors that impinge on resilience from many directions,
represented here simply as biophysical and social stressors. Stressors include climate change, climate variability, land-use change, degradation of ecosystems, poverty and inequality, and
cultural factors. (B) Opportunity space [Sections A-2, A-3, B-2, C-1, and C-2] refers to decision points and pathways that lead to a range of (C) possible futures [Sections C and B-3] with
differing levels of resilience and risk. (D) Decision points result in actions or failures-to-act throughout the opportunity space, and together they constitute the process of managing or failing
to manage risks related to climate change. (E) Climate-resilient pathways (in green) within the opportunity space lead to a more resilient world through adaptive learning, increasing scientific
knowledge, effective adaptation and mitigation measures, and other choices that reduce risks. (F) Pathways that lower resilience (in red) can involve insufficient mitigation, maladaptation,
failure to learn and use knowledge, and other actions that lower resilience; and they can be irreversible in terms of possible futures. [Figure 1-5]

89
Technical Summary
TS
Examples of Co-benefits, Synergies, and Trade-offs among
Adaptation, Mitigation, and Sustainable Development
Significant co-benefits, synergies, and trade-offs exist between
mitigation and adaptation and among different adaptation
responses; interactions occur both within and across regions
(very high confidence).
Illustrative examples include the following.
• Increasing efforts to mitigate and adapt to climate change imply an
increasing complexity of interactions, particularly at the intersections
among water, energy, land use, and biodiversity, but tools to
understand and manage these interactions remain limited (very
high confidence). See Box TS.9. Widespread transformation of
terrestrial ecosystems in order to mitigate climate change, such as
carbon sequestration through planting fast-growing tree species
into ecosystems where they did not previously occur, or the
c
onversion of previously uncultivated or non-degraded land to
bioenergy plantations, can lead to negative impacts on ecosystems
and biodiversity (high confidence). [3.7, 4.2 to 4.4, 22.6, 24.6, 25.7,
25.9, 27.3, Boxes 25-10 and CC-WE]
• Climate policies such as increasing energy supply from renewable
resources, encouraging bioenergy crop cultivation, or facilitating
payments under REDD+ will affect some rural areas both positively
(e.g., increasing employment opportunities) and negatively (e.g.,
land use changes, increasing scarcity of natural capital) (medium
confidence). These secondary impacts, and trade-offs between
mitigation and adaptation in rural areas, have implications for
governance, including benefits of promoting participation of rural
stakeholders. Mitigation policies with social co-benefits expected
in their design, such as CDM and REDD+, have had limited or no
effect in terms of poverty alleviation and sustainable development
Box TS.8 | Adaptation Limits and Transformation
Adaptation can expand the capacity of natural and human systems to cope with a changing climate. Risk-based decision making can
be used to assess potential limits to adaptation. Limits to adaptation occur when adaptive actions to avoid intolerable risks for an
actor’s objectives or for the needs of a system are not possible or are not currently available. Limits to adaptation are context-specific
and closely linked to cultural norms and societal values. Value-based judgments of what constitutes an intolerable risk may differ
among actors, but understandings of limits to adaptation can be informed by historical experiences, or by anticipation of impacts,
vulnerability, and adaptation associated with different scenarios of climate change. The greater the magnitude or rate of climate
change, the greater the likelihood that adaptation will encounter limits. [16.2 to 16.4, 20.5, 20.6, 22.4, 25.4, 25.10, Box 16-2]
Limits to adaptation may be influenced by the subjective values of societal actors, which can affect both the perceived need for
adaptation and the perceived appropriateness of specific policies and measures. While limits imply that intolerable risks and the
increased potential for losses and damages can no longer be avoided, the dynamics of social and ecological systems mean that there
are both “soft” and “hard” limits to adaptation. For “soft” limits, there are opportunities in the future to alter limits and reduce risks,
for example, through the emergence of new technologies or changes in laws, institutions, or values. In contrast, “hard” limits are
those where there are no reasonable prospects for avoiding intolerable risks. Recent studies on tipping points, key vulnerabilities, and
planetary boundaries provide some insights on the behavior of complex systems. [16.2 to 16.7, 25.10]
In cases where the limits to adaptation have been surpassed, losses and damage may increase and the objectives of some actors
may no longer be achievable. There may be a need for transformational adaptation to change fundamental attributes of a system in
response to actual or expected impacts of climate change. It may involve adaptations at a greater scale or intensity than previously
experienced, adaptations that are new to a region or system, or adaptations that transform places or lead to a shift in the types or
locations of activities. [16.2 to 16.4, 20.3, 20.5, 22.4, 25.10, Boxes 25-1 and 25-9]
The existence of limits to adaptation suggests transformational change may be a requirement for sustainable development in a
changing climate—that is, not only for adapting to the impacts of climate change, but for altering the systems and structures,
economic and social relations, and beliefs and behaviors that contribute to climate change and social vulnerability. However, just as
there are ethical implications associated with some adaptation options, there are also legitimate concerns about the equity and ethical
dimensions of transformation. Societal debates over risks from forced and reactive transformations as opposed to deliberate transitions
to sustainability may place new and increased demands on governance structures at multiple levels to reconcile conflicting goals and
visions for the future. [1.1, 16.2 to 16.7, 20.5, 25.10]

90
Technical Summary
TS
(medium confidence). Mitigation efforts focused on land acquisition
for biofuel production show preliminary negative impacts for the
poor in many developing countries, and particularly for indigenous
people and (women) smallholders. [9.3, 13.3, 22.6]
•
Mangrove, seagrass, and salt marsh ecosystems offer important
carbon storage and sequestration opportunities (limited evidence,
medium agreement), in addition to ecosystem goods and services
such as protection against coastal erosion and storm damage and
maintenance of habitats for fisheries species. For ocean-related
mitigation and adaptation in the context of anthropogenic
ocean warming and acidification, international frameworks offer
o
pportunities to solve problems collectively, for example, managing
fisheries across national borders and responding to extreme events.
[5.4, 25.6, 30.6, 30.7]
Continued next page
Green infrastructure and green roofs
Objectives
S
torm water management, adaptation to increasing temperatures, reduced energy use, urban regeneration
Relevant sectors
I
nfrastructure, energy use, water management
Overview
B
enefi ts of green infrastructure and roofs can include reduction of storm water runoff and the urban heat island effect, improved energy performance of buildings,
reduced noise and air pollution, health improvements, better amenity value, increased property values, improved biodiversity, and inward investment. Trade-offs can
r
esult between higher urban density to improve energy effi ciency and open space for green infrastructure. [8.3.3, 11.7.4, 23.7.4, 24.6, Tables 11-3 and 25-5]
Examples with
interactions
London: The Green Grid for East London seeks to create interlinked and multi-purpose open spaces to support regeneration of the area. It aims to connect people and
places, to absorb and store water, to cool the vicinity, and to provide a diverse mosaic of habitats for wildlife. [8.3.3]
New York: In preparation for more intense storms, New York is using green infrastructure to capture rainwater before it can fl ood the combined sewer system,
implementing green roofs, and elevating boilers and other equipment above ground. [8.3.3, 26.3.3, 26.8.4]
Singapore: Singapore has used several anticipatory plans and projects to enhance green infrastructure, including its Streetscape Greenery Master Plan, constructed
wetlands or drains, and community gardens. Under its Skyrise Greenery project, Singapore has provided subsidies and handbooks for rooftop and wall greening
i
nitiatives. [8.3.3]
Durban: Ecosystem-based adaptation is part of Durban’s climate change adaptation strategy. The approach seeks a more detailed understanding of the ecology of
i
ndigenous ecosystems and ways in which biodiversity and ecosystem services can reduce vulnerability of ecosystems and people. Examples include the Community
Reforestation Programme, in which communities produce indigenous seedlings used in the planting and managing of restored forest areas. Development of ecosystem-
based adaptation in Durban has demonstrated needs for local knowledge and data and the benefi ts of enhancing existing protected areas, land-use practices, and local
initiatives contributing to jobs, business, and skill development. [8.3.3, Box 8-2]
Water management
Primary objective
Water resource management given multiple stressors in a changing climate
Relevant sectors
Water use, energy production and use, biodiversity, carbon sequestration, biofuel production, food production
Overview
Water management in the context of climate change can encompass ecosystem-based approaches (e.g., watershed management or restoration, flood regulation
services, and reduction of erosion or siltation), supply-side approaches (e.g., dams, reservoirs, groundwater pumping and recharge, and water capture), and demand-
side approaches (e.g., increased use effi ciency through water recycling, infrastructure upgrades, water-sensitive design, or more effi cient allocation). Water may require
signifi cant amounts of energy for lifting, transport, distribution, and treatment. [3.7.2, 26.3, Tables 9-8 and 25-5, Boxes CC-EA and CC-WE]
Examples with
interactions
New York: New York has a well-established program to protect and enhance its water supply through watershed protection. The Watershed Protection Program includes
city ownership of land that remains undeveloped and coordination with landowners and communities to balance water-quality protection, local economic development,
and improved wastewater treatment. The city government indicates it is the most cost-effective choice for New York given the costs and environmental impacts of a
fi ltration plant. [8.3.3, Box 26-3]
Cape Town: Facing challenges in ensuring future supplies, Cape Town responded by commissioning water management studies, which identifi ed the need to incorporate
climate change, as well as population and economic growth, in planning. During the 2005 drought, local authorities increased water tariffs to promote effi cient water
usage. Additional measures may include water restrictions, reuse of gray water, consumer education, or technological solutions such as low-fl ow systems or dual fl ush
toilets. [8.3.3]
Capital cities in Australia: Many Australian capital cities are reducing reliance on catchment runoff and groundwater—water resources most sensitive to climate
change and drought—and are diversifying supplies through desalination plants, water reuse including sewage and storm water recycling, and integrated water cycle
management that considers climate change impacts. Demand is being reduced through water conservation and water-sensitive urban design and, during severe
shortfalls, through implementation of restrictions. The water augmentation program in Melbourne includes a desalination plant. Trade-offs beyond energy intensiveness
have been noted, such as damage to sites signifi cant to aboriginal communities and higher water costs that will disproportionately affect poorer households. [14.6.2,
Tables 25-6 and 25-7, Box 25-2]
Payment for environmental services and green fi scal policies
Primary objective
Management incorporating the costs of environmental externalities and the benefi ts of ecosystem services
Relevant sectors
Biodiversity, ecosystem services
Overview
Payment for environmental services (PES) is a market-based approach that aims to protect natural areas, and associated livelihoods and environmental services, by
developing fi nancial incentives for preservation. Mitigation-focused PES schemes are common, and there is emerging evidence of adaptation-focused PES schemes.
Successful PES approaches can be diffi cult to design for services that are hard to defi ne or quantify. [17.5.2, 27.6.2]
Examples with
interactions
Central and South America: A variety of PES schemes have been implemented in Central and South America. For example, national-level programs have operated
in Costa Rica and Guatemala since 1997 and in Ecuador since 2008. Examples to date have shown that PES can fi nance conservation, ecosystem restoration and
reforestation, better land-use practices, mitigation, and more recently adaptation. Uniform payments for benefi ciaries can be ineffi cient if, for example, recipients that
promote greater environmental gains receive only the prevailing payment. [17.5.2, 27.3.2, 27.6.2, Table 27-8]
Brazil: Municipal funding in Brazil tied to ecosystem-management quality is a form of revenue transfer important to funding local adaptation actions. State
governments collect a value-added tax redistributed among municipalities, and some states allocate revenues in part based on municipality area set aside for protection.
This mechanism has helped improve environmental management and increased creation of protected areas. It benefi ts relations between protected areas and
surrounding inhabitants, as the areas can be perceived as opportunities for revenue generation rather than as obstacles to development. The approach builds on existing
institutions and administrative procedures and thus has low transaction costs. [8.4.3, Box 8-4]
Table TS.8 | Illustrative examples of intra-regional interactions among adaptation, mitigation, and sustainable development.

91
Technical Summary
TS
• Geoengineering approaches involving manipulation of the ocean
to ameliorate climate change (such as nutrient fertilization, binding
of CO
2
by enhanced alkalinity, or direct CO
2
injection into the deep
ocean) have very large environmental and associated socioeconomic
consequences (high confidence). Alternative methods focusing on
solar radiation management (SRM) leave ocean acidification unabated
as they cannot mitigate rising atmospheric CO
2
emissions. [6.4]
• Some agricultural practices can reduce emissions and also increase
resilience of crops to temperature and rainfall variability (high
confidence). [23.8, Table 25-7]
• Many solutions for reducing energy and water consumption in
urban areas with co-benefits for climate change adaptation (e.g.,
greening cities and recycling water) are already being implemented
(high confidence). Transport systems promoting active transport
and reduced motorized-vehicle use can improve air quality and
increase physical activity (medium confidence). [11.9, 23.8, 24.4,
26.3, 26.8, Boxes 25-2 and 25-9]
• Improved energy efficiency and cleaner energy sources can lead to
reduced emissions of health-damaging climate-altering air pollutants
(very high confidence). [11.9, 23.8]
• In Africa, experience in implementing integrated adaptation–mitigation
responses that leverage developmental benefits encompasses some
participation of farmers and local communities in carbon offset
systems and increased use of agroforestry and farmer-assisted tree
regeneration (high confidence). [22.4, 22.6]
• In Asia, development of sustainable cities with fewer fossil-fuel-
driven vehicles and with more trees and greenery would have a
number of co-benefits, including improved public health (high
confidence). [24.4 to 24.7]
• In Australasia, transboundary effects from climate change impacts
and responses outside Australasia have the potential to outweigh
some of the direct impacts within the region, particularly economic
impacts on trade-intensive sectors such as agriculture (medium
confidence) and tourism (limited evidence, high agreement), but they
remain among the least-explored issues. [25.7, 25.9, Box 25-10]
• In North America, policies addressing local concerns (e.g., air
pollution, housing for the poor, declines in agricultural production)
can be adapted at low or no cost to fulfill adaptation, mitigation,
and sustainability goals (medium confidence). [26.9]
• In Central and South America, biomass-based renewable energy can
impact land use change and deforestation, and could be affected by
climate change (medium confidence). The expansion of sugarcane,
soy, and oil palm may have some effect on land use, leading to
deforestation in parts of the Amazon and Central America, among
other sub-regions, and to loss of employment in some countries.
[27.3]
• For small islands, energy supply and use, tourism infrastructure and
activities, and coastal wetlands offer opportunities for adaptation–
mitigation synergies (medium confidence). [29.6 to 29.8]
Table TS.8 provides further specific examples of interactions
among adaptation, mitigation, and sustainable development to
complement the assessment findings above.
Renewable energy
Primary objective
R
enewable energy production and reduction of emissions
Relevant sectors
B
iodiversity, agriculture, food security
Overview
R
enewable energy production can require signifi cant land areas and water resources, creating the potential for both positive and negative interactions between
m
itigation policies and land management. [4.4.4, 13.3.1, 19.3.2, 19.4.1, Box CC-WE]
Examples with
interactions
Central and South America: Renewable resources, especially hydroelectric power and biofuels, account for substantial fractions of energy production in countries
s
uch as Brazil. Where bioenergy crops compete for land with food crops, substantial trade-offs can exist. Land-use change to produce bioenergy can affect food crops,
biodiversity, and ecosystem services. Lignocellulosic feedstocks, such as sugarcane second-generation technologies, do not compete with food. [19.3.2, 27.3.6, 27.6.1,
T
able 27-6]
Australia and New Zealand: Mandatory renewable energy targets and incentives to increase carbon storage support increased biofuel production and increased
b
iological carbon sequestration, with impacts on biodiversity depending on implementation. Benefi ts can include reduced erosion, additional habitat, and enhanced
c
onnectivity, with risks or lost opportunities associated with large-scale monocultures especially if replacing more diverse landscapes. Large-scale land cover changes
can affect catchment yields and regional climate in complex ways. New crops such as oil mallees or other eucalypts may provide multiple benefi ts, especially in marginal
a
reas, displacing fossil fuels or sequestering carbon, generating income for landholders (essential oils, charcoal, bio-char, biofuels), and providing ecosystem services.
[Table 25-7, Box 25-10]
Disaster risk reduction and adaptation to climate extremes
Primary objective
I
ncreasing resilience to extreme weather events in a changing climate
Relevant sectors
I
nfrastructure, energy use, spatial planning
Overview
S
ynergies and tradeoffs among sustainable development, adaptation, and mitigation occur in preparing for and responding to climate extremes and disasters. [13.2 to
13.4, 20.3, 20.4]
Examples with
interactions
P
hilippines: The Homeless People’s Federation of the Philippines developed responses following disasters, including community-rooted data gathering (e.g., assessing
destruction and victims’ immediate needs); trust and contact building; savings support; community-organization registration; and identifi cation of needed interventions
(e.g., building-materials loans). Community surveys mapped inhabitants especially at risk in informal settlements, raising risk-awareness among the inhabitants and
increasing community engagement in planning risk reduction and early warning systems. [8.3.2, 8.4.2]
London: Within London, built form and other dwelling characteristics can have a stronger infl uence on indoor temperatures during heat waves than the urban heat
island effect, and utilizing shade, thermal mass, ventilation control, and other passive-design features are effective adaptation options. Passive housing designs enhance
natural ventilation and improve insulation, while also reducing household emissions. For example, in London the Beddington Zero Energy Development was designed to
reduce or eliminate energy demand for heating, cooling, and ventilation for much of the year. [8.3.3, 11.7.4]
United States: In the United States, post-disaster funds for loss reduction are added to funds provided for disaster recovery. They can be used, for instance, to buy out
properties that have experienced repetitive fl ood losses and relocate residents to safer locations, to elevate structures, to assist communities with purchasing property
and altering land-use patterns in fl ood-prone areas, and to undertake other activities designed to lessen the impacts of future disasters. [14.3.3]
Table TS.8 (continued)

92
Technical Summary
TS
Box TS.9 | The Water–Energy–Food Nexus
Water, energy, and food/feed/fiber are linked through numerous interactive pathways affected by a changing climate (Box TS.9
Figure 1). [Box CC-WE] The depth and intensity of those linkages vary enormously among countries, regions, and production systems.
Many energy sources require significant amounts of water and produce a large quantity of wastewater that requires energy for
treatment. [3.7, 7.3, 10.2, 10.3, 22.3, 25.7, Box CC-WE] Food production, refrigeration, transport, and processing also require both
e
nergy and water. A major link between food and energy as related to climate change is the competition of bioenergy and food
production for land and water, and the sensitivity of precipitation, temperature, and crop yields to climate change (robust evidence,
high agreement). [7.3, Boxes 25-10 and CC-WE]
Most energy production methods require significant amounts of water, either directly (e.g., crop-based energy sources and
hydropower) or indirectly (e.g., cooling for thermal energy sources or other operations) (robust evidence, high agreement). [10.2,
10.3, 25.7, Box CC-WE] Water is required for mining, processing, and residue disposal of fossil fuels or their byproducts. [25.7] Water
for energy currently ranges from a few percent in most developing countries to more than 50% of freshwater withdrawals in some
developed countries, depending on the country. [Box CC-WE] Future water requirements will depend on electric demand growth, the
portfolio of generation technologies, and water management options (medium evidence, high agreement). Future water availability
for energy production will change due to climate change (robust evidence, high agreement). [3.4, 3.5, Box CC-WE]
Energy is also required to supply and treat water. Water may require significant amounts of energy for lifting (especially as aquifers
continue to be depleted), transport, and distribution and for its treatment either to use it or to depollute it. Wastewater and even
excess rainfall in cities requires energy to be treated or disposed. Some non-conventional water sources (wastewater or seawater)
are often highly energy intensive. [Table 25-7, Box 25-2] Energy intensities per cubic meter of water vary by about a factor of 10
among different sources, for example, locally produced potable water from ground/surface water sources versus desalinated seawater.
[Boxes 25-2 and CC-WE] Groundwater is generally more energy intensive than surface water. [Box CC-WE]
Linkages among water, energy, food/feed/fiber, and climate are strongly related to land use and management, such as afforestation,
which can affect water as well as other ecosystem services, climate, and water cycles (robust evidence, high agreement). Land
degradation often reduces efficiency of water and energy use (e.g., resulting in higher fertilizer demand and surface runoff), and
many of these interactions can compromise food security. On the other hand, afforestation activities to sequester carbon have
important co-benefits of reducing soil erosion and providing additional (even if only temporary) habitat, but may reduce renewable
water resources. [3.7, 4.4, Boxes 25-10 and CC-WE]
Consideration of the interlinkages of energy, food/feed/fiber, water, land use, and climate change has implications for security of
supplies of energy, food, and water; adaptation and mitigation pathways; air pollution reduction; and health and economic impacts.
This nexus is increasingly recognized as critical to effective climate-resilient-pathway decision making (medium evidence, high
agreement), although tools to support local- and regional-scale assessments and decision support remain very limited.
Water
Energy Food/feed/fiber
Water for energy
• Cooling of thermal power plants
• Hydropower
• Irrigation of bioenergy crops
• Extraction and refining
Energy for water
• Extraction and transportation
• Water treatment/desalination
• Wastewater, drainage,
treatment, and disposal
Energy for food/feed/fiber
Energy – Water – Food/Feed/Fiber – Climate change
GHG
emissions/
climate change
Nutritionally appropriate low-meat
diet or low-water-consuming
vegetarian diet generally reduces
water and energy demand as well as
GHG emissions per person.
Use of agricultural, livestock, and food
waste may reduce conventional energy
use and GHG emissions.
Climate change tends to increase
energy demand for cooling as well as
water demand.
Box TS.9 Figure 1 | The water–energy–food nexus as related to climate change, with implications for both adaptation and mitigation strategies. [Figure WE-1, Box CC-WE]
• Crop and livestock production
• Processing and transport
• Food consumption
• Energy for irrigated crops
Food/feed/fiber for energy production
Competition between (bio)energy and
food/fiber production for water and land
Water for food/feed/fiber
Impact of food/feed/fiber
production on water quality
and runoff generation
• Irrigation
• Livestock water use
• Water use for food processing

93
Frequently Asked Questions
FAQ
Working Group II Frequently Asked Questions
These FAQs provide an entry point to the approach and scientific findings
of the Working Group II contribution to the Fifth Assessment Report.
F
or summary of the scientific findings, see the Summary for Policymakers
(SPM) and Technical Summary (TS). These FAQs, presented in clear and
accessible language, do not reflect formal assessment of the degree of
certainty in conclusions, and they do not include calibrated uncertainty
language presented in the SPM, TS, and underlying chapters. The sources
of the relevant assessment in the report are noted by chapter numbers
in square brackets.
FAQ 1: Are risks of climate change mostly due to changes in
extremes, changes in average climate, or both?
[Chapters 3, 4, 5, 6, 7, 8, 9, 10, 11, 12, 13, 18, 19, 22, 23, 24, 25, 26,
27, 28, 29, 30; TS]
People and ecosystems across the world experience climate in many
different ways, but weather and climate extremes strongly influence
losses and disruptions. Average climate conditions are important.
They provide a starting point for understanding what grows where and
for informing decisions about tourist destinations, other business
opportunities, and crops to plant. But the impacts of a change in average
conditions often occur as a result of changes in the frequency, intensity,
or duration of extreme weather and climate events. It is the extremes
that place excessive and often unexpected demands on systems poorly
equipped to deal with those extremes. For example, wet conditions lead
to flooding when storm drains and other infrastructure for handling
excess water are overwhelmed. Buildings fail when wind speeds exceed
design standards. For many kinds of disruption, from crop failure caused
by drought to sickness and death from heat waves, the main risks are
in the extremes, with changes in average conditions representing a
climate with altered timing, intensity, and types of extremes.
FAQ 2: How much can we say about what society will be like in
the future, in order to plan for climate change impacts?
[Chapters 1, 2, 14, 15, 16, 17, 20, and 21; TS]
Overall characteristics of societies and economies, such as population
size, economic activity, and land use, are highly dynamic. On the
scale of just 1 or 2 decades, and sometimes in less time than that,
technological revolutions, political movements, or singular events can
shape the course of history in unpredictable ways. To understand
potential impacts of climate change for societies and ecosystems,
scientists use scenarios to explore implications of a range of possible
futures. Scenarios are not predictions of what will happen, but they can
be useful tools for researching a wide range of “what if” questions
about what the world might be like in the future. They can be used to
study future emissions of greenhouse gases and climate change. They
can also be used to explore the ways climate-change impacts depend
on changes in society, such as economic or population growth or
progress in controlling diseases. Scenarios of possible decisions and
policies can be used to explore the solution space for reducing greenhouse
gas emissions and preparing for a changing climate. Scenario analysis
creates a foundation for understanding risks of climate change for
people, ecosystems, and economies across a range of possible futures.
It provides important tools for smart decision making when both
uncertainties and consequences are large.
F
AQ 3: Why is climate change a particularly difficult challenge
for managing risk?
[Chapters 1, 2, 16, 17, 19, 20, 21, and 25; TS]
Risk management is easier for nations, companies, and even individuals
when the likelihood and consequences of possible events are readily
understood. Risk management becomes much more challenging when
the stakes are higher or when uncertainty is greater. As the WGII AR5
demonstrates, we know a great deal about the impacts of climate
change that have already occurred, and we understand a great deal
about expected impacts in the future. But many uncertainties remain,
and will persist. In particular, future greenhouse gas emissions depend
on societal choices, policies, and technology advancements not yet
made, and climate-change impacts depend on both the amount of
climate change that occurs and the effectiveness of development in
reducing exposure and vulnerability. The real challenge of dealing
effectively with climate change is recognizing the value of wise and
timely decisions in a setting where complete knowledge is impossible.
This is the essence of risk management.
FAQ 4: What are the timeframes for mitigation and adaptation
benefits?
[Chapters 1, 2, 16, 19, 20, and 21; TS]
Adaptation can reduce damage from impacts that cannot be avoided.
Mitigation strategies can decrease the amount of climate change that
occurs, as summarized in the WGIII AR5. But the consequences of
investments in mitigation emerge over time. The constraints of existing
infrastructure, limited deployment of many clean technologies, and the
legitimate aspirations for economic growth around the world all tend to
slow the deviation from established trends in greenhouse gas emissions.
Over the next few decades, the climate change we experience will be
determined primarily by the combination of past actions and current
trends. The near-term is thus an era where short-term risk reduction
comes from adapting to the changes already underway. Investments in
mitigation during both the near-term and the longer-term do, however,
have substantial leverage on the magnitude of climate change in the
latter decades of the century, making the second half of the 21st century
and beyond an era of climate options. Adaptation will still be important
during the era of climate options, but with opportunities and needs that
will depend on many aspects of climate change and development policy,
both in the near term and in the long term.
FAQ 5: Can science identify thresholds beyond which climate
change is dangerous?
[Chapters 1, 2, 4, 5, 6, 16, 17, 18, 19, 20, and 25; TS]
Human activities are changing the climate. Climate-change impacts are
already widespread and consequential. But while science can quantify
climate change risks in a technical sense, based on the probability,
magnitude, and nature of the potential consequences of climate change,
determining what is dangerous is ultimately a judgment that depends
on values and objectives. For example, individuals will value the present
versus the future differently and will bring personal worldviews on the
importance of assets like biodiversity, culture, and aesthetics. Values
also influence judgments about the relative importance of global
economic growth versus assuring the well-being of the most vulnerable
among us. Judgments about dangerousness can depend on the extent
to which one’s livelihood, community, and family are directly exposed
and vulnerable to climate change. An individual or community displaced

94
Frequently Asked Questions
FAQ
b
y climate change might legitimately consider that specific impact
dangerous, even though that single impact might not cross the global
threshold of dangerousness. Scientific assessment of risk can provide
an important starting point for such value judgments about the danger
of climate change.
FAQ 6: Are we seeing impacts of recent climate change?
[Chapters 3, 4, 5, 6, 7, 11, 13, 18, 22, 23, 24, 25, 26, 27, 28, 29, and
30; SPM]
Yes, there is strong evidence of impacts of recent observed climate
change on physical, biological, and human systems. Many regions have
experienced warming trends and more frequent high-temperature
extremes. Rising temperatures are associated with decreased snowpack,
and many ecosystems are experiencing climate-induced shifts in the
activity, range, or abundance of the species that inhabit them. Oceans
are also displaying changes in physical and chemical properties that, in
turn, are affecting coastal and marine ecosystems such as coral reefs,
and other oceanic organisms such as mollusks, crustaceans, fishes, and
zooplankton. Crop production and fishery stocks are sensitive to
changes in temperature. Climate change impacts are leading to shifts
in crop yields, decreasing yields overall and sometimes increasing them
in temperate and higher latitudes, and catch potential of fisheries is
increasing in some regions but decreasing in others. Some indigenous
communities are changing seasonal migration and hunting patterns to
adapt to changes in temperature.
FAQ 7: Are the future impacts of climate change only negative?
Might there be positive impacts as well?
[Chapters 3, 4, 5, 6, 7, 8, 9, 10, 11, 12, 13, 19, 22, 23, 24, 25, 26, 27,
and 30]
Overall, the report identifies many more negative impacts than positive
impacts projected for the future, especially for high magnitudes and
rates of climate change. Climate change will, however, have different
impacts on people around the world and those effects will vary not only
by region but over time, depending on the rate and magnitude of climate
change. For example, many countries will face increased challenges for
economic development, increased risks from some diseases, or degraded
ecosystems, but some countries will probably have increased opportunities
for economic development, reduced instances of some diseases, or
expanded areas of productive land. Crop yield changes will vary with
geography and by latitude. Patterns of potential catch for fisheries are
changing globally as well, with both positive and negative consequences.
Availability of resources such as usable water will also depend on
changing rates of precipitation, with decreased availability in many
places but possible increases in runoff and groundwater recharge in
some regions like the high latitudes and wet tropics.
FAQ 8: What communities are most vulnerable to the impacts
of climate change?
[Chapters 8, 9, 12, 13, 19, 22, 23, 26, 27, 29, and Box CC-GC]
Every society is vulnerable to the impacts of climate change, but the
nature of that vulnerability varies across regions and communities, over
time, and depends on unique socioeconomic and other conditions.
Poorer communities tend to be more vulnerable to loss of health and
life, while wealthier communities usually have more economic assets
at risk. Regions affected by violence or governance failure can be
particularly vulnerable to climate change impacts. Development
c
hallenges, such as gender inequality and low levels of education,
and other differences among communities in age, race and ethnicity,
socioeconomic status, and governance can influence vulnerability to
climate change impacts in complex ways.
FAQ 9: Does climate change cause violent conflicts?
[Chapters 12, 19]
Some factors that increase risks from violent conflicts and civil wars are
sensitive to climate change. For example, there is growing evidence
that factors like low per capita incomes, economic contraction, and
inconsistent state institutions are associated with the incidence of civil
wars, and also seem to be sensitive to climate change. Climate-change
policies, particularly those associated with changing rights to resources,
can also increase risks from violent conflict. While statistical studies
document a relationship between climate variability and conflict, there
remains much disagreement about whether climate change directly
causes violent conflicts.
FAQ 10: How are adaptation, mitigation, and sustainable
development connected?
[Chapters 1, 2, 8, 9, 10, 11, 13, 17, 20, 22, 23, 24, 25, 26, 27, and 29]
Mitigation has the potential to reduce climate change impacts, and
adaptation can reduce the damage of those impacts. Together, both
approaches can contribute to the development of societies that are
more resilient to the threat of climate change and therefore more
sustainable. Studies indicate that interactions between adaptation and
mitigation responses have both potential synergies and tradeoffs
that vary according to context. Adaptation responses may increase
greenhouse gas emissions (e.g., increased fossil-based air conditioning
in response to higher temperatures), and mitigation may impede
adaptation (e.g., increased use of land for bioenergy crop production
negatively impacting ecosystems). There are growing examples of co-
benefits of mitigation and development policies, like those which can
potentially reduce local emissions of health-damaging and climate-
altering air pollutants from energy systems. It is clear that adaptation,
mitigation, and sustainable development will be connected in the future.
FAQ 11: Why is it difficult to be sure of the role of climate
change in observed effects on people and ecosystems?
[Chapter 3, 4, 5, 6, 7, 11, 12, 13, 18, 22, 23, 24, 25, 26, 27, 28,
29, and 30]
Climate change is one of many factors impacting the Earth’s complex
human societies and natural ecosystems. In some cases the effect of
climate change has a unique pattern in space or time, providing a
fingerprint for identification. In others, potential effects of climate
change are thoroughly mixed with effects of land use change, economic
development, changes in technology, or other processes. Trends in human
activities, health, and society often have many simultaneous causes,
making it especially challenging to isolate the role of climate change.
Much climate-related damage results from extreme weather events
and could be affected by changes in the frequency and intensity of these
events due to climate change. The most damaging events are rare, and
the level of damage depends on context. It can therefore be challenging
to build statistical confidence in observed trends, especially over short
time periods. Despite this, many climate change impacts on the physical
environment and ecosystems have been identified, and increasing numbers
of impacts have been found in human systems as well.
