
1133
21
Regional Context
Coordinating Lead Authors:
Bruce Hewitson (South Africa), Anthony C. Janetos (USA)
Lead Authors:
Timothy R. Carter (Finland), Filippo Giorgi (Italy), Richard G. Jones (UK), Won-Tae Kwon
(Republic of Korea), Linda O. Mearns (USA), E. Lisa F. Schipper (Sweden), Maarten K. van Aalst
(Netherlands)
Contributing Authors:
Eren Bilir (USA), Monalisa Chatterjee (USA/India), Katharine J. Mach (USA), Carol McSweeney
(UK), Grace Redmond (UK), Vanessa Schweizer (USA), Luke Wirth (USA), Claire van Wyk
(South Africa)
Review Editors:
Thomas Downing (USA), Phil Duffy (USA)
Volunteer Chapter Scientist:
Kristin Kuntz-Duriseti (USA)
This chapter should be cited as:
Hewitson
, B., A.C. Janetos, T.R. Carter, F. Giorgi, R.G. Jones, W.-T. Kwon, L.O. Mearns, E.L.F. Schipper, and M. van Aalst,
2014: Regional context. In: Climate Change 2014: Impacts, Adaptation, and Vulnerability. Part B: Regional Aspects.
Contribution of Working Group II to the Fifth Assessment Report of the Intergovernmental Panel on Climate
Change [Barros, V.R., C.B. Field, D.J. Dokken, M.D. Mastrandrea, K.J. Mach, T.E. Bilir, M. Chatterjee, K.L. Ebi,
Y.O. Estrada, R.C. Genova, B. Girma, E.S. Kissel, A.N. Levy, S. MacCracken, P.R. Mastrandrea, and L.L. White (eds.)].
Cambridge University Press, Cambridge, United Kingdom and New York, NY, USA, pp. 1133-1197.

21
1134
Executive Summary ......................................................................................................................................................... 1136
21.1. Introduction .......................................................................................................................................................... 1139
21.2. Defining Regional Context .................................................................................................................................... 1139
21.2.1. Decision-Making Context ............................................................................................................................................................... 1140
21.2.2. Defining Regions ............................................................................................................................................................................ 1140
Box 21-1. A New Framework of Global Scenarios for Regional Assessment ............................................................................ 1143
21.2.3. Introduction to Methods and Information ...................................................................................................................................... 1144
21.3. Synthesis of Key Regional Issues .......................................................................................................................... 1144
21.3.1. Vulnerabilities and Impacts ............................................................................................................................................................ 1147
21.3.1.1. Observed Impacts ............................................................................................................................................................ 1147
21.3.1.2. Future Impacts and Vulnerability ..................................................................................................................................... 1148
Box 21-2. Summary Regional Climate Projection Information ...................................................................................... 1152
21.3.2. Adaptation ..................................................................................................................................................................................... 1152
21.3.2.1. Similarities and Differences in Regions ............................................................................................................................ 1155
21.3.2.2. Adaptation Examples in Multiple Regions ....................................................................................................................... 1155
21.3.2.3. Adaptation Examples in Single Regions .......................................................................................................................... 1156
Box 21-3. Developing Regional Climate Information Relevant to Political and Economic Regions .............................. 1157
21.3.3. Climate System ............................................................................................................................................................................... 1158
21.3.3.1. Global Context ................................................................................................................................................................ 1158
21.3.3.2. Dynamically and Statistically Downscaled Climate Projections ....................................................................................... 1159
21.3.3.3. Projected Changes in Hydroclimatic Regimes, Major Modes of Variability, and Regional Circulations ............................ 1162
21.3.3.4. Projected Changes in Extreme Climate Events ................................................................................................................ 1162
Box 21-4. Synthesis of Projected Changes in Extremes Related to Temperature and Precipitation ............................. 1163
21.3.3.5. Projected Changes in Sea Level ....................................................................................................................................... 1171
21.3.3.6. Projected Changes in Air Quality ..................................................................................................................................... 1171
21.4. Cross-Regional Phenomena .................................................................................................................................. 1171
21.4.1. Trade and Financial Flows ............................................................................................................................................................... 1171
21.4.1.1. International Trade and Emissions ................................................................................................................................... 1171
21.4.1.2. Trade and Financial Flows as Factors Influencing Vulnerability ........................................................................................ 1173
21.4.1.3. Sensitivity of International Trade to Climate .................................................................................................................... 1173
21.4.2. Human Migration ........................................................................................................................................................................... 1175
21.4.3. Migration of Natural Ecosystems .................................................................................................................................................... 1176
Table of Contents

1135
Regional Context Chapter 21
21
21.5. Analysis and Reliability of Approaches to Regional Impacts, Adaptation, and Vulnerability Studies .................. 1176
21.5.1. Analyses of Vulnerability and Adaptive Capacity ............................................................................................................................ 1176
21.5.1.1. Indicators and Indices ..................................................................................................................................................... 1177
21.5.1.2. Hotspots .......................................................................................................................................................................... 1177
21.5.2. Impacts Analyses ............................................................................................................................................................................ 1178
21.5.3. Development and Application of Baseline and Scenario Information ............................................................................................. 1179
21.5.3.1. Baseline Information: Context, Current Status, and Recent Advances ............................................................................. 1179
21.5.3.2. Development of Projections and Scenarios ...................................................................................................................... 1181
21.5.3.3. Credibility of Projections and Scenarios .......................................................................................................................... 1182
21.6. Knowledge Gaps and Research Needs ................................................................................................................. 1184
References ....................................................................................................................................................................... 1184
Frequently Asked Questions
21.1: How does this report stand alongside previous assessments for informing regional adaptation? .................................................. 1150
21.2: Do local and regional impacts of climate change affect other parts of the world? ......................................................................... 1151
21.3: What regional information should I take into account for climate risk management for the 20-year time horizon? ...................... 1156
21.4: Is the highest resolution climate projection the best to use for performing impacts assessments? ................................................ 1182

1136
Chapter 21 Regional Context
21
Executive Summary
There has been an evolution in the treatment of regional aspects of climate change in IPCC reports from a patchwork of case
examples in early assessments toward recent attempts at a more systematic coverage of regional issues at continental and sub-
continental scales. {21.2.2}
Key topics requiring a regional treatment include changes in the climate itself and in other aspects of the climate
system (such as the cryosphere, oceans, sea level, and atmospheric composition), climate change impacts on natural resource sectors and on
human activities and infrastructure, factors determining adaptive capacity for adjusting to these impacts, emissions of greenhouse gases and
aerosols and their cycling through the Earth system, and human responses to climate change through mitigation and adaptation.
A good understanding of decision-making contexts is essential to define the type and scale of information on climate change-
related risks required from physical climate science and impacts, adaptation, and vulnerability (IAV) assessments (high confidence).
{21.2.1}
This is a general issue for all IAV assessments, but is especially important in the context of regional issues. Many studies still rely on
global data sets, models, and assessment methods to inform regional decisions. However, tailored regional approaches are often more effective
in accounting for variations in transnational, national, and local decision-making contexts, as well as across different groups of stakeholders
and sectors. There is a growing body of literature offering guidance on how to provide the most relevant climate risk information to suit specific
decision-making scales and processes.
A greater range of regional scale climate information is now available that provides a more coherent picture of past and future
regional changes with associated uncertainties. {21.3.3}
More targeted analyses of reference and projected climate information for
impact assessment studies have been carried out. Leading messages include:
• Significant improvements have been made in the amount and quality of climate data that are available for establishing baseline reference
states of climate-sensitive systems. {21.5.3.1} These include new and improved observational data sets, rescue and digitization of historical
data sets, and a range of improved global reconstructions of weather sequences.
• A larger set of global and regional (both dynamical and statistical) model projections allow a better characterization of ranges of plausible
climate futures than in the Fourth Assessment Report (AR4) {21.3.3}, and more methods are available to produce regional probabilistic
projections of changes for use in IAV assessment work. {21.5.3}
• Better process understanding would strengthen the emerging messages on future climate change where there remains significant regional
variation in their reliability. {21.3.3}
• Confidence in past climate trends has different regional variability, and in many regions there is higher confidence in future changes, often
owing to a lack of evidence on observed changes. {21.3; Box 21-4}
In spite of improvements, the available information is limited by the lack of comprehensive observations of regional climate, or
analyses of these, and different levels of confidence in projected climate change (high confidence).
Some trends that are of particular
significance for regional impacts and adaptation include: {21.3.3.1; WGI AR5 SPM}
• The globally averaged combined land and ocean surface temperature data show a warming of 0.85 (0.65 to 1.06) °C, over the period
1880–2012. There is regional variation in the global trend, but overall the entire globe has warmed during the period 1901–2012.
{WGI AR5 SPM} Future warming is very likely to be larger over land areas than over oceans. {WGI AR5 SPM}
• Averaged over mid-latitude land areas, precipitation has increased since 1901(medium confidence before and high confidence after 1951),
but for other regions there is low confidence in the assessment of precipitation trends. {WGI AR5 SPM}
• There are likely more land regions where the number of heavy precipitation events has increased than where it has decreased. The frequency
or intensity of heavy precipitation events has likely increased in North America and Europe. In other continents, confidence in changes in
heavy precipitation events is at most medium. The frequency and intensity of drought has likely increased in the Mediterranean and West
Africa and likely decreased in central North America and northwest Australia.
• The annual mean Arctic sea ice extent decreased over the period 1979–2012 with a rate that was very likely in the range 3.5 to 4.1% per
decade. Climate models indicate a nearly ice-free Arctic Ocean in September before mid-century is likely under the high forcing scenario
Representative Concentration Pathway 8.5 (RCP8.5) (medium confidence).
• The average rate of ice loss from glaciers worldwide, excluding those near the Greenland and Antarctic ice sheets, was very likely 275 (140
to 410) Gt yr
-1
over the period 1993–2009. By the end of the 21st century, the volume of glaciers (excluding those near the Antarctic ice
sheet) is projected to decrease by 15 to 55% for RCP2.6, and by 35 to 85% for RCP8.5, relative to 1986–2005 (medium confidence).

1137
21
Regional Context Chapter 21
• The rate of global mean sea level rise during the 21st century is very likely to exceed the rate observed during 1971–2010, under all RCP
scenarios. {21.3.3.5; WGI AR5 SPM} By the end of the 21st century it is very likely that sea level will rise in more than about 95% of the
ocean area, with about 70% of the global coastlines projected to experience a sea level change within 20% of the global mean change.
Sea level rise along coasts will also be a function of local and regional conditions, including land subsidence or uplift and patterns of
development near the coast.
There is substantial regional variation in observations and projections of climate change impacts, both because the impacts
themselves vary and because of unequal research attention. {21.3.1} Evidence linking observed impacts on biological, physical, and
increasingly) human systems to recent and ongoing regional temperature and (in some cases) precipitation changes have become more
compelling since the Fourth Assessment Report (AR4). This is due both to the greater availability of statistically robust, calibrated satellite
records, and to improved reporting from monitoring sites in hitherto under-represented regions, though the disparity still remains large between
data-rich and data-poor regions. Regional variations in physical impacts such as vegetation changes, sea level rise, and ocean acidification are
increasingly well documented, though their consequences for ecosystems and humans are less well studied or understood. Projections of future
impacts rely primarily on a diverse suite of biophysical, economic, and integrated models operating from global to site scales, though some
physical experiments are also conducted to study processes in altered environments. New research initiatives are beginning to exploit the
diversity of impact model projections, through cross-scale model intercomparison exercises.
There are large variations in the degree to which adaptation processes, practices, and policy have been studied and implemented
in different regions (high confidence). {21.3.2} Europe and Australia have had extensive research programs on climate change adaptation,
while research in Africa and Asia has been dominated by international partners and relies heavily on case studies of community-based adaptation.
National adaptation strategies are common in Europe, and adaptation plans are in place in some cities in Europe, the Americas, and Australasia,
with agriculture, water, and land use management the primary sectors of activity. However, it is still the case that implementation lags behind
planning in most regions of the world.
Contested definitions and alternative approaches to describing regional vulnerability to climate change pose problems for
interpreting vulnerability indicators. {21.3.1.2, 21.5.1.1}
There are numerous studies that use indicators to define aspects of vulnerability,
quantifying these across regional units (e.g., by country or municipality), often weighting and merging them into vulnerability indices and
presenting them regionally as maps. However, methods of constructing indices are subjective, often lack transparency, and can be difficult to
interpret. Moreover, indices commonly combine indicators reflecting current conditions (e.g., of socioeconomic capacity) with other indicators
describing projected changes (e.g., of future climate or population), and have failed to reflect the dynamic nature of the different indicator variables.
Hotspots draw attention, from various perspectives and often controversially, to locations judged to be especially vulnerable to
climate change. {21.5.1.2} Identifying hotspots is an approach that has been used to indicate locations that stand out in terms of IAV capacity
(or combinations of these). The approach exists in many fields and the meaning and use of the term hotspots differs, though their purpose is
generally to set priorities for policy action or for further research. Hotspots can be very effective as communication tools, but may also suffer
from methodological weaknesses. They are often subjectively defined, relationships between indicator variables may be poorly understood, and
they can be highly scale dependent. In part due to these ambiguities, there has been controversy surrounding the growing use of hotspots in
decision making, particularly in relation to prioritizing regions for climate change funding.
Cross-regional phenomena can be crucial for understanding the ramifications of climate change at regional scales, and its
impacts and policies of response (high confidence). {21.4}
These include global trade and international financial transactions, which are
linked to climate change as a direct or indirect cause of anthropogenic emissions; as a predisposing factor for regional vulnerability, through
their sensitivity to climate trends and extreme climate events; and as an instrument for implementing mitigation and adaptation policies.
Migration is also a cross-regional phenomenon, whether of people or of ecosystems, both requiring transboundary consideration of their
causes, implications, and possible interventions to alleviate human suffering and promote biodiversity.
Downscaling of global climate reconstructions and models has advanced to bring the climate data to a closer match for the
temporal and spatial resolution requirements for assessing many regional impacts, and the application of downscaled climate

1138
Chapter 21 Regional Context
21
data has expanded substantially since AR4. {21.3.3, 21.5.3} This information remains weakly coordinated, and current results indicate
that high-resolution downscaled reconstructions of the current climate can have significant errors. The increase in downscaled data sets has
not narrowed the uncertainty range. Integrating these data with historical change and process-based understanding remains an important
challenge.
Characterization of uncertainty in climate change research on regional scales has advanced well beyond quantifying uncertainties
in regional climate projections alone, to incorporating uncertainties in simulations of future impacts as well as considering
uncertainties in projections of societal vulnerability. {21.3.3, 21.5}
In particular, intercomparison studies are now examining the
uncertainties in impacts models (e.g., Agricultural Model Intercomparison and Improvement Project (AgMIP) and Inter-Sectoral Impact Model
Intercomparison Project (ISI-MIP)) and combining them with uncertainties in regional climate projections. Some results indicate that a larger
portion of the uncertainty in estimates of future impacts can be attributed to the impact models applied rather than to the climate projections
assumed. In addition, the deeper uncertainties associated with aspects of defining societal vulnerability to climate change related to the
alternative approaches to defining vulnerability are becoming appreciated. As yet there has been little research actively to quantify these
uncertainties or to combine them with physical impact and climate uncertainties.
Studies of multiple stressors and assessments of potential global and regional futures using scenarios with multiple, non-climate
elements are becoming increasingly common. {21.5.3.2-3} Non-climatic factors relevant to assessing a system’s vulnerability generally
involve a complex mix of influences such as environmental changes (e.g., in air, water, and soil quality; sea level; resource depletion), land use
and land cover changes, and socioeconomic changes (e.g., in population, income, technology, education, equity, governance). All of these non-
climate factors have important regional variations. There is significant variation in vulnerability owing to variability in these factors.

1139
Regional Context Chapter 21
21
21.1. Introduction
This chapter serves as an introduction to Part B of this volume. It provides
context for an assessment of regional aspects of climate change in
different parts of the world, which are presented in the following nine
chapters. While the main focus of those chapters is on the regional
dimensions of impacts, adaptation, and vulnerability (IAV), this chapter
also offers links to regional aspects of the physical climate reported by
Working Group I (WGI) and of mitigation analysis reported by Working
Group III (WGIII). The chapter frames the discussion of both global and
regional issues in a decision-making context. This context identifies
different scales of decisions that are made (e.g., global, international,
regional, national, subnational, local) and the different economic or impact
sectors that are often the objects of decision making (e.g., agriculture,
water resources, energy).
Within this framing, the chapter then provides three levels of synthesis.
First there is an evaluation of the state of knowledge of changes in the
physical climate system, and associated impacts and vulnerabilities, and
the degree of confidence that we have in understanding those on a
regional basis as relevant to decision making. Second, the regional
context of the sectoral findings presented in Part A of this volume is
discussed. Third, there is an analysis of the regional variation revealed
in subsequent chapters of Part B. In so doing, the goal is to examine how
the chapters reflect differences or similarities in how decision making
is being addressed by policy and informed by research in different regions
o
f the world, and whether there is commonality of experience among
regions that could be useful for enhancing decisions in the future.
Having analyzed similarities and differences among IPCC regions, the
chapter then discusses trans-regional and cross-regional issues that
affect both human systems (e.g., trade and financial flows) and natural
systems (e.g., ecosystem migration). Finally, the chapter evaluates
methods of assessing regional vulnerabilities and adaptation, impact
analyses, and the development and application of baselines and scenarios
of the future. These evaluations provide guidance for understanding
how such methods might ultimately be enhanced, so that the confidence
in research about possible future conditions and consequences might
ultimately improve.
21.2. Defining Regional Context
The climate system may be global in extent, but its manifestations—
through atmospheric processes, ocean circulation, bioclimatic zones,
daily weather, and longer-term climate trends—are regional or local in
their occurrence, character, and implications. Moreover, the decisions that
are or could be taken on the basis of climate change science play out on
a range of scales, and the relevance and limitations of information on
both biophysical impacts and social vulnerability differ strongly from
global to local scale, and from one region to another. Explicit recognition
of geographical diversity is therefore important for any scientific
Level
Coherent policies and decision making across domains
Economy Energy Food / fi ber Technology Environment …
Multi-level organization and governance
Global
• International Monetary
Fund
• World Bank
• World Trade Organization
• Millennium Development
Goals
• NGOs
• International Energy Agency
• NGOs
• UN Food and Agriculture
Organization
• World Trade Organization
• UN Convention on the Law
of the Sea (fi sheries)
• NGOs
• World Intellectual Property
Organization
• NGOs
• UN Framework Convention
on Climate Change
• Convention on Biological
Diversity
• Montreal Protocol
• NGOs
Transnational
• Multilateral Financial
Institutions / Multilateral
Development Banks
• Bilateral Financial
Institutions
• Organisation for Economic
Cooperation and
Development
• EU
• UN Convention on the Law
of the Sea (transport)
• Organization of the
Petroleum Exporting
Countries
• Electric grid operators
• Oil / gas distributors
• Association of Southeast
Asian Nations Free Trade
Area
• Common Market for Eastern
and Southern Africa
• Mercado Común del Sur
(Southern Common Market)
• EU Common
Agricultural / Fisheries
Policies
• Multi-nationals’ research
and development
• EU Innovation Union
• Convention on Long-range
Transboundary Air Pollution
(Europe, North America,
Central Asia)
• Mekong River Commission
for Sustainable
Development
• Lake Victoria Basin
Commission
• EU Directives
National
• Ministries / governments
• Departments / agencies
• Banks
• Taxation
• Ministries / governments
• Department s / agencies
• Energy providers
• Energy regulators
• Ministries / governments
• Department s / agencies
• Tariffs, quotas, regulations
• Ministries / governments
• Department s / agencies
• Education
• Innovation
• Research and development
• Ministries / governments
• Department s / agencies
• Environmental law
Subnational
• States / provinces / counties /
cIties
• Taxation
• States / province s / counties /
cities
• Public / private energy
providers
• States / provinces / counties /
cities
• Extension services
• Land use planning
• States / provinces / counties /
cities
• Incentives
• Science parks
• States / provinces / counties /
cities
• Protected areas
• Regional offi ces
Local
• Microfi nance
• Cooperatives
• Employers
• Voters
• Consumers
• Renewables
• Producers
• Voters
• Consumers
• Farmers
• Foresters
• Fishers
• Landowners
• Voters
• Consumers
• Entrepreneurs
• Investors
• Voters
• Consumers
• Environmentalists
• Landowners
• Voters
• Consumers
Notes: EU = European Union; NGO = Non-governmental Organization; UN = United Nations.
Table 21-1 | Dimensions of the institutions and actors involved in climate change decision making, including example entries referred to in chapters of this volume. Vertical
integration can occur within as well as between levels. Decision-making domains are illustrative. Modifi ed and extended from Mickwitz et al. (2009).

1140
Chapter 21 Regional Context
21
a
ssessment of anthropogenic climate change. The following sections
emphasize some of the crucial regional issues to be pursued in Part B
of this report.
21.2.1. Decision-Making Context
A good understanding of decision-making contexts is essential to define
the type and resolution and characteristics of information on climate
change-related risks required from physical climate science and impacts,
adaptation, and vulnerability assessments (IAV; e.g., IPCC, 2012). This
is a general issue for all IAV assessments (cf. the chapters in Part A), but
is especially important in the context of regional issues. Many studies
still rely on global data sets, models, and assessment methods to inform
regional decisions. However, tailored regional approaches are often
more effective in accounting for variations in transnational, national,
and local decision-making contexts, as well as across different groups
of stakeholders and sectors. There is a growing body of literature offering
guidance on how to provide the most relevant climate risk information
to suit specific decision-making scales and processes (e.g., Willows and
Connell, 2003; ADB, 2005; Kandlikar et al., 2011).
Table 21-1 illustrates the range of actors involved in decision making to
be informed by climate information at different scales in different sectors,
ranging from international policymakers and agencies, to national and
local government departments, to civil society organizations and the
private sector at all levels, all the way to communities and individual
households. The table illustrates how policymakers face a dual challenge
in achieving policy integration—vertically, through multiple levels of
governance, and horizontally, across different sectors (policy coherence).
Many climate change risk assessments have traditionally been undertaken
either in the context of international climate policy making (especially
United Nations Framework Convention on Climate Change (UNFCCC)),
or by (or for) national governments (e.g., Roshydromet, 2008; SEI, 2009;
Watkiss et al., 2011; DEFRA, 2012). In those cases, climate risk information
commonly assumes a central role in the decision making, for instance
to inform mitigation policy, or for plans or projects designed specifically
to adapt to a changing climate. In recent years, increasing attention has
been paid to more sector- or project-specific risk assessments, intended
to guide planning and practice by a range of actors (e.g., Liu et al., 2008;
Rosenzweig et al., 2011). In those contexts, climate may often be
considered as only one contributor among a much wider set of
considerations for a particular decision. In such cases, there is uncertainty
about not only the future climate, but also many other aspects of the
system at risk. Moreover, while analysts will seek the best available
climate risk information to inform the relative costs and benefits of the
options available to manage that risk, they will also need to consider
the various constraints to action faced by the actors involved.
Some of these decision-making contexts, such as the design of large
infrastructure projects, may require rigorous quantitative information
to feed formal evaluations, often including cost-benefit analysis (e.g.,
PriceWaterHouseCoopers, 2010; see also Chapter 17). Others, especially
at the local level, such as decision making in traditional communities,
are often made more intuitively, with a much greater role for a wide
range of social and cultural aspects. These may benefit much more from
e
xperience-based approaches, participatory risk assessments, or story-
telling to evaluate future implications of possible decisions (e.g., van
Aalst et al., 2008; World Bank, 2010a). Multi-criteria analysis, scenario
planning, and flexible decision paths offer options for taking action
when faced with large uncertainties or incomplete information, and can
help bridge adaptation strategies across scales (in particular between
the national and local levels). In most cases, an understanding of the
context in which the risk plays out, and the alternative options that may
be considered to manage it, are not an afterthought, but a defining
feature of an appropriate climate risk analysis, which requires a much
closer interplay between decision makers and providers of climate risk
information than often occurs in practice (e.g., Hellmuth et al., 2011;
Cardona et al., 2012; Mendler de Suarez et al., 2012).
The different decision-making contexts also determine the types of
climate information required, including the climate variables of interest
and the geographic and time scales on which they need to be provided.
Many climate change impact assessments have traditionally focused on
changes over longer time horizons (often out to 2100, though recently
studies have begun to concentrate more on mid-century or earlier). In
contrast, most decisions taken today have a planning horizon ranging
from a few months to about 2 decades (e.g., Wilby et al., 2009). For many
such shorter term decisions, recent climate variability and observed
trends are commonly regarded as sufficient to inform adaptation (e.g.,
Hallegatte, 2009). However, in so doing, there is often scope to make
better use of observed climatological information as well as seasonal
and maybe also decadal climate forecasts (e.g., Wang et al., 2009;
Ziervogel et al., 2010; HLT, 2011; Mehta et al., 2011; Kirtman et al.,
2014). For longer term decisions, such as decisions with irreversible
long-term implications and investments with a long investment horizon
and substantial vulnerability to changing climate conditions, longer term
climate risk information is needed (e.g., Reeder and Ranger, 2010).
However, while that longer term information is often used simply to
plan for a best-guess scenario to optimize for most probable conditions,
there is increasing attention for informing concerns about maladaptation
(Barnett and O’Neill, 2010) and sequencing of potential adaptation
options in a wider range of possible outcomes, requiring a stronger
focus on ranges of possible outcomes and guidance on managing
uncertainties, especially at regional, national, and sub-national levels
(Hall et al., 2012; Gersonius et al., 2013).
Section 21.3 summarizes different approaches that have been applied
at different scales, looking at IAV and climate science in a regional
context and paying special attention to information contained in the
regional chapters.
21.2.2. Defining Regions
There has been an evolution in the treatment of regional aspects of
climate change in IPCC reports (Table 21-2) from a patchwork of case
examples in the First Assessment Report (FAR) and its supplements,
through to attempts at a more systematic coverage of regional issues
following a request from governments, beginning with the Special Report
on the Regional Impacts of Climate Change in 1998. That report distilled
information from the Second Assessment Report (SAR) for 10 continental
scale regions, and the subsequent Third (TAR) and Fourth (AR4)

1141
Regional Context Chapter 21
21
a
ssessments each contained comparable chapters on IAV in the WGII
volumes. WGI and WGIII reports have also addressed regional issues
in various chapters, using different methods of mapping, statistical
aggregation, and spatial averaging to provide regional information.
P
art B of this WGII contribution to the Fifth Assessment Report (AR5) is
the first to address regional issues treated in all three WGs. It consists
of chapters on the six major continental land regions, polar regions,
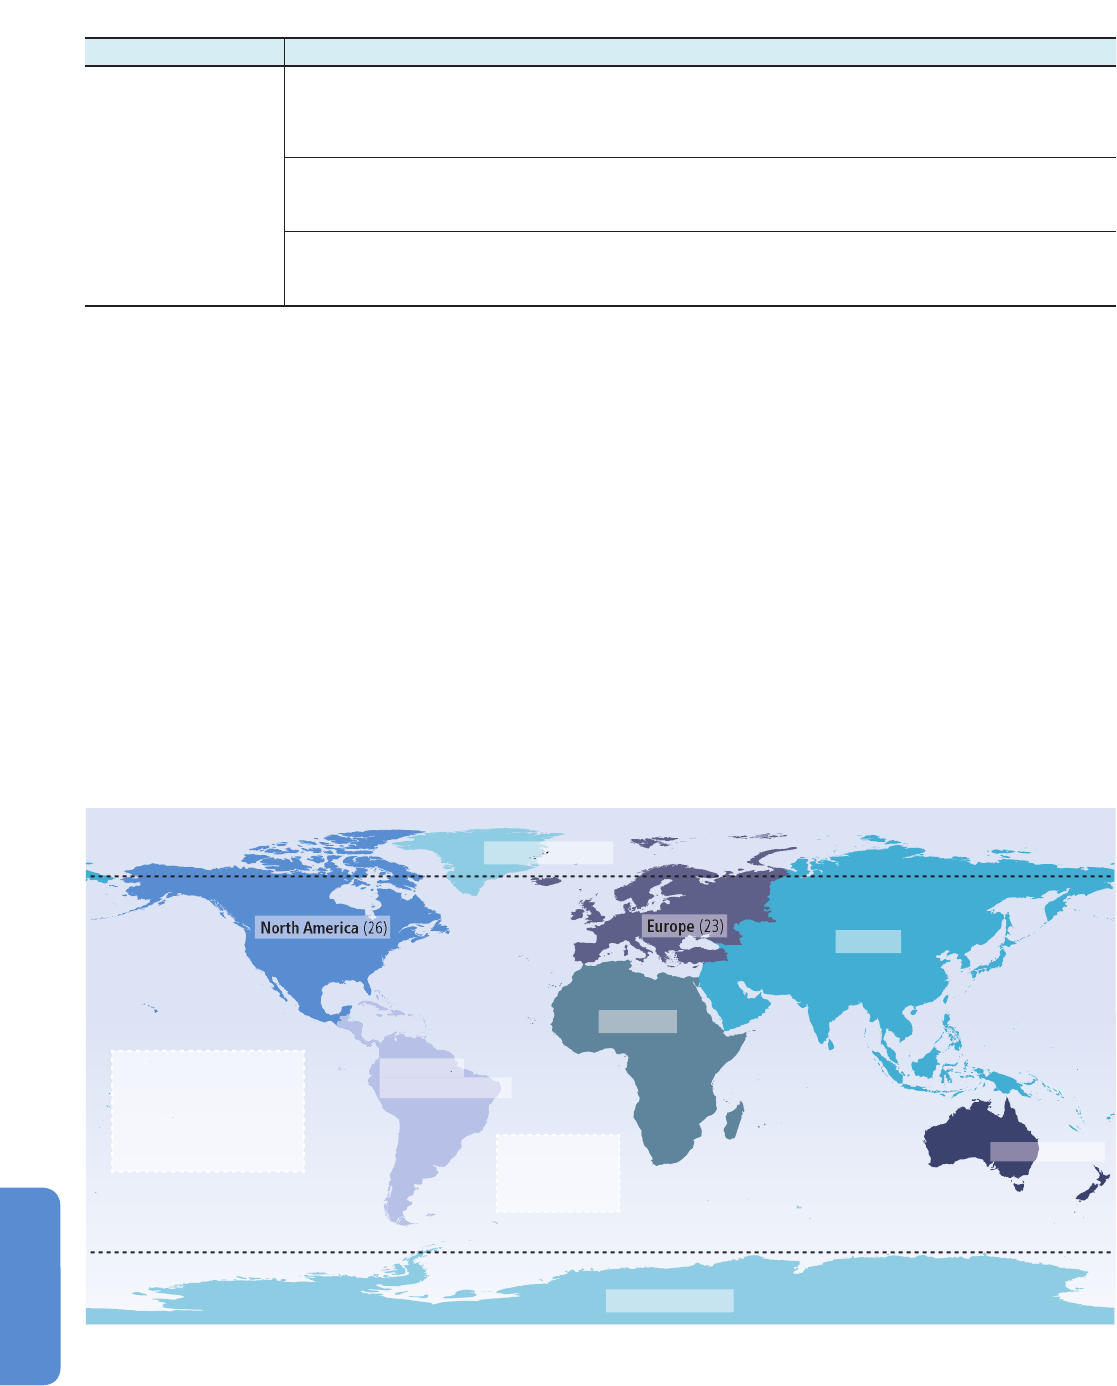
small islands, and the ocean. These are depicted in Figure 21-1.
Continued next page
IPCC report Treatment of regions
First Assessment Report (IPCC,
1
990a– c)
Climate: Climate projections for 2030 in 5 subcontinental regions; observations averaged for Northern / Southern Hemisphere, by selected regions, and by
2
0° latitude × 60° longitude grid boxes
Impacts: Agriculture by continent (7 regions); ecosystem impacts for 4 biomes; water resources for case study regions; oceans and coastal zones treated
s
eparately
Responses: Emissions scenarios by 5 economic groupings; energy and industry by 9 regions; coastal zone and wetlands by 20 world regions
Supplements to First Assessment
R
eport (IPCC, 1992a– b)
Climate: IS92 emissions scenarios by 7 world regions
I
mpacts: Agriculture by continent (6 regions); ocean ecology by 3 latitude zones; questionnaire to governments on current activities on impacts by 6 World
Meteorological Organization regions
S
R: Climate Change 1994 (IPCC,
1994a)
E
valuation of IS92 emissions scenarios by 4 world regions: OECD, USSR / Eastern Europe, China /Centrally Planned Asia, and Other
Second Assessment Report
(IPCC,
1
996a– c)
Climate: Gridded proportional circle maps for observed climate trends (5° latitude / longitude); climate projections for 7 subcontinental regions
I
mpacts, Adaptations, and Mitigation: Energy production statistics by 10 world regions; forests, wood production and management by three zones
(tropical, temperate, boreal); separate chapters by physiographic types (deserts, mountain regions, wetlands, cryosphere, oceans, and coastal zones and
s
mall islands); country case studies, agriculture by 8 continental-scale regions; energy supply by 8 world regions
Economic and social dimensions: Social costs and response options by 6 economic regions
S
R: Regional Impacts
(
IPCC, 1998) 10 continental-scale regions: Africa, Arctic and Antarctic, Australasia, Europe, Latin America, Middle East and Arid Asia, North America, Small Island
States, Temperate Asia, Tropical Asia. Subdivisions applied in some regions; vegetation shifts mapped by 9 biomes; reference socioeconomic data for 1990
provided by country and for all regions except polar
SR: Land-Use Change and Forestry
(IPCC, 1998a)
9 biomes; 15 land use categories; national and regional case studies
SR: Aviation
(IPCC, 1999) Observed and projected emissions by 22 regional air routes; inventories by 5 economic regions
SR: Technology Transfer
(IPCC,
2000b)
Country case studies; indicators of technology transfer by 6 or 7 economic regions
SR: Emissions Scenarios
(IPCC,
2000a)
4 SRES world regions defi ned in common across integrated assessment models; 11 sub-regions; driving factors by 6 continental regions
Third Assessment Report (TAR)
(IPCC, 2001a– c)
Climate: Gridded observations of climate trends; 20 example glaciers; 9 biomes for carbon cycle; Circulation Regimes for model evaluation; 23 “Giorgi-
type” regions for regional climate projections
Impacts, Adaptation, and Vulnerability: Example projections from 32 “Giorgi-type” regions; basins by continent; 5 coastal types; urban / rural settlements;
insurance by economic region; 8 continental-scale regions equivalent to 1998 Special Report but with single chapter for Asia; subdivisions used for each
region (Africa, Asia, and Latin America by climate zones; North America by 6 core regions and 3 border regions)
Mitigation: Country examples; developed (Annex I) and developing (non-Annex I); various economic regions; policies, measures, and instruments by 4
blocs: OECD, Economies in Transition, China and Centrally Planned Asia, and Rest of the World
SR: Ozone Layer (IPCC / TEAP,
2005)
Various economic regions /countries depending on sources and uses of chemicals
SR: Carbon Capture and Storage
(IPCC, 2005)
CO
2
sources by 9 economic regions; potential storage facilities by geological formation, by oil /gas wells, by ocean depth; costs by 4 economic groupings
Fourth Assessment Report (AR4)
(IPCC, 2007a– c)
Climate: Land use types for surface forcing of climate; observations by 19 Giorgi regions; modes of variability for model evaluation; attribution of climate
change by 22 “Giorgi-type” regions and by 6 ocean regions; climate statistics for 30 “Giorgi-type” regions; probability density functions of projections for
26 regions; summary graphs for 8 continental regions
Impacts, Adaptation, and Vulnerability: Studies reporting observed impacts by 7 IPCC regions; comparison of TAR and AR4 climate projections for 32
“Giorgi-type” regions; ecosystems by 11 biomes; agriculture by latitudinal zone; examples of coastal mega-deltas; industry and settlement by continental
region; 8 continental regions, as in TAR, but Small Islands not Small Island States; sub-regional summary maps for each region, using physiographic,
biogeographic, or geographic defi nitions; example vulnerability maps at sub-national scale and globally by country
Mitigation: 17 global economic regions for GDP; energy supply by continent, by economic region, by 3 UNFCCC groupings; trends in CO
2
emissions (and
projections), waste and carbon balance by economic region
SR: Renewable Energy Sources
and Climate Change Mitigation
(IPCC, 2011)
Global maps showing potential resources for renewable energy: land suitability for bioenergy production, global irradiance for solar, geothermal,
hydropower, ocean waves / tidal range, wind; various economic /continental regions: installed capacity (realized vs. potential), types of technologies,
investment cost, cost effectiveness, various scenario-based projections; country comparisons of deployment and uptake of technologies, share of energy
market
SR: Managing the Risks of
Extreme Events and Disasters
to Advance Climate Change
Adaptation
(IPCC, 2012)
Trends in observed (tables) and projected (maps and tables) climate extremes (T
max
, T
min
, heat waves, heavy precipitation and dryness) by 26 sub-
continental regions covering most land areas of the globe; attribution studies of return periods of extreme temperatures for 15 “Giorgi-type” regions;
gridded global maps of projected extremes of temperature, precipitation, wind speed, dry spells, and soil moisture anomalies; continental-scale estimates
of projected changes in impacts of extremes (fl oods, cyclones, coastal inundation) as well as frequencies of observed climate extremes and their estimated
costs); distinctions drawn between local, country and international /global actors with respect to risk management and its fi nancing
Table 21-2 | Selected examples of regional treatment in previous IPCC Assessment Reports and Special Reports (SRs). Major assessments are subdivided into three Working
Group reports, each described by generic titles.
1142
Chapter 21 Regional Context
21
Some of the main topics benefiting from a regional treatment are:
• Changes in climate, typically represented over sub-continental regions,
a scale at which global climate models simulate well the pattern of
observed surface temperatures, though more modestly the pattern
of precipitation (Flato et al., 2014). While maps are widely used to
represent climatic patterns, regional aggregation of this (typically
gridded) information is still required to summarize the processes
and trends they depict. Examples, including information on climate
extremes, are presented elsewhere in this chapter, with systematic
coverage of all regions provided in on-line supplementary material.
Selected time series plots of temperature and precipitation change
from an atlas of global and regional climate projections accompanying
the WGI report (Collins et al., 2014a) can also be found in several
regional chapters of this volume. In Figure 21-1, the sub-continental
regions used for summarizing climate information are overlaid on
a map of the nine regions treated in Part B.
• Changes in other aspects of the climate system, such as cryosphere,
oceans, sea level, and atmospheric composition. A regional treatment
of these phenomena is often extremely important to gauge real
risks, for example, when regional changes in land movements and
local ocean currents counter or reinforce global sea level rise
(Nicholls et al., 2013).
• Climate change impacts on natural resource sectors, such as agriculture,
forestry, ecosystems, water resources, and fisheries, and on human
activities and infrastructure, often with regional treatment according
to biogeographical characteristics (e.g., biomes; climatic zones;
physiographic features such as mountains, river basins, coastlines,
or deltas; or combinations of these).
• Adaptive capacity, which is a measure of society’s ability to adjust
to the potential impacts of climate change, sometimes characterized
in relation to social vulnerability (Füssel, 2010b) and represented
in regional statistics through the use of socioeconomic indicators.
IPCC report Treatment of regions
F
ifth Assessment Report (IPCC,
2013a, 2014, and this volume)
C
limate: Gridded global maps of observed changes in climate; cryosphere observations from 19 glacierized regions and 3 Arctic permafrost zones;
paleoclimatic reconstructions for 7 continental regions; CO
2
fl uxes for 11 land and 10 ocean regions; observed aerosol concentrations for 6 continental
r
egions and projections for 9 regions; detection and attribution of changes in mean and extreme climate for 7 continental and 8 ocean regions; climate
model evaluation and multi-model projections of extremes for 26 sub-continental regions; maps and time series of seasonal and annual multi-model
s
imulated climate changes for 19 sub-continental regions and global over 1900 –2100
Impacts, Adaptation, and Vulnerability, Part A: Global and sectoral aspects: Gridded global maps of water resources, species distributions, ocean
p
roductivity; global map of 51 ocean biomes; detection and attribution of observed impacts, key risks, and vulnerabilities and adaptation synthesis by
I
PCC regions. Part B: Regional aspects: 9 continental-scale regions, 8 as in AR4 plus the ocean; sub-regions in Africa (5), Europe (5), Asia (6), Central and
South America (5 or 7); Polar (2); Small Islands (4), Oceans (7); Other disaggregation by gridded maps or countries
M
itigation: Economic statistics by development (3 or 5 categories) or by income; 5 country groupings (plus international transport) for emission-
related scenario analysis (RCP5: OECD 1990 countries, Reforming Economies, Latin America and Caribbean, Middle East and Africa, Asia) with further
d
isaggregation to 10 regions (RCP10) for regional development; land use regions for forest (13) and agriculture (11); Most other analyses by example
countries
Notes: IS92 = IPCC Scenarios, 1992; OECD = Organisation for Economic Cooperation and Development; RCP = Representative Concentration Pathway; SRES = Special Report on
Emission Scenarios; UNFCCC = United Nations Framework Convention on Climate Change.
Table 21-2 (continued)
North America (26)
Europe (23)
Asia (24)
Australasia (25)
Polar Regions (28)
Polar Regions (28)
Africa (22)
The Ocean (30)
Central and
South America (27)
Small Islands (29)
These are principally sovereign states
and territories located in the tropical
Pacific, Indian, and eastern Atlantic
Oceans, and the Caribbean and
Mediterranean Seas.
Figure 21-1 | Specification of the world regions described in Chapters 22 to 30 of this volume. Chapter numbers are given in parentheses after each region’s name.

1143
Regional Context Chapter 21
21
• Emissions of greenhouse gases (GHGs) and aerosols and their cycling
through the Earth system (Blanco et al., 2014; Ciais et al., 2014).
• Human responses to climate change through mitigation and
adaptation, which can require both global and regional approaches
(e.g., Agrawala et al., 2014; Somanathan et al., 2014; Stavins et al.,
2014; see also Chapters 14 to 16).
Detailed examples of these elements are referred to throughout this
chapter and the regional ones that follow. Some of the more important
international political groupings that are pertinent to the climate change
issue are described and cataloged in on-line supplementary material
(Section SM21.1). Table SM21-1 lists United Nations member states and
other territories, their status in September 2013 with respect to some
illustrative groupings of potential relevance for international climate
change policy making, and the regional chapters in which they are
considered in this report.
Finally, new global socioeconomic and environmental scenarios for
climate change research have emerged since the AR4 that are richer and
more diverse and offer a higher level of regional detail than previous
scenarios taken from the IPCC Special Report on Emissions Scenarios
(SRES). These are introduced in Box 21-1.
Box 21-1 | A New Framework of Global Scenarios for Regional Assessment
The major socioeconomic driving factors of future emissions and their effects on the global climate system were characterized in the
TAR and AR4 using scenarios derived from the IPCC Special Report on Emissions Scenarios (SRES; IPCC, 2000a). However, these
scenarios are becoming outdated in terms of their data and projections, and their scope is too narrow to serve contemporary user
needs (Ebi et al., 2013). More recently a new approach to developing climate and socioeconomic scenarios has been adopted in
which concentration trajectories for atmospheric greenhouse gases (GHGs) and aerosols were developed first (Representative
Concentration Pathways (RCPs); Moss et al., 2010), thereby allowing climate modeling work to proceed much earlier in the process
than for SRES. Different possible Shared Socioeconomic Pathways (SSPs), intended for shared use among different climate change
research communities, were to be determined later, recognizing that more than one socioeconomic pathway can lead to the same
concentrations of GHGs and aerosols (Kriegler et al., 2012).
Four different RCPs were developed, corresponding to four different levels of radiative forcing of the atmosphere by 2100 relative to
preindustrial levels, expressed in units of W m
–
2
: RCP8.5, 6.0, 4.5, and 2.6 (van Vuuren et al., 2012). These embrace the range of
scenarios found in the literature, and all except RCP8.5 also include explicit stabilization strategies, which were missing from the
SRES set. An approximate mapping of the SRES scenarios onto the RCPs on the basis of a resemblance in radiative forcing by 2100 is
presented in Chapter 1, pairing RCP8.5 with SRES A2 and RCP 4.5 with B1 and noting that RCP6.0 lies between B1 and B2. No SRES
scenarios result in forcing as low as RCP2.6, though mitigation scenarios developed from initial SRES trajectories have been applied
in a few climate model experiments (e.g., the E1 scenario; Johns et al., 2011).
In addition, five SSPs have been proposed, representing a wide range of possible development pathways (van Vuuren et al., 2013).
An inverse approach is applied, whereby the SSPs are constructed in terms of outcomes most relevant to IAV and mitigation analysis,
depicted as challenges to mitigation and adaptation. Narrative storylines for the SSPs have been outlined and preliminary quantifications
of the socioeconomic variables are underway (O'Neill et al., 2013). Priority has been given to a set of basic SSPs with the minimum
detail and comprehensiveness needed to provide inputs to impacts, adaptation, and vulnerability (IAV), and integrated assessment
models, primarily at global or large regional scales. Building on the basic SSPs, a second stage will construct extended SSPs, designed
for finer-scale regional and sectoral applications (O’Neill et al., 2013).
An overall scenario architecture has been designed for integrating RCPs and SSPs (Ebi et al., 2013; van Vuuren et al., 2013), for
considering mitigation and adaptation policies using Shared Policy Assumptions (SPAs; Kriegler et al., 2013) and for providing relevant
socioeconomic information at the scales required for IAV analysis (van Ruijven et al., 2013). Additional information on these scenarios
can be found in Section 1.1.3 and elsewhere in the assessment (Blanco et al., 2014; Collins et al., 2014a; Kunreuther et al., 2014).
However, owing to the time lags that still exist between the generation of RCP-based climate change projections in the Coupled
Model Intercomparison Project Phase 5 (CMIP5; Taylor et al., 2012) and the development of SSPs, few of the IAV studies assessed in
this report actively use these scenarios. Instead, most of the scenario-related studies in the assessed literature still rely on the SRES.

1144
Chapter 21 Regional Context
21
21.2.3. Introduction to Methods and Information
There has been significant confusion and debate about the definitions
of key terms (Janssen and Ostrom, 2006), such as vulnerability (Adger,
2006), adaptation (Stafford Smith et al., 2011), adaptive capacity (Smit
and Wandel, 2006), and resilience (Klein et al., 2003). One explanation
is that the terms are not independent concepts, but defined by each
other, thus making it impossible to remove the confusion around the
definitions (Hinkel, 2011). The differences in the definitions relate to the
different entry points for looking at climate change risk (IPCC, 2012).
Table 21-3 shows two ways to think about vulnerability, demonstrating
that different objectives (e.g., improving well-being and livelihoods or
reducing climate change impacts) lead to different sets of questions being
asked. This results in the selection of different methods to arrive at the
answers. The two approaches portrayed in the middle and righthand
columns of Table 21-3 have also been characterized in terms of top-down
(middle column) and bottom-up (right column) perspectives, with the
former identifying physical vulnerability and the latter social vulnerability
(Dessai and Hulme, 2004). In the middle column, the climate change
impacts are the starting point for the analysis, revealing that people
and/or ecosystems are vulnerable to climate change. This approach
commonly applies global-scale scenario information and seeks to refine
this to the region of interest through downscaling procedures. For the
approach illustrated on the right, the development context is the starting
point (i.e., social vulnerability), commonly focusing on local scales, on top
of which climate change occurs. The task is then to identify what changes
are needed in the broader scale development pathways to reduce
vulnerability to climate change. Another difference is a contrast in time
frames, where a climate change-focused approach tends to look to the
future to see how to adjust to expected changes, whereas a vulnerability-
focused approach is centered on addressing the drivers of current
vulnerability. A similar approach is described by McGray et al. (2009).
The information assessed in this chapter stems from different entry
points, framings, and conceptual frameworks for thinking about risk. They
merge social and natural science perspectives with transdisciplinary
o
nes. There is no single “best” conceptual model: the approaches
change as scientific thinking evolves. The IPCC itself is an example of
this: The IPCC Special Report on Managing the Risks of Extreme Events
and Disasters to Advance Climate Change Adaptation (SREX; IPCC,
2012) presented an approach that has been adjusted and adapted in
Chapter 19 of this volume. Chapter 2 describes other conceptual models
for decision making in the context of risk. Though this diversity in
approaches enriches our understanding of climate change, it can also
create difficulties in comparisons. For instance, findings that are
described as vulnerabilities in some studies may be classified as impacts
in others; lack of adaptive capacity in one setting might be described
as social vulnerability in another.
21.3. Synthesis of Key Regional Issues
This section presents information on IAV and climate science in a
regional context. To illustrate how these different elements play out in
actual decision-making contexts, Table 21-4 presents examples drawn
from the regional and thematic chapters, which illustrate how information
about vulnerability and exposure, and climate science at different scales,
inform adaptation (implemented in policy and practice as part of a wider
decision-making context). These show that decision making is informed
by a combination of different types of information. However, this section
is organized by the three constituent elements: vulnerabilities and
impacts, adaptation, and climate science.
The following two subsections offer a brief synopsis of the approaches
being reported in the different regional chapters on impacts and
vulnerability studies (Section 21.3.1) and adaptation studies (Section
21.3.2), aiming particularly to highlight similarities and differences
among regions. Table 21-5 serves as a rough template for organizing
this discussion, which is limited to the literature that has been assessed
by the regional chapters. It is organized according to the broad research
approach applied, distinguishing impacts and vulnerability approaches
from adaptation approaches, and according to scales of application
ranging from global to local.
Context Climate change impacts perspective Vulnerability perspective
Root problem Climate change Social vulnerability
Policy context Climate change mitigation, compensation, technical adaptation Social adaptation, sustainable development
Illustrative policy question What are the benefi ts of climate change mitigation? How can the vulnerability of societies to climatic hazards be reduced?
Illustrative research question What are the expected net impacts of climate change in
different regions?
Why are some groups more affected by climatic hazards than others?
Vulnerability and adaptive capacity Adaptive capacity determines vulnerability Vulnerability determines adaptive capacity
Reference for adaptive capacity Adaptation to future climate change Adaptation to current climate variability
Starting point of analysis Scenarios of future climate change Current vulnerability to climatic variability
Analytical function Descriptive, positivist Explanatory, normative
Main discipline Natural science Social science
Meaning of “vulnerability” Expected net damage for a given level of global climate change Susceptibility to climate change and variability as determined by socioeconomic factors
Vulnerability approach Integrated, risk-hazard Political economy
Reference IPCC (2001a) Adger (1999)
Table 21-3 | Two possible entry points for thinking about vulnerability to climate change (illustrative and adapted from Füssel, 2007).

1145
Regional Context Chapter 21
21
S
ection 21.3.3 then provides an analysis of advances in understanding
of the physical climate system for the different regions covered in
Chapters 22 to 30, introducing new regional information to complement
the large-scale and process-oriented findings presented by WGI AR5.
U
nderstanding the reliability of this information is of crucial importance.
In the context of IAV studies it is relevant to a very wide range of
scales and it comes with a similarly wide range of reliabilities. Using a
classification of spatial scales similar to that presented in Table 21-5,
Continued next page
Early warning systems for heat
Exposure and vulnerability
F
actors affecting exposure and vulnerability include age, preexisting health status, level of outdoor activity, socioeconomic factors including poverty and social
isolation, access to and use of cooling, physiological and behavioral adaptation of the population, urban heat island effects, and urban infrastructure.
[8.2.3, 8.2.4, 11.3.3, 11.3.4, 11.4.1, 11.7, 13.2.1, 19.3.2, 23.5.1, 25.3, 25.8.1, SREX Table SPM.1]
Climate information at the
global scale
O
bserved:
•
Very likely decrease in the number of cold days and nights and increase in the number of warm days and nights, on the global scale between 1951 and
2
010. [WGI AR5 2.6.1]
• Medium confi dence that the length and frequency of warm spells, including heat waves, has increased globally since 1950. [WGI AR5 2.6.1]
P
rojected: Virtually certain that, in most places, there will be more hot and fewer cold temperature extremes as global mean temperatures increase, for
events defi ned as extremes on both daily and seasonal time scales. [WGI AR5 12.4.3]
Climate information at the
regional scale
Observed:
•
L
ikely that heat wave frequency has increased since 1950 in large parts of Europe, Asia, and Australia. [WGI AR5 2.6.1]
• Medium confi dence in overall increase in heat waves and warm spells in North America since 1960. Insuffi cient evidence for assessment or spatially varying
t
rends in heat waves or warm spells for South America and most of Africa. [SREX Table 3-2; WGI AR5 2.6.1]
Projected:
•
L
ikely that, by the end of the 21st century under Representative Concentration Pathway 8.5 (RCP8.5) in most land regions, a current 20-year high-
temperature event will at least double its frequency and in many regions occur every 2 years or annually, while a current 20-year low-temperature event
w
ill become exceedingly rare. [WGI AR5 12.4.3]
• Very likely more frequent and/or longer heat waves or warm spells over most land areas. [WGI AR5 12.4.3]
Description
Heat-health early warning systems are instruments to prevent negative health impacts during heat waves. Weather forecasts are used to predict situations
associated with increased mortality or morbidity. Components of effective heat wave and health warning systems include identifying weather situations
that adversely affect human health, monitoring weather forecasts, communicating heat wave and prevention responses, targeting notifi cations to vulnerable
populations, and evaluating and revising the system to increase effectiveness in a changing climate. Warning systems for heat waves have been planned and
implemented broadly, for example in Europe, the United States, Asia, and Australia.
[11.7.3, 24.4.6, 25.8.1, 26.6, Box 25-6]
Broader context
• Heat health warning systems can be combined with other elements of a health protection plan, for example building capacity to support communities most
at risk, supporting and funding health services, and distributing public health information.
• In Africa, Asia, and elsewhere, early warning systems have been used to provide warning of and reduce a variety of risks related to famine and food
insecurity; fl ooding and other weather-related hazards; exposure to air pollution from fi re; and vector-borne and food-borne disease outbreaks.
[7.5.1, 11.7, 15.4.2, 22.4.5, 24.4.6, 25.8.1, 26.6.3, Box 25-6]
Mangrove restoration to reduce fl ood risks and protect shorelines from storm surge
Exposure and vulnerability
Loss of mangroves increases exposure of coastlines to storm surge, coastal erosion, saline intrusion, and tropical cyclones. Exposed infrastructure, livelihoods,
and people are vulnerable to associated damage. Areas with development in the coastal zone, such as on small islands, can be particularly vulnerable.
[5.4.3, 5.5.6, 29.7.2, Box CC-EA]
Climate information at the
global scale
Observed:
• Likely increase in the magnitude of extreme high sea level events since 1970, mostly explained by rising mean sea level. [WGI AR5 3.7.5]
• Low confi dence in long-term (centennial) changes in tropical cyclone activity, after accounting for past changes in observing capabilities. [WGI AR5 2.6.3]
Projected:
• Very likely signifi cant increase in the occurrence of future sea level extremes by 2050 and 2100. [WGI AR5 13.7.2]
• In the 21st century, likely that the global frequency of tropical cyclones will either decrease or remain essentially unchanged. Likely increase in both global
mean tropical cyclone maximum wind speed and rainfall rates. [WGI AR5 14.6]
Climate information at the
regional scale
Observed: Change in sea level relative to the land (relative sea level) can be signifi cantly different from the global mean sea level change because of
changes in the distribution of water in the ocean and vertical movement of the land. [WGI AR5 3.7.3]
Projected:
• Low confi dence in region-specifi c projections of storminess and associated storm surges. [WGI AR5 13.7.2]
• Projections of regional changes in sea level reach values of up to 30% above the global mean value in the Southern Ocean and around North America, and
between 10% to 20% above the global mean value in equatorial regions. [WGI AR5 13.6.5]
• More likely than not substantial increase in the frequency of the most intense tropical cyclones in the western North Pacifi c and North Atlantic. [WGI AR5 14.6]
Description
Mangrove restoration and rehabilitation has occurred in a number of locations (e.g., Vietnam, Djibouti, and Brazil) to reduce coastal fl ooding risks and protect
shorelines from storm surge. Restored mangroves have been shown to attenuate wave height and thus reduce wave damage and erosion. They protect
aquaculture industry from storm damage and reduce saltwater intrusion.
[2.4.3, 5.5.4, 8.3.3, 22.4.5, 27.3.3]
Broader context
• Considered a low-regrets option benefi ting sustainable development, livelihood improvement, and human well-being through improvements for food
security and reduced risks from fl ooding, saline intrusion, wave damage, and erosion. Restoration and rehabilitation of mangroves, as well as of wetlands or
deltas, is ecosystem-based adaptation that enhances ecosystem services.
• Synergies with mitigation given that mangrove forests represent large stores of carbon.
• Well-integrated ecosystem-based adaptation can be more cost effective and sustainable than non-integrated physical engineering approaches.
[5.5, 8.4.2, 14.3.1, 24.6, 29.3.1, 29.7.2, 30.6.1, 30.6.2, Table 5-4, Box CC-EA]
Table 21-4 | Illustrative examples of adaptation experience, as well as approaches to reduce vulnerability and enhance resilience. Adaptation actions can be infl uenced by
climate variability, extremes, and change, and by exposure and vulnerability at the scale of risk management. Many examples and case studies demonstrate complexity at the
level of communities or specifi c regions within a country. It is at this spatial scale that complex interactions between vulnerabilities, inequalities, and climate change come to the
fore. At the same time, place-based examples illustrate how larger-level drivers and stressors shape differential risks and livelihood trajectories, often mediated by institutions.

1146
Chapter 21 Regional Context
21
Continued next page
Community-based adaptation and traditional practices in small island contexts
Exposure and vulnerability
W
ith small land area, often low elevation coasts, and concentration of human communities and infrastructure in coastal zones, small islands are particularly
vulnerable to rising sea levels and impacts such as inundation, saltwater intrusion, and shoreline change.
[
29.3.1, 29.3.3, 29.6.1, 29.6.2, 29.7.2]
Climate information at the
global scale
O
bserved:
• Likely increase in the magnitude of extreme high sea level events since 1970, mostly explained by rising mean sea level. [WGI AR5 3.7.5]
•
L
ow confi dence in long-term (centennial) changes in tropical cyclone activity, after accounting for past changes in observing capabilities. [WGI AR5 2.6.3]
• Singe 1950 the number of heavy precipitation events over land has likely increased in more regions than it has decreased. [WGI AR5 2.6.2]
P
rojected:
• Very likely signifi cant increase in the occurrence of future sea level extremes by 2050 and 2100. [WGI AR5 13.7.2]
•
I
n the 21st century, likely that the global frequency of tropical cyclones will either decrease or remain essentially unchanged. Likely increase in both global
m
ean tropical cyclone maximum wind speed and rainfall rates. [WGI AR5 14.6]
• Globally, for short-duration precipitation events, likely shift to more intense individual storms and fewer weak storms. [WGI AR5 12.4.5]
Climate information at the
regional scale
O
bserved: Change in sea level relative to the land (relative sea level) can be signifi cantly different from the global mean sea level change because of
changes in the distribution of water in the ocean and vertical movement of the land. [WGI AR5 3.7.3]
P
rojected:
• Low confi dence in region-specifi c projections of storminess and associated storm surges. [WGI AR5 13.7.2]
•
P
rojections of regional changes in sea level reach values of up to 30% above the global mean value in the Southern Ocean and around North America, and
between 10% and 20% above the global mean value in equatorial regions. [WGI AR5 13.6.5]
• More likely than not substantial increase in the frequency of the most intense tropical cyclones in the western North Pacifi c and North Atlantic. [WGI AR5 14.6]
Description
T
raditional technologies and skills can be relevant for climate adaptation in small island contexts. In the Solomon Islands, relevant traditional practices include
elevating concrete fl oors to keep them dry during heavy precipitation events and building low aerodynamic houses with palm leaves as roofi ng to avoid
h
azards from fl ying debris during cyclones, supported by perceptions that traditional construction methods are more resilient to extreme weather. In Fiji after
Cyclone Ami in 2003, mutual support and risk sharing formed a central pillar for community-based adaptation, with unaffected households fi shing to support
t
hose with damaged homes. Participatory consultations across stakeholders and sectors within communities and capacity building taking into account
traditional practices can be vital to the success of adaptation initiatives in island communities, such as in Fiji or Samoa. [29.6.2]
Broader context
• Perceptions of self-effi cacy and adaptive capacity in addressing climate stress can be important in determining resilience and identifying useful solutions.
•
T
he relevance of community-based adaptation principles to island communities, as a facilitating factor in adaptation planning and implementation, has
been highlighted, for example, with focus on empowerment and learning-by-doing, while addressing local priorities and building on local knowledge and
capacity. Community-based adaptation can include measures that cut across sectors and technological, social, and institutional processes, recognizing that
technology by itself is only one component of successful adaptation.
[5.5.4, 29.6.2]
Adaptive approaches to fl ood defense in Europe
Exposure and vulnerability
Increased exposure of persons and property in fl ood risk areas has contributed to increased damages from fl ood events over recent decades.
[5.4.3, 5.4.4, 5.5.5, 23.3.1, Box 5-1]
Climate information at the
global scale
Observed:
• Likely increase in the magnitude of extreme high sea level events since 1970, mostly explained by rising mean sea level. [WGI AR5 3.7.5]
• Since 1950 the number of heavy precipitation events over land has likely increased in more regions than it has decreased. [WGI AR5 2.6.2]
Projected:
• Very likely that the time-mean rate of global mean sea level rise during the 21st century will exceed the rate observed during 1971–2010 for all RCP
scenarios. [WGI AR5 13.5.1]
• Globally, for short-duration precipitation events, likely shift to more intense individual storms and fewer weak storms. [WGI AR5 12.4.5]
Climate information at the
regional scale
Observed:
• Likely increase in the frequency or intensity of heavy precipitation in Europe, with some seasonal and/or regional variations. [WGI AR5 2.6.2]
• Increase in heavy precipitation in winter since the 1950s in some areas of northern Europe (medium confi dence). Increase in heavy precipitation since the
1950s in some parts of west-central Europe and European Russia, especially in winter (medium confi dence). [SREX Table 3-2]
• Increasing mean sea level with regional variations, except in the Baltic Sea where the relative sea level is decreasing due to vertical crustal motion. [5.3.2,
23.2.2]
Projected:
• Over most of the mid-latitude land masses, extreme precipitation events will very likely be more intense and more frequent in a warmer world. [WGI AR5
12.4.5]
• Overall precipitation increase in northern Europe and decrease in southern Europe (medium confi dence). [23.2.2]
• Increased extreme precipitation in northern Europe during all seasons, particularly winter, and in central Europe except in summer (high confi dence).
[23.2.2; SREX Table 3.3]
Description
Several governments have made ambitious efforts to address fl ood risk and sea level rise over the coming century. In the Netherlands, government
recommendations include “soft” measures preserving land from development to accommodate increased river inundation; maintaining coastal protection
through beach nourishment; and ensuring necessary political-administrative, legal, and fi nancial resources. Through a multi-stage process, the British
government has also developed extensive adaptation plans to adjust and improve fl ood defenses to protect London from future storm surges and river
fl ooding. Pathways have been analyzed for different adaptation options and decisions, depending on eventual sea level rise, with ongoing monitoring of the
drivers of risk informing decisions.
[5.5.4, 23.7.1, Box 5-1]
Broader context
• The Dutch plan is considered a paradigm shift, addressing coastal protection by “working with nature” and providing “room for river.”
• The British plan incorporates iterative, adaptive decisions depending on the eventual sea level rise with numerous and diverse measures possible over the
next 50 to 100 years to reduce risk to acceptable levels.
• In cities in Europe and elsewhere, the importance of strong political leadership or government champions in driving successful adaptation action has been
noted.
[5.5.3, 5.5.4, 8.4.3, 23.7.1, 23.7.2, 23.7.4, Boxes 5-1 and 26-3]
Table 21-4 (continued)

1147
Regional Context Chapter 21
21
Table 21-6 provides a summary assessment of the reliability of information
on two basic climate variables of relevance, surface temperature and
precipitation. It is drawn from the extensive assessment and supporting
literature from the IPCC SREX (IPCC, 2012) and the WGI AR5 reports.
Some discussion of relevant methodologies and related issues and
results is also presented in Section 21.5.
Table 21-6 shows there are significant variations in reliability, with finer
scaled information generally less reliable given the need for a greater
density of observations and/or for models to maintain accuracy at high
resolutions. The reliability of information on past climate depends on the
availability and quality of observations, which are higher for temperature
than precipitation as observations of temperature are easier to make
and generally more representative of surrounding areas than is the case
for precipitation. Future climate change reliability depends on the
performance of the models used for the projections in simulating the
processes that lead to these changes. Again, information on temperature
is generally more reliable owing to the models’ demonstrated ability to
simulate the relevant processes when reproducing past changes. The
significant geographical variations, in the case of the observations, result
from issues with availability and/or quality of data in many regions,
especially for precipitation. For future climate change, data availability
is less of an issue with the advent of large ensembles of climate model
projections but quality is a significant problem in some regions where
the models perform poorly and there is little confidence that processes
driving the projected changes are accurately captured. A framework for
summary information on model projections of future climate change
placed in the context of observed changes is presented in Box 21-2.
21.3.1. Vulnerabilities and Impacts
21.3.1.1. Observed Impacts
The evidence linking observed impacts on biological, physical, and
(increasingly) human systems to recent and ongoing regional climate
changes has become more compelling since the AR4 (see Chapter 18).
One reason for this is the improved reporting of published studies from
hitherto under-represented regions of the world, especially in the tropics
(Rosenzweig and Neofotis, 2013). That said, the disparity is still large
between the copious evidence being presented from Europe and North
America, as well as good quality data emerging from Australasia, polar
regions, many ocean areas, and some parts of Asia and South America,
compared to the much sparser coverage of studies from Africa, large
parts of Asia, Central and South America, and many small islands. On
the other hand, as the time series of well-calibrated satellite observations
Continued next page
Index-based insurance for agriculture in Africa
Exposure and vulnerability
Susceptibility to food insecurity and depletion of farmers’ productive assets following crop failure. Low prevalence of insurance due to absent or poorly
d
eveloped insurance markets or to amount of premium payments. The most marginalized and resource-poor especially may have limited ability to afford
insurance premiums.
[
10.7.6, 13.3.2, Box 22-1]
Climate information at the
global scale
Observed:
•
V
ery likely decrease in the number of cold days and nights and increase in the number of warm days and nights, on the global scale between 1951 and
2
010. [WGI AR5 2.6.1]
•
M
edium confi dence that the length and frequency of warm spells, including heat waves, has increased globally since 1950. [WGI AR5 2.6.1]
•
S
ince 1950 the number of heavy precipitation events over land has likely increased in more regions than it has decreased. [WGI AR5 2.6.2]
• Low confi dence in a global-scale observed trend in drought or dryness (lack of rainfall). [WGI AR5 2.6.2]
P
rojected:
• Virtually certain that, in most places, there will be more hot and fewer cold temperature extremes as global mean temperatures increase, for events defi ned
a
s extremes on both daily and seasonal time scales. [WGI AR5 12.4.3]
• Regional to global-scale projected decreases in soil moisture and increased risk of agricultural drought are likely in presently dry regions, and are projected
w
ith medium confi dence by the end of this century under the RCP8.5 scenario. [WGI AR5 12.4.5]
• Globally, for short-duration precipitation events, likely shift to more intense individual storms and fewer weak storms. [WGI AR5 12.4.5]
Climate information at the
regional scale
Observed:
•
M
edium confi dence in increase in frequency of warm days and decrease in frequency of cold days and nights in southern Africa. [SREX Table 3-2]
• Medium confi dence in increase in frequency of warm nights in northern and southern Africa. [SREX Table 3-2]
P
rojected:
• Likely surface drying in southern Africa by the end of the 21st century under RCP8.5 (high confi dence). [WGI AR5 12.4.5]
•
L
ikely increase in warm days and nights and decrease in cold days and nights in all regions of Africa (high confi dence). Increase in warm days largest in
summer and fall (medium confi dence). [Table SREX 3-3]
•
L
ikely more frequent and/or longer heat waves and warm spells in Africa (high confi dence). [Table SREX 3-3]
Description
A recently introduced mechanism that has been piloted in a number of rural locations, including in Malawi, Sudan, and Ethiopia, as well as in India. When
physical conditions reach a particular predetermined threshold where signifi cant losses are expected to occur—weather conditions such as excessively high
o
r low cumulative rainfall or temperature peaks—the insurance pays out.
[9.4.2, 13.3.2, 15.4.4, Box 22-1]
Broader context
• Index-based weather insurance is considered well suited to the agricultural sector in developing countries.
• The mechanism allows risk to be shared across communities, with costs spread over time, while overcoming obstacles to traditional agricultural and disaster
insurance markets. It can be integrated with other strategies such as microfi nance and social protection programs.
• Risk-based premiums can help encourage adaptive responses and foster risk awareness and risk reduction by providing fi nancial incentives to policyholders
to reduce their risk profi le.
• Challenges can be associated with limited availability of accurate weather data and diffi culties in establishing which weather conditions cause losses.
Basis risk (i.e., farmers suffer losses but no payout is triggered based on weather data) can promote distrust. There can also be diffi culty in scaling up pilot
schemes.
• Insurance for work programs can enable cash-poor farmers to work for insurance premiums by engaging in community-identifi ed disaster risk reduction
projects.
[10.7.4 to 10.7.6, 13.3.2, 15.4.4, Table 10-7, Box 22-1, Box 25-7]
Table 21-4 (continued)

1148
Chapter 21 Regional Context
21
become longer in duration, and hence statistically more robust, these
are increasingly providing a near global coverage of changes in surface
characteristics such as vegetation, hydrology, and snow and ice conditions
that can usefully complement or substitute for surface observations (see
Table 21-4 and Chapter 18 for examples). Changes in climate variables
other than temperature, such as precipitation, evapotranspiration, and
carbon dioxide (CO
2
) concentration, are also being related to observed
impacts in a growing number of studies (Rosenzweig and Neofotis,
2013; see also examples from Australia in Table 25-3 and southeastern
South America in Figure 27-7).
Other regional differences in observed changes worth pointing out
include trends in relative sea level, which is rising on average globally
(Church et al., 2014), but displays large regional variations in magnitude,
or even sign, due to a combination of influences ranging from El Niño/
La Niña cycles to local tectonic activity (Nicholls et al., 2013), making
general conclusions about ongoing and future risks of sea level change
very difficult to draw across diverse regional groupings such as small
islands (see Chapter 29). There are also regional variations in another
ongoing effect of rising CO
2
concentration—ocean acidification, with
a greater pH decrease at high latitudes consistent with the generally
lower buffer capacities of the high latitude oceans compared to
lower latitudes (Rhein et al., 2014; Section 3.8.2). Calcifying organisms
are expected to show responses to these trends in future, but key
uncertainties remain at organismal to ecosystem levels (Chapter 30,
Box CC-OA).
21.3.1.2. Future Impacts and Vulnerability
21.3.1.2.1. Impact models
The long-term monitoring of environmental variables, as well as serving
a critical role in the detection and attribution of observed impacts, also
provides basic calibration material used for the development and testing
of impact models. These include process-based or statistical models used
to simulate the biophysical impacts of climate on outcomes such as
crop yield, forest productivity, river runoff, coastal inundation, or human
mortality and morbidity (see Chapters 2 to 7, 11). They also encompass
various types of economic models that can be applied to evaluate the
costs incurred by biophysical impacts (see, e.g., Chapters 10 and 17).
There are also Integrated Assessment Models (IAMs), Earth system
models, and other more loosely linked integrated model frameworks
that represent multiple systems and processes (e.g., energy, emissions,
climate, land use change, biophysical impacts, economic effects, global
trade) and the various interactions and feedbacks between them. For
examples of these, see Section 17.6.3 and Flato et al. (2014).
Relocation of agricultural industries in Australia
Exposure and vulnerability
Crops sensitive to changing patterns of temperature, rainfall, and water availability. [7.3, 7.5.2]
Climate information at the
global scale
Observed:
•
V
ery likely decrease in the number of cold days and nights and increase in the number of warm days and nights, on the global scale between 1951 and
2010. [WGI AR5 2.6.1]
•
M
edium confi dence that the length and frequency of warm spells, including heat waves, has increased globally since 1950. [WGI AR5 2.6.1]
• Medium confi dence in precipitation change over global land areas since 1950. [WGI AR5 2.5.1]
•
S
ince 1950 the number of heavy precipitation events over land has likely increased in more regions than it has decreased. [WGI AR5 2.6.2]
• Low confi dence in a global-scale observed trend in drought or dryness (lack of rainfall). [WGI AR5 2.6.2]
P
rojected:
• Virtually certain that, in most places, there will be more hot and fewer cold temperature extremes as global mean temperatures increase, for events defi ned
a
s extremes on both daily and seasonal time scales. [WGI AR5 12.4.3]
•
V
irtually certain increase in global precipitation as global mean surface temperature increases. [WGI AR5 12.4.1]
• Regional to global-scale projected decreases in soil moisture and increased risk of agricultural drought are likely in presently dry regions, and are projected
w
ith medium confi dence by the end of this century under the RCP8.5 scenario. [WGI AR5 12.4.5]
• Globally, for short-duration precipitation events, likely shift to more intense individual storms and fewer weak storms. [WGI AR5 12.4.5]
Climate information at the
regional scale
O
bserved:
• Cool extremes rarer and hot extremes more frequent and intense over Australia and New Zealand, since 1950 (high confi dence). [Table 25-1]
• Likely increase in heat wave frequency since 1950 in large parts of Australia. [WGI AR5 2.6.1]
•
L
ate autumn/winter decreases in precipitation in southwestern Australia since the 1970s and southeastern Australia since the mid-1990s, and annual
increases in precipitation in northwestern Australia since the 1950s (very high confi dence). [Table 25-1]
•
M
ixed or insignifi cant trends in annual daily precipitation extremes, but a tendency to signifi cant increase in annual intensity of heavy precipitation in
recent decades for sub-daily events in Australia (high confi dence). [Table 25-1]
P
rojected:
• Hot days and nights more frequent and cold days and nights less frequent during the 21st century in Australia and New Zealand (high confi dence). [Table
2
5-1]
• Annual decline in precipitation over southwestern Australia (high confi dence) and elsewhere in southern Australia (medium confi dence). Reductions
strongest in the winter half-year (high confi dence). [Table 25-1]
•
I
ncrease in most regions in the intensity of rare daily rainfall extremes and in sub-daily extremes (medium confi dence) in Australia and New Zealand. [Table
25-1]
• Drought occurrence to increase in southern Australia (medium confi dence). [Table 25-1]
• Snow depth and snow area to decline in Australia (very high confi dence). [Table 25-1]
• Freshwater resources projected to decline in far southeastern and far southwestern Australia (high confi dence). [25.5.2]
Description
Industries and individual farmers are relocating parts of their operations, for example for rice, wine, or peanuts in Australia, or are changing land use in situ
in response to recent climate change or expectations of future change. For example, there has been some switching from grazing to cropping in southern
Australia. Adaptive movement of crops has also occurred elsewhere.
[7.5.1, 25.7.2, Table 9-7, Box 25-5]
Broader context
• Considered transformational adaptation in response to impacts of climate change.
• Positive or negative implications for the wider communities in origin and destination regions.
[25.7.2, Box 25-5]
Table 21-4 (continued)

1149
Regional Context Chapter 21
21
Scale
Approach / fi eld
Impacts / vulnerability Adaptation Target fi eld
Global • Resource availability
1,2,3
• Impact costs
4, 5, 6, 7
•
Vulnerability / risk mapping
8
,9,10
• Hotspots analysis
11
• Adaptation costs
4,5,6,7,12
• Policy negotiations
• Development aid
•
Disaster planning
• Capacity building
C
ontinental / biome • Observed impacts
1
3,14,15
•
Future biophysical impacts
16,17
• Impact costs
5,16
•
Vulnerability / risk mapping
1
8
•
Adaptation costs
5
•
Modeled adaptation
19
•
Capacity building
•
International law
• Policy negotiations
•
Regional development
National / state / province • Observed impacts
20,21,22
• Future impacts/risks
2
3, 24
•
Vulnerability assessment
24
• Impact costs
25
• Observed adaptation
26
• Adaptation assessment
2
4,27
• National adaptation plan /strategy
• National communication
•
Legal requirement
• Regulation
M
unicipality / basin / patch / delta / farm • Hazard / risk mapping
28
•
Pest/disease risk mapping
2
9
• Urban risks / vulnerabilities
3
0
•
Adaptation cost
28
•
Urban adaptation
3
0,31
•
Spatial planning
•
Extension services
• Water utilities
• Private sector
Site / fi eld / tree / fl oodplain / household • Field experiments
3
2
• Coping studies
3
3,34
• Economic modeling
35
•
Agent-based modeling
36
• Individual actors
• Local planners
Table 21-5 | Dimensions of assessments of impacts and vulnerability and of adaptation drawn on to serve different target fi elds (cf. Table 21-1). Scales refer to the level of
aggregation at which study results are presented. Entries are illustrations of different types of study approaches reported and evaluated in this volume, with references given both
to original studies and to chapters in which similar studies are cited. Aspects of some of the studies in this table are also alluded to in Section 21.5.
1. Global terrestrial water balance in the Water Model Intercomparison Project (Haddeland et al., 2011); see 3.4.1.
2. Global dynamic vegetation model intercomparison (Sitch et al., 2008); see 4.3.2.
3. Impacts on agriculture, coasts, water resources, ecosystems, and health in the Inter-Sectoral Impact Model Intercomparison Project (Schiermeier, 2012); see 19.6.2.
4. UNFCCC study to estimate the aggregate cost of adaptation (UNFCCC, 2007), which is critiqued by Parry (2009) and Fankhauser (2010)
5. The Economics of Adaptation to Climate Change study (World Bank, 2010).
6. A thorough evaluation of global modeling studies is provided in 17.4.2. (See also 14.5.2 and 16.3.2.)
7. Impacts on agriculture and costs of adaptation (e.g., Nelson et al., 2009b); see 7.4.4.
8. Can we avoid dangerous climate change? (AVOID) program and Quantifying and Understanding the Earth System (QUEST) Global-scale impacts of climate change (GSI)
project (Arnell et al., 2013); see 19.7.1.
9. OECD project on Cities and Climate Change (Hanson et al., 2011); see 5.4.3, 23.3.1, 24.4.5, and 26.8.3.
10. For critical reviews of global vulnerability studies, see Füssel (2010b) and Preston et al. (2011).
11. A discussion of hotspots can be found in Section 21.5.1.2.
12. Adaptation costs for climate change-related human health impacts (Ebi, 2008); see 17.4.2.
13. Satellite monitoring of sea ice over polar regions (Comiso and Nishio, 2008); see also Vaughan et al. (2013).
14. Satellite monitoring of vegetation growth (e.g., Piao et al., 2007) and phenology (e.g., Heumann et al., 2011); see 4.3.2, 4.3.3, and 18.3.2.
15. Meta-analysis of range shifts in terrestrial organisms (e.g., Chen et al., 2011); see 4.3.2 and 18.3.2.
16. Physical and economic impacts of future climate change in Europe (Ciscar et al., 2011); see 23.3.1 and 23.4.1.
17. Impacts on crop yields in West Africa (Roudier et al., 2011); see Chapter 22.3.4.
18. Climate change integrated methodology for cross-sectoral adaptation and vulnerability in Europe (CLIMSAVE) project (Harrison et al., 2012); see 23.2.1.
19. Modeling agricultural management under climate change in sub-Saharan Africa (Waha et al., 2013).
20. Satellite monitoring of lake levels in China (Wang et al., 2013).
21. Satellite monitoring of phenology in India (Singh et al., 2006) and in other regions (18.3.2).
22. UK Climate Change Risk Assessment (CCRA, 2012); see Table 15-2.
23. United States Global Change Research Program second (Karl et al., 2009) and third (in review) national climate change impact assessments; see 26.1.
24. The Global Environment Facility-funded Assessments of Impacts and Adaptations to Climate Change program addressed impacts and vulnerability (Leary et al., 2008b) and
adaptation (Leary et al., 2008a) in developing countries; for example, see 27.3.5.
25. Economics of Climate Change national studies in Kenya and Tanzania (SEI, 2009; GCAP, 2011); see 22.3.6.
26. Sowing dates of various crops in Finland (Kaukoranta and Hakala, 2008); and see 23.4.1.
27. Finnish Climate Change Adaptation Research Programme (ISTO) Synthesis Report (Ruuhela, 2012).
28. Urban fl ood risk and adaptation cost, Finland (Perrels et al., 2010).
29. See Garrett (2013) for a specifi c example of a risk analysis, or Sutherst (2011) for a review; and see 25.7.2.
30. New York City coastal adaptation (Rosenzweig et al., 2011); and see 8.2 and Box 26-3.
31. Bangkok Assessment Report of Climate Change (BMA/GLF/UNEP, 2009); see 8.3.3.
32. Field, chamber and laboratory plant response experiments (e.g., Long et al., 2006; Hyvönen et al., 2007; Wittig et al., 2009; Craufurd et al., 2013); see 4.2.4 and 7.3.1.
33. Farming response to irrigation water scarcity in China (Liu et al., 2008); and see 13.2.2.
34. Farmers’ mechanisms for coping with hurricanes in Jamaica (Campbell and Beckford, 2009); and see 29.6.
35. Modeling micro-insurance of subsistence farmers for drought losses in Ethiopia (Meze-Hausken et al., 2009); see 14.3.1.
36. Simulating adaptive behavior of farming communities in the Philippines (Acosta-Michlik and Espaldon, 2008); see 24.4.6.

1150
Chapter 21 Regional Context
21
Spatial scale Era
Temporal scale
Annual Seasonal Daily
Temperature Precipitation Temperature Precipitation Temperature Precipitation
Global
Past VH H VH HN/AN/A
F
uture change VH (direction)
H (amount)
H
(direction)
MH (amount)
V
H (direction)
H (amount)
H
(direction)
MH (amount)
N
/A N/A
Regional, large
river basin
P
ast VH–H (depends
on observation
a
vailability)
H
–L (depends
on observation
a
vailability)
V
H–H (depends
on observation
a
vailability)
H
–L (depends
on observation
a
vailability)
V
H–H (depends
on observation
a
vailability)
H
–L (depends
on observation
a
vailability)
F
uture change VH (direction)
H (amount)
H
–L (depends on
capture of processes)
V
H (direction)
MH (amount)
H
–L (depends on
capture of processes)
V
H (direction)
MH (amount)
H
–L (depends on
capture of processes)
National, state
P
ast VH–H (depends
on observation
a
vailability)
H
–L (depends
on observation
a
vailability)
V
H–H (depends
on observation
a
vailability)
H
–L (depends
on observation
a
vailability)
V
H–H (depends
on observation
a
vailability)
H
–VL (depends
on observation
a
vailability)
Future change VH (direction)
M
H (amount)
H–L (depends on
c
apture of processes)
VH (direction)
M
H (amount)
H–L (depends on
c
apture of processes)
H (direction)
M
H (amount)
H–VL (depends on
c
apture of processes)
City, county
Past VH–M (depends
o
n observation
availability)
H–VL (depends
o
n observation
availability)
VH–M (depends
o
n observation
availability)
H–VL (depends
o
n observation
availability)
H–ML (depends
o
n observation
availability)
H–VL (depends
o
n observation
availability)
Future change H (direction)
MH (amount)
H–VL (depends on
c
apture of processes)
H (direction)
MH (amount)
H–VL (depends on
c
apture of processes)
H (direction)
M (amount)
M–VL (depends on
c
apture of processes)
Village, site / fi eld
Past VH–ML (depends
on observation
availability)
H–VL (depends
on observation
availability)
VH–ML (depends
on observation
availability)
H–VL (depends
on observation
availability)
H–ML (depends
on observation
availability)
H–VL (depends
on observation
availability)
Future change H (direction)
MH (amount)
H–VL (depends on
capture of processes)
H (direction)
MH (amount)
H–VL (depends on
capture of processes)
H (direction)
M (amount)
M–VL (depends on
capture of processes)
Table 21-6 | Reliability of climate information on temperature and precipitation over a range of spatial and temporal scales. Reliability is assigned to one of seven broad
categories from Very High (VH) to Medium (M) through to Very Low (VL).
Frequently Asked Questions
FAQ 21.1 | How does this report stand alongside previous assessments
for informing regional adaptation?
The five major Working Group II assessment reports produced since 1990 all share a common focus that addresses
the environmental and socioeconomic implications of climate change. In a general sense, the earlier assessments
are still valid, but the assessments have become much more complete over time, evolving from making very simple,
general statements about sectoral impacts, through greater concern with regions regarding observed and projected
impacts and associated vulnerabilities, through to an enhanced emphasis on sustainability and equity, with a deeper
examination of adaptation options. Finally, in the current report there is a much improved appreciation of the
context for regional adaptation and a more explicit treatment of the challenges of decision making within a risk
management framework.
Obviously one can learn about the latest understanding of regional impacts, vulnerability, and adaptation in the
context of climate change by looking at the most recent report. This builds on the information presented in previous
reports by reporting developments in key topics. New and emergent findings are given prominence, as these may
present fresh challenges for decision makers. Differences with the previous reports are also highlighted—whether
reinforcing, contradicting, or offering new perspectives on earlier findings—as these too may have a bearing on
past and present decisions. Following its introduction in the TAR, uncertainty language has been available to convey
the level of confidence in key conclusions, thus offering an opportunity for calibrated comparison across successive
reports. Regional aspects have been addressed in dedicated chapters for major world regions, first defined following
the SAR and used with minor variations in the three subsequent assessments. These consist of the continental
regions of Africa, Europe, Asia, Australasia, North America, Central and South America, Polar Regions, and Small
Islands, with a new chapter on The Oceans added for the present assessment.

1151
Regional Context Chapter 21
21
21.3.1.2.2. Vulnerability mapping
A second approach to projecting potential future impacts is to construct
vulnerability maps. These usually combine information on three
components: exposure to a hazard (commonly defined by the magnitude
of climate change, sensitivity to that hazard), the magnitude of response
for a given level of climate change, and adaptive capacity (describing
the social and economic means to withstand the impacts of climate
change (IPCC, 2001b)). Key indicators are selected to represent each of
the three components, which are sometimes combined into a single
index of vulnerability. Indicators are usually measured quantities taken
from statistical sources (e.g., income, population), or have been modeled
separately (e.g., key climate variables). Vulnerability indices have
received close scrutiny in several recent reviews (Füssel, 2010b; Hinkel,
2011; Malone and Engle, 2011; Preston et al., 2011; Kienberger et al.,
2012), and a number of global studies have been critiqued by Füssel
(2010b).
A variant of vulnerability mapping is risk mapping (e.g., Ogden et al.,
2008; Tran et al., 2009). This commonly identifies a single indicator of
hazard (e.g., a level of flood expected with a given return period), which
can be mapped accurately to define those regions at risk from such an
event (e.g., in a flood plain). Combined with information on changing
r
eturn periods of such events under a changing climate would enable
some estimate of altered risk to be determined.
21.3.1.2.3. Experiments
A final approach for gaining insights on potential future impacts concerns
physical experiments designed to simulate future altered environments
of climate (e.g., temperature, humidity, and moisture) and atmospheric
composition (e.g., CO
2
, surface ozone, and sulfur dioxide concentrations).
These are typically conducted to study responses of crop plants, trees, and
natural vegetation, using open top chambers, greenhouses, or free air gas
release systems (e.g., Craufurd et al., 2013), or responses of aquatic
organisms such as plankton, macrophytes, or fish, using experimental
water enclosures known as mesocosms (e.g., Sommer et al., 2007;
Lassen et al., 2010).
21.3.1.2.4. Scale issues
Impact models operate at a range of spatial and temporal resolutions,
and while their outputs are sometimes presented as fine-resolution
maps, key model findings are rarely produced at the finest resolution
Frequently Asked Questions
FAQ 21.2 | Do local and regional impacts of climate change affect other parts of the world?
Local and regional impacts of climate change, both adverse and beneficial, may indeed have significant ramifications
in other parts of the world. Climate change is a global phenomenon, but often expresses itself in local and regional
shocks and trends impacting vulnerable systems and communities. These impacts often materialize in the same
place as the shock or trend, but also much farther afield, sometimes in completely different parts of the world.
Regional interdependencies include both the global physical climate system as well as economic, social, and political
systems that are becoming increasingly globalized.
In the physical climate system, some geophysical impacts can have large-scale repercussions well beyond the regions
in which they occur. A well-known example of this is the melting of land-based ice, which is contributing to sea
level rise (and adding to the effects of thermal expansion of the oceans), with implications for low-lying areas far
beyond the polar and mountain regions where the melting is taking place.
Other local impacts can have wider socioeconomic and geopolitical consequences. For instance, extreme weather
events in one region may impact production of commodities that are traded internationally, contributing to shortages
of supply and hence increased prices to consumers, influencing financial markets and disrupting food security
worldwide, with social unrest a possible outcome of food shortages. Another example, in response to longer term
trends, is the potential prospect of large-scale migration due to climate change. Though hotly contested, this link
is already seen in the context of natural disasters, and could become an issue of increasing importance to national
and international policymakers. A third example is the shrinkage of Arctic sea ice, opening Arctic shipping routes
as well as providing access to valuable mineral resources in the exclusive economic zones of countries bordering the
Arctic, with all the associated risks and opportunities. Other examples involving both risks and opportunities include
changes of investment flows to regions where future climate change impacts may be beneficial for productivity.
Finally, some impacts that are entirely local and may have little or no direct effect outside the regions in which they
occur still threaten values of global significance, and thus trigger international concern. Examples include humanitarian
relief in response to local disasters or conservation of locally threatened and globally valued biodiversity.

1152
Chapter 21 Regional Context
21
of the simulations (i.e., they are commonly aggregated to political or
topographic units of interest to the target audience, e.g., watershed,
municipality, national, or even global). Aggregation of data to coarse-
scale units is also essential for allowing comparison of outputs from
models operating at different resolutions, but it also means that
sometimes quite useful detail may be overlooked when model outputs
are presented at the scale of the coarsest common denominator.
Conversely, if outputs from impact models are required as inputs to other
models, the outputs may need to be harmonized to a finer grid than the
original data. In such cases, downscaling methods are commonly applied.
This was the case, for example, when providing spatially explicit
projections of future land use from different IAMs (Hurtt et al., 2011)
for climate modelers to apply in the CMIP5 process (Collins et al.,
2014a). It is also a common procedure used in matching climate model
outputs to impact models designed to be applied locally (e.g., over a
river basin or an urban area; see Section 21.3.3.2).
Even if the same metrics are being used to compare aggregate model
results (e.g., developed versus developing country income under a given
future scenario) estimates may have been obtained using completely
different types of models operating at different resolutions. Moreover,
many models that have a large-scale coverage (e.g., continental or
global) may nonetheless simulate processes at a relatively fine spatial
resolution, offering a potentially useful source of spatially explicit
information that is unfamiliar to analysts working in specific regions,
who may defer to models more commonly applied at the regional scale.
Examples include comparison of hydrological models with a global and
regional scope (Todd et al., 2011) and bioclimatic models of vascular
plant distributions with a European and local scope (Trivedi et al., 2008).
Vulnerability mapping exercises can also be undermined by inappropriate
merging of indicator data sets that resolve information to a different
level of precision (e.g., Tzanopoulos et al., 2013). There is scope for
considerably enhanced cross-scale model intercomparison work in the
future, and projects such as the Agricultural Model Intercomparison and
Improvement Project (AgMIP; Rosenzweig et al., 2013) and Inter-
Sectoral Impact Model Intercomparison Project (ISI-MIP; Schiermeier,
2012; see also Section 21.5) have provision for just such exercises.
21.3.2. Adaptation
This section draws on material from the regional chapters (22 to 30) as
well as the examples described in Table 21-4. Material from Chapters
14 to 17 is also considered. See also Table 16-4 for a synthesis from the
perspective of adaptation constraints and limits.
Box 21-2 | Summary Regional Climate Projection Information
Summary figures on observed and projected changes in temperature and precipitation are presented in the following regional
chapters. These provide some context to the risks associated with climate change vulnerability and impacts and the decision making
on adaptations being planned and implemented in response to these risks. Figure 21-2 provides an example for Africa. The information
is identical to that displayed in Box CC-RC.
These figures provide a very broad overview of the projected regional climate changes, but in dealing with only annual averages they
are not able to convey any information about projected changes on seasonal time scales or shorter, such as for extremes. In addition,
they are derived solely from the Coupled Model Intercomparison Project Phase 5 (CMIP5) General Circulation Models (GCMs) and do
not display any information derived from CMIP3 data, which are widely used in many of the studies assessed within the WGII AR5. To
provide additional context, two additional sets of figures are presented here and in Box 21-4 that display temperature and precipitation
changes at the seasonal and daily time scales respectively.
Figure 21-3 displays projected seasonal and annual changes averaged over the regions defined in the IPCC Special Report on Managing
the Risks of Extreme Events and Disasters to Advance Climate Change Adaptation (IPCC, 2012), for Central and South America for the
four RCP scenarios and three of the SRES scenarios. The temperature and precipitation changes for the period 2071–2100 compared to
a baseline of 1961–1990 are plotted for the four standard 3-month seasons with the changes from each CMIP3 or CMIP5 represented by
a symbol. Symbols showing the CMIP3 model projections are all gray but differ in shape depending on the driving SRES concentrations
scenario and those showing the CMIP5 projections differ in color depending on the driving RCP emissions/concentrations scenario
(see figure legend for details and Box 21-1 for more information on the SRES and RCP scenarios). The 30-year periods were chosen
for consistency with the figures displayed in Box 21-4 (Figures 21-7 and 21-8) showing changes in daily temperatures and precipitation.
Figures presenting similar information for the SREX regions contained in the other inhabited continents are presented in Figures
SM21-1 to SM21-7.
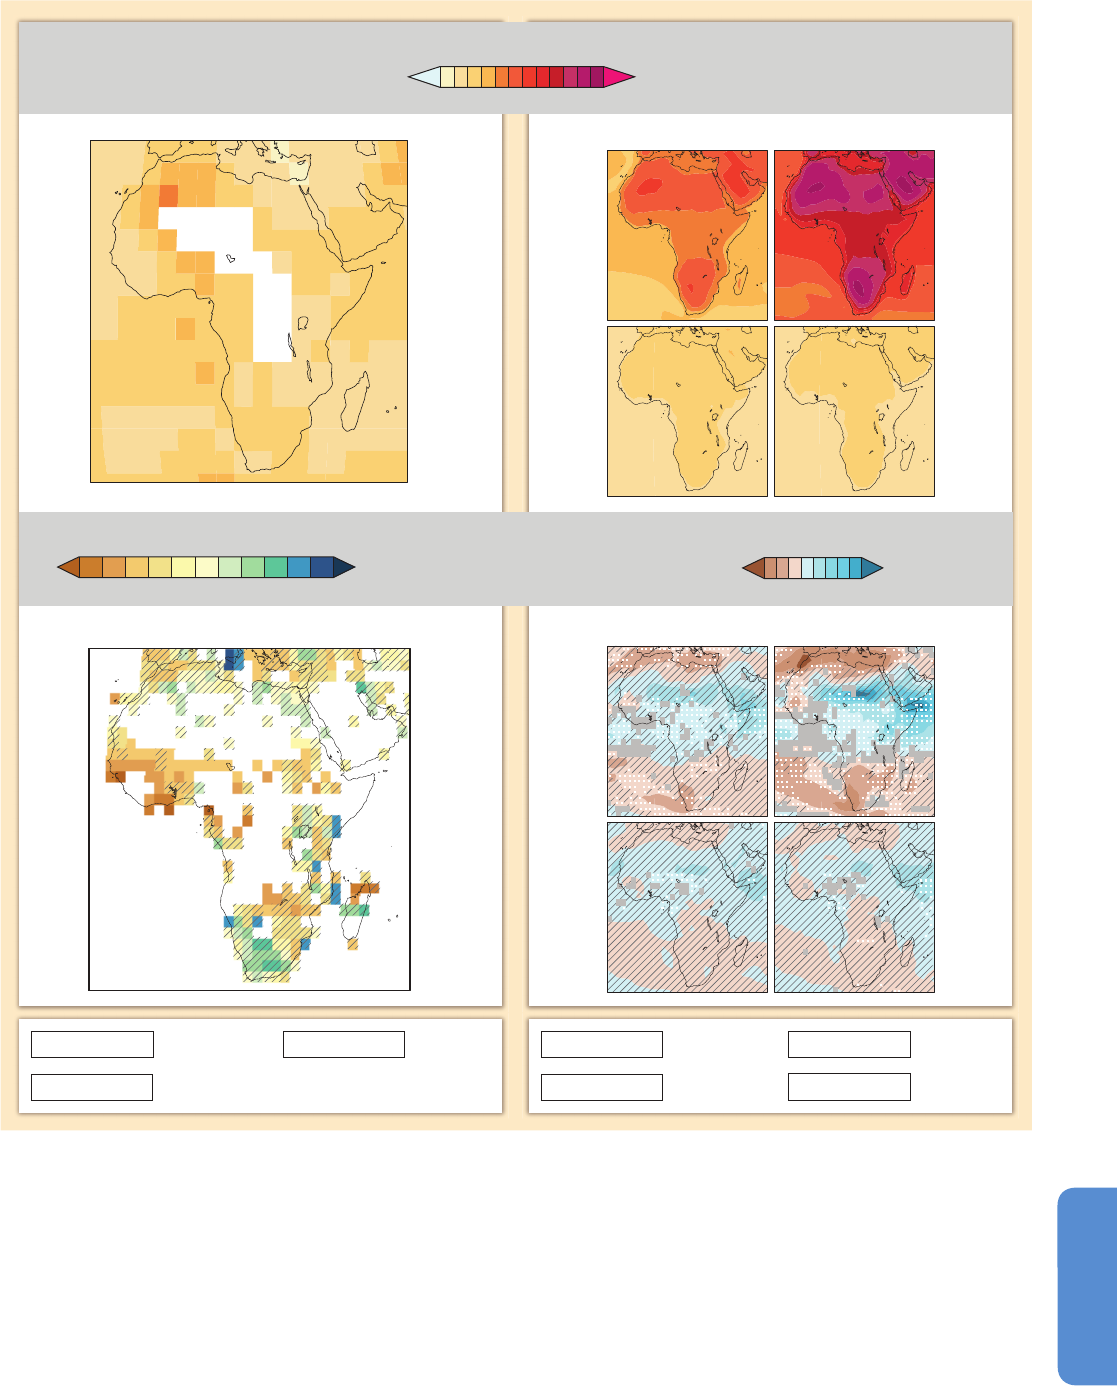
1153
Regional Context Chapter 21
21
Annual Precipitation
Change
Difference from 1986–2005 mean
(˚C)
Diagonal Lines
Trend not
statistically
significant
White
Insufficient
data
Solid Color
Strong
agreement
Very strong
agreement
Little or
no change
Gray
Divergent
changes
Solid Color
Significant
trend
Diagonal Lines
White Dots
Annual Temperature Change
late 21st century
mid 21st century
RCP8.5RCP2.6
Trend over 1901–2012
(˚C over period)
Difference from 1986–2005 mean (%)
0
246
(mm/year per decade)
Trend in annual precipitation over 1951–2010
–20 0 20 40
–5 0525102.5–2.5 50–10–50 –25–100
late 21st century
mid 21st century
RCP8.5RCP2.6
Figure 21-2 | Observed and projected changes in annual average temperature and precipitation. (Top panel, left) Map of observed annual average temperature change from
1901–2012, derived from a linear trend. [WGI AR5 Figures SPM.1 and 2.21] (Bottom panel, left) Map of observed annual precipitation change from 1951–2010, derived from a
linear trend. [WGI AR5 Figures SPM.2 and 2.29] For observed temperature and precipitation, trends have been calculated where sufficient data permit a robust estimate (i.e., only
for grid boxes with greater than 70% complete records and more than 20% data availability in the first and last 10% of the time period). Other areas are white. Solid colors
indicate areas where trends are significant at the 10% level. Diagonal lines indicate areas where trends are not significant. (Top and bottom panel, right) CMIP5 multi-model mean
projections of annual average temperature changes and average percent changes in annual mean precipitation for 2046–2065 and 2081–2100 under RCP2.6 and 8.5, relative to
1986–2005. Solid colors indicate areas with very strong agreement, where the multi-model mean change is greater than twice the baseline variability (natural internal variability in
20-yr means) and ≥90% of models agree on sign of change. Colors with white dots indicate areas with strong agreement, where ≥66% of models show change greater than the
baseline variability and ≥66% of models agree on sign of change. Gray indicates areas with divergent changes, where ≥66% of models show change greater than the baseline
variability, but <66% agree on sign of change. Colors with diagonal lines indicate areas with little or no change, where <66% of models show change greater than the baseline
variability, although there may be significant change at shorter timescales such as seasons, months, or days. Analysis uses model data and methods building from WGI AR5 Figure
SPM.8. See also Annex I of WGI AR5. [Boxes 21-2 and CC-RC]
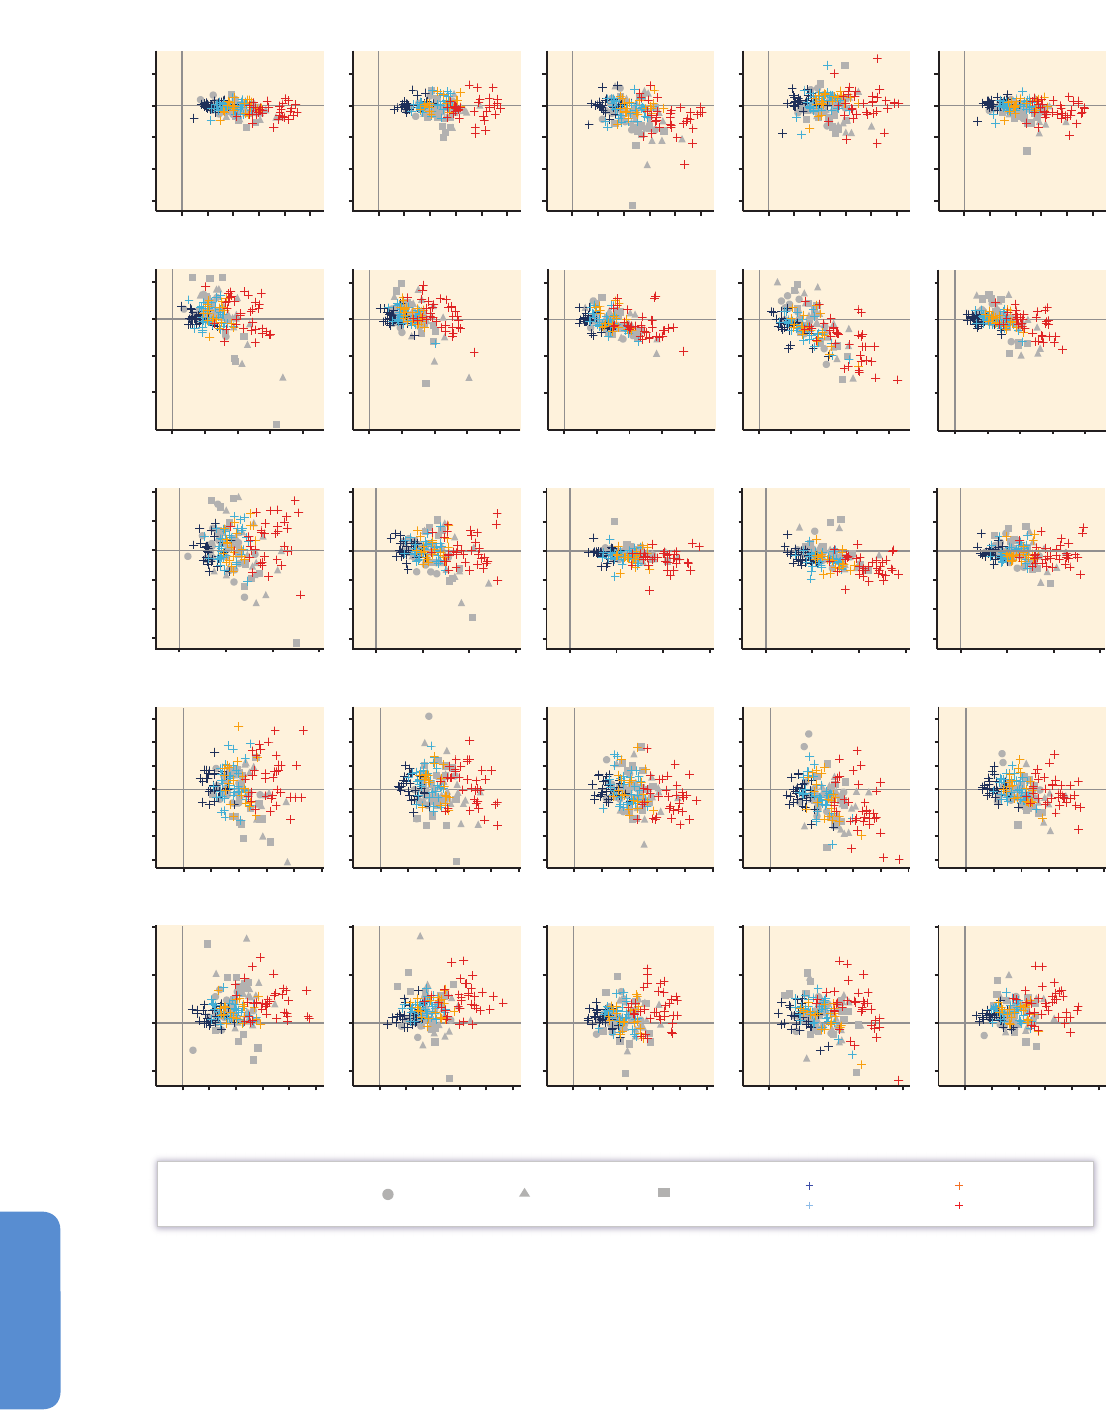
1154
Chapter 21 Regional Context
21
Change in mean rainfall by 2080s (mm/day)
Change in mean surface
temperature by 2080 (
°
C)
CMIP3 SRESB1 CMIP3 SRESA1B
CMIP3 SRESA2
CMIP5 RCP2.6
CMIP5 RCP4.5
CMIP5 RCP6.0
CMIP5 RCP8.5
Change in mean surface temperature by 2080s (
°
C)
CAM DJF CAM MAM CAM JJA CAM SON CAM ANN
NEB DJF NEB MAM NEB JJA NEB SON NEB ANN
WSA DJF WSA MAM WSA JJA WSA SON WSA ANN
AMZ DJF AMZ MAM AMZ JJA AMZ SON AMZ ANN
SSA DJF SSA MAM SSA JJA SSA SON SSA ANN
1
0
–1
–2
–
3
–1 012345 –1 012 345 –1 012 345 –1 012 345–1 012345
1
0
–1
–
2
–
3
0468204682 0468204682 04682
1
0
–1
–2
–3
0462
0.6
0.4
0.2
–0.4
–0.6
02341
1.0
0.5
0
–0.5
02341
2
0
–0.2
5–1
5
0462
02341
02341
5–1
5
0462
02341
02341
5–1
5
0462
02341
02341
5–1
5
0462
02341
02341
5–1
5–1 –1 –1 –1 –1
Figure 21-3 | Regional average change in seasonal and annual mean temperature and precipitation over five sub-regions covering South and Central America for the period
2071–2100 relative to 1961–1990 in General Circulation Model (GCM) projections from 35 Coupled Model Intercomparison Project Phase 5 (CMIP5) ensemble under four
Representative Concentration Pathway (RCP) scenarios (van Vuuren et al., 2011) compared with GCM projections from 22 CMIP3 ensemble under three Special Report on
Emission Scenarios (SRES) scenarios (IPCC, 2000a); see Table 21-1 for details of the relationship between the SRES and RCP scenarios. Regional averages are based on SREX
region definitions (IPCC, 2012; see also Figure 21-4). Temperature changes are given in °C and precipitation changes in mm day
–1
with axes scaled relative to the maximum
changes projected across the range of models. The models that generated the data displayed are listed in Table SM21-3.

1155
Regional Context Chapter 21
21
21.3.2.1. Similarities and Differences in Regions
As described in the regional chapters, a large portion of adaptation
knowledge is based on conclusions drawn from case studies in specific
locations, with the conceptual findings typically being applied globally
(Chapters 14 to 17). It is this empirical knowledge on adaptation that
guides understandings in the different regions. This is especially the case
for developing regions. Thus, regional approaches to adaptation vary in
their degree of generality. One of the most striking differences between
regions in terms of adaptation is the extent to which it has been studied
and implemented. Australia and Europe have invested heavily in research
on adaptation since the AR4, and the result is a rich body of literature
published by local scientists. The ability to advance in adaptation
knowledge may be related to the amount and quality of reliable climate
information, the lack of which has been identified as a constraint to
developing adaptation measures in Africa (Section 22.4.2). Many case
studies, especially of community-based adaptation, stem from Asia,
Africa, Central and South America, and small islands but the majority
of this work has been undertaken and authored by international non-
governmental organizations, as well as by other non-local researchers.
In Africa, most planned adaptation work is considered to be pilot and
seen as part of learning about adaptation, although there has been
significant progress since the AR4 (Section 22.4.4.2).
Most regional chapters report lags in policy work on adaptation (see
also Section 16.5.2). While most European countries have adaptation
strategies, few have been implemented (Section 23.1.2). Lack of
implementation of plans is also the case for Africa (Section 22.4). In North
(Section 26.8.4.1.2) and Central and South America (Section 27.5.3.2),
adaptation plans are in place for some cities. In Australasia, there are few
adaptation plans (Section 25.4.2). In the Arctic, they are in their infancy
(Section 28.4). At the same time, civil society and local communities
have the opportunity to play a role in decision making about adaptation
in Europe and Asia (Sections 23.7.2, 24.4.6.5). In Africa, social learning
and collective action are used to promote adaptation (Section 22.4.5.3).
Adaptation is observed as mostly autonomous (spontaneous) in
Africa, although socio-ecological changes are creating constraints for
autonomous adaptation (Section 22.4.5.4). There is a disconnect in most
parts of Africa between policy and planning levels, and the majority of
work is still autonomous and unsupported (Section 22.4.1). In the
case of UNFCCC-supported activities, such as National Adaptation
Programmes of Action, few projects from the African (Section 22.4.4.2)
least developed countries have been funded, thus limiting the effectiveness
of these investments. Several chapters (Africa, Europe, North America,
Central and South America, and Small Islands) explicitly point out that
climate change is only one of multiple factors that affect societies and
ecosystems and drives vulnerability or challenges adaptation (Sections
22.4.2, 23.10.1, 26.8.3.1, 27.3.1.2, 29.6.3). For example, North America
reports that for water resources, most adaptation actions are “no-
regrets,” meaning that they have benefits beyond just adaptation to
climate change (Section 26.3.4). In Australasia, the limited role of
socioeconomic information in vulnerability assessments restricts
confidence regarding the conclusions about future vulnerability and
adaptive capacity (Section 25.3.2).
Some chapters (Polar Regions, North America, Australasia) emphasize
the challenges faced by indigenous peoples and communities in dealing
w
ith climate change (Sections 25.8.2, 26.8.2.2, 28.4.1). Although they
are described as having some degree of adaptive capacity to deal with
climate variability, shifts in lifestyles combined with a loss of traditional
knowledge leave many groups more vulnerable to climate change
(Section 28.2.4.2). Also, traditional responses have been found to be
maladaptive because they are unable to adjust to the rate of change,
or the broader context in which the change is taking place, as seen in
the Arctic (28.4.1). In response to changing environmental conditions,
people are taking on maladaptive behavior—for instance, by going
further to hunt because of changed fish stocks and thus exposing
themselves to greater risk, or changing to different species and depleting
stocks (Section 28.4.1). Limits to traditional approaches for responding
to changing conditions have also been observed in several Small Island
States (29.8).
Most populated regions have experience with adaptation strategies in
agriculture, where exposure to the impacts of climate variability over
centuries provides a starting point for making adjustments to new
changes in climate. Water and land use management strategies stand
out in the literature in common across all of the main continental
regions.
The link between adaptation and development is explicit in Africa,
where livelihood diversification has been key to reducing vulnerability
(Section 22.4.5.2). At the same time, there is evidence that many short-
term development initiatives have been responsible for increasing
vulnerability (Section 22.4.4.2). Other chapters mention constraints or
barriers to adaptation in their regions. For example, the low priority
accorded to adaptation in parts of Asia, compared to more pressing
issues of employment and education, is attributed in part to a lack of
awareness of the potential impacts of climate change and the need
to adapt, a feature common to many regions (Section 22.5.4). All
developing regions cite insufficient financial resources for implementing
adaptation as a significant limitation.
21.3.2.2. Adaptation Examples in Multiple Regions
Across regions, similar responses to climate variability and change can
be noted. Heat waves are an interesting example (Table 21-4), as early
warning systems are gaining use for helping people reduce exposure
to heat waves. At the global scale, the length and frequency of warm spells,
including heat waves, has increased since 1950 (medium confidence) and,
over most land areas on a regional scale, more frequent and/or longer
heat waves or warm spells are likely by 2016–2035 and very likely by
2081–2100 (IPCC, 2013a). Warning systems are now planned and
implemented in Europe, the USA, Canada, Asia, and Australia.
Use of mangroves to reduce flood risks and protect coastal areas from
storm surges is a measure promoted in Asia, Africa, the Pacific, and
South America (Table 21-4). Often, mangroves have been cut down to
provide coastal access, so there is a need to restore and rehabilitate
them. This is an example that is considered low-regrets because it brings
multiple benefits to communities besides protecting them from storm
surges, such as providing food security and enhancing ecosystem
services. Mangrove forests also store carbon, offering synergies with
mitigation.

1156
Chapter 21 Regional Context
21
In several African countries, as well as in India, index-based insurance
for agriculture has been used to address food insecurity and loss of
crops resulting from more hot and fewer cold nights, an increase in
heavy precipitation events, and longer warm spells (Table 21-4). A
predetermined weather threshold typically associated with high
loss triggers an insurance pay-out. The mechanism shares risk across
communities and can help encourage adaptive responses and foster risk
awareness and risk reduction. However, limited availability of accurate
weather data means that establishing which weather conditions causes
losses can be challenging. Furthermore, if there are losses but not
enough to trigger pay-out, farmers may lose trust in the mechanism.
21.3.2.3. Adaptation Examples in Single Regions
Although conditions are distinct in each region and location, practical
lessons can often be drawn from looking at examples of adaptation in
different locations. Experience with similar approaches in different
Frequently Asked Questions
FAQ 21.3 | What regional information should I take into account
for climate risk management for the 20-year time horizon?
The fundamental information required for climate risk management is to understand the climate events that put
t
he system being studied at risk and what is the likelihood of these arising. The starting point for assembling this
information is a good knowledge of the climate of the recent past including any trends in aspects of these events
(e.g., their frequency or intensity). It is also be important to consider that many aspects of the climate are changing,
t
o understand how the future projected changes may influence the characteristics of these events and that these
changes will, in general, be regionally variable. However, it should be noted that over the coming 20 years the
magnitude of projected changes may not be sufficient to have a large influence on the frequency and intensity of
t
hese events. Finally, it is also essential to understand which other factors influence the vulnerability of the system.
These may be important determinants in managing the risks; also, if they are changing at faster rates than the
climate, then changes in the latter become a secondary issue.
For managing climate risks over a 20-year time horizon it is essential to identify the climate variables to which the
system at risk is vulnerable. It could be a simple event such as extreme precipitation or a tropical cyclone or a more
complex sequence of a late onset of the monsoon coupled with prolonged dry spells within the rainy season.
The current vulnerability of the system can then be estimated from historical climate data on these variables, including
any information on trends in the variables. These historical data would give a good estimate of the vulnerability
assuming the record was long enough to provide a large sample of the relevant climate variables and that the reasons
for any trends, for example, clearly resulting from climate change, were understood. It should be noted that in
many regions sufficiently long historical records of the relevant climate variables are often not available.
It is also important to recognize that many aspects of the climate of the next 20 years will be different from the
past. Temperatures are continuing to rise with consequent increases in evaporation and atmospheric humidity and
reductions in snow amount and snow season length in many regions. Average precipitation is changing in many
regions, with both increases and decreases, and there is a general tendency for increases in extreme precipitation
observed over land areas. There is a general consensus among climate projections that further increases in heavy
precipitation will be seen as the climate continues to warm and more regions will see significant increases or decreases
in average precipitation. In all cases the models project a range of changes for all these variables that are generally
different for different regions.
Many of these changes may often be relatively small compared to their natural variations but it is the influence of
these changes on the specific climate variables that the system is at risk from that is important. Thus information
needs to be derived from the projected climate changes on how the characteristics of these variables, for example,
the likelihood of their occurrence or magnitude, will change over the coming 20 years. These projected future
characteristics in some cases may be indistinguishable from those historically observed but in other cases some or all
models will project significant changes. In the latter situation, the effect of the projected climate changes will then
result in a range of changes in either the frequency or magnitude of the climate event, or both. The climate risk
management strategy would then need to adapt to accounting for either a greater range or changed magnitude
of risk. This implies that in these cases a careful analysis of the implications of projected changes for the specific
temporal and spatial characteristic of the climate variables relevant to the system at risk is required.

1157
Regional Context Chapter 21
21
regions offers additional lessons that can be useful when deciding
whether an approach is appropriate.
Community-based adaptation is happening and being planned in many
developing regions, especially in locations that are particularly poor. In
small islands, where a significant increase in the occurrence of future
sea level extremes by 2050 and 2100 is anticipated, traditional
technologies and skills may still be relevant for adapting (Table 21-4).
In the Solomon Islands, relevant traditional practices include elevating
concrete floors to keep them dry during heavy precipitation events and
building low aerodynamic houses with palm leaves as roofing to avoid
hazards from flying debris during cyclones, supported by perceptions
that traditional construction methods are more resilient to extreme
weather. In Fiji, after Cyclone Ami in 2003, mutual support and risk
sharing formed a central pillar for community-based adaptation, with
unaffected households fishing to support those with damaged homes.
Participatory consultations across stakeholders and sectors within
communities and capacity building taking into account traditional
practices can be vital to the success of adaptation initiatives in island
communities, such as in Fiji or Samoa. These actions provide more than
just the immediate benefits; they empower people to feel in control of
their situations.
In Europe, several governments have made ambitious efforts to address
risks of inland and coastal flooding due to higher precipitation and sea
level rise during the coming century (Table 21-4). Efforts include a
multitude of options. One of the key ingredients is strong political
leadership or government champions. In The Netherlands, government
recommendations include “soft” measures preserving land from
development to accommodate increased river inundation; raising the
level of lakes to ensure continuous freshwater supply; restoring natural
estuary and tidal regimes; maintaining coastal protection through beach
nourishment; and ensuring necessary political-administrative, legal, and
financial resources. The British government has also developed extensive
adaptation plans to adjust and improve flood defenses and restrict
development in flood risk areas to protect London from future storm
surges and river flooding. They undertook a multi-stage process, engaging
stakeholders and using multi-criteria analysis. Pathways have been
analyzed for different adaptation options and decisions, depending on
eventual sea level rise, with ongoing monitoring of the drivers of risk
informing decisions.
In Australia, farmers and industries are responding to experienced and
expected changes in temperature, rainfall, and water availability by
relocating parts of their operations, such as for rice, wine, or peanuts,
or changing land use completely (Table 21-4). In South Australia, for
instance, there has been some switching from grazing to cropping. The
response is transformational adaptation, and can have positive or
negative implications for communities in both origin and destination
regions. This type of adaptation requires a greater level of commitment,
access to more resources and greater integration across decision-making
levels because it spans regions, livelihoods, and economic sectors.
Box 21-3 | Developing Regional Climate Information Relevant to Political and Economic Regions
In many world regions, countries form political and/or economic groupings that coordinate activities to further the interests of the
constituent nations and their peoples. For example, the Intergovernmental Authority on Development (IGAD) of the countries of the
Greater Horn of Africa recognizes that the region is prone to extreme climate events such as droughts and floods that have severe
negative impacts on key socioeconomic sectors in all its countries. In response it has set up the IGAD Climate Prediction and Applications
Centre (ICPAC). ICPAC provides and supports application of early warning and related climate information for the management of
climate-related risks (for more details see http://www.icpac.net/). In addition it coordinates the development and dissemination of
seasonal climate forecasts for the IGAD countries as part of a World Meteorological Organization (WMO)-sponsored Regional Climate
Outlook Forum process (Ogallo et al., 2008) which perform the same function in many regions. A more recent WMO initiative, the
Global Framework for Climate Services (Hewitt et al., 2012), aims to build on these and other global, regional, and national activities
and institutions to develop climate information services for all nations.
As socioeconomic factors are important contributors to both the vulnerability and adaptability of human and natural systems, it clearly
makes sense to summarize and assess available climate and climate change information for these regions, as this will be relevant to
policy decisions taken within these groupings on their responses to climate change. For example, Figure 22-2 illustrates the presentation
of observed and projected climate changes of two summary statistics for five political/economic regions covering much of Africa. It
conveys several important pieces of information: the models are able to reproduce the observed trends in temperature; they simulate
significantly lower temperatures without the anthropogenic forcings and significantly higher future temperatures under typical emissions
paths; and for most regions the models project that future variations in the annual average will be similar to those simulated for the
past. However, for a more comprehensive understanding additional information needs to be included on other important aspects of
climate, for example, extremes (see Box 21-4).

1158
Chapter 21 Regional Context
21
21.3.3. Climate System
This section places the regional chapters in a broader context of regional
climate information, particularly regarding cross-regional aspects, but
does not provide a detailed region-by-region assessment. Boxes 21-2
and 21-4 introduce examples of regional information for continental/
sub-continental regions but other regional definitions are often relevant
(see Box 21-3). The focus in this section is on the summary of new
and emerging knowledge since the AR4 relevant to IAV research, with
emphasis on material deriving from dynamical and statistical downscaling
work which is often of greater relevance for IAV applications than the
coarser resolution global climate model data. In a regional context, WGI
AR5 Chapter 14 is particularly relevant for the projections and evaluation
of confidence in models’ ability to simulate temperature, precipitation,
and phenomena, together with an assessed implication for the general
level of confidence in projections for 2080–2099 of regional temperature
and precipitation (see WGI AR5 Table 14.2).
21.3.3.1. Global Context
21.3.3.1.1. Observed changes
Temperature and precipitation
New estimates of global surface air temperatures give a warming of
about 0.89ºC (0.69ºC–1.08ºC) for the period of 1901–2012 and about
0.72ºC (0.49ºC–0.79ºC) for the period 1951–2012 (WGI AR5 Section
2.4.3). Positive annual temperature trends are found over most land
areas, particularly since 1981. Over the period 1981–2012, relatively
large trends have occurred over areas of Europe, the Sahara and Middle
East, central and northern Asia, and northeastern North America (WGI
AR5 Section 2.4.3).
For precipitation, the Northern Hemisphere mid- to high latitudes show a
likely increasing trend (medium confidence prior to 1950, high confidence
afterwards; WGI AR5 Section 2.5.1). Observed precipitation trends show
a high degree of spatial and temporal variability, with both positive and
negative values (WGI AR5 Section 2.5). The human influence on warming
since the middle of the 20th century is likely over every continental
region, except Antarctica (WGI AR5 Section 10.3.1), while the attribution
of changes in hydrological variables is less confident (WGI AR5 Section
10.3.2).
Cryosphere
New data have become available since the AR4 to evaluate changes in
the cryosphere (WGI AR5 Section 4.1) showing that the retreat of annual
Arctic sea ice extent has continued, at a very likely rate of 3.5 to 4.1%
per decade during the period 1979–2012. The perennial sea ice extent
(sea ice area at summer minimum) decreased at a rate of 11.5 ± 2.1%
per decade (very likely) over the same period 1979–2012 (WGI AR5
Section 4.2.2). The thickness, concentration, and volume of Arctic ice have
also decreased. Conversely, the total annual extent of Antarctic ice has
increased slightly (very likely 1.2 to 1.8% per decade between 1979 and
2011), with strong regional differences (WGI AR5 Section 4.2.3).
A
lmost all glaciers worldwide have continued to shrink since the AR4,
with varying rates across regions (WGI AR5 Sections 4.3.1, 4.3.3). In
particular, during the last decade most ice loss has been observed from
glaciers in Alaska, the Canadian Arctic, the Southern Andes, the Asian
mountains, and the periphery of the Greenland ice sheet. Several
hundred glaciers globally have completely disappeared in the last 30
years (WGI AR5 Section 4.3.3).
Because of better techniques and more data, confidence has increased
in the measurements of Greenland and Antarctica ice sheets. These
indicate that parts of the Antarctic and Greenland ice sheets have been
losing mass over the last 2 decades (high confidence), mostly due to
changes in ice flow in Antarctica, and a mix of changes in ice flow and
increases in snow/ice melt in Greenland. Ice shelves in the Antarctic
Peninsula are continuing a long-term trend of thinning and partial
collapse started some decades ago (WGI AR5 Sections 4.4.2-3, 4.4.5).
21.3.3.1.2. Near-term and long-term climate projections
The uncertainty in near-term CMIP5 projections is dominated by internal
variability of the climate system (see ‘Climate Variability’ in Glossary),
initial ocean conditions, and inter-model response, particularly at smaller
spatial and temporal scales (Hawkins and Sutton, 2009, 2011). In the
medium and long term, emission profiles may affect the climate response.
Global warming of 0.3ºC to 0.7ºC is likely for the period of 2016–2035
compared to 1986–2005 based on the CMIP5 multi-model ensemble,
and spatial patterns of near-term warming are generally consistent with
the AR4 (WGI AR5 Section 11.3.6). For precipitation (2016–2035 vs.
1986–2005), zonal mean precipitation will very likely increase in high
and some of the mid-latitudes, and will more likely than not decrease
in the subtropics (WGI AR5 Section 11.3.2). Results from multi-decadal
near-term prediction experiments (up to 2035) with initialized ocean
state show that there is some evidence of predictability of yearly to
decadal temperature averages both globally and for some geographical
regions (WGI AR5 Section 11.2.3).
Moving to long-term projections (up to 2100), analyses of the CMIP5
ensemble have shown that, in general, the mean temperature and
precipitation regional change patterns are similar to those found for
CMIP3, with a pattern correlation between CMIP5 and CMIP3 ensemble
mean late 21st century change greater than 0.9 for temperature and
greater than 0.8 for precipitation (WGI AR5 Section 12.4). Given the
increased comprehensiveness and higher resolution of the CMIP5
models, this adds robustness to the projected regional change patterns.
Some of the main characteristics of the projected late 21st century
regional temperature and precipitation changes derived from the
CMIP5 ensemble can be broadly summarized as follows (from WGI AR5
Chapter 12 and the WGI AR5 Atlas) with further details provided in Box
21-2 and accompanying on-line supplementary material.
Temperature
Regions that exhibit relatively high projected temperature changes
(often greater than the global mean by 50% or more) are high-latitude
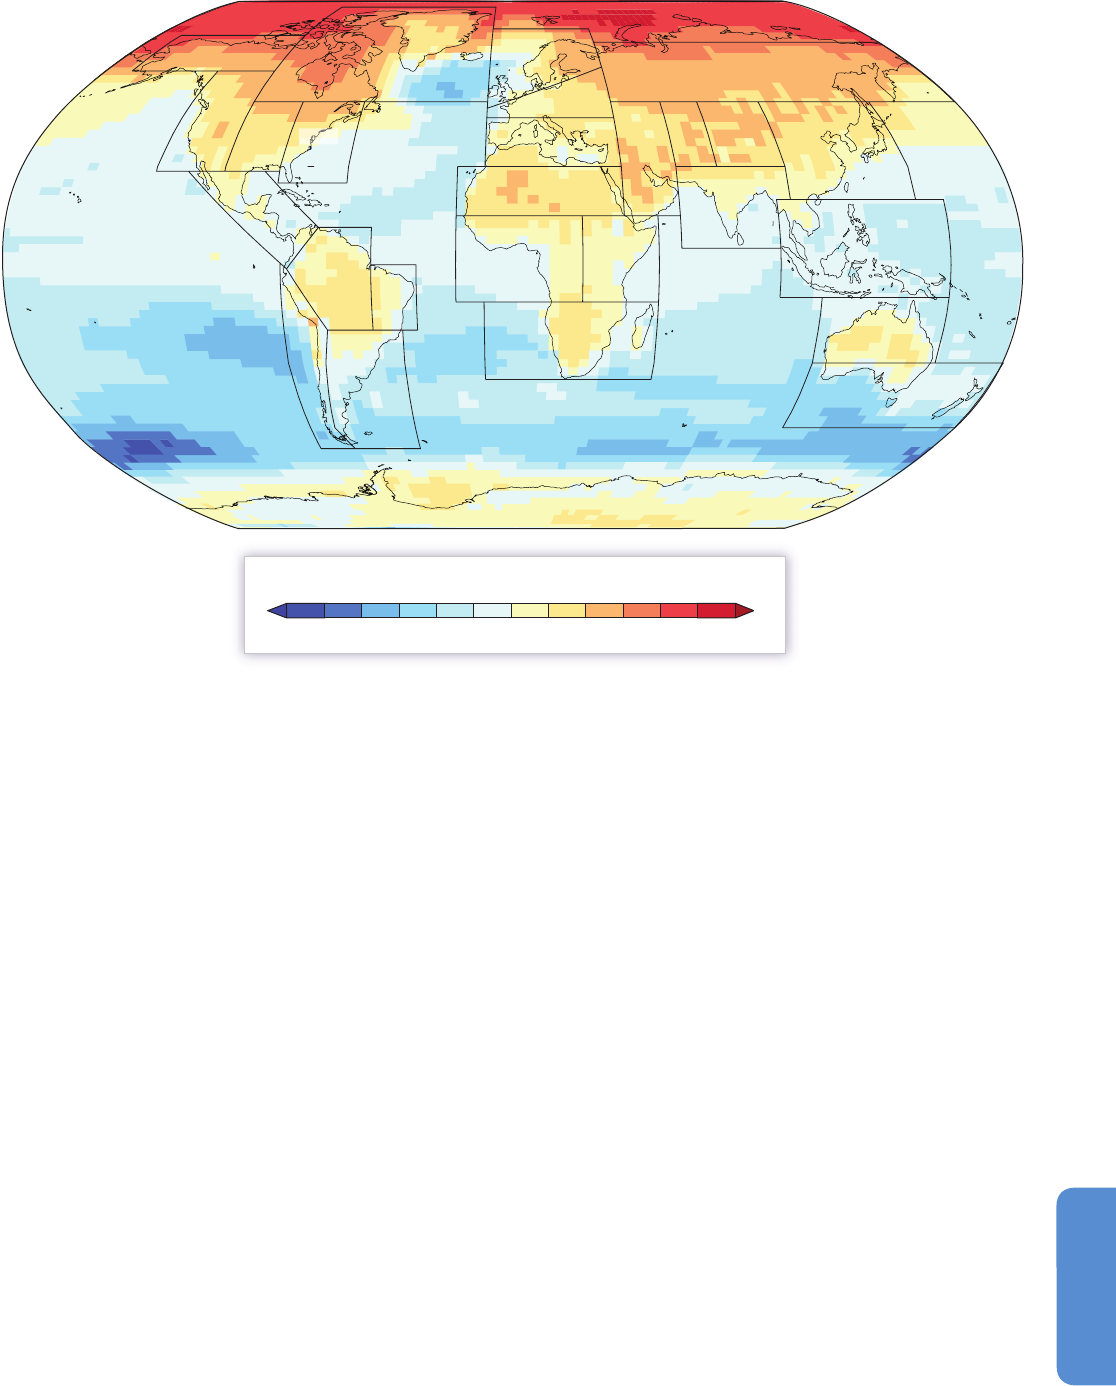
1159
Regional Context Chapter 21
21
Northern Hemisphere land areas and the Arctic, especially in December–
January–February, and Central North America, portions of the Amazon,
the Mediterranean, and Central Asia in June–July–August (Figure 21-4).
Precipitation
Changes in precipitation are regionally highly variable, with different
areas projected to experience positive or negative changes (Box 21-2).
By the end of the century in the RCP8.5 scenario, the high latitudes will
very likely experience greater amounts of precipitation, some mid-latitude
arid and semiarid regions will likely experience drying, while some moist
mid-latitude regions will likely experience increased precipitation (WGI
AR5 Section 12.4.5).
Studies have also attempted to obtain regional information based on
pattern scaling techniques in which regional temperature and precipitation
changes are derived as a function of global temperature change (e.g.,
Giorgi, 2008; Watterson, 2008, 2011; Watterson and Whetton, 2011;
Ishizaki et al., 2012). Figure 21-5 from Harris et al. (2013) provides an
example of Probability Density Functions (PDFs) of temperature and
precipitation change over sub-continental scale regions obtained using
a Bayesian method complemented by pattern scaling and performance-
based model weighting.
21.3.3.2. Dynamically and Statistically Downscaled
Climate Projections
Dynamical and statistical downscaling techniques have been increasingly
applied to produce regional climate change projections, often as part
of multi-model intercomparison projects (Görgen et al, 2010). A large
number of Regional Climate Model (RCM)-based climate projections
for the European region were produced as part of the European projects
PRUDENCE (Christensen et al., 2007; Deque et al., 2007) and ENSEMBLES
(Hewitt 2005; Deque and Somot, 2010). High-resolution projections
(grid interval of ~12 km) were also produced as part of Euro-Coordinated
Regional Downscaling Experiment (CORDEX; Jacob et al 2013). All
these studies provide a generally consistent picture of seasonally and
latitudinally varying patterns of change, which Giorgi and Coppola (2007)
summarized with the term “European Climate Change Oscillation (ECO).”
The ECO consists of a dipole pattern of precipitation change, with
decreased precipitation to the south (Mediterranean) and increased to
the north (Northern Europe) following a latitudinal/seasonal oscillation.
0.29 0.33 0.4 0.5 0.66 0.8 1 1.25 1.5 2 2.5 3 3.5
Median ratio of local to global temperature change
C
AM
AMZ
CNA
CGI
ENAWNA
ALA
WSA
SSA
N
EB
NEU
CEU
W
AF
SAH
SAF
CAS
MED
EAF
SAS
W
AS
NAU
SEA
TIB
EAS
NAS
SAU
Figure 21-4 | Coupled Model Intercomparison Project Phase 5 (CMIP5) ensemble median ratio of local to global average temperature change in the period 2071–2100 relative
to 1961–1990 under the Representative Concentration Pathway 8.5 (RCP8.5) emissions/concentrations scenario. The values are displayed on a common 2.5º × 3.75º grid onto
which each models’ data were re-gridded and they were calculated as follows: (1) for each model the local change was calculated between 1961 and 1990 at each grid cell, and
is divided by the global average change in that model projection over the same period; (2) the median ratio value across all models at each grid cell is identified and shown. Data
used are from the 35 CMIP5 models for which monthly projections were available under RCP8.5, as listed in Table SM21-3. Over-plotted polygons indicate the SREX regions
(IPCC, 2012) used to define the sub-regions used to summarize information in Chapters 21 and some of the subsequent regional chapters.
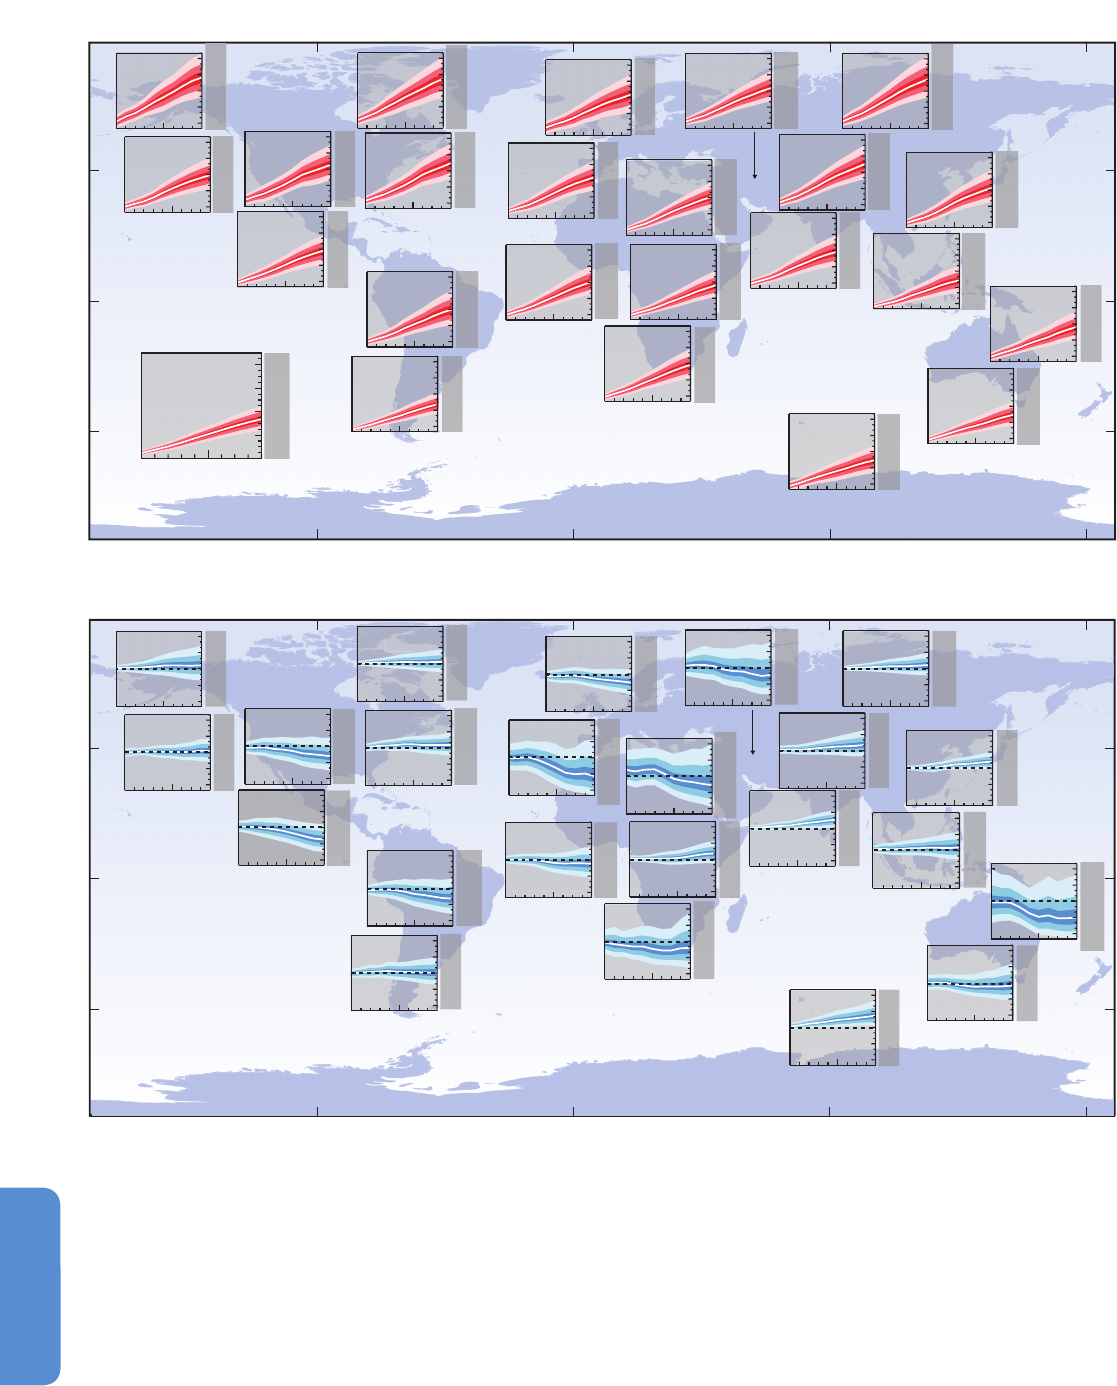
1160
Chapter 21 Regional Context
21
As a result, the Mediterranean region is projected to be much drier and
hotter than today in the warm seasons (Giorgi and Lionello, 2008), and
central/northern Europe much warmer and wetter in the cold seasons
(Kjellstrom and Ruosteenoja, 2007). An increase of interannual variability
of precipitation and summer temperature is also projected throughout
Europe, with a decrease in winter temperature variability over Northern
Europe (Schar et al., 2004; Giorgi and Coppola, 2007; Lenderink et al.,
2007). This leads to broader seasonal anomaly distributions and a higher
frequency and intensity of extreme hot and dry summers (e.g., Schar et
al., 2004; Seneviratne et al., 2006; Beniston et al., 2007; Coppola and
(a) Giorgi-Francisco regions, temperature change (°C), annual, A1B scenario
(b) Giorgi-Francisco regions, precipitation change (%), JJA, A1B scenario
2000 2050 2090
0
2
4
6
8
2.8
4
.5
6.5
2
.7
4.4
6.4
3
.8
6.1
9
.0
2.4
3.4
4.5
Central North
America
Central
America
Eastern North
America
Greenland
Northern
Europe
Mediterranean
Basin
Central Asia
Sahara
Tibet
W
estern Africa
Eastern Africa
Southern
Africa
South Asia
East Asia
Southeast Asia
North
Australia
South
Australia
North Asia
Amazon Basin
Southern
South America
Antarctica
Western North
America
Alaska
Global
∆T
1.5m
(°C)
2000 2050 2090
0
2
4
6
8
∆T
1.5m
(°C)
1.9
3
.5
5.2
2.6
4.1
6.0
2.2
3.4
5.0
2.6
4.4
6.7
2.3
3.4
4.8
2
.7
4.4
6.2
3.1
5.0
7.3
3.5
5.3
7.7
3.6
5.9
8.5
3.2
4.8
6.7
2.8
4.8
7.2
3.0
4.5
6.4
2.7
4.1
5.8
2.8
4.4
6.3
3.3
4.7
6.4
2.1
3.5
5.3
3.1
4.8
7.0
3.2
4.8
6.8
3.6
5.4
7.6
3.8
5.9
8.7
–67
–29
48
–30
–3
37
–47
–18
18
–22
0
28
–45
–22
5
–17
2
24
–45
–18
15
–14
5
28
–21
6
43
–14
4
27
–71
–34
32
–35
–14
1
0
–34
–7
22
–7
11
35
–11
54
–57
–16
59
–16
5
33
–1
11
29
2
16
33
–47
–12
4
8
–9
11
39
–12
7
3
0
Alaska
Western North
America
–49
Central North
America
Central
America
Eastern North
America
Greenland
Amazon Basin
Western Africa
Southern
South America
Southern
Africa
Mediterranean
Basin
Sahara
Northern
Europe
Tibet
South Asia
Southeast Asia
East Asia
North
Australia
South
Australia
North Asia
Eastern Africa
2000 2050 2090
–60
–
–
30
0
30
60
4
23
51
Antarctic
Central Asia
∆Precipitation (%)
Figure 21-5 | Evolution of the 5%, 17%, 33%, 50%, 67%, 83% and 95% percentiles of the distribution functions for annual surface air temperature changes (panel a) and JJA
percentage precipitation changes (panel b) for the Giorgi-Francisco (2000) regions and the globe with the SRES A1B forcing scenario (IPCC, 2000) combining results from a
perturbed physics ensemble and the Coupled Model Intercomparison Project Phase 3 (CMIP3) ensemble. Twenty year means relative to the 1961–1990 baseline are plotted in
decadal steps using a common y-axis scale. The 5%, 50%, and 95% percentile values for the period 2080–2099 are displayed for each region (From Harris et al. 2012).
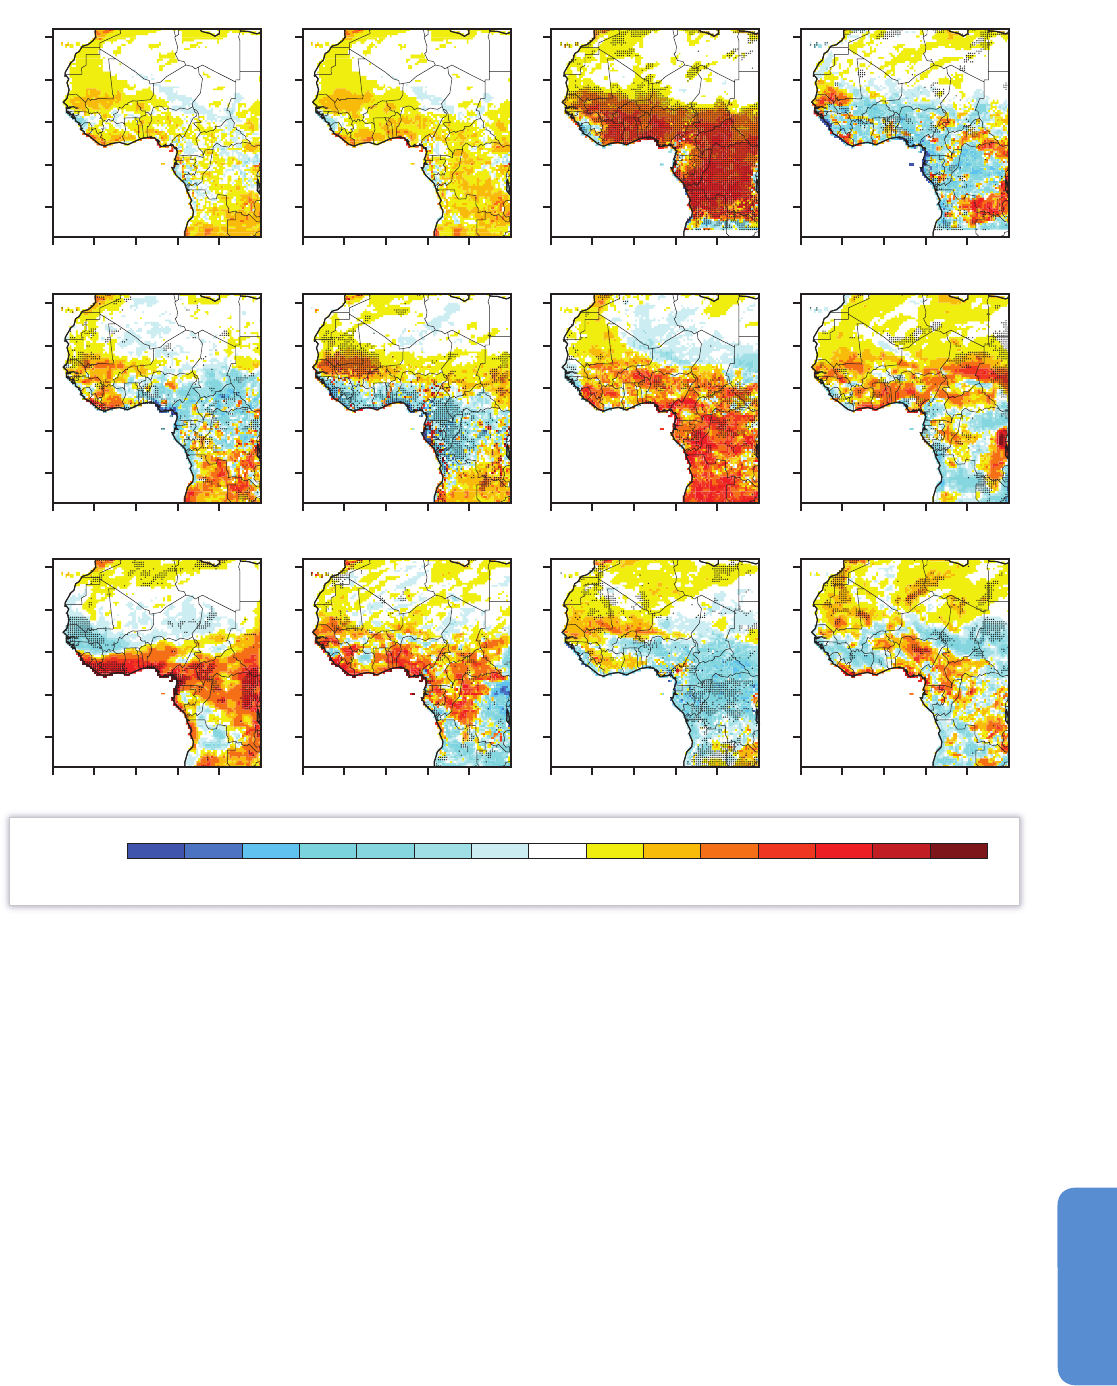
1161
Regional Context Chapter 21
21
Giorgi, 2010), for which a substantial contribution is given by land-
atmosphere feedbacks (Seneviratne et al., 2006; Fischer et al., 2007;
Seneviratne et al., 2010; Hirschi et al., 2011; Jaeger and Seneviratne,
2011). The broad patterns of change in regional model simulations
generally follow those of the driving global models (Christensen and
Christensen, 2007; Deque et al., 2007; Zanis et al., 2009); however, fine
scale differences related to local topographical, land use, and coastline
features are produced (e.g., Gao et al., 2006; Coppola and Giorgi, 2010;
Tolika et al., 2012).
As part of the ENSEMBLES and AMMA projects, multiple RCMs were run
for the period 1990–2050 (A1B scenario) over domains encompassing
the West Africa region with lateral boundary conditions from different
GCMs. The RCM-simulated West Africa monsoon showed a wide range
of response in the projections, even when the models were driven by
the same GCMs (Paeth et al., 2011; see Figure 21-6). Although at least
some of the response patterns may be within the natural variability,
this result suggests that for Africa, and probably more generally the
tropical regions, local processes and how they are represented in models
play a key factor in determining the precipitation change signal, leading
to a relatively high uncertainty (Engelbrecht et al., 2009; Haensler et al.,
2011; Mariotti et al., 2011; Diallo et al., 2012). Statistical downscaling
techniques have also been applied to the Africa region (Hewitson and
Crane, 2006; Lumsden et al., 2009; Goergen et al., 2010; Benestad, 2011;
Paeth and Diederich, 2011). In this regard, methodological developments
since the AR4 have been limited (see, e.g., reviews in Brown et al., 2008;
3
0°
20°
1
0°
0
°
–
10°
30°
2
0°
1
0°
0°
–10°
3
0°
20°
10°
0°
–10°
–10°–20°0°10° 20° 30° –10°–20°0°10° 20° 30° –10°–20°0°10° 20° 30° –10°–20°0°10° 20° 30°
1000 700 500 300 200 100 50 0–10 –50 –100 –200 –300 –500 –700 –1000
mm per
50 years
EE
EEEE
HHH
H
Ensemble Ensemble + LCC REMO + LCC REMO
REGCM3 HIRHAM/DMI CCLM RACMO
RCA/SMIHI HIRHAM/METNO HadRM3P PROMES
Figure 21-6 | Linear changes (i.e., changes obtained by fitting the time series at each grid point with straight lines) of annual precipitation during the 2001–2050 period from
10 individual Regional Climate Model (RCM) experiments and the Multi-Model Ensemble (MME) mean under the A1B emission scenario. The top middle panels also account for
projected land cover changes. Note that the REMO trends in both panels arise from a three-member ensemble whereas all other RCMs are represented by one single simulation.
Trends statistically significant at the 95% level are marked by black dots (Paeth et al., 2011).

1162
Chapter 21 Regional Context
21
P
aeth et al., 2011) and activities have focused more on the applications
(e.g., Mukheibir, 2007; Gerbaux et al., 2009) for regional specific activities
in the context of IAV work.
Several RCM and time-slice high resolution GCM experiments have been
conducted or analyzed for the South America continent (Marengo et al.,
2009, 2010; Nunez et al., 2009; Cabre et al., 2010; Menendez et al., 2010;
Sorensson et al., 2010; Kitoh et al., 2011). Overall, these studies revealed
varied patterns of temperature and precipitation change, depending on
the global and regional models used; however, a consistent change found
in many of these studies was an increase in both precipitation intensity
and extremes, especially in areas where mean precipitation was projected
to also increase. The Central American region has emerged as a prominent
climate change hotspot since the AR4, especially in terms of a consistent
decrease of precipitation projected by most models, particularly in June
to July (Rauscher et al., 2008, 2011). Regional model studies focusing
specifically on Central America projections are, however, still too sparse
to provide robust conclusions (e.g., Campbell et al., 2011).
Since the AR4 there has been considerable attention to producing
higher resolution climate change projections over North America based
on RCMs and high-resolution global time slices (e.g., Salathe et al.,
2008, 2010; DominGuez et al., 2010; Subin et al., 2011), in particular
as part of the North American Regional Climate Change Assessment
Program (NARCCAP; Mearns et al., 2009, 2012, 2013). Results indicate
variations (and thus uncertainty) in future climate based on the different
RCMs, even when driven by the same GCM in certain subdomains
(De Elia and Cote, 2010; Bukovsky et al., 2013; Mearns et al., 2013).
However, in the NARCCAP suite of simulations there were also some
important commonalities in the climate changes produced by the RCMs.
For example, they produced larger and more consistent decreases in
precipitation throughout the Great Plains in summer than did the driving
GCMs or the full suite of CMIP3 GCM simulations as well as larger
increases in precipitation in the northern part of the domain in winter.
In the realm of statistical downscaling and spatial disaggregation,
considerable efforts have been devoted to applying different statistical
models for the entire USA and parts of Canada (e.g., Maurer et al., 2007;
Hayhoe et al., 2010; Schoof et al., 2010).
Numerous high-resolution RCM projections have been carried out over
the East Asia continent. While some of these find increases in monsoon
precipitation over South Asia in agreement with the driving GCMs
(Kumar et al., 2013), others also produce results that are not in line with
those from GCMs. For example, both Ashfaq et al. (2009) and Gao et al.
(2011) found in high-resolution RCM experiments (20- and 25-km grid
spacing, respectively) decreases in monsoon precipitation over areas of
India and China in which the driving GCMs projected an increase in
monsoon rain. Other high-resolution (20-km grid spacing) projections
include a series of double-nested RCM scenario runs for the Korean
peninsula (Im et al., 2007, 2008a,b, 2010, 2011; Im and Ahn, 2011),
indicating a complex fine-scale structure of the climate change signal
in response to local topographical forcing. Finally, very high resolution
simulations were also performed. Using a 5-km mesh non-hydrostatic
RCM nested within a 20-km mesh Atmosphere General Circulation
Model (AGCM), Kitoh et al. (2009) and Kanada et al. (2012) projected
a significant increase in intense daily precipitation around western
Japan during the late Baiu season.
F
inally, a range of RCM, variable resolution, and statistical downscaling
21st century projections have been conducted over the Australian
continent or some of its sub-regions (Nunez and Mc Gregor, 2007; Song
et al., 2008, Timbal et al., 2008; Watterson et al., 2008; Yin et al., 2010;
Bennett et al., 2012; Grose et al., 2012a,b), showing that a local fine-
scale modulation of the large-scale climate signal occurs in response
to topographical and coastal forcings.
21.3.3.3. Projected Changes in Hydroclimatic Regimes, Major
Modes of Variability, and Regional Circulations
By modifying the Earth’s energy and water budgets, climate change may
possibly lead to significant changes in hydroclimatic regimes and major
modes of climate variability (Trenberth et al., 2003). For example, Giorgi
et al. (2011) defined an index of hydroclimatic intensity (HY-INT)
incorporating a combined measure of precipitation intensity and mean
dry spell length. Based on an analysis of observations and global and
regional climate model simulations, they found that a ubiquitous global
and regional increase in HY-INT was a strong hydroclimatic signature
in model projections consistent with observations for the late decades
of the 20th century. This suggests that global warming may lead to a
hydroclimatic regime shift toward more intense and less frequent
precipitation events, which would increase the risk of both flood and
drought associated with global warming.
El Niño-Southern Oscillation (ENSO) is a regional mode of variability
that substantially affects human and natural systems (McPhaden et al.,
2006). Although model projections indicate that ENSO remains a major
mode of tropical variability in the future, there is little evidence to
indicate changes forced by GHG warming that are outside the natural
modulation of ENSO occurrences (WGI AR5 Sections 14.4, 14.8).
The North Atlantic Oscillation (NAO) is a major mode of variability for the
Northern Hemisphere mid-latitude climate. Model projections indicate
that the NAO phase is likely to become slightly more positive (WGI AR5
Chapter 14 ES) due to GHG forcing, but the NAO will be dominated by
its large natural fluctuations. Model projections indicate that the Southern
Annular Mode (SAM), a major mode of variability for the Southern
Hemisphere, is likely going to weaken as ozone concentrations recover
through the mid-21st century (WGI AR5 Sections 14.5, 14.8).
Regional circulations, such as the monsoon, are expected to change.
The global monsoon precipitation, aggregated over all monsoon systems,
is likely to strengthen in the 21st century with increases in its area and
intensity, while the monsoon circulation weakens. Different regional
monsoon systems, however, exhibit different responses to GHG forcing
in the 21st century (WGI AR5 Section 14.2.1).
21.3.3.4. Projected Changes in Extreme Climate Events
CMIP5 projections confirm results from the CMIP3; a decrease in the
frequency of cold days and nights, an increase in the frequency of warm
days and nights, an increase in the duration of heat waves, and an
increase in the frequency and intensity of high precipitation events, both
in the near term and far future (IPCC, 2012, Sections 3.3.2, 3.4.4; WGI
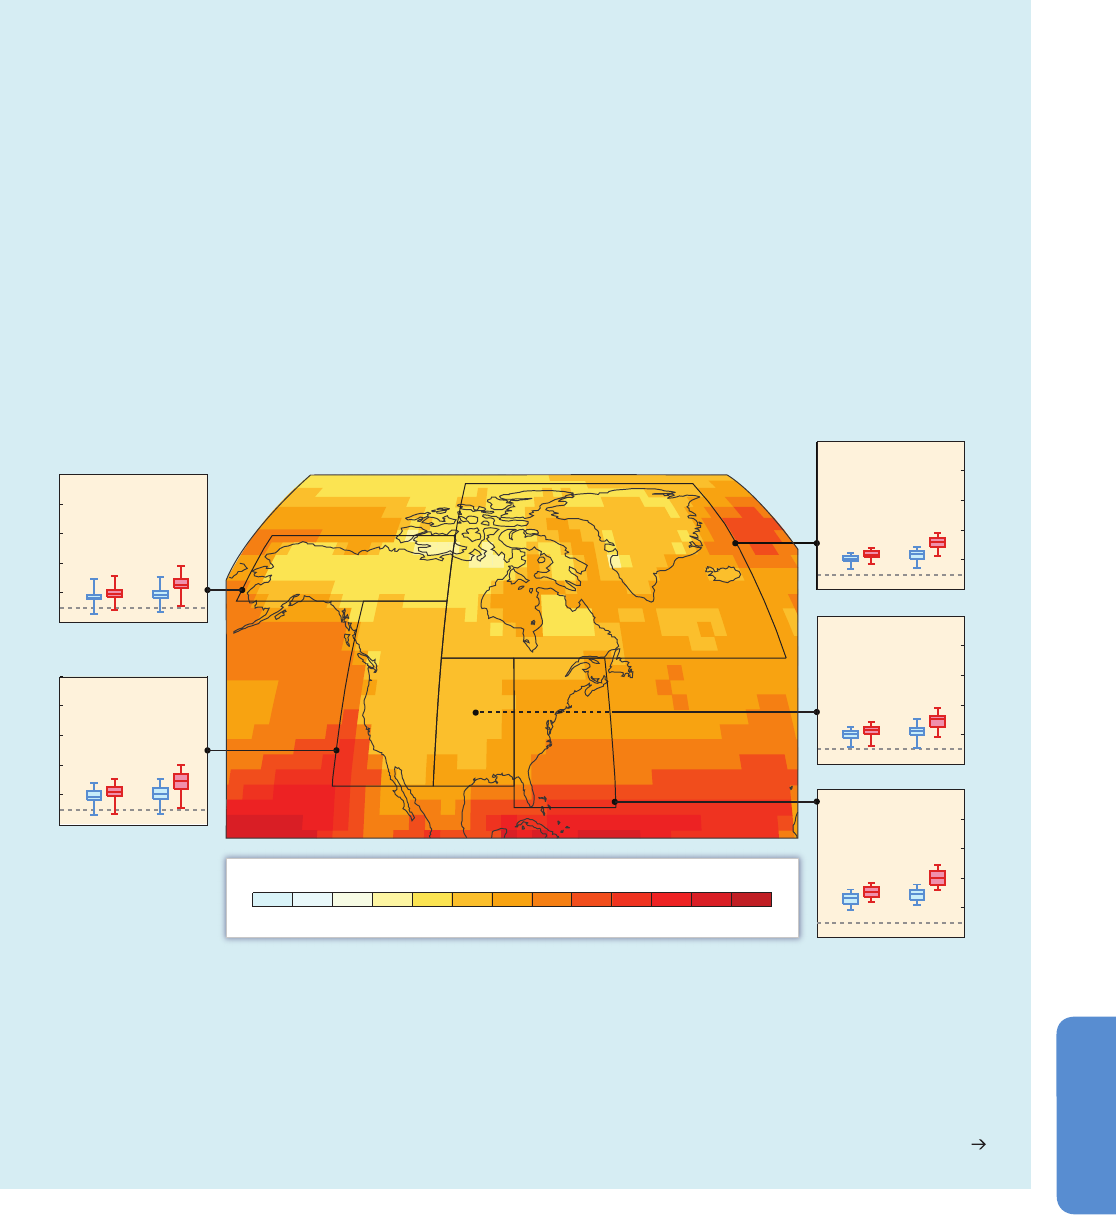
1163
Regional Context Chapter 21
21
A
R5 Section 12.4.5). Increases in intensity of precipitation (thus risk of
flood) and summer drought occurrence over some mid-continental land
areas is a robust signature of global warming, both in observations for
recent decades and in model projections (Trenberth, 2011; WGI AR5
Section 12.4.5). For tropical cyclones there is still little confidence in past
trends and near-term projections (Seneviratne et al., 2012). Globally,
t
ropical cyclone frequency is projected to either not change or decrease
and, overall, wind speed and precipitation is likely to increase though
basin scale specific conclusions are still unclear (Knutson et al., 2010).
A summary of observed and projections extremes, along with some
statistics on CMIP5 projections of changes in daily temperature and
precipitation extremes over the main continents and the SREX regions
Box 21-4 | Synthesis of Projected Changes in Extremes Related to Temperature and Precipitation
The IPCC Special Report on Managing the Risks of Extreme Events and Disasters to Advance Climate Change Adaptation (IPCC,
2012), or SREX for short, provides an in-depth assessment of observed and projected changes in climate extremes. Owing to the
relevance of this material for assessing risks associated with climate change vulnerability and impacts and responses to these risks,
summary information is presented here both drawing from and building on the material in the SREX report, including additional
analyses of Coupled Model Intercomparison Project Phase 5 (CMIP5) data (only CMIP3 data were used in SREX).
Summaries of SREX findings relevant to three continents—South America (including the Caribbean), Asia, and Africa (CDKN, 2012a,b,c;
available from http://cdkn.org/srex/)—have been developed using material from SREX Chapter 3. A synthesis of this material for all
SREX regions, along with additional material from WGI AR5, is presented in Table 21-7. This demonstrates that in many areas of the
world there is higher confidence in future changes in extreme events than there is in past trends, often owing to a lack of evidence
on observed changes.
Continued next page
100
80
60
40
20
0
100
80
60
40
20
0
North America
0 5 10 15 20 25 30 40 50 60 70 80 90 100
Percentage of days when temperature exceeds the 90th percentile in the baseline
100
80
60
40
20
0
2041–2070 2071–2100
100
80
60
40
20
0
2041–2070 2071–2100
100
80
60
40
20
0
RCP8.5
RCP4.5
Figure 21-7 | The frequency of “warm days” (defined here as the 90th percentile daily maximum temperature during a baseline period of 1961–1990) projected for
the 2071–2100 period by 26 Coupled Model Intercomparison Project Phase 5 (CMIP5) General Circulation Models (GCMs) for North America. Map: Ensemble median
frequency of “warm days” during 2071–2100 under Representative Concentration Pathway 8.5 (RCP8.5). Graphs: Box-and-whisker plots indicate the range of
regionally averaged “hot-day” frequency by 2041–2070 and 2071–2100 under RCP4.5 and RCP8.5 across the 26 CMIP5 models for each SREX sub-region in North
America. Boxes represent inter-quartile range and whiskers indicate full range of projections across the ensemble. The baseline frequency of “warm days” of 10% is
represented on the graphs by the dashed line. A full list of CMIP5 models for which data is shown here can be found in Table SM21-4.
CGI
CNA
ENA
WNA
ALA
ALA
WNA
CGI
2041–2070 2071–2100
CNA
2041–2070 2071–2100
2041–2070 2071–2100
ENA
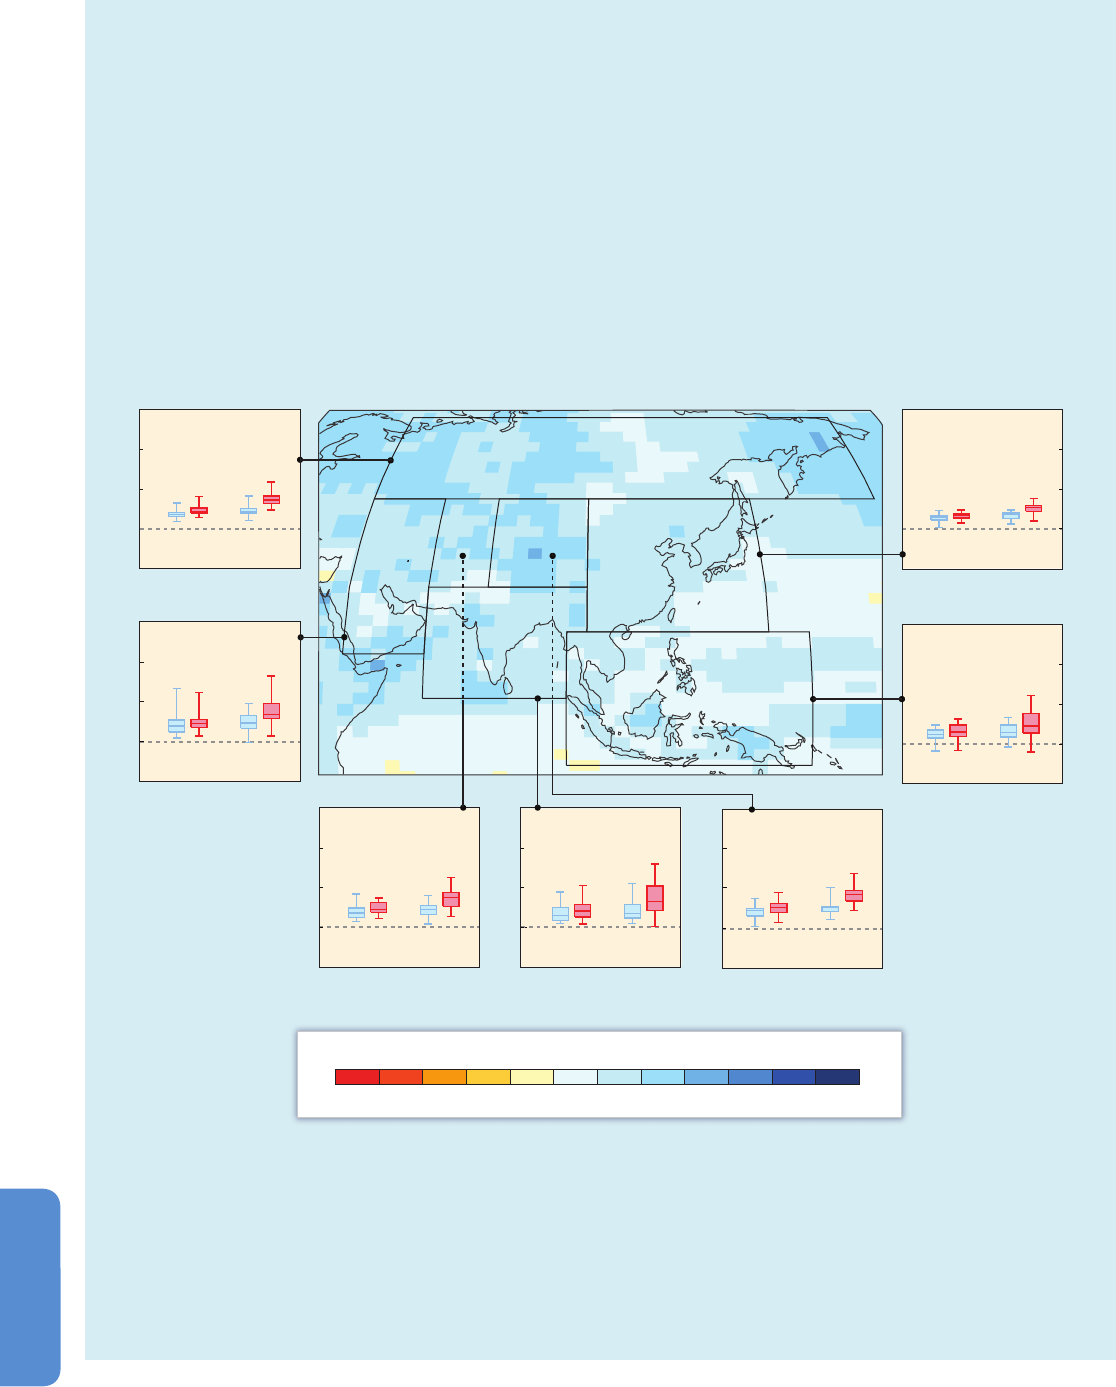
1164
Chapter 21 Regional Context
21
Box 21-4 (continued)
In the SREX report, the only coordinated global multi-model ensemble information available was from CMIP3. To provide information
consistent with the projections assessed elsewhere in WGI and WGII AR5, changes in daily temperature and precipitation projected
by the CMIP5 models are presented here for two example indices, the 90th percentiles of the daily maximum temperature and daily
precipitation amounts on wet days. Changes in these indices were calculated over 30-year periods (1961–1990 for the baseline and
two future periods, 2041–2070 and 2071–2100) and the analysis was focused on the less extreme daily events to reduce problems
with the number needed to be sampled to generate robust statistics (Kendon et al., 2008). Projected changes were calculated for
Representative Concentration Pathway 4.5 (RCP4.5) and RCP8.5 and the results are displayed as a map for a given continental region
and also regional averages over the SREX regions within that continent. Two examples are provided: for temperature changes over
North America (Figure 21-7) and precipitation changes over Asia (Figure 21-8). A full set can be found in Figures SM21-8 to SM21-19.
Asia
25
20
15
10
5
2041–2070 2071–2100
RCP8.5
RCP4.5
NAS
0246 810 12 14 16 18 20 22 24
Percentage of days when daily rainfall exceeds the 90th percentile in the baseline
Figure 21-8 | The frequency of “very wet days” (defined here as the 90th percentile of daily precipitation on wet days during a baseline period of 1961–1990 with
wet days defined as days with 1 mm of precipitation or more) projected for the 2071–2100 period by 26 Coupled Model Intercomparison Project Phase 5 (CMIP5)
General Circulation Models (GCMs) or Asia. Map: Ensemble median frequency of “very wet days” during 2071–2100 under Representative Concentration Pathway 8.5
(RCP8.5). Graphs: Box-and-whisker plots indicate the range of regionally averaged “very wet day” frequency by 2041–2070 and 2071–2100 under RCP4.5 and
RCP8.5 across the 26 CMIP5 models for each SREX sub-region in Asia. Boxes represent inter-quartile range and whiskers indicate full range of projections across the
ensemble. The baseline frequency of “very wet days” of 10% is represented on the graphs by the dashed line. A full list of CMIP5 models for which data are shown
here can be found in Table SM21-4. Note that the World Meteorological Organization (WMO) Expert Team on Climate Change Detection Indices defines “very wet
days” threshold as the 95th percentile daily precipitation event.
25
20
15
10
5
2041–2070
2071–2100
WAS
25
20
15
1
0
5
2041–2070 2071–2100
EAS
25
20
15
10
5
2041–2070 2071–2100
TIB
25
20
15
10
5
2041–2070 2071–2100
SEA
25
20
15
10
5
2041–2070 2071–2100
SAS
2041–2070 2071–2100
CAS
25
20
15
10
5
WAS
NAS
EAS
TIB
SAS
SEA
CAS

1165
Regional Context Chapter 21
21
Continued next page
Region/
region code
Trends in daytime temperature extremes
(frequency of hot and cool days)
Trends in nighttime temperature extremes
(frequency of warm and cold nights)
Trends in heat waves/warm spells Trends in heavy precipitation (rain, snow) Trends in dryness and drought
Observed Projected Observed Projected Observed Projected Observed Projected Observed Projected
West North
America
WNA, 3
Very likely large
increases in hot days
(large decreases in
cool days)
a
Very likely increase in hot
days (decrease in cool
days)
b
Very likely large decreases
in cold nights (large
increases in warm nights)
a
Very likely increase
in warm nights
(decrease in cold
nights)
b
Increase in warm
spell duration
a
Likely more frequent,
longer, and/or more
intense heat waves
and warm spells
b
Spatially varying trends.
General increase,
decrease in some
areas
a
Increase in 20-year return
value of annual maximum
daily precipitation and
other metrics over
northern part of the
region (Canada)
b
Less confi dence in
southern part of
the region, due to
inconsistent signal in
these other metrics
b
No change or overall
slight decrease in
dryness
a
Inconsistent
signal
b
Central North
America
CNA, 4
Spatially varying
trends: small increases
in hot days in the
north, decreases in the
south
a
Very likely increase in hot
days (decrease in cool
days)
b
Spatially varying trends:
small increase in cold
nights (and decreases in
warm nights) in south
and vice versa in the
north
a
Very likely increase
in warm nights
(decrease in cold
nights
b
Spatially varying
trends
a
Likely more frequent,
longer, and/or more
intense heat waves
and warm spells
b
Very likely increase
since 1950
a
Increase in 20-year return
value of annual maximum
daily precipitation
b
Inconsistent signal in
other heavy precipitation
days metrics
b
Likely decrease
a, c
Increase in
consecutive
dry days and
soil moisture in
southern part
of central North
America
b
Inconsistent
signal in the
rest of the
region
b
Table 21-7 | An assessment of observed and projected future changes in temperature and precipitation extremes over 26 sub-continental regions as defi ned in the SREX report (IPCC 2012); these regions are also displayed
in Figure 21.4 and Table SM21.2. Confi dence levels are indicated by color coding of the symbols. Likelihood terms are given only for high confi dence statements and are specifi ed in the text. Observed trends in temperature
and precipitation extremes, including dryness, are generally calculated from 1950, using the period 1961-1990 as a baseline (see Box 3.1 of IPCC, 2012). The future changes are derived from global and regional climate model
projections of the climate of 2071-2100 compared with 1961-1990 or 2080-2100 compared with 1980-2000. Table entries are summaries of information in Tables 3-2 and 3-3 of IPCC (2012) supplemented with or superseded by
material from Chapters 2 (Section 2.6 and Table 2.13) and 14 (Section 14.4) of IPCC (2013a) and Table 25-1 of this volume. The source(s) of information for each entry are indicated by the superscripts a (Table 3-2 of IPCC, 2012),
b (Table 3-3 of IPCC, 2012), c (Section 2.6 and Table 2.13 of IPCC, 2013a), d (Section 14.4 of IPCC, 2013a), and e (Table 25-1 of this volume).
Increasing trend
or signal
Decreasing
trend or signal
Medium
confidence
Both increasing and
decreasing trend or signal
Inconsistent trend or signal
or insufficient evidence
No change or only
slight change
Low
confidence
High
confidence
Level of confidence in findings
Symbols

1166
Chapter 21 Regional Context
21
Continued next page
Table 21-7 (continued)
Region/
region code
Trends in daytime temperature extremes
(frequency of hot and cool days)
Trends in nighttime temperature extremes
(frequency of warm and cold nights)
Trends in heat waves/warm spells Trends in heavy precipitation (rain, snow) Trends in dryness and drought
Observed Projected Observed Projected Observed Projected Observed Projected Observed Projected
East North
America
ENA, 5
Spatially varying trends.
Overall increases in
hot days (decreases in
cool days), opposite or
insignifi cant signal in a
few areas
a
Very likely increase in hot
days (decrease in cool
days)
b
Weak and spatially
varying trends
a
Very likely increase
in warm nights
(decrease in cold
nights
b
Spatially varying
trends, many
areas with
increase in
duration, some
areas with
decrease
a
Likely more frequent,
longer and/or more
intense heat waves
and warm spells
b
Very likely increase
since 1950
a
Increase in 20-year return
value of annual maximum
daily precipitation.
Additional metrics
support an increase in
heavy precipitation over
northern part of the
region.
b
No signal or inconsistent
signal in these other
metrics in the southern
part of the region
b
Slight decrease in dryness
since 1950
a
Inconsistent
signal in
consecutive
dry days, some
consistent
decrease in soil
moisture
b
Alaska/
Northwest
Canada
ALA, 1
Very likely large
increases in warm
days (decreases in cold
days)
a
Very likely increase in hot
days (decrease in cool
days)
b
Very likely large decreases
in cold nights, increases in
warm nights
a
Very likely increase
in warm nights
(decrease in cold
nights)
b
Insuffi cient
evidence
a
Likely more frequent,
and/or longer heat
waves and warm
spells
b
Slight tendency for
increase
a
No signifi cant trend in
southern Alaska
a
Likely increase in heavy
precipitation
b
Inconsistent trends
a
Increases in dryness in
part of the region
a
Inconsistent
signal
b
East Canada,
Greenland,
Iceland
CGI, 2
Likely increases in hot
days (decreases in cool
days) in some areas,
decrease in hot days
(increase in cool days)
in others
a
Very likely increase in
warm days (decrease in
cold days)
b
Small increases in
unusually cold nights and
decreases in warm nights
in northeastern Canada
a
Small decrease in cold
nights and increase in
warm nights in south-
eastern/central Canada
a
Very likely increase
in warm nights
(decrease in cold
nights)
b
Some areas
with warm spell
duration increase,
some with
decrease
a
Likely more frequent,
and/or longer heat
waves and warm
spells
b
Increase in a few areas
a
Likely increase in heavy
precipitation
b
Insuffi cent evidence
a
Inconsistent
signal
b
Northern
Europe
NEU, 11
Increase in hot days
(decrease in cool days),
but generally not
signifi cant at the local
scale
a
Very likely increase in hot
days (decrease in cool
days) [but smaller trends
than in central and
southern Europe]
b
Increase in warm
nights (decrease in cold
nights) over the whole
region, but generally not
signifi cant at the local
scale
a
Very likely increase
in warm nights
(decrease in cold
nights)
b
Increase in heat
waves. Consistent
tendency for
increase in heat
wave duration
and intensity, but
no signifi cant
trend
a
Likely more frequent,
longer and/or more
intense heat waves/
warm spells, but
summer increases
smaller than in
southern Europe
b
Little change over
Scandinavia
b
Increase in winter
in some areas, but
often insignifi cant or
inconsistent trends
at sub-regional scale,
particularly in summer
a
Likely increase in
20-year return value
of annual maximum
daily precipitation. Very
likely increases in heavy
preciptation intensity and
frequency in winter in
the north
b
Spatially varying trends.
Overall only slight or no
increase in dryness, slight
decrease in dryness in
part of the region
a
No major
changes in
dryness
b

1167
Regional Context Chapter 21
21
Continued next page
Table 21-7 (continued)
Region/
region code
Trends in daytime temperature extremes
(frequency of hot and cool days)
Trends in nighttime temperature extremes
(frequency of warm and cold nights)
Trends in heat waves/warm spells Trends in heavy precipitation (rain, snow) Trends in dryness and drought
Observed Projected Observed Projected Observed Projected Observed Projected Observed Projected
Central
Europe
CEU, 12
Likely overall increase
in hot days (decrease
in cool days) since
1950 in most regions.
Very likely increase
in hot days (likely
decrease in cool days)
in west-central Europe
a
Lower confi dence in
trends in east-central
Europe (due to lack
of literature, partial
lack of access to
observations, overall
weaker signals, and
change point in
trends)
a
Very likely increase in hot
days (decrease in cool
days)
b
Likely overall increase in
warm nights (decrease in
cold nights) at the yearly
time scale. Some regional
and seasonal variations in
signifi cance and in a few
cases sign of trends. Very
likely increase in warm
nights (decrease in cold
nights)in west-central
Europe
a
Lower confi dence in trends
in east-central Europe
(due to lack of literature,
partial lack of access to
observations, overall weaker
signals, and change point
in trends)
a
Very likely increase
in warm nights
(decrease in cold
nights)
b
Increase in heat
waves. Consistent
increase in heat
wave duration
and intensity, but
no signifi cant
trend. Signifi cant
increase in
maximum heat
wave duration
in west-central
Europe in
summer
a
Likely more frequent,
longer and/or more
intense heat waves/
warm spells
b
Increase in part of the
region, in particular
central western Europe
and European Russia,
especially in winter.
a
Insignifi cant or
inconsistent trends
elsewhere, in particular
in summer
a
Likely increase in
20-year return value of
annual maximum daily
precipitation. Additional
metrics support an
increase in heavy
precipitation in large
part of the region over
winter.
b
Less confi dence
in summer, due to
inconsistent evidence
b
Spatially varying trends.
Increase in dryness in
part of the region but
some regional variation
in dryness trends and
dependence of trends
on studies considered
(index, time period)
a
Increase in
dryness in
central Europe
and increase
in short-term
droughts
b
Southern
Europe and
Mediterranean
MED, 13
Likely increase in
hot days (decrease
in cool days) in
most of the region.
Some regional and
temporal variations
in the signifi cance
of the trends. Likely
strongest and most
signifi cant trends in
Iberian peninsula and
southern France
a
Smaller or less
signifi cant trends in
southeastern Europe
and Italy due to
change point in trends,
strongest increase in
hot days since 1976
a
Very likely increase in hot
days (decrease in cool
days)
b
Likely increase in warm
nights (decrease in
cold nights) in most
of the region. Some
regional variations in
the signifi cance of the
trends. Very likely overall
increase in warm nights
(decrease in cold nights
in southwest Europe/west
Mediterranean
a
Very likely increase
in warm nights
(decrease in cold
nights)
b
Likely increase in
most regions
a
Likely more frequent,
longer and/
or more intense
heat waves and
warm spells (likely
largest increases in
southwest south,
and east of the
region)
b
Inconsistent trends
across the region and
across studies
a
Inconsistent changes and/
or regional variations
b
Overall increase in
dryness, likely increase in
the Mediterranean
a, c
Increase
in dryness.
Consistent
increase in area
of drought
b, d
West Africa
WAF, 15
Signifi cant increase in
temperature of hottest
day and coolest day in
some parts
a
Insuffi cient evidence in
other parts
a
Likely increase in hot
days (decrease in cool
days)
b
Increasing frequency of
warm nights. Decrease
in cold nights in western
central Africa, Nigeria,
and Gambia
a
Insuffi cient evidence on
trends in cold nights in
other parts
a
Likely increase
in warm nights
(decrease in cold
nights)
b
Insuffi cient
evidence for most
of the region
a
Likely more frequent
and/or longer heat
waves and warm
spells
b
Rainfall intensity
increased
a
Slight or no change
in heavy precipitation
indicators in most areas
b
Low model agreement in
northern areas
b
Likely increase but 1970s
Sahel drought dominates
the trend; greater inter-
annual variation in recent
years
a, c
Inconsistent
signal
b
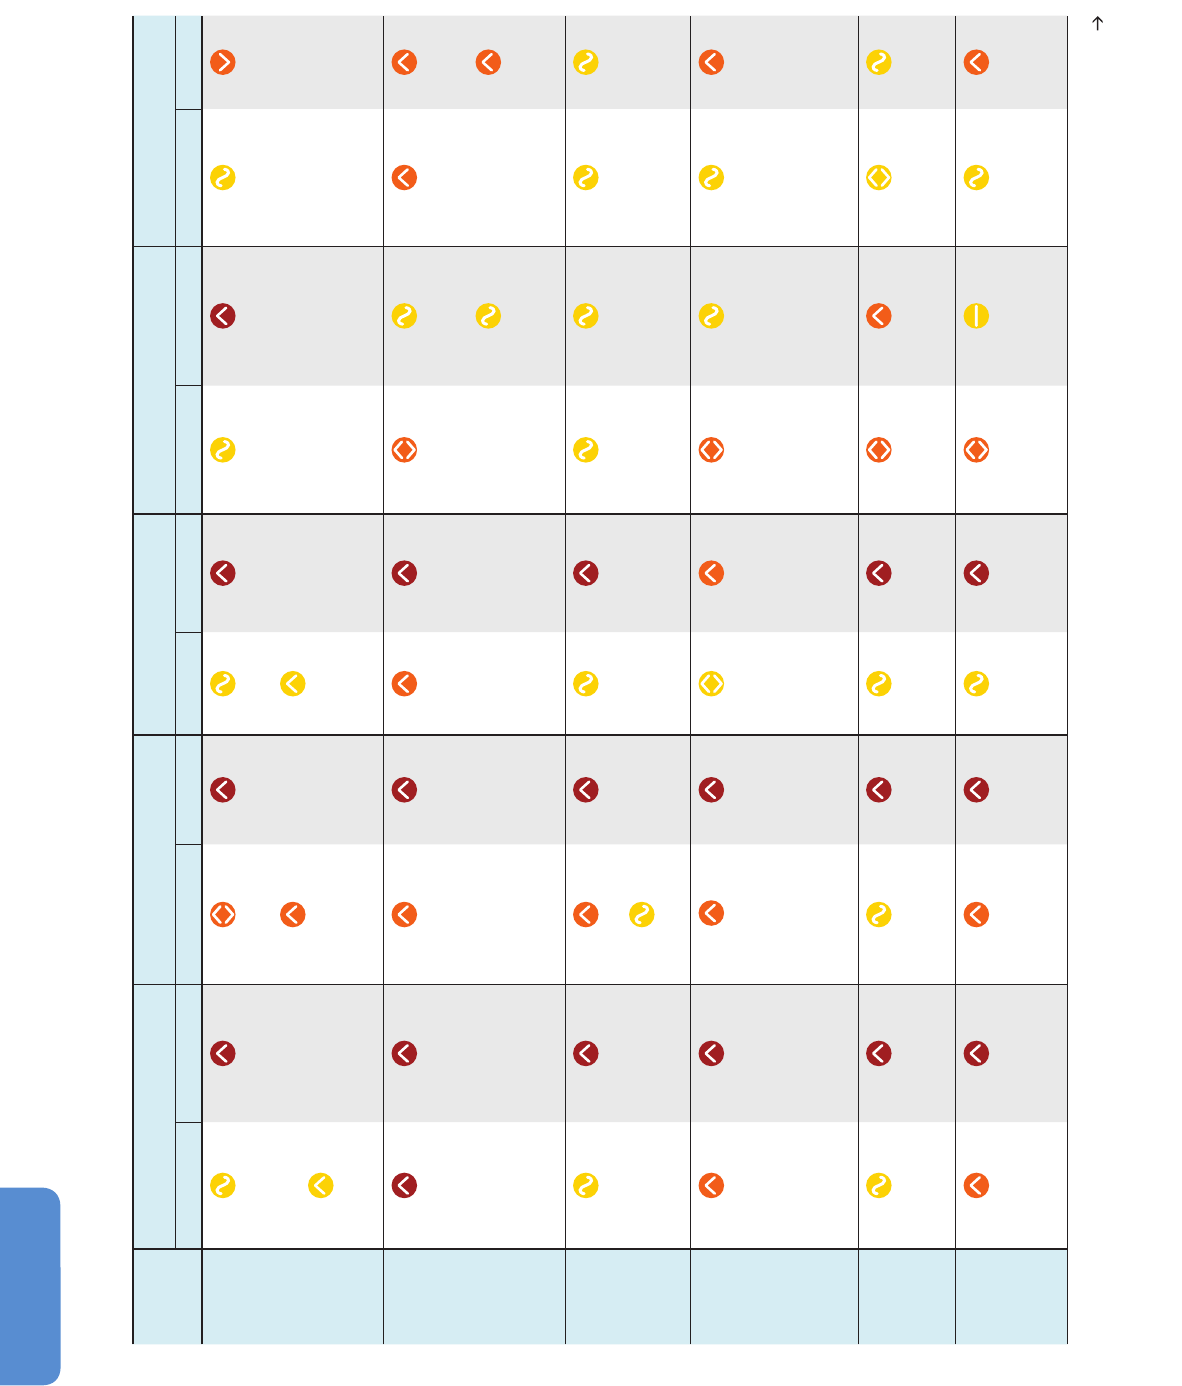
1168
Chapter 21 Regional Context
21
Continued next page
Table 21-7 (continued)
Region/
region code
Trends in daytime temperature extremes
(frequency of hot and cool days)
Trends in nighttime temperature extremes
(frequency of warm and cold nights)
Trends in heat waves/warm spells Trends in heavy precipitation (rain, snow) Trends in dryness and drought
Observed Projected Observed Projected Observed Projected Observed Projected Observed Projected
East Africa
EAF, 16
Lack of evidence due
to lack of literature and
spatially non-uniform
trends
a
Increases in hot days in
southern tip (decrease
in cool days)
a
Likely increase in hot
days (decrease in cool
days)
b
Spatially varying trends in
most areas
a
Increases in warm nights
in southern tip (decrease
in cold nights)
a
Likely increase
in warm nights
(decrease in cold
nights)
b
Insuffi cient
evidence
a
Increase in warm
spell duration in
southern tip of
the region
a
Likely more frequent
and/or longer heat
waves and warm
spells
b
Insuffi cient evidence
a
Likely increase in heavy
precipitation
b
Spatially varying trends in
dryness
a
Decreasing
dryness in large
areas
b
Southern
Africa
SAF, 17
Likely increase in hot
days (decrease in cool
days)
a, c
Likely increase in hot
days (decrease in cool
days)
b
Likely increase in warm
nights (decrease in cold
nights)
a, c
Likely increase
in warm nights
(decrease in cold
nights)
b
Increase in warm
spell duration
a
Likely more frequent
and/or longer heat
waves and warm
spells
b
Increases in more
regions than decreases
but spatially varying
trends
a
Lack of agreement in
signal for region as a
whole
b
Some evidence of
increase in heavy
precipitation in southeast
regions
b
General increase in
dryness
a
Increase in
dryness, except
eastern part
b, d
Consistent
increase in area
of drought
b
Sahara
SAH, 14
Lack of literature
a
Likely increase in hot
days (decrease in cool
days)
b
Increase in warm nights
a
Lack of literature on
trends in cold nights
a
Likely increase
in warm nights
(decrease in cold
nights)
b
Insuffi cient
evidence
a
Likely more frequent
and/or longer heat
waves and warm
spells
b
Insuffi cient evidence
a
Low agreement
b
Limited data, spatial
variation of the trends
a
Inconsistent
signal of
change
b
Central
America and
Mexico
CAM, 6
Increases in the
number of hot days,
decreases in the
number of cool days
a
Likely increase in hot
days (decrease in cool
days)
b
Increases in number of
warm nights (decrease in
number of cold nights)
a
Likely increase in
warm nights (likely
decrease in cold
nights)
b
Spatially varying
trends (increases
in some areas,
decreases in
others)
a
Likely more frequent,
longer and/or more
intense heat waves/
warm spells in most
of the region
b
Spatially varying trends.
Increase in many areas,
decrease in a few
others
a
Inconsistent trends
b
Varying and inconsistent
trends
a
Increase in
dryness in
Central America
and Mexico,
with less
confi dence
in trend in
extreme south
of region
b
Amazon
AMZ, 7
Insuffi cient evidence to
identify trends
a
Hot days likely to
increase (cool days likely
to decrease)
b
Insuffi cient evidence to
identify trends
a
Very likely increase
in warm nights
(likely decrease in
cold nights)
b
Insuffi cient
evidence
a
Likely more frequent
and longer heat
waves and warm
spells
b
Increases in many
areas, decreases in
a few
a
Tendency for increases in
heavy precipitation events
in some metrics
b
Decrease in dryness
for much of the region.
Some opposite trends
and inconsistencies
a
Inconsistent
signals
b
Northeastern
Brazil
NEB, 8
Increases in the
number of hot days
a
Hot days likely to
increase (cool days likely
to decrease)
b
Increases in the number
of warm nights
a
Likely increase in
warm nights (likely
decrease in cold
nights)
b
Insuffi cient
evidence
a
Likely more frequent
and longer heat
waves and warm
spells in some
studies
b
Increases in many
areas, decreases in
a few
a
Slight or no change
b
Varying and inconsistent
trends
a
Increase in
dryness
b

1169
Regional Context Chapter 21
21
Continued next page
Table 21-7 (continued)
Region/
region code
Trends in daytime temperature extremes
(frequency of hot and cool days)
Trends in nighttime temperature extremes
(frequency of warm and cold nights)
Trends in heat waves/warm spells Trends in heavy precipitation (rain, snow) Trends in dryness and drought
Observed Projected Observed Projected Observed Projected Observed Projected Observed Projected
Southeastern
South
America
SSA, 10
Spatially varying trends
(increases in some
areas, decreases in
others)
a
Hot days likely to
increase (cool days likely
to decrease)
b
Increases in number of
warm nights (decreases in
number of cold nights)
a
Very likely increase
in warm nights
(likely decrease in
cold nights)
b
Spatially varying
trends (increases
in some areas,
decreases in
others)
a
Tendency for more
frequent and longer
heat waves and
warm spells
b
Increases in northern
areas
a
Insuffi cient evidence in
southern areas
a
Increases in northern
areas
b
Insuffi cient evidence in
southern areas
b
Varying and inconsistent
trends
a
Inconsistent
signals
b
West Coast
South
America
WSA, 9
Spatially varying trends
(increases in some
areas, decreases in
others)
a
Hot days likely to
increase (cool days likely
to decrease)
b
Increases in number of
warm nights (decreases in
number of cold nights)
a
Likely increase in
warm nights (likely
decrease in cold
nights)
b
Insuffi cient
evidence
a
Likely more frequent
and longer heat
waves and warm
spells
b
Increases in many
areas, decrease in a
few areas
a
Increases in tropics
b
Low confi dence in
extratropics
b
Varying and inconsistent
trends
a
Decrease in
consecutive
dry days in the
tropics, and
increase in the
extratropics
b
Increase in
consecutive
dry days and
soil moisture
in southwest
South America
b
North Asia
NAS, 18
Likely increase in hot
days (decrease in cool
days)
a
Likely increase in hot
days (decrease in cool
days)
b
Likely increase in warm
nights (decrease in cold
nights)
a
Likely increase
in warm nights
(decrease in cold
nights)
b
Spatially varying
trends
a
Likely more frequent
and/or longer heat
waves and warm
spells
a
Increase in some
regions, but spatial
variation
a
Likely increase in heavy
precipitation for most
regions
b
Spatially varying trends
a
Inconsistent
signal of
change
b
Central Asia
CAS, 20
Likely increase in hot
days (decrease in cool
days)
a
Likely increase in hot
days (decrease in cool
days)
b
Likely increase in warm
nights (decrease in cold
nights)
a
Likely increase
in warm nights
(decrease in cold
nights)
b
Increase in warm
spell duration in a
few areas
a
Insuffi cient
evidence in
others
a
Likely more frequent
and/or longer heat
waves and warm
spells
b
Spatially varying trends
a
Inconsistent signal in
models
b
Spatially varying trends
a
Inconsistent
signal of
change
b
East Asia
EAS, 22
Likely increase in hot
days (decrease in cool
days)
a
Likely increase in hot
days (decrease in cool
days)
b
Increase in warm nights
(decrease in cold nights)
a
Likely increase
in warm nights
(decrease in cold
nights)
b
Increased heat
waves in China
a
Increase in warm
spell duration in
northern China,
decrease in
southern China
a
Likely more frequent
and/or longer heat
waves and warm
spells
b
Spatially varying trends
a
Increase in heavy
precipitation across the
region
b
Tendency for increased
dryness
a
Inconsistent
signal of
change
b
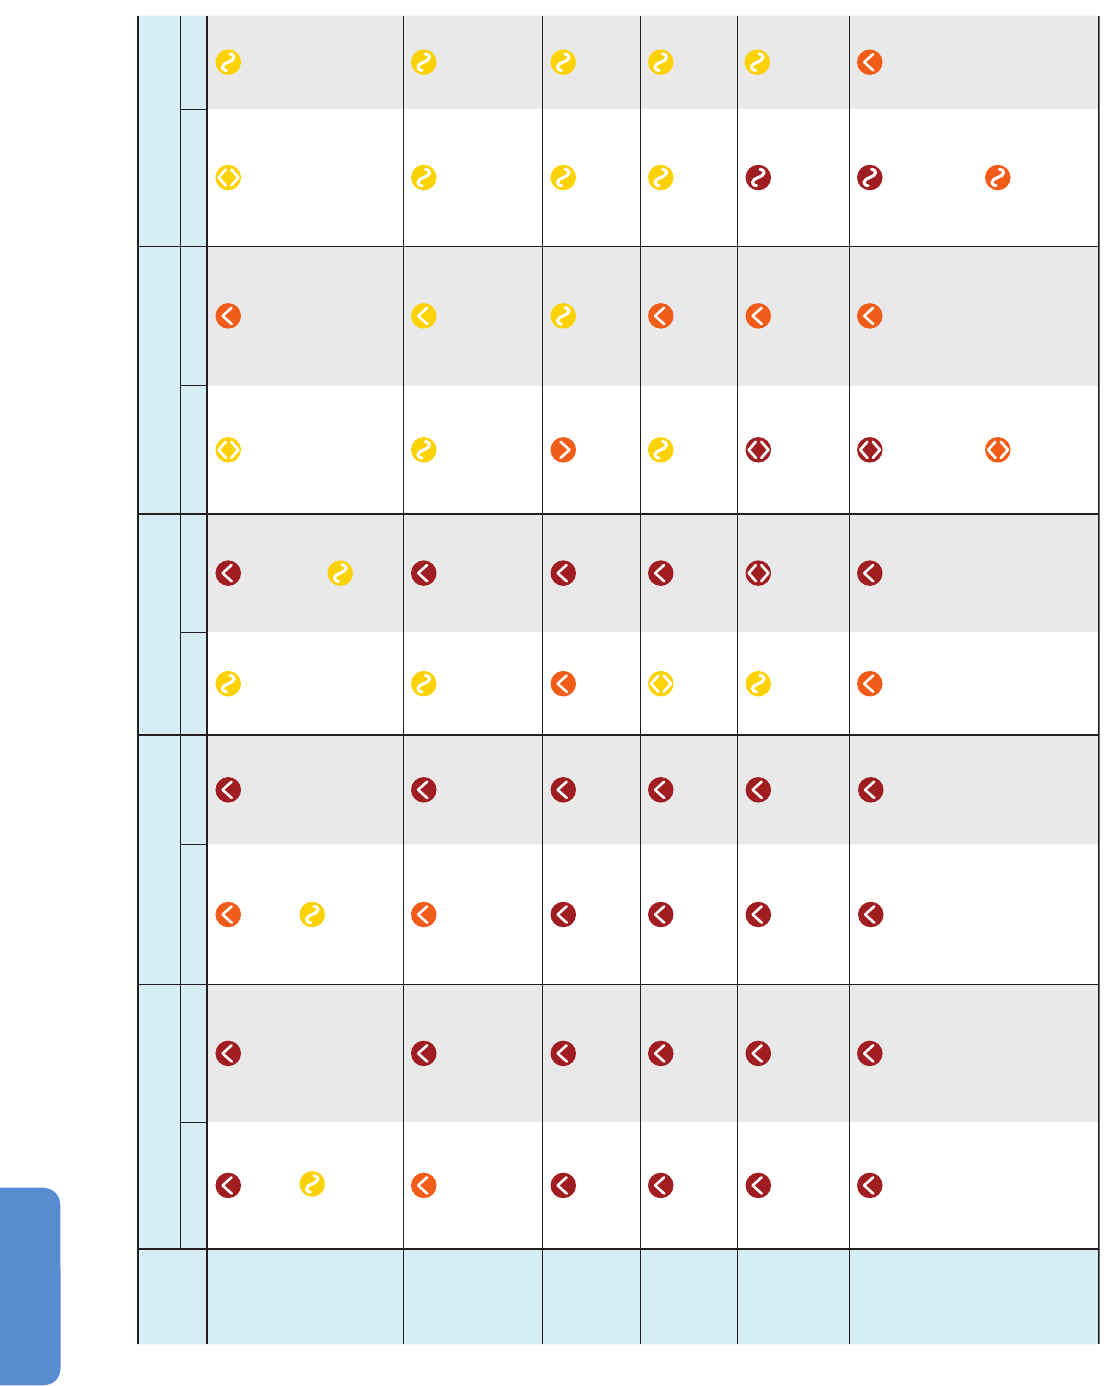
1170
Chapter 21 Regional Context
21
Region/
region code
Trends in daytime temperature extremes
(frequency of hot and cool days)
Trends in nighttime temperature extremes
(frequency of warm and cold nights)
Trends in heat waves/warm spells Trends in heavy precipitation (rain, snow) Trends in dryness and drought
Observed Projected Observed Projected Observed Projected Observed Projected Observed Projected
Southeast
Asia
SEA, 24
Increase in hot days
(decrease in cool days)
for northern areas
a
Insuffi cient evidence
for Malay Archipelago
a
Likely increase in hot
days (decrease in cool
days)
b
Increase in warm nights
(decrease in cold nights)
for northern areas
a
Insuffi cient evidence for
Malay Archipelago
a
Likely increase
in warm nights
(decrease in cold
nights)
b
Insuffi cient
evidence
a
Likely more frequent
and/or longer
heat waves and
warm spells over
continental areas
b
Low confi dence in
changes for some
areas
b
Spatially varying trends,
partial lack of evidence
a
Increases in most metrics
over most (especially non-
continental) regions. One
metric shows inconsistent
signals of change.
b
Spatially varying trends
a
Inconsistent
signal of
change
b
South Asia
SAS, 23
Increase in hot days
(decrease in cool days)
a
Likely increase in hot
days (decrease in cool
days)
b
Increase in warm nights
(decrease in cold nights)
a
Likely increase
in warm nights
(decrease in cold
nights)
b
Insuffi cient
evidence
a
Likely more frequent
and/or longer heat
waves and warm
spells
b
Mixed signal in India
a
More frequent
and intense heavy
precipitation days over
parts of South Asia.
Either no change or some
consistent increases in
other metrics
b
Inconsistent signal for
different studies and
indices
a
Inconsistent
signal of
change
b
West Asia
WAS, 19
Very likely increase in
hot days (decrease in
cool days more likely
than not)
a
Likely increase in hot
days (decrease in cool
days)
b
Likely increase in warm
nights (decrease in cold
nights)
a
Likely increase
in warm nights
(decrease in cold
nights)
b
Increase in warm
spell duration
a
Likely more frequent
and/or longer heat
waves and warm
spells
b
Decrease in heavy
precipitation events
a
Inconsistent signal of
change
b
Lack of studies, mixed
results
a
Inconsistent
signal of
change
b
Tibetan
Plateau
TIB, 21
Likely increase in hot
days (decrease cool
days)
a
Likely increase in hot
days (decrease in cool
days)
b
Likely increase in warm
nights (decrease in cold
nights)
a
Likely increase
in warm nights
(decrease in cold
nights)
b
Spatially varying
trends
a
Likely more frequent
and/or longer heat
waves and warm
spells
b
Insuffi cient evidence
a
Increase in heavy
precipitation
b
Insuffi cient evidence.
Tendency to decreased
dryness
a
Inconsistent
signal of
change
b
North
Australia
NAU, 25
Likely increase in hot
days (decrease in cool
days). Weaker trends in
northwest
a
Very likely increase in hot
days (decrease in cool
days)
b
Likely increase in warm
nights (decrease in cold
nights)
a
Very likely increase
in warm nights
(decrease of cold
nights)
b
Insuffi cient
literature
a
Likely more frequent
and/or longer heat
waves and warm
spells
b
Spatially varying trends,
which mostly refl ect
changes in mean
rainfall
e
Increase in most regions
in the intensity of extreme
(i.e., current 20-year
return period) heavy
rainfall events
e
No signifi cant change in
drought occurrence over
Australia (defi ned using
rainfall anomalies)
e
Inconsistent
signal
b
South
Australia/
New Zealand
SAU, 26
Very likely increase in
hot days (decrease in
cool days)
a
Very likely increase in
hot days (decrease in
cool days)
b
Very likely increase in
warm nights (decrease
in cold nights)
a
Very likely
increase in warm
nights (decrease
in cold nights)
b
Increase in
warm spells
across southern
Australia
a
Likely more
frequent and/or
longer heat waves
and warm spells
b
Spatially varying
trends in southern
Australia, which
mostly refl ect changes
in mean rainfall
e
Spatially varying
trends in New
Zealand, which
mostly refl ect changes
in mean rainfall
e
Increase in most regions
in the intensity of
extreme (i.e., current
20-year return period)
heavy rainfall events
e
No signifi cant change
in drought occurrence
over Australia
(defi ned using rainfall
anomalies)
e
No trend in drought
occurrence over New
Zealand (defi ned using
a soil–water balance
model) since 1972
e
Increase
in drought
frequency
in southern
Australia,
and in many
regions of New
Zealand
e
Table 21-7 (continued)

1171
Regional Context Chapter 21
21
(
Figure 21-4), are introduced in Box 21-4 and accompanying on-line
supplementary material.
21.3.3.5. Projected Changes in Sea Level
Projections of regional sea level changes, based both on the CMIP3
and CMIP5 models, indicate a large regional variability of sea level rise
(even more than 100% of the global mean sea level rise) in response
to different regional processes (WGI AR5 Section 13.6.5). However, by
the end of the 21st century it is very likely that more than about 95%
of the oceans will undergo sea level rise, with about 70% of coastlines
experiencing a sea level rise within 20% of the global value and most
regions experiencing sea level fall being located near current and former
glaciers and ice sheets (WGI AR5 Section 13.6.5). Some preliminary
analysis of the CMIP5 ensembles indicates areas of maximum steric sea
level rise in the Northern Atlantic, the northwestern Pacific off the East
Asia coasts, the eastern coastal oceanic regions of the Bay of Bengal,
and the western coastal regions of the Arabian Sea (WGI AR5 Section
13.6.5).
21.3.3.6. Projected Changes in Air Quality
Since the AR4 more studies have become available addressing the issue
of the effects of both climate and emission changes on air quality. Most
of these studies focused on the continental USA and Europe, and
utilized both global and regional climate and air quality models run in
off-line or coupled mode. Regional modeling studies over the USA or
some of its sub-regions include, for example, those of Hogrefe et al.
(2004), Knowlton et al. (2004), Dawson et al. (2007), Steiner et al.
(2006), Lin et al. (2008), Zhang et al. (2008), and Weaver et al. (2009),
while examples of global modeling studies include Doherty et al. (2006),
Murazaki and Hess (2006), Shindell et al. (2006), and Stevenson et al.
(2006). Weaver et al. (2009) provide a synthesis of simulated effects of
climate change on ozone concentrations in the USA using an ensemble
of regional and global climate and air quality models, indicating a
predominant increase in near-surface ozone concentrations, particularly
in the eastern USA (Figure 21-9) mostly tied to higher temperatures and
corresponding biogenic emissions. An even greater increase was found
in the frequency and intensity of extreme ozone concentration events,
which are the most dangerous for human health. Examples of regional
studies of air quality changes in response to climate change over Europe
include Langner et al. (2005), Forkel and Knocke (2006), Meleux et al.
(2007), Szopa and Hauglustaine (2007), Kruger et al. (2008), Engardt et
al. (2009), Andersson and Engardt (2010), Athanassiadou et al. (2010),
Carvalho et al. (2010), Katragkou et al. (2010, 2011), Huszar et al.
(2011), Zanis et al. (2011), and Juda-Rezler et al. (2012). All of these
studies indicated the potential of large increases in near-surface summer
ozone concentrations especially in Central and Southern Europe due to
much warmer and drier projected summer seasons.
21.4. Cross-Regional Phenomena
Thus far, this chapter has covered climate change-related issues that have
a regional expression in one part of the world or another. In principle,
t
hese issues can be studied and described, in situ, in the regions in
which they occur. However, there is a separate class of issues that
transcends regional boundaries and demands a different treatment. To
understand such cross-regional phenomena, knowledge is required of
critical but geographically remote associations and of dynamic cross-
boundary flows.
The following sections consider some examples of these phenomena,
focusing on trade and financial flows and migration. Though these issues
are treated in more detail in Part A of this report, they are restated here
in Part B to stress the importance of a global perspective in appreciating
climate change challenges and potential solutions at the regional scale.
21.4.1. Trade and Financial Flows
Global trade and international financial transactions are the motors of
modern global economic activity. Their role as key instruments for
implementing mitigation and adaptation policies is explored in detail
in Chapters 14 to 17 and in the WGIII AR5 (Gupta et al., 2014; Stavins
et al., 2014).
They are also inextricably linked to climate change (WTO and UNEP, 2009)
through a number of other interrelated pathways that are expanded
here: (1) as a direct or indirect cause of anthropogenic emissions (e.g.,
Peters et al., 2011), (2) as contributory factors for regional vulnerability
to the impacts of climate change (e.g., Leichenko and O’Brien, 2008),
and (3) through their sensitivity to climate trends and extreme climate
events (e.g., Nelson et al., 2009a; Headey, 2011).
21.4.1.1. International Trade and Emissions
The contemporary world is highly dependent on trading relationships
between countries in the import and export of raw materials, food and
fiber commodities, and manufactured goods. Bulk transport of these
products, whether by air, sea, or over land, is now a significant contributor
to emissions of GHGs and aerosols (Stavins et al., 2014). Furthermore,
the relocation of manufacturing has transferred net emissions via
international trade from developed to developing countries (see Figure
21-10), and most developed countries have increased their consumption-
based emissions faster than their domestic (territorial) emissions (Peters
et al., 2011).
This regional transfer of emissions is commonly referred to in climate
policy negotiations as “carbon leakage” (Barker et al., 2007)—though
only a very small portion of this can be attributed to climate policy
(“strong carbon leakage”), a substantial majority being due to the effect
of non-climate policies on international trade (“weak carbon leakage”;
Peters, 2010). A particular example of strong carbon leakage concerns
the conversion of land use from the production of food to bioenergy
crops. These crops sequester carbon otherwise extracted from the
ground as fossil fuels, but in the process displace demand for food
production to land in other regions, often inducing land clearance and
hence an increase in emissions (Searchinger et al., 2008), though the
empirical basis for this latter assertion is disputed (see Kline and Dale,
2008).
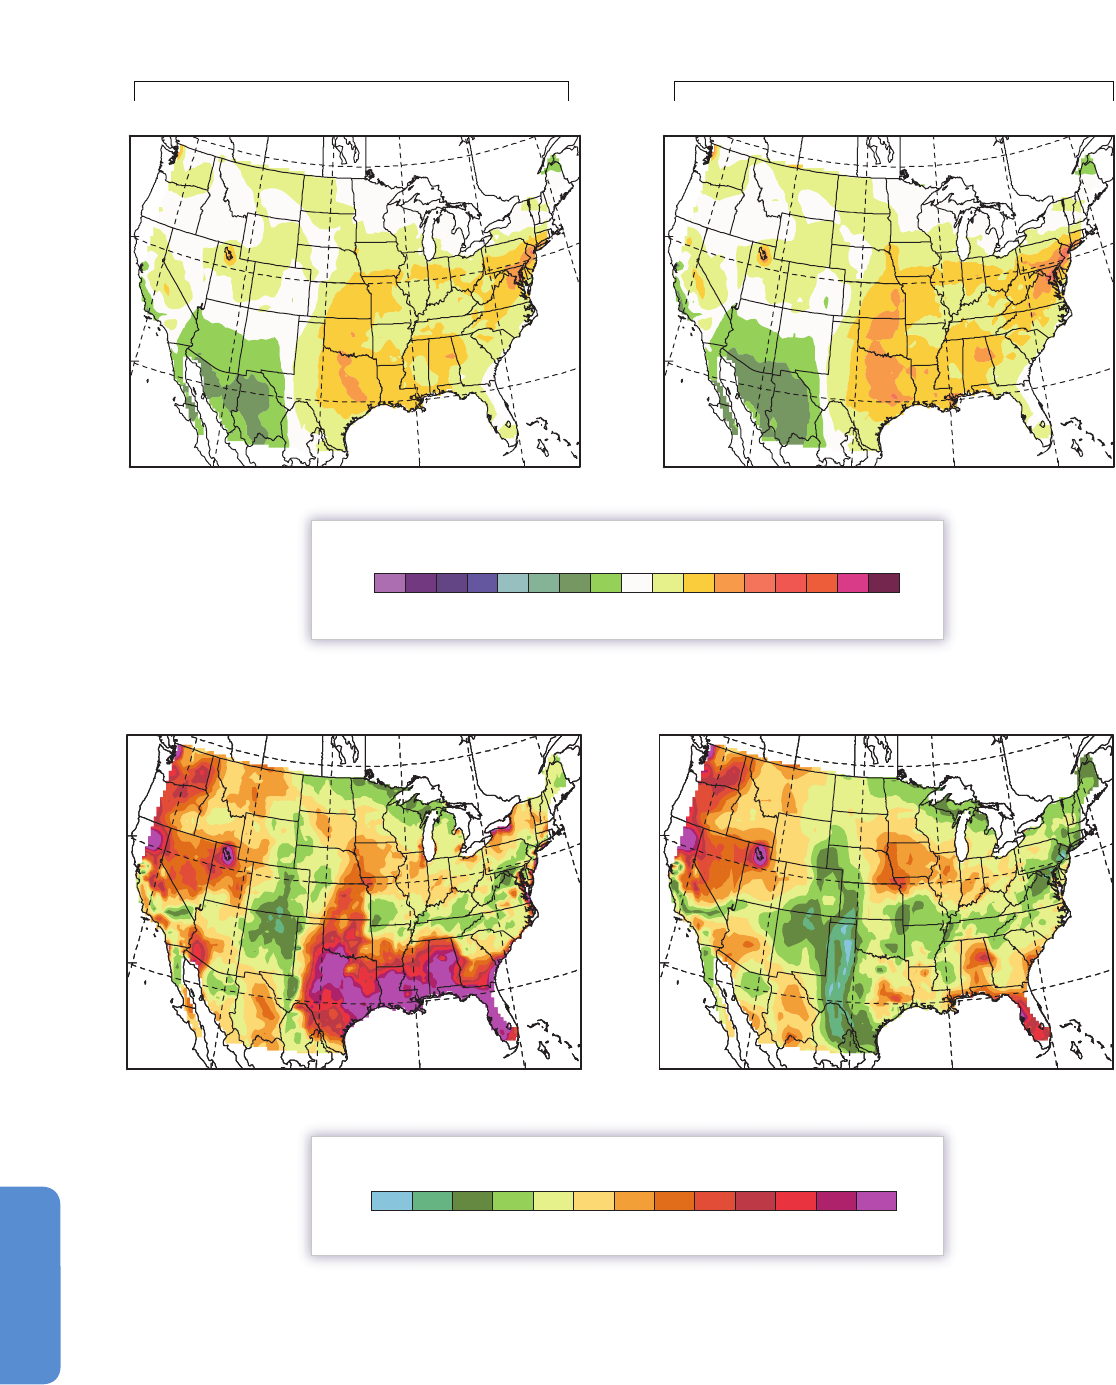
1172
Chapter 21 Regional Context
21
40°N
30°N
40°N
30°N
110°W 110°W 90°W 80°W 110°W 110°W 90°W 80°W
110°W 110°W 90°W 80°W 110°W 110°W 90°W 80°W
40°N
30°N
40°N
30°N
–7.5 –6.5 –5.5 –4.5 –3.5 –2.5 –1.5 –0.5 0.5 1.5 2.5 3.5 4.5 5.5 6.5 7.5
Mean (ppb)
0.4 0.8 1.2 1.6 2.0 2.4 2.8 3.2 3.6 4.0 4.4 4.8
Standard Deviation (ppb)
Figure 21-9 | Mean (top panels) and standard deviation (bottom panels) in future-minus-present (2050s minus 1990s) MDA8 summer ozone concentrations across (lefthand
panels) all seven experiments (five regional and two global) and for comparison purposes (righthand panels), not including the WSU experiment (which simulated July-only
conditions). The different experiments use different pollutant emission and Special Report on Emission Scenarios (SRES) greenhouse gas (GHG) emission scenarios. The pollutant
emissions are the same in the present and future simulations (Weaver et al., 2009).
Left panels: all seven experiments (5 regional and two global) Right panels: all experiments except the WSU experiment
Summer ozone (MDA8 O3) concentration mean changes (top panels) and standard deviations (bottom panels)

1173
Regional Context Chapter 21
21
21.4.1.2. Trade and Financial Flows
as Factors Influencing Vulnerability
The increasingly international nature of trade and financial flows
(commonly referred to as globalization), while offering potential benefits
for economic development and competitiveness in developing countries,
also presents high exposure to climate-related risks for some of the
populations already most vulnerable to climate change (Leichenko and
O’Brien, 2008). Examples of these risks, explored further in Chapters 7
to 9, 12, 13, and 19, include:
• Severe impacts of food price spikes in many developing countries
(including food riots and increased incidence of child malnutrition)
such as occurred in 2008 following shortfalls in staple cereals, due
to a coincidence of regional weather extremes (e.g., drought) in
producer countries, the reallocation of food crops by some major
exporters for use as biofuels (an outcome of climate policy; see
previous section), and market speculation (Ziervogel and Ericksen,
2010). Prices subsequently fell back as the world economy went
into recession, but spiked again in early 2011 for many of the same
reasons (Trostle et al., 2011), with some commentators predicting
a period of rising and volatile prices due to increasing demand and
competition from biofuels (Godfray et al., 2010).
• A growing dependence of the rural poor on supplementary income
from seasonal urban employment by family members and/or on
international financial remittances from migrant workers (Davies
et al., 2009). These workers are commonly the first to lose their jobs
in times of economic recession, which automatically decreases the
resilience of recipient communities in the event of adverse climate
conditions. On the other hand, schemes to provide more effective
c
ommunication with the diaspora in times of severe weather and
other extreme events can provide rapid access to resources to aid
recovery and reduce vulnerability (Downing, 2012).
• Some aspects of international disaster relief, especially the provision
of emergency food aid over protracted periods, has been cited as an
impediment to enhancing adaptive capacity to cope with climate-
related hazards in many developing countries (Schipper and Pelling,
2006). Here, international intervention, while well-intentioned to
relieve short-term stress, may actually be counterproductive in regard
to the building of long-term resilience.
21.4.1.3. Sensitivity of International Trade to Climate
Climate trends and extreme climate events can have significant
implications for regional resource exploitation and international trade
flows. The clearest example of an anticipated, potentially major impact
of climate change concerns the opening of Arctic shipping routes as well
as exploitation of mineral resources in the exclusive economic zones
(EEZs) of Canada, Greenland/Denmark, Norway, the Russian Federation,
and the USA (Figure 21-11, see also Section 28.3.4).
For instance, the Community Climate System Model 4 (CCSM4) climate
and sea ice model has been used to provide projections under RCP4.5,
RCP6.0, and RCP8.5 forcing (see Box 21-1) of future accessibility for
shipping to the sea ice hazard zone of the Arctic marine environment
defined by the International Maritime Organization (IMO) (Stephenson
et al., 2013; Figure 21-11, central map). Results suggest that moderately
ice-strengthened ships (Polar Class 6), which are estimated under
baseline (1980–1999) conditions to be able to access annually about
36% of the IMO zone, would increase this access to 45 to 48% by
2011–2030, 58 to 69% by 2046–2065, and 68 to 93% by 2080–2099,
with almost complete accessibility projected for summer (90 to 98% in
July to October) by the end of the century (Stephenson et al., 2013). The
robustness of those findings was confirmed using seven sea ice models
in an analysis of optimal sea routes in peak season (September) for
2050–2069 under RCP4.5 and RCP8.5 forcing (Smith and Stephenson,
2013). All studies imply increased access to the three major cross Arctic
routes: the Northwest Passage, Northern Sea Route (part of the Northeast
Passage), and Trans-Polar Route (Figure 21-11), which could represent
significant distance savings for trans-continental shipping currently
using routes via the Panama and Suez Canals (Stephenson et al., 2011).
Indeed, in 2009, two ice-hardened cargo vessels—the Beluga Fraternity
and Beluga Foresight—became the first to successfully traverse the
Northeast Passage from South Korea to The Netherlands, a reduction of
5500 km and 10 days compared to their traditional 20,000-km route
via the Suez Canal, translating into an estimated saving of some
US$300,000 per ship, including the cost of standby icebreaker assistance
(Smith, 2009; Det Norsk Veritas, 2010). A projection using an earlier
version of the CCSM sea ice model under the SRES A1B scenario, but
offering similar results (with forcing by mid-century lying just below
RCP8.5; Figure 1-5a), is presented in Figure 21-11 (peripheral maps),
which also portrays winter transportation routes on frozen ground.
These routes are heavily relied on for supplying remote communities
and for activities such as forestry and, in contrast to the shipping routes,
are projected to decline in many regions.
420
3
80
3
40
300
260
220
180
140
100
1990
1992
1994
1996 1998
2000
2002
2004
2006
2008
Percentage of 1990 value
Population
Gross domestic product (GDP)
International trade
Global fossil CO
2
emissions
Emissions embodied in trade
Net emission transfers Annex B to non-Annex B
Figure 21-10 | Growth rates from 1990–2008 of international trade, its embodied
CO
2
emissions and net emissions transfers from Annex B and non-Annex B countries
compared to other global macro-variables, all indexed to 1990 (Peters et al., 2011).
Annex B and non-Annex B Parties to the United Nations Framework Convention on
Climate Change (UNFCCC) are listed in Table SM21-1.
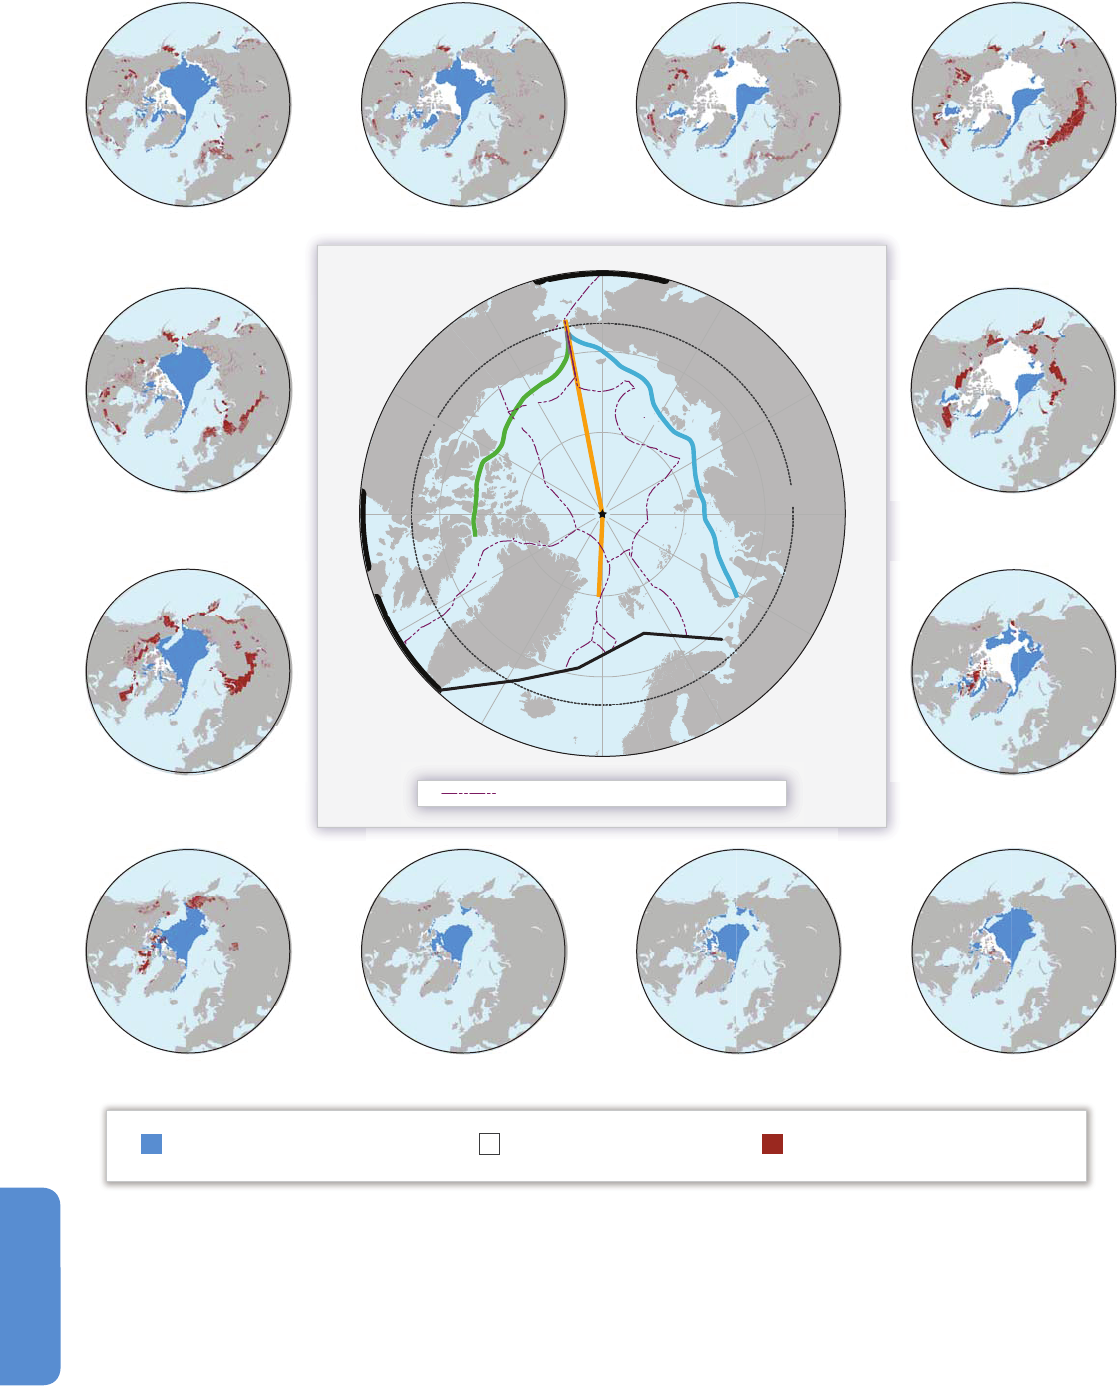
1174
Chapter 21 Regional Context
21
New maritime access to Polar
Class 6 vessels (light icebreaker)
Inaccessible areas
Areas of lost winter road potential for
ground vehicles exceeding 2 metric tonnes
Marine exclusive environmental zones (EEZs)
January February March April
December May
November June
October JulySeptember August
6
0
°
G R E E N L A N D
N
o
t
h
w
e
s
t
P
a
s
s
a
ge
T
r
a
n
s
-
P
o
l
a
r
R
o
u
t
e
I
M
O
B
O
U
N
D
A
R
Y
i
N
o
r
t
h
e
r
n
S
e
a
R
o
u
t
e
r
150
°W
150
°E
1
80
°
120
°W
120
°W
60
°W
30
°W
0
°
60
°E
30
°E
I
C E L A N D
N O R W A Y
S W E D E N
F I N L A N D
RUSSIAN FEDERATION
U.S.A.
C
ANADA
A
R
C
T
I
C
C
I
R
C
L
E
HIGH SEAS
N O R T H
P
O L E
9
0
°
W
9
0
°
E
Figure 21-11 | Central map: Marine exclusive environmental zones (EEZs, dashed lines) of Canada, Greenland/Denmark, Norway, Russian Federation, and the USA, and location
of the Northwest Passage, Northern Sea Route, Trans-Polar Route, and international high seas within the International Maritime Organization (IMO) Guidelines Boundary for
Arctic shipping (thick black border) (after Stephenson et al., 2013). Peripheral monthly maps: Projected change in accessibility of maritime and land-based transportation by
mid-century (2045–2059 relative to 2000–2014) using the Arctic Transport Accessibility Model and Community Climate System Model 3 (CCSM3) climate and sea ice estimates
assuming a Special Report on Emission Scenarios (SRES) A1B scenario. Dark blue areas denote new maritime access to Polar Class 6 vessels (light icebreaker); white areas remain
inaccessible. Red delimits areas of lost winter road potential for ground vehicles exceeding 2 metric tonnes (Stephenson et al., 2011).

1175
Regional Context Chapter 21
21
A
second illustration of how the risk of adverse climate changes may
have contributed to anticipatory adaptive actions affecting countries in
other regions of the world and potentially influencing commodity markets
relates to the purchase or renting of large tracts of productive land in
parts of Africa, South America and the Caribbean, Central Asia, and
Southeast Asia by countries in Europe, Africa, the Gulf, and South and
East Asia (De Schutter, 2009; Cotula et al., 2011; Zoomers, 2011). While
there is clearly a profit motive in many of these purchases (i.e., cheap and
fertile land and the opportunity to cultivate high value food or biofuel
crops), there is also a concern that domestic agricultural production in
some countries will be unable to keep pace with rapid growth in domestic
demand and changing dietary preferences, especially in agricultural
regions affected by frequent shortfalls due to droughts, floods, and
cyclones (Cotula et al., 2011), or threatened by sea level rise (Zoomers,
2011). Land acquisition on such a large scale raises a number of ethical
issues relating to local access to food and the appropriate and sustainable
management of the land (Deininger and Byerlee, 2012). These issues
have led the UN Special Rapporteur on the right to food to recommend
a list of 11 principles for ensuring informed participation of local
communities, adequate benefit sharing, and the respect of human rights
(De Schutter, 2009). This issue is elaborated with respect to livelihoods
and poverty in Section 13.4.3.4, and land dispossession is categorized
as a key risk in Section 19.6.2.
Extreme climate phenomena that may be harbingers of similar and
more frequent events in a warmer world, already exact devastating
consequences in some regions that extend well beyond country
boundaries. A recent event that disrupted international trade and
commodity flows was the severe 2010/2011 flooding in eastern Australia
(Giles, 2011; Queensland Floods Commission of Inquiry, 2012; see also
Box 25-8), which, combined with damaging cyclones in Queensland and
western Australia, curtailed numerous mining operations and damaged
transportation networks, leading to declines in both thermal and
metallurgical coal exports (by 31 and 19%, respectively, relative to the
previous quarter; ABARES, 2011), with a sharp rise in their monthly price
between November 2010 and January 2011 (Index Mundi, 2012). The
severe weather was the primary factor contributing to a fall in Australian
GDP of 1.2% during January to March 2011 compared with a rise of 0.7%
in the preceding 3-month period (Australian Bureau of Statistics, 2011).
Other examples of how extreme climate events can affect international
trade are reported by Oh and Reuveny (2010) and Handmer et al. (2012).
21.4.2. Human Migration
There has been considerable debate in recent years around the postulate
that anthropogenic climate change and environmental degradation
could lead to mass migration (Perch-Nielsen et al., 2008; Feng et al.,
2010; Warner, 2010; Black et al., 2011; Foresight, 2011; Assan and
Rosenfeld, 2012). The issue is treated at length in Chapters 9, 12, and 19,
so only a few aspects are touched on here, to highlight the growing
significance of migration in all regions of the world. Four possible
pathways through which climate change could affect migration are
suggested by Martin (2009):
1) Intensification of natural disasters
2) Increased warming and drought that affects agricultural production
and access to clean water
3
) Sea level rise, which makes coastal areas and some island states
increasingly uninhabitable
4) Competition over natural resources, which leads to conflict and
displacement of inhabitants.
Abundant historical evidence exists to suggest that changes in climatic
conditions have been a contributory factor in migration, including large
population displacements in the wake of severe events such as Hurricane
Katrina in New Orleans, Louisiana, USA, in 2005 (Cutter et al., 2012),
Hurricane Mitch in Central America in 1998, and the northern Ethiopian
famines of the 1980s (McLeman and Smit, 2006). Other examples are
provided in Table 12-3. However, the evidence is not clear cut (Black,
2001), with counterexamples also available of migration being limited
due to economic hardship (e.g., during the Sahel drought of the mid-
1980s in Mali; Findley, 1994).
The spatial dimension of climate-related migration is most commonly
internal to nations (e.g., from affected regions to safer zones; Naik, 2009).
In this context it is also worth pointing out that internal migration for
other (predominantly economic) reasons may actually expose populations
to increased climate risk. For instance, there are large cities in developing
countries in low-elevation coastal zones that are vulnerable to sea level
rise. Increased migration to these cities could exacerbate the problems,
with the migrants themselves being especially vulnerable (Nordås and
Gleditsch, 2007; UNFPA, 2007).
Migration can also be international, though this is less common in response
to extreme weather events, and where it does happen it usually occurs
along well established routes. For example, emigration following Hurricane
Mitch tripled from Honduras and increased from Nicaragua by 40%,
mainly to the southern states of the USA (already a traditional destination
for migrants), and was aided by a relaxation of temporary residency
requirements by the USA (Naik, 2009).
The causal chains and links between climate change and migration are
complex and can be difficult to demonstrate (e.g., Perch-Nielsen et al.,
2008; Piguet, 2010; Tänzler et al., 2010; ADB, 2012; Oliver-Smith, 2012;
Sections 9.3.3.3.1,12.4, 19.4.2.1), though useful insights can be gained
from studying past abandonment of settlements (McLeman, 2011). Thus
projecting future climate-related migration remains a challenging
research topic (Feng et al., 2010). There are also psychological, symbolic,
cultural, and emotional aspects to place attachment, which are well
documented from other non-climate causes of forced migration, and
are also applicable to cases of managed coastal retreat due to sea level
rise (e.g., Agyeman et al., 2009).
Forced migration appears to be an emerging issue requiring more
scrutiny by governments in organizing development cooperation, and
to be factored into international policy making as well as international
refugee policies. For example, it has been suggested that the National
Adaptation Plans of Action (NAPAs) under the UNFCCC, by ignoring
transboundary issues (such as water scarcity) and propounding nationally
orientated adaptation actions (e.g., upstream river management, to the
detriment of downstream users in neighboring countries), could potentially
be a trigger for conflict, with its inevitable human consequences.
Currently there is no category in the United Nations High Commission
for Refugees classification system for environmental refugees, but it is

1176
Chapter 21 Regional Context
21
p
ossible that this group of refugees will increase in the future and their
needs and rights will need to be taken into consideration (Brown, 2008).
The Nansen Initiative, put forward jointly by Norway and Switzerland at
a 2011 ministerial meeting, pledges “to cooperate with interested states
and relevant actors, including UNHCR, to obtain a better understanding
of cross-border movements provoked by new factors such as climate
change, identify best practices and develop a consensus on how best
to protect and assist those affected,” and may eventually result in a
soft law or policy framework (Kolmannskog, 2012). However, migration
should not always be regarded as a problem; in those circumstances
where it contributes to adaptation (e.g., through remittances) it can be
part of the solution (Laczko and Aghazarm, 2009).
21.4.3. Migration of Natural Ecosystems
One of the more obvious consequences of climate change is the
displacement of biogeographical zones and the natural migration of
species (see Chapters 4, 6, 19). General warming of the climate can be
expected to result in migration of ecosystems toward higher latitudes
and upward into higher elevations (Section 4.3.2.5) or downward to
cooler depths in marine environments (Section 6.3.2.1). Species shifts
are already occurring in response to recent climate changes in many
parts of the world (Rosenzweig et al., 2008), with average poleward
shifts in species’ range boundaries of 6 km per decade being reported
(Parmesan et al., 2011).
Study of the estimated shifts of climatic zones alone can provide insights
into the types of climatic regimes to anticipate under projected future
anthropogenic climate change. By grouping different combinations and
levels of climatic variables it is possible not only to track the shifts in
the zones in which they occur, but also to identify newly emerging
combinations of conditions not found at the present day as well as
combinations that may not survive global climate change (known
respectively as novel and disappearing climates; Williams et al., 2007;
see also Section 19.5.1). These analyses can help define what types of
climatic niches may be available in the future and where they will be
located. Such a spatial analog approach can delimit those regions that
might currently or potentially (in the future) be susceptible to invasion
by undesirable aquatic (e.g., EPA, 2008) or terrestrial (e.g., Mainka and
Howard, 2010) alien species or alternatively might be candidates for
targeting translocation (assisted colonization) of species endangered
in their native habitats (e.g., Brooker et al., 2011; Thomas, 2011). However,
there are many questions about the viability of such actions, including
genetic implications (e.g., Weeks et al., 2011), inadvertent transport of
pests or pathogens with the introduced stock (e.g., Brooker et al., 2011),
and risk of invasiveness (e.g., Mueller and Hellmann, 2008).
The ability of species to migrate with climate change must next be judged,
in the first instance, against the rate at which the climatic zones shift over
space (e.g., Loarie et al., 2009; Burrows et al., 2011; Diffenbaugh and
Field, 2013; see also Section 4.3.2.5). For projecting potential future
species shifts, this is the most straightforward part of the calculation.
In contrast, the ecological capacity of species to migrate is a highly
complex function of factors, including their ability to:
• Reproduce, propagate, or disperse
• Compete for resources
•
Adapt to different soils, terrain, water quality, and day length
• Overcome physical barriers (e.g., mountains, water/land obstacles)
• Contend with obstacles imposed by human activity (e.g., land use,
pollution, or dams).
Conservation policy under a changing climate is largely a matter of
promoting the natural adaptation of ecosystems, if this is even feasible
for many species given the rapidity of projected climate change. Studies
stress the risks of potential mismatching in responses of co-dependent
species to climate change (e.g., Schweiger et al., 2012) as well as the
importance of maintaining species diversity as insurance for the provision
of basic ecosystem services (e.g., Traill et al., 2010; Isbell et al., 2011).
Four priorities have been identified for conservation stakeholders to
apply to climate change planning and adaptation (Heller and Zavaleta,
2009): (1) regional institutional coordination for reserve planning and
management and to improve landscape connectivity; (2) a broadening
of spatial and temporal perspectives in management activities and
practice, and actions to enhance system resilience; (3) mainstreaming
of climate change into all conservation planning and actions; and (4)
holistic treatment of multiple threats and global change drivers, also
accounting for human communities and cultures. The regional aspects
of conservation planning transcend political boundaries, again arguing
for a regional (rather than exclusively national) approach to adaptation
policy. This issue is elaborated in Sections 4.4.2 and 19.4.2.3.
21.5. Analysis and Reliability of
Approaches to Regional Impacts,
Adaptation, and Vulnerability Studies
Assessing climate vulnerability or options for adapting to climate impacts
in human and natural systems requires an understanding of all factors
influencing the system and how change may be effected within the
system or applied to one or more of the external influencing factors.
This will require, in general, a wide range of climate and non-climate
information and methods to apply this to enhance the adaptive capacity
of the system.
There are both areas of commonality across and differences between
regions in the information and methods, and these are explored in this
section. It initially focuses on advances in methods to study vulnerability
and adaptive capacity and to assess impacts (studies of practical
adaptation and the processes of adaptation decision making are treated
in detail in Chapters 14 to 17, so not addressed here). This is followed
by assessments of new information on, and thinking related to, baseline
and recent trends in factors needed to assess vulnerability and define
impacts baselines, and future scenarios used to assess impacts, changes
in vulnerability, and adaptive capacity; and then assessment of the
credibility of the various types of information presented.
21.5.1. Analyses of Vulnerability and Adaptive Capacity
Multiple approaches exist for assessing vulnerability and for exploring
adaptive capacity (UNFCCC, 2008; Schipper et al., 2010). The choice of
method is influenced by objectives and starting point (see Table 21-3)
as well as the type of information available. Qualitative assessments

1177
Regional Context Chapter 21
21
u
sually draw on different methods and inputs from quantitative
assessments. Qualitative information cannot always be translated to
quantitative information, or vice versa, yet both approaches can
sometimes be used to answer the same questions. Indicators, indices,
and mapping are the most common ways to aggregate the resulting
vulnerability and adaptive capacity information to compare across regions
(Section 21.5.1.1) or to identify “hotspots” (Section 21.5.1.2).
21.5.1.1. Indicators and Indices
Several attempts have been made to develop vulnerability indicators
and indices (Atkins et al., 2000; Downing et al., 2001; Moss et al., 2001;
Villa and McLeod, 2002; Lawrence et al., 2003; Luers et al., 2003;
Cardona, 2007; Barr et al., 2010; Birkmann, 2011; Chen et al., 2011).
Representation on a map or through an index is a common way to
depict global vulnerability information and requires quantification of
selected variables in order to measure them against a selected baseline,
even though quantification of some qualitative information may not
be possible (Luers et al., 2003; Edwards et al., 2007; Hinkel, 2011).
Vulnerability is differentiated according to factors such as gender, age,
livelihood, or access to social networks, among many other factors
(Wisner et al., 2004; Cardona et al., 2012), which may not be represented
accurately through some indicators.
One approach used to create regional comparisons is to use indices,
which are composites of several indicators thought to contribute to
vulnerability, each normalized and sometimes weighted so they can be
combined (Adger et al., 2004; Rygel et al., 2006). The approach has been
critiqued extensively because the weights assigned the indicators depend
on expert opinion which can result in different regions appearing more or
less vulnerable, as Füssel (2010b) found in reviewing global vulnerability
maps based on different indices.
Vulnerability indices developed to date have failed to reflect the
dynamic nature of component indicator variables. This is illustrated by
the (in)ability to characterize how the selected indicators contribute to
determining vulnerability over time. Significantly, the relative importance
of the indicator may change from season-to-season (e.g., access to
irrigation water) or may gradually or rapidly become obsolete. Hinkel’s
(2011) review of literature on vulnerability indicators suggests that
vulnerability has been confused as a proxy for unsustainable or insufficient
development so that simple measurements are seen as sufficient to tell
a story about vulnerability. Hinkel (2011) suggests that the simplification
of information to create vulnerability indicators is what limits their
utility.
Indicator systems have also been developed to improve understanding
of adaptive capacity. These are used both to measure adaptive capacity
and identify entry points for enhancing it (Adger and Vincent, 2005;
Eriksen and Kelly, 2007; Swanson et al., 2007; Lioubimtseva and Henebry,
2009; Adaptation Sub-Committee, 2011). For example, the Global
Adaptation Index, developed by the Global Adaptation Alliance (GAIN,
n.d.), uses a national approach to assess vulnerability to climate change
and other global challenges and compare this with a country’s “Readiness
to improve resilience” (GAIN, n.d.) to assist public and private sectors
to prioritize financial investments in adaptation activities.
21.5.1.2. Hotspots
A special case of the use of indicators concerns the identification of
hotspots, a term originally used in the context of biodiversity, where a
“biodiversity hotspot” is a biologically diverse region typically under
threat from human activity, climate change, or other drivers (Myers,
1988). The term typically relates to a geographical location, which
emerges as a concern when multiple layers of information are compiled
to define it. In climate change analysis, hotspots are used to indicate
locations that stand out in terms of impacts, vulnerability, or adaptive
capacity (or all three). Examples of hotspot mapping include how climate
change can influence disease risk (de Wet et al., 2001), extinctions of
endemic species (Malcolm et al., 2006), and disaster risk (Dilley, 2006).
Hotspots analysis is used to serve various purposes, such as setting
priorities for policy action, identifying focal regions for further research
(Dilley, 2006; Ericksen et al., 2011; de Sherbinin, 2013; see also www.
climatehotmap.org), or, increasingly, helping distinguish priority locations
for funding. Examples of the latter purpose include guiding the allocation
of global resources to pre-empt, or combat, disease emergence (Jones
et al., 2008) or funding for disaster risk management (Arnold et al.,
2005). Because identifying hotspots raises important methodological
issues about the limitation of using indicators to integrate quantitative
impacts with qualitative dimensions of vulnerability, their use to compare
regions leads to a subjective ranking of locations as having priority for
climate change investment. This can be controversial and considered
politically motivated (Klein, 2009).
Certain locations are considered hotspots because of their regional or
global importance. These can be defined by population size and growth
rate, contributions to regional or global economies, productive significance
(e.g., food production) as well as by disaster frequency and magnitude,
and projected climate change impacts. The choice of variables may
result in different locations being identified as hotspots (Füssel, 2009).
For example, the Consultative Group on International Agricultural
Research (CGIAR) Research Program on Climate Change Agriculture and
Food Security (CCAFS) mapped hotspots of food insecurity and climate
change in the tropics (Ericksen et al, 2011) using stunted growth as a
proxy for food security, but other variables could also have been
selected. Scale matters in representing hotspots and they will look
different on a global scale than on a finer scale (Arnold et al., 2006).
The rationale for identifying such hotspots is that they may gradually
evolve into locations of conflict or disaster, where a combination of
factors leads to the degradation of resources and social fabric. Climate
change hotspots have been defined as locations where impacts of climate
change are “well pronounced and well documented” (UCS, 2011). A
climate change hotspot can describe (1) a region for which potential
climate change impacts on the environment or different activity sectors
can be particularly pronounced or (2) a region whose climate is especially
responsive to global change (Giorgi, 2006). An example of the former
is given by Fraser et al. (2013), combining hydrological modeling with
quantitatively modeled adaptive capacity (defined as the inverse of
sensitivity to drought) to identify vulnerability hotspots for wheat and
maize. Examples of the latter are given by Giorgi (2006), Diffenbaugh et
al. (2008), Giorgi and Bi (2009), Xu et al. (2009), Diffenbaugh and Scherer
(2011), and Diffenbaugh and Giorgi (2012), who used different regional
climate change indices, including changes in mean and interannual

1178
Chapter 21 Regional Context
21
v
ariability of temperature and precipitation and metrics of seasonal
extremes, to identify the Mediterranean Basin, Central America, Central
and West Africa, the Northern high latitude regions, the Amazon, the
southwestern USA, Southeast Asia, and the Tibetan Plateau as prominent
hotspots.
2
1.5.2. Impacts Analyses
In recent years, there has been increased scrutiny of the methods and
tools applied in impact assessment, especially quantitative models that
are used to project the biophysical and socioeconomic impacts of future
climate change (see Section 2.3.2.1), but also encompassing qualitative
methods, including studies of indigenous knowledge (Section 12.3.3).
In an advance from previous assessments, different types of impact
models are now being applied for the first time in many regions of the
world. This is largely due to burgeoning international development
support for climate change vulnerability and adaptation studies
(Fankhauser, 2010). It is also related to a surge of interest in regional
economic assessments in the wake of the Stern review (Stern, 2007) as
well as to the evolution of climate models into Earth system models
that incorporate a more realistic representation of land surface
processes (Flato et al., 2014) and their increased application to study
hydrological (Section 3.4.1), ecophysiological (Section 4.3.3), and
cryospheric (Vaughan et al., 2014) impacts.
Potential impacts have been simulated for single as well as multiple
sectors, at spatial scales ranging from site or household to global, and over
a range of temporal scales and time horizons (Table 21-5). A majority
of impact studies still follow the conventional approach where future
impacts are modelled based on a set of assumptions (scenarios) about
future climate and socioeconomic conditions (see Section 21.2.3, lefthand
side of Table 21-3). However, an increasing number are being undertaken
that follow a “socio-institutional” approach to adaptation planning
(Downing, 2012), righthand side of Table 21-3, which emphasizes the
importance of adaptive flexibility and climate resilience given the often
intractable, “deep” uncertainties implicit in many projections of future
change (Donley et al., 2012; Garrett et al., 2013; Gersonius et al., 2013).
Impact modeling studies also commonly treat aspects of adaptation,
either explicitly as modeled options or implicitly as built-in autonomous
responses (Dickinson, 2007; White et al., 2011). Furthermore, as an
anthropogenic signature is attributed to ongoing climate changes in
many regions (Bindoff et al., 2014), and with growing evidence that
these changes are having impacts on natural and human systems in
many more regions than reported in the AR4 (Chapter 18; Rosenzweig
and Neofotis, 2013), it is now possible in some regions and sectors to
test impact models’ projections against observed impacts of recent
climate change (e.g., Araújo et al., 2005; Barnett et al., 2008; Lobell et
al., 2011). This is also an essential element in the attribution of observed
impacts (Sections 18.3-5).
Uncertainties in and Reliability of Impacts Analyses
Literature on uncertainty in impacts analyses has focused mainly on the
uncertainties in impacts that result from the uncertainties in future
c
limate (Mearns et al., 2001; Carter et al., 2007), and this literature
continues to grow since AR4, particularly in the realm of agriculture and
water resources (e.g., Ferrise et al., 2011; Littell et al., 2011; Wetterhall
et al., 20011; Ficklin et al., 2012; Osborne et al., 2013), but also in other
areas such as flood risk (Ward et al., 2013). Furthermore, research has
advanced to establish which future climate uncertainties are most
important to the resultant uncertainties about crop yields (e.g., Lobell and
Burke, 2008) and to apply future resource uncertainties to adaptation
studies (Howden et al., 2007). Use of multiple global or regional model
scenarios is now found in many more studies (e.g., Arnell, 2011; Bae et al.,
2011; Gosling et al., 2011; Olsson et al., 2011), and the use of probabilistic
quantification of climate uncertainties has produced estimates of
probabilities of changes in future resources such as agriculture and
water (e.g., Tebaldi and Lobell, 2008; Watterson and Whetton, 2011).
Some studies have developed probability distributions of future impacts
by combining results from multiple climate projections and, sometimes,
different emissions scenarios, making different assumptions about the
relative weight to give to each scenario (Brekke et al., 2009). Nobrega
et al. (2011) apply six different GCMs and four different SRES emissions
scenarios to study the impacts of climate change on water resources in
the Rio Grande Basin in Brazil and found that choice of GCM was the
major source of uncertainty in terms of river discharge.
With an ever-increasing number of impacts’ projections appearing in the
literature and the unprecedented rate and magnitude of climate change
projected for many regions, some authors have begun to question both
the robustness of the impacts models being applied (e.g., Heikkinen et
al., 2006; Fitzpatrick and Hargrove, 2009; Watkiss, 2011a) as well as the
methods used to represent key uncertainties in impacts’ projections
(e.g., Arnell, 2011; Rötter et al., 2011; White et al., 2011). This is being
addressed through several prominent international research efforts:
AgMIP, involving crop and economic models at different scales
(Rosenzweig et al., 2013), the Carbon Cycle Model Intercomparison
Project (C4MIP; Friedlingstein et al., 2006; Sitch et al., 2008; Arora et
al., 2013), and the Water Model Intercomparison Project (WaterMIP;
Haddeland et al., 2011). Modeling groups from these projects are also
participating in the ISI-MIP, initially focusing on intercomparing global
impact models for agriculture, ecosystems, water resources, health, and
coasts under RCP- and SSP-based scenarios (see Box 21-1) with regional
models being considered in a second phase of work (Schiermeier, 2012).
AgMIP results for 27 wheat models run at contrasting sites worldwide
indicate that projections of yield to the mid-21st century are more sensitive
to crop model differences than to global climate model scenario differences
(Asseng et al., 2013; Carter, 2013). WaterMIP’s analysis of runoff and
evapotranspiration from five global hydrologic and six land surface
models indicate substantial differences in the models’ estimates in these
key parameters (Haddelenad et al., 2011). Finally, as in climate modeling,
researchers are now applying multiple impact model and perturbed
parameter ensemble approaches to future projections (e.g., Araújo and
New, 2007; Jiang et al., 2007; Palosuo et al., 2011), usually in combination
with ensemble climate projections treated discretely (e.g., New et al.,
2007; Graux et al., 2013; Tao and Zhang, 2013) or probabilistically (e.g.,
Luo et al., 2007; Fronzek et al., 2009, 2011; Børgesen and Olesen, 2011;
Ferrise et al., 2011; Wetterhall et al., 2011).
These new impact MIPs, and similar initiatives, have the common purpose
of mobilizing the research community to address some long-recognized

1179
Regional Context Chapter 21
21
b
ut pervasive problems encountered in impact modeling. A sample of
recent papers illustrate the variety of issues being highlighted, for
example, forest model typology and comparison (Medlyn et al., 2011),
crop pest and disease modeling and evaluation (Sutherst et al., 2011;
Garrett et al., 2013), modeling responses to extreme weather events
(Lobell et al., 2010; Asseng et al., 2013), field experimentation for model
calibration and testing (Long et al., 2006; Craufurd et al., 2013), and
data quality considerations for model input and calibration (Lobell,
2013). Greater attention is also being paid to methods of economic
evaluation of the costs of impacts and adaptation at scales ranging
from global (e.g., UNFCCC, 2007; Nelson et al., 2009b; Parry et al., 2009;
Fankhauser, 2010; Füssel, 2010a; Patt et al., 2010), through regional
(e.g., EEA, 2007; World Bank, 2010b; Ciscar et al., 2011; Watkiss, 2011b),
to national (SEI, 2009; Watkiss et al., 2011) and local levels (e.g., Perrels
et al., 2010).
21.5.3. Development and Application
of Baseline and Scenario Information
21.5.3.1. Baseline Information: Context,
Current Status, and Recent Advances
This section deals with defining baseline information for assessing climate
change IAV. The baseline refers to a reference state or behavior of a
system, for example, current biodiversity of an ecosystem, or a reference
state of factors (e.g., agricultural activity, climate) that influence that
system (see Glossary). For example, the UNFCCC defines the preindustrial
baseline climate, prior to atmospheric composition changes from its
baseline preindustrial state, as a reference for measuring global average
temperature rises. A baseline may be used to characterize average
conditions and/or variability during a reference period, or may allude to
a single point in time, such as a reference year. It may provide information
on physical factors such as climate, sea level, or atmospheric composition,
or on a range of non-climate factors, such as technological, land use, or
socioeconomic conditions. In many cases a baseline needs to capture
much of a system’s variability to enable assessment of its vulnerability
or to test whether significant changes have taken place. Thus the
information used to establish this baseline must account for the variability
of the factors influencing the system. In the case of climate factors often
this requires 30 years of data (e.g., Jones et al., 1997) and sometimes
substantially more (e.g., Kendon et al., 2008). In addition, temporal and
spatial properties of systems will influence the information required. Many
depend on high-resolution information, for example, urban drainage
systems (high spatial scales) or temperature-sensitive organisms (sub-
daily time scales). This section assesses methods to derive relevant
climatic and non-climatic information and its reliability.
21.5.3.1.1. Climate baselines and their credibility
Observed weather data are generally used as climate baselines, for
example, with an impacts model to form a relevant impacts baseline,
though downscaled climate model data are now being used as well. For
example, Bell et al. (2012) use dynamically and statistically downscaled
hourly rainfall data with a 1-km river flow model to generate realistic
high-resolution baseline river flows. These were then compared with
f
uture river flows derived used corresponding downscaled future climate
projections to generate projected impacts representing realistic responses
to the imposed climate perturbations. This use of high-resolution data
was important to ensure that changes in climate variability that the
system was sensitive to were taken into account (see also Hawkins et
al., 2013). Underscoring the importance of including the full spectrum
of climate variability when assessing climate impacts, Kay and Jones
(2012) showed a greater range of projected changes in UK river flows
resulted when using high time resolution (daily rather than monthly)
climate data.
Thus to develop the baseline of a climate-sensitive system it is important
to have a good description of the baseline climate, thus including
information on its variability on time scales of days to decades. This
has motivated significant efforts to enhance the quality, length, and
homogeneity of, and make available, observed climate records (also
important for monitoring, detecting, and attributing observed climate
change; Bindoff et al., 2014; Hartmann et al., 2014; Masson-Delmotte
et al., 2014; Rhein et al., 2014; Vaughan et al., 2014). This has included
generating new data sets such as Asian Precipitation – Highly Resolved
Observational Data Integration Towards Evaluation (APHRODITE, a gridded
rain-gauge based data set for Asia; Yatagai, et al., 2012), coordinated
analyses of regional climate indices and extremes by Climate Variability
and Predictability Programme (CLIVAR)’s Expert Team on Climate Change
Detection and Indices (ETCCDI) (see, e.g., Zhang et al., 2011), and data
rescue work typified by the Atmospheric Circulation Reconstructions
over the Earth (ACRE) initiative (Allan et al., 2011), resulting in analysis
and digitization of many daily or sub-daily weather records from all over
the world. Also, estimates of uncertainty in the observations are either
being directly calculated, for example, for the Hadley Centre/climatic
research unit gridded surface temperature data set 4 (HadCRUT4) near-
surface temperature record (Morice et al., 2012), or can be generated
from multiple data sets, for example, for precipitation using data sets
such as Global Precipitation Climatology Centre (GPCC; Rudolf et al.,
2011), Tropical Rainfall Measuring Mission (TRMM; Huffman et al.,
2010), and APHRODITE (Yatagi et al., 2012).
Significant progress has also been made in developing improved and
new global reanalyses. These use climate models constrained by long time
series of observations from across the globe to reconstruct the temporal
evolution of weather patterns during the period of the observations. An
important new development has been the use of digitized surface
pressure data from ACRE by the 20th Century Reanalysis (20CR) project
(Compo et al., 2011) covering 1871 to the present day. 20CR provides
the basis for estimating historical climate variability from the sub-daily
to the multi-decadal time scale (Figure 21-12) at any location. It can be
used directly, or via downscaling, to develop estimates of the baseline
sensitivity of a system to climate and addressing related issues such as
establishing links between historical climate events and their impacts.
Other advances in reanalyses (http://reanalyses.org) have focused on
developing higher quality reconstructions for the recent past. They
include a new European Centre for Medium Range Weather Forecasts
Reanalyses (ERA) data set, ERA-Interim (Dee et al., 2011), and the
NASA Modern Era Reanalysis for Research and Applications (MERRA;
Rienecker et al., 2011), 1979 to the present, the National Centers for
Environmental Prediction (NCEP) Climate Forecast System Reanalysis
(CFSR), 1979 to January 2010 (Saha et al., 2010), and regional reanalyses
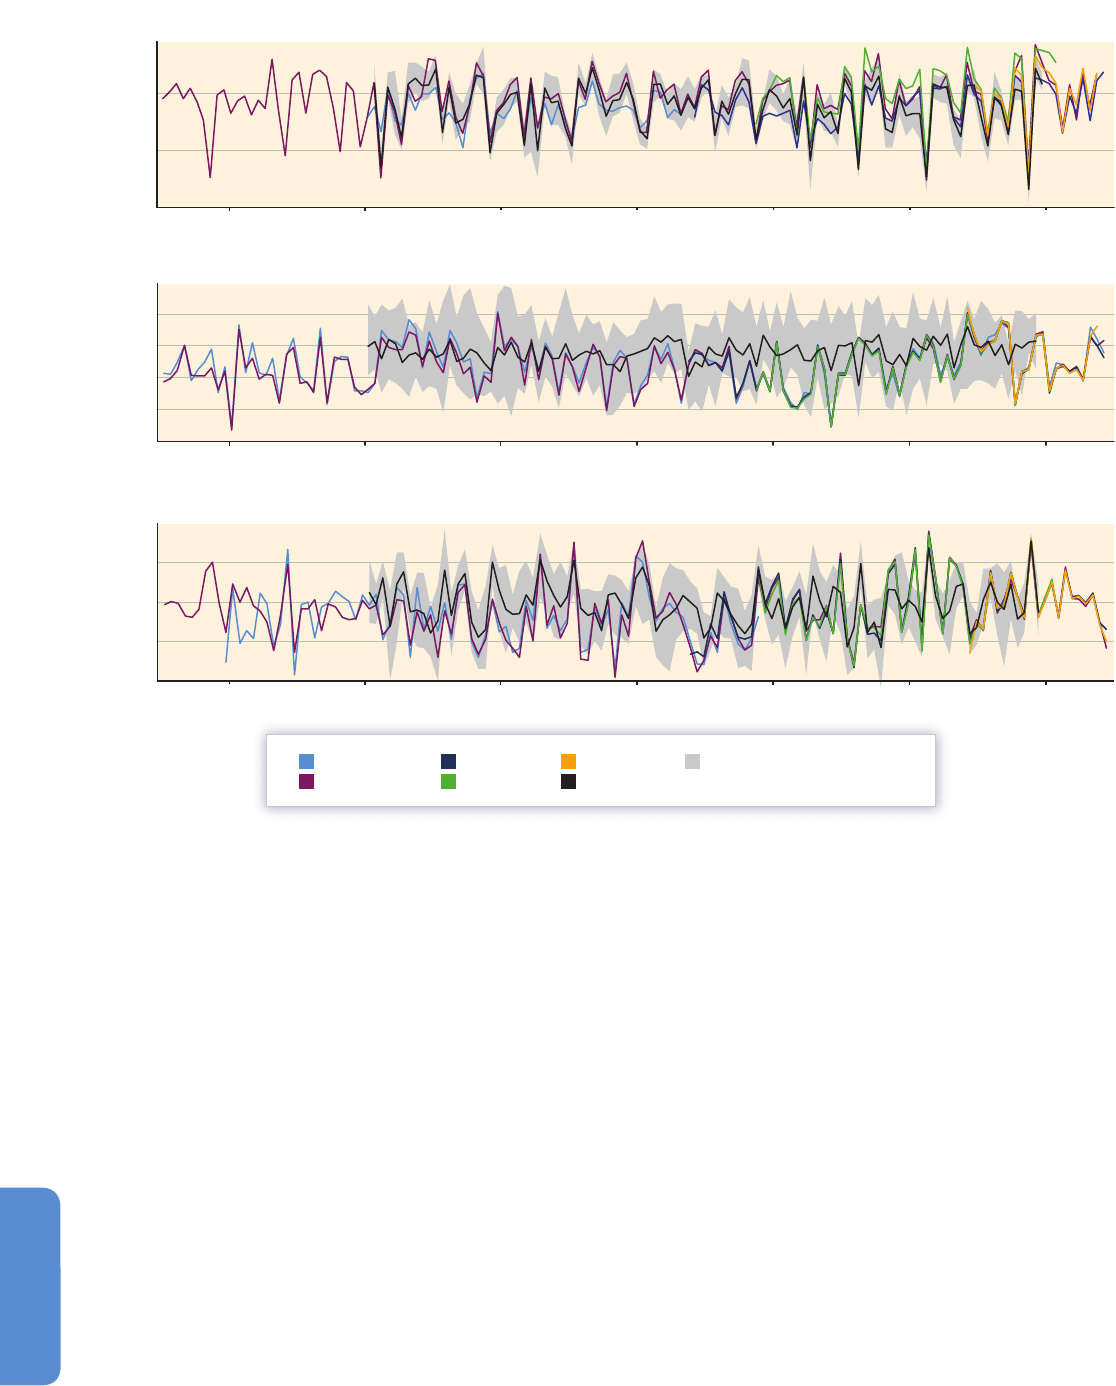
1180
Chapter 21 Regional Context
21
such as the North American Regional Reanalysis (NARR; Mesinger et
al., 2006) and European Reanalysis and Observations for Monitoring
(EURO4M; http://www.euro4m.eu/).
In many regions high temporal and spatial resolution baseline climate
information is not available (e.g., World Weather Watch, 2005; Washington
et al., 2006). Recent reanalyses may provide globally complete and
temporally detailed reconstructions of the climate of the recent past
but generally lack the spatial resolution or have significant biases (Thorne
and Vose, 2010; Cerezo-Mota et al., 2011; Dee et al., 2011). Downscaling
the reanalyses can be used with available observations to estimate the
error in the resulting reconstructions, which can often be significant
(Duryan et al., 2010; Mearns et al., 2012). Advances in this area are
expected through the World Climate Research Programme (WCRP)-
sponsored Coordinated Regional Downscaling Experiment (CORDEX)
project (http://wcrp.ipsl.jussieu.fr/SF_RCD_CORDEX.html; Giorgi et al.,
2009), which includes downscaling ERA-Interim over all land and
enclosed sea areas (e.g., Nikulin et al. 2012).
21.5.3.1.2. Non-climatic baselines and their credibility
Climate-sensitive systems can be influenced by many non-climatic factors,
so information on the baseline state of these factors is also commonly
required (Carter et al., 2001, 2007). Examples of physical non-climatic
factors include availability of irrigation systems, effectiveness of disease
4
2
0
–2
–6
–4
(a) The tropical September to January Pacific Walker Circulation (PWC)
0.04
0.00
–0.04
b
ase period 1989–1999
1900 1920 1940 1960 1980 2000
2
1
0
–1
–2
1880
REC/HadSLP
20CR Vers. 2
NNR
ERA-40
ERA-INT
SOCOL
(b) The December to March North Atlantic Oscillation (NAO)
(c) The December to March Pacific North American (PNA) pattern
ω (Pa/s)
Ensemble mean and spread
from a climate model ensemble
Figure 21-12 | Time series of seasonally averaged climate indices representing three modes of large-scale climate variability: (a) the tropical September to January Pacific Walker
Circulation (PWC); (b) the December to March North Atlantic Oscillation (NAO); and (c) the December to March Pacific North America (PNA) pattern. Indices (as defined in
Brönnimann et al., 2009) are calculated (with respect to the overlapping 1989–1999 period) from various observed, reanalysis, and model sources: statistical reconstructions of
the PWC, the PNA, and the NAO (blue); 20th Century Reanalysis (20CR, purple); National Centers for Environmental Prediction–National Center for Atmospheric Research
(NCEP–NCAR) reanalyses (NNR, dark blue); European Centre for Medium Range Weather Forecasts 40-Year Reanalysis (ERA-40, green); and ERA-Interim (orange). The black line
and gray shading represent the ensemble mean and spread from a climate model ensemble with a lower boundary condition of observed sea surface temperatures and sea ice
from the Hadley Centre Interpolated sea surface temperature (HadISST) data set (Rayner et al., 2003); see Brönnimann et al. (2009) for details. The model results provide a
measure of the predictability of these modes of variability from sea surface temperature and sea ice alone and demonstrate that the reanalyses have significantly higher skill in
reproducing these modes of variability.

1181
Regional Context Chapter 21
21
p
revention, or flood protection. Examples of socioeconomic factors
include levels of social, educational, and economic development, political/
governance background, and available technology. Significant work has
been undertaken to collect and make this information available. Local
and national governments and international agencies (e.g., UN agencies,
World Bank) have been collecting data (http://data.worldbank.org/data-
catalog) on the human-related factors for many decades and similarly
information on technological developments is widely available. Often
these factors are evolving quickly and the baseline is taken as the
reference state at a particular point in time rather than aggregated over
a longer period. In the case of the physical factors, information on many
of these have been refined and updated as they are critical inputs to
deriving the climate forcings in the RCPs (van Vuuren et al., 2011) used
in CMIP5 (Taylor et al., 2012). This includes updated information on land
use change (Hurtt et al., 2011), atmospheric composition (Meinshausen
et al., 2011) and aerosols (Grainer et al., 2011; Lamarque et al., 2011).
The importance of establishing an appropriate physical baseline is
illustrated in a study of potential climate change impacts on flow in the
River Thames in the UK over a 126-year period. No long-term trend is
seen in annual maximum flows despite increases in temperature and a
major change in the seasonal partitioning of rainfall, winter rainfall
becoming larger than summer (Marsh, 2004). An investigation of the
physical environment found that it had been significantly modified as part
of river management activities, with increases in channel capacity of 30%
over 70 years leading to fewer floods. Thus establishing a baseline for
river channel capacity explained the current reduced vulnerability of the
Thames to flooding. In a study of the potential for crop adaptation
(Challinor et al., 2009), the relevant non-climatic factor identified was
technological. Detailed field studies demonstrated that the current
germplasm included varieties with a wide range of tolerance to higher
temperatures (Badigannavar et al., 2002). This established an agricultural
technology baseline, current crop properties, which demonstrated the
potential to reduce vulnerability in the system to compensate for the
projected climate change impact.
21.5.3.2. Development of Projections and Scenarios
Since the AR4 there have been several new developments in the realm
of scenarios and projections: (1) a new approach to the construction of
global scenarios for use in climate change analysis, initiated with the
development of RCPs (see Box 21-1 for a full description); (2) the
development and application of a greater number of higher resolution
climate scenarios (Section 21.3.3.2); and (3) further use of multiple
scenario elements as opposed to use of climate change scenarios only
and greater focus on multiple stressors.
21.5.3.2.1. Application of high-resolution
future climate information
There are now many examples of the generation and application of
high-resolution climate scenarios for assessing impacts and adaptation
planning. These provide information at resolutions relevant for many
impacts and adaptation studies but also, particularly with regard to
dynamical downscaling, account for higher resolution forcings, such as
c
omplex topography (e.g., Salathé et al., 2010) or more detailed land-
atmosphere feedbacks such as in West Africa (Taylor et al., 2011). In an
analysis of climate impacts including possible adaptations in the Pacific
Northwest of North America (Miles et al., 2010) application of two
dynamically downscaled scenarios was particularly useful for the
assessment of effects of climate change on stormwater infrastructure
(Rosenberg et al., 2010). More widely in North America results from
NARCCAP have been used to assess impacts of climate change on
available wind energy (Pryor and Barthelmie, 2011), road safety (Hambly
et al., 2012), hydrology (Burger et al., 2011; Shrestha et al., 2012), forest
drought (Williams et al., 2013), and human health (Li et al., 2012).
Several European-led projects have generated and applied high-
resolution climate scenarios to investigate the impacts of climate change
over Europe for agriculture, river flooding, human health, and tourism
(Christensen et al., 2012) and on energy demand, forest fire risk, wind
storms damage, crop yields, and water resources (Morse et al., 2009).
The UK developed new UK Climate Projections in 2009 (UKCP09)
combining the CMIP3, a perturbed physics GCM, and a regional climate
model ensemble to develop probabilities of changes in temperature and
precipitation at a 25-km resolution (Murphy et al., 2009) to determine
probabilities of different impacts of climate change and possible
adaptations. In general, with all of this work, a range of different
techniques have been used with little assessment or guidance on the
relative merits of each.
21.5.3.2.2. Use of multiple scenario elements
and focus on multiple stressors
Many more impacts and adaptation studies now use multiple scenario
elements, and focus on multiple stressors as opposed to climate change
scenarios and effects alone (e.g., Sections 3.3.2, 4.2.4, 7.1.2). Good
examples of use of multiple scenario elements involve studies of climate
change and human health considering additional factors such as urban
heat island (e.g., Knowlton et al., 2008; Rosenzweig et al., 2009),
population increase and expanded urban areas (McCarthy et al., 2010),
and population and socioeconomic conditions (Watkiss and Hunt,
2012). As these studies are often undertaken at small scales, local scale
information on relevant factors may be inconsistent with larger scale
scenario elements used in quantifying other stressors. In recognition of
this, efforts have been or are being made to downscale the large-scale
scenario elements, for example, the SRES scenarios were downscaled for
Europe (van Vuuren and O’Neill, 2006), and economic activity information
has been downscaled to 0.5° grids in some regions (Gaffin et al., 2004;
Grübler et al., 2007; van Vuuren et al., 2010). However, this information
is far from comprehensive and has not yet been examined carefully in
the impacts and vulnerability literature (van Ruijven et al., 2013).
Typical non-climate stressors include changes in population, migration,
land use, economic factors, technological development, social capital,
air pollution, and governance structures. They can have independent,
synergistic, or antagonistic effects and their importance varies regionally.
Land use and socioeconomic changes are stressors of equal importance
to climate change for some studies in Latin America (Section 27.2.2.1);
numerous changes in addition to climate strongly affect ocean ecosystem
health (Section 6.6.1); and in Asia rapid urbanization, industrialization,

1182
Chapter 21 Regional Context
21
a
nd economic development are identified as major stressors expected
to be compounded by climate change in (Sections 24.4.1-7). Most
multiple stressor studies are regional or local in scope. For example,
Ziervogel and Taylor (2008) examined two different villages in South
Africa and found that a suite of stressors are present such as high
unemployment, health status (e.g., increased concern about AIDs), and
access to education, with climate change concerns present only in the
context of other impacts such as availability of water. In a study on the
Great Lakes region, additional stressors included land use change,
population increase, and point source pollution (Danz et al., 2007).
Mawdesly et al. (2009) considered wildlife management and biodiversity
conservation and noted that reducing pressure from other stressors can
maximize flexibility for adaptation to climate change. This increased
focus on multiple stressors obviously increases the need for a much
wider range of data and wider range of projections for the wide range
of stressors, across multiple spatial scales.
21.5.3.3. Credibility of Projections and Scenarios
21.5.3.3.1. Credibility of regional climate projections
Obtaining robust regional projections of climate change (i.e., at least a
clear indication of the direction of change), requires combining projections
with detailed analysis and understanding of the drivers of the changes.
The most successful example of this is the application of the attribution
of observed global and regional temperature changes using global models
i
ncorporating known natural and anthropogenic climate forcing factors
(Flato et al., 2014; see also WGI AR5 Section 10.3). The ability of GCMs to
reproduce the observed variations in temperature and the quantification
of the influence of the different forcings factors and how well these
influences are captured in the models provide confidence that models
capture correctly the physical processes driving the changes. This can
also provide confidence in projections of precipitation when physically
linked to changes in temperature (Rowell and Jones, 2006; Kendon et
al., 2010). It is important, especially with precipitation where regional
change may appear to differ in direction from one model to another, to
distinguish when changes are significant (Tebaldi et al., 2011; Collins et
al., 2014b; see also WGI AR5 Box 12.1). Significant future projections of
opposite direction are found, with neither possibility able to be excluded
on the basis of our physical understanding of the drivers of these changes.
For example, McSweeney et al. (2012) found that in an ensemble of
GCM projections over Southeast Asia, all models simulated the important
monsoon processes and rainfall well but projected both positive and
negative changes in monsoon precipitation and significantly different
patterns of change.
Model trends or projections may also be inconsistent with trends in
available observations and in these cases, their projections are less
credible. For example, the magnitude of the significant drying trend seen
in the Sahel from the 1960s to the 1990s is not captured by models
driven by observed sea surface temperatures (SSTs) (e.g., Held et al. 2005)
despite statistical analysis demonstrating the role of SSTs in driving
Sahel rainfall variability. Thus our understanding of the system and its
Frequently Asked Questions
FAQ 21.4 | Is the highest resolution climate projection the best
to use for performing impacts assessments?
A common perception is that higher resolution (i.e., more spatial detail) equates to more useable and robust
information. Unfortunately data does not equal information, and more high-resolution data does not necessarily
translate to more or better information. Hence, while high-resolution Global Climate Models (GCMs) and many
downscaling methods can provide high-resolution data, and add value in, for example, regions of complex topography,
it is not a given that there will be more value in the final climate change message. This partially depends on how
the higher resolution data were obtained. For example, simple approaches such as spatial interpolation or adding
climate changes from GCMs to observed data fields do increase the spatial resolution but add no new information
on high-resolution climate change. Nonetheless, these data sets are useful for running impacts models. Many impacts
settings are somewhat tuned to a certain resolution, such as the nested size categorizations of hydrologic basins
down to watershed size, commonly used in hydrologic modeling. Using dynamical or statistical downscaling methods
will add a new high-resolution component, providing extra confidence that sub-GCM scale processes are being
represented more accurately. However, there are new errors associated with the additional method applied that
need to be considered. More importantly, if downscaling is applied to only one or two GCMs then the resulting
high-resolution scenarios will not span the full range of projected changes that a large GCM ensemble would
indicate are plausible futures. Spanning that full range is important in being able to properly sample the uncertainty
of the climate as it applies in an impacts context. Thus, for many applications, such as understanding the full envelope
of possible impacts resulting from our current best estimates of regional climate change, lower resolution data
may be more informative. At the end of the day, no one data set is best, and it is through the integration of multiple
sources of information that robust understanding of change is developed. What is important in many climate change
impacts contexts is appropriately sampling the full range of known uncertainties, regardless of spatial resolution.
It is through the integration of multiple sources of information that robust understanding of change is developed.

1183
Regional Context Chapter 21
21
d
rivers, and their representation in the models, is incomplete, which
complicates the interpretation of future projected changes in this region
(e.g., Biasutti et al., 2008; Druyan, 2011). It implies that other processes
are important and so research is required to identify these and ensure
they are correctly represented in the models, without which projections
of rainfall changes over this region cannot be considered reliable.
21.5.3.3.2. Credibility regarding socioeconomic scenario elements
Cash et al. (2003) distinguish three criteria for linking scientific knowledge
to policy action: credibility (scientific adequacy of a policy-relevant
study), salience (relevance of a study’s findings to the needs of decision
makers), and legitimacy (the perception that the study is respectful of
divergent values and beliefs). Studies examining the performance of
scenarios in climate change research across all three of these criteria
are rare, but a general conclusion has been that much less attention is
paid to salience and legitimacy (Garb et al., 2008; Hulme and Dessai,
2008; Girod et al., 2009). Recognizing this, a new framework for global
s
cenarios has been developed (Box 21-1), providing researchers greater
freedom than hitherto for customizing information provided by global
scenarios. These innovations may pose challenges for scientific credibility,
and it is unclear how difficult it will be to bring independently developed
climate and socioeconomic projections together as scenarios in an
internally consistent manner, especially when some of these may include
fine-scale regional detail (O’Neill and Schweizer, 2011; O’Neill et al.,
2013).
Owing to the common practice for scenario development of using
narrative descriptions of alternative futures as the inspiration for
socioeconomic simulations (the Story and Simulation approach; Alcamo,
2009) it has been suggested that the exclusion of some details in
socioeconomic scenario studies can affect the internal consistency and
therefore the overall credibility of a study (e.g., Schweizer and Kriegler,
2012; Lloyd and Schweizer, 2013). Storylines can offer a point of entry
for multi-scalar scenario analyses (Rounsevell and Metzger, 2010), and
such sub-global scenario studies have been on the rise (Kok et al., 2011;
Preston et al., 2011; Sietz et al., 2011; van Ruijven et al., 2013).
Knowledge gap Research need
There is no clear understanding of how to integrate the diversity of climate change projections
data. The full associated uncertainty is weakly characterized and quantifying how much of
an observed or simulated climate change is due to internal variability or external forcings
is diffi cult in many situations. Collectively this results in data products with differing time
and space resolution and differing dependencies and assumptions that can have confl icting
messages. At present, individual products are plausible and mostly defensible insofar as they
have a physical basis within the assumptions of the method. However, at decision-relevant
scales, understanding where (or whether) the true outcome will lie within the range of
the products collectively is often not possible and thus the products are often not strongly
actionable.
Research is needed to distinguish the relative stochastic and deterministic sources of
variability and change as a function of scale, variable, and application. The need is to develop
further and build on physical understanding of the drivers of climate variability and change
and to represent these realistically within models to understand the source of the spread and
any contradictions in the regional projections at scales relevant to users, and then to provide
guidance on a likely range of outcomes within which the true response would be expected
to lie. Similarly, there is a need is to articulate the real inherent uncertainty within climate
projection data and to understand when climate information is useful at the scales of need.
This also requires stronger dialogues with users of climate information to inform choices of
variables and ways to characterize envelopes of risk and uncertainties.
The growth of multi-model, multi-method, and multi-generational data for climate projections
creates confusion for the Impacts, Adaptation, and Vulnerability (IAV) community. The lack of a
clear approach to handling this diversity leads to choosing one or another subset, where one
choice may substantially alter the IAV conclusion compared to a different subset.
Methodological and conceptual advances are needed to facilitate the synthesis of diverse
data sets on different scales from methods with different assumptions, and to integrate these
into cohesive and defensible understanding of projected regional change.
The attributes of regional climate change through which impacts are manifest, such as the
intensity, persistence, distribution, recurrence, and frequency of weather events, is poorly
understood. The information conveyed to the adaptation community is dominated by
aggregates in time and space (e.g., IPCC Special Report on Managing the Risks of Extreme
Events and Disasters to Advance Climate Change Adaptation (SREX) regional averages, or
time averages), which hide the important attributes underlying these aggregated changes. In
part this is a consequence of the fi rst row above.
The research need is to be able to demonstrate how to unpack the regional projections into
terms relevant for impacts and adaptation. For example, how is the shape of the distribution
of weather events changing (not just the extremes), or how stable are the critical global
teleconnection patterns that contribute to the variability of a region?
The historical record for many regions, especially those regions most vulnerable to climate
change, is poor to the extent that the historical record is at best an estimate with unknown
uncertainty. This severely undermines the development of regional change analysis, limits
the evaluation of model skill, and presents a weak baseline against which to assess change
signals or to develop impacts, adaptation, or vulnerability baselines.
The research need is to integrate the multiplicity of historical data as represented by the
raw observations into processed gridded products (e.g., climate research unit and Global
Precipitation Climatology Project), satellite data, and reanalysis data sets. Involving national
scientists with their inherent local knowledge and rescue and digitization of the many
national archives still inaccessible to the wider research community would signifi cantly
enhance this research activity.
Impact model sensitivity studies and intercomparison exercises are beginning to reveal
fundamental fl aws and omissions in some impact models in the representation of key
processes that are expected to be important under projected climate changes. For example,
high temperature constraints and CO
2
and drought effects on agricultural yields are poorly
represented in many crop models.
Intensifi ed efforts are needed to refi ne, test, and intercompare impact models over a
wider range of sectors and environments than hitherto. These should be supported, where
applicable, by targeted fi eld, chamber, and laboratory experiments under controlled
atmospheric composition and climate conditions, to improve understanding of key physical,
biological, and chemical processes operating in changed environments. Such experiments are
needed across a range of terrestrial and aquatic biogeographical zones in different regions of
the world.
New global scenarios are under development, based on climate projections for different
Representative Concentration Pathways (RCPs) and socioeconomic scenarios based on shared
socioeconomic pathways (SSPs). However, there is currently little or no guidance on how these
projections are to be accessed or applied in IAV studies. Moreover, as yet, quantitative SSPs
are available only for large regions (basic SSPs), and regional SSPs that are consistent with
the global SSPs (extended SSPs) along with scenarios that include mitigation and adaptation
policies (shared policy assumptions (SPAs)) have not yet been developed.
Extended SSPs for major subcontinental regions of the world, including variables that defi ne
aspects of adaptive capacity and guidance on how to combine RCP-based regional climate
projections with regional SSPs and SPAs to form plausible regional scenarios for application
in IAV analysis.
The determinants and regional variability of vulnerability, exposure, and adaptive capacity
are not well understood, and methods for projecting changes in them are underdeveloped.
Furthermore, given these lacks of understanding, uncertainties of these three elements are
poorly characterized and quantifi ed.
Case studies and underlying theory of these features of societies, and documentation of the
effectiveness of actions taken, are needed in conjunction with methods development for
projections. More attention needs to be placed on determining their uncertainties in national
and regional assessments.
Table 21-8 | Leading knowledge gaps and related research needs.

1184
Chapter 21 Regional Context
21
E
nvironmental scenario exercises crossing geographical scales suggests
that linkages between scenarios at different scales can be hard or soft
(Zurek and Henrichs, 2007), where downscaling (van Vuuren et al., 2010)
would be an example of a hard linkage while other similarities between
scenarios would be soft linkages. How to apply flexible interpretations
of scientific adequacy and maintain scenario credibility is relatively
unexplored, and there is thus a need for studies to document best
practices in this respect.
21.6. Knowledge Gaps and Research Needs
Understanding of the regional nature of climate change, its impacts,
regional and cross-regional vulnerabilities, and options for adaptation is
still at a rudimentary level. There are both fundamental and methodological
research issues in the physical sciences concerned with the projection
of regional changes in the climate system and the potential impacts of
those changes on various resource sectors and natural systems. Of equal
importance, there are also fundamental gaps in our understanding of
the determinants of vulnerability and adaptive capacity, thus presenting
methodological challenges for projecting how societal vulnerability
might evolve as the climate system changes. While development of
new scenarios is a part of the underlying research agenda, they will
inevitably be limited without further progress in our knowledge of the
determinants of vulnerability.
Table 21-8 summarizes major research gaps in the physical, ecological,
and social sciences that impede the scientific communities’ progress in
understanding the regional context of climate changes, their consequences,
and societies’ responses.
References
ABARES, 2011: Australian Mineral Statistics 2011, March Quarter 2011. ABARES
project 43133, Australian Bureau of Agricultural and Resource Economics and
Sciences (ABARES), Canberra, ACT, Australia, 37 pp.
Acosta-Michlik, L. and V. Espaldon, 2008: Assessing vulnerability of selected farming
communities in the Philippines based on a behavioural model of agent’s
adaptation to global environmental change. Global Environmental Change,
18(4), 544-563.
Adaptation Sub-Committee, 2011: Adapting to Climate Change in the UK:
Measuring Progress. Progress Report, UK Adaptation Sub-Committee,
Committee on Climate Change, London, UK, 101 pp.
ADB, 2005: Climate Proofing: A Risk-Based Approach to Adaptation. Pacific Studies
Series, Pub. Stock No. 030905, Asian Development Bank (ADB), Manila,
Philippines, 191 pp.
ADB, 2012: Addressing Climate Change and Migration in Asia and the Pacific. Final
Report, Asian Development Bank (ADB), Manila, Philippines, 82 pp.
Adger, W.N., 2006: Vulnerability. Global Environmental Change, 16(3), 268-281.
Adger, W.N. and K. Vincent, 2005: Uncertainty in adaptive capacity. Comptes Rendus
Geoscience, 337, 399-410.
Adger, W.N., N. Brooks, M. Kelly, S. Bentham, and S. Eriksen, 2004: New Indicators
of Vulnerability and Adaptive Capacity. Technical Report 7, Tyndall Centre for
Climate Change Research, University of East Anglia, Norwich, UK, 122 pp.
Agrawala, S., S. Klasen, R. Acosta Moreno, L. Barreto-Gomez, T. Cottier, A.E. Gámez-
Vázquez, D. Guan, E.E. Gutierrez-Espeleta, L. Jian, Y.G. Kim, J. Lewis, M. Messouli,
M. Rauscher, N. Uddin, and A. Venables, 2014: Regional development and
cooperation. In: Climate Change 2014: Mitigation of Climate Change.
Contribution of Working Group III to the Fifth Assessment Report of the
Intergovernmental Panel on Climate Change [Edenhofer, O., et al. (eds.)].
Cambridge University Press, Cambridge, UK and New York, NY, USA (in press).
Agyeman, J., P. Devine-Wright, and J. Prange, 2009: Close to the edge, down by the
river? Joining up managed retreat and place attachment in a climate changed
world. Environment and Planning A, 41, 509-513.
Alcamo, J. (ed.), 2008: Environmental Futures: The Practice of Environmental Scenario
Analysis. Vol. 2 of Developments in Integrated Environmental Assessment,
Elsevier, Amsterdam, Netherlands and Oxford, UK, 197 pp.
Allan, R., P. Brohan, G.P. Compo, R. Stone, J. Luterbacher, and S. Brönnimann, 2011: The
International Atmospheric Circulation Reconstructions over the Earth (ACRE)
Initiative. Bulletin of the American Meteorological Society, 92(11), 1421-1425.
Andersson, C. and M. Engardt, 2010: European ozone in a future climate: importance
of changes in dry deposition and isoprene emissions. Journal of Geophysical
Research: Atmospheres, 115(D2), D02303, doi:10.1029/2008JD011690.
Araújo, M.B. and M. New, 2007: Ensemble forecasting of species distributions. Trends
in Ecology and Evolution, 22, 42-47.
Araújo, M.B., R.J. Whittaker, R.J. Ladle, and M. Erhard, 2005: Reducing uncertainty in
projections of extinction risk from climate change. Global Ecology and
Biogeography, 14, 529-538.
Arnell, N.W., 2011: Uncertainty in the relationship between climate forcing and
hydrological response in UK catchments. Hydrology and Earth System Sciences,
15, 897-912.
Arnell, N.W., J.A. Lowe, S. Brown, S.N. Gosling, P. Gottschalk, J. Hinkel, B. Lloyd-
Hughes, R.J. Nicholls, T.J. Osborn, T.M. Osborne, G.A. Rose, P. Smith, and R.F.
Warren, 2013: A global assessment of the effects of climate policy on the
impacts of climate change. Nature Climate Change, 3, 512-519.
Arnold, M., M. Dilley, U. Deichmann, R.S. Chen, and A.L. Lerner-Lam, 2005: Natural
Disaster Hotspots: A Global Risk Analysis. Disaster Risk Management Series
No. 5, The World Bank, Hazard Management Unit, The International Bank for
Reconstruction and Development / The World Bank, Washington, DC, USA,
132 pp.
Arnold, M., R.S. Chen, U. Deichmann, M. Dilley, A.L. Lerner-Lam, R.E. Pullen, and Z.
Trohanis (eds.), 2006: Natural Disaster Hotspots: Case Studies. Disaster Risk
Management Series No. 6, The World Bank, Hazard Management Unit, The
International Bank for Reconstruction and Development / The World Bank,
Washington, DC, USA, 184 pp.
Arora, V.K., G.J. Boer, P. Friedlingstein, M. Eby, C.D. Jones, J.R. Christian, G. Bonan, L.
Bopp, V. Brovkin, P. Cadule, T. Hajima, T. Ilyina, K. Lindsay, J.F. Tjiputra, and T.
Wu, 2013: Carbon-concentration and carbon-climate feedbacks in CMIP5
Earth system models. Journal of Climate, 26, 5289-5314.
Ashfaq, M., Y. Shi, W. Tung, R.J. Trapp, X. Gao, J.S. Pal, and N.S. Diffenbaugh, 2009:
Suppression of south Asian summer monsoon precipitation in the 21
st
century.
Geophysical Research Letters, 36(1), L01704, doi:10.1029/2008GL036500.
Assan, J.K. and T. Rosenfeld, 2012: Environmentally induced migration, vulnerability
and human security: consensus, controversies and conceptual gaps for policy
analysis. Journal of International Development, 24, 1046-1057.
Asseng, S., F. Ewert, C. Rosenzweig, J.W. Jones, J.L. Hatfield, A.C. Ruane, K.J. Boote,
P.J. Thorburn, R.P. Rötter, D. Cammarano, N. Brisson, B. Basso, P. Martre, P.K.
Aggarwal, C. Angulo, P. Bertuzzi, C. Biernath, A.J. Challinor, J. Doltra, S. Gayler,
R. Goldberg, R. Grant, L. Heng, J. Hooker, L.A. Hunt, J. Ingwersen, R.C. Izaurralde,
K.C. Kersebaum, C. Müller, S. Naresh Kumar, C. Nendel, G. O’Leary, J.E. Olesen,
T.M. Osborne, T. Palosuo, E. Priesack, D. Ripoche, M.A. Semenov, I. Shcherbak,
P. Steduto, C. Stöckle, P. Stratonovitch, T. Streck, I. Supit, F. Tao, M. Travasso, K.
Waha, D. Wallach, J.W. White, J.R. Williams, and J. Wolf, 2013: Uncertainty in
simulating wheat yields under climate change. Nature Climate Change, 3,
827-832.
Athanassiadou, M., J. Baker, D. Carruthers, W. Collins, S. Girnary, D. Hassell, M. Hort,
C. Johnson, K. Johnson, R. Jones, D. Thomson, N. Trought, and C. Witham, 2010:
An assessment of the impact of climate change on air quality at two UK sites.
Atmospheric Environment, 44(16), 1877-1886.
Atkins, J.P., S. Mazzi, and C.D. Easter, 2000: A Commonwealth Vulnerability Index for
Developing Countries: The Position of Small States. Economic Paper No. 40,
Commonwealth Secretariat, London, UK, 64 pp.
Badigannavar, A., D. Kale, and G. Murty, 2002: Genetic base and diversity in groundnut
genotypes. Plant Breeding, 121(4), 348-353.
Bae, D., I. Jung, and D.P. Lettenmaier, 2011: Hydrologic uncertainties in climate change
from IPCC AR4 GCM simulations of the Chungju Basin, Korea. Journal of
Hydrology, 401(1), 90-105.
Barker, T., I. Bashmakov, A. Alharthi, M. Amann, L. Cifuentes, J. Drexhage, M. Duan,
O. Edenhofer, B. Flannery, M. Grubb, M. Hoogwijk, F.I. Ibitoye, C.J. Jepma, W.A.
Pizer, and K. Yamaji, 2007: Mitigation from a cross-sectoral perspective. In:

1185
Regional Context Chapter 21
21
Climate Change 2007: Mitigation. Contribution of Working Group III to the
Fourth Assessment Report of the Intergovernmental Panel on Climate Change
[Metz, B., O.R. Davidson, P.R. Bosch, R. Dave, and L.A. Meyer (eds.)]. Cambridge
University Press, Cambridge, UK and New York, NY, USA, pp. 619-690.
Barnett, J. and S. O’Neill, 2010: Maladaptation. Global Environmental Change, 20,
211-213.
Barnett, T.P., D.W. Pierce, H.G. Hidalgo, C. Bonfils, B.D. Santer, T. Das, G. Bala, A.W.
Wood, T. Nozawa, A.A. Mirin, D.R. Cayan, and M.D. Dettinger, 2008: Human-
induced changes in the hydrology of the western United States. Science, 319,
1080-1083.
Barr, R., S. Fankhauser, and K. Hamilton, 2010: Adaptation investments: a resource
allocation framework. Mitigation and Adaptation Strategies for Global
Change, 15(8), 843-858.
Bell, V., A. Kay, S. Cole, R. Jones, R. Moore, and N. Reynard, 2012: How might climate
change affect river flows across the Thames Basin? An area-wide analysis
using the UKCP09 Regional Climate Model ensemble. Journal of Hydrology,
442-443, 89-104.
Benestad, R.E., 2011: A new global set of downscaled temperature scenarios. Journal
of Climate, 24(8), 2080-2098.
Beniston, M., D.B. Stephenson, O.B. Christensen, C.A.T. Ferro, C. Frei, S. Goyette, K.
Halsnaes, T. Holt, K. Jylhä, B. Koffi, J. Palutikof, R. Schöll, T. Semmler, and K.
Woth, 2007: Future extreme events in European climate: an exploration of
regional climate model projections. Climatic Change, 81, 71-95.
Bennett, J., F. Ling, D. Post, M. Grose, S. Corney, B. Graham, G. Holz, J. Katzfey, and
N. Bindoff, 2012: High-resolution projections of surface water availability for
Tasmania, Australia. Hydrology and Earth System Sciences, 16(5), 1287-1303.
Biasutti, M., I. Held, A. Sobel, and A. Giannini, 2008: SST forcings and Sahel rainfall
variability in simulations of the twentieth and twenty-first centuries. Journal
of Climate, 21(14), 3471-3486.
Bindoff, N., P. Stott, K.M. AchutaRao, M. Allen, N. Gillett, D. Gutzler, K. Hansingo, G.
Hegerl, Y. Hu, S. Jain, I. Mokhov, J. Overland, J. Perlwitz, R. Sebbari, and X.
Zhang, 2013: Detection and attribution of climate change: from global to
regional. In: Climate Change 2013: The Physical Science Basis. Contribution
of Working Group I to the Fifth Assessment Report of the Intergovernmental
Panel on Climate Change [Stocker, T.F., D. Qin, G.-K. Plattner, M. Tignor, S.K.
Allen, J. Boschung, A. Nauels, Y. Xia, V. Bex, and P.M. Midgley (eds.)]. Cambridge
University Press, Cambridge, UK and New York, NY, USA, pp. 867-952.
Birkmann, J., 2011: Regulation and coupling of society and nature in the context of
natural hazards. In: Coping with Global Environmental Change, Disasters and
Security [Brauch, H.B., Ú. Oswald Spring, C. Mesjasz, J. Grin, P. Kameri-Mbote,
B. Shourou, P. Dunay, and J. Birkmann (eds.)]. Hexagon Series on Human and
Environmental Security and Peace Vol. 5, Springer-Verlag, Berlin Heidelberg,
pp. 1103-1127.
Black, R., 2001: Environmental Refugees: Myth Or Reality?Working Paper No. 34,
Office of the United Nations High Commissioner for Refugees (UNHCR),
Geneva, Switzerland, 19 pp.
Black, R., S.R.G. Bennett, S.M. Thomas, and J.R. Beddington, 2011: Migration as
adaptation. Nature, 478, 447-449.
Blanco, G., R. Gerlagh, S. Suh, J. Barrett, H. De Conick, C.F.D. Morejon, R. Mathur, N.
Nakicenovic, A.O. Ahenkorah, J. Pan, H. Pathak, J. Rice, R. Richels, D. Stern, F.L.
Toth, and P. Peter Zhou, 2014: Drivers, trends and mitigation. In: Climate
Change 2014: Mitigation of Climate Change. Contribution of Working Group
III to the Fifth Assessment Report of the Intergovernmental Panel on Climate
Change [Edenhofer, O., et al. (eds.)]. Cambridge University Press, Cambridge,
UK and New York, NY, USA (in press).
Børgesen, C.D. and J.E. Olesen, 2011: A probabilistic assessment of climate change
impacts on yield and nitrogen leaching from winter wheat in Denmark.
Natural Hazards and Earth System Science, 11, 2541-2553.
Brekke, L.D., E.P. Maurer, J.D. Anderson, M.D. Dettinger, E.S. Townsley, A. Harrison,
and T. Pruitt, 2009: Assessing reservoir operations risk under climate change.
Water Resources Research, 45(4), W04411, doi:10.1029/2008WR006941.
Bronnimann, S., A. Stickler, T. Griesser, A.M. Fischer, A. Grant, T. Ewen, T. Zhou, M.
Schraner, E. Rozanov, and T. Peter, 2009: Variability of large-scale atmospheric
circulation indices for the Northern Hemisphere during the past 100 years.
Meteorologische Zeitschrift, 18(4), 379-396.
Brooker, R., A. Britton, A. Gimona, J. Lennon, and N. Littlewood, 2011: Literature
Review: Species Translocations as a Tool for Biodiversity Conservation during
Climate Change. Scottish Natural Heritage Commissioned Report No.440,
Scottish Natural Heritage, Inverness, UK, 68 pp.
Brown, C., A. Greene, P. Block, and A. Giannini, 2008: Review of Downscaling
Methodologies for Africa Applications. IRI Technical Report 08-05, IRI
Downscaling Report, International Research Institute for Climate and Society
(IRI), Lamont Campus, Columbia University, Palisades, NY, USA, 31 pp.
Brown, O., 2008: Migration and Climate Change. IOM Migration Research Series No.
31, International Organization for Migration (IOM), Research and Publications
Unit, Geneva, Switzerland, 60 pp.
Bukovsky, M.S., D. Gochis, and L.O. Mearns, 2013: Towards assessing NARCCAP
Regional Climate Model credibility for the North American monsoon: current
climate simulations. Journal of Climate, 26, 8802-8826.
Bürger, G., J. Schulla, and A. Werner, 2011: Estimates of future flow, including
extremes, of the Columbia River headwaters. Water Resources Research,
47(10), W10520, doi:10.1029/2010WR009716.
Burrows, M.T., D.S. Schoeman, L.B. Buckley, P. Moore, E.S. Poloczanska, K.M. Brander,
C. Brown, J.F. Bruno, C.M. Duarte, B.S. Halpern, J. Holding, C.V. Kappel, W.
Kiessling, M.I. O’Connor, J.M. Pandolfi, C. Parmesan, F.B. Schwing, W.J.
Sydeman, and A.J. Richardson, 2011: The pace of shifting climate in marine
and terrestrial ecosystems. Science, 334(6056), 652-655.
Cabré, M.F., S.A. Solman, and M.N. Nuñez, 2010: Creating regional climate change
scenarios over southern South America for the 2020’s and 2050’s using the
pattern scaling technique: validity and limitations. Climatic Change, 98, 449-
469.
Campbell, D. and C. Beckford, 2009: Negotiating uncertainty: Jamaican small farmers’
adaptation and coping strategies, before and after hurricanes – a case study
of Hurricane Dean. Sustainability Science, 1(4), 1366-1387.
Campbell, J.D., M.A. Taylor, T.S. Stephenson, R.A. Watson, and F.S. Whyte, 2011: Future
climate of the Caribbean from a regional climate model. International Journal
of Climatology, 31(12), 1866-1878.
Cardona, O.D., 2005: Indicators of Disaster Risk and Risk Management: Program for
Latin American and the Caribbean. Summary Report No. 30718, Prepared for
the World Conference on Disaster Reduction, Inter-American Development
Bank (IADB), Universidad Nacional de Colombia – Sede Manizales (UNC), and
Instituto de Estudios Ambientales (IDEA), IADB, Washington, DC, USA, 47 pp.
Cardona, O.D., M.K. van Aalst, J. Birkmann, M. Fordham, G. McGregor, R. Perez, R.S.
Pulwarty, E.L.F. Schipper, and B.T. Sinh, 2012: Determinants of risk: exposure
and vulnerability. In: Managing the Risks of Extreme Events and Disasters to
Advance Climate Change Adaptation. A Special Report of Working Groups I
and II of the Intergovernmental Panel on Climate Change [Field, C.B., V. Barros,
T.F. Stocker, D. Qin, D.J. Dokken, K.L. Ebi, M.D. Mastrandrea, K.J. Mach, G.-K.
Plattner, S.K. Allen, M. Tignor, and P.M. Midgley (eds.)]. Cambridge University
Press, Cambridge, UK and New York, NY, USA, pp. 65-108.
Carter, T.R., 2013: Agricultural impacts: multi-model yield projections. Nature Climate
Change, 3, 784-786.
Carter, T.R., E.L. La Rovere, R.N. Jones, R. Leemans, L.O. Mearns, N. Nakicenovic, A.B.
Pittock, S.M. Semenov, and J. Skea, 2001: Developing and applying scenarios.
In: Climate Change 2001: Impacts, Adaptation, and Vulnerability. Contribution
of Working Group II to the Third Assessment Report of the Intergovernmental
Panel on Climate Change [McCarthy, J.J., O.F. Canziani, N.A. Leary, D.J. Dokken,
and K.S. White (eds.)]. Cambridge University Press, Cambridge, UK and New
York, NY, USA, pp. 145-190.
Carter, T.R., R.N. Jones, X. Lu, S. Bhadwal, C. Conde, L.O. Mearns, B.C. O’Neill, M.D.A.
Rounsevell, and M.B. Zurek, 2007: New assessment methods and the
characterisation of future conditions. In: Climate Change 2007: Impacts,
Adaptation and Vulnerability. Contribution of Working Group II to the Fourth
Assessment Report of the Intergovernmental Panel on Climate Change [Parry,
M.L., O.F. Canziani, J.P. Palutikof, P.J. van der Linden, and C.E. Hanson (eds.)].
Cambridge University Press, Cambridge, UK and New York, NY, USA, pp. 133-
171.
Carvalho, A., A. Monteiro, S. Solman, A.I. Miranda, and C. Borrego, 2010: Climate-
driven changes in air quality over Europe by the end of the 21
st
century, with
special reference to Portugal. Environmental Science & Policy, 13(6), 445-
458.
Cash, D.W., W.C. Clark, F. Alcock, N.M. Dickson, N. Eckley, D.H. Guston, J. Jaeger, and
R.B. Mitchell, 2003: Knowledge systems for sustainable development.
Proceedings of the National Academy of Sciences of the United States of
America, 100(14), 8086-8091.
CDKN, 2012a: Managing Climate Extremes and Disasters in Africa: Lessons from the
SREX Report. Climate and Development Knowledge Network (CDKN), London,
UK, 20 pp.

1186
Chapter 21 Regional Context
21
CDKN, 2012b: Managing Climate Extremes and Disasters in Asia: Lessons from the
SREX Report. Climate and Development Knowledge Network (CDKN), London,
UK, 20 pp.
CDKN, 2012c: Managing Climate Extremes and Disasters in Latin America and the
Caribbean: Lessons from the SREX Report. Climate and Development
Knowledge Network (CDKN), London, UK, 20 pp.
Cerezo-Mota, R., M. Allen, and R. Jones, 2011: Mechanisms controlling precipitation
in the northern portion of the North American monsoon. Journal of Climate,
24(11), 2771-2783.
Challinor, A., T. Wheeler, D. Hemming, and H. Upadhyaya, 2009: Crop yield simulations
using a perturbed crop and climate parameter ensemble: sensitivity to
temperature and potential for genotypic adaptation to climate change. Climate
Research, 38, 117-127.
Chen, I.C., J.K. Hill, R. Ohlemuller, D.B. Roy, and C.D. Thomas, 2011: Rapid range shifts
of species associated with high levels of climate warming. Science, 333, 1024-
1026.
Christensen, J.H. and O.B. Christensen, 2007: A summary of the PRUDENCE model
projections of changes in European climate by the end of this century. Climatic
Change, 81, 7-30.
Christensen, J.H., B. Hewitson, A. Busuioc, A. Chen, X. Gao, I. Held, R. Jones, W.-T.
Kwon, R. Laprise, V.M. Rueda, L.O. Mearns, C.G. Menéndez, J. Räisänen, A.
Rinke, R.K. Kolli, A. Sarr, and P. Whetton, 2007: Regional climate projections.
In: Climate Change 2007: The Physical Science Basis. Working Group I
Contribution to the Intergovernmental Panel on Climate Change Fourth
Assessment Report [Solomon, S., D. Qin, M. Manning, Z. Chen, M. Marquis,
K.B. Averyt, M. Tignor, and H.L. Miller (eds.)]. Cambridge University Press,
Cambridge, UK and New York, NY, USA, pp. 847-940.
Christensen, O.B., C.M. Goodess, and J. Ciscar, 2012: Methodological framework of
the PESETA project on the impacts of climate change in Europe. Climatic
Change, 112(1), 7-28.
Church, J.A., P.U. Clark, A. Cazenave, J. Gregory, S. Jevrejeva, A. Levermann, M.
Merrifield, G. Milne, R.S. Nerem, P. Nunn, A. Payne, W. Tad Pfeffer, D. Stammer,
and A. Unnikrishnan, 2013: Sea level change. In: Climate Change 2013: The
Physical Science Basis. Contribution of Working Group I to the Fifth Assessment
Report of the Intergovernmental Panel on Climate Change [Stocker, T.F., D.
Qin, G.-K. Plattner, M. Tignor, S.K. Allen, J. Boschung, A. Nauels, Y. Xia, V. Bex,
and P.M. Midgley (eds.)]. Cambridge University Press, Cambridge, UK and New
York, NY, USA, pp.1137-1216.
Ciais, P., C. Sabine, G. Bala, L. Bopp, V. Brovkin, J. Canadell, A. Chhabra, R. DeFries, J.
Galloway, M. Heimann, C. Jones, C. Le Quéré, R. Myneni, S. Piao, and P. Thornton,
2013: Carbon and other biogeochemical cycles. In: Climate Change 2013: The
Physical Science Basis. Contribution of Working Group I to the Fifth Assessment
Report of the Intergovernmental Panel on Climate Change [Stocker, T.F., D.
Qin, G.-K. Plattner, M. Tignor, S.K. Allen, J. Boschung, A. Nauels, Y. Xia, V. Bex,
and P.M. Midgley (eds.)]. Cambridge University Press, Cambridge, UK and New
York, NY, USA, 465-570.
Ciscar, J.-C., A. Iglesias, L. Feyen, L. Szabó, D. Van Regemorter, B. Amelung, R. Nicholls,
P. Watkiss, O.B. Christensen, R. Dankers, L. Garrote, C.M. Goodess, A. Hunt, A.
Moreno, J. Richards, and A. Soria, 2011: Physical and economic consequences
of climate change in Europe. Proceedings of the National Academy of Sciences
of the United States of America, 108(7), 2678-2683.
Collins, M., R. Knutti, J. Arblaster, J.-L. Dufresne, T. Fichefet, P. Friedlingstein, X. Gao,
W. Gutowski, T. Johns, G. Krinner, M. Shongwe, C. Tebaldi, A. Weaver, and M.
Wehner, 2013: Long-term climate change: projections, commitments and
irreversibility. In: Climate Change 2013: The Physical Science Basis. Contribution
of Working Group I to the Fifth Assessment Report of the Intergovernmental
Panel on Climate Change [Stocker, T.F., D. Qin, G.-K. Plattner, M. Tignor, S.K.
Allen, J. Boschung, A. Nauels, Y. Xia, V. Bex, and P.M. Midgley (eds.)]. Cambridge
University Press, Cambridge, UK and New York, NY, USA, pp.1029-1136.
Comiso, J.C. and F. Nishio, 2008: Trends in the sea ice cover using enhanced and
compatible AMSR-E, SSM/I, and SMMR data. Journal of Geophysical Research:
Oceans, 113(C2), C02S07, doi:10.1029/2007JC004257.
Compo, G., J. Whitaker, P. Sardeshmukh, N. Matsui, R. Allan, X. Yin, B. Gleason, R.
Vose, G. Rutledge, and P. Bessemoulin, 2011: The twentieth century reanalysis
project. Quarterly Journal of the Royal Meteorological Society, 137(654), 1-
28.
Coppola, E. and F. Giorgi, 2010: An assessment of temperature and precipitation
change projections over Italy from recent global and regional climate model
simulations. International Journal of Climatology, 30, 11-32.
Cotula, L., S. Vermeulen, P. Mathieu, and C. Toulmin, 2011: Agricultural investment
and international land deals: evidence from a multi-country study in Africa.
Food Security, 3(Suppl. 1), S99-S113.
Craufurd, P.Q., V. Vadez, S.V. Krishna Jagadish, P.V. Vara Prasad, and M. Zaman-Allah,
2013: Crop science experiments designed to inform crop modeling. Agricultural
and Forest Meteorology, 170, 8-18.
Cutter, S., B. Osman-Elasha, J. Campbell, S.-M. Cheong, S. McCormick, R. Pulwarty, S.
Supratid, and G. Ziervogel, 2012: Managing the risks from climate extremes
at the local level. In: Managing the Risks of Extreme Events and Disasters to
Advance Climate Change Adaptation. A Special Report of Working Groups I
and II of the Intergovernmental Panel on Climate Change [Field, C.B., V. Barros,
T.F. Stocker, D. Qin, D.J. Dokken, K.L. Ebi, M.D. Mastrandrea, K.J. Mach, G.-K.
Plattner, S.K. Allen, M. Tignor, and P.M. Midgley (eds.)]. Cambridge University
Press, Cambridge, UK and New York, NY, USA, pp. 291-338.
Danz, N.P., G.J. Niemi, R.R. Regal, T. Hollenhorst, L.B. Johnson, J.M. Hanowski, R.P.
Axler, J.J. Ciborowski, T. Hrabik, and V.J. Brady, 2007: Integrated measures of
anthropogenic stress in the US Great Lakes basin. Environmental Management,
39(5), 631-647.
Davies, M., K. Oswald, and T. Mitchell, 2009: Climate change adaptation, disaster
risk reduction and social protection. In: Promoting Pro-Poor Growth: Social
Protection. Organisation for Economic Co-operation and Development
(OECD), OECD, Paris, France, pp. 201-217.
Dawson, J.P., P.J. Adams, and S.N. Pandis, 2007: Sensitivity of ozone to summertime
climate in the Eastern USA: a modeling case study. Atmospheric Environment,
41, 1494-1511.
De Elia, R. and H. and Cote, 2010: Climate and climate change sensitivity to model
configuration in the Canadian RCM over North America. Meteorologische
Zeitschrift, 19(4), 325-339.
De Schutter, O., 2009: Large-Scale Land Acquisitions and Leases: A Set of Core
Principles and Measures to Address the Human Rights Challenge. Report
presented to the Human Rights Council by the United Nations Special
Rapporteur on the right to food, United Nations Human Rights Council
(UNHRC), Geneva, Switzerland, 15 pp.
de Sherbinin, A., 2013: Climate change hotspots mapping: what have we learned?
Climatic Change (in press), doi: 10.1007/s10584-013-0900-7.
de Wet, N., W. Ye, S. Hales, R. Warrick, A. Woodward, and P. Weinstein, 2001: Use of
a computer model to identify potential hotspots for dengue fever in New
Zealand. The New Zealand Medical Journal, 114(1140), 420-422.
Dee, D., S. Uppala, A. Simmons, P. Berrisford, P. Poli, S. Kobayashi, U. Andrae, M.
Balmaseda, G. Balsamo, P. Bauer, P. Bechtold, A.C.M. Beljaars, L. van de Berg,
J. Bidlot, N. Bormann, C. Delsol, R. Dragani, M. Fuentes, A.J. Geer, L.
Haimberger, S.B. Healy, H. Hersbach, E.V. Hólm, L. Isaksen, P. Kållberg, M.
Köhler, M. Matricardi, A.P. McNally, B.M. Monge-Sanz, J.-J. Morcrette, B.-K.
Park, C. Peubey, P. de Rosnay, C. Tavolato, J.-N. Thépaut, and F. Vitart, 2011:
The ERA-Interim reanalysis: configuration and performance of the data
assimilation system. Quarterly Journal of the Royal Meteorological Society,
137(656), 553-597.
DEFRA, 2012: The UK Climate Change Risk Assessment 2012 Evidence Report.
Presented to Parliament pursuant to Section 56 of the Climate Change Act 2008,
Climate Change Risk Assessment (CCRA), UK Department for Environment,
Food & Rural Affairs (DEFRA) Project Code GA0204, Prepared by HR
Wallingford, AMEC Environment & Infrastructure UK, Ltd. (formerly Entec UK
Ltd.), The Met Office, Collingwood Environmental Planning, Alexander Ballard,
Ltd., Paul Watkiss Associates, and Metroeconomica, Stationery Office, London,
UK, 464 pp.
Deininger, K. and D. Byerlee, 2012: The rise of large farms in land abundant countries:
do they have a future? World Development, 40(4), 701-714.
Déqué, M. and S. Somot, 2010: Weighted frequency distributions express modelling
uncertainties in the ENSEMBLES regional climate experiments. Climate
Research, 44(2), 195-209.
Déqué, M., D.P. Rowell, D. Luethi, F. Giorgi, J.H. Christensen, B. Rockel, D. Jacob, E.
Kjellstroem, M. de Castro, and B.J.J.M. van den Hurk, 2007: An intercomparison
of regional climate simulations for Europe: assessing uncertainties in model
projections. Climatic Change, 81(1), 53-70.
Dessai, S. and M. Hulme, 2004: Does climate adaptation policy need probabilities?
Climate Policy, 4(2), 107-128.
Det Norsk Veritas, 2010: Beluga Shipping Masters First Commercial Transit of the
Northeast-Passage. Det Norsk Veritas (DNV) now DNV GL, Høvik, Norway,
www.dnvgl.com/.

1187
Regional Context Chapter 21
21
Diallo, I., M.B. Sylla, F. Giorgi, A.T. Gaye, and M. Camara, 2012: Multimodel GCM-
RCM ensemble-based projections of temperature and precipitation over West
Africa for the early 21
st
century. International Journal of Geophysics, 2012,
972896, doi:10.1155/2012/972896.
Dickinson, T., 2007: The Compendium of Adaptation Models for Climate Change.1
st
edn., Adaptation and Impacts Research Division (AIRD), Environment Canada,
Toronto, ON, Canada, 41 pp.
Diffenbaugh, N.S. and C.B. Field, 2013: Changes in ecologically critical terrestrial
climate conditions. Science, 341, 486-492.
Diffenbaugh, N.S. and F. Giorgi, 2012: Climate change hotspots in the CMIP5 global
climate model ensemble. Climatic Change, 114(3-4), 813-822.
Diffenbaugh, N.S. and M. Scherer, 2011: Observational and model evidence of global
emergence of permanent, unprecedented heat in the 20
th
and 21
st
centuries.
Climatic Change, 107(3-4), 615-624.
Diffenbaugh, N.S., F. Giorgi, and J.S. Pal, 2008: Climate change hotspots in the United
States. Geophysical Research Letters, 35(16), L16709, doi:10.1029/
2008GL035075.
Dilley, M., 2006: Chapter 9: Disaster risk hotspots: a project summary. In: Measuring
Vulnerability to Natural Hazards: Towards Disaster Resilient Societies [Birkmann,
J. (ed.)]. United Nations University (UNU) Press, Tokyo, Japan, pp. 182-188.
Doherty, R.M., D.S. Stevenson, C.E. Johnson, W.J. Collins, and M.G. Sanderson, 2006:
Tropospheric ozone and El Niño – Southern Oscillation: influence of atmospheric
dynamics, biomass burning emissions, and future climate change. Journal of
Geophysical Research: Atmospheres, 111(D19), D19304, doi:10.1029/
2005JD006849.
Dominguez, F., J. Cañon, and J. Valdes, 2010: IPCC AR4 climate simulations for the
southwestern U.S.: the importance of future ENSO projections. Climatic
Change, 99, 499-514.
Donley, E.E., R.J. Naiman, and M.D. Marineau, 2012: Strategic planning for instream
flow restoration: a case study of potential climate change impacts in the
central Columbia River basin. Global Change Biology, 18, 3071-3086.
Downing, T.E., 2012: Views of the frontiers in climate change adaptation economics.
Wiley Interdisciplinary Reviews: Climate Change, 3, 161-170.
Downing, T.E., R. Butterfield, S. Cohen, S. Huq, R. Moss, A. Rahman, Y. Sokona, and L.
Stephen, 2001: Vulnerability Indices, Climate Change Impacts and Adaptation.
Technical Report, United Nations Environment Programme (UNEP), Division
of Policy Development and Law, Nairobi, Kenya, 39 pp.
Druyan, L.M., 2011: Studies of 21
st
-century precipitation trends over West Africa.
International Journal of Climatology, 31(10), 1415-1424.
Druyan, L.M., J. Feng, K.H. Cook, Y. Xue, M. Fulakeza, S.M. Hagos, A. Konaré, W.
Moufouma-Okia, D.P. Rowell, and E.K. Vizy, 2010: The WAMME regional model
intercomparison study. Climate Dynamics, 35(1), 175-192.
Ebi, K.L., 2008: Adaptation costs for climate change-related cases of diarrhoeal
disease, malnutrition, and malaria in 2030. Globalization and Health, 4(9),
doi: 10.1186/1744-8603-4-9.
Ebi, K.L., S. Hallegate, T. Kram, N.W. Arnell, T.R. Carter, J. Edmonds, E. Kriegler, R.
Mathur, B.C. O’Neill, K. Riahi, H. Winkler, D.P. van Vuuren, and T. Zwickel, 2013:
A new scenario framework for climate change research: background, process,
and future directions. Climatic Change, doi: 10.1007/s10584-013-0912-3.
Edwards, J., M. Gustafsson, and B. Näslund-Landenmark, 2007: Handbook for
Vulnerability Mapping. EU Asia Pro Eco project, Technical Report, Swedish
Rescue Services Agency, Stockholm, Sweden, 18 pp.
EEA, 2007: Climate Change: The Cost of Inaction and the Cost of Adaptation. EEA
Technical Report No. 13/2007, European Environment Agency (EEA), Publications
Office of the European Union, Luxembourg, Luxembourg, 67 pp.
Engardt, M., R. Bergstrom, and C. Andersson, 2009: Climate and emission changes
contributing to changes in near-surface ozone in Europe over the coming
decades: results from model studies. Ambio, 38(8), 452-458.
Engelbrecht, F.A., J.L. McGregor, and C.J. Engelbrecht, 2009: Dynamics of the
conformal cubic atmospheric model projected climate change signal over
southern Africa. International Journal of Climatology, 29(7), 1013-1033.
EPA, 2008: Effects of Climate Change for Aquatic Invasive Species and Implications
for Management and Research. EPA/600/R-08/014, National Center for
Environmental Assessment, U.S. Environmental Protection Agency (EPA),
Washington, DC, USA, 336 pp.
Ericksen, P., P. Thornton, A. Notenbaert, L. Cramer, P. Jones, and M. Herrero, 2011:
Mapping Hotspots of Climate Change and Food Insecurity in the Global Tropics.
CCAFS Report No. 5, Technical Report, CGIAR Research Program on Climate
Change, Agriculture and Food Security (CCAFS), Copenhagen, Denmark, 52 pp.
Eriksen, S.H. and P.M. Kelly, 2007: Developing credible vulnerability indicators for
climate adaptation policy assessment. Mitigation and Adaptation Strategies
for Global Change, 12, 495-524.
Fankhauser, S., 2010: The costs of adaptation. Wiley Interdisciplinary Reviews:
Climate Change, 1, 23-30.
Feng, S., A.B. Krueger, and M. Oppenheimer, 2010: Linkages among climate change,
crop yields and Mexico-US cross-border migration. Proceedings of the
National Academy of Sciences of the United States of America, 107(32),
14257-14262.
Ferrise, R., M. Moriondo, and M. Bindi, 2011: Probabilistic assessments of climate
change impacts on durum wheat in the Mediterranean region. Natural
Hazards and Earth System Science, 11, 1293-1302.
Ficklin, D.L., I.T. Stewart, and E.P. Maurer, 2012: Projections of 21
st
century Sierra
Nevada local hydrologic flow components using an ensemble of general
circulation models. JAWRA Journal of the American Water Resources
Association, 48(6), 1104-1125.
Findley, S., 1994: Does drought increase migration? A study of migration from rural
Mali during the 1983-1985 drought. International Migration Review, 28(3),
539-553.
Fischer, E.M., S.I. Seneviratne, P.L. Vidale, D. Lüthi, and C. Schär, 2007: Soil moisture-
atmosphere interactions during the 2003 European summer heat wave.
Journal of Climate, 20, 5081-5099.
Fitzpatrick, M.C. and W.W. Hargrove, 2009: The projection of species distribution
models and the problem of non-analog climate. Biodiversity and Conservation,
18, 2255-2261.
Flato, G., J. Marotzke, B. Abiodun, P. Braconnot, S.C. Chou, W. Collins, P. Cox, F.
Driouech, S. Emori, V. Eyring, C. Forest, P. Gleckler, E. Guilyardi, C. Jakob, V.
Kattsov, C. Reason, and M. Rummukainen, 2013: Evaluation of climate
models. In: Climate Change 2013: The Physical Science Basis. Contribution of
Working Group I to the Fifth Assessment Report of the Intergovernmental
Panel on Climate Change [Stocker, T.F., D. Qin, G.-K. Plattner, M. Tignor, S.K.
Allen, J. Boschung, A. Nauels, Y. Xia, V. Bex, and P.M. Midgley (eds.)]. Cambridge
University Press, Cambridge, UK and New York, NY, USA, pp.741-866.
Foresight, 2011: International Dimensions of Climate Change. Final Project Report,
UK Government Foresight Programme, Government Office for Science, London,
UK, 127 pp.
Forkel, R. and R. Knoche, 2006: Regional climate change and its impacts on
photooxidant concentrations in southern Germany: simulations with a coupled
regional climate-chemistry model. Journal of Geophysical Research, 111,
D12302, doi:10.1029/2005JD006748.
Fraser, E.D.G., E. Simelton, M. Termansen, S.N. Gosling, and A. South, 2013: “Vulnerability
hotspots”: integrating socio-economic and hydrological models to identify
where cereal production may decline in the future due to climate change
induced drought. Agricultural and Forest Meteorology, 170, 195-205.
Friedlingstein, P., P. Cox, R. Betts, L. Bopp, W. von Bloh, V. Brovkin, P. Cadule, S. Doney,
M. Eby, I. Fung, G. Bala, J. John, C. Jones, F. Joos, T. Kato, M. Kawamiya, W.
Knorr, I.K. Lindsay, H.D. Matthews, T. Raddatz, P. Rayner, C. Reick, E. Roeckner,
K.-G. Schnitzler, R. Schnur, K. Strassmann, A.J. Weaver, C. Yoshikawa, and N.
Zeng, 2006: Climate-carbon cycle feedback analysis: results from the C4MIP
Model intercomparison. Journal of Climate, 19, 3337-3353.
Fronzek, S., T.R. Carter, J. Räisänen, L. Ruokolainen, and M. Luoto, 2009: Applying
probabilistic projections of climate change with impact models: a case study
for sub-Arctic palsa mires in Fennoscandia. Climatic Change, 99, 515-534.
Fronzek, S., T.R. Carter, and M. Luoto, 2011: Evaluating sources of uncertainty in
modelling the impact of probabilistic climate change on sub-Arctic palsa
mires. Natural Hazards and Earth System Sciences, 11, 2981-2995.
Füssel, H.-M., 2007: Vulnerability: a generally applicable conceptual framework for
climate change research. Global Environmental Change, 17(2), 155-167.
Füssel, H.-M., 2009: Review and Quantitative Analysis of Indices of Climate Change
Exposure, Adaptive Capacity, Sensitivity, and Impacts. Background note to the
World Development Report 2010, World Bank, Washington, DC, USA, 34 pp.
Füssel, H.-M., 2010a: Modeling impacts and adaptation in global IAMs. Wiley
Interdisciplinary Reviews: Climate Change, 1, 288-303.
Füssel, H.-M., 2010b: How inequitable is the global distribution of responsibility,
capability, and vulnerability to climate change: a comprehensive indicator-
based assessment. Global Environmental Change, 20, 597-611.
Gaffin, S.R., C. Rosenzweig, X. Xing, and G. Yetman, 2004: Downscaling and geo-
spatial gridding of socio-economic projections from the IPCC Special Report
on Emissions Scenarios (SRES). Global Environmental Change, 14, 105-123.

1188
Chapter 21 Regional Context
21
Galloway McLean, K., 2010: Advance Guard: Climate Change Impacts, Adaptation,
Mitigation and Indigenous Peoples – A Compendium of Case Studies. United
Nations University (UNU), Traditional Knowledge Initiative, Darwin, Australia,
124 pp.
Gao, X.J., J.S. Pal, and F. Giorgi, 2006: Projected changes in mean and extreme
precipitation over the Mediterranean region from a high resolution double
nested RCM simulation. Geophysical Research Letters, 33(3), L03706,
doi:10.1029/2005GL024954.
Gao, X.J., Y. Shi, and F. Giorgi, 2011: A high resolution simulation of climate change
over China. Science China Earth Sciences, 54(3), 462-472.
Garb, Y., S. Pulver, and S.D. VanDeveer, 2008: Scenarios in society, society in scenarios:
toward a social scientific analysis of storyline-driven environmental modeling.
Environmental Research Letters, 3(4), 045015, doi:10.1088/1748-9326/3/4/
045015.
Garrett, K.A., A.D.M. Dobson, J. Kroschel, B. Natarajan, S. Orlandini, H.E.Z. Tonnang,
and C. Valdivia, 2013: The effects of climate variability and the color of
weather time series on agricultural diseases and pests, and on decisions for
their management. Agricultural and Forest Meteorology, 170, 216-227.
Gerbaux, M., N.M.J. Hall, N. Dessay, and I. Zin, 2009: The sensitivity of Sahelian runoff
to climate change. Hydrological Sciences Journal, 54(1), 5-16.
Gersonius, B., R. Ashley, A. Pathirana, and C. Zevenbergen, 2013: Climate change
uncertainty: building flexibility into water and flood risk infrastructure.
Climatic Change, 116, 411-423.
Giles, B.D., 2011: The Queensland floods of December 2010/early January 2011 –
and the media. Weather, 66(2), 55, doi: 10.1002/wea.774.
Giorgi, F., 2006: Climate change hot-spots. Geophysical Research Letters, 33(8),
L08707, doi:10.1029/2006GL025734.
Giorgi, F., 2008: A simple equation for regional climate change and associated
uncertainty. Journal of Climate, 21, 1589-1604.
Giorgi, F. and X. Bi, 2009: The Time of Emergence (TOE) of GHG-forced precipitation
change hot-spots. Geophysical Research Letters, 36(6), L06709, doi:10.1029/
2009GL037593.
Giorgi, F. and E. Coppola, 2007: European Climate-change Oscillation (ECO).
Geophysical Research Letters, 34(21), L21703, doi:10.1029/2007GL031223.
Giorgi, F. and R. Francesco, 2000: Evaluating uncertainties in the prediction of
regional climate change. Geophysical Research Letters, 27, 1295-1298.
Giorgi, F. and P. Lionello, 2008: Climate change projections for the Mediterranean
region. Global and Planetary Change, 63(2-3), 90-104.
Giorgi, F., C. Jones, and G.R. Asrar, 2009: Addressing climate information needs at
the regional level: the CORDEX framework. World Meteorological Organization
(WMO) Bulletin, 58(3), 175-183.
Giorgi, F., E.S. Im, E. Coppola, N.S. Diffenbaugh, X.J. Gao, L. Mariotti, and Y. Shi, 2011:
Higher hydroclimatic intensity with global warming. Journal of Climate,
24(20), 5309-5324.
Girod, B., A. Wiek, H. Mieg, and M. Hulme, 2009: The evolution of the IPCC’s emissions
scenarios. Environmental Science and Policy, 12(2), 103-118.
Godfray, H.C.J., J.R. Beddington, I.R. Crute, L. Haddad, D. Lawrence, J.F. Muir, J. Pretty,
S. Robinson, S.M. Thomas, and C. Toulmin, 2010: Food security: the challenge
of feeding 9 billion people. Science, 327, 812-818.
Goergen, K., J. Beersma, G. Brahmer, H. Buiteveld, M. Carambia, O. de Keizer, P.
Krahe, E. Nilson, R. Lammersen, C. Perrin, and D. Volken, 2010: Assessment
of Climate Change Impacts on Discharge in the Rhine River Basin:Results
of the RheinBlick2050 Project.Report No. I-23 of the CHR, International
Commission for the Hydrology of the Rhine Basin (CHR), Lelystad, Netherlands,
211 pp.
Gosling, S.N., R.G. Taylor, N.W. Arnell, and M.C. Todd, 2011: A comparative analysis
of projected impacts of climate change on river runoff from global and
catchment-scale hydrological models. Hydrology and Earth System Sciences,
15, 279-294.
Granier, C., B. Bessagnet, T. Bond, A. D’Angiola, Denier van der Gon, Hugo, G.J. Frost,
A. Heil, J.W. Kaiser, S. Kinne, Z. Klimont, S. Kloster, J.-F. Lamarque, C. Liousse,
T. Masui, F. Meleux, A. Mieville, T. Ohara, J.-C. Raut, K. Riahi, M.G. Schultz, S.J.
Smith, A. Thompson, J. van Aardenne, G.R. van der Werf, and D.P. van Vuuren
2011: Evolution of anthropogenic and biomass burning emissions of air
pollutants at global and regional scales during the 1980-2010 period. Climatic
Change, 109(1), 163-190.
Graux, A.-I., G. Bellocchi, R. Lardy, and J.-F. Soussana, 2013: Ensemble modelling of
climate change risks and opportunities for managed grasslands in France.
Agricultural and Forest Meteorology, 170, 114-131.
Grose, M.R., S.P. Corney, J.J. Katzfey, J.C. Bennett, G.K. Holz, C.J. White, and N.L.
Bindoff, 2012a: A regional response in mean westerly circulation and rainfall
to projected climate warming over Tasmania, Australia. Climate Dynamics,
40(7-8), 2035-2048.
Grose, M.R., M.J. Pook, P.C. McIntosh, J.S. Risbey, and N.L. Bindoff, 2012b: The
simulation of cutoff lows in regional climate models: reliability and projected
trends. Climatic Dynamics, 39, 445-459.
Grübler, A., B. O’Neill, K. Riahi, V. Chirkov, A. Goujon, P. Kolp, I. Prommer, S. Scherbov,
and E. Slentoe, 2007: Regional, national, and spatially explicit scenarios of
demographic and economic change based on SRES. Technological Forecasting
& Social Change, 74, 980-1029.
Gupta, S., J. Harnisch, D.C. Barua, L. Chingambo, P. Frankel, R.J.G. Vázquez, L.
Gómez-Echeverri, E. Haites, Y. Huang, R. Kopp, B. Lefèvre, H.O. Machado-Filho,
and E. Massetti, 2014: Cross-cutting investment and finance issues. In: Climate
Change 2014: Mitigation of Climate Change. Contribution of Working Group
III to the Fifth Assessment Report of the Intergovernmental Panel on Climate
Change [Edenhofer, O., et al. (eds.)]. Cambridge University Press, Cambridge,
UK and New York, NY, USA (in press).
Haddeland, I., D.B. Clark, W. Franssen, F. Ludwig, F. Voß, N.W. Arnell, N. Bertrand, M.
Best, S. Folwell, D. Gerten, S. Gomes, S.N. Gosling, S. Hagemann, N. Hanasaki,
R. Harding, J. Heinke, P. Kabat, S. Koirala, T. Oki, J. Polcher, T. Stacke, P. Viterbo,
G.P. Weedon, and P. Yeh, 2011: Multimodel estimate of the global terrestrial
water balance: setup and first results. Journal of Hydrometeorology, 12(5),
869-884.
Haensler, A., S. Hagemann, and D. Jacob, 2011: Dynamical downscaling of ERA40
reanalysis data over southern Africa: added value in the simulation of the
seasonal rainfall characteristics. International Journal of Climatology, 31(15),
2338-2349.
Hall, J.W., S. Brown, R.J. Nicholls, N.F. Pidgeon, and R.T. Watson, 2012: Proportionate
adaptation. Nature Climate Change, 2, 833-834.
Hallegatte, S., 2009: Strategies to adapt to an uncertain climate change. Global
Environmental Change, 19, 240-247.
Hambly, D., J. Andrey, B. Mills, and C. Fletcher, 2012: Projected implications of climate
change for road safety in Greater Vancouver, Canada. Climatic Change,
116(3-4), 613-629.
Handmer, J., Y. Honda, Z.W. Kundzewicz, N. Arnell, G. Benito, J. Hatfield, I.F. Mohamed,
P. Peduzzi, S. Wu, B. Sherstyukov, K. Takahashi, and Z. Yan, 2012: Changes in
impacts of climate extremes: human systems and ecosystems. In: Managing
the Risks of Extreme Events and Disasters to Advance Climate Change
Adaptation. A Special Report of Working Groups I and II of the Intergovernmental
Panel on Climate Change [Field, C.B., V. Barros, T.F. Stocker, D. Qin, D.J. Dokken,
K.L. Ebi, M.D. Mastrandrea, K.J. Mach, G.-K. Plattner, S.K. Allen, M. Tignor, and
P.M. Midgley (eds.)]. Cambridge University Press, Cambridge, UK and New
York, NY, USA, pp. 231-290.
Hanson, S., R. Nicholls, N. Ranger, S. Hallegatte, J. Corfee-Morlor, C. Herweijer, and J.
Chateau, 2011: A global ranking of port cities with high exposure to climate
extremes. Climatic Change, 104, 89-111.
Harris, G.R., D.M.H. Sexton, B.B.B. Booth, M. Collins, and J.M. Murphy, 2013:
Probabilistic projections of transient climate change. Climate Dynamics,
40(11-12), 2937-2972.
Hartmann, D.L., A.M.G. Klein Tank, M. Rusticucci, L. Alexander, S. Broennimann, Y.A.-
R. Charabi, F. Dentener, E. Dlugokencky, D. Easterling, A. Kaplan, B. Soden, P.
Thorne, M. Wild, and P. Zhai, 2013: Observations: atmosphere and surface. In:
Climate Change 2013: The Physical Science Basis. Contribution of Working
Group I to the Fifth Assessment Report of the Intergovernmental Panel on
Climate Change [Stocker, T.F., D. Qin, G.-K. Plattner, M. Tignor, S.K. Allen, J.
Boschung, A. Nauels, Y. Xia, V. Bex, and P.M. Midgley (eds.)]. Cambridge
University Press, Cambridge, UK and New York, NY, USA, pp. 159-254.
Hawkins, E. and R. Sutton, 2009: The potential to narrow uncertainty in regional
climate predictions. Bulletin of the American Meteorological Society, 90(8),
1095-1107.
Hawkins, E. and R. Sutton, 2011: The potential to narrow uncertainty in projections
of regional precipitation change. Climate Dynamics, 37(1), 407-418.
Hawkins, E., T.M. Osborne, C. Kit Ho, and A.J. Challinor, 2013: Calibration and bias
correction of climate projections for crop modelling: an idealised case study
over Europe. Agricultural and Forest Meteorology, 170, 19-31.
Hayhoe, K., J. van Dorn, T. Croley, N. Schlegal, and D. Wuebbles, 2010: Regional
climate change projections for Chicago and the Great Lakes. Journal of Great
Lakes Research, 36(Suppl. 2), 7-21.

1189
Regional Context Chapter 21
21
Headey, D., 2011: Rethinking the global food crisis: the role of trade shocks. Food
Policy, 36(2), 136-146.
Heikkinen, R.K., M. Luoto, M.B. Araújo, R. Virkkala, W. Thuiller, and M.T. Sykes, 2006:
Methods and uncertainties in bioclimatic envelope modelling under climate
change. Progress in Physical Geography, 30(6), 751-777.
Held, I., T. Delworth, J. Lu, K. Findell, and T. Knutson, 2005: Simulation of Sahel drought
in the 20
th
and 21
st
centuries. Proceedings of the National Academy of Sciences
of the United States of America, 102(50), 17891-17896.
Heller, N.E. and E.S. Zavaleta, 2009: Biodiversity management in the face of climate
change: a review of 22 years of recommendations. Biological Conservation,
142, 14-32.
Hellmuth, M.E., S.J. Mason, C. Vaughan, M.K. van Aalst, and R. Choularton, 2011: A
Better Climate for Disaster Risk Management. The Climate and Society Series
No. 3, International Research Institute for Climate and Society (IRI), The Earth
Institute at Columbia University, Lamont Campus, Columbia University,
Palisades, NY, USA, 118 pp.
Heumann, B.W., J.W. Seaquist, L. Eklundh, and P. Jonsson, 2007: AVHRR derived
phenological change in the Sahel and Soudan, Africa, 1982-2005. Remote
Sensing of Environment, 108(4), 385-392.
Hewitson, B.C. and R.G. Crane, 2006: Consensus between GCM climate change
projections with empirical downscaling: precipitation downscaling over South
Africa. International Journal of Climatology, 26, 1315-1337.
Hewitt, C.D., 2005: The ENSEMBLES project: providing ensemble-based predictions of
climate changes and their impacts. EGGS Newsletter, 13, 22-25, static.egu.eu/
static/4626/newsletter/eggs/eggs_13.pdf.
Hewitt, C., S. Mason, and D. Walland, 2012: The global framework for climate services.
Nature Climate Change, 2(12), 831-832.
Hinkel, J., 2011: “Indicators of vulnerability and adaptive capacity”: towards a
clarification of the science–policy interface. Global Environmental Change,
21(1), 198-208.
Hirschi, M., S.I. Seneviratne, V. Alexandrov, F. Boberg, C. Boroneant, O.B. Christensen,
H. Formayer, B. Orlowsky, and P. Stepanek, 2010: Observational evidence for
soil-moisture impact on hot extremes in southeastern Europe. Nature
Geoscience, 4(1), 17-21.
HLT, 2011: Climate Knowledge for Action: A Global Framework for Climate Services
– Empowering the Most Vulnerable. WMO-No. 1065, Report of the High-Level
Taskforce (HLT) towards the Global Framework for Climate Services (GFCS),
World Meteorological Organization (WMO), Geneva, Switzerland, 240 pp.
Hogrefe, C., B. Lynn, K. Civerolo, J.Y. Ku, J. Rosenthal, C. Rosenzweig, R. Goldberg, S.
Gaffin, K. Knowlton, and P.L. Kinney, 2004: Simulating changes in regional
air pollution over the eastern United States due to changes in global and
regional climate and emissions. Journal of Geophysical Research: Atmospheres,
109(D22), D22301, doi:10.1029/2004JD004690.
Howden, S.M., J. Soussana, F.N. Tubiello, N. Chhetri, M. Dunlop, and H. Meinke, 2007:
Adapting agriculture to climate change. Proceedings of the National Academy
of Sciences of the United States of America, 104(50), 19691-19696.
Huffman, G.J., R.F. Adler, D.T. Bolvin, E.J. Nelkin, F. Hossain, and M. Gebremichael,
2010: The TRMM multi-satellite precipitation analysis (TMPA). In: Satellite
Rainfall Applications for Surface Hydrology. Springer Science, Dordrecht,
Netherlands, pp. 3-22.
Hulme, M. and S. Dessai, 2008: Predicting, deciding, learning: can one evaluate the
“success” of national climate scenarios? Environmental Research Letters, 3,
045013, doi:10.1088/1748-9326/3/4/045013.
Hurtt, G.C., L.P. Chini, S. Frolking, R.A. Betts, J. Feddema, G. Fischer, J.P. Fisk, K. Hibbard,
R.A. Houghton, A. Janetos, C.D. Jones, G. Kindermann, T. Kinoshita, K. Klein
Goldewijk, K. Riahi, E. Shevliakova, S. Smith, E. Stehfest, A. Thomson, P. Thornton,
D.P. van Vuuren, and Y.P. Wang, 2011: Harmonization of land-use scenarios
for the period 1500-2100: 600 years of global gridded annual land-use
transitions, wood harvest, and resulting secondary lands. Climatic Change,
109(1), 117-161.
Huszar, P., K. Juda-Rezler, T. Halenka, H. Chervenkov, D. Syrakov, A.B. Krueger, P. Zanis,
D. Melas, E. Katragkou, M. Reizer, W. Trapp, and M. Belda, 2011: Potential
climate change impacts on ozone and PM levels over Central and Eastern
Europe from high resolution simulations. Climate Research, 50, 51-68.
Hyvönen, R., G.I. Ågren, S. Linder, T. Persson, M.F. Cotrufo, A. Ekblad, M. Freeman, A.
Grelle, I.A. Janssens, P.G. Jarvis, S. Kellomäki, A. Lindroth, D. Loustau, T.
Lundmark, R.J. Norby, R. Oren, K. Pilegaard, M.G. Ryan, B.D. Sigurdsson, M.
Strömgren, M.V. Oijen, and G. Wallin, 2007: The likely impact of elevated [CO
2
],
nitrogen deposition, increased temperature and management on carbon
sequestration in temperate and boreal forest ecosystems: a literature review.
New Phytologist, 173(3), 463-480.
Im, E.-S. and J.-B. Ahn, 2011: On the elevation dependency of present day climate
and future change over Korea from a high resolution regional climate simulation.
Journal of the Meteorological Society of Japan, 89, 89-100.
Im, E.-S., M.-H. Kim, and W.-T. Kwon, 2007: Projected change in mean and extreme
climate over Korea from a double nested regional climate model simulation.
Journal of the Meteorological Society of Japan, 85(6), 717-732.
Im, E.-S., J.-B. Ahn, W.-T. Kwon, and F. Giorgi, 2008a: Multi decadal scenario simulation
over Korea using a one-way double-nested regional climate model system.
Part 2: future climate projection (2021-2050). Climate Dynamics, 30, 239-254.
Im, E.-S., W.J. Gutowski, and F. Giorgi, 2008b: Consistent changes in 21
st
century daily
precipitation from regional climate simulations for Korea using two convection
parameterizations. Geophysical Research Letters, 35(14), L14706, doi:10.1029/
2008GL034126.
Im, E.-S., I.-W. Jung, H. Chang, D.-H. Bae, and W.-T. Kwon, 2010: Hydroclimatological
response to dynamically downscaled climate change simulations for Korean
basins. Climatic Change, 100(3-4), 485-508.
Im, E.-S., I.-W. Jung, and D.-H. Bae, 2011: The temporal and spatial structures of recent
and future trends in extreme indices over Korea from a regional climate
projection. International Journal of Climatology, 31, 72-86.
IPCC, 1990a: Climate Change: The IPCC Scientific Assessment. Report Prepared for
IPCC by Working Group I, Intergovernmental Panel on Climate Change
[Houghton, J.T., G.T. Jenkins, and J.J. Ephraums (eds.)]. Cambridge University
Press, Cambridge, UK, New York, NY, USA, and Melbourne, Australia, 365 pp.
IPCC, 1990b: Climate Change: The IPCC Impacts Assessment. Report prepared for
IPCC by Working Group II, Intergovernmental Panel on Climate Change
[Tegart, W.J. McG., G.W. Sheldon, and D.C. Griffiths (eds.)]. Australian
Government Publishing Service, Canberra, ACT, Australia, 278 pp.
IPCC, 1990c: Climate Change: The IPCC Response Strategies. Report of Working
Group III of the Intergovernmental Panel on Climate Change [Bernthal, F.
(ed.)]. U.S. National Science Foundation, Washington, DC, USA, 270 pp.
IPCC, 1992a: Climate Change 1992: The Supplementary Report to the IPCC Scientific
Assessment. Report prepared for the Intergovernmental Panel on Climate
Change by Working Group I combined with Supporting Scientific Material
[Houghton, J.T., B.A. Callander, and S.K. Varney (eds.)]. Cambridge University
Press, Cambridge, UK, New York, NY, USA, and Victoria, Australia, 200 pp.
IPCC, 1992b: Climate Change 1992: The Supplementary Report to the IPCC Impacts
Assessment, Intergovernmental Panel on Climate Change. Report prepared for
the Intergovernmental Panel on Climate Change by Working Group II combined
with Supporting Scientific Material [Tegart, W.J. McG. and G.W. Sheldon (eds.)].
Australian Government Publishing Service, Canberra, ACT, Australia, 114 pp.
IPCC, 1994a: Climate Change 1994: Radiative Forcing of Climate Change and an
Evaluation of the IPCC IS92 Emission Scenarios. Reports of Working Groups I
and III of the Intergovernmental Panel on Climate Change [Houghton, J.T.,
L.G.M. Filho, J. Bruce, H. Lee, B.A. Callander, E. Haites, N. Harris, and K. Maskell
(eds.)]. Cambridge University Press, Cambridge, UK, 339 pp.
IPCC, 1994b: IPCC Technical Guidelines for Assessing Climate Change Impacts and
Adaptations. Part of the IPCC Special Report to the First Session of the
Conference of the Parties to the UN Framework Convention on Climate
Change, Working Group II, Intergovernmental Panel on Climate Change
[Carter, T.R., M.L. Parry, S. Nishioka, and H. Harasawa (eds.)]. University College
London, UK and Center for Global Environmental Research, National Institute
for Environmental Studies, Tsukuba, Japan, 59 pp.
IPCC, 1996a: Climate Change 1995: The Science of Climate Change. Contribution of
Working Group I to the Second Assessment Report of the Intergovernmental
Panel on Climate Change [Houghton, J.T., L.G.M. Filho, B.A. Callander, N. Harris,
A. Kattenberg, and K. Maskell (eds.)]. Cambridge University Press, Cambridge,
UK, New York, NY, USA, and Melbourne, Australia, 572 pp.
IPCC, 1996b: Climate Change 1995: Impacts, Adaptations, and Mitigation of Climate
Change: Scientific-Technical Analyses. Contribution of Working Group II to the
Second Assessment Report of the Intergovernmental Panel on Climate Change
[Watson, R.T., M.C. Zinyowera, and R.H. Moss (eds.)]. Cambridge University
Press, Cambridge, UK, New York, NY, USA, and Melbourne, Australia, 880 pp.
IPCC, 1996c: Climate Change 1995: Economic and Social Dimensions of Climate
Change. Contribution of Working Group III to the Second Assessment Report
of the Intergovernmental Panel on Climate Change [Bruce, J.P., H. Lee, and
E.F. Haites (eds.)]. Cambridge University Press, Cambridge, UK, New York, NY,
USA, and Melbourne, Australia, 448 pp.

1190
Chapter 21 Regional Context
21
IPCC, 1997: The Regional Impacts of Climate Change: An Assessment of Vulnerability.
A Special Report of IPCC Working Group II, Intergovernmental Panel on
Climate Change [Watson, R.T., M.C. Zinyowera, and R.H. Moss, (eds.)].
Cambridge University Press, Cambridge, UK, 517 pp.
IPCC, 1998: Land Use, Land-Use Change and Forestry. A Special Report of the
Intergovernmental Panel on Climate Change [Watson, R.T., I.R. Noble, B. Bolin,
N.H. Ravindranath, D.J. Verardo, and D.J. Dokken (eds.)]. Cambridge University
Press, Cambridge, UK, 375 pp.
IPCC, 1999: Aviation and the Global Atmosphere: A Special Report of Working Groups
I and III of the Intergovernmental Panel on Climate Change [Penner, J.E., D.H.
Lister, D.J. Griggs, D.J. Dokken, and M. McFarland (eds.)]. Prepared in
collaboration with the Scientific Assessment Panel to the Montreal Protocol
on Substances that Deplete the Ozone Layer, Cambridge University Press,
Cambridge, UK, 373 pp.
IPCC, 2000a: Special Report on Emissions Scenarios. A Special Report of Working
Group III of the Intergovernmental Panel on Climate Change [Nakićenović, N.
and R. Swart (eds.)]. Cambridge University Press, Cambridge, UK, 570 pp.
IPCC, 2000b: Methodological and Technological Issues in Technology Transfer. A
Special Report of IPCC Working Group III, Intergovernmental Panel on Climate
Change [Metz, B., O.R. Davidson, J.-W. Martens, S. Van Rooijen, and L. Van
Wie McGrory (eds.)]. Cambridge University Press, Cambridge, UK, 432 pp.
IPCC, 2001a: Climate Change 2001: The Scientific Basis. Contribution of Working
Group I to the Third Assessment Report of the Intergovernmental Panel on
Climate Change [Houghton, J.T., Y. Ding, D.J. Griggs, M. Noguer, P.J. van der
Linden, X. Dai, K. Maskell, and C.A. Johnson (eds.)]. Cambridge University
Press, Cambridge, UK and New York, NY, USA, 881 pp.
IPCC, 2001b: Climate Change 2001: Impacts, Adaptation, and Vulnerability. Contribution
of Working Group II to the Third Assessment Report of the Intergovernmental
Panel on Climate Change [McCarthy, J.J., O.F. Canziani, N.A. Leary, D.J. Dokken,
and K.S. White (eds.)]. Cambridge University Press, Cambridge, UK and New
York, NY, USA, 1032 pp.
IPCC, 2001c: Climate Change 2001: Mitigation. Contribution of Working Group III to
the Third Assessment Report of the Intergovernmental Panel on Climate
Change [Metz, B., O. Davidson, R. Swart, and J. Pan (eds.)]. Cambridge
University Press, Cambridge, UK and New York, NY, USA, 752 pp.
IPCC, 2005: IPCC Special Report on Carbon Dioxide Capture and Storage. Prepared
by Working Group III of the Intergovernmental Panel on Climate Change
[Metz, B., O. Davidson, H.d. Coninck, M. Loos, and L.A. Meyer (eds.)].
Cambridge University Press, Cambridge, UK and New York, NY, USA, 431 pp.
IPCC, 2007a: Climate Change 2007: The Physical Science Basis. Contribution of Working
Group I to the Fourth Assessment Report of the Intergovernmental Panel on
Climate Change [Solomon, S., D. Qin, M. Manning, Z. Chen, M. Marquis, K.B.
Averyt, M. Tignor, and H.L. Miller (eds.)]. Cambridge University Press, Cam-
bridge, UK and New York, NY, USA, 996 pp.
IPCC, 2007b: Climate Change 2007: Impacts, Adaptation and Vulnerability. Contribution
of Working Group II to the Fourth Assessment Report of the Intergovernmental
Panel on Climate Change [ Parry, M.L., O.F. Canziani, J.P. Palutikof, P.J. van der
Linden, and C.E. Hanson (eds.)]. Cambridge University Press, Cambridge, UK
and New York, NY, USA, 976 pp.
IPCC, 2007c: Climate Change 2007: Mitigation. Contribution of Working Group III to
the Fourth Assessment Report of the Intergovernmental Panel on Climate
Change [Metz, B., O.R. Davidson, P.R. Bosch, R. Dave, and L.A. Meyer (eds.)].
Cambridge University Press, Cambridge, UK and New York, NY, USA, 851 pp.
IPCC, 2011: IPCC Special Report on Renewable Energy Sources and Climate Change
Mitigation. Special Report of Working Group III [Edenhofer, O., R. Pichs-Madruga,
Y. Sokona, K. Seyboth, P. Matschoss, S. Kadner, T. Zwickel, P. Eickemeier, G.
Hansen, S. Schlömer, and C. von Stechow (eds)].Cambridge University Press,
Cambridge, UK and New York, NY, USA, 1075 pp.
IPCC, 2012: Managing the Risks of Extreme Events and Disasters to Advance Climate
Change Adaptation. A Special Report of Working Groups I and II of the
Intergovernmental Panel on Climate Change [Field, C.B., V. Barros, T.F. Stocker,
D. Qin, D.J. Dokken, K.L. Ebi, M.D. Mastrandrea, K.J. Mach, G.-K. Plattner, S.K.
Allen, M. Tignor, and P.M. Midgley (eds.)]. Cambridge University Press,
Cambridge, UK and New York, NY, USA, 582 pp.
IPCC, 2013a: Climate Change 2013: The Physical Science Basis. Contribution of Working
Group I to the Fifth Assessment Report of the Intergovernmental Panel on
Climate Change [Stocker, T.F., D. Qin, G.-K. Plattner, M. Tignor, S.K. Allen, J.
Boschung, A. Nauels, Y. Xia, V. Bex, and P.M. Midgley (eds.)]. Cambridge
University Press, Cambridge, UK and New York, NY, USA, 1535 pp.
IPCC, 2013b: Summary for Policymakers. In: Climate Change 2014: The Physical
Science Basis. Contribution of Working Group I to the Fifth Assessment Report
of the Intergovernmental Panel on Climate Change [Stocker, T.F., D. Qin, G.-K.
Plattner, M. Tignor, S.K. Allen, J. Boschung, A. Nauels, Y. Xia, V. Bex, and P.M.
Midgley (eds.)]. Cambridge University Press, Cambridge, UK and New York,
NY, USA, pp. 3-29.
IPCC, 2013c: Annex I: Atlas of global and regional climate projections [van Oldenborgh,
G.J., M. Collins, J. Arblaster, J.H. Christensen, J. Marotzke, S.B. Power, M.
Rummukainen, and T. Zhou (eds.)]. In: Climate Change 2013: The Physical
Science Basis. Contribution of Working Group I to the Fifth Assessment Report
of the Intergovernmental Panel on Climate Change [Stocker, T.F., D. Qin, G.-K.
Plattner, M. Tignor, S.K. Allen, J. Boschung, A. Nauels, Y. Xia, V. Bex, and P.M.
Midgley (eds.)]. Cambridge University Press, Cambridge, UK and New York,
NY, USA, pp. 1311-1393.
IPCC, 2014: Climate Change 2014: Mitigation of Climate Change. Contribution of
Working Group III to the Fifth Assessment Report of the Intergovernmental
Panel on Climate Change [Edenhofer, O., et al. (eds.)]. Cambridge University
Press, Cambridge, UK and New York, NY, USA (in press).
IPCC and TEAP, 2005: Special Report on Safeguarding the Ozone Layer and the Global
Climate System: Issues Related to Hydrofluorocarbons and Perfluorocarbons.
Prepared by the Intergovernmental Panel on Climate Change (IPCC) Working
Groups I and III and the Montreal Protocol Technology and Economic Assessment
Panel (TEAP) [Metz, B., L. Kuijpers, S. Solomon, S.O. Andersen, O. Davidson, J.
Pons, D. de Jager, T. Kestin, M. Manning, and L. Meyer (eds.)]. Cambridge
University Press, Cambridge, UK and New York, NY, USA, 478 pp.
Isbell, F., V. Calcagno, A. Hector, J. Connolly, W.S. Harpole, P.B. Reich, M. Scherer-
Lorenzen, B. Schmid, D. Tilman, J. van Ruijven, A. Weigelt, B.J. Wilsey, E.S.
Zavaleta, and M. Loreau, 2011: High plant diversity is needed to maintain
ecosystem services. Nature, 477, 199-202.
Ishizaki, Y., H. Shiogama, S. Emori, T. Yokohata, T. Nozawa, T. Ogura, M. Abe, M.
Yoshimori, and K. Takahashi, 2012: Temperature scaling pattern dependence
on representative concentration pathway emission scenarios. A letter. Climatic
Change, 112, 535-546.
Ishizaki, Y., H. Shiogama, S. Emori, T. Yokohata, T. Nozawa, K. Takahashi, T. Ogura, M.
Yoshimori, and T. Nagashima, 2013: Dependence of precipitation scaling
patterns on emission scenarios for representative concentration pathways.
Journal of Climate, 26, 8868-8879.
Jacob, D., J. Petersen, B. Eggert, A. Alias, O.B. Christensen, L.M. Bouwer, A. Braun,
A. Colette, M. Déqué, and G. Georgievski, 2013: EURO-CORDEX: new high-
resolution climate change projections for European impact research. Regional
Environmental Change, doi:10.1007/s10113-013-0499-2.
Jaeger, E.B. and S.I. Seneviratne, 2011: Impact of soil moisture-atmosphere coupling
on European climate extremes and trends in a regional climate model. Climate
Dynamics, 36(9-10), 1919-1939.
Janssen, M.A. and E. Ostrom, 2006: Resilience, vulnerability, and adaptation: a cross-
cutting theme of the International Human Dimensions Programme on Global
Environmental Change. Global Environmental Change, 16(3), 237-239.
Jiang, T., Y.D. Chen, C.-y. Xu, Xiaohong Chen, Xi Chen, and V.P. Singh, 2007: Comparison
of hydrological impacts of climate change simulated by six hydrological models
in the Dongjiang Basin, South China. Journal of Hydrology, 336, 316-333.
Johns, T.C., J.-F. Royer, I. Höschel, H. Huebener, E. Roeckner, E. Manzini, M. May, J.-L.
Dufresne, O.H. Otterå, D.P. van Vuuren, D. Salas y Melia, M.A. Giorgetta, S.
Denvil, S. Yang, P.G. Folgli, J. Körper, J.F. Tjiputra, E. Stehfest, and C.D. Hewitt,
2011: Climate change under aggressive mitigation: the ENSEMBLES multi-
model experiment. Climate Dynamics, 37(9), 1975-2003.
Jones, K.E., N.G. Patel, M.A. Levy, A. Storeygard, D. Balk, J.L. Gittleman, and P. Daszak,
2008: Global trends in emerging infectious diseases. Nature,45(7181), 990-993.
Jones, R., J. Murphy, M. Noguer, and A. Keen, 1997: Simulation of climate change
over Europe using a nested regional-climate model. II: comparison of driving
and regional model responses to a doubling of carbon dioxide. Quarterly Journal
of the Royal Meteorological Society, 123(538), 265-292.
Juda-Rezler, K., M. Reizer, P. Huszar, B.C. Krüger, P. Zanis, D. Syrakov, E. Katragkou,
W. Trapp, D. Melas, H. Chervenkov, I. Tegoulias, and T. Halenka, 2012: Modelling
the effects of climate change on air quality over Central and Eastern Europe:
concept, evaluation and projections. Climate Research, 53(3), 179-203.
Kanada, S., M. Nakano, and T. Kato, 2012: Projections of future changes in precipitation
and the vertical structure of the frontal zone during the Baiu season in the
vicinity of Japan using a 5-km-mesh regional climate model. Journal of the
Meteorological Society of Japan, Ser. II, 90A, 65-86, doi:10.2151/jmsj.2012-A03.

1191
Regional Context Chapter 21
21
Kandlikar, M., H. Zerriffi, and C. Ho Lem, 2011: Science, decision-making and
development: managing the risks of climate variation in less-industrialized
countries. Wiley Interdisciplinary Reviews: Climate Change, 2, 201-219.
Katragkou, E., P. Zanis, I. Tegoulias, D. Melas, I. Kioutsioukis, B.C. Krüger, P. Huszar, T.
Halenka, and S. Rauscher, 2010: Decadal regional air quality simulations
over Europe in present climate: near surface ozone sensitivity to external
meteorological forcing. Atmospheric Chemistry and Physics, 10(23), 11805-
11821.
Katragkou, E., P. Zanis, I. Kioutsioukis, I. Tegoulias, D. Melas, B.C. Krüger, and E.
Coppola, 2011: Future climate change impacts on summer surface ozone from
regional climate-air quality simulations over Europe. Journal of Geophysical
Research: Atmospheres, 116(D22), D22307, doi:10.1029/2011JD015899.
Kaukoranta, T. and K. Hakala, 2008: Impact of spring warming on sowing times of
cereal, potato, and sugar beet in Finland. Agricultural and Food Science, 17(2),
165-176.
Kay, A. and R. Jones, 2012: Comparison of the use of alternative UKCP09 products
for modelling the impacts of climate change on flood frequency. Climatic
Change, 114(2), 211-230.
Kendon, E.J., D.P. Rowell, R.G. Jones, and E. Buonomo, 2008: Robustness of future
changes in local precipitation extremes. Journal of Climate, 21(17), 4280-
4297.
Kendon, E.J., D.P. Rowell, and R.G. Jones, 2010: Mechanisms and reliability of future
projected changes in daily precipitation. Climate Dynamics, 35(2), 489-509.
Kienberger, S., T. Blaschke, and R.Z. Zaidi, 2012: A framework for spatio-temporal
scales and concepts from different disciplines: the ‘vulnerability cube’. Natural
Hazards, 68(3), 1343-1369.
Kirtman, B., S.B. Power, A.J. Adedoyin, G.J. Boer, R. Bojariu, I. Camilloni, F.J. Doblas-
Reyes, A.M. Fiore, M. Kimoto, G.A. Meehl, M. Prather, A. Sarr, C. Schär, R. Sutton,
G.J. van Oldenborgh, G. Vecchi, and H.-J. Wang, 2013: Near-term climate
change: projections and predictability. In: Climate Change 2013: The Physical
Science Basis. Contribution of Working Group I to the Fifth Assessment Report
of the Intergovernmental Panel on Climate Change [Stocker, T.F., D. Qin, G.-K.
Plattner, M. Tignor, S.K. Allen, J. Boschung, A. Nauels, Y. Xia, V. Bex, and P.M.
Midgley (eds.)]. Cambridge University Press, Cambridge, UK and New York,
NY, USA, pp. 953-1028.
Kitoh, A., T. Ose, K. Kurihara, S. Kusunoki, M. Sugi, and KAKUSHIN Team-3 Modeling
Group, 2009: Projection of changes in future weather extremes using super-
high-resolution global and regional atmospheric models in the KAKUSHIN
Program: results of preliminary experiments. Hydrological Research Letters,
3, 49-53.
Kitoh, A., S. Kusunoki, and T. Nakaegawa, 2011: Climate change projections over South
America in the late 21
st
century with the 20 and 60 km mesh Meteorological
Research Institute atmospheric general circulation model (MRI-AGCM). Journal
of Geophysical Research, 116(D6), D06105, doi:10.1029/2010JD014920.
Kjellstrom, E. and K. Ruosteenoja, 2007: Present day and future precipitation in the
Baltic Sea region as simulated in a suite of regional climate models.Climatic
Change, 81(1 Suppl.), 281-291.
Klein, R.J.T., 2009: Identifying countries that are particularly vulnerable to the adverse
effects of climate change: an academic or a political challenge? Carbon &
Climate Law Review, 3, 284-291.
Klein, R.J.T., R.J. Nicholls, and F. Thomalla, 2003: Resilience to natural hazards: how
useful is this concept? Environmental Hazards, 5(1), 35-45.
Kline, K.L. and V.H. Dale, 2008: Biofuels: effect on land and fire. Science, 321(5886),
199-201.
Knowlton, K., J.E. Rosenthal, C. Hogrefe, B. Lynn, S. Gaffin, R. Goldberg, C. Rosenzweig,
K. Civerolo, J.-Y. Ku, and P.L. Kinney, 2004: Assessing ozone-related health
impacts under a changing climate. Environmental Health Perspectives,
112(15), 1557-1563.
Knowlton, K., C. Hogrefe, B. Lynn, C. Rosenzweig, J. Rosenthal, and P.L. Kinney, 2008:
Impacts of heat and ozone on mortality risk in the New York City metropolitan
region under a changing climate. In: Seasonal Forecasts, Climatic Change, and
Human Health [Thomson, M.C., R. Garcia-Herrera, and M. Beniston (eds.)].
Springer, Dordrecht, Netherlands, pp. 143-160.
Knutson, T.R., J.L. McBride, J. Chan, K. Emanual, G. Holland, C. Landsea, I. Held, J.P.
Kossin, A.K. Srivastava, and M. Sugi, 2010: Tropical cyclones and climate
change. Nature Geoscience, 3, 157-163.
Knutti, R., R. Furrer, C. Tebaldi, J. Cermak, and G. Meehl, 2010: Challenges in
combining projections from multiple climate models. Journal of Climate,
23(10), 2739-2758.
Kok, K., M. van Vliet, I. Bärlund, A. Dubel, and J. Sendzimir, 2011: Combining participative
backcasting and exploratory scenario development: experiences from the
SCENES project. Technological Forecasting and Social Change, 78, 835-851.
Kolmannskog, V., 2012: Climate change, environmental displacement and international
law. Journal of International Development, 24, 1071-1081.
Kriegler, E., B.C. O’Neill, S. Hallegatte, T. Kram, R.J. Lempert, R.H. Moss, and T.
Wilbanks, 2012: The need for and use of socio-economic scenarios for climate
change analysis: a new approach based on shared socio-economic pathways.
Global Environmental Change, 22(4), 807-822.
Krüger, B.C., E. Katragkou, I. Tegoulias, P. Zanis, D. Melas, E. Coppola, S. Rauscher, P.
Huszar, and T. Halenka, 2008: Regional photochemical model calculations for
Europe concerning ozone levels in a changing climate. Idojaras, 112(3-4),
285-300.
Kumar, P., A. Wiltshire, C. Mathison, S. Asharaf, B. Ahrens, P. Lucas-Picher, J.H.
Christensen, A. Gobiet, F. Saeed, and S. Hagemann, 2013: Downscaled climate
change projections with uncertainty assessment over India using a high
resolution multi-model approach. Science of the Total Environment, 468-
469(Suppl.), S18-S30.
Kunreuther, H., S. Gupta, V. Bosetti, R. Cooke, M.H. Duong, H. Held, J. Llanes-Regueiro,
A. Patt, E. Shittu, and E. Weber, 2014: Integrated risk and uncertainty assessment
of climate change response policies. In: Climate Change 2014: Mitigation of
Climate Change. Contribution of Working Group III to the Fifth Assessment
Report of the Intergovernmental Panel on Climate Change [Edenhofer, O., et
al. (eds.)]. Cambridge University Press, Cambridge, UK and New York, NY, USA
(in press).
Laczko, F. and C. Aghazarm (eds.), 2009: Migration, Environment and Climate
Change: Assessing the Evidence. International Organization for Migration
(IOM), Geneva, Switzerland, 441 pp.
Lamarque, J.-F., G.P. Kyle, M. Meinshausen, K. Riahi, S.J. Smith, D.P. van Vuuren, A.J.
Conley, and F. Vitt, 2011: Global and regional evolution of short-lived
radiatively-active gases and aerosols in the Representative Concentration
Pathways. Climatic Change, 109(1), 191-212.
Langner, J.R., R. Bergstrom, and V. Foltescu, 2005: Impact of climate change on surface
ozone and deposition of sulphur and nitrogen in Europe. Atmospheric
Environment, 39(6), 1129-1141.
Lassen, M.K., K.D. Nielsen, K. Richardson, K. Garde, and L. Schlüter, 2010: The effects
of temperature increases on a temperate phytoplankton community – a
mesocosm climate change scenario. Journal of Experimental Marine Biology
and Ecology, 383, 79-88.
Lawrence, P., J.R. Meigh, and C.A. Sullivan, 2003: The Water Poverty Index: An
International Comparison. Keele Economics Research Papers (KERP) No. 2002/19,
Department of Economics, Keele University, Keele, Staffordshire, UK, 16 pp.
Leary, N., J. Adejuwon, V. Barros, I. Burton, J. Kulkarni, and R. Lasco (eds.), 2008a:
Climate Change and Adaptation. International START Secretariat, Earthscan,
London, UK and Sterling, VA, USA, 381 pp.
Leary, N., C. Conde, J. Kulkarni, A. Nyong, and J. Pulhin (eds.), 2008b: Climate Change
and Vulnerability. Earthscan, London, UK and Sterling, VA, USA, 431 pp.
Leichenko, R. and K. O’Brien, 2008: Environmental Change and Globalization: Double
Exposures. Oxford University Press, New York, NY, USA, 192 pp.
Lenderink, G., A. van Ulden, B. van den Hurk, and E. van Meijgaard, 2007:
Summertime interannual temperature variability in an ensemble of regional
model simulations: analysis of the surface energy budget. Climatic Change,
81, 233-247.
Li, B., S. Sain, L.O. Mearns, H.A. Anderson, S. Kovats, K.L. Ebi, M.Y. Bekkedal, M.S.
Kanarek, and J.A. Patz, 2012: The impact of extreme heat on morbidity in
Milwaukee, Wisconsin. Climatic Change, 110(3), 959-976.
Lin, J.-T., K.O. Patten, K. Hayhoe, X.-Z. Liang, and D.J. Wuebbles, 2008: Effects of future
climate and biogenic emissions changes on surface ozone over the United
States and China. Journal of Applied Meteorology and Climatology, 47, 1888-
1909.
Lioubimtseva, E. and G.M. Henebry, 2009: Climate and environmental change in
arid Central Asia: impacts, vulnerability, and adaptations. Journal of Arid
Environments, 73(11), 963-977.
Littell, J.S., D. McKenzie, B.K. Kerns, S. Cushman, and C.G. Shaw, 2011: Managing
uncertainty in climate-driven ecological models to inform adaptation to
climate change. Ecosphere, 2(9), 102, doi:10.1890/ES11-00114.1.
Liu, C., D. Golding, and G. Gong, 2008: Farmers’ coping response to the low flows in
the lower Yellow River: a case study of temporal dimensions of vulnerability.
Global Environmental Change, 8, 543-553.

1192
Chapter 21 Regional Context
21
Lloyd, E.A. and V.J. Schweizer, 2013: Objectivity and a comparison of methodological
scenario approaches for climate change research. Synthese, doi:10.1007/
s11229-013-0353-6.
Loarie, S.R., P.B. Duffy, H. Hamilton, G.P. Asner, C.B. Field, and D.D. Ackerly, 2009: The
velocity of climate change. Nature, 462, 1052-1055.
Lobell, D.B., 2013: Errors in climate datasets and their effects on statistical crop
models. Agricultural and Forest Meteorology, 170, 58-66.
Lobell, D.B. and M.B. Burke, 2008: Why are agricultural impacts of climate change
so uncertain? The importance of temperature relative to precipitation.
Environmental Research Letters, 3(3), 034007, doi:10.1088/1748-9326/3/3/
034007.
Lobell, D.B., M. Bänziger, C. Magorokosho, and B. Vivek, 2010: Nonlinear heat effects
on African maize as evidenced by historical yield trials. Nature Climate
Change, 1, 42-45.
Lobell, D.B., W. Schlenker, and J. Costa-Roberts, 2011: Climate trends and global crop
production since 1980. Science, 333, 616-620.
Long, S.P., E.A. Ainsworth, A.D.B. Leakey, J. Nösberger, and D.R. Ort, 2006: Food
for thought: lower-than-expected crop yield stimulation with rising CO
2
concentrations. Science, 312, 1918-1921.
Luers, A.L., D.B. Lobell, L. Sklar, C. Addams, and P.A. Matson, 2003: A method for
quantifying vulnerability, applied to the Yaqui Valley, Mexico. Global
Environmental Change, 13, 255-267.
Lumsden, T.G., R.E. Schulze, and B.C. Hewitson, 2009: Evaluation of potential changes
in hydrologically relevant statistics of rainfall in Southern Africa under conditions
of climate change. Water SA, 35(5), 649-656.
Luo, Q., W. Bellotti, M. Williams, I. Cooper, and B. Bryan, 2007: Risk analysis of possible
impacts of climate change on South Australian wheat production. Climatic
Change, 85, 89-101.
Mainka, S.A. and G.W. Howard, 2010: Climate change and invasive species: double
jeopardy. Integrative Zoology, 5, 102-111.
Malcolm, J.R., L. Canran, R.P. Neilson, L. Hansen, and L. Hannah, 2006: Global warming
and extinctions of endemic species from biodiversity hotspots. Conservation
Biology, 20(2), 538-548.
Malone, E.L. and N.L. Engle, 2011: Evaluating regional vulnerability to climate
change: purposes and methods. Wiley Interdisciplinary Reviews: Climate
Change, 2, 462-474.
Marengo, J.A., R. Jones, L.M. Alves, and M.C. Valverde, 2009: Future change of
temperature and precipitation extremes in South America as derived from the
PRECIS regional climate modeling system. International Journal of Climatology,
29(15), 2241-2255.
Marengo, J.A., T. Ambrizzi, R.P. da Rocha, L.M. Alves, S.V. Cuadra, M.C. Valverde, R.R.
Torres, D.C. Santos, and S.E.T. Ferraz, 2010: Future change of climate in South
America in the late twenty-first century: intercomparison of scenarios from
three regional climate models. Climate Dynamics, 35(6), 1073-1096.
Mariotti, L., E. Coppola, M.B. Sylla, F. Giorgi, and C. Piani, 2011: Regional climate
model simulation of projected 21
st
century climate change over an all-Africa
domain: comparison analysis of nested and driving model results. Journal of
Geophysical Research, 116(D15), D15111, doi:10.1029/2010JD015068.
Marsh, T.J., 2004: The January 2003 flood on the Thames. Weather, 59(3), 59-62.
Martin, S.F., 2009: Chapter VIII: Managing environmentally induced migration. In:
Migration, Environment and Climate Change: Assessing the Evidence [Laczko,
F. and C. Aghazarm (eds.)]. International Organization for Migration (IOM),
Geneva, Switzerland, pp. 353-384.
Masson-Delmotte, V., M. Schulz, A. Abe-Ouchi, J. Beer, A. Ganopolski, J.F.G. Rouco,
E. Jansen, K. Lambeck, J. Luterbacher, T. Naish, T. Osborn, B. Otto-Bliesner, T.
Quinn, R. Ramesh, M. Rojas, X. Shao, and A. Timmermann, 2013: Information
from paleoclimate archives. In: Climate Change 2013: The Physical Science
Basis. Contribution of Working Group I to the Fifth Assessment Report of the
Intergovernmental Panel on Climate Change [Stocker, T.F., D. Qin, G.-K.
Plattner, M. Tignor, S.K. Allen, J. Boschung, A. Nauels, Y. Xia, V. Bex, and P.M.
Midgley (eds.)]. Cambridge University Press, Cambridge, UK and New York,
NY, USA, pp. 383-464.
Mastrandrea, M.D., K.J. Mach, G.-K. Plattner, O. Edenhofer, T.F. Stocker, C.B. Field,
K.L. Ebi, and P.R. Matschoss, 2011: The IPCC AR5 guidance note on consistent
treatment of uncertainties: a common approach across the working groups.
Climatic Change, 108(4), 675-691.
Maurer, E.P., L. Brekke, T. Pruitt, and P.B. Duffy, 2007: Fine-resolution climate projections
enhance regional climate change impact studies. Eos, Transactions of the
American Geophysical Union, 88(47), 504, doi:10.1029/2007EO470006.
Mawdsley, J.R., R. O’Malley, and D.S. Ojima, 2009: A review of climate-change
adaptation strategies for wildlife management and biodiversity conservation.
Conservation Biology, 23(5), 1080-1089.
McCarthy, M.P., M. Best, and R. Betts, 2010: Climate change in cities due to global
warming and urban effects. Geophysical Research Letters, 37(9), L09705,
doi:10.1029/2010GL042845.
McGray, H., A. Hammill, R. Bradley, E.L. Schipper, and J.-E. Parry, 2007: Weathering
the Storm: Options for Framing Adaptation and Development. World
Resources Institute (WRI), Washington, DC, USA, 57 pp.
McLeman, R.A., 2011: Settlement abandonment in the context of global environmental
change. Global Environmental Change, 21(Suppl. 1), S108-S120.
McLeman, R. and B. Smit, 2006: Migration as an adaptation to climate change.
Climate Change, 76, 31-53.
McPhaden, M.J., S.E. Zebiak, and M.H. Glantz, 2006: ENSO as an integrating concept
in Earth science. Science, 314(5806), 1740-1745.
McSweeney, C.F., R.G. Jones, and B.B. Booth, 2012: Selecting ensemble members to
provide regional climate change information. Journal of Climate, 25(2012),
7100-7121.
Mearns, L.O., M. Hulme, T.R. Carter, R. Leemans, M. Lal, and P. Whetton, 2001: Climate
scenario development. In: Climate Change 2001: The Scientific Basis.
Contribution of Working Group I to the Third Assessment Report of the
Intergovernmental Panel on Climate Change [Houghton, J.T., Y. Ding, D.J.
Griggs, M. Noguer, P.J. van der Linden, X. Dai, K. Maskell, and C.A. Johnson
(eds.)]. Cambridge University Press, Cambridge, UK and New York, NY, USA,
pp.739-768.
Mearns, L.O., W.J. Gutowski, R. Jones, R. Leung, S. McGinnis, A.M.B. Nunes, and Y.
Qian, 2009: A regional climate change assessment program for North America.
Eos, Transactions of the American Geophysical Union, 90(36), 311,
doi:10.1029/2009EO360002.
Mearns, L.O., R. Arritt, S. Biner, M.S. Bukovsky, S. McGinnis, S. Sain, D. Caya, J. Correia
Jr., D. Flory, and W. Gutowski, 2012: The North American regional climate
change assessment program: overview of phase I results. Bulletin of the
American Meteorological Society, 93(9), 1337-1362.
Mearns, L.O., S. Sain, R.L. Leung, M.S. Bukovsky, S. McGinnis, S. Biner, D. Caya, R.W.
Arritt, W. Gutowski, E. Takle, M. Snyder, R.G. Jones, A.M.B. Nunes, S. Tucker, D.
Herzmann, L. McDaniel, and L. Sloan, 2013: Climate change projections of the
North American Regional Climate Change Assessment Program (NARCCAP).
Climatic Change Letters, 120(4), 965-975.
Medlyn, B.E., R.A. Duursma, and M.J.B. Zeppel, 2011: Forest productivity under climate
change: a checklist for evaluating model studies. Wiley Interdisciplinary
Reviews: Climate Change, 2, 332-355.
Meehl, G.A., C. Covey, K.E. Taylor, T. Delworth, R.J. Stouffer, M. Latif, B. McAvaney,
and J.F.B. Mitchell, 2007: The WCRP CMIP3 multimodel dataset: a new era in
climate change research. Bulletin of the American Meteorological Society,
88(9), 1383-1394.
Mehta, V., G. Meehl, L. Goddard, J. Knight, A. Kumar, M. Latif, T. Lee, A. Rosati, and D.
Stammer, 2011: Decadal climate predictability and prediction: where are we?
Bulletin of the American Meteorological Society, 92(5), 637-640.
Meinshausen, M., S.J. Smith, K. Calvin, J.S. Daniel, M.L. Kainuma, J. Lamarque, K.
Matsumoto, S. Montzka, S.C. Raper, and K. Riahi, 2011: The RCP greenhouse
gas concentrations and their extensions from 1765 to 2300. Climatic Change,
109(1), 213-241.
Meleux, F., F. Solmon, and F. Giorgi, 2007: Increase in European summer ozone
amounts due to climate change. Atmospheric Environment, 41(35), 7577-
7587.
Mendler de Suarez, J., P. Suarez, C. Bachofen, N. Fortugno, J. Goentzel, P. Goncalves,
N. Grist, C. Macklin, K. Pfeifer, S. Schweizer, M. Van Aalst, and H. Virji, 2012:
Games for a New Climate: Experiencing the Complexity of Future Risks.
Pardee Center Task Force Report, Frederick S. Pardee Center for the Study of
the Longer-Range Future, Boston University, Boston, MA, USA, 109 pp.
Menéndez, C.G., M. de Castro, A. Sorensson, and J. Boulanger, 2010: CLARIS Project:
towards climate downscaling in South America. Meteorologische Zeitschrift,
19(4), 357-362.
Mesinger, F., G. DiMego, E. Kalnay, K. Mitchell, P.C. Shafran, W. Ebisuzaki, D. Jovic, J.
Woollen, E. Rogers, and E.H. Berbery, 2006: North American regional reanalysis.
Bulletin of the American Meteorological Society, 87(3), 343-360.
Meze-Hausken, E., A. Patt, and S. Fritz, 2009: Reducing climate risk for micro-insurance
providers in Africa: a case study of Ethiopia. Global Environmental Change,
19(1), 66-73.

1193
Regional Context Chapter 21
21
Mickwitz, P., F. Aix, S. Beck, D. Carss, N. Ferrand, G. Görg, A. Jensen, P. Kivimaa, C.
Kuhlicke, W. Kuindersma, M. Máñez, M. Melanen, S. Monni, A.B. Pedersen, H.
Reinert, and S. van Bommel, 2009: Climate Policy Integration, Coherence and
Governance. PEER Report No 2, Partnership for European Environmental
Research, Helsinki, Finland, 92 pp.
Miles, E.L., M.M. Elsner, J.S. Littell, L.W. Binder, and D.P. Lettenmaier, 2010: Assessing
regional impacts and adaptation strategies for climate change: the Washington
Climate Change Impacts Assessment. Climatic Change, 102(1), 9-27.
Morice, C.P., J.J. Kennedy, N.A. Rayner, and P.D. Jones, 2012: Quantifying uncertainties
in global and regional temperature change using an ensemble of observational
estimates: the HadCRUT4 data set. Journal of Geophysical Research, 117(D8),
D08101, doi:10.1029/2011JD017187.
Morse, A., C. Prentice, and T. Carter, 2009: Assessments of climate change impacts:
research theme 6. In: ENSEMBLES: Climate Change and Its Impacts: Summary
of Research and Results from the ENSEMBLES Project [van der Linden, P. and
J. Mitchell (eds.)]. Met Office Hadley Center, Exeter, UK, pp. 107-129.
Moss, R.H., A.L. Brenkert, and E.L. Malone, 2001: Vulnerability to Climatic Change:
An Quantitative Approach. PNNL-SA-33642, Prepared for the U.S. Department
of Energy (DOE) by the Pacific Northwest National Laboratory, DOE,
Washington, DC, USA, 70 pp.
Moss, R.H., J.A. Edmonds, K. Hibbard, M. Manning, S.K. Rose, D.P. van Vuuren, T.R.
Carter, S. Emori, M. Kainuma, T. Kram, G. Meehl, J. Mitchell, N. Nakicenovic, K.
Riahi, S. Smith, R.J. Stouffer, A. Thomson, J. Weyant, and T. Wilbanks, 2010: The
next generation of scenarios for climate change research and assessment.
Nature, 463, 747-756.
Mueller, J.M. and J.J. Hellmann, 2008: An assessment of invasion risk from assisted
migration. Conservation Biology, 22, 562-567.
Mukheibir, P., 2007: Possible climate change impacts on large hydroelectricity
schemes in Southern Africa. Journal of Energy in Southern Africa, 18(1), 4-9.
Murazaki, K. and P. Hess, 2006: How does climate change contribute to surface ozone
change over the United States? Journal of Geophysical Research, 111(D5),
D05301, doi:10.1029/2005JD005873.
Murphy, J.M., D.M.H. Sexton, G.J. Jenkins, P.M. Boorman, B.B.B. Booth, C.C. Brown,
R.T. Clark, M. Collins, G.R. Harris, E.J. Kendon, R.A. Betts, S.J. Brown, T.P.
Howard, K.A. Humphrey, M.P. McCarthy, R.E. McDonald, A. Stephens, C.
Wallace, R. Warren, R. Wilby, and R.A. Wood, 2009: UK Climate Projections
Science Report: Climate Change Projections. UKCP09 Scientific Reports, Met
Office Hadley Centre, Exeter, UK, 190 pp.
Myers, N., 1988: Threatened biotas: “hotspots” in tropical forests. Environmentalist,
8, 187-208.
Naik, A., 2009: Migration and natural disasters. In: Migration, Environment and
Climate Change: Assessing the Evidence [Laczko, F. and C. Aghazarm (eds.)].
International Organization for Migration (IOM), Geneva, Switzerland, pp. 245-
317.
Nelson, G., A. Palazzo, C. Ringler, T. Sulser, and M. Batka, 2009a: The Role of International
Trade in Climate Change Adaptation. ICTSD–IPC Platform on Climate Change,
Agriculture and Trade, Issue Brief No. 4, International Centre for Trade and
Sustainable Development (ICTSD), Geneva, Switzerland and International
Food & Agricultural Trade Policy Council (IPC), Washington, DC, USA, 16 pp.
Nelson, G.C., M.W. Rosegrant, J. Koo, R. Robertson, T. Sulser, T. Zhu, C. Ringler, S. Msangi,
A. Palazzo, M. Batka, M. Magalhaes, R. Valmonte-Santos, M. Ewing, and D. Lee,
2009b: Climate Change: Impact on Agriculture and Costs of Adaptation. Food
Policy Report, International Food Policy Research Institute (IFPRI), Washington,
DC, USA, 19 pp.
New, M., A. Lopez, S. Dessai, and R. Wilby, 2007: Challenges in using probabilistic
climate change information for impact assessments: an example from the water
sector. Philosophical Transactions of the Royal Society A, 365, 2117-2131.
Nicholls, R.J., S.E. Hanson, J.A. Lowe, R.A. Warrick, X. Lu, and A.J. Long, 2013: Sea-
level scenarios for evaluating coastal impacts. Wiley Interdisciplinary Reviews:
Climate Change (in press), doi: 10.1022/wcc.253.
Nikulin, G., C. Jones, F. Giorgi, G. Asrar, M. Büchner, R. Cerezo-Mota, O.B. Christensen,
M. Déqué, J. Fernandez, and A. Hänsler, 2012: Precipitation climatology in an
ensemble of CORDEX-Africa regional climate simulations. Journal of Climate,
25(18), 6057-6078.
Nóbrega, M., W. Collischonn, C. Tucci, and A. Paz, 2011: Uncertainty in climate change
impacts on water resources in the Rio Grande Basin, Brazil. Hydrology and
Earth System Sciences, 15(2), 585-595.
Nordås, R. and N.P. Gleditsch, 2007: Climate change and conflict. Political Geography,
26, 627-638.
Nunez, M.N. and J.L. McGregor, 2007: Modeling future water environments of
Tasmania, Australia. Climate Research, 34(1), 25-37.
Nunez, M.N., S.A. Solman, and M.F. Cabre, 2009: Regional climate change experiments
over southern South America. II: climate change scenarios in the late twenty-
first century. Climate Dynamics, 32(7-8), 1081-1095.
Ogallo, L., P. Bessemoulin, J. Ceron, S. Mason, and S.J. Connor, 2008: Adapting to
climate variability and change: the Climate Outlook Forum process. Bulletin
of the World Meteorological Organization, 57(2), 93-102.
Ogden, N.H., L. St-Onge, I.K. Barker, S. Brazeau, M. Bigras-Poulin, D.F. Charron, C.M.
Francis, A. Heagy, L.R. Lindsay, A. Maarouf, P. Michel, F. Milord, C.J. O’-
Callaghan, L. Trudel1, and R.A. Thompson, 2008: Risk maps for range expansion
of the Lyme disease vector, Ixodes scapularis, in Canada now and with climate
change. International Journal of Health Geographics, 7(1), 24-39.
Oh, C.H. and R. Reuveny, 2010: Climatic natural disasters, political risk, and international
trade. Global Environmental Change, 20, 243-254.
Oliver-Smith, A., 2012: Debating environmental migration: society, nature and
population displacement in climate change. Journal of International
Development, 24, 1058-1070.
Olsson, J., W. Wang, L.P. Graham, J. Rosberg, and J. Andreasson, 2011: Using an
ensemble of climate projections for simulating recent and near-future
hydrological change to Lake Vanern in Sweden. Tellus Series A: Dynamic
Meteorology and Oceanography, 63(1), 126-137.
O’Neill, B.C. and V. Schweizer, 2011: Projection and prediction: mapping the road
ahead. Nature Climate Change, 1(7), 352-353.
O’Neill, B.C., E. Kriegler, K. Riahi, K.L. Ebi, S. Hallegatte, T.R. Carter, R. Mathur, and
D.P. van Vuuren, 2013: A new scenario framework for climate change research:
the concept of Shared Socio-Economic Pathways. Climatic Change (in press),
doi:10.1007/s10584-013-0905-2.
Osborne, T., G. Rose, and T. Wheeler, 2013: Variation in the global-scale impacts of
climate change on crop productivity due to climate model uncertainty and
adaptation. Agricultural and Forest Meteorology, 170, 183-194.
Paeth, H. and M. Diederich, 2011: Postprocessing of simulated precipitation for impact
studies in West Africa. Part II: a weather generator for daily data. Climate
Dynamics, 36(7-8), 1337-1348.
Paeth, H., N.M.J. Hall, M.A. Gaertner, M.D. Alonso, S. Moumouni, J. Polcher, P.M. Ruti,
A.H. Fink, M. Gosset, T. Lebel, A.T. Gaye, D.P. Rowell, W. Moufouma-Okia, D.
Jacob, B. Rockel, F. Giorgi, and M. Rummukainen, 2011: Progress in regional
downscaling of west Africanprecipitation. Atmospheric Science Letters, 12(1),
75-82.
Palosuo, T., K.C. Kersebaum, C. Angulo, P. Hlavinka, M. Moriondo, J.E. Olesen, R.H.
Patil, F. Ruget, C. Rumbaur, J. Takáč, M. Trnka, M. Bindi, B. Çaldağ, F. Ewert, R.
Ferrise, W. Mirschel, L. Şaylan, B. Šiška, and R. Rötter, 2011: Simulation of
winter wheat yield and its variability in different climates of Europe: a
comparison of eight crop growth models. European Journal of Agronomy,
35, 103-114.
Parmesan, C., C. Duarte, E. Poloczanska, A.J. Richardson, and M.C. Singer, 2011:
Overstretching attribution. Nature Climate Change, 1, 2-4.
Parry, M., N. Arnell, P. Berry, D. Dodman, S. Fankhauser, C. Hope, S. Kovats, R. Nicholls,
D. Satterthwaite, R. Tiffin, and T. Wheeler, 2009: Assessing the Costs of Adaptation
to Climate Change: A Review of the UNFCCC and Other Recent Estimates.
International Institute for Environment and Development (IIED) and Grantham
Institute for Climate Change, Imperial College London, UK, 111 pp.
Patt, A.G., D.P. van Vuuren, F. Berkhout, A. Aaheim, A.F. Hof, M. Isaac, and R. Mechler,
2010: Adaptation in integrated assessment modeling: where do we stand?
Climatic Change, 99, 383-402.
Perch-Nielsen, S.L., M.B. Bättig, and D. Imboden, 2008: Exploring the link between
climate change and migration. Climatic Change, 91, 375-393.
Perrels, A., N. Veijalainen, J. Jylhä, J. Aaltonen, R. Molarius, M. Porthin, J. Silander, T.
Rosqvist, T. Tuovinen, T. Carter, and S. Fronzek, 2010: The Implications of Climate
Change for Extreme Weather Events and their Socio-Economic Consequences
in Finland.VATT Research Reports 158/2010, Government Institute for Economic
Research, Helsinki, Finland, 133 pp.
Peters, G.P., 2010: Managing carbon leakage. Carbon Management, 1(1), 35-37.
Peters, G.P., J.C. Minx, C.L. Weber, and O. Edenhofer, 2011: Growth in emission transfers
via international trade from 1990 to 2008. Proceedings of the National Academy
of Sciences of the United States of America, 108(21), 8903-8908.
Piao, S., X. Wang, P. Caiais, T. Wang, and J. Liu, 2011: Changes in satellite-derived
vegetation growth trend in temperate and boreal Eurasia for 1982-2006.
Global Change Biology, 17(10), 3228-3239.

1194
Chapter 21 Regional Context
21
Piguet, E., 2010: Linking climate change, environmental degradation, and migration:
a methodological overview. Wiley Interdisciplinary Reviews: Climate Change,
1, 517-524.
Preston, B.L., E.J. Yuen, and R.M. Westaway, 2011: Putting vulnerability to climate
change on the map: a review of approaches, benefits, and risks. Sustainability
Science, 6, 177-202.
PriceWaterhouseCoopers, 2010: Adapting to Climate Change in the Infrastructure
Sectors: Maintaining Robust and Resilient Infrastructure Systems in the Energy,
Transport, Water and ICT Sectors. Report for the Adapting to Climate Change
Programme, UK Department for Environment, Food and Rural Affairs (DEFRA),
PriceWaterhouseCoopers, London, UK, 100 pp.
Pryor, S. and R. Barthelmie, 2011: Assessing climate change impacts on the near-
term stability of the wind energy resource over the United States. Proceedings
of the National Academy of Sciences of the United States of America, 108(20),
8167-8171.
Queensland Floods Commission of Inquiry, 2012: Final Report. State of Queensland,
Brisbane, Australia, 654 pp.
Rauscher, S.A., F. Giorgi, N.S. Diffenbaugh, and A. Seth, 2008: Extension and
intensification of the Meso-American mid-summer drought in the 21
st
century.
Climate Dynamics, 31(5), 551-571.
Rauscher, S.A., F. Kucharski, and A. Seth, 2011: The role of regional SST warming
variations in the drying of Meso-America in future climate projections. Journal
of Climate, 24(7), 2003-2016.
Rayner, N., D. Parker, E. Horton, C. Folland, L. Alexander, D. Rowell, E. Kent, and A.
Kaplan, 2003: Global analyses of sea surface temperature, sea ice, and night
marine air temperature since the late nineteenth century. Journal of Geophysical
Research, 108(D14), 4407, doi:10.1029/2002JD002670.
Reeder, T. and N. Ranger, 2010: How Do You Adapt in an Uncertain World? Lessons
from the Thames Estuary 2100 Project. Expert Perspectives Series, World
Resources Institute (WRI), Washington, DC, USA, 16 pp.
Rhein, M., S.R. Rintoul, S. Aoki, E. Campos, D. Chambers, R.A. Feely, S. Gulev, G.C.
Johnson, S.A. Josey, A. Kostianoy, C. Mauritzen, D. Roemmich, L. Talley, and F.
Wang, 2013: Observations: ocean. In: Climate Change 2013: The Physical
Science Basis. Contribution of Working Group I to the Fifth Assessment Report
of the Intergovernmental Panel on Climate Change. [Stocker, T.F., D. Qin, G.-
K. Plattner, M. Tignor, S.K. Allen, J. Boschung, A. Nauels, Y. Xia, V. Bex, and P.M.
Midgley (eds.)]. Cambridge University Press, Cambridge, UK and New York,
NY, USA, pp. 255-316.
Rienecker, M.M., M.J. Suarez, R. Gelaro, R. Todling, J. Bacmeister, E. Liu, M.G.
Bosilovich, S.D. Schubert, L. Takacs, and G. Kim, 2011: MERRA: NASA’s modern-
era retrospective analysis for research and applications. Journal of Climate,
24(14), 3624-3648.
Rosenberg, E.A., P.W. Keys, D.B. Booth, D. Hartley, J. Burkey, A.C. Steinemann, and
D.P. Lettenmaier, 2010: Precipitation extremes and the impacts of climate
change on stormwater infrastructure in Washington State. Climatic Change,
102(1), 319-349.
Rosenzweig, C. and P. Neofotis, 2013: Detection & attribution of anthropogenic climate
change impacts. Wiley Interdisciplinary Reviews: Climate Change, 4, 121-150.
Rosenzweig, C., D. Karoly, M. Vicarelli, P. Neofotis, Q. Wu, G. Casassa, A. Menzel, T.L.
Root, N. Estrella, B. Seguin, P. Tryjanowski, C. Liu, S. Rawlins, and A. Imeson,
2008: Attributing physical and biological impacts to anthropogenic climate
change. Nature, 453, 353-358.
Rosenzweig, C., W. Solecki, L. Parshall, B. Lynn, J. Cox, and R. Goldberg, 2009:
Mitigating New York City’s heat island: integrating stakeholder perspectives
and scientific evaluation. Bulletin of the American Meteorological Society,
90(9), 1297-1312.
Rosenzweig, C., W.D. Solecki, R. Blake, M. Bowman, C. Faris, V. Gornitz, R. Horton, K.
Jacob, A. LeBlanc, and R. Leichenko, 2011: Developing coastal adaptation to
climate change in the New York City infrastructure-shed: process, approach,
tools, and strategies. Climatic Change, 106(1), 93-127.
Rosenzweig, C., J.W. Jones, J.L. Hatfield, A.C. Ruane, K.J. Boote, P. Thorburn, J.M. Antle,
G.C. Nelson, C. Porter, S. Janssen, S. Asseng, B. Basso, F. Ewert, D. Wallach, G.
Baigorria, and J.M. Winter, 2013: The Agricultural Model Intercomparison and
Improvement Project (AgMIP): protocols and pilot studies. Agricultural and
Forest Meteorology, 170, 166-182.
Roshydromet, 2008: Assessment Report on Climate Change and its Consequences
in Russian Federation: General Summary. Federal Service for Hydrometeorology
and Environmental Monitoring (Roshydromet), Published by RIHMI-WDC,
Obninsk, Kaluga region, Russia, 24 pp.
Rötter, R.P., T.R. Carter, J.E. Olesen, and J.R. Porter, 2011: Crop-climate models need
an overhaul. Nature Climate Change, 1, 175-177.
Roudier, P., B. Sultan, P. Quirion, and A. Berg, 2011: The impact of future climate
change on West African crop yields: what does the recent literature say?
Global Environmental Change, 21(3), 1073-1083.
Rounsevell, M.D.A. and M.J. Metzger, 2010: Developing qualitative scenario storylines
for environmental change assessment. Wiley Interdisciplinary Reviews:
Climate Change, 1, 606-619.
Rowell, D.P. and R.G. Jones, 2006: Causes and uncertainty of future summer drying
over Europe. Climate Dynamics, 27(2), 281-299.
Rudolf, B., A. Becker, U. Schneider, A. Meyer-Christoffer, and M. Ziese, 2011: New
GPCC full data reanalysis version 5 provides high-quality gridded monthly
precipitation data. GEWEX News, 21(2), 4-5.
Ruuhela, R. (ed.), 2012: How Can We Prepare for Unavoidable Climate Change?
Summary Report of Finnish Adaptation Research in Different Sectors.
Publication of the Ministry of Agriculture and Forestry 6/2011, Helsinki, Finland,
176 pp.
Rygel, L., D. O’Sullivan, and B. Yarnal, 2006: A method for constructing a social
vulnerability index: an application to hurricane storm surges in a developed
country. Mitigation and Adaptation Strategies for Global Change, 11(3), 741-
764.
Saha, S., S. Moorthi, H. Pan, X. Wu, J. Wang, S. Nadiga, P. Tripp, R. Kistler, J. Woollen,
and D. Behringer, 2010: The NCEP climate forecast system reanalysis. Bulletin
of the American Meteorological Society, 91(8), 1015-1057.
Salathé, E.P., R. Steed, C.F. Mass, and P.H. Zahn, 2008: A high-resolution climate
model for the U.S. Pacific Northwest: mesoscale feedbacks and local responses
to climate change. Journal of Climate, 21, 5708-5726.
Salathé, E.P., L.R. Leung, Y. Qian, and Y. Zhang, 2010: Regional climate model
projections for the State of Washington. Climatic Change, 102(1), 51-75.
Schär, C., P.L. Vidale, D. Lüthi, C. Frei, C. Häberli, M.A. Liniger, and C. Appenzeller,
2004: The role of increasing temperature variability in European summer heat
wave. Nature, 427(6972), 332-336.
Schiermeier, Q., 2012: Models hone picture of climate impacts. Nature, 482(7385),
286, doi:10.1038/482286a.
Schipper, L. and M. Pelling, 2006: Disaster risk, climate change and international
development: scope for, and challenges to, integration. Disasters, 30, 19-38.
Schipper, L., W. Liu, D. Krawanchild, and S. Chanthy, 2010: Review of Climate Change
Adaptation Methods and Tools. MRC Technical Paper No. 34, Mekong River
Commission, Vientiane, Laos, 76 pp.
Schoof, J.T., S.C. Pryor, and J. Suprenant, 2010: Development of daily precipitation
projections for the United States based on probabilistic downscaling. Journal
of Geophysical Research, 115(D13), D13106, doi:10.1029/2009JD013030.
Schweiger, O., R.K. Heikkinen, A. Harpke, T. Hickler, S. Klotz, O. Kudrna, I. Kühn, J.
Pöyry, and J. Settele, 2012: Increasing range mismatching of interacting
species under global change is related to their ecological characteristics.
Global Ecology and Biogeography, 607, 88-99.
Schweizer, V.J. and E. Kriegler, 2012: Improving environmental change research with
systematic techniques for qualitative scenarios. Environmental Research
Letters, 7(4), 044011, doi:10.1088/1748-9326/7/4/044011.
Searchinger, T., R. Heimlich, R.A. Houghton, F. Dong, A. Elobeid, J. Fabiosa, S. Tokgoz, D.
Hayes, and T.-H. Yu, 2008: Use of U.S. croplands for biofuels increases greenhouse
gases through emissions from land-use change. Science, 319(5867), 1238-
1240.
SEI, 2009: Economics of Climate Change: Kenya. Stockholm Environment Institute
(SEI), Oxford Office, Oxford UK, 65 pp.
Seneviratne, S.I., D. Luthi, M. Litschi, and C. Schar, 2006: Land-atmosphere coupling
and climate change in Europe. Nature, 443(7108), 205-209.
Seneviratne, S.I., T. Corti, E.L. Davin, M. Hirschi, E.B. Jaeger, I. Lehner, B. Orlowsky,
and A.J. Teuling, 2010: Investigating soil moisture-climate interactions in a
changing climate: a review. Earth Science Reviews, 99(3-4), 125-161.
Seneviratne, S.I., N. Nicholls, D. Easterling, C.M. Goodess, S. Kanae, J. Kossin, Y. Luo,
J. Marengo, K. McInnes, M. Rahimi, M. Reichstein, A. Sorteberg, C. Vera, and
X. Zhang, 2012: Changesin climate extremes and theirimpacts on the
naturalphysicalenvironment. In: Managing the Risks of Extreme Events and
Disasters to Advance Climate Change Adaptation. A Special Report of Working
Groups I and II of the Intergovernmental Panel on Climate Change [Field, C.B.,
V. Barros, T.F. Stocker, D. Qin, D.J. Dokken, K.L. Ebi, M.D. Mastrandrea, K.J. Mach,
G.-K. Plattner, S.K. Allen, M. Tignor, and P.M. Midgley (eds.)]. Cambridge
University Press, Cambridge, UK and New York, NY, USA, pp. 109-230.

1195
Regional Context Chapter 21
21
Shindell, D.T., G. Faluvegi, D.S. Stevenson, M.C. Krol, L.K. Emmons, J.-F. Lamarque, G.
Pétron, F.J. Dentener, K. Ellingsen, M.G. Schultz, O. Wild, M. Amann, C.S.
Atherton, D.J. Bergmann, I. Bey, T. Butler, J. Cofala, W.J. Collins, R.G. Derwent,
R.M. Doherty, J. Drevet, H.J. Eskes, A.M. Fiore, M. Gauss, D.A. Hauglustaine,
L.W. Horowitz, I.S.A. Isaksen, M.G. Lawrence, V. Montanaro, J.-F. Müller, G.
Pitari, M.J. Prather, J.A. Pyle, S. Rast, J.M. Rodriguez, M.G. Sanderson, N.H.
Savage, S.E. Strahan, K. Sudo, S. Szopa, N. Unger, T.P.C. van Noije, and G. Zeng,
2006: Multimodel simulations of carbon monoxide: comparison with
observations and projected near-future changes. Journal of Geophysical
Research: Atmospheres, 111(D19), D19306, doi:10.1029/2006JD007100.
Shrestha, R.R., Y.B. Dibike, and T.D. Prowse, 2012: Modelling of climate-induced
hydrologic changes in the Lake Winnipeg watershed. Journal of Great Lakes
Research, 38, 83-94.
Sietz, D., M.K.B. Ludeke, and C. Walther, 2011: Categorisation of typical vulnerability
patterns in global drylands. Global Environmental Change, 21, 431-440.
Singh, R.P., S.R. Oza, and M.R. Pandya, 2006: Observing long-term changes in rice
phenology using NOAA-AVHRR and DMSP-SSM/I satellite sensor measurements
in Punjab, India. Current Science, 91(9), 1217-1221.
Sitch, S., C. Huntingford, N. Gednev, P.E. Levy, M. Lomas, S.L. Piao, R. Betts, P. Ciais,
P. Cox, P. Friedlingstein, C.D. Jones, I.C. Prentice, and F.I. Woodward, 2008:
Evaluation of the terrestrial carbon cycle, future plant geography and climate-
carbon cycle feedbacks using five Dynamic Global Vegetation Models (DGVMs).
Global Change Biology, 14, 1-25.
Smit, B. and J. Wandel, 2006: Adaptation, adaptive capacity and vulnerability. Global
Environmental Change, 16(3), 282-292.
Smith, A., 2009: Global warming reopens the Northeast Passage. Time Magazine,
17/09/09, content.time.com/time/world/article/0,8599,1924410,00.html.
Smith, L.C. and S.R. Stephenson, 2013: New Trans-Arctic shipping routes navigable
by midcentury. Proceedings of the National Academy of Sciences of the United
States of America, 110(13), 4871-4872.
Somanathan, E., T. Sterner, T. Sugiyama, D. Chimanikire, N. Dubash, J.K. Essandoh-
Yeddu, S. Fifita, L. Goulder, A. Jaffe, X. Labandeira, S. Managi, C. Mitchell, J.P.
Montero, F. Teng, and T. Zylicz, 2014: National and sub-national policies and
institutions. In: Climate Change 2014: Mitigation of Climate Change.
Contribution of Working Group III to the Fifth Assessment Report of the
Intergovernmental Panel on Climate Change [Edenhofer, O., et al. (eds.)].
Cambridge University Press, Cambridge, UK and New York, NY, USA (in press).
Sommer, U., N. Aberle, A. Engel, T. Hansen, K. Lengfellner, M. Sandow, J. Wohlers, E.
Zöllner, and U. Riebesell, 2007: An indoor mesocosm system to study the effect
of climate change on the late winter and spring succession of Baltic Sea
phyto- and zooplankton. Oecologia, 150(4), 655-667.
Song, R.Y., X.J. Gao, H.Q. Zhang, and A. Moise, 2008: 20 km resolution regional climate
model experiments over Australia: experimental design and simulations of
current climate. Australian Meteorological Magazine, 57(3), 175-193.
Sorensson, A.A., C.G. Menendez, R. Ruscica, P. Alexander, P. Samuelsson, and U.
Willen, 2010: Projected precipitation changes in South America: a dynamical
downscaling within CLARIS. Meteorologische Zeitschrift, 19(4), 347-355.
Stafford Smith, M., L. Horrocks, A. Harvey, and C. Hamilton, 2011: Rethinking
adaptation for a 4°C world. Philosophical Transactions of the Royal Society
A, 369, 196-216.
Stavins, R., Z. Ji, T. Brewer, M. Conte Grand, M. den Elzen, M. Finus, J. Gupta, N. Höhne,
M.-K. Lee, A. Michaelowa, M. Paterson, K. Ramakrishna, G. Wen, J. Wiener,
and H. Winkler, 2014: International cooperation: agreements and instruments.
In: Climate Change 2014: Mitigation of Climate Change. Contribution of
Working Group III to the Fifth Assessment Report of the Intergovernmental
Panel on Climate Change [Edenhofer, O., et al. (eds.)]. Cambridge University
Press, Cambridge, UK and New York, NY, USA (in press).
Steiner, A.L., S. Tonse, R.C. Cohen, A.H. Goldstein, and R.A. Harley, 2006: Influence
of future climate and emissions on regional air quality in California. Journal
of Geophysical Research, 111(D18), D18303, doi:10.1029/2005JD006935.
Stephenson, S.R., L.C. Smith, and J.A. Agnew, 2011: Divergent long-term trajectories
of human access to the Arctic. Nature Climate Change, 1, 156-160.
Stephenson, S.R., L.W. Brigham, L.C. Smith, and J.A. Agnew, 2013: Projected 21
st
-
century changes to Arctic marine access. Climatic Change, 118(3-4), 885-899.
Stern, N., 2007: The Economics of Climate Change: The Stern Review. Cambridge
University Press, Cambridge, UK, 692 pp.
Stevenson, D.S., F.J. Dentener, M.G. Schultz, K. Ellingsen, T.P.C. van Noije, O. Wild, G.
Zeng, M.M. Amann, C.S. Atherton, N. Bell, D.J. Bergmann, I. Bey, T. Butler, J.J.
Cofala, W.J. Collins, R.G. Derwent, R.M. Doherty, J. Drevet, H.J. Eskes, A.M.
Fiore, M. Gauss, D.A. Hauglustaine, L.W. Horowitz, I.S.A. Isaksen, M.C. Krol,
J.-F. Lamarque, M.G. Lawrence, V. Montanaro, J.-F. Müller, G. Pitari, M.J. Prather,
J.A. Pyle, S. Rast, J.M. Rodriguez, M.G. Sanderson, N.H. Savage, D.T. Shindell,
S.E. Strahan, K. Sudo, and S. Szopa, 2006: Multimodel ensemble simulations
of present day and near future tropospheric ozone. Journal of Geophysical
Research, 111(D8), D08301, doi:10.1029/2005JD006338.
Stokke, O.S., 2007: A legal regime for the Arctic? Interplay with the Law of the Sea
Convention. Marine Policy, 31(4), 402-408.
Subin, Z.M., W.J. Riley, J. Jin, D.S. Christianson, M.S. Torn, and L.M. Kueppers, 2011:
Ecosystem feedbacks to climate change in California: development, testing,
and analysis using a coupled regional atmosphere and land surface model
(WRF3–CLM3.5). Earth Interactions, 15(15), 1-38, doi:10.1175/2010EI331.1.
Sutherst, R.W., F. Constable, K.J. Finlay, R. Harrington, J. Luck, and M.P. Zalucki, 2011:
Adapting to crop pest and pathogen risks under a changing climate. Wiley
Interdisciplinary Reviews: Climate Change, 2, 220-237.
Swanson, D.A., J.C. Hiley, H.D. Venema, and R. Grosshans, 2007: Indicators of Adaptive
Capacity to Climate Change for Agriculture in the Prairie Region of Canada:
An Analysis based on Statistics Canada’s Census of Agriculture. Working Paper
for the Prairie Climate Resilience Project, International Institute for Sustainable
Development (IISD), Winnipeg, ON, Canada, 56 pp.
Szopa, S. and D.A. Hauglustaine, 2007: Relative impacts of worldwide tropospheric
ozone changes and regional emission modifications on European surface
ozone levels. Comptes Rendus Geoscience, 339(11), 709-720.
Tänzler, D., A. Maas, and A. Carius, 2010: Climate change adaptation and peace.
Wiley Interdisciplinary Reviews: Climate Change, 1, 741-750.
Tao, F. and Z. Zhang, 2013: Climate change, wheat productivity and water use in the
North China Plain: a new super-ensemble-based probabilistic projection.
Agricultural and Forest Meteorology, 170, 146-165.
Taylor, C.M., D.J. Parker, N. Kalthoff, M.A. Gaertner, N. Philippon, S. Bastin, P.P. Harris,
A. Boone, F. Guichard, A. Agusti-Panareda, M. Baldi, P. Cerlini, L. Descroix, H.
Douville, C. Flamant, J.-Y. Grandpeix, and J. Polcher, 2011: New perspectives
on land-atmosphere feedbacks from the African Monsoon Multidisciplinary
Analysis. Atmospheric Science Letters, 12(1), 38-44.
Taylor, K.E., R.J. Stouffer, and G.A. Meehl, 2012: A summary of the CMIP5 experiment
design. Bulletin of the American Meteorological Society, 93, 485-498.
Tebaldi, C. and D. Lobell, 2008: Towards probabilistic projections of climate change
impacts on global crop yields. Geophysical Research Letters, 35(8), L08705,
doi:10.1029/2008GL033423.
Tebaldi, C., J.M. Arblaster, and R. Knutti, 2011: Mapping model agreement on future
climate projections. Geophysical Research Letters, 38(23), L23701, doi:10.1029/
2011GL049863.
Thomas, C.D., 2011: Translocation of species, climate change, and the end of trying
to recreate past ecological communities. Trends in Ecology & Evolution, 26,
216-221.
Thorne, P.W. and R.S. Vose, 2010: Reanalyses suitable for characterizing long-term
trends are they really achievable? Bulletin of the American Meteorological
Society, 91(3), 353-361.
Timbal, B., P. Hope, and S. Charles, 2008: Evaluating the consistency between statistically
downscaled and global dynamical model climate change projections. Journal
of Climate, 21(22), 6052-6059.
Todd, M.C., R.G. Taylor, T.J. Osborn, D.G. Kingston, N.W. Arnell, and S.N. Gosling, 2011:
Uncertainty in climate change impacts on basin-scale freshwater resources –
preface to the special issue: the QUEST-GSI methodology and synthesis of
results. Hydrology and Earth System Sciences, 15, 1035-1046.
Tolika, C.K., P. Zanis, and C. Anagnostopoulou, 2012: Regional climate change scenarios
for Greece: future temperature and precipitation projections from ensembles
of RCMs. Global NEST Journal, 14(4), 407-421.
Traill, L.W., M.L.M. Lim, N.S. Sodhi, and C.J.A. Bradshaw, 2010: Mechanisms driving
change: altered species interactions and ecosystem function through global
warming. Journal of Animal Ecology, 79, 937-947.
Tran, P., R. Shaw, G. Chantry, and J. Norton, 2009: GIS and local knowledge in disaster
management: flood risk mapping in Viet Nam. Disasters, 33(1), 152-169.
Trenberth, K.E., 2011: Changes in precipitation with climate change. Climate Research,
47(1), 123-138.
Trenberth, K.E., A. Dai, R.M. Rasmussen, and D.B. Parsons, 2003: Bulletin of the
American Meteorological Society, 84(9), 1205-1217.
Trivedi, M.R., P.M. Berry, M.D. Morecroft, and T.P. Dawson, 2008: Spatial scale affects
bioclimate model projections of climate change impacts on mountain plants.
Global Change Biology, 14, 1089-1103.

1196
Chapter 21 Regional Context
21
Trostle, R., D. Marti, S. Rosen, and P. Westcott, 2011: Why Have Food Commodity
Prices Risen Again? WRS-1103, Economic Research Service, U.S. Department
of Agriculture (USDA), Washington, DC, USA, 29 pp.
Tzanopoulos, J., R. Mouttet, A. Letourneau, I.N. Vogiatzakis, S.G. Potts, K. Henle, R.
Mathevet, and P. Marty, 2013: Scale sensitivity of drivers of environmental
change across Europe. Global Environmental Change, 23, 167-178.
Uherek, E., T. Halenka, J. Borken-Kleefeld, Y. Balkanski, T. Berntsen, C. Borrego, M.
Gauss, P. Hoor, K. Juda-Rezler, J. Lelieveld, D. Melas, K. Rypdal, and S. Schmid,
2010: Transport impacts on atmosphere and climate: land transport.
Atmospheric Environment, 44(37), 4772-4816.
UNFCCC, 2008: Compendium on Methods and Tools to Evaluate Impacts of and
Vulnerability to Climate Change. United Nations Framework Convention on
Climate Change (UNFCCC), UNFCCC Secretariat, Bonn, Germany, 228 pp.
UNFCCC, 2007: Investment and Financial Flows to Address Climate Change. United
Nations Framework Convention on Climate Change (UNFCCC), UNFCCC
Secretariat, Bonn, Germany, 272 pp.
UNFPA, 2007: State of the World Population 2007: Unleashing the Potential of Urban
Growth. United Nations Population Fund (UNFPA), New York, NY, USA, 100 pp.
van Aalst, M.K., T. Cannon, and I. Burton, 2008: Community level adaptation to climate
change: the potential role of participatory community risk assessment. Global
Environmental Change: Human and Policy Dimensions, 18(1), 165-179.
van Ruijven, B.J., M. Levy, A. Agrawal, F. Biermann, J. Birkmann, T.R. Carter, K.L. Ebi,
M. Garschagen, B. Jones, R. Jones, E. Kemp-Benedict, M. Kok, K. Kok, M.C.
Lemos, P.L. Lucas, B. Orlove, S. Pachauri, T. Parris, A. Patwardhan, A. Petersen,
B.L. Preston, J. Ribot, D.S. Rothman, and V.J. Schweizer, 2013: Enhancing the
relevance of Shared Socioeconomic Pathways for climate change impacts,
adaptation and vulnerability research. Climatic Change (in press), doi:
10.1007/s10584-013-0931-0.
van Vuuren, D.P. and B.C. O’Neill, 2006: The consistency of IPCC’s SRES scenarios to
1990-2000 trends and recent projections. Climatic Change, 75(1), 9-46.
van Vuuren, D.P., S.J. Smith, and K. Riahi, 2010: Downscaling socioeconomic and
emissions scenarios for global environmental change research: a review.
WIREs Climate Change, 1(3), 393-404.
van Vuuren, D.P., J. Edmonds, M. Kainuma, K. Riahi, A. Thomson, K. Hibbard, G.C. Hurtt,
T. Kram, V. Krey, J.-F. Lamarque, T. Masui, M. Meinshausen, N. Nakicenovic, S.J.
Smith, and S.K. Rose, 2011: The representative concentration pathways: an
overview. Climatic Change, 109(1-2), 5-31.
van Vuuren, D.P., K. Riahi, R. Moss, J. Edmonds, A. Thomson, N. Nakicenovic, T. Kram,
F. Berkhout, R. Swart, A. Janetos, S.K. Rose, and N. Arnell, 2012: A proposal for
a new scenario framework to support research and assessment in different
climate research communities. Global Environmental Change, 22, 21-35.
van Vuuren, D.P., E. Kriegler, B.C. O’Neill, K.L. Ebi, K. Riahi, T.R. Carter, J. Edmonds, S.
Hallegatte, T. Kram, R. Mathur, and H. Winkler, 2013: A new scenario framework
for climate change research: scenario matrix architecture. Climatic Change
(in press), doi: 10.1007/s10584-013-0906-1.
Vaughan, D.G., J.C. Comiso, I. Allison, J. Carrasco, G. Kaser, R. Kwok, P. Mote, T.
Murray, F. Paul, J. Ren, E. Rignot, O. Solomina, K. Steffen, and T. Zhang, 2013:
Observations: cryosphere. In: Climate Change 2014: The Physical Science Basis.
Contribution of Working Group I to the Fifth Assessment Report of the
Intergovernmental Panel on Climate Change [Stocker, T.F., D. Qin, G.-K.
Plattner, M. Tignor, S.K. Allen, J. Boschung, A. Nauels, Y. Xia, V. Bex, and P.M.
Midgley eds.)]. Cambridge University Press, Cambridge, UK and New York, NY,
USA, pp. 317-382.
Villa, F. and H. McLeod, 2002: Environmental vulnerability indicators for environmental
planning and decision-making: guidelines and applications. Environmental
Management, 29(3), 335-348.
Waha, K., C. Müller, A. Bondeau, J.P. Dietrich, P. Kurukulasuriya, J. Heinke, and H.
Lotze-Campen, 2013: Adaptation to climate change through the choice of
cropping system and sowing date in sub-Saharan Africa. Global Environmental
Change, 23(1), 130-143.
Wang, E., P. McIntosh, Q. Jiang, and J. Xu, 2009: Quantifying the value of historical
climate knowledge and climate forecasts using agricultural systems modelling.
Climatic Change, 96, 45-61.
Wang, X., P. Gong, Y. Zhao, Y. Xu, X. Cheng, Z. Niu, Z. Luo, H. Huang, F. Sun, and X. Li,
2013: Water-level changes in China’s large lakes determined from
ICESat/GLAS data. Remote Sensing of Environment, 132, 131-144.
Ward, P., S. Pelt, O. Keizer, J. Aerts, J. Beersma, B. den Hurk, and A. te Linde, 2013:
Including climate change projections in probabilistic flood risk assessment.
Journal of Flood Risk Management, doi: 10.1111/jfr3.12029.
Warner, K., 2010: Global environmental change and migration: governance challenges.
Global Environmental Change, 20, 402-413.
Washington, R., M. Harrison, D. Conway, E. Black, A. Challinor, D. Grimes, R. Jones, A.
Morse, G. Kay, and M. Todd, 2006: African climate change:taking the shorter
route. Bulletin of the American Meteorological Society, 87(10), 1355-1366.
Watkiss, P. (ed.), 2011a: The ClimateCost Project: Final Report, Volume 1: Europe.
Stockholm Environment Institute (SEI), Stockholm, Sweden, 16 pp.
Watkiss, P., 2011b: Aggregate economic measures of climate change damages:
explaining the differences and implications. Wiley Interdisciplinary Reviews:
Climate Change, 2, 356-372.
Watkiss, P. and A. Hunt, 2012: Projection of economic impacts of climate change in
sectors of Europe based on bottom up analysis: human health. Climatic
Change, 112(1), 101-126.
Watkiss, P., T. Downing, S. Pye, M. Savage, J. Goodwin, M. Longanecker, and S. Lynn,
2011: The Economics of Climate Change in the United Republic of Tanzania.
Report prepared for Development Partners Group on Environment and
Climate Change and the Department for International Development (DFID),
by the Global Climate Adaptation Partnership (GCAP) with SEI and other
partners, GCAP, Oxford, UK, 118 pp.
Watterson, I.G., 2008: Calculation of probability density functions for temperature
and precipitation change under global warming. Journal of Geophysical
Research: Atmospheres, 113(D12), D12106, doi:10.1029/2007JD009254.
Watterson, I., 2011: Calculation of joint PDFs for climate change with properties
matching recent Australian projections. Australian Meteorological and
Oceanographic Journal, 61(4), 211-219.
Watterson, I. and P. Whetton, 2011: Joint PDFs for Australian climate in future
decades and an idealized application to wheat crop yield. Australian
Meteorological and Oceanographic Journal, 61(4), 221-230.
Watterson, I.G., J.L. McGregor, and K.C. Nguyen, 2008: Changes in extreme temperatures
in Australasian summer simulated by CCAM under global warming, and the role
of winds and land-sea contrasts. Australian Meteorological Magazine, 57(3),
195-212.
Weaver, C.P., E. Cooter, R. Gilliam, A. Gilliland, A. Grambsch, D. Grano, B. Hemming,
S.W. Hunt, C. Nolte, and D.A. Winner, 2009: A preliminary synthesis of modeled
climate change impacts on U.S. regional ozone concentrations. Bulletin of the
American Meteorological Society, 90(12), 1843-1863.
Weeks, A.R., C.M. Sgro, A.G. Young, R. Frankham, N.J. Mitchell, K.A. Miller, M. Byrne,
D.J. Coates, M.D.B. Eldridge, P. Sunnucks, M.F. Breed, E.A. James, and A.A.
Hoffmann, 2011: Assessing the benefits and risks of translocations in changing
environments: a genetic perspective. Evolutionary Applications, 4(6), 709-725.
Wetterhall, F., L.P. Graham, J. Andréasson, J. Rosberg, and W. Yang, 2011: Using
ensemble climate projections to assess probabilistic hydrological change in
the Nordic region. Natural Hazards and Earth System Science, 11, 2295-2306.
White, J.W., G. Hoogenboom, B.A. Kimball, and G.W. Wall, 2011: Methodologies for
simulating impacts of climate change on crop production. Field Crops
Research, 124, 357-368.
Wilby, R.L., J. Troni, Y. Biot, L. Tedd, B.C. Hewitson, D.M. Smith, and R.T. Sutton, 2009:
A review of climate risk information for adaptation and development
planning. International Journal of Climatology, 29, 1193-1215.
Williams, A.P., C.D. Allen, A.K. Macalady, D. Griffin, C.A. Woodhouse, D.M. Meko, T.W.
Swetnam, S.A. Rauscher, R. Seager, and H.D. Grissino-Mayer, 2013: Temperature
as a potent driver of regional forest drought stress and tree mortality. Nature
Climate Change, 3, 292-297.
Williams, J.W., S.T. Jackson, and J.E. Kutzbach, 2007: Projected distributions of novel
and disappearing climates by 2100 AD. Proceedings of the National Academy
of Sciences of the United States of America, 104, 5738-5742.
Willows, R. and R. Connell, 2003: Climate Adaptation: Risk, Uncertainty, and Decision-
making. UKCIP Technical Report, UK Climate Impacts Programme (UKCIP),
Oxford, UK, 154 pp.
Wisner, B., P. Blaikie, T. Cannon, and I. Davis, 2004: At Risk, Natural Hazards, People’s
Vulnerability and Disasters. Routledge, Abingdon, UK and New York, NY, USA,
471 pp.
Wittig, V.E., E.A. Ainsworth, S.L. Naidu, D.F. Karnosky, and S.P. Long, 2009: Quantifying
the impact of current and future tropospheric ozone on tree biomass, growth
physiology and biochemistry. Global Change Biology, 15(2), 396-424.
World Bank, 2010a: The Costs to Developing Countries of Adapting to Climate
Change: New Methods and Estimates. The Global Report of the Economics
of Adaptation to Climate Change Study, Consultation Draft, The World Bank
Group, Washington, DC, USA, 84 pp.

1197
Regional Context Chapter 21
21
World Bank, 2010b: Economics of Adaptation to Climate Change: Social Synthesis
Report. The International Bank for Reconstruction and Development / The
World Bank, Washington, DC, USA, 116 pp.
World Weather Watch, 2005: World Weather Watch: Twenty-Second Status Report
on Implementation. WMO-No. 986, World Meteorological Organization
(WMO) Secretariat, Geneva, Switzerland, 60 pp.
WTO and UNEP, 2009: Trade and Climate Change.World Trade Organization (WTO) and
United Nations Environment Programme (UNEP), WTO, Geneva, Switzerland,
166 pp.
Xu, Y., X.J. Gao, and F. Giorgi, 2009: Regional variability of climate change hotspots
in East Asia. Advances in Atmospheric Sciences, 26(4), 783-792.
Yatagai, A., K. Kamiguchi, O. Arakawa, A. Hamada, N. Yasutomi, and A. Kitoh, 2012:
APHRODITE: constructing a long-term daily gridded precipitation dataset for
Asia based on a dense network of rain gauges. Bulletin of the American
Meteorological Society, 93(9), 1401-1415.
Yin, C., Y. Li, W. Ye, J.F. Bornman, and X. Yan, 2010: Statistical downscaling of regional
daily precipitation over southeast Australia based on self-organizing maps.
Theoretical and Applied Climatology, 105(1-2), 11-26.
Zanis, P., I. Kapsomenakis, C. Philandras, K. Douvis, D. Nikolakis, E. Kanellopoulou, C.
Zerefos, and C. Repapis, 2009: Analysis of an ensemble of present day and
future regional climate simulations for Greece. International Journal of
Climatology, 29(11), 1614-1633.
Zanis, P., E. Katragkou, I. Tegoulias, A. Poupkou, D. Melas, P. Huszar, and F. Giorgi,
2011: Evaluation of near surface ozone in air quality simulations forced by a
regional climate model over Europe for the period 1991-2000. Atmospheric
Environment, 45(36), 6489-6500.
Zhang, Q., H. Körnich, and K. Holmgren, 2012: How well do reanalyses represent the
southern African precipitation? Climate Dynamics, 40(3-4), 951-962.
Zhang, X., L. Alexander, G.C. Hegerl, P. Jones, A.K. Tank, T.C. Peterson, B. Trewin, and
F.W. Zwiers, 2011: Indices for monitoring changes in extremes based on daily
temperature and precipitation data. Wiley Interdisciplinary Reviews: Climate
Change, 2(6), 851-870.
Zhang, Y., X.-M. Hu, L.R. Leung, and W.I. Gustafson, 2008: Impacts of regional climate
change on biogenic emissions and air quality. Journal of Geophysical
Research, 113(D18), D18310, doi:10.1029/2008JD009965.
Ziervogel, G. and P.J. Ericksen, 2010: Adapting to climate change to sustain food
security. Wiley Interdisciplinary Reviews: Climate Change, 1, 525-540.
Ziervogel, G. and A. Taylor, 2008: Feeling stressed: integrating climate adaptation
with other priorities in South Africa. Environment: Science and Policy for
Sustainable Development, 50(2), 32-41.
Ziervogel, G., P. Johnston, M. Matthew, and P. Mukheibir, 2010: Using climate
information for supporting climate change adaptation in water resource
management in South Africa. Climatic Change, 103, 537-554.
Zoomers, A., 2011: Introduction: rushing for land: equitable and sustainable
development in Africa, Asia and Latin America. Development, 54(1), 12-20.
Zurek, M.B. and T. Henrichs, 2007: Linking scenarios across geographical scales in
international environmental assessments. Technological Forecasting and
Social Change, 74, 1282-1295.
