
411
6
Ocean Systems
Coordinating Lead Authors:
Hans-O. Pörtner (Germany), David M. Karl (USA)
Lead Authors:
Philip W. Boyd (New Zealand/Australia), William W.L. Cheung (Canada),
Salvador E. Lluch-Cota (Mexico), Yukihiro Nojiri (Japan), Daniela N. Schmidt (UK),
Peter O. Zavialov (Russian Federation)
Contributing Authors:
Jürgen Alheit (Germany), Javier Aristegui (Spain), Claire Armstrong (Norway),
Gregory Beaugrand (France), Vsevolod Belkovich (Russian Federation), Chris Bowler (France),
Peter Brewer (USA), Matthew Church (USA), Sarah R. Cooley (USA), Pablo del Monte-Luna
(Mexico), Martin Edwards (UK), Mikhail Flint (Russian Federation), Michael J. Follows (USA),
Thomas Frölicher (Switzerland), Elizabeth A. Fulton (Australia), Jean-Pierre Gattuso (France),
Ove Hoegh-Guldberg (Australia), Eileen E. Hofmann (USA), Andrew H. Knoll (USA),
Lisa A. Levin (USA), Lena Menzel (Germany), Coleen L. Moloney (South Africa), R. Ian Perry
(Canada), Elvira S. Poloczanska (Australia), J. Murray Roberts (UK), Björn Rost (Germany),
Jorge L. Sarmiento (USA), Jan Sedláček (Switzerland), Daniela Storch (Germany),
Christian Wiencke (Germany), Astrid C. Wittmann (Germany)
Review Editors:
Kenneth F. Drinkwater (Norway), Alexander Polonsky (Ukraine)
Volunteer Chapter Scientists:
Lena Menzel (Germany), Astrid C. Wittmann (Germany)
This chapter should be cited as:
Pörtner
, H.-O., D.M. Karl, P.W. Boyd, W.W.L. Cheung, S.E. Lluch-Cota, Y. Nojiri, D.N. Schmidt, and P.O. Zavialov,
2014: Ocean systems. In: Climate Change 2014: Impacts, Adaptation, and Vulnerability. Part A: Global and
Sectoral Aspects. Contribution of Working Group II to the Fifth Assessment Report of the Intergovernmental
Panel on Climate Change [Field, C.B., V.R. Barros, D.J. Dokken, K.J. Mach, M.D. Mastrandrea, T.E. Bilir,
M. Chatterjee, K.L. Ebi, Y.O. Estrada, R.C. Genova, B. Girma, E.S. Kissel, A.N. Levy, S. MacCracken,
P.R. Mastrandrea, and L.L. White (eds.)]. Cambridge University Press, Cambridge, United Kingdom and New
York, NY, USA, pp. 411-484.

6
412
Executive Summary ........................................................................................................................................................... 414
6.1. Introduction: Point of Departure, Observations, and Projections ........................................................................... 417
6.1.1. Changes in Physical and Chemical Variables .................................................................................................................................... 418
6.1.1.1.Temperature and Salinity ..................................................................................................................................................... 418
6.1.1.2.Carbon Dioxide-Induced Acidification .................................................................................................................................. 418
6.1.1.3.Hypoxia ................................................................................................................................................................................ 418
6.1.1.4.Light and Nutrients .............................................................................................................................................................. 420
6.1.2. Historical and Paleo-Records ............................................................................................................................................................ 420
6.1.2.1.Historical Observations ........................................................................................................................................................ 420
6.1.2.2.Paleontological Records ....................................................................................................................................................... 421
6.2. Diversity of Ocean Ecosystems and Their Sensitivities to Climate Change ............................................................ 423
6.2.1. Pelagic Biomes and Ecosystems ........................................................................................................................................................ 424
6.2.2. Benthic Habitats and Ecosystems ..................................................................................................................................................... 424
6.3. Climate Change Impacts from Organism to Ecosystem .......................................................................................... 424
6.3.1. Temperature Effects .......................................................................................................................................................................... 427
6.3.1.1.Principles .............................................................................................................................................................................. 427
6.3.1.2.Microbes .............................................................................................................................................................................. 428
6.3.1.3.Macroalgae and Seagrasses ................................................................................................................................................. 429
6.3.1.4.Animals ................................................................................................................................................................................ 429
6.3.1.5.Ecosystems ........................................................................................................................................................................... 431
Box 6-1. An Atlantic Ocean Example: Long-Term Responses of Pelagic Organisms and Communities to Temperature .. 434
6.3.2. Carbon Dioxide Effects ..................................................................................................................................................................... 432
6.3.2.1.Principles .............................................................................................................................................................................. 436
6.3.2.2.Microbes .............................................................................................................................................................................. 439
6.3.2.3.Macroalgae and Seagrasses ................................................................................................................................................. 440
6.3.2.4.Animals ................................................................................................................................................................................ 440
6.3.2.5.Ecosystems ........................................................................................................................................................................... 441
6.3.3. Life in Hypoxia and Anoxia ............................................................................................................................................................... 443
6.3.3.1.Principles .............................................................................................................................................................................. 443
6.3.3.2.Microbes .............................................................................................................................................................................. 443
6.3.3.3.Animals and Plants .............................................................................................................................................................. 443
6.3.3.4.Ecosystems ........................................................................................................................................................................... 443
6.3.4. Mixed Layer Depth and Light Shaping Net Primary Production ........................................................................................................ 444
6.3.5. Concurrent Responses to Multiple Drivers ........................................................................................................................................ 445
6.3.5.1.Principles .............................................................................................................................................................................. 446
6.3.5.2.Microbes .............................................................................................................................................................................. 447
6.3.5.3.Animals and Plants .............................................................................................................................................................. 447
Table of Contents

413
Ocean Systems Chapter 6
6
6.3.5.4.Ecosystems ........................................................................................................................................................................... 448
6.3.6. Food Web Consequences .................................................................................................................................................................. 448
6.3.7. Marine Reptiles, Mammals, and Birds ............................................................................................................................................... 448
6.3.7.1.Principles .............................................................................................................................................................................. 448
6.3.7.2.Field Observations ................................................................................................................................................................ 449
6.3.8. Summary and Conclusions ................................................................................................................................................................ 450
6.4. Human Activities in Marine Ecosystems: Adaptation Benefits and Threats ............................................................ 451
6.4.1. Ecosystem Services ........................................................................................................................................................................... 452
6.4.1.1.Food from the Sea ................................................................................................................................................................ 452
6.4.1.2.Other Provisioning Services .................................................................................................................................................. 453
6.4.1.3.Climate Regulation and Extreme Events .............................................................................................................................. 453
6.4.1.4.Cultural Services ................................................................................................................................................................... 453
6.4.1.5.Supporting Services .............................................................................................................................................................. 453
6.4.2. Management-Related Adaptations and Risks ................................................................................................................................... 453
6.4.2.1.Ecosystem Management ...................................................................................................................................................... 453
6.4.2.2.Geoengineering Approaches ................................................................................................................................................ 454
6.4.2.3.Health Issues ........................................................................................................................................................................ 454
6.4.3. Conclusions ...................................................................................................................................................................................... 456
6.5. Projections of Future Climate Change Impacts through Modeling Approaches ..................................................... 456
6.5.1. Oceanic Primary Production .............................................................................................................................................................. 456
6.5.2. Higher Trophic Levels ........................................................................................................................................................................ 456
6.5.3. Ecosystems and Fisheries .................................................................................................................................................................. 457
6.5.4. Conclusions ...................................................................................................................................................................................... 459
6.6. Chapter Conclusions and Key Uncertainties ........................................................................................................... 461
6.6.1. Key Risks Related to Climate Change: Constraints on Ecosystem Services ....................................................................................... 461
6.6.1.1.Redistribution and Constraints on Microbial Functions and Primary Productivity ................................................................ 461
6.6.1.2.Warming-Induced Species Redistribution, Loss of Biodiversity, and Fisheries Catch Potential .............................................. 461
6.6.1.3.Expanding Hypoxia Affecting Marine Resources .................................................................................................................. 464
6.6.1.4.Constraints on Marine Calcifiers and Associated Fisheries and Aquaculture due to Ocean Acidification .............................. 464
6.6.1.5.Interactions of Climate-Related Drivers Exacerbating Impacts on Organisms, Ecosystems, and Their Services ..................... 465
6.6.2. Key Uncertainties .............................................................................................................................................................................. 465
References ......................................................................................................................................................................... 465
Frequently Asked Questions
6.1: Why are climate impacts on oceans and their ecosystems so important? ........................................................................................ 417
6.2: What is different about the effects of climate change on the oceans compared to the land,
and can we predict the consequences? ............................................................................................................................................ 426
6.3: Why are some marine organisms affected by ocean acidification? ................................................................................................... 436
6.4: What changes in marine ecosystems are likely because of climate change? .................................................................................... 451

414
Chapter 6 Ocean Systems
6
Executive Summary
Ocean ecosystems have responded and will continue to respond to climate changes of different rates, magnitudes, and durations
(virtually certain). Human societies depend on marine ecosystem services, which are sensitive to climate change (high confidence),
in particular the provisioning of food (fisheries and aquaculture) and other natural resources; nutrient recycling; regulation of global climate
including production of oxygen (O
2
) and removal of atmospheric carbon dioxide (CO
2
); protection from extreme weather and climate events;
and aesthetic, cultural, and supporting services. {6.3, 6.4, 6.5}
Climate change alters physical, chemical, and biological properties of the ocean (very high confidence). Oceanic drivers include
salinity, circulation, temperature, carbon dioxide (CO
2
), oxygen (O
2
), nutrients, and light. These drivers shape the physiological performance of
individual cells and organisms and ultimately determine ecosystem composition, spatial structure, and functioning. {6.1.1, 6.3}
The fossil record and present field and laboratory observations confirm links between key environmental drivers and responses
of ocean ecosystems to climate change (high confidence). For millions of years in Earth history, natural climate change at rates slower
than today’s anthropogenic change has led to significant ecosystem shifts (high confidence), including species emergences and extinctions
(high confidence). Contemporary multi-decadal natural climate variations associated with regional transient warming periods by 1°C have led
to fundamental restructuring of ecosystems and large socioeconomic implications (high confidence). {6.1.2, 6.3.1, 6.4}
Vulnerability of most organisms to warming is set by their physiology, which defines their limited temperature ranges and hence
their thermal sensitivity (high confidence). Temperature defines the geographic distribution of many species and their responses to climate
change. Shifting temperature means and extremes alter habitat (e.g., sea ice and coastal), and cause changes in abundance through local
extinctions and latitudinal expansions or shifts (very high confidence). Vulnerability is greatest in polar animals owing to their narrow temperature
ranges (medium confidence) and in tropical species living close to upper thermal limits (medium confidence). Although genetic adaptation occurs
(medium confidence), the capacity of present-day fauna and flora to compensate for or keep up with the rate of ongoing thermal change is
limited (low confidence). {6.3.1, 6.3.5, 6.5.2}
The warming-induced shifts in the abundance, geographic distribution, migration patterns, and timing of seasonal activities of
species (very high confidence) have been and will be paralleled by a reduction in their maximum body size (medium confidence).
This has resulted and will further result in changing interactions between species, including competition and predator-prey
dynamics (high confidence).
Numerous observations over the last decades in all ocean basins show global-scale changes including large-
scale distribution shifts of species (very high confidence) and altered ecosystem composition (high confidence) on multi-decadal time scales,
tracking climate trends. The distribution and abundance of many fishes and invertebrates have shifted poleward and/or to deeper, cooler waters
(high confidence). Poleward displacements of phyto- and zooplankton have occurred by hundreds of kilometers per decade (high confidence).
Some warm-water corals and their reefs have responded with species replacement, bleaching, and a decreased coral cover causing habitat loss
(high confidence). While marine reptiles such as turtles encounter direct effects of warming, impacts to seabirds and marine mammals are
mostly indirect through effects of warming on their prey (high confidence). {6.3.1, 6.3.7, 6.5, Boxes CC-CR, CC-MB}
In response to further warming by 1°C or more by the mid-21st century and beyond, ocean-wide changes in ecosystem properties
are projected to continue (high confidence).
Large irreversible shifts in the spatial distribution of species and seasonal timing of their
activities (feeding, growth, development, behaviors, and productivity) will have implications for species composition, and ecosystem goods and
services. {6.3.1, 6.4, 6.5, 6.6}
By the mid-21st century, the spatial shifts of marine species will cause species richness to increase at mid- and high latitudes
(high confidence) and to decrease at tropical latitudes (medium confidence), resulting in global redistribution of catch potential
for fishes and invertebrates, with implications for food security (medium confidence).
Animal displacements are projected to lead to
high-latitude invasions and high local extinction rates in the tropics and semi-enclosed seas. This will cause a 30 to 70% increase in the fisheries
yield of some high-latitude regions by 2055 (relative to 2005), a redistribution at mid-latitudes, but a drop of 40–60% in the tropics and the
Antarctic, based on 2°C warming above preindustrial values (medium confidence in the direction of trends in fisheries yields, low confidence in

415
6
Ocean Systems Chapter 6
the magnitude of change). If a decrease in global net primary production (NPP) or a shift toward smaller primary producers occurs, the overall
fisheries catch potential may also decrease. {6.3.1-4, 6.4.1, 6.5.1-4}
Open ocean NPP is projected to fall globally depending on RCP scenario (medium confidence). The estimated decrease will occur
by up to 9% by 2100 under the RCP8.5 business-as-usual climate scenario (relative to 1990, low confidence). The oceans currently
provide about half of global NPP. Environmental controls on NPP include temperature, CO
2
, nutrient supply, and light (through cloud cover,
mixed layer depth), all of which will be altered (WGI AR5 Section 6.3). Present observations indicate increasing NPP at high (Arctic) latitudes
(medium confidence), projected to continue beyond 2100 (medium confidence). This increase is offset by a decrease at temperate and tropical
latitudes (medium confidence). Poor representation of shelf and coastal regions hamper projections in global NPP models for near-shore waters,
reducing confidence in global projections. {6.3.4, 6.5.1, Box CC-PP}
Large-scale processes and climatic feedbacks sustained by microbes (bacteria, archaea, unicellular algae, and protozoans) play
key roles in marine ecosystems (e.g., carbon and nitrogen (N
2
) fixation or nutrient recycling) and will be altered by climate
change (medium confidence). Identifying which microbial species, groups, and processes are being affected and how these will be altered is
difficult, as these organisms and their responses to environmental change are extremely diverse and often modulated by biological interactions or
changes in circulation and nutrient supply (limited evidence, low agreement). Warming will cause species-specific responses, such as enhancing
metabolic rates and exceeding thermal tolerances, which will affect abundance, distribution, and community structure. Warmer, CO
2
- and
nutrient-enriched coastal oceans may stimulate harmful algal blooms (medium confidence), and the redistribution of certain microbes causing
diseases such as cholera (medium confidence). {6.3, 6.4.2}
Rising atmospheric CO
2
over the last century and into the future not only causes ocean warming but also changes carbonate
chemistry in a process termed ocean acidification (WGI AR5 Sections 3.8.2, 6.4.4). Impacts of ocean acidification range from
changes in organismal physiology and behavior to population dynamics (medium to high confidence) and will affect marine
ecosystems for centuries if emissions continue (high confidence).
Laboratory and field experiments as well as field observations show a
wide range of sensitivities and responses within and across organism phyla (high confidence). Most plants and microalgae respond positively
to elevated CO
2
levels by increasing photosynthesis and growth (high confidence). Within other organism groups, vulnerability decreases with
increasing capacity to compensate for elevated internal CO
2
concentration and falling pH (low to medium confidence). Among vulnerable
groups sustaining fisheries, highly calcified corals, mollusks, and echinoderms are more sensitive than crustaceans (high confidence) and fishes
(low confidence). Trans-generational or evolutionary adaptation has been shown in some species, reducing impacts of projected scenarios (low
to medium confidence). Limits to adaptive capacity exist but remain largely unexplored. {6.3.2, Box CC-OA}
Few field observations conducted in the last decade demonstrate biotic responses attributable to anthropogenic ocean
acidification, as in many places these responses are not yet outside their natural variability and may be influenced by confounding
local or regional factors.
Shell thinning in planktonic foraminifera and in Southern Ocean pteropoda has been attributed fully or in part to
acidification trends (medium to high confidence). Coastward shifts in upwelling CO
2
-rich waters of the Northeast Pacific cause larval oyster
fatalities in aquacultures (high confidence) or shifts from mussels to fleshy algae and barnacles (medium confidence), providing an early
perspective on future effects of ocean acidification. This supports insight from volcanic CO
2
seeps as natural analogs that macrophytes
(seaweeds and seagrasses) will outcompete calcifying organisms. During the next decades ecosystems, including cold- and warm-water coral
communities, are at increasing risk of being negatively affected by ocean acidification, especially as ocean acidification will be combined with
rising temperature extremes (medium to high confidence, respectively). {6.1.2, 6.3.2, 6.3.5}
The expansion of hypoxic regions termed Oxygen Minimum Zones (OMZs) and anoxic “dead zones,” observed over the last 50
years and projected into the future under climate change, especially if combined with nutrient enrichment (eutrophication), will
constrain the habitat of O
2
-dependent organisms and benefit anaerobic microbes (medium confidence). Hypoxia tolerance varies
among species and is influenced by temperature, elevated CO
2
, food consumption, and O
2
demand (high confidence). Warming-induced
stratification limits the exchange of gases between water layers. Enhanced oxygen consumption by heterotrophic organisms depletes the oxygen
further, causing a community shift toward lower species richness and hypoxia-tolerant specialists. Under extreme hypoxia ecosystems are

416
Chapter 6 Ocean Systems
6
dominated by microbes. These OMZs are also characterized by microbial removal of fixed nitrogen (denitrification), which can significantly
reduce the low-latitude nutrient inventories with implications for regional productivity. {6.3.3, 6.3.5}
The climate-change-induced intensification of ocean upwelling in some eastern boundary systems, as observed in the last decades,
may lead to regional cooling rather than warming of surface waters and cause enhanced productivity (medium confidence), but
also enhanced hypoxia, acidification, and associated biomass reduction in fish and invertebrate stocks.
Owing to contradictory
observations there is currently uncertainty about the future trends of major upwelling systems and how their drivers (enhanced productivity,
acidification, and hypoxia) will shape ecosystem characteristics (low confidence). {6.1.1, 6.3.2, 6.3.3, 6.3.5-6, Box CC-UP}
Environmental drivers acting simultaneously on ocean biota* often lead to interactive effects and complex responses (high
confidence). Interactions of temperature, ocean acidification, and hypoxia narrow thermal ranges and enhance sensitivity to temperature
extremes in organisms such as corals, coralline algae, mollusks, crustaceans, and fishes (high confidence). In primary producers, light and
individual nutrients can also interact with temperature and acidification. Combined warming and ocean acidification reduce calcification in
warm-water corals (high confidence). Ocean acidification will alter availability of trace metals (low confidence). (*The term biota encompasses
the organisms of a region, habitat, or geological period.) {6.3.2.2, 6.3.5, 6.5.2}
The combination and often amplification of global and regional climate change and local anthropogenic drivers result in
enhanced vulnerability of natural and human systems (high confidence).
Major regional and local drivers include fishing, pollution, and
eutrophication. {6.3.5, 6.4, 6.5}
The progressive redistribution of species and the reduction in marine biodiversity in sensitive regions and habitats puts the
sustained provision of fisheries productivity and other ecosystem services at risk, which will increase due to warming by 1°C or
more by 2100 compared to the present (high confidence).
Human societies respond with limited adaptive capacity. Socioeconomic
vulnerability is highest in developing tropical countries involving a risk of reduced supplies, income, and employment from marine fisheries
(high confidence). This emphasizes disparities in food security between developed and underdeveloped nations. {6.4.1, 6.5}
With continuing climate change, local adaptation measures (such as conservation) or a reduction in human activities (such as
fishing) may not sufficiently offset global-scale effects on marine ecosystems (high confidence). Effects of climate change will thus
complicate management regimes such as of marine protected areas once species undergo distributional shifts. This increases the vulnerabilities
of marine ecosystems and fisheries. {6.4.2.1}
Geoengineering approaches involving manipulation of the ocean to ameliorate climate change (such as nutrient fertilization,
binding of CO
2
by enhanced alkalinity, or direct CO
2
injection into the deep ocean) have very large environmental and associated
socioeconomic consequences (high confidence).
Some actually require purposeful alteration of ocean ecosystems for implementation.
Alternative methods focusing on solar radiation management (SRM) leave ocean acidification largely unabated as they cannot mitigate CO
2
emissions. {6.4.2}

417
Ocean Systems Chapter 6
6
6.1. Introduction: Point of Departure,
Observations, and Projections
The oceans cover about 71% of Earth’s surface to an average depth of
3
700 m. Their importance for life on Earth, including humans, is vast (FAQ
6.1). Marine habitats display natural variability on various spatial and
temporal scales but a dearth of long-term observational data from the
vast open oceans limits our understanding of the causes and ecological
consequences of this variability. The available information indicates that
climate controls ocean temperatures, chemistry, circulation, upper ocean
stratification, nutrient supply, and sunlight exposure. These drivers affect
marine ecosystems through direct effects on organisms, amplified by
their changing interactions with other species. Food webs are modified by
changes in phytoplankton growth and the availability of live organisms or
their decomposing bodies, that is, debris or dissolved organic matter, as
food to (chemo-)heterotrophs (organisms gaining energy by feeding on
organic matter). Organismal responses lead to changes in biogeochemical
processes, such as the carbon cycle, and in biological diversity and the
services the oceans provide.
Some impacts of climate change on marine ecosystems and their services
were addressed in the IPCC Fourth Assessment Report (AR4): WGII
Chapters 4 to 6 (ecosystems, food, coastal areas), and regional chapters,
for example, 15 (polar regions) and 16 (small islands). The ecosystem
assessment in WGII AR4 Chapter 4 focused on terrestrial, coastal, and
marine systems, their properties, goods, and services. It emphasized the
difficulty in assessing future ecosystem responses as a result of ecosystem
complexity, different vulnerabilities of species, and ecosystem-specific,
critical thresholds associated with nonlinear responses to environmental
change. Focusing on terrestrial ecosystems, WGII AR4 Chapter 4 concluded
t
hat more than 2°C to 3°C warming above preindustrial levels causes
high extinction risks to 20 to 30% of present-day species (medium
confidence), paralleled by substantial changes in ecosystem structure
and functioning (high confidence). The authors projected that a wide
range of planktonic and benthic calcifiers will be impacted by ocean
warming (very high confidence) and acidification (medium confidence),
particularly in the Southern Ocean. They characterized sea ice and coral
reef biomes as highly vulnerable. Key uncertainties identified in AR4 were
the incomplete knowledge of ocean acidification (addressed in present
Section 6.3.2), synergistic effects and their mechanisms (Section 6.3.5),
biotic feedbacks to the climate system (Section 6.4), and the impacts
of interactions between climate change, human uses, and ecosystem
management (Section 6.4.2).
Much more than in previous IPCC reports (Figure 1-2), impacts on the
oceans are a focus in AR5. This allows for a more comprehensive
discussion of phenomena and impacts, as well as the associated
uncertainties and the levels of confidence in observed and projected
changes. The present chapter focuses on the general principles and
processes characterizing climate change impacts on ocean systems and
on the uses of these systems by human societies. For projections of
responses to climate change, the chapter also assesses our understanding
of underlying functional mechanisms causing change across all levels
of biological organization, from molecules to organisms to ecosystems.
As the ocean is a heterogeneous environment, the comparison of major
ocean regions is required to understand variability and differences in
key processes and carbon inventories (Box CC-PP, Figure 1). We discuss
the changes and variability in the ocean’s principal physical and chemical
properties and assess knowledge drawn from paleo- and historical to
present observations. We develop a conceptual framework for analyzing
Frequently Asked Questions
FAQ 6.1 | Why are climate impacts on oceans and their ecosystems so important?
Oceans create half the oxygen (O
2
) we use to breathe and burn fossil fuels. Oceans provide about 17% of the animal
protein consumed by the world’s human population, or almost 20% of that protein consumed by 3 billion people.
Oceans are home to species and ecosystems valued in tourism and for recreation. The rich biodiversity of the oceans
offers resources for innovative drugs or biomechanics. Ocean ecosystems such as coral reefs and mangroves protect
the coastlines from tsunamis and storms. About 90% of the goods the world uses are shipped across the oceans.
All these activities are affected by climate change.
Oceans play a major role in global climate dynamics. Oceans absorb 93% of the heat accumulating in the atmosphere,
and the resulting warming of oceans affects most ecosystems. About a quarter of all the carbon dioxide (CO
2
) emitted
from the burning of fossil fuels is absorbed by oceans. Plankton convert some of that CO
2
into organic matter, part
of which is exported into the deeper ocean. The remaining CO
2
causes progressive acidification from chemical reactions
between CO
2
and seawater, acidification being exacerbated by nutrient supply and with the spreading loss of O
2
content. These changes all pose risks for marine life and may affect the oceans’ ability to perform the wide range
of functions that are vitally important for environmental and human health.
The effects of climate change occur in an environment that also experiences natural variability in many of these
variables. Other human activities also influence ocean conditions, such as overfishing, pollution, and nutrient runoff
via rivers that causes eutrophication, a process that produces large areas of water with low oxygen levels (sometimes
called “dead zones”). The wide range of factors that affect ocean conditions and the complex ways these factors
interact make it difficult to isolate the role any one factor plays in the context of climate change, or to identify
with precision the combined effects of these multiple drivers.

418
Chapter 6 Ocean Systems
6
e
ffects on organisms and ecosystems and assess present knowledge
derived from experiments, field studies, and numerical model projections
mostly using Representative Concentration Pathways (RCPs) of climate
change scenarios to provide trajectories of climate change drivers (Moss
et al., 2010). Finally, we assess the implications of such changes for
ecosystem services, and identify plausible socioeconomic consequences.
Assessing climate change impacts on coastal systems is the topic of
Chapter 5. An integrative treatment of regional climate changes and
impacts in seven key ocean regions is the focus of regional Chapter 30.
Marine issues are also included in regional Chapters 22 to 29, with a
focus on polar oceans (Chapter 28) and small islands (Chapter 29). Topics
important to several chapters, such as ocean acidification, upwelling
systems, primary productivity, changes in biogeography, and coral reefs,
are discussed in joint assessments presented in the respective cross-
chapter boxes.
6.1.1. Changes in Physical and Chemical Variables
Trends in ocean conditions over the last 60 years reflect significant human
impacts beyond natural variability on temperature, salinity, dissolved
inorganic carbon and oxygen content, pH, and other properties of the
upper ocean (e.g., Pierce et al., 2012; Sen Gupta and McNeil, 2012; WGI
AR5 Section 3.8, Table 10.1). With climate change, marine ecosystems are
and will be exposed to rising temperature, ocean acidification, expansion
of hypoxic zones, and other environmental drivers changing concomitantly.
6.1.1.1. Temperature and Salinity
Over the last 39 years, oceans have warmed at average rates of >0.1°C
per decade in the upper 75 m and 0.015°C per decade at 700 m depth
(WGI AR5 Section 3.2.2, Figure 3.1). Trends differ regionally, seasonally,
and interannually (WGI AR5 Section 2.7; for ocean regions see Section
30.5 in the present volume). Temperature changes are particularly large
at El Niño-Southern Oscillation (ENSO) with high (3- to 4-year) and low
(5- to 7-year) frequencies, and on multi-decadal scales (>25 years,
Figure 6-1). The strongest warming trends are found at high latitudes
where most of the inter-decadal variability occurs, while tropical oceans
are dominated by interannual frequencies. Global climate models have
explored changes in different frequency domains, but their spatial
resolution is poor (WGI AR5 Sections 11.3.3, 12.4.7).
Temperature variations are often accompanied by changes in salinity.
Increased salinity results from reduced precipitation relative to evaporation,
for example, above the thermoclines (layer separating the upper mixed
layer from deeper water where temperature and density change rapidly
with depth) of subtropical gyres at mid- to low latitudes since 1950
(WGI AR5 Chapter 3). Decreased salinity due to enhanced precipitation
relative to evaporation has occurred at some tropical and higher latitudes,
exacerbated by sea ice melt (Durack et al., 2012). Both warming and
freshening cause enhanced density stratification, a trend projected to
continue into the 21st century (WGI AR5 Chapter 3, Section 11.3.3,
Figure 12.34; Helm et al., 2010). Mean sea surface temperature in
2090 will be 2.7°C warmer than in 1990 (RCP8.5; WGI AR5 Chapter 12;
Bopp et al., 2013).
6.1.1.2. Carbon Dioxide-induced Acidification
Rising carbon dioxide (CO
2
) concentrations in air (given as partial
pressures, pCO2, in µatm) cause increasing upper ocean CO
2
levels
(Watson et al., 2009). Starting from a preindustrial value of 280 µatm
atmospheric pCO
2
levels will have reached around 500 µatm by 2050
following the Special Report on Emissions Scenarios (SRES; IPCC, 2000)
and all RCPs (Moss et al., 2010; Meinshausen et al., 2011). By 2100 values
are projected to reach between 420 µatm and 940 µatm depending on
the RCP. The rise in pCO
2
causes ocean acidification (OA), measured as a
decline in water pH (negative log of proton concentration), accompanied
by a fall in both carbonate ion (CO
3
2–
) concentration and the saturation
states (Ω) of various calcium carbonates (CaCO
3
; Zeebe and Westbroek,
2003; WGI AR5 Section 3.8.2, Box 3.2, Chapter 6, Figure 6.29). Hence,
the seawater solubilities of three forms of CaCO
3
, namely calcite,
magnesium-calcite, and aragonite, increase. These minerals are important
components of shells and skeletons of many marine organisms (Section
6.3.2).
Ocean acidification occurs on a background of natural temporal and
spatial variability of pH, pCO
2
, and Ω. In the open ocean, the mean pH
(total scale, pH
T
) of surface waters presently ranges between 7.8 and 8.4
(WGI AR5 Section 3.8.2). In stratified mid-water layers, largely isolated
from gas exchange between surface waters and air, decomposition of
organic material leads to lowered oxygen (O
2
) and elevated CO
2
levels
(Paulmier et al., 2011) associated with lower pH values. The few existing
field data of sufficient duration, resolution, and accuracy (WGI AR5
Figure 3.18) show that trends in anthropogenic OA clearly deviate from
the envelope of natural variability (Friedrich et al., 2012). OA presently
ranges between –0.0013 and –0.0024 pH
T
units per year (WGI AR5
Section 3.8.2, Table 3.2, Box 3.2; Dore et al., 2009). Average surface
ocean pH has decreased by more than 0.1 units below the preindustrial
average of 8.17. By 2100 pH is expected to change by –0.13, –0.22,
–0.28, and –0.42 pH
T
units, at CO
2
levels of 421, 538, 670, and 936 ppm
under RCP2.6, 4.5, 6.0, and 8.5 climate scenarios, respectively (WGI AR5
Figure 6.28). The rate of acidification in surface waters varies regionally
and is 50% higher in the northern North Atlantic than in the subtropical
Atlantic (Olafsson, 2009). Salinity reduction caused by ice melt or
excess precipitation (Jacobs and Giulivi, 2010; Vélez-Belchí et al., 2010)
exacerbates OA by diluting the concentrations of substances acting as
buffers (Steinacher et al., 2009; Denman et al., 2011). At high sustained
CO
2
concentrations the changes in ocean chemistry will take thousands
of years to be buffered by the natural dissolution of CaCO
3
from sediments
and tens to hundreds of thousands of years to be eliminated completely
by the weathering of rocks on land (Archer et al., 2009).
6.1.1.3. Hypoxia
The average dissolved oxygen concentration in the ocean is presently
162 µmol kg
–1
(Sarmiento and Gruber, 2006). Concentrations range from
over 500 µmol kg
–1
in productive Antarctic waters super-saturated with
oxygen (Carrillo et al., 2004) to zero in coastal sediments and in
permanently anoxic deep layers of isolated water bodies, such as the
Black Sea and the Cariaco Basin. Hypoxia results from oxygen depletion
in excess of supply as in stratified water bodies (Section 6.1.1.2). Vast
Oxygen Minimum Zones (OMZs) exist between less than 100 and more
419
Ocean Systems Chapter 6
6
0 10 20 30 °C
-2
0
10
20
30
2–3 years3–5 years
5–8 years
8–15 years
1
5–25 years25–40 years
0 10 20 30 °C
A
verage temperature between 1911 and 2011
(a) (b)
(c)
(d)
T
emperature range (historical maximum–minimum values)
0 10 20 30 40 50 (%)
Interannual variability of sea surface temperature
Global Average Temperature and
Sea Surface Temperature
Anomalies (GSST)
Southern Oscillation Index (SOI)
North Atlantic Oscillation (NAO)
Atlantic Multi-decadal Oscillation
(AMO)
Pacific Decadal Oscillation (PDO)
Contribution to the time series variability (%)
10
20 30
40 50 60 70
80 90 100 0
Very high frequency (2–3 years)
High ENSO* frequency (3–5 years)
Low ENSO* frequency (5–8 years)
Decadal (8–15 years)
Bi-decadal (15–25 years)
Multi-decadal (25–40 years)
*ENSO = El Niño-Southern Oscillation
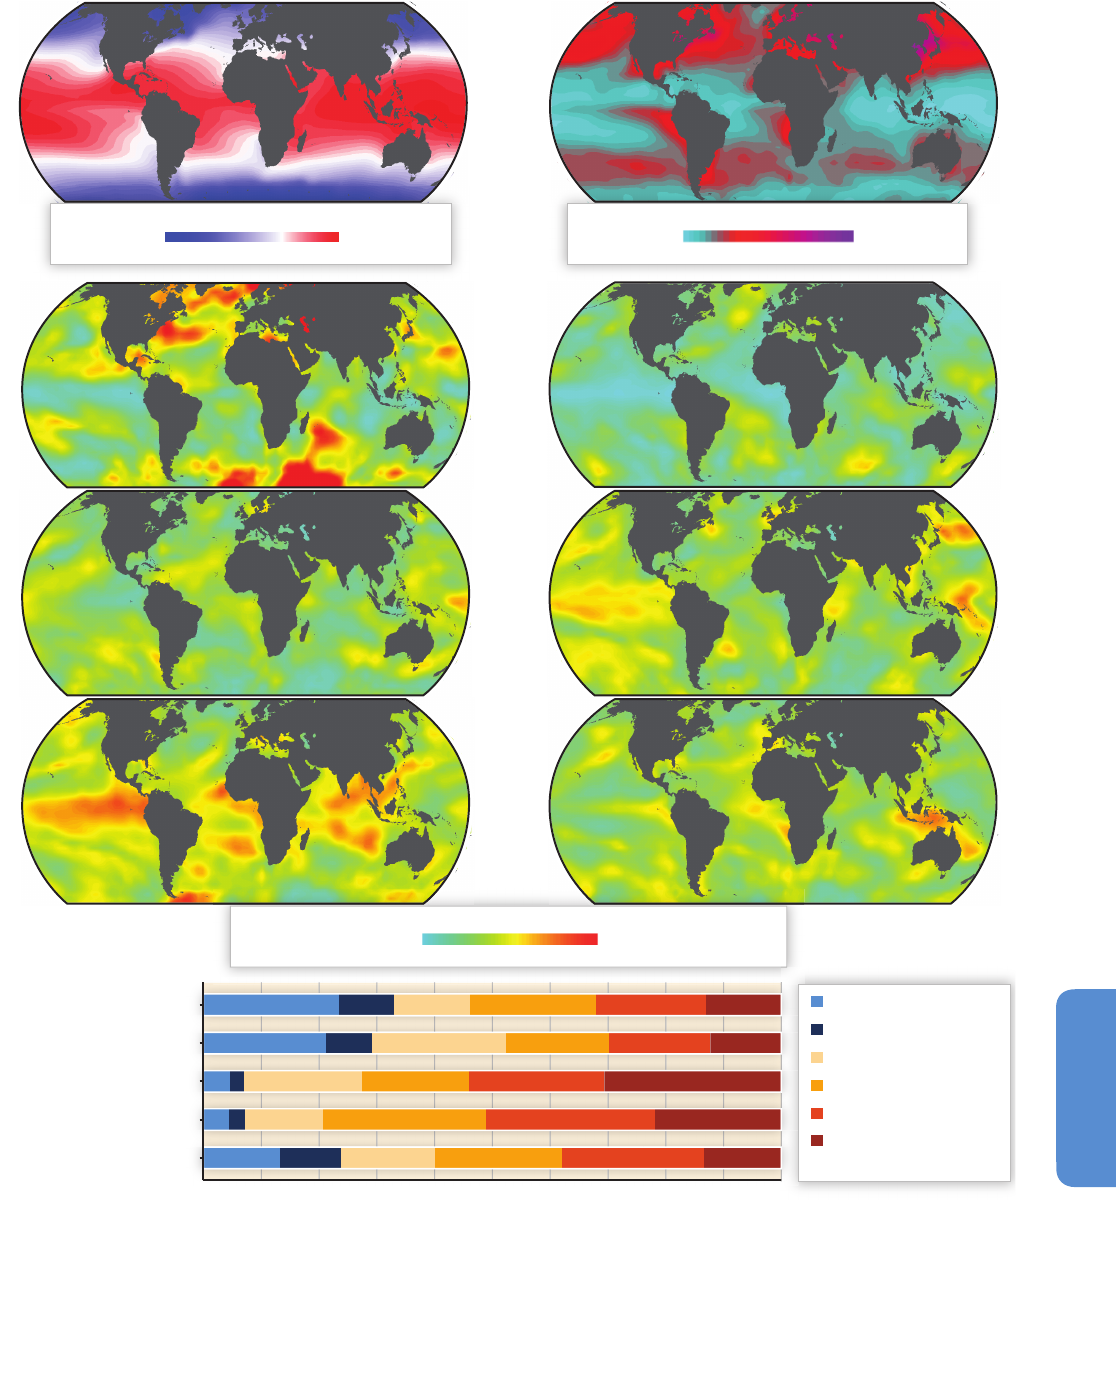
Figure 6-1 | Sea surface temperature variability between 1911 and 2011. (a) The sea surface temperature average for the period. (b) The temperature range calculated as the
difference between the maximum and minimum values for each grid component during the century. (c) The spatial distribution of variability by time scales (based on the
Extended Reynolds Sea Surface Temperature, NOAA, 2012) corresponds to the multi-decadal (25 to 40 years), bi-decadal (15 to 25 years), decadal (8 to 15 years), low ENSO (El
Niño-Southern Oscillation) frequency (5 to 8 years), high ENSO frequency (3 to 5 years), and very high frequency (2 to 3 years) scales. The summed variabilities from the same
2°x2° box in all six maps corresponds to 100% of the time series variability. (d) The spectral density of some of the most widely used climate indices, accumulated in the same
frequency windows. The total bar length (100%) corresponds to the cumulative variability of each time series between the 2 and 40 year frequency window. Climate indices were
obtained from the NOAA ESRL Physical Sciences Division website.
420
Chapter 6 Ocean Systems
6
t
han 900 m depths in Eastern Atlantic and Pacific tropical oceans. The
ecological literature applies the term hypoxia (see Section 6.3.3) to O
2
concentrations below 60 µmol kg
–
1
(estimated at about 5% of global
ocean volume; Deutsch et al., 2011). Pacific OMZs regularly reach oxygen
levels below 20 µmol kg
–1
(about 0.8% of global ocean volume; Paulmier
and Ruiz-Pino, 2009), lower than Atlantic ones. Suboxic waters at <4.5
μmol O
2
kg
–1
occupy about 0.03% of the ocean volume, mainly in the
northeastern tropical Pacific (Karstensen et al., 2008).
OMZs are naturally present in many habitats including marine sediments,
but are also expanding due to anthropogenic influences. Over the past
50 years, open ocean O
2
concentrations have decreased by a mean rate
of 0.1 to >0.3 µmol kg
–1
yr
–1
(WGI AR5 Section 3.8.3; Stramma et al.,
2008). In some OMZs the rate has been much higher due to warming,
increased stratification, and rising biological O
2
demand (WGI AR5
Section 3.8.3). Long-term declines in O
2
by about 7 µmol kg
–1
per decade
have been documented at mid-water depths over much of the subarctic
North Pacific (Keeling et al., 2010). In coastal regions, extremely hypoxic
“dead zones” that exclude animal life, have increased from 42 reported
in the 1960s to more than 400 in 2008 and been attributed to high
oxygen demand from eutrophication, the local enrichment of nutrients,
resulting in organic matter loading and its decay as well as nitrous oxide
formation and release (Naqvi et al., 2000; Díaz and Rosenberg, 2008;
Zhang et al., 2010).
F
uture warming will likely accelerate the spread of hypoxic zones,
especially in temperate to sub-polar regions. Most models project
decreasing global ocean oxygen contents by 1 to 7% from present-day
concentrations in 2100 (Keeling et al., 2010; WGI AR5 Figure 6.30 under
RCP8.5), with a mean decline by 3.4% in 2090 compared to the 1990s
(Bopp et al., 2013). Warming and freshening of the surface layer will
increase stratification and reduce the depth of winter mixing. The
evolution of low O
2
zones will be linked to changes in fluvial runoffs
(e.g. Milly et al., 2008; see also Section 5.3.4.3), the wind regime (e.g.,
Vecchi and Soden, 2007), as well as the intensity, duration, and seasonal
timing of upwelling events (Snyder et al., 2003; see also Section 30.5.2).
The potential contributions of destabilized methane hydrates and bacterial
methane oxidation to exacerbate hypoxia and acidification at high
latitudes remain to be explored (Westbrook et al., 2009). Currently, there
is no consensus on the future volumes of hypoxic and suboxic waters
because of large uncertainties in potential biogeochemical effects and
in the evolution of tropical ocean dynamics due to both natural and
anthropogenic causes (WGI AR5 Section 6.4.5). While volumes with O
2
concentrations <80 µmol kg
–1
are projected to increase by several
percent, suboxic waters <5 μmol O
2
kg
–1
may undergo a 30% increase
by 2100 compared to 2005 (low confidence; Bopp et al., 2013).
6.1.1.4. Light and Nutrients
Most models project that the mixed layer at the ocean surface (see
Figure 6-2) will become shallower in the coming decades through a
strengthening of the vertical density gradient (e.g., Sarmiento et al., 1998;
Sallée et al., 2013). Mean light levels encountered by phytoplankton are
set by incoming light from solar radiation, the depth of the mixed layer,
and the degree to which underwater light is attenuated by living and
non-living particles (Kirk, 1994). A shallower mixed layer will likely result
in the resident phytoplankton receiving higher mean underwater light
levels if the organisms are physically mixed through this stratum (Figure
6-2).
Enhanced, seasonally prolonged stratification (Holt et al., 2010), especially
in the tropics, the North Atlantic, the Northeast Pacific, and the Arctic
(Capotondi et al., 2012), will lead to decreased vertical transport of
nutrients to surface waters (Doney, 2010; Figure 6-2). River plumes
(Signorini et al., 1999), nutrient accumulation in the pycnocline as
reported for North Pacific waters (Whitney, 2011), human-induced
eutrophication, enhanced upwelling (Box CC-UP), and tidal mixing and
estuarine circulation in coastal oceans could partly compensate for the
projected reduction in nutrient supply in the oceans (limited evidence,
medium agreement).
6.1.2. Historical and Paleo-Records
6.1.2.1. Historical Observations
Ocean ecosystems are variable in time and space, and in a non-steady-
state, reflected in indices such as the North Atlantic Oscillation (NAO)
Index, the Atlantic Multi-decadal Oscillation (AMO), the Arctic Climate
Regime Index (ACRI), Pacific Decadal Oscillation (PDO), or the El Niño-
Southern Oscillation (ENSO) (WGI AR5 Box 2.5; Figure 6-1; Section 30.5).
Nutrient
supply
Nutrient
supply
Light
NOW FUTURE
CO
2
CO
2
Low oxygen mid-water
Low oxygen mid-water
Carbonate solubility
Carbonate solubility
Storms
Storms
Light
Dust
Dust
Warmer - fresher - acidified
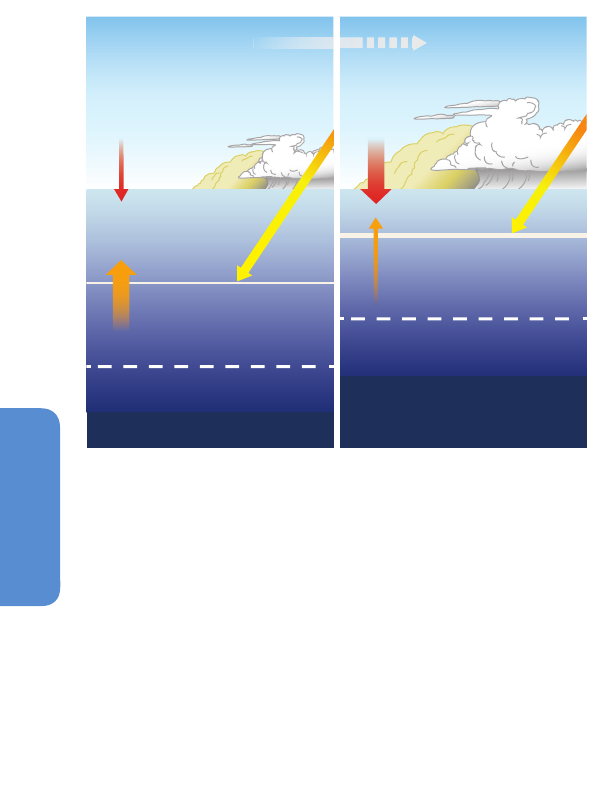
Figure 6-2 | Projected alteration (magnitude and frequency) of oceanic fluxes and
atmospheric events due to a changing climate in the coming decades. Ocean
properties will be altered from the sunlit surface layer to the mid-water stratum. In the
surface ocean, the depth of the mixed layer (solid horizontal line) will shallow
resulting in higher mean light levels. Increased density stratification (i.e., a
strengthening sea water density gradient represented by the increasing thickness of
the solid horizontal line) will reduce the vertical supply of nutrients for
photosynthesizing organisms residing in the mixed layer. Anthropogenic CO
2
will
acidify, that is, lower the pH of the surface ocean (note this happens in a pH range
higher than 7 such that oceans will remain alkaline but less so due to acidification).
The penetration of acidified waters to depth will result in a shallower depth (dashed
horizontal line) at which CaCO
3
structures, such as shells, dissolve. At depth, the
location of low-O
2
waters will progressively become shallower. In addition, changes in
storm activity and dust deposition will influence ocean physics and chemistry, with
consequent effects on ocean biota and hence ecosystems (courtesy of Reusch and
Boyd, 2013).

421
Ocean Systems Chapter 6
6
T
he combination of large, global data sets such as Reynolds, National
Center for Atmospheric Research (NCAR), International Comprehensive
Ocean-Atmosphere Data Set (ICOADS) with multi-decadal time series,
for example, near Hawaii (HOT), Bermuda (BATS), the Ligurian Sea
(DYFAMED), the Canaries (ESTOC), Kerguelen Island (KERFIX), Hokkaido
Island (KNOT), and Taiwan (SEATS) has provided data on the physical
and biogeochemical state of the oceans (Karl et al., 2003). These have
been augmented by the limited-term, high-resolution programs World
Ocean Circulation Experiment (WOCE) and Joint Global Ocean Flux Study
(JGOFS).
Historical data sets provide baseline information on ecosystem states
and document the responses of biota to both natural variability in the
ocean system and surface ocean warming since the 1970s (Figure 6-3;
Section 6.3.1). Such data sets are rare and regionally biased. Examples
include changes in geographic ranges of plankton and seasonal timing
(phenology) of different components of the ecosystem detected by the
Continuous Plankton Recorder (CPR: e.g., Edwards et al., 2001; Richardson
et al., 2006; Box 6-1) or multi-decadal shifts in pelagic ecosystems
(CalCOFI) including higher parts of the food chain such as sardines and
anchovies (Brinton and Townsend, 2003; Chavez et al., 2003; Lavaniegos
and Ohman, 2003; see also Section 6.3.1) and the skeletal archives of
long-lived organisms such as coralline algae (Halfar et al., 2011), bivalves
(Schöne et al., 2003), and corals (De’ath et al., 2009).
Systematic, long-term interdisciplinary observations using repeated,
highly calibrated measurements at a given field site are required to
capture high- and low-frequency events, for example, regime shifts
(abrupt changes between contrasting, persistent states of any complex
system; deYoung et al., 2008). Direct observations are complemented
by satellite remotely sensed data sets. Ocean color data (e.g., Coastal
Zone Color Scanner (1978–1986), Sea-Viewing Wide Field-of-View
Sensor (SeaWiFS, 1997–2010), and Moderate Resolution Imaging
Spectroradiometer (MODIS-AQUA, 2002 to the present); McClain, 2009)
provide estimates of chlorophyll concentrations (a proxy for phytoplankton
stocks and net primary production (NPP); Sections 6.2.1, 6.3.4; Saba et
al., 2011). Total chlorophyll cannot be measured from space; therefore,
the near-surface value (approximately one optical depth) is extrapolated
to whole water-column chlorophyll based on vertical distribution using
region-specific algorithms. Large uncertainties persist, as these estimates
reflect both phytoplankton stocks and their physiological status
(Dierssen, 2010; Behrenfeld, 2011). The approximately 15-year archived
time series of SeaWiFS is too short to reveal trends over time and their
causes. It is an example for the general issue that undersampling of
ocean phenomena in time and space limits our current ability to assess
present states, to distinguish effects of anthropogenic change from
natural variability, and to project future changes (Henson et al., 2010;
Beaulieu et al., 2013; Box CC-PP).
6.1.2.2. Paleontological Records
Paleontological records in marine sediments provide long-term, low-
resolution data on the spatial distributions of organisms and their
abundances from all ages and latitudes. This information can be readily
related to the concurrent shifts in multiple environmental properties
that are also recorded in these sediments. The records provide insights
i
nto shifts, expansions, and contractions of biogeographic ranges;
species extinctions and emergences; and changes in species abundance,
as well as the environmental forcings to which organisms respond.
Temporal trends reveal influences of temperature, hypoxia, CO
2
, and
food availability on organisms and ecosystems (Section 6.1.1; Figure
6-3).
Owing to insufficient resolution, the geological record often does not
allow the direct attribution of a biological change to a single driver or
the identification of various drivers and their relative importance. Support
for projections of future changes in present-day ecosystems and their
services is thus limited (low confidence; Sections 6.4, 6.5). Nonetheless,
information gained from the geological record is invaluable, as both
paleo and present climatic shifts share the same combination and sign
of environmental changes: increasing atmospheric CO
2
causing
warming and CO
2
enrichment in the surface ocean, leading to enhanced
stratification of the upper ocean and a decrease in dissolved O
2
(WGI
AR5 Chapter 3; Section 5.3). A combination of models (WGI AR5
Chapters 3, 6, 12) and geological data can be used to forecast future
impacts on ocean biota (medium confidence).
The last glacial-interglacial transition is associated with an average
increase in atmospheric CO
2
of approximately 1 µatm per century
between 18 and 10 thousand years before present (kyr BP) (WGI AR5
Chapter 5), a significantly slower increase than the approximately 90
µatm in the last century (WGI AR5 Chapters 5, 6). Consequently, the
average pH change of 0.002 pH units per century during the glacial-
interglacial transition is small relative to the ongoing anthropogenic
perturbation of >0.1 pH unit per century (WGI AR5 Section 3.8.2).
Overall the upper glacial ocean was more O
2
-rich than today’s ocean
(Jaccard and Galbraith, 2012) and between 0.7°C and 2.7°C colder, with
strong regional differences of up to 10°C cooling in the North Atlantic
and 2 to 6°C in the Southern Ocean (WGI AR5 Chapter 5, Table 5.2).
During warming from the glacial into the interglacial marine plankton
such as foraminifera, coccolithophores, diatoms, dinoflagellates, and
radiolarians showed marked poleward range expansion (high confidence;
see WGI AR5 Section 5.7; CLIMAP Project Members, 1976; MARGO
Project Members, 2009). Under the lower glacial CO
2
concentrations,
calcification in planktonic foraminifera was higher (limited evidence,
medium agreement).
The most prominent abrupt climate change periods in the recent
geological record, developing within 10 to 100 years, are associated
with Dansgaard-Oeschger (DO) and Heinrich events (WGI AR5 Section
5.7), which occurred repetitively during the last 120 kyr. Whereas the
atmospheric changes happened within a few decades, the sea surface
temperature in the North Atlantic changed by up to 5°C within decades
to centuries (WGI AR5 Section 5.7). Southern Ocean temperature changes
were slower (hundreds to thousands of years; Barker et al., 2009). The
cold phase of a DO event led to the migration of polar foraminiferal
species toward the equator, in the North Atlantic as far south as the
Iberian Peninsula (Martrat et al., 2004). Abrupt (approximately 100-
year) abundance changes in the Southern Ocean were associated with
latitudinal shifts in the Antarctic Circumpolar Current and associated
species (Barker et al., 2009) akin to modern changes in plankton range
due to warming (Box CC-MB, Box 6-1). During the DO warm phases the
Monsoon-driven Arabian Sea upwelling records show enhanced primary
422
Chapter 6 Ocean Systems
6
1000
500
1500
2000
planktic foraminifer
0
2
4
6
coccolithophore
benthic
foraminifer
benthic
foraminifer
coccolithophore
benthic foraminifer
coralline alga
–0.3
0.0
0.3
0
20
40
80
100
60
0
5
10
15
20
25
benthic foraminifer
40
50
60
70
80
90
planktic
foraminifer
Calcification
(g m
–2
yr
–1
)
coral (Caribbean)
coral (Great Barrier Reef)
coral
Warm-water species (%)
0
1
2
3
1.5
1.6
1.7
1.8
1
0
2
–2
(μatm)
(μatm)
Normalized calcification
250
300
350
4
00
–0.5
LOSCAR model
GENIE model
0.0
0.5
Age (Million years)
55.155.355.555.7 1700 1800 1900 2000 2100
Calendar year
Environmental changes
Biotic responses
Extinctions
Migration
Calcification
Ocean
temperature
anomaly
A
tmospheric
CO
2
Warm-water species (%) Number of species
Normalized calcite
volume
(°C)
Paleocene
–
Eocene Thermal Maximum
Industrialization
P
roxy reconstructions
D
irect measurement
55.155.355.555.7
1700 1800 1900 2000 2100
AMO index Normalized (°C)
currently no evidence for
climate-related extinction in the
marine record
Atlantic Multi-decadal Oscillation (AMO)
index
(mean detrended sea surface temperature
anomaly for the North Atlantic)
coralline alga
–1
0
0
.0
0.3
–0.3
0.0
–0.3
0.3
AMO index
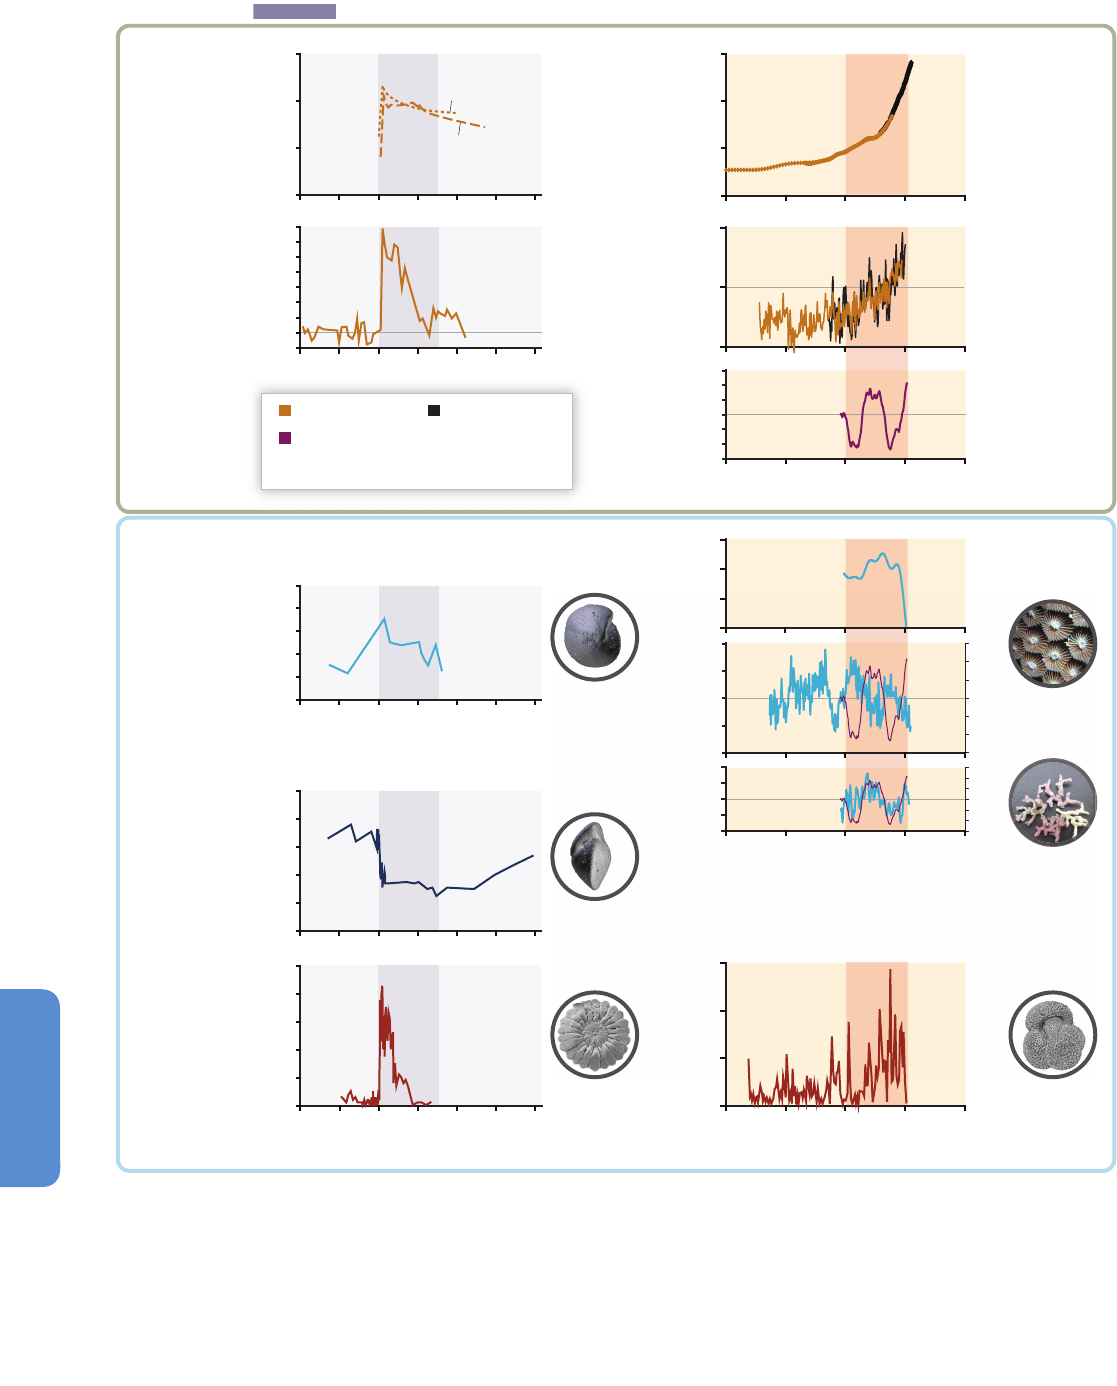
Figure 6-3 | Environmental changes (top) and associated biological responses (bottom) for the Paleocene–Eocene Thermal Maximum (PETM, left) and the industrial era (right).
The PETM represents the best geological analog for the future ocean because of its rapid environmental change. Episodes of largest environmental change are indicated with
darker bands. Note the different time scale between the two columns. Both time intervals are characterized by rapid warming both on land and in the ocean (modern: Wilson et
al., 2006 and PETM: Kennett and Stott, 1991) and increases in CO
2
(modern: Etheridge et al. 1996; Keeling et al., 2005 and PETM: Zeebe et al., 2009 (LOSCAR model); Ridgwell
and Schmidt, 2010 (Grid Enabled Integrated Earth System Model (GENIE model))). For the recent industrial era, the Atlantic Multi-decadal Oscillation (AMO; see Figure 6-1 and
Section 6.1.2.1) is shown to highlight an example of high-frequency sea surface temperature fluctuations (Enfield et al., 2001) and their influence on marine biota. Note the
species-specific calcification responses to climate change with decreases, increases, and high variability (coralline alga: Halfar et al., 2011; coral: Vásquez-Bedoya et al., 2012;
De’ath et al., 2013; PETM: Foster et al., 2013). While there was extinction during the PETM (Thomas, 2003), there is currently no evidence for climate-related extinction in the
marine record. Warming led to migration of warm-water species into previous cold-water habitats (modern: Field et al., 2006; PETM: Bralower, 2002). Pictures are examples of
organisms highlighting the processes in each panel, and are not to scale.

423
Ocean Systems Chapter 6
6
a
nd export production, reduced oxygenation, and denitrification, all
within approximately 200 years (Higginson et al., 2004).
The last time the atmospheric CO
2
content approached that of today
was during the Pliocene warm period (3.3 to 3.0 million years ago (Ma)),
with long periods of atmospheric CO
2
levels between 330 and 400 µatm
(Pagani et al., 2010; Seki et al., 2010) and equilibrated temperatures
approximately 2°C warmer than today (medium confidence; Haywood
et al., 2009; WGI AR5 Chapter 5). The Mid-Pliocene Warm Period saw a
poleward expansion of tropical planktonic foraminifera (high confidence;
Dowsett, 2007). Coccolithophores (Bown et al., 2004), corals (Jackson
and Johnson, 2000), and mollusks (Vermeij and Petuch, 1986) remained
unaffected with respect to rates of species extinction or emergences
compared to background rates.
Perhaps the best analog for the future ocean is the Paleocene-Eocene
Thermal Maximum (PETM, 55.3 Ma). The PETM was an event of warming
(Dunkley Jones et al., 2013), and ocean acidification (Zachos et al., 2005)
over millennia (Cui et al., 2011; Stassen et al., 2012) with increased
runoff and nutrients into the shelf ecosystems. Model simulations for
the PETM show 10 times lower rates of CO
2
input and hence ocean
acidification compared to today (medium confidence; Ridgwell and
Schmidt, 2010). Depending on the assumed rate and magnitude of the
CO
2
release, models project pH declined by 0.25 to 0.45 units in PETM
surface waters and a reduction in surface ocean aragonite saturation
from Ω = 3 to Ω = 2 or even as low as 1.5 (Ridgwell and Schmidt, 2010).
Warming caused range expansions of warm-water taxa toward higher
latitudes (high confidence). The composition of plankton assemblages
changed both within and between phytoplankton groups (Gibbs et al.,
2006; Sluijs and Brinkhuis, 2009), possibly reflecting the warming trend
and/or changes in nutrient availability (Sections 6.2.2-3). There was no
bias in extinction toward more heavily calcifying species, possibly as slow
CO
2
input led to minor surface water acidification. By contrast, benthic
foraminifera, the dominant deep water eukaryote, recorded up to 50%
extinction (Thomas, 2007). In contrast to sediment dwellers, more mobile
pelagic crustaceans (ostracods) did not show any significant change in
species composition (Webb et al., 2009). In shallow coastal waters,
calcareous algae and corals were replaced by symbiont-bearing benthic
foraminifera (medium confidence; Scheibner and Speijer, 2008).
The warm climates of the Mesozoic (251 to 65 Ma) led to a number of
anoxic events in the oceans (Jenkyns, 2010). In some cases, OMZs
expanded vertically, leading to anoxia in upper water layers (Pancost
et al., 2004). Some of the Cretaceous oceanic anoxic events were
associated with extinctions or increased species turnover (normalized
sum of originations and extinctions) of planktonic foraminifera and
radiolarians (30%). Such turnover was very small in other groups of
organisms (e.g., a maximum of 7% of coccolithophores; Leckie et al.,
2002). The attribution of these evolutionary changes to reduced O
2
is
tenuous as warming, changes in nutrient supply, and possibly ocean
acidification occurred concomitantly (Hönisch et al., 2012).
Global-scale collapse of marine ecosystems is rare, even in the geological
record. Some mass extinctions, in particular the Permian Period extinction
251 Ma, have been associated with large-scale inputs of carbon into
the atmosphere and ocean, with associated warming and deep-sea O
2
decline (Knoll et al., 2007; Kiessling and Simpson, 2011). The end-
P
ermian mass extinction preferentially affected reef organisms such as
corals and sponges resulting in a 4 Myr period without reef builders
(Kiessling and Simpson, 2011), and underscores that vulnerabilities
differ among organisms depending on anatomy, physiology, and ecology
(Knoll and Fischer, 2011). The rates of environmental change and any
potential acidification have not yet been accurately constrained for
these events.
Of the last 100 Myr, only the last 2 Myr had CO
2
levels of approximately
190 to 280 ppm, comparable to preindustrial values. Values like those
predicted for the mid and end of this century can solely be found in the
geological record older than 33 Ma, with large uncertainties in the
absolute numbers (WGI AR5 Section 5.3; Hönisch et al., 2012). That
marine biota thrived throughout high CO
2
times cannot imply that
marine organisms will remain unaffected in a future warm, high-CO
2
world. The key environmental issue of the 21st century is one of an
unprecedented rate of change, not simply magnitude, of CO
2
levels
(Hönisch et al., 2012). The current rate and magnitude of ocean
acidification are at least 10 times faster than any event within the last
65 Ma (high confidence; Ridgwell and Schmidt, 2010) or even 300 Ma
of Earth history (medium confidence; Hönisch et al., 2012). The slower
events in geological history provide robust evidence (high agreement)
for environmentally mediated changes in biogeographic ranges of fauna
and flora, their compositional changes, extinctions, and, to much lesser
degree, emergences (very high confidence). No past climate change event
perfectly parallels future projections of anthropogenic climate change,
which is unprecedented in evolutionary history. Existing similarities
indicate, however, that future challenges (Sections 6.1.1, 6.3.1-8) may
be outside the adaptive capacity of many organisms living in today’s
oceans (low to medium confidence).
6.2. Diversity of Ocean Ecosystems and Their
Sensitivities to Climate Change
Global-scale observation and modeling studies provide robust evidence
of present and future climate-mediated alterations of the ocean
environment (high agreement; Section 6.1.1; WGI AR5 Chapters 3, 6;
Bopp et al., 2013), which in turn impact ocean ecosystems (high
confidence; Boyd and Doney, 2002; Drinkwater et al., 2010; Hoegh-
Guldberg and Bruno, 2010). An assessment of present findings and
projections requires knowledge of the characteristics of ocean biota
and ecosystems and their climate sensitivity.
Life on Earth is diverse as a result of nearly 4 billion years of evolutionary
history. Marine microorganisms are the oldest forms of life and the most
functionally diverse; multicellular organisms are constrained to limited
functional abilities. Knowledge of overarching similarities across the
organism domains Archaea, Bacteria, and Eukarya (Woese et al., 1990)
or kingdoms Bacteria, Protozoa, Fungi, Plantae, Animalia, and Chromista
(Cavalier-Smith, 2004) would facilitate projections of climate impacts.
The phylogenetic and metabolic diversity of microbes (i.e., viruses,
archaea, bacteria, protists, and microalgae) sustains key ecosystem
processes such as primary production, CO
2
fixation and O
2
production,
the conversion of nitrogen into ammonia (N
2
fixation), and the use of
nitrate, sulfate, CO
2
, and metals (iron and manganese) in metabolism
instead of O
2
when it is absent. Microbes enhance the horizontal

424
Chapter 6 Ocean Systems
6
t
ransfer of genetic information between unrelated individuals, thereby
enhancing biodiversity (McDaniel et al., 2010). Microbes may respond
to climate change by exploiting their large diversity, undergoing species
replacements (Karl et al., 2001), and thereby sustain their biogeochemical
roles. Species replacements also occur among plants and animals, but
in most cases research has focused on their resilience, well-being,
abundance, survival, and conservation under climate change (FAQ
6.2).
6.2.1. Pelagic Biomes and Ecosystems
Pelagic organisms are key to biogeochemical processes in the ocean.
The base of the marine food web is the photosynthetic fixation of CO
2
by phytoplankton, a process termed (net) primary production (NPP;
Box CC-PP). Photosynthesis is controlled by light, temperature, inorganic
nutrients (CO
2
, nitrate, phosphate, silicate, and trace elements including
iron), and the density-dependent stability of the surface mixed-layer depth
(MLD) (Section 6.1.1; Figure 6-2; Sverdrup, 1953; González-Taboada and
Anadón, 2012). Environmental variability and the displacement of
organisms by ocean currents cause variability in phytoplankton
productivity, competitiveness, and natural selection (Margalef, 1978)
and result in changes in carbon sequestration (Box CC-PP; Figure 6-4).
Nutrient limitation leads to a decrease in NPP or chlorophyll levels and
a reduction in the amount of energy supplied to higher trophic levels,
including fish and invertebrates (high confidence; Ware and Thomson,
2005; Brander, 2007), affecting fishery yields (Cheung et al., 2008;
Friedland et al., 2012). The wide range of trophic structures in marine
food webs and the potentially nonlinear changes in energy transfer
under different NPP and temperature scenarios (Stock and Dunne, 2010)
hamper accurate projections of changes in higher trophic levels.
6.2.2. Benthic Habitats and Ecosystems
The ocean’s primary production is inextricably linked with benthic (sea
floor) communities via the biological pump (Figure 6-4), the chemical
exchange of nutrients and gases, and the existence of organisms with
both pelagic and benthic life history stages. Even in abyssal habitats, a
continuous rain of organic detritus serves as the primary source of carbon
a
nd energy. Therefore climate impacts on surface marine ecosystems
will impact even the deepest benthic communities, even if direct changes
to their physical habitat do not occur (Smith et al., 2009).
Benthic organisms living in shallow waters or the intertidal zone (where
they encounter temporary exposure to air) are exposed to widely
fluctuating and progressively changing means and extremes of
environmental variables, such as temperature, oxygen, CO
2
, salinity, and
sea level (WGI AR5 Chapters 3, 13; Sections 6.3.1-3, 6.3.5). Plants and
sessile or slow moving animals may be unable to escape from unfavorable
changes except by means of advection of fertilized eggs or planktonic
larvae. If climate change harms those species engineering benthic
habitats, the entire ecosystem may be impacted. This concerns those
ecosystem engineers, which form habitat from the structures they
produce (e.g., corals forming skeletons; Section 6.3.1) and those forming
habitat through their behavior (e.g., worms reworking and irrigating
sediment in a process termed bioturbation). Effects on both types of
ecosystem engineers (Sections 6.3.1-8) influence the regeneration of
nutrients and affect benthic-pelagic coupling.
6.3. Climate Change Impacts
from Organism to Ecosystem
Understanding climate-induced alterations in the functioning of
individual organisms, species populations, communities (assemblages
of various species), and ecosystems builds on studies in the laboratory,
in micro- and mesocosms (closed small- to medium-sized experimental
systems approximating natural conditions, holding selected biological
communities), and of biota or communities in the field as well as
modeling. These data inform us which taxonomic groups in what
regions are more susceptible to climate change (Boyd et al., 2011).
Empirical studies of marine organism and ecosystem sensitivities have
begun identifying the mechanisms and processes linking climate to
ecosystem changes (Drinkwater et al., 2010; Ottersen et al., 2010).
Changes in ecological community composition, species interactions, and
food web dynamics often build on organismal effects elicited by climate
forcing (e.g., Section 6.3.1.5; Boyd et al., 2010; Ottersen et al., 2010).
The underlying mechanisms respond to climate-related factors in a
hierarchy from organism (highest), tissue, cell to molecular (lowest)
Table 6-1 | To assess how a changing climate will alter the ocean’s biological pump (Figure 6-4) and determine the resulting biogeochemical feedbacks on global climate,
changes in a wide range of processes from cells to ocean basins, and from epipelagic to mesopelagic, must be quantifi ed. This table illustrates the complexity of the integrated
knowledge platform needed to provide evidence of these biogeochemical ramifi cations and thus the present limits to clear conclusions about climate-induced effects on the
biological pump (NPP = net primary production; C = carbon; TEP = transparent exopolymer particle; DOM = dissolved organic matter; POM = particulate organic matter).
Alteration of physiological
rates
Biogeographical changes /
community shifts
Altered foodweb structure:
trophodynamics
Changes to particle
dynamics
Biogeochemical changes /
climatic feedbacks
• NPP (Bopp et al., 2002, 2013)
• Particle solubilization through
bacterial ectoenzymes (Christian
and Karl, 1995)
• TEP production (Engel et al.,
2004)
• Microzooplankton grazing rates
(Rose et al., 2009)
• Microbial community structure
(Giovannoni and Vergin, 2012)
• Phytoplankton community
structure, e.g., biomes (Boyd and
Doney, 2002)
• Alteration of zooplankton biomes
(Beaugrand et al., 2009)
• Faunistic shifts at depth (Jackson
and Burd, 2001)
• Altered prey-predator linkages
(Lewandowska and Sommer,
2010)
• Faecal pellet geometry (Wilson et
al., 2008)
• C partitioning between DOM
vs. POM, e.g., TEP (Riebesell et
al., 2007)
• Sinking rates /seawater viscosity
(Lam and Bishop, 2008)
• Ballasting, e.g., calcite versus
opal (Klaas and Archer, 2002)
• Particle fl ux /C sequestration
(Bopp et al., 2002)
• Shifts in elemental stoichiometry
of planktonic communities (Karl
et al., 2003)
• Remineralization rate; [O
2
],
hypoxia; nutrient resupply
(Gruber, 2011)
• Activity of the microbial loop;
vertical carbon export (Grossart
et al., 2006; Piontek et al., 2010)
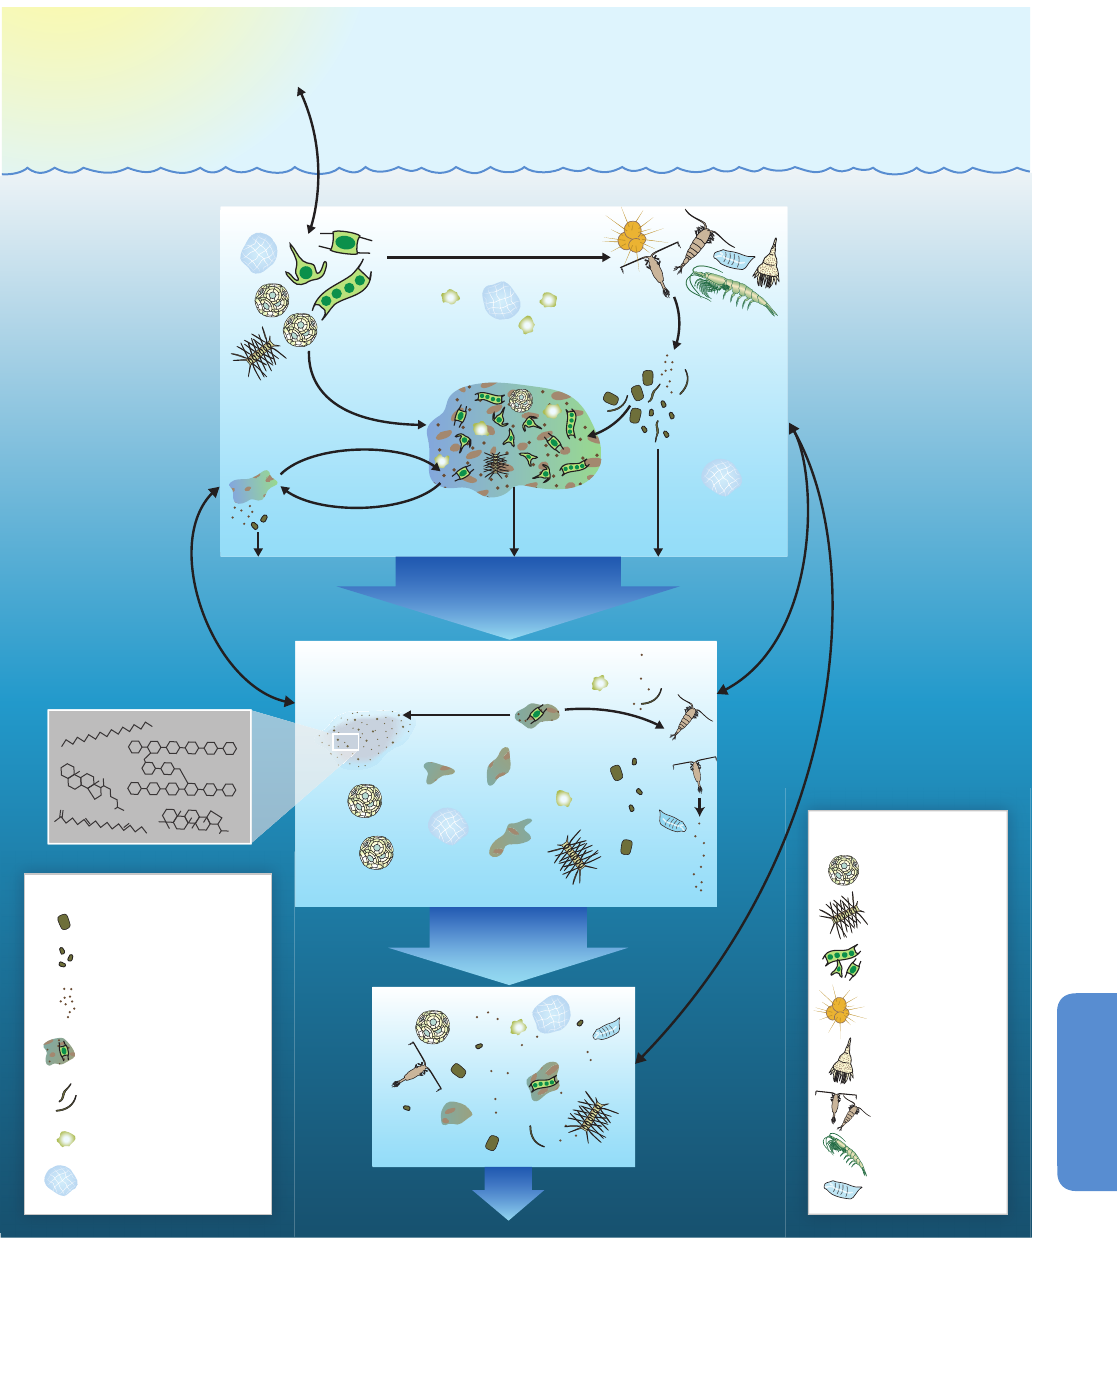
425
Ocean Systems Chapter 6
6
CO
2
Consumption
Aggregation
Fragmentation
Microbial
decomposition
Consumption
Sinking
Zooplankton
vertical
migration
Egestion
0–100 m
100–
500 m
>500 m
Physical mixing
of DOM
Ocean’s biological pump
Figure 6-4 | A schematic representation of the ocean’s biological pump, which will be influenced by climate change and is a conduit for carbon sequestration. It is difficult to
project how the pump might be altered and whether it would represent a positive or negative feedback to climate change through the cumulative effects of affected processes,
surface to depth (Table 6-1): shifts in net primary production, floristic and faunistic community composition in the pelagic realm, and in grazing rates; alterations to the ballasting
of settling particles and the proportion of net primary production released as dissolved organic matter; modified bacterial enzymatic rates and particle solubilization; faunistic shifts
at depth. Note that the relative sizes of the organisms, particles, and particle building blocks are not presented to scale (modified from Buesseler et al. (2008) by J. Cook / WHOI).
Coccolithophorids
Radiolaria
Salps
Foraminifera
Diatoms
Other
Phytoplankton
Copepods
Euphausiids
Plankton Key
Salp pellets
Copepod pellets
Microzooplankton
mini-pellets
Aggregates (marine snow)
Aluminosilicates
Euphausiid pellets
Larvacean houses
Particle Key
Sinking
particles

426
Chapter 6 Ocean Systems
6
levels of biological organization (Pörtner, 2002a; Pörtner and Knust,
2007; Raven et al., 2012). Such knowledge aids the interpretation and
attribution to climate change of observed effects and is a major asset
for projections of future impacts.
The genetic and physiological underpinning of climate sensitivity of
organisms sets the boundaries for ecosystem response and provides
crucial information on sensitivities, resilience, and the direction and
scope of future change. As anthropogenic climate change accelerates,
a key issue is whether and how quickly organisms can compensate for
effects of individual or multiple drivers, by short-term acclimatization
or long-term evolutionary adaptation across generations. Evolutionary
adaptation depends on the genetic variation within a population,
from which the environment selects the fittest genotypes (Rando and
Verstrepen, 2007; Reusch and Wood, 2007). Genetic variation depends
on mutation rates, generation time, and population size (Bowler et al.,
2010). However, epigenetic mechanisms, such as modifications of the
genome by DNA methylation, can also influence fitness and adaptation
(Richards, 2006) and can be remarkably rapid as seen in terrestrial
ecosystems (Bossdorf et al., 2008). In plants and animals the rate of
evolutionary adaptation is constrained by long generation times, but
enhanced by high phenotypic variability and high mortality rates among
early life stages as a selection pool (e.g., Sunday et al., 2011). The limits
to acclimatization or adaptation capacity are presently unknown.
Frequently Asked Questions
FAQ 6.2 | What is different about the effects of climate change on the oceans
compared to the land, and can we predict the consequences?
The ocean environment is unique in many ways. It offers large-scale aquatic habitats, diverse bottom topography,
and a rich diversity of species and ecosystems in water in various climate zones that are found nowhere else.
One of the major differences in terms of the effect of climate change on the oceans compared to land is ocean
acidification. Anthropogenic CO
2
enters the ocean and chemical reactions turn some of it to carbonic acid, which
a
cidifies the water. This mirrors what is also happening inside organisms once they take up the additional CO
2
.
Marine species that are dependent on calcium carbonate (CaCO
3
), such as shellfish, seastars, and corals, may find it
difficult to build their shells and skeletons under ocean acidification. In general, animals living and breathing in
water like fish, squid, and mussels have between five and 20 times less CO
2
in their blood than terrestrial animals,
so CO
2
-enriched water will affect them in different and potentially more dramatic ways than species that breathe
in air.
Consider also the unique impacts of climate change on ocean dynamics. The ocean has layers of warmer and colder
water, saltier or less saline water, and hence less or more dense water. Warming of the ocean and the addition of
more freshwater at the surface through ice melt and higher precipitation increases the formation of more stable
layers stratified by density, which leads to less mixing of the deeper, denser, and colder nutrient-rich layers with
the less dense nutrient-limited layers near the surface. With less mixing, respiration by organisms in the mid-water
layers of stratified oceans will produce oxygen-poor waters, so-called oxygen minimum zones (OMZs). Large, more
active fish can’t live in these oxygen poor waters, while more simple specialized organisms with a lower need for
oxygen will remain, and even thrive in the absence of predation from larger species. Therefore, the community of
species living in hypoxic areas will shift.
State-of-the-art ecosystem models build on empirical observations of past climate changes and enable development
of estimates of how ocean life may react in the future. One such projection is a large shift in the distribution of
commercially important fish species to higher latitudes and reduced harvesting potential in their original areas.
But producing detailed projections, for example, what species and how far they will shift, is challenging because
of the number and complexity of interactive feedbacks that are involved. At the moment, the uncertainties in
modeling and complexities of the ocean system even prevent any quantification of how much of the present
changes in the oceans are being caused by anthropogenic climate change or natural climate variability, and how
much by other human activities such as fishing, pollution, etc.
It is known, however, that the resilience of marine ecosystems to adjust to climate change impacts is likely to be
reduced by both the range of factors and their rate of change. The current rate of environmental change is much
faster than most climate changes in the Earth’s history, so predictions from longer term geological records may not
be applicable if the changes occur within a few generations of a species. A species that had more time to adapt in
the past may simply not have time to adapt under future climate change.
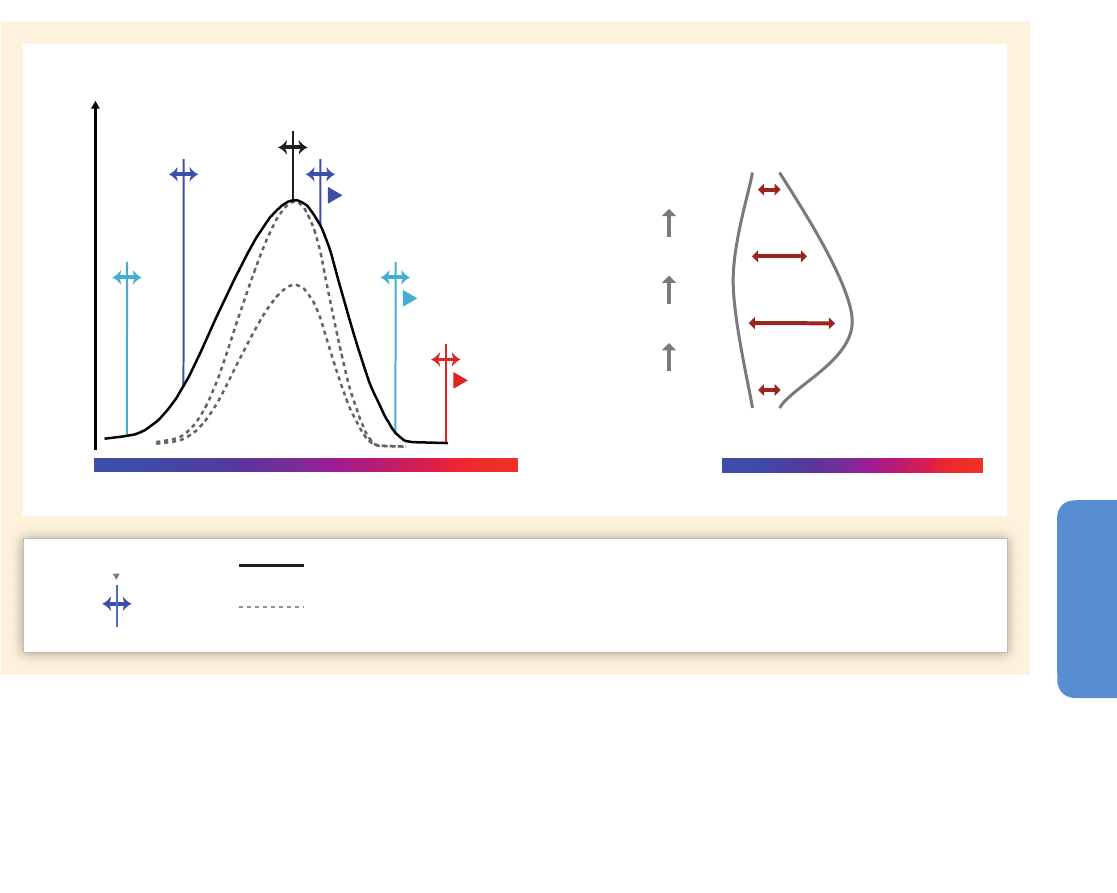
427
Ocean Systems Chapter 6
6
H
owever, mass extinctions occurring during much slower rates of climate
change in Earth history (Section 6.1.2) suggest that evolutionary rates
in some organisms may not be fast enough to cope.
Comprehensive understanding of climate change effects on ecosystems
requires addressing the effects of individual drivers across organism taxa
(Sections 6.3.1-4), the integrated action of multiple drivers (Section
6.3.5), the consequences for food webs (Section 6.3.6), and the specific
effects on animals breathing in air (Section 6.3.7) and operating at the
highest trophic levels.
6.3.1. Temperature Effects
The effects of temperature on ecosystems largely result from organismal
responses. This requires that information on organisms’ thermal
sensitivities, limits, and functional properties is used to assess how
temperature changes have affected and will continue to affect species
distributions, abundances, diversity, trophic interactions, community
assemblages, risks of species extinctions, and ecosystem functioning.
O
rganisms also respond to temperature-driven changes in the physical
environment such as stratification, reduced sea ice cover, and freshening.
Ambient temperature interacts with other drivers such as ocean
acidification and hypoxia (Section 6.3.5). Ambient temperature plays a
more limited role for marine mammals and seabirds (Section 6.3.7).
6
.3.1.1. Principles
All organisms including marine ones have limited temperature ranges
within which they live and function. Organismal performance is related
to temperature by curves called thermal reaction norms (Figure 6-5),
which likely apply across all organisms (Chevin et al., 2010), from viruses
(Knies et al., 2006), bacteria (Ratkowsky et al., 1983), and phytoplankton
(Eppley, 1972; Thomas et al., 2012) to macroalgae and plants (Bolton
and Lüning, 1982; Müller et al., 2009; Vitasse et al., 2010) and animals
(Huey and Kingsolver, 1989; Angilletta, 2009). Heat tolerance thresholds
differ greatly between organisms and are hypothesized to be lowered
by rising organizational complexity and body size (Pörtner, 2002a,b).
Maximum heat limits of animals and plants are close to the maximum
Temperature range
Temperature range
T
d
denaturation
T
opt
T
p
T
p
T
c
T
c
anaerobiosis
loss of performance
and abundance
Scope for aerobic performance
Aerobic thermal
window
HighLow
Growing adults
Spawners
Eggs, early larvae
Juveniles
(a)
Thermal windows for animals: limits and acclimatization
(b)
Thermal window widths across life stages (fishes)
Performance curve under normal conditions
Performance curve options under
elevated CO
2
or in hypoxic water or both
T
opt
Optimum temperature (performance maximum)
T
p
Pejus temperatures (limit to long-term tolerance)
T
c
Critical temperatures (transition to anaerobic metabolism)
T
d
Denaturation temperatures (the onset of cell damage)
acclimatization
and adaptation
Cold WarmCold Warm
threshold line
Figure 6-5 | Thermal specialization of an organism explains the why, how, when, and where of climate sensitivity. (a) The thermal tolerance range and performance levels of an
organism are described by its performance curve (exemplified for an animal). Each performance (e.g., exercise, growth, reproduction) is maximal at its optimum temperature (T
opt
),
and becomes progressively constrained during cooling or warming. Surpassing the first low- and high-temperature thresholds (T
p
; p, pejus: getting worse) means going into
time-limited tolerance. Once further cooling or warming surpasses the next low or high thresholds (T
c
; c, critical), oxygen availability becomes insufficient and an anaerobic
metabolism begins. Denaturation temperatures (T
d
) are even more extreme and characterized by the onset of damage to cells and proteins. Horizontal arrows indicate that T
p
, T
c
,
and T
d
thresholds of an individual can shift, within limits, between summer and winter (seasonal acclimatization) or when the species adapts to a cooler or warmer climate over
generations (evolutionary adaptation). Under elevated CO
2
levels (ocean acidification) and in hypoxic waters performance levels can decrease and thermal windows narrow
(dashed gray curves). (b) The width of the thermal range (horizontal arrows) also changes over time when an individual develops from egg to larva to adult and gains weight and
size. Blue to red color gradients illustrate the range between cold and warm temperatures (after Pörtner, 2002a, 2012; Pörtner and Farrell, 2008).
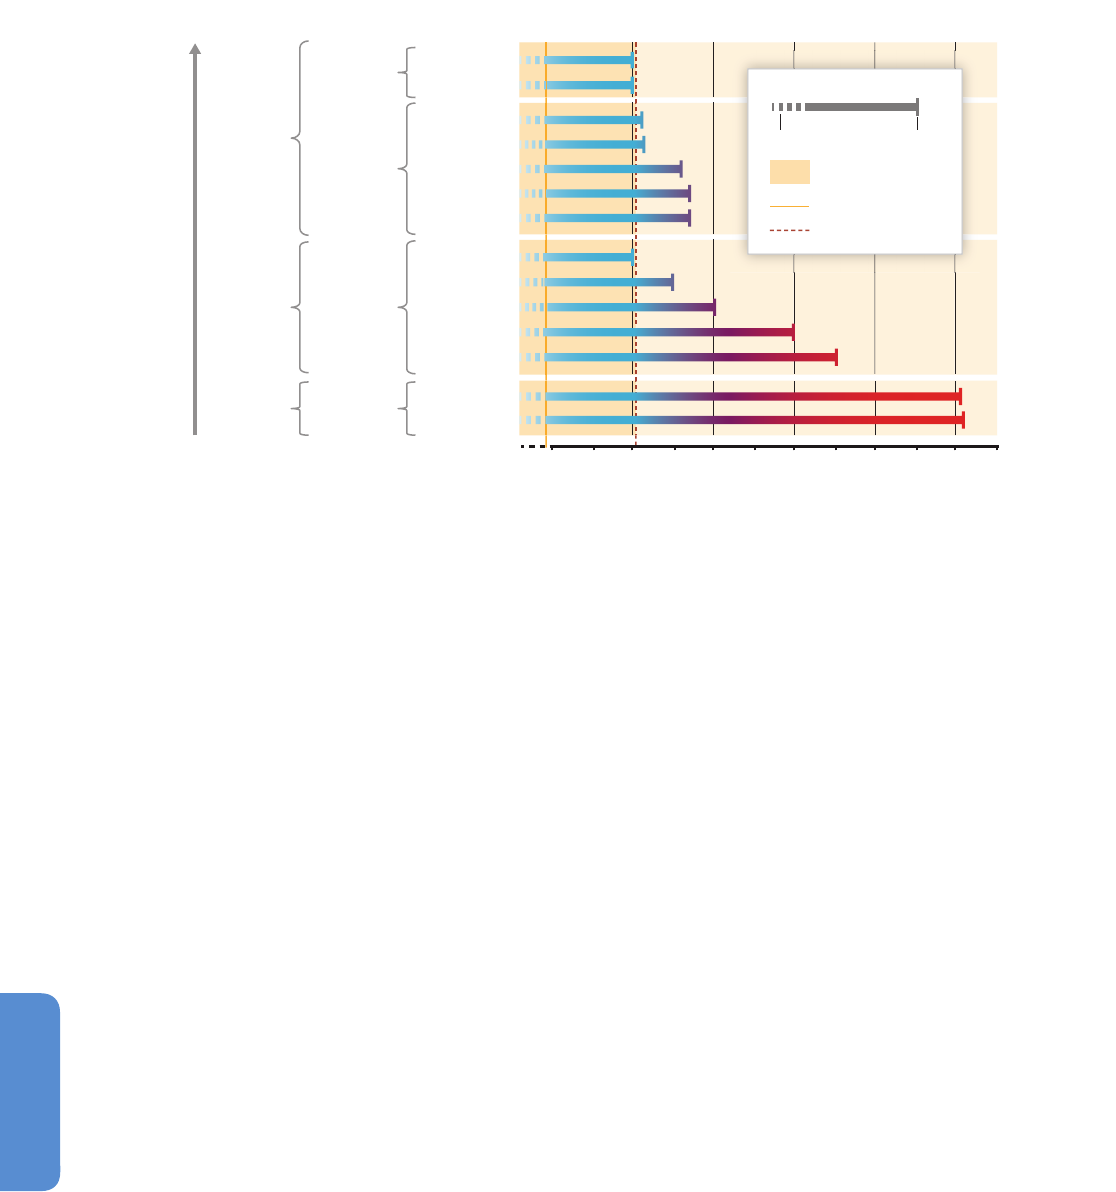
428
Chapter 6 Ocean Systems
6
temperature found in the warmest oceans (Figure 6-6). Knowledge of
reaction norms, thermal limits, and underlying mechanisms is most
advanced in animals (Pörtner et al., 2012; see also Section 6.3.1.4). Their
role in underpinning biogeography has not been explored systematically
in other organisms (e.g., Green et al., 2008), reducing the confidence level
in assessments of thermal impacts. In animals, changes in physiological
performances influence growth, body size, behavior, immune defense,
feeding, reproductive success, biogeography, phenology, and therefore
ecosystem structure and functioning. Shape and width of the curves
can shift through acclimatization and evolutionary adaptation (Figure
6-5a) and during life history (Figure 6-5b), with implications for the
distribution boundaries of species or populations (Section 6.3.1.5).
For any species, tracking the climate-induced displacement of tolerated
ambient temperatures by undergoing shifts in biogeographical ranges
to, e.g., higher latitudes during warming (Section 6.3.1.5; Figure 6-7) can
be understood as a simple mode of adaptation, implemented through
dispersal (e.g., of pelagic life stages), active movements (e.g., of migrating
adult fishes), or passive displacement (e.g., of early life stages or plankton
with drifting water masses). Conversely, fully completed acclimatization
or evolutionary adaptation (Figure 6-5) would involve shifting thermal
tolerance ranges and allow species to resist the temperature trend (e.g.,
warming) and to sustain fitness in their previous habitat.
6.3.1.2. Microbes
Temperature effects on growth, abundance, distribution, phenology, and
community structure of highly diverse microbes have large implications
for ecosystem functioning (Section 6.3; Box CC-PP). A warming ocean
may initially enhance the metabolic rates of microbes (Banse, 1991) and
stimulate their overall growth (Bissinger et al., 2008). Data from the
Continuous Plankton Recorder (Section 6.1.2) in the Northeast Atlantic
confirm that warming from 1960 to 1995 enhanced phytoplankton
growth (Edwards et al., 2001). Eventually, with warming, the thermal
tolerance of some groups will be challenged (Chevin et al., 2010), leading
to the replacement of species. This is reflected in increasing fractions of
smaller phytoplankton in warmer relative to colder waters (Morán et
al., 2010; Flombaum et al., 2013).
In response to transient warming, phytoplankton distribution in the
North Atlantic shifted poleward by hundreds of kilometers per decade
since the 1950s. Phenology of plankton in the North Atlantic was also
affected, with differences in sensitivity between groups (high
confidence; Section 6.3.1.5; Box 6-1). Coccolithophore blooms (Emiliania
huxleyi) in the Bering Sea were reported for the first time during the
period 1997–2000, probably in response to a 4°C warming, combined
with a shallower mixed layer depth, higher light levels and low
zooplankton grazing (Merico et al., 2004). Loss of multi-year Arctic sea
ice has had a profound effect on the diversity, structure, and function
of the epipelagic microbial assemblage (i.e., found in the layer into
which enough light penetrates for photosynthesis) (Comeau et al.,
2011), and further warming is likely to have even greater impacts
on the food web and on ecosystem services (medium confidence).
Warming may also have caused the southward range extension of
coccolithophores in the Southern Ocean in the 2000s (Cubillos et al.,
2007). However, further experimental and field observations (Giovannoni
and Vergin, 2012) are required to validate model projections (Taucher
Increasing complexity?
8
070605040 130120110100903020
Domain
Eukarya
Bacteria
Archaea
Multicellular
Unicellular
Unicellular
Unicellular
Cell number
Flagellata
Amoeba
Microalgae
Gram+ Bacteria
Flavobacteria
Cyanobacteria
Purple Bacteria
Ciliata
Thermotogales
Crenarchaeota
Euryarchaeota
Animals
Plants
Fungi
Group Tolerance range for growth
Temperature (°C)
M
ean SST = 17°C
Maximum SST = 41°C
M
aximal tempMinimal temp
Thermal window
S
ea surface
t
emperature (SST)
Figure 6-6 | Maximal values of temperature covered by various domains and groups of free-living marine organisms (bacteria to animals; domains and groups modified after
Woese et al., 1990). High organizational complexity is hypothesized to be associated with decreasing tolerance to heat and to enable an increase in body size which in turn,
decreases heat tolerance further (Sorokin and Kraus, 1962; Chevaldonné et al., 2000; Alker et al., 2001; Baumgartner et al., 2002; Pörtner, 2002a,b; Campbell et al., 2006; De
Jonckheere et al., 2009, 2011). In the domain Bacteria, the Thermotogales are less complex and most tolerant to high temperatures (Huber et al., 1986; Tenreiro et al., 1997;
Takai et al., 1999; Ventura et al., 2000; Abed et al., 2002). The highest temperature at which growth can occur is 122°C for hydrothermal vent archaea, seen under elevated
hydrostatic pressure in laboratory experiments (Kashefi and Lovley, 2003; Takai et al., 2008).

429
Ocean Systems Chapter 6
6
a
nd Oschlies, 2011) of differential responses to warming by different
microorganisms.
6.3.1.3. Macroalgae and Seagrasses
Macrophytes in coastal waters (Chapter 5) cover 0.6% of the world’s
marine areas and supply about 2 to 5% of total oceanic production
(Smith, 1981; Charpy-Roubaud and Sournia, 1990; Field et al., 1998).
They have limited temperature ranges and are sensitive to temperature
extremes (high confidence), resulting in changes of photosynthesis,
growth, reproduction, and survival (following the principles of Figures
6-5, 6-6; and Harley et al., 2012), with consequences for their abundance,
distribution, and productivity. Ice retreat in polar areas leads to an
expansion of macroalgal distribution, for example, in the Antarctic
(Quartino et al., 2013).
Warm- versus cold-water-adapted species may have different sensitivities
to warming and show a range of responses in distribution shifts (Lima
et al., 2007). Temperate macroalgae with wide windows of thermal
tolerance acclimatize by shifting these windows following seasonal
temperature changes (Kübler and Davison, 1995). Antarctic and tropical
macroalgae are exposed to permanently low or high temperatures,
respectively, and have consequently specialized in a limited temperature
range, paralleled by a low acclimatization potential (Pakker et al., 1995;
Eggert et al., 2006; Gómez et al., 2011). Thus, Antarctic and tropical
macroalgae appear to be most vulnerable to warming (high confidence;
Short and Neckles, 1999). While observations in the tropics indicate that
seagrasses tolerate higher temperatures than seaweeds (Campbell et
al., 2006), an increase in maximum temperature by >1°C from 1988–
1999 to 2002–2006 (Section 30.5.3.1.5) led to increased seagrass shoot
mortality in the Mediterranean Sea (Marbà and Duarte, 2010). The
molecular basis of acclimatization and evolutionary adaptation, as well
as their limitation in relation to the climate regime, require further study
in the macrophytes.
6.3.1.4. Animals
The mechanisms shaping the thermal performance curve and, thereby,
an animal’s thermal niche have been explained by the concept of “oxygen
and capacity limited thermal tolerance” (OCLTT), applicable to marine
invertebrates and fishes (Pörtner et al., 2010; see also Figure 6-5a, FAQ
6.2). The temperature range at which animals can function best results
from optimal oxygen supply at minimal oxygen usage. At temperature
extremes, oxygen supply capacity becomes constrained in relation to
demand, and metabolism becomes thermally limited. Beyond upper and
lower temperature thresholds (T
p
, Figure 6-5a), growth, reproduction,
and other key functions decrease. These thresholds change during the
individual life cycle, and with body size. At large body size, limitations
in oxygen supply are exacerbated and heat tolerance limits shift to
lower temperatures.
Surpassing species-specific heat tolerance limits (Figure 6-5, T
p
) during
warming causes a reduction of abundance (Pörtner and Knust, 2007;
Katsikatsou et al., 2012), coral losses (Donner et al., 2005), shifts in the
seasonal timing of (zooplankton) biomass formation (Mackas et al.,
1
998; Schlüter et al., 2010), and changes in growth (Lloret and Rätz,
2000; Brunel and Dickey-Collas, 2010). During early life, owing to
incomplete development, or as adult spawners, owing to large body
size, animals may become more sensitive to warming because of
narrower thermal windows (Pörtner et al., 2008). This may cause high
vulnerability of winter-spawning Atlantic cod to warming winter to
spring temperatures (Table 6-2). In contrast, adult bigeye, bluefin,
and skipjack tuna spawn at high temperatures. They need to prevent
overheating by moving to cooler (deeper) waters (Lehodey et al., 2011).
Although temperature means are still most commonly used when
attributing responses of marine organisms to climate effects, temperature
extremes rather than means are most often mediators of effects (e.g.,
Easterling et al., 2000; Wethey et al., 2011; Wernberg et al., 2013; Figure
6-5). During heat exposure near the borders of the distribution range
(including the high intertidal or warming surface waters), reductions in
growth, activity, and abundance accompany even small (<0.5°C) shifts
in ambient temperature extremes (e.g., Takasuka and Aoki, 2006;
Pörtner and Knust, 2007; Nilsson et al., 2009; Neuheimer et al., 2011).
Local extinction events follow as a result of mortality or behavioral
avoidance of unfavorable thermal environments (Breau et al., 2011).
Shifted species distribution ranges follow temperature clines from high
to low, usually along latitudes, a lateral gradient at basin scale (Perry et
al., 2005; Poloczanska et al., 2013), or a vertical temperature gradient to
deeper waters (high confidence; Dulvy et al., 2008; Section 6.5.3; see
also Figure 6-5b, Box CC-MB).
Adopting OCLTT principles has enabled modeling studies to project
climate effects (Section 6.5), and paleo-studies to explain climate-induced
mass extinction events and evolutionary patterns in Earth history (Pörtner
et al., 2005; Knoll et al., 2007). For example, long-term observations show
that warming affects the body size of marine fishes (medium confidence).
Assessing effects of warming on body size may be complicated by
effects on the animal’s energy budget, the changing availability and
body size of prey species, community structure, species interactions, or
effects of fishing (Genner et al., 2010; Cheung et al., 2013a). Below the
thermal optimum, warming causes growth and weight-at-age of some
juvenile or younger fish populations to increase (e.g., Brunel and Dickey-
Collas, 2010; Neuheimer and Grønkjær, 2012). However, OCLTT predicts
that small individuals are more heat tolerant than large ones, in line
with observations of falling animal body sizes in warming oceans (Box
6-1; e.g., Daufresne et al., 2009). This trend is projected to continue into
the 21st century (medium to high confidence; Cheung et al., 2013a).
Thermal windows of fishes and invertebrates roughly match ambient
temperature variability (Figure 6-1) according to climate regime and
seasonality (Pörtner and Peck, 2010; Sunday et al., 2012). Sub-Arctic,
small, or highly mobile species are eurytherms. They function across a
wide temperature range, that is, they have wide thermal windows and
distribution ranges, at the expense of higher energetic costs and
associated lifestyles (Pörtner, 2002a, 2006). Conversely, high polar
species are stenotherms, that is, they have narrow thermal windows and
low energy demand lifestyles, making them sensitive to temperature
change. In a warming world, polar stenotherms will be marginalized,
with no possibility to escape to colder regions (high confidence).
However, extinction of polar species has not yet been reported. As
marine fishes and invertebrates in the Southern Hemisphere are

430
Chapter 6 Ocean Systems
6
adapted to less variable ocean temperatures than those in the Northern
Hemisphere (Jones et al., 1999; Figure 6-1), they may generally be more
vulnerable to warming extremes than Northern ones. Tropical species
(with thermal windows of intermediate width) live close to the highest
temperatures tolerated by marine animals (Figure 6-6). Vulnerability is,
therefore, highest for polar stenotherms, similar or lower for tropical,
and lowest for temperate species (high confidence).
Short-term shifts in thermal thresholds of an individual organism may
happen over days and weeks, such as during seasonal acclimatization.
Long-term shifts occur over many generations during evolutionary
adaptation of a population to cooler or warmer climates (Figure 6-5a;
Pörtner, 2006; Pörtner et al., 2008; Eliason et al., 2011). Both
acclimatization and adaptation involve adjustments in biochemical
characters (membranes, enzymes); however, the capacity to shift those
boundaries is limited and depends on the species and the prevailing
climate regime (Pörtner et al., 2008, 2012). Ocean acidification, hypoxia,
food availability, and stress affect those limits (Section 6.3.5; Figure
6-5a).
Local adaptation may reduce climate vulnerability at the species level,
by causing functional and genetic differentiation between populations,
thereby enabling the species to cover wider temperature ranges and
live in heterogeneous environments. Local adaptation on small spatial
scales is particularly strong in intertidal organisms (Kelly et al., 2012).
On larger scales, the widening biogeographic and roaming ranges of
Phenomenon Key drivers Mechanism / Sensitivity
Biogeography
N
orthward shift in the distribution of North Sea cod
(Gadus morhua) stocks between 1977 and 2001.
1
,2
T
emperature Bottlenecks of high sensitivity during early life stages as well as
adult spawning stage in winter /early spring.
S
hift from sardines (Sardinops melanostictus) to
anchovies (Engraulis japonicus) in the western North
P
acifi c observed between 1993 and 2003.
3,4
T
emperature Thermal windows of growth and reproductive output are
found at higher temperatures for anchovies than sardines, food
p
references of the competing species being similar.
Variable sensitivity of Pacifi c tuna species to the
a
vailability of dissolved O
2
.
Bigeye tuna routinely
reach depths where ambient O
2
content is below 1.5
m
l L
– 1
(≈ 60 µmoles kg
– 1
)
.
5, 6
Oxygen Oxygen transport via hemoglobin is adapted to be highly
e
ffi cient supporting high metabolic rates as needed during
feeding in the OMZ.
N
orthward movement of species and the conversion
of polar into more temperate and temperate
i
nto more subtropical system characteristics in
the European Large Marine Ecosystems between
1
958–2005.
7
, 8
W
arming and current advection Effects are attributed to climate change but may be infl uenced
by nutrient enrichment and overfi shing.
Abundance
Increase in abundance of arctic boreal plankton
species, notably the copepods Calanus hyperboreus,
C
alanus glacialis and the dinofl agellate Ceratium
arcticum between 1960 and 2000 in the
N
ewfoundland Shelf, Northwest Atlantic.
9,10
Temperature Temperature sensitivity of phyto- and zooplankter resulting from
cooling due to increased infl ux of Arctic water.
A benthic fi sh species, the eelpout (Zoarces
v
iviparus) at its southern distribution limit, the
German Wadden Sea, displayed abundance losses
during warming periods and rising summer extreme
t
emperatures between 1993 and 2005, with early
disappearance of the largest individuals.
1
1
Temperature Temperature extremes exceed organism’s thermal windows,
w
ith largest individuals being relatively less tolerant to high
temperature than smaller individuals.
V
ariable sensitivities to OA within and across animal
phyla (Figure 6-10b).
1
2 – 21
A
nthropogenic OA, sea water
acidifi cation by elevated pCO
2
in
OMZs, upwelling areas, involving
anthropogenic ocean acidifi cation.
L
owered extracellular (blood plasma) pH causing a lowering
of the rates of ion exchange and metabolism in muscle or liver
(hepatocytes) of vertebrates and invertebrates. High sensitivity
at reduced energy turnover in tissues and /or whole organism
by reduced ion exchange, use of more energy effi cient transport
mechanisms, reduced protein synthesis, enhanced nitrogen
release from amino acid catabolism and protein degradation,
slower growth.
Phenology
Migration time of pink salmon (Oncorhynchus
gorbuscha) in Alaska is almost two weeks earlier in
2010s relative to 40 years ago.
2
2
Warming Rapid microevolution for earlier migration timing.
In the waters around the UK, during a period
of warming between 1976 and 2005, the
seasonal timing of biological events of all major
marine taxonomic groups (plant / phytoplankton,
invertebrate and vertebrates) advanced, on average,
by 0.31 to 0.43 days year
– 1
.
23
Warming Sensitivity to seasonal temperature changes as a result of
specifi c thermal windows of different organisms.
Body size and growth
Asymptotic body sizes of different populations of
Atlantic cod (Gadus morhua) and Atlantic Herring
(Clupea harengus) are negatively related to
temperature.
24, 25
Warming At large body size, oxygen supply limitations are exacerbated
and the organism reaches its long-term heat tolerance limits at
lower temperatures, thus limiting the maximum body size that
can be reached.
Table 6-2 | Selected examples of species responses and underlying mechanisms to changing temperature, oxygen level and ocean acidifi cation (OA). References are indicated by
superscript numbers and in the footnote.
1. Perry et al. (2005); 2. Pörtner et al. (2008); 3. Takasuka et al. (2007); 4. Takasuka et al. (2008); 5. Lehodey et al. (2011); 6. Seibel (2011); 7. Beaugrand et al. (2009); 8.
Philippart et al. (2011); 9. Johns et al. (2001);10. Greene and Pershing (2003); 11. Pörtner and Knust (2007); 12. Reipschläger and Pörtner (1996); 13. Pörtner et al. (2000); 14.
Vezzoli et al. (2004); 15. Langenbuch and Pörtner (2003); 16. Fernández-Reiriz et al. (2011); 17. Langenbuch and Pörtner (2002);18. Langenbuch et al. (2006); 19. Michaelidis et
al. (2005); 20. Pörtner et al. (1998); 21. Stumpp et al. (2012); 22. Kovach et al. (2012); 23. Thackeray et al. (2010); 24. Taylor (1958); 25. Brunel and Dickey-Collas (2010).

431
Ocean Systems Chapter 6
6
N
orthern Hemisphere eurytherms into Arctic waters (Pörtner et al., 2008)
are supported by the differentiation into populations with diverse thermal
ranges, combined with high acclimatization capacity. By contrast, such
capacity is small in high polar, for example, Antarctic species (Peck et
al., 2010). Tropical reef fishes undergo rapid warm acclimation across
generations (Donelson et al., 2012) but some may approach animal heat
limits. The rates, mechanisms, and limits of thermal acclimatization and
evolutionary adaptation are poorly understood (low confidence).
6.3.1.4.1. Warm- and cold-water coral communities
Tropical corals live in shallow water and differ from most other animals
by hosting dinoflagellates (Symbiodinium sp.) in their tissues, which
provide the host with organic carbon from photosynthesis and with
nitrogen and enable the corals to build and sustain carbonate reefs (Box
CC-CR). High light, rapid salinity changes, and small increases in
temperature can trigger ”coral bleaching”, the loss of symbionts and tissue
color. In case of warming, early steps involve shifts in the photosynthetic
processing of light, generating Reactive O
2
Species (ROS) that may in turn
damage the symbionts (Hoegh-Guldberg and Smith, 1989; Glynn and
D’Croz, 1990; Jones et al., 1998; Hoegh-Guldberg, 1999). Mass bleaching
correlates with small temperature anomalies (+1°C to 2°C of the long-
term summer maximum, satellite observations), causing mortalities
(Goreau and Hayes, 1994; Strong et al., 2011) and decreasing coral
abundance, on average by 1 to 2% per year (high confidence; Bruno
and Selig, 2007; see also Box CC-CR; Section 30.5.6).
The degree of impact will depend on the coral reefs’ adaptability to
thermal stress and the interaction of multiple drivers (Meissner et al.,
2012; Teneva et al., 2012; see also Box CC-CR). Such capacity is
suggested by different heat tolerances among coral genera (Hoegh-
Guldberg and Salvat, 1995; Loya et al., 2001), the exchange of genetic
clades of Symbiodinium with more tolerant varieties (Baker, 2001; Jones
et al., 2008), as well as acclimatization phenomena (Howells et al., 2012).
Studies of the thermal sensitivity of deeper-living cold-water corals
(without endosymbionts) are scarce. One species, Lophelia pertusa,
responds to about 3°C warming with a threefold increase in metabolic
rate (Dodds et al., 2007), indicating a narrow thermal window in the
cold (cf. Pörtner, 2006).
6.3.1.5. Ecosystems
Heat exposure of ecosystem engineers may threaten the existence of a
whole ecosystem. During the last warm interglacial period equatorial
coral reefs deteriorated and retreated (Kiessling et al., 2012), a finding
emphasizing their thermal sensitivity (Veron et al., 2009) and showing
that warming oceans can reach temperatures well beyond the upper
heat limits of distinct animal groups and marine animals overall (Figure
6-6). In the present-day Great Barrier Reef, a large-scale survey found
diverse coral types along a climatic gradient, with no consistent
response to climatic drivers (Hughes et al., 2012). However, warm-induced
bleaching has contributed to the progressive decrease in live coral cover
observed over the last decades (De’ath et al., 2012; see also Box CC-CR;
Section 30.5.6).
W
ithin ecosystems, shifting competitive or trophic interactions, differential
risks for species extinctions and, thereby, scenarios of community-level
responses to temperature change (Urban et al., 2012; Milazzo et al., 2013)
can be traced back to changing differences in the performance of
participating animal species (Figure 6-7; e.g., Cairns et al., 2008; Harley,
2011; Pörtner, 2012). Knowledge is insufficient to assess interactions of
species from different domains, impeding a deeper understanding of
shifting distributions, abundances, community assemblages, and food
webs in space and time (low confidence in current understanding;
Parmesan and Matthews, 2005).
For example, in a coastal microcosm (small-scale, simplified experimental
ecosystem) resident heterotrophic bacteria were stimulated by warming
more than a laboratory-reared phytoplankter (Wohlers-Zöllner et al.,
2011). Also, high- to low-latitude transects in both the North and South
Atlantic revealed a shift between cold and warm waters, from photo-
autotrophs (gaining energy from photosynthesis) to chemo-heterotrophs
(Hoppe et al., 2002). Thermal stimulation of bacteria over phytoplankton
has biogeochemical implications, for example, microbially mediated
CO
2
flow to the atmosphere might increase (Sarmento et al., 2010). The
principles and wider applicability of these findings require further
investigation (limited evidence, low agreement; Kirchman et al., 2009).
Observations of shifting distributions and phenologies, reproduction,
and range shifts of phytoplankton, zooplankton, other invertebrates,
fishes, and seabirds in pelagic and coastal marine ecosystems have at
least partly been attributed to temperature-mediated biological
responses (high confidence; see also Figure 6-8; Box 6-1; Box CC-MB).
In the North Atlantic as a key example, many biological events have
been occurring earlier in the year (robust evidence, high agreement;
Box 6-1; Section 30.5.1.1.1). Species richness has increased as a result
of shifts in ranges and abundances. In the Norwegian and Barents Seas,
a time series (1959–2006) of four commercial fish species and their
zooplankton prey showed that climate shapes population growth rates
through complex influences early in life, including direct temperature
effects on growth, indirect effects via the biomass of zooplankton prey,
and delayed feedback effects through predators (Stige et al., 2010).
Differential species responses to temperature and trophic amplification
were demonstrated to modify species interactions at five trophic levels:
primary producers (phytoplankton); primary, secondary, and tertiary
consumers (zooplankton, fishes, and jellyfishes); and benthic detritivores
(echinoderms and bivalves) (Kirby and Beaugrand, 2009). Also, the
responses of various plankton functional groups, such as diatoms,
dinoflagellates, and copepods, to warming are not synchronous, resulting
in predator-prey mismatches that carry over to higher trophic levels
(high confidence; Edwards and Richardson, 2004; Costello et al., 2006;
see also Figure 6-7a; Section 6.3.6). In the intertidal, warming-induced
changes in relative species ranges lead to shifts in dominance through
competitive interactions and to modifications in predator pressure
(Poloczanska et al., 2008; Harley, 2011). Trans-Arctic interchange of
species between Atlantic and Pacific has happened repeatedly in warm
periods of the Pleistocene (Dodson et al., 2007) and may occur again,
now facilitated by ballast transport by enhanced trans-Arctic shipping
(low to medium confidence).
Warming may increase the risk of disease outbreaks or parasite infections,
in marine organisms and ecosystems, and ultimately, humans (medium
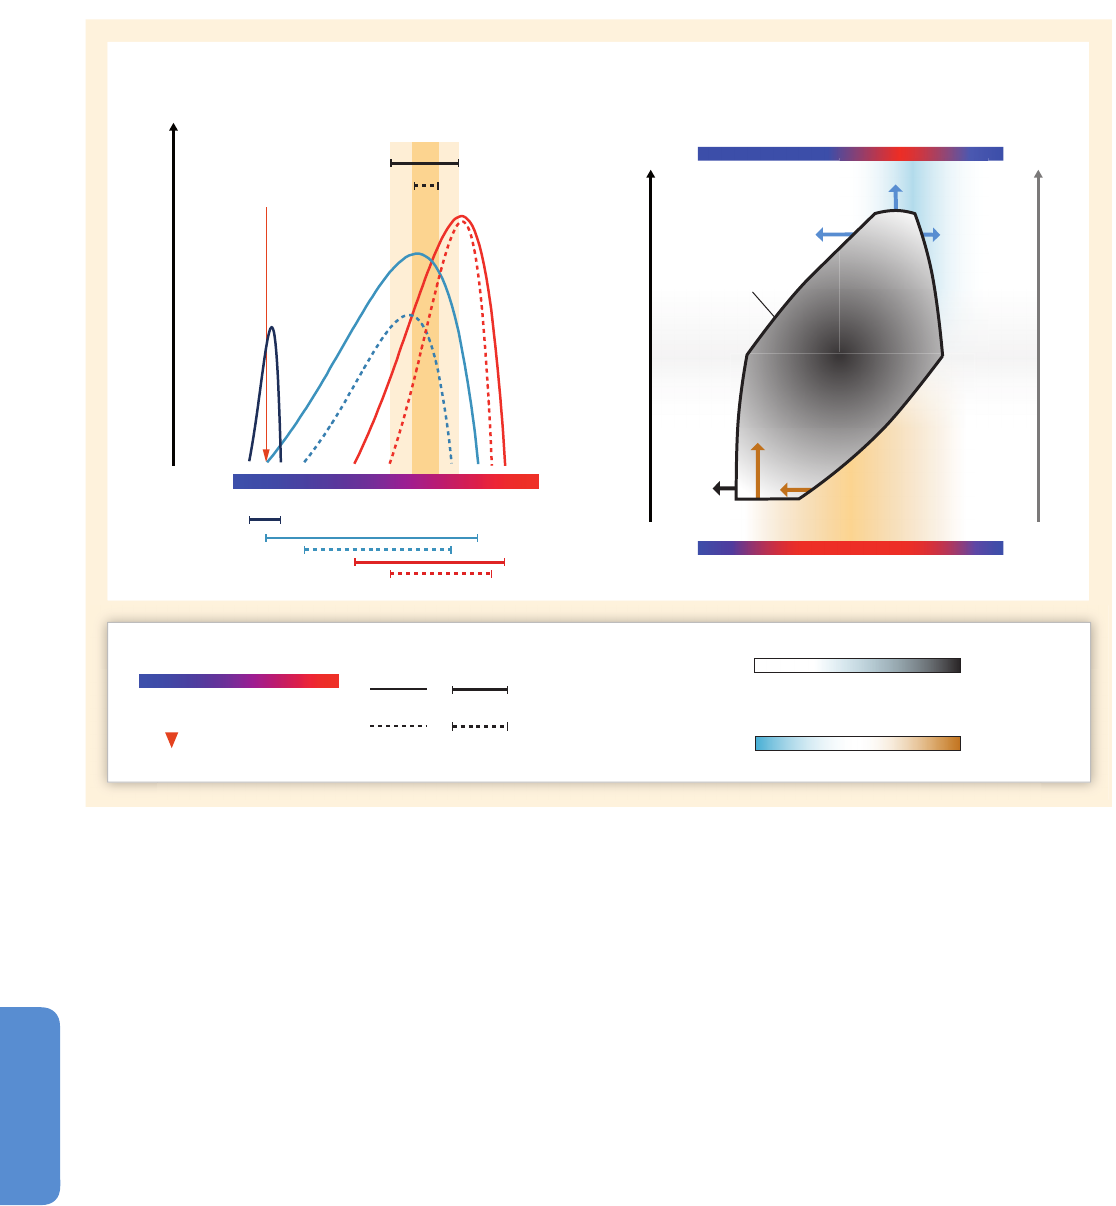
432
Chapter 6 Ocean Systems
6
confidence; Altizer et al., 2013; Burge et al., 2014). Some marine
pathogens and protist diseases are shifting their distribution poleward as
oceans warm (e.g., Baker-Austin et al., 2013; Burge et al., 2014). Climate
change may weaken the immune response of hosts, particularly fishes
and invertebrates, and increase their susceptibility to disease, as
observed during warming in coral reefs of the Pacific and Caribbean
(Harvell et al., 2009). Global outbreak frequencies of jellyfish aggregations
may follow rising sea surface temperatures (SSTs) (low confidence; Mills,
2001; Purcell and Decker, 2005), but evidence is inconclusive. Some
studies report an increasing trend (Brotz et al., 2012) and others do not
support this view (Condon et al., 2013).
In conclusion, organisms live in limited temperature ranges and are
sensitive to temperature extremes (very high confidence). Temperature
governs the biogeography, diversity, development, reproduction,
behavior, and phenology of marine species as well as the composition of
communities in both pelagic and benthic systems and the seasonal timing
of relevant processes (phenology) (very high confidence). Ecosystems
functioning at the coldest temperatures and warm adapted ones existing
at their upper thermal limits are more sensitive (medium confidence).
6.3.2. Carbon Dioxide Effects
Evidence for biological effects of ocean acidification stems from paleo-
observations (Section 6.1.2), few observations in the field (Section
6.3.2.5), studies at volcanic CO
2
seeps as natural analogs, and mostly
from short- to medium-term (hours to months) experiments in the
Latitudes (in °N)
Contraction
Expansion
Aerobic performance and productivity
Warm
adapted
Temperate
eurytherm
Temperate
Polar
Tropical
P
olar
s
tenotherm
C
oexistence ranges
Normal condition
CO
2
, Hypoxia
Impact of photoperiod
High
North
Low
South
HighLow
(a)
Competition, predator/prey, phenologies of organisms in
different climate zones
(
b)
S
patial dynamics during progressive warming
Temperature range
Under normal condition
Under elevated CO
2
and in
hypoxic water
Species abundance
Spatial dynamics during progressive warming
Phenology
shift
Seasonal temperature dynamics in low latitude
Temperature-dependent
time window
Temperature ranges of organisms in climate zones
S
easonal temperature dynamics in high latitude
Spring warming cue
Spring warming cue
Jan Dec
Jan Dec
Warm
HighLow
Expansion Contraction
Cold
Performance
curve
Performance
range
Contraction
Expansion
Figure 6-7 | Role of thermal tolerance and performance of organisms at ecosystem level. (a) Thermal tolerance ranges (Figure 6-5) differ between species across polar, temperate,
and tropical climate zones, then overlap between coexisting species. Shifting temperatures and specific effects of additional drivers on the respective performance curves (dashed
lines) change the fitness of coexisting species relative to each other as well as their temperature range of coexistence (after Pörtner and Farrell, 2008). Warming alters the timing
of seasonal activities (e.g., elicited by spring warming cues) to earlier, or can benefit only one of two interacting species (e.g., in predator–prey dynamics or competition), causing
shifts in predominance. (b) During climate warming a largely unchanged thermal range of a species causes it to follow its normal temperatures as it moves or is displaced,
typically resulting in a poleward shift of the biogeographic range (exemplified for the Northern Hemisphere; modified after Beaugrand, 2009). The polygon delineates the
distribution range in space and seasonal time; the level of gray denotes abundance. The Southern time window of tolerated temperatures shifts to earlier and contracts, while the
Northern one dilates (indicated by arrows). Species display maximum productivity in low latitude spring, wide seasonal coverage in the center, and a later productivity maximum
in the North. The impact of photoperiod (length of daily exposure to light) increases with latitude (gray arrow). Water column characteristics or photoperiod may overrule
temperature control in some organisms (e.g., diatoms), limiting northward displacement.
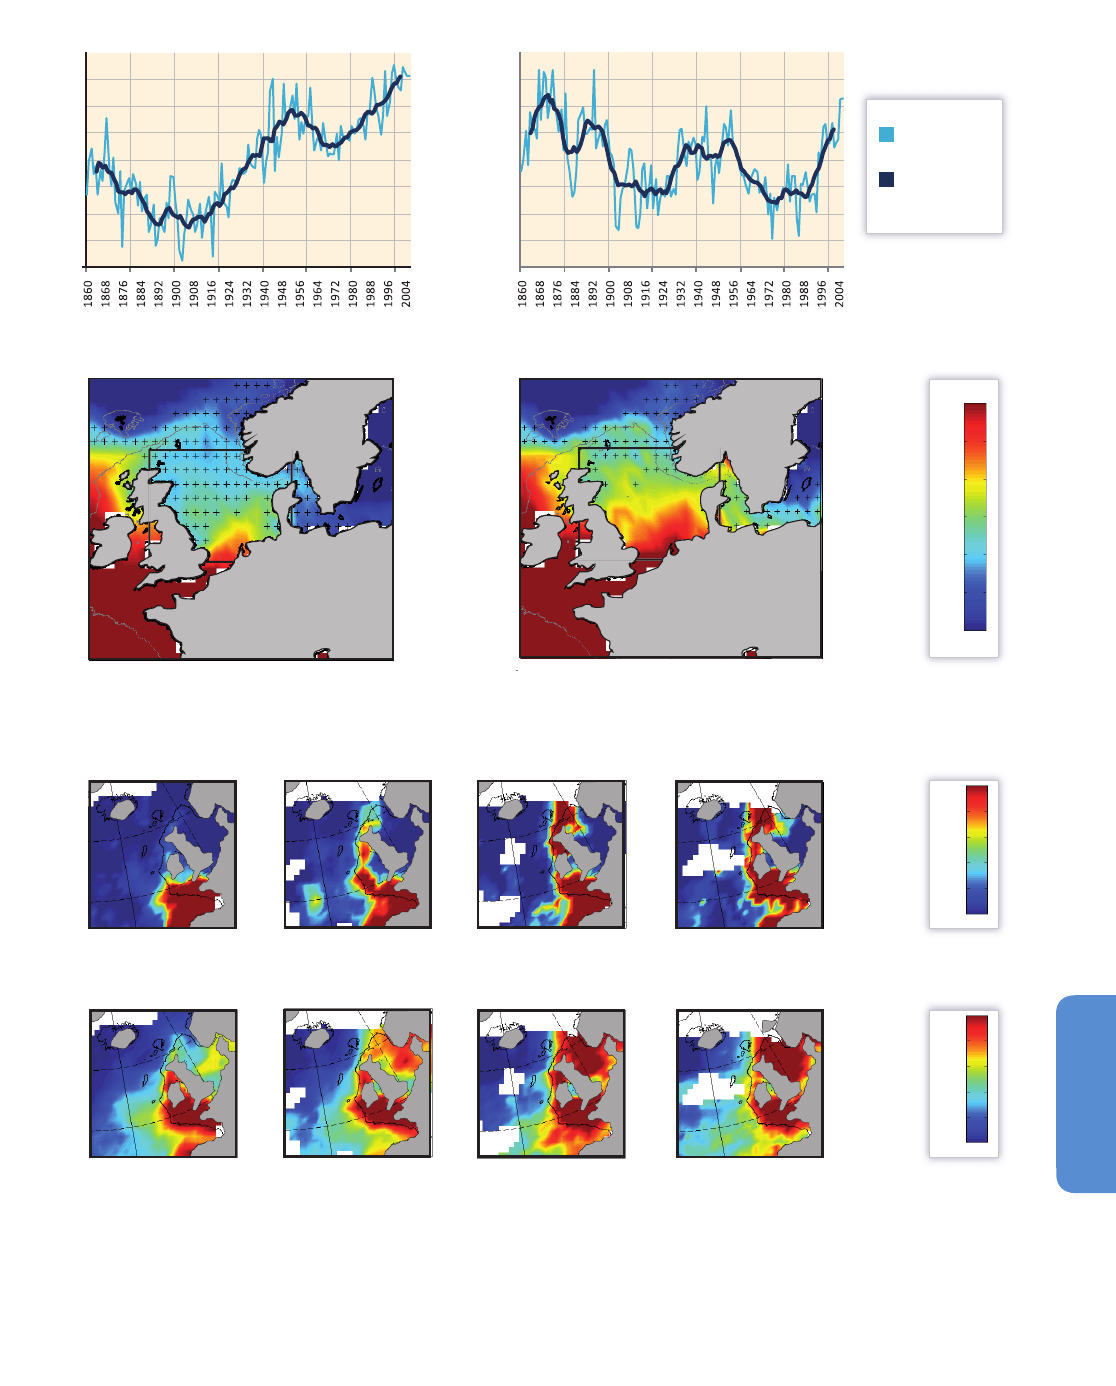
433
Ocean Systems Chapter 6
6
0.00
0.04
0.08
Mean number of species per assemblage
2003–2005
2000–2002
1982–1999
50°N
60°N
1958–1981
50°N
60°N
(
a) Climate warming
(
b) Atlantic Multi-decadal Oscillation (AMO)
65°N
60°N
55°N
45°N
50°N
0°E 5°E 10°E 15°E5°W
Latitudes
72.15% of the geographical
cells have a temperature
regime between 9 and 10°C
Longitudes
(c) Temperature regime (1960–1981)
(e) Warm-temperate pseudo-oceanic species
(f) Temperate pseudo-oceanic species
Annual mean
5-year
running mean
2003–2005
2000–2002
1982–1999
1958–1981
0.0
0.4
0.8
(d) Temperature regime (1988–2005)
11.5
10.5
9.5
8.5
0°E 5°E 10°E 15°E5°W
6
5°N
60°N
55°N
45°N
50°N
Latitudes
20.25% of the geographical
cells have a temperature
regime between 9 and 10°C
Longitudes
11.5
10.5
9.5
8.5
−
5
10
15
20
−15
−
10
−20
0
5
Index of temperature change
(AMO; 17.5%)
Index of temperature change
(climate change; 30.5%)
SST (in °C)
−
5
0
5
10
15
20
−15
−
10
−20
Figure 6-8 | Multi-decadal changes in ecosystem structure in the Northeast Atlantic driven by warming from both anthropogenic climate change and natural climate variability.
(a) Index of temperature change over the North Atlantic (31°N to 65°N and 99°W to 11°E) reflecting climate change. This index is the first principal component (i.e., explaining
30.5% of observed variability) based on a principal component analysis (PCA) performed on sea surface temperature. (b) Index of temperature change (17.5% of observed
variability) reflecting the Atlantic Multi-decadal Oscillation (AMO). The index is the second principal component. (c, d) Observed mean annual sea surface temperature in the
North Sea during 1960–1981 (c) and 1988–2005 (d). The location of the critical thermal boundary (9°C to 10°C) is indicated by “+.” (e) Long-term changes in the mean number
of warm-temperate pseudo-oceanic species from 1958 to 2005. (f) Long-term changes in the mean number of temperate pseudo-oceanic species from 1958 to 2005. The period
1958–1981 was a period of relative stability and the period 1982–1999 was a period of rapid northward shifts, indicating that the abrupt ecosystem shift observed in the North
Sea was part of a large-scale response of the zooplankton biodiversity to warming temperatures (see a–d). Average values are below 1 because they are annual averages. Note
that the color bar is 10-fold smaller for warm-temperate pseudo-oceanic species because these species are less frequently observed than their temperate counterparts. Panels (a)
and (b) from Edwards et al. (2013), and (c)–(f) from Beaugrand et al. (2008, 2009).
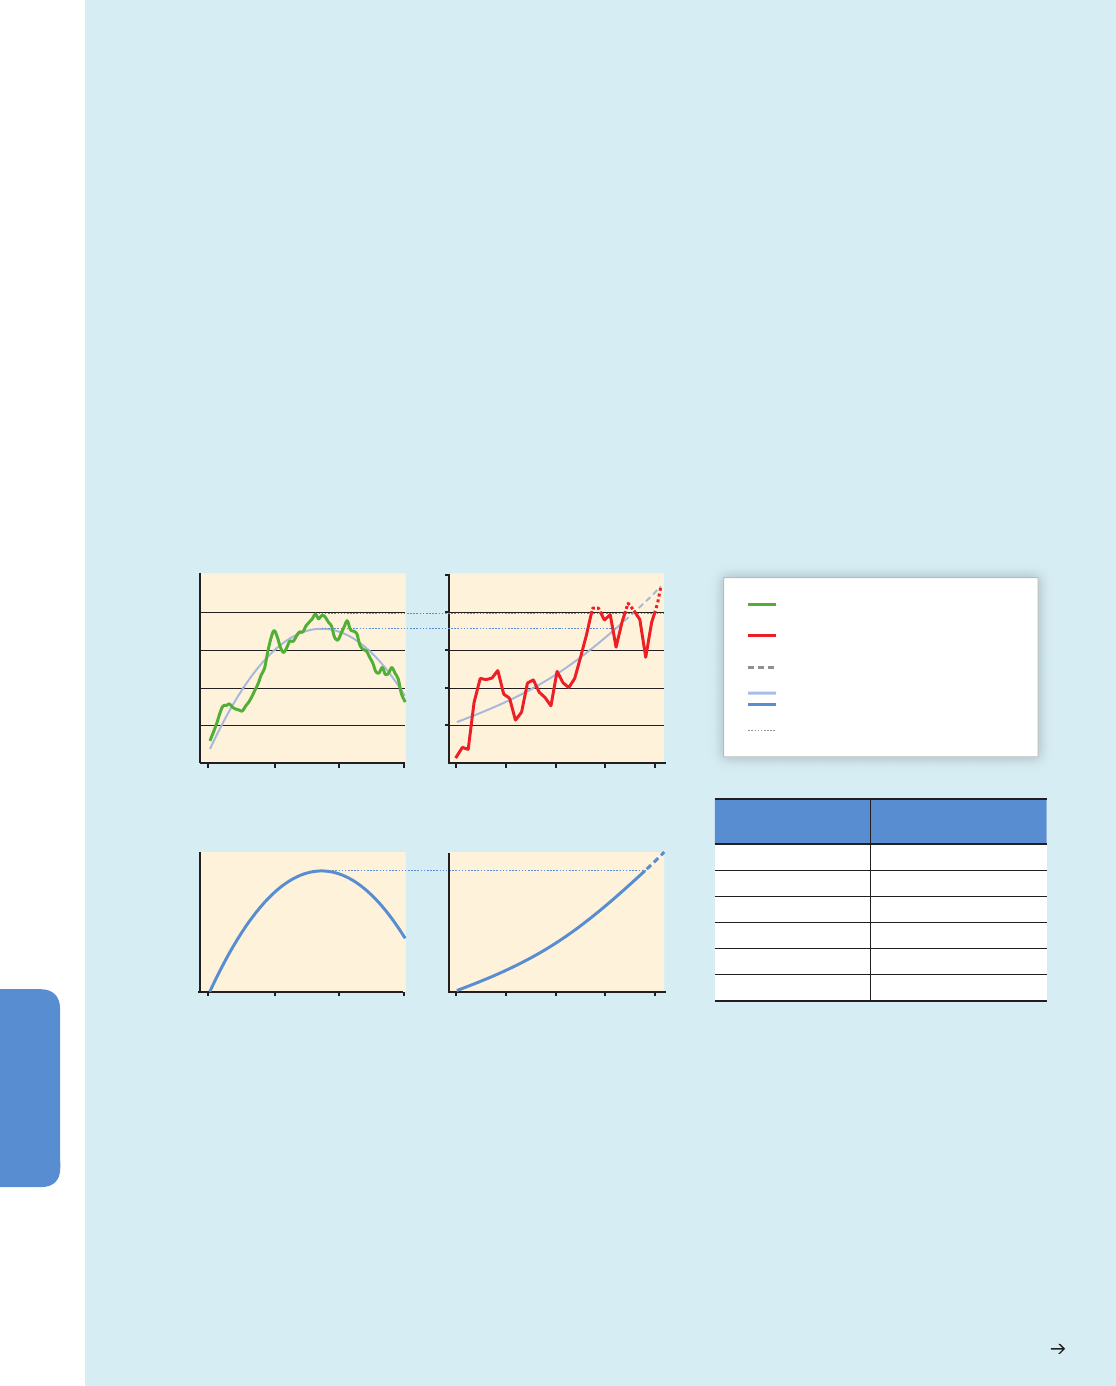
434
Chapter 6 Ocean Systems
6
Box 6-1 | An Atlantic Ocean Example:
Long-Term Responses of Pelagic Organisms and Communities to Temperature
Long-term observations (Sections 6.1.2, 30.5.1.1.1) encompassing the pelagic Northeast Atlantic over a 50-year period and longer
(Figures 6-8, 6-9) show changes in the seasonal abundance of phytoplankton, rapid northerly displacements of temperate and
subtropical zooplankton (e.g., calanoid copepods) and phytoplankton (e.g., dinoflagellates and diatoms), and the resulting changes in
the ecosystem functioning and productivity (high confidence; Edwards et al., 2001; Beaugrand et al., 2002; Edwards and Richardson,
2004). The range limit of warm water copepods shifted by 10° north since 1960 (Beaugrand et al., 2009), with attendant mismatch in
the seasonal timing of trophic levels (predators and prey) and functional groups (Edwards and Richardson, 2004). Modes of climate
variability reflected in climate indices like the Northern Hemisphere Temperature (NHT) and the North Atlantic Oscillation (NAO) over
multi-decadal periods accompanied these changes (Figure 6-1). In cooler regions, increased phytoplankton activity caused by warming
favored growth, resulting in the observed increase in phytoplankton biomass, whereas a decrease in nutrient supply would have
prevented growth in warmer regions and caused a decrease in biomass (Richardson and Schoeman, 2004; see also Section 6.3.4).
Hinder et al. (2012) attributed a recent decline in North Sea dinoflagellates relative to diatoms to warming, increased summer
windiness, and thus water column turbulence. The ecosystem response to natural climate variability in the past provides a glimpse
into the climate-induced changes of the near future (Figure 6-9).
Temperature change (
o
C)
Increasing magnitude
of change
1910 197019501930
1910 197019501930
2000 2020 204020302010
2000 2020 204020302010
1.0
0.8
0.6
0.4
0.2
0.0
(a) Observed temperature variability
in North Atlantic
(b) Projected temperature change
(RCP8.5) in North Atlantic
Observed temperature
Projected temperature
Values beyond historical observations
Trend curves / Schematic for changes
Temperature maxima reached in the 1940s
(c) Sketch of observed changes in
parameters (see table on the right)
(d) Sketch of projected changes in
parameters (see table on the right)
Parameter sketched
by curves (c) and (d)
How parameter changes
Biogeography Poleward expansion and shift
Phenology Timing variability
Community composition Species turnover
NPP (mg C m
–2
day
–1
) Net primary productivity
Zooplankton (t km
–2
) Biomass and latitudinal shift
Fish stocks (t km
–2
)Biomass and latitudinal shift
Figure 6-9 | Schematic depiction of observed effects of approximately 1°C ocean warming in the northern North Atlantic driven by climate variability (a,c) versus
effects expected from anthropogenic climate change (b,d). (a) Transient warming and cooling associated with Atlantic Multi-decadal Oscillation (AMO) variability
(Drinkwater, 2006), based on the Kola Section temperatures (0 to 200 m; Stations 3 to 7, 71.5° to 72.5°N, 33.5°E) in the Barents Sea obtained from
http://www.pinro.ru and filtered using a 20-year running mean. Similar trends occurred across most of the northern North Atlantic although the amplitude and timing
of the peaks and troughs varied spatially. (b) Warming driven by climate change for the same region (Representative Concentration Pathway 8.5 (RCP8.5) simulations
averaged from Coupled Model Intercomparison Project Phase 5 (CMIP5) models, computed as the mean over the upper 200 m in the grid box (2.5° × 2.5°) centered at
71.25°N and 33.75°E). (c) Warming and subsequent cooling in the northern North Atlantic during the period shown in (a) resulted in complex multi-faceted changes
(shown schematically) in net primary production (NPP), zooplankton biomass, and fish stock abundances. There was a general poleward shift and range expansion of
many commercial (e.g., Atlantic herring, Atlantic cod, haddock) and non-commercial species, reversed during the subsequent cooling period. Poleward shifts in
spawning areas (e.g., Atlantic cod) were also reversed as the waters cooled. Shifts in seasonal timing (phenology) and community composition were influenced by
earlier arrivals and later retreat of migratory fish (not shown). For more details see Drinkwater (2006). (d) Projected effects of climate mediated warming on northern
sub-polar and polar biota based on model projections of altered NPP (Bopp et al., 2013), and of the range shift of exploited fishes and invertebrates (Cheung et al.,
2009, 2013a). The projected trends in (d) will differ with latitude, for example, decreased NPP at lower latitudes and no significant change to NPP in temperate waters
(Bopp et al., 2013). Higher NPP supported and is projected to support higher trophic levels at high latitudes (c,d; Section 6.3.4). Note that climate variability will be
superimposed on anthropogenic warming (b; see Figures 6-1, 6-8a,b). Dashed lines indicate projected changes to continue beyond the range of historical observations.
Continued next page

435
Ocean Systems Chapter 6
6
Box 6-1 (continued)
In regions of high vulnerability to climate, mild warming can trigger rapid and substantial ecosystem shifts, offering a way to anticipate
future changes (Figure 6-9). In line with the increased understanding of physiology (Section 6.3.1.1), warming in the temperate to
polar North Atlantic was paralleled by a reduction in the average body lengths of about 100 copepod species, from 3 to 4 mm to 2 to
3 mm (Beaugrand et al., 2010). Warming also correlated with an increase in species richness among copepods and within the dinofla-
gellate genus Ceratium. In diatoms, which are major contributors to carbon export (Armbrust, 2009), warming and decreasing annual
variability in SST resulted in lower diversity, smaller size, and reduced abundance (Beaugrand et al., 2010). Morán et al. (2010) found
that temperature alone explained 73% of the variance in the contribution of small cells (picophytoplankton) to total phytoplankton
biomass in the eastern and western temperate North Atlantic from –0.6 to 22°C. More recently, Marañón et al. (2012) analyzed data
from polar, sub-polar, and tropical regions and suggested that nutrient availability may influence cell size more than temperature.
The ecosystem regime shift observed in North Sea plankton in the late 1980s involved an increase in phytoplankton stocks and
changes in species composition and abundance among holozooplankton (animals that are planktonic for their entire lifecycle) (Reid
et al., 2001; Kirby and Beaugrand, 2009; Kirby et al., 2009; Lindley et al., 2010). This shift was paralleled by the northward propagation
of a critical thermal boundary (CTB, i.e., the boundary of the sub-polar gyre) between the temperate and the polar biomes (Beaugrand
et al., 2008; see also Box CC-PP, Figure 1). Warming to above the CTB coincided with pronounced and large-scale variations in
phytoplankton productivity, an increase in calanoid copepod diversity (Beaugrand et al., 2008) and herring abundance (Schlüter et al.,
2008), a reduction in the mean size of calanoids, and a decrease in the abundance of southern Atlantic cod populations in the North
Atlantic Ocean (e.g., the North Sea; Pörtner et al., 2008; Beaugrand et al., 2010). These patterns also extend to the southern North
Sea, where elevated salinities and average warming by 1.6°C, both in summer and winter between 1962 and 2007, expanded the
time window for growth of microalgae and possibly supported the invasion and increase in numbers of warm-adapted silicified
diatoms (Wiltshire et al., 2010). Recent findings indicate a regime shift in the Bay of Biscay and the Celtic and the North Seas in the
mid to end 1990s (Luczak et al., 2011). Changing plankton composition and changing abundances of both sardine and anchovies
(Raab et al., 2013) paralleled stepwise warming.
Northward range extensions or redistributions in fishes were largest along the European Continental shelf and attributed to regional
warming, for example, by 1.0°C from 1977 to 2001 in the North Sea, with winter warming being closely correlated with the shift of
Atlantic cod (Perry et al., 2005; see also Section 6.3.1). Similar trends were observed due to warming by 1°C to 2°C in the waters
south and west of Iceland during the past 15 years (Valdimarsson et al., 2012). In the Northwest Atlantic Arctic and sub-Arctic, winter
and spring warming caused expansion of the area matching the thermal optimum of Atlantic salmon at 4°C to 8°C and caused
greater growth (Friedland and Todd, 2012). Pelagic sardines and anchovies entered the North Sea in the early to mid-1990s, after
about 40 years of absence, in response to intensified NAO and AMO (Alheit et al., 2012). Red mullet and bass extended into western
Norway; Mediterranean and northwest African species extended to the south coast of Portugal (Brander et al., 2003; Beare et al.,
2004; Genner et al., 2004; see also Section 30.5.1.1.4).
In the Northwest Atlantic cooling and freshening occurred during the late 1980s to early 1990s and seemed to have the opposite
effect, as capelin and their predator, Atlantic cod, shifted farther south (Rose and O'Driscoll, 2002). Between the early 1990s and mid-
2000s in the Northwest Atlantic sub-polar gyre, phytoplankton biomass increased, due to warming. At the same time, Arctic copepod
species became more abundant, due to increased influx of Arctic water (Head and Pepin, 2010). Although temperatures have risen on
the Newfoundland Shelf (Colbourne et al., 2011), capelin and cod remain scarce for reasons probably unrelated to climate (DFO,
2011a,b). Farther south, Arctic freshwater inflows caused freshening and increased stratification of the area around the Gulf of Maine
throughout the 1990s, resulting in enhanced phytoplankton abundance, a larger and later fall bloom, increased abundance of small
copepods, and a decrease in the large copepod Calanus finmarchicus (deYoung et al., 2004; Pershing et al., 2005, 2010). Various fish
species showed poleward shifts in distribution (Table 6-2) that were associated with reduced survival of larval cod (Mountain and
Kane, 2010) and fewer right whale calves (Greene et al., 2003), but increased herring abundance (Greene and Pershing, 2007).

436
Chapter 6 Ocean Systems
6
laboratory or field, exposing organisms to projected future CO
2
levels
(Sections 6.3.2.1-4). A surging number of studies is providing evidence
that rising CO
2
levels will increasingly affect marine biota and interfere
with ecological and biogeochemical processes in the oceans (high
confidence; FAQs 6.2, 6.3).
6.3.2.1. Principles
The absorption of rising atmospheric CO
2
by oceans and organisms
changes carbonate system variables in the water and in organism internal
fluids, that is, the relative proportions of CO
2
, carbonate, bicarbonate,
and hydrogen ions (pH). Internal pH must be tightly controlled, as some
processes, such as calcification, release protons thereby affecting pH and
as other biochemical processes are pH sensitive. Accumulation of CO
2
and the resulting acidification can also affect a wide range of organismal
functions, such as membrane transport, calcification, photosynthesis in
plants, neuronal processes in animals, growth, reproductive success, and
survival. Effects translate from organism to ecosystem.
The capacity of organisms to resist and compensate for the CO
2
-induced
acidification of internal fluids depends on acid-base regulation, that is,
the capacity of ion exchange to accumulate bicarbonate internally, an
aspect unexplored in many phyla (low to medium confidence; Figure
6-10a; e.g., animals: Heisler, 1986; Claiborne et al., 2002; Pörtner, 2008;
phytoplankton: Taylor et al., 2011; see also FAQ 6.3).
In unicellular microbes the regulation of intracellular pH may play a key
role in modulating CO
2
responses (Taylor et al., 2011). Findings in
invertebrates and fish indicate an additional role for extracellular pH
(Figure 6-10a); effective pH values may vary between species. Organisms
pre-adapted to elevated CO
2
may minimize the decrease in pH (acidosis).
They may also modify their sensitivity such that they respond less or
not at all to the acidosis. Recent evidence, however, emphasizes a role
for acid-base regulation in a natural low-pH setting. Between two
urchin species, only the one successful in maintaining its setpoints of
extracellular pH is able to settle close to volcanic CO
2
seeps (Calosi et al.,
2013). Compensating for the acidosis may cause increased energy demand
and respiration rates. In general, such capacity rises with metabolic
energy turnover, for example, it is higher in more active marine animals,
such as fishes, cephalopods, and pelagic copepods, and in mobile coastal
crabs compared to sessile species (Pörtner et al., 2005, 2011; Ishimatsu
et al., 2008; Melzner et al., 2009; Ishimatsu and Dissanayake, 2010; see
also Table 6-3). This matches the sensitivity distribution seen among
animals at the phylum level (medium confidence; Figure 6-9b).
Some species have lower metabolic rates in response to acidosis (Pörtner
et al., 1998; Michaelidis et al., 2005; Pörtner, 2008; Liu and He, 2012;
Navarro et al., 2013); others display increased energy turnover and food
ingestion rates, possibly indicating a capacity to resist acidification effects
(Parker et al., 2011; Saba et al., 2012). The effects of the acidosis on
various processes relevant to fitness may explain changes in whole-
organism energy demand, probably paralleled by modified ion exchange,
protein synthesis, and growth and feeding rates. The magnitude of effect
depends on the CO
2
concentrations reached (Figure 6-10b).
The internal formation of carbonate from bicarbonate is essential to
calcification, which is the formation of solid CaCO
3
in internal or external
Frequently Asked Questions
FAQ 6.3 | Why are some marine organisms affected by ocean acidification?
Many marine species, from microscopic plankton to shellfish and coral reef builders, are referred to as calcifiers,
species that use solid calcium carbonate (CaCO
3
) to construct their skeletons or shells. Seawater contains ample
calcium but, to use it and turn it into CaCO
3
, species have to bring it to specific sites in their bodies and raise the
alkalinity (lower the acidity) at these sites to values higher than in other parts of the body or in ambient seawater.
That takes energy. If high CO
2
levels from outside penetrate the organism and alter internal acidity levels, keeping
the alkalinity high takes even more energy. The more energy is needed for calcification, the less is available for
other biological processes such as growth or reproduction, reducing the organisms’ weight and overall competitiveness
and viability.
Exposure of external shells to more acidic water can affect their stability by weakening or actually dissolving
carbonate structures. Some of these shells are shielded from direct contact with seawater by a special coating that
the animal makes (as is the case in mussels). The increased energy needed for making the shells to begin with impairs
the ability of organisms to protect and repair their dissolving shells. Presently, more acidic waters brought up from
the deeper ocean to the surface by wind and currents off the Northwest coast of the USA are having this effect on
oysters grown in aquaculture.
Ocean acidification affects not only species producing calcified exoskeletons. It affects many more organisms either
directly or indirectly and has the potential to disturb food webs and fisheries. Most organisms that have been
investigated display greater sensitivity at extreme temperatures so, as ocean temperatures change, those species
that are forced to exist at the edges of their thermal ranges will experience stronger effects of acidification.

437
Ocean Systems Chapter 6
6
c
alcified structures, used for defense and structural support. Calcification
usually occurs in separate body or cell compartments, where pH and thus
CO
3
2
–
concentration and saturation Ω (Section 6.1.1) are maintained at
values higher than in other body fluids or ambient water (Taylor et al.,
2011; Trotter et al., 2011; McCullough et al., 2012; Venn et al., 2013).
CO
2
impedes the formation of carbonate such that calcification rate
decreases. It may be maintained by enhanced transport of ions, incurring
elevated energetic costs (Figure 6-10).
External carbonate structures like shells rely on ambient seawater being
supersaturated with carbonates. Decreasing oceanic carbonate levels
reduce the saturation levels (Ω) of calcite or aragonite in the water.
Reduction to below unity may lead to the corrosion of carbonate shells
(FAQ 6.3). However, many species protect their shells from direct contact
with seawater by various types of organic coating (e.g., a periostracum
in mollusks and brachiopods, an epicuticle covering the carapace of
crustaceans, an epidermis covering the tests of urchins, epithelial tissue
covering aragonite in corals, and coralline algae precipitating CaCO
3
(mostly Mg-calcite) within their cell wall). A meta-analysis of the effects
o
f ocean acidification on biological processes indicates that reductions
in the rate of net calcification (calcification minus dissolution) and survival
are the most uniform responses across organisms studied, relative to
other, more variable impacts such as reduced growth, development, and
abundance (Kroeker et al., 2013; see also Box CC-OA).
Some organisms benefit from elevated CO
2
partial pressures (pCO
2
).
Photosynthesis and/or nitrogen fixation in selected microorganisms are
impacted by OA, but effects are species or taxon specific, possibly
depending on how they acquire carbon, that is, the presence and in
particular the type, capacity, and energetic costs of carbon-concentrating
mechanisms (CCMs; Giordano et al., 2005; Kranz et al., 2011).
A comprehensive picture of responses to CO
2
requires consideration of
variable sensitivities between species and life stages and taxon-specific
sensitivity distributions, as shown by a meta-analysis of animal data
(Wittmann and Pörtner, 2013; see also Figure 6-10b). Echinoderms,
bivalves, gastropods, and corals begin to respond negatively at lower CO
2
levels than crustaceans or cephalopods (Figure 6-10b). This sensitivity
Taxon
No. of
studies
No. of
parameters
studied
Total no.
of species
studied
pCO
2
where the most
vulnerable species is negatively
affected or investigated pCO
2
range
a
(µatm)
Assessment of
tolerance to
RCP 6.0 (confi dence)
Assessment of
tolerance to
RCP 8.5 (confi dence)
Cyanobacteria 17 5 9+ 180–1250
a
Benefi cial (low)Benefi cial (low)
Coccolithophores 35 67+ 740Tolerant (low) Vulnerable (medium)
Diatoms 22 528+ 150–1500
a
Tolerant (low) Tolerant (low)
Dinofl agellates 12 411+ 150–1500
a
Benefi cial (low) Tolerant (low)
Foraminifers 11 4 22 588 Vulnerable (low) Vulnerable (medium)
Seagrasses 6 6 5 300–21000
a
Benefi cial (medium)Benefi cial (low)
Macroalgae (non-calcifying) 21 521+
280–20812
a
Benefi cial (medium)Benefi cial (low)
Macroalgae (calcifying) 38 10 36+ 365Vulnerable (medium) Vulnerable (high)
Warm-water corals 45 13 31 467 Vulnerable (medium) Vulnerable (high)
Cold-water corals 10 13 6445Vulnerable (low) Vulnerable (medium)
Annelids 10 617+ 1200Tolerant (medium) Tolerant (medium)
Echinoderms 54 14 35 510 Vulnerable (medium) Vulnerable (high)
Mollusks (benthic) 72 20 38+ 508Vulnerable (medium) Vulnerable (high)
Mollusks (pelagic) 7 8 8 550 Vulnerable (low) Vulnerable (medium)
Mollusks (cephalopods) 10 8 5 2200 (850 for trace elements) Tolerant (medium) Tolerant (medium)
Bryozoans 738+ 549Tolerant (low) Vulnerable (low)
Crustaceans 47 27 44+ 700Tolerant (medium) Tolerant (low)
Fish
b
51 16 40 700 Vulnerable (low) Vulnerable (low)
Table 6-3 | Tolerances to ocean acidifi cation in marine taxa, assessed from laboratory and fi eld studies of species in the CO
2
partial pressure (pCO
2
) range from <650 to >10000
µatm, compared to present day atmospheric levels of 400 µatm. (It should be noted that anthropogenic CO
2
emissions add to the natural variability of CO
2
concentrations
in marine environments, which can reach much higher than atmospheric levels.) Variables studied include growth, survival, calcifi cation, metabolic rate, immune response,
development, abundance, behavior, and others. Neither all life stages, nor all variables, including the entire range of CO
2
concentrations, were studied in all species. Confi dence
is based on the number of studies, the number of species studied, and the agreement of results within one group. + denotes that possibly more species or strains (genetically
distinct populations of the same species) were studied, as only genus or family were specifi ed; benefi cial: most species were positively affected; vulnerable: more than 5% of
species in a group will be negatively affected by 2100; tolerant: more than 95% of species will not be affected by 2100. RCP 6.0: Representative Concentration Pathway (RCP)
with projected atmospheric pCO
2
= 670 µatm; RCP 8.5: pCO
2
= 936 µatm in 2100 (Meinshausen et al., 2011). Confi dence is limited by the short- to medium-term nature of
various studies and the lack of sensitivity estimates on evolutionary time scales, that is, across generations (see separate reference list, Online Supplementary Material). Note that
the assessment of variability between species from the same animal phylum has revealed an increase in the fraction of sensitive species with rising CO
2
levels; see Figure 6-10.
a
Rather than a sensitivity threshold the entire range of investigated pCO
2
values is given for groups of photosynthetic organisms. In all studies photosynthetic rates are stimulated
to different, species-specifi c degrees by elevated pCO
2
, indicating low vulnerability. Coccolithophores and calcifying algae are assessed as being more sensitive than other
photosynthetic organisms due to reduced calcifi cation and shell dissolution.
b
Confi dence levels for fi shes were converted from medium to low, in light of uncertainty on the long-term persistence of behavioral disturbances.
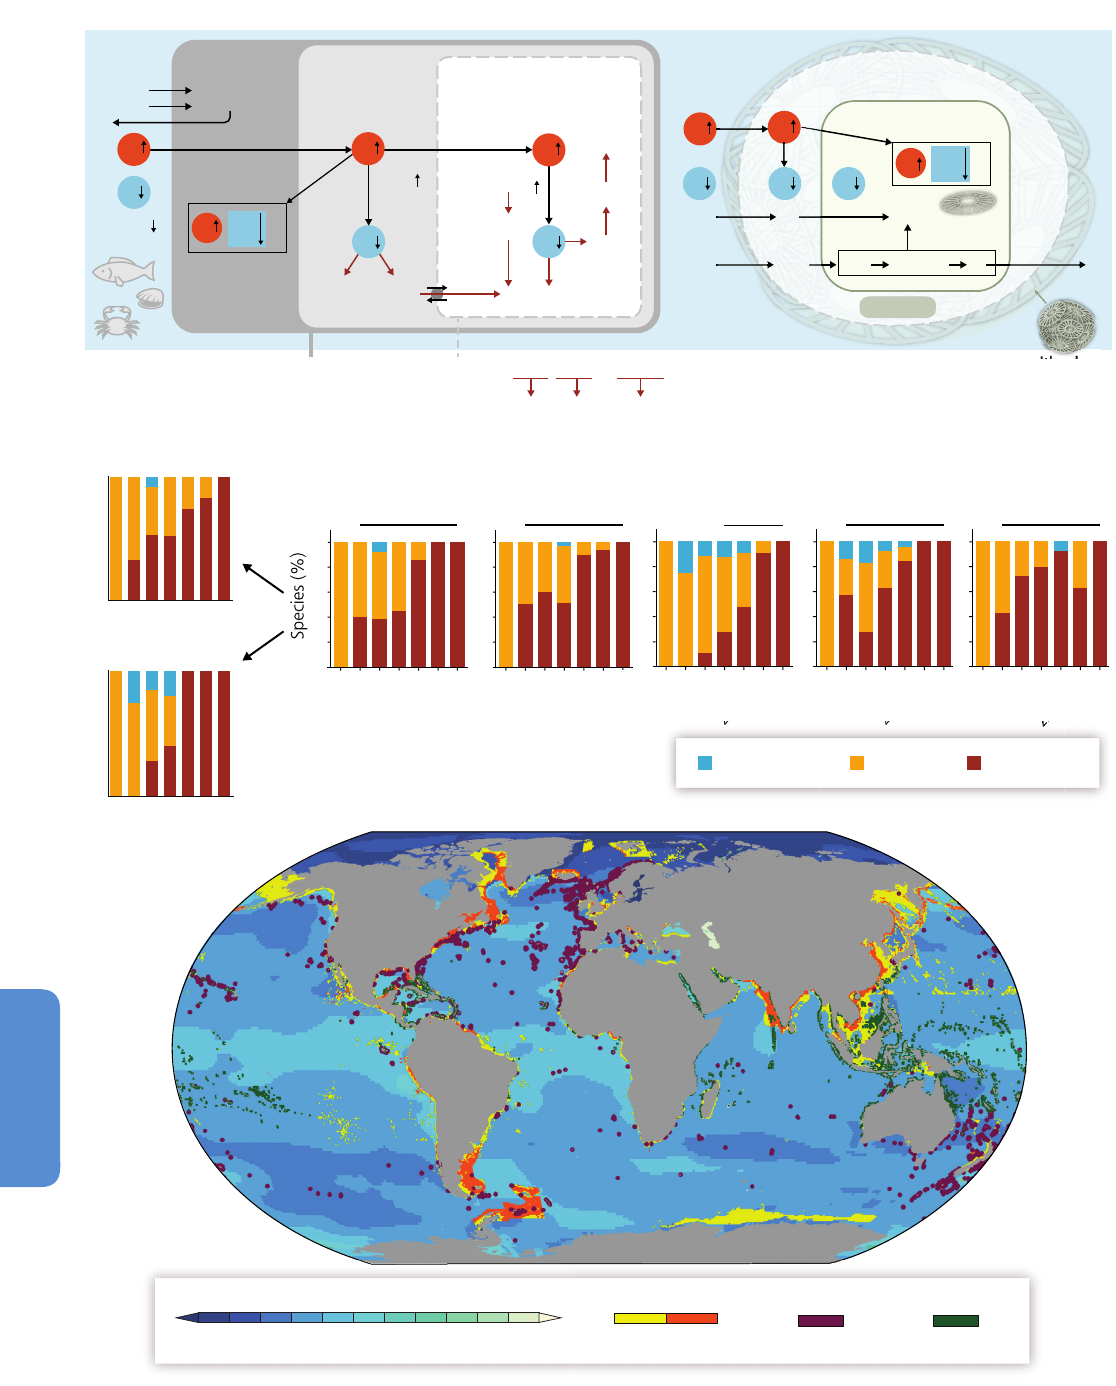
438
Chapter 6 Ocean Systems
6
+
2
+
3
+
H
H
H
H
C
3
C
O
−
−
H
2
+
C
H
3
H
CO
a
Ca
Ca
H
CO
O
H
CO
+
H
C
2
+
3
Ocean
space
f
orming tissue
]
2
CO
pH
−
2
3
[CO
−
S
hell/skeleton-
(gills,gut etc.)
Epithelia
Skin, gills
Respiration rate
Control
Neural
and capacity
Contraction rate
e
space
p
H
Intracellular
processes
Extracellular
transport
oxygen
Blood
rates
e
xchange
Ion-
e
Mitochondrial
Growth
synthesis
P
rotein
e
xpressions
G
ene
Metabolic rate
i
i
p
H
]
−
3
[HCO
Ω
]
−
2
3
CO[
pH
2
CO
regulation
pH and ion
Calcification rate
2+
C
a
or muscle heart, brain,.g., eAnimal cell from,
Animal
a
3
H
CO
2
+
Ca
−
2
CO
3
HCO
2
+
]
−
3
[HCO
Ca
+
H
2
CO
2
CO
2
CO
pH
i
pH
(
b)
(
a)
1518202315926
salrWarm-water co
spac
ce
I
spa
c
e
ace
ntr
e
nt
cell
l
ac
space
ntrac
ular
el
ntracell
C
lith
e
ula
ular
ac
c
e
ac
e
n
I
I
spa
nt
r
Coccolith vesicle
3
CaCO
2+
Ω
]
−
2
3
CO[
pH
2
C
a
formation
C
O
i
pH
C
occolith
+
H
+
oplastChlor
−
3
H
CO
+
+ H
−
2
3
CO
+
H
Phytoplankter
Coccolithophore
(c)
3335747
1
00
8
0
60
40
20
0
0000
29
10000
00
10
>
–
1370
137
13
0
–
2900
2901–
10
1–
850
851
85
370
71–
2
90
–
650
651
500–
6
0
50
1–
1
3
8
0
1–
8
Co
nt
ntro
l
500
1212141813522
Corals
29
–1370
137
13
–2
290
1–850
851
85
370
71–2
90
–650
651
50
0–6
0
50
1–1
3
8
0
1–
8
Co
nt
ntro
l
50
0
31151640
Mollus
salrCold-water co
(
2
COp
0000
10000
00
10
>
0
2900
01–10
293129
ks
252323189437
Crustaceans
0000
00
10
>
–1370
137
13 0
–2900
2901–10
1–850
851
85
370
71–2
90
–650
651
500–6
0
50
1–1
3
8
0
1–
8
Cont
ntrol
500
5
Cont
ntr
5
29 10000
0000
00
10
>
–1370
137
13 0
–2900
2901–10
1–850
851
85
370
71–2
90
–650
651
500–6
0
50
1–1
3
8
0
1–
8
trol
500
2222262718729
Echinoderms
–1370
137
13 0
–2900
2901–1
1–85
0
851
85
370
71–2
90
–650
651
500–6
5
0
1
–1
3
8
0
1–
8
Cont
ntrol
500
141511725
Fish
29 10000
29
0000
00
10
>
0
00
10
19224
10000
Positive effect
atm)
+
(
Negative effectNo effect
ct
)
2
Change in pH (at 936 µatm atmospheric CO
–0.60
–0.55
–0
.50
–0
.45
–0
.40
–0.35
–0.30
–0.25
–0.20
–0.15
–0.10
–
0.05
ater coralsarm-wWater coralsCold-w
<0.02 >0.02
)
2
–
Catch rate (tonnes km

439
Ocean Systems Chapter 6
6
pattern resembles the one seen in the Permian mass extinction (Knoll
et al., 2007; Knoll and Fischer, 2011). The picture for fishes is less clear,
as the present findings of high vulnerability are not met by similar
observations in the fossil record. Evolutionary adaptation may thus
eliminate or minimize reported effects.
The capacity for pH and ion regulation and other relevant processes can
be upregulated by gene expression, as seen in acclimation studies in
echinoderm larvae (O’Donnell et al., 2010; Martin et al., 2011) and fishes
(Deigweiher et al., 2008; Tseng et al., 2013), in warm-water coral branches
(Kaniewska et al., 2012), but not in a study of warm-water coral larvae
(Moya et al., 2012). Few studies address whether and to what extent
species undergo evolutionary adaptation to high pCO
2
, as seen in the
coccolithophore Emiliania huxleyi over 500 asexual generations
(Lohbeck et al., 2012). In organisms with longer generation times,
perturbation studies in the laboratory measure tolerance and acclimation,
but not adaptation or natural selection. Animal adaptation is accelerated
by high functional variability among larvae, enabling selection of resistant
genotypes (low to medium confidence; Sunday et al., 2011; Parker et
al., 2012; Pespeni et al., 2013). This may explain the selective mortality
seen in Atlantic cod larvae under elevated CO
2
(Frommel et al., 2012).
Both acclimatization and adaptation will shift sensitivity thresholds but
the capacity and limits of species to acclimatize or adapt remain largely
unknown and hence impacts of acute exposures cannot easily be scaled
up to effects on the longer, evolutionary time scales of ocean acidification
(Wittmann and Pörtner, 2013). Observations in ecosystems characterized
by permanently elevated or fluctuating CO
2
levels, such as upwelling
areas, OMZs (Section 6.1.1), or seeps, reflect the existence of sensitivity
thresholds (high confidence; Section 6.3.2.5) but organisms may have
evolved a higher resistance to increased CO
2
levels than elsewhere (low
confidence).
Table 6-3 compiles effects of ocean acidification observed across taxa in
laboratory and field experiments. The latter include studies in mesocosms
and at natural analogs, submarine CO
2
venting areas at locales such as
Ischia, Italy (Hall-Spencer et al., 2008), Papua New Guinea (Fabricius et
al., 2011), and Puerto Morelos, Mexico (Crook et al., 2012). It should be
noted that anthropogenic CO
2
accumulation according to RCPs adds to
the natural variability of CO
2
concentrations in marine environments.
Many groups, especially sessile or non-photosynthetic calcifiers, have
sensitive species with vulnerability thresholds surpassed under RCP6.0
by 2100 (low to medium confidence).
Recent meta-analyses also summarize OA effects, two for biogeochemical
processes and relative effect sizes (Harvey et al., 2013; Kroeker et al.,
2013), one for the distribution of sensitivity between species within
major animal phyla and its change depending on ambient pCO
2
(Figure
6-10; Wittmann and Pörtner, 2013). All of these analyses consider the
interaction of warming and CO
2
accumulation (Section 6.3.5). Present
limitations in understanding the mechanisms of effect and their long-
term persistence compounds accurate projections of the long-term
effects of OA (medium confidence; Wittmann and Pörtner, 2013).
6.3.2.2. Microbes
The physiology of both calcifying (coccolithophores) and non-califying
phytoplankton can be influenced by changes in carbonate system
variables caused by ocean acidification (Figure 6-10a). Growth and
photosynthetic rates of diatoms in laboratory cultures are considered
relatively insensitive to elevated CO
2
(Rost et al., 2003; Trimborn et al.,
2008). Dinoflagellate sensitivity to elevated CO
2
is poorly studied (Hansen
et al., 2007), but in one species carbon fixation rates were enhanced at
750 µatm CO
2
while growth remained unaffected (Fu et al., 2008).
Indirect effects of ocean acidification on phytoplankton physiology include
altered availability of trace metals needed for many biochemical cycles
(Hoffmann et al., 2012).
Harmful algal blooms are a growing problem in coastal waters worldwide
(Section 6.4.2.3), and many of the various phytoplankton species that
produce bio-accumulated toxins are sensitive to changes in the seawater
carbonate buffer system (Hallegraeff, 2010; Fu et al., 2012). For example,
the dominance and community structure of harmful bloom dinoflagellates
can be profoundly altered by changing pCO
2
(Tatters et al., 2013), and
both toxic dinoflagellates and diatoms have been shown to produce
higher toxin levels under near-future levels of ocean acidification (Fu et
al., 2010; Sun et al., 2011).
Some planktonic N
2
-fixing cyanobacteria (diazotrophs), for example,
strains (genetically distinct populations of the same species) of offshore
cyanobacteria of the genera Trichodesmium and Crocosphaera, respond
to rising CO
2
with increased rates of both carbon and N
2
fixation (Fu et
al., 2008; Lomas et al., 2012). In contrast, laboratory studies using the
bloom-forming cyanobacteria Nodularia (an organism largely found in
coastal stratified, eutrophic waters) revealed decreased growth and N
2
Figure 6-10 | (a) Responses of a schematized marine animal (left) and a phytoplankter (right) to ocean acidification. Effects are mediated via diffusive CO
2
entry (black arrows)
into body and cell compartments, resulting in a rise in pCO
2
(highlighted in red), a drop in compartmental pH (highlighted in blue), and their effects (red arrows) on various
processes (red text) in tissues and cellular compartments, as well as on calcium carbonate saturation state (Ω) at calcification sites (after Pörtner, 2008; Taylor et al., 2011).
Variable sensitivity relates to the degree of pH decline and compensation, depending on the capacity of pH and ion regulation. (b) Distribution of sensitivities across species within
animal phyla, under progressively rising water CO
2
levels, as percent of studied cold- and warm-water coral (mostly scleractinia), echinoderm, molluskan, crustacean, and fish
species affected negatively, positively, or not at all (for effects considered, see text). As not all life stages, variables, and pCO
2
ranges were covered in all species, two assumptions
partially compensate for missing data: 1) Negative effects at low pCO
2
will remain negative at high pCO
2
. 2) A positive or neutral outcome at both low and high pCO
2
will be the
same at intermediate pCO
2
. As responses reported for each species vary for each pCO
2
range, variable species numbers result (on top of columns). The total number of species
studied in a group is shown as the number above the control column. The control category corresponds to 380 µatm. For 2100, RCP scenarios falling within each CO
2
partial
pressure (pCO
2
) category are as follows: RCP4.5 for 500–650 μatm (approximately equivalent to ppm in the atmosphere), RCP6.0 for 651–850 μatm, and RCP8.5 for 851–1370
μatm. By 2150, RCP8.5 falls within the 1371–2900 μatm category. Horizontal lines above columns represent frequency distributions significantly different from controls
(Wittmann and Pörtner, 2013). Data for warm- and cold-water corals as in Table 6-3. (c) Areas with reported annual catches of marine calcifiers (crustaceans and mollusks) ≥
0.005 tonnes km
–2
depicted on a global map (weighted mean of the orange color area =0.07 tonnes km
–2
) showing the distribution of ocean acidification in 2100 according to
RCP8.5 (WGI AR5 SPM; pH change from 1986–2005 to 2081–2100) as well as the distribution of warm-water (green dots) and cold-water coral communities (purple dots).

440
Chapter 6 Ocean Systems
6
f
ixation under elevated CO
2
c
onditions (Czerny et al., 2009). The wide
range of responses in N
2
fixation (e.g., Hutchins et al., 2007; Levitan et
al., 2007; Kranz et al., 2010) may be explained by different CO
2
affinities
(i.e., dependences of growth rates on CO
2
concentration) of a range of
N
2
-fixing cyanobacteria (Trichodesmium and Crocosphaera) from different
oceanic biomes. Some species/strains operate at close to maximum
growth rates at present-day oceanic CO
2
levels, whereas others had
sub-optimal growth rates under these conditions (Hutchins et al., 2013).
To date, the physiological mechanisms underlying these responses remain
unknown, especially in open-ocean nitrogen fixers. Cyanobacteria may
reallocate energy from their energetically expensive CCMs toward N
2
fixation and the acquisition of growth limiting nutrients (Kranz et al.,
2010; Levitan et al., 2010), but evidence for such diversion of energy is
lacking. Whether nitrogen fixation will increase with progressive ocean
acidification remains to be explored (low confidence, limited in situ
evidence, medium agreement).
The responses of coccolithophore calcification to OA are species specific
and highly variable. The function(s) of calcification are not well understood,
making it difficult to evaluate the consequences of lowered calcification
(e.g., Rost et al., 2008). Reductions, increases, and unchanged calcification
rates (and shell structure) have all been found in different coccolithophore
species for RCP8.5 CO
2
conditions projected around 2100 (Riebesell et
al., 2000; Zondervan et al., 2001; Langer et al., 2006; Iglesias-Rodriguez
et al., 2008). Calcification in coccolithophores is species (Langer et al.,
2006) and in Emiliania huxleyi even strain specific (Langer et al., 2009,
2011; Hoppe et al., 2011). It thus remains unclear whether OA will result
in exoskeletons that are insufficiently calcified for sustained structural
support and protection in coccolithophores (medium evidence, low
agreement).
Foraminifera display decreasing calcification and shell weight under
elevated CO
2
(Lombard et al., 2010). Changes in historical specimens
(Moy et al., 2009; see Section 6.3.2.5.1) and during glacial-interglacial
cycles (Barker and Elderfield, 2002) support projections of future reductions
in net calcification by foraminifera (medium to high confidence).
6.3.2.3. Macroalgae and Seagrasses
Primary production, shoot density, reproductive output, and below-
ground biomass of seagrasses generally respond positively to elevated
pCO
2
, indicating CO
2
limitation of their productivity. Such effects were
identified in both laboratory and field above 720 to 1800 µatm (high
confidence; e.g., Palacios and Zimmerman, 2007; Hall-Spencer et al., 2008;
Andersson et al., 2011; cf. Section 5.4.2.3). Production, growth, and
recruitment of most but not all non-calcifying seaweeds also increased
at CO
2
levels from 700 to 900 µatm (RCP8.5; Porzio et al., 2011; Kroeker
et al., 2013). Some non-calcifying seaweeds and seagrasses will thus
benefit from future ocean acidification (high confidence) but OA exposes
them to higher than usual grazing as a consequence of losing deterrent
phenolic substances (low confidence; Arnold et al., 2012).
Calcifying algae (corallines) show complex and species-specific responses
of photosynthesis to elevated CO
2
, but calcification is impacted once
species-specific pCO
2
thresholds are surpassed (medium confidence;
Anthony et al., 2008; Martin and Gattuso, 2009). At habitat temperature
c
alcification by temperate coralline red and calcareous green algae
increased at CO
2
levels up to 900 µatm and decreased only at the highest
concentration applied (2850 µatm), but did not fall below rates found
at present-day pCO
2
(Ries et al., 2009). During 3 months of exposure,
growth of Lithothamnion glaciale, a cold-water calcareous red alga,
decreased progressively with rising CO
2
levels, and its structural integrity
was weakened beyond 590 µatm (Ragazzola et al., 2012), potentially
influencing ecosystem function. Some calcifying algae may thus be
impacted by future ocean acidification (medium confidence).
6.3.2.4. Animals
Studies of marine animals and their life stages show a high diversity
and variability of processes affected by ocean acidification. Many
variables studied reflect physiological performance (O
2
consumption,
exercise, behavior, calcification, growth, immune response, acid-base
balance, gene expression, fertilization, sperm motility, developmental
time, production of viable offspring, and morphology; Table 6-3; Figure
6-10). In some species growth may be stimulated by OA, in others
depressed or unaffected (cf. Gooding et al., 2009; Munday et al., 2009a,
2011a; Dupont et al., 2010). The degree of CO
2
-induced acidosis and its
compensation by ion exchange may shape sensitivity (Section 6.3.2.1).
Full exploitation of the ability to resist pCO
2
increases depends on the
availability and high quality of food and the strengthening of fitness
(Gooding et al., 2009; Melzner et al., 2011). However, food quality of
prey organisms may decrease under elevated pCO
2
. For example, slower
reproduction and growth of the copepod Acartia tonsa under 760 µatm
pCO
2
was related to the decreasing quality of its diatom food (Rossoll
et al., 2012).
Changes in calcification rates reported from CO
2
manipulation
experiments vary widely. Reduced calcification and weakened calcified
structures were seen under elevated pCO
2
in corals (see Section 6.3.2.4.2),
echinoderms (Kurihara and Shirayama, 2004), mollusks (Gazeau et al.,
2013), and larval crustaceans (Arnold et al., 2009; Walther et al., 2011).
Some adult limpets and urchins increased calcification rates at pCO
2
from 600 to 900 µatm, before it fell at even higher pCO
2
. In some adult
crabs, lobsters, and shrimps calcification rates increased further with
rising pCO
2
(Ries et al., 2009). Stronger internal structures such as
cuttlebones and otoliths resulted from enhanced calcification under
elevated pCO
2
in juvenile cuttlefish (cephalopods: Gutowska et al.,
2008) and fishes (Checkley, Jr. et al., 2009; Munday et al., 2011b), with
unclear impacts on fitness. Energy costs in epithelia or calcification
compartments may be enhanced by elevated pCO
2
causing a stimulation
of metabolism (Section 6.3.2.1). In some cases, this may indicate
imbalances in energy budget rather than increased CO
2
resistance, for
example, if costs are down-regulated in muscle or liver. Enhanced
calcification can then occur at the expense of growth (medium confidence;
Wood et al., 2008; Beniash et al., 2010; Thomsen and Melzner, 2010;
Parker et al., 2011).
Studies on calcifying zooplankton focused on pteropods (planktonic
mollusks with aragonite shells). These form an integral part of the food
web, both as grazers and prey, for example, for pink salmon (Armstrong
et al., 2005; Hunt et al., 2008). In the Sub-Arctic, the Arctic, and the
Southern Ocean, pteropods will reduce calcification in response to OA

441
Ocean Systems Chapter 6
6
u
ntil at least the end of the century (medium confidence; Orr et al., 2005;
Comeau et al., 2009; Lischka et al., 2011).
Elevated CO
2
causes behavioral disturbances in fishes (studied mostly
in larvae and juveniles; Munday et al., 2010; Ferrari et al., 2011;
Domenici et al., 2012; Jutfeld et al., 2013) through neural mechanisms
(Nilsson et al., 2012). The long-term persistence and evolutionary
relevance of these behavioral effects need further study before general
conclusions can be drawn (low confidence; Wittmann and Pörtner, 2013;
see also Table 6-3).
6.3.2.4.1. Animal life cycles
It is generally held that organisms at early life stages are always more
sensitive to environmental stress than adults. In the context of ocean
acidification this statement is supported by findings like larval oyster
fatalities in aquaculture caused by upwelled CO
2
-rich waters (high
confidence; Barton et al., 2012). A key aspect may also be that larvae
growing or developing more slowly under elevated CO
2
as in various
groups including fishes (Baumann et al., 2012; see also Section 6.3.2.1)
may encounter enhanced mortalities due to prolonged predator
exposure. Comparative studies of animal sensitivities to OA over a
complete life cycle or during critical transition phases (e.g., fertilization,
egg development and hatching, metamorphosis, molting) are scarce
and do not support generalized conclusions (low confidence).
Effects of elevated CO
2
on one life stage or transition phase may affect
or carry over to the next one. Molting success into the final larval stage
was reduced in a crab species (Walther et al., 2010). In a sea urchin
species, negative impact was found to accumulate during 4 months
acclimation of adults reducing reproductive success. This impact was,
however, compensated for during extended acclimation of female
urchins for 16 months (Dupont et al., 2013). Negative impact was still
transferred from urchin larvae to juveniles under elevated pCO
2
.
Conversely, adult oysters acclimated to high CO
2
acquired resistance
which was carried over to their offspring (Parker et al., 2012). More
long-term acclimation studies to realistic emission scenarios are
needed for generalized conclusions. Furthermore, the preposition that
juvenile life stages are always more sensitive than adults needs
thorough re-investigation in the context of ocean acidification,
especially in the context of the notion that larvae may provide a selection
pool for survival of the most suitable phenotypes (low confidence;
Section 6.3.2.1).
6.3.2.4.2. Warm- and cold-water coral communities
In warm-water reef-building corals, OA causes genus-specific reductions
in calcification (Leclercq et al., 2002; Langdon and Atkinson, 2005; Kleypas
and Langdon, 2006). Nutrient availability to symbionts may sustain
calcification. Heterotrophic feeding by the corals also supports energy-
dependent calcification and acid-base regulation, and thus resilience
(Edmunds, 2011; Figure 6-10). Females may sacrifice calcification more
than males due to energetic trade-offs with reproduction (Holcomb
et al., 2012). Warm-water corals are thus sensitive to future OA (high
confidence; Table 6-3).
T
he cold-water coral Lophelia pertusa shows resilience to ocean
acidification. In short-term ship-board incubations pH reductions between
0.15 and 0.3 units (540 and 790 µatm) led to calcification rates reduced
by 30 to 56% (Maier et al., 2009), especially in young, fast growing
polyps. However, net calcification was maintained at seawater aragonite
saturation <1. Exposure to a pCO
2
-induced pH reduction by 0.1 units
or even to the projected end of century pCO
2
of 930 µatm led to
calcification rates being maintained over 6 to 9 months (Form and
Riebesell, 2012; Maier et al., 2013). This ability is probably due to a
regulated upward shift of pH and carbonate saturation at organismal
calcification sites (McCulloch et al., 2012; see also Figure 6-10). Natural
distribution of other cold-water species covers wide natural pH gradients
in Chilean fjords (Desmophyllum dianthus; Jantzen et al., 2013) and
ranges into waters with undersaturated carbonates as in Australian
waters (four scleractinian corals; Thresher et al., 2011). Pre-adaption to
elevated pCO
2
apparently exists; however, species vulnerabilities to further
increases in pCO
2
have not been investigated. Again, vulnerability is
species specific, colonial scleractinians may be limited to water saturated
or near-saturated with aragonite, whereas others are not (Thresher et
al., 2011). Conclusions on the relative vulnerability of the group appear
premature (Table 6-3). To what extent a further lowering of carbonate
saturation values will influence the future distribution of various calcite
or aragonite forming cold-water corals is not clear (low confidence;
Guinotte et al., 2006).
6.3.2.5. Ecosystems
For insight into ecosystem level processes, laboratory studies have been
supplemented with experimental studies in large volume mesocosms
(i.e., >1000 L) and in the field, and with long-term field observations.
Together they inform the debate over the attribution of field observations
to ocean acidification.
6.3.2.5.1. Evidence from field observations
Contributions of anthropogenic ocean acidification to climate-induced
alterations in the field have rarely been established and are limited to
observations in individual species (see also Section 30.5.1.1.3). Shell
thinning in modern planktonic foraminifera (collected 1997–2004) in
the Southern Ocean compared to those from the Holocene and before
was attributed to anthropogenic ocean acidification (Moy et al., 2009).
Both anthropogenic OA and the upwelling of CO
2
-rich deep waters
(Section 30.5.4.1.4) were held responsible for shell thinning in
planktonic foraminifera in the Arabian Sea over the last century (de
Moel et al., 2009) or in live pteropods collected in 2008 in the Southern
Ocean (medium evidence, medium agreement; Bednaršek et al., 2012).
However, no changes were observed in a 57-year record of the
composition and abundance of calcifying zooplankton in the increasingly
acidified California Current System (Ohman et al., 2009). Possible
explanations for the absence of significant responses in some studies
include insufficient lengths of time series (Section 6.1.2), organisms
being pre-adapted to naturally high CO
2
in upwelling or other systems,
linked to a low signal-to-noise ratio, or the difficulty of detecting small
OA effects in comparison with larger ecosystem effects of other drivers
such as temperature, for example, in calcifying plankton (Beaugrand et

442
Chapter 6 Ocean Systems
6
a
l., 2013). Similarly, declines in coral calcification and performance in
the field (De’ath et al., 2009) were attributed to thermal extremes, but
may also include an as-yet unclear contribution from OA.
6.3.2.5.2. Microbial communities and nutrient cycles
Laboratory experiments, coastal mesocosm studies (Weinbauer et al.,
2011), and field experiments (Beman et al., 2011; Law et al., 2012) have
yielded various, sometimes conflicting, results on the effects of CO
2
on
microbial processes. From a meta-analysis of available data, Liu et al.
(2010) conclude that the rates of several microbial processes will be
affected by OA, some positively, others negatively. The potential of the
microbial community to adapt to ocean acidification and maintain
functionality, either by genetic change at the species level or through
the replacement of sensitive species or groups at the community level,
remains to be explored further. At the present time there is insufficient
field-based evidence to conclude that elevated CO
2
will affect natural
assemblages of microorganisms (limited evidence, low agreement) with
the possible exception of the negative impact on calcification (Joint et
al., 2011).
Experimental studies on OA effects (through reduced pH or increased
CO
2
) on autotrophic and heterotrophic microbial production have
provided inconsistent results. Microbes are characterized by large
diversity and broad environmental adaptation, and hence may respond
to environmental challenges by exploiting such diversity via species
replacements (Krause et al., 2012). This makes it difficult to project the
findings of laboratory experiments investigating the response of
microbes to OA to the ecosystem level. Relevant variables include
cellular elemental stoichiometry (C:N:P ratios; Riebesell, 2004; Fu et al.,
2007), rates of CO
2
and N
2
fixation (Riebesell, 2004; Hutchins et al.,
2007, 2009), rates of nitrification (Beman et al., 2011), changes in
the proportion of dissolved organic carbon (i.e., DOC) to particulate
photosynthate produced during carbon fixation (Kim et al., 2011), and
the response of viruses (Danovaro et al., 2011).
Field experiments led to the projection that nitrification rates (ammonia
oxidation to nitrite and nitrite oxidation to nitrate) of bacteria and archaea
will be reduced by 3 to 44% when pH is reduced by 0.05 to 0.14 (Beman
et al., 2011), corresponding to a mean rise in CO
2
by approximately 100
µatm. The reported decrease in nitrification occurred regardless of natural
pH variability, providing no evidence for acclimation of the nitrifiers to
reduced pH, for example, in upwelling areas. Potential changes in microbial
cell abundance, possibly as a result of lower cellular nitrification rates,
could further decrease the total rate of nitrification.
It remains unclear whether OA has contributed to the systematic
changes in phytoplankton abundance and community structure observed
over recent decades, which have largely been attributed to warming
(Chavez et al., 2011). In natural assemblages from coastal and polar
waters, NPP is stimulated by increased CO
2
(medium confidence;
Riebesell et al., 2008; Tortell et al., 2008). Small differences in CO
2
sensitivity may lead to pronounced shifts in the dominance of species
(Tortell et al., 2008; Beaufort et al., 2011). Quantification of the calcite
mass of the coccolithophore community in the present ocean and over
the last 40 kyr were in large part attributed to shifts between differently
c
alcified species and morphotypes according to carbonate chemistry
(Beaufort et al., 2011). The same study, however, also observed
heavily calcified Emiliania huxleyi morphotypes in upwelling systems
characterized by low pH, a finding which highlights the complexity of
assemblage-level responses and may indicate pre-adaptation to
elevated pCO
2
. Owing to the complex response patterns, it is not
possible to project ecosystem-level effects from effects on coccolithophore
calcification in monospecific culture experiments (low confidence).
Projections of OA impacts on phytoplankton become even more
complicated by synergistic interactions with other drivers (Boyd, 2011;
see also Section 6.3.5).
6.3.2.5.3. Macrophytes and macrofauna
Macrofauna and macrophyte communities have been studied in
mesocosms and in ecosystems exposed to shifted upwelling regimes or
at natural volcanic CO
2
vents (Fabricius et al., 2011; Kroeker et al., 2011).
The latter are considered as natural analogs of future ocean acidification.
An 8-year trend of (variable) pH decline in upwelled waters along the
Northeast Pacific coast was paralleled by shifts in community composition,
where shelled species like mussels were replaced by fleshy algae and
barnacles (Wootton et al., 2008). Macrofaunal calcifiers at CO
2
vents
(Hall-Spencer et al., 2008; Fabricius et al., 2011) and in mesocoms
(Christen et al., 2013) display a lowering of species richness. These
findings suggest that non-calcifiers increasingly outcompete calcifiers
once pH
T
decreases to a mean of 7.8 to 7.7 (medium confidence).
Finally, a loss of calcifiers from mesocosms occurred around 0.5 units
below the pH values expected from OA under RCP8.5 by 2100 (medium
confidence; Christen et al., 2013). At CO
2
seeps, calcitic bryozoans replace
coralline algae, which have more soluble high-calcite skeletons (Martin
et al., 2008). Seagrasses and non-calcifying algae gain a competitive
advantage (Fabricius et al., 2011). Coral communities exposed to high
pCO
2
waters (from upwelling or seeps) have lower growth, calcification,
and biodiversity (Manzello et al., 2008; Fabricius et al., 2011), resulting
in a shift from net accretion to erosion (Box CC-CR). The use of seeps
as analogs of future OA is limited as pH variability is high at these sites,
such that effective values may be lower than indicated by the average
change (Hall-Spencer et al., 2008; Porzio et al., 2011). During periods
of high pH at the seeps, they are recolonized by invertebrates and
fishes from neighboring areas with normal pH, compromising
assessments of long-term sensitivity thresholds. Overall, findings
available from mesocosms and natural analogs indicate losses in
diversity, biomass, and trophic complexity of benthic marine
communities due to elevated CO
2
(high confidence) and support the
projection of similar shifts in other systems with continued OA
(medium confidence).
Enhanced freshwater input by poorly buffered rivers or by precipitation,
into estuaries, brackish oceans like the Baltic (Section 30.5.3.1.4), and
into freshening polar oceans, reduces salinity and alkalinity at rising
atmospheric pCO
2
and thereby, alters the carbonate system and enhances
OA (Section 6.1.1). Estuaries usually have OMZs, where background
pCO
2
is elevated. Its reduction by dilution causes the acidification effect
to be somewhat less. Enhanced pH reduction and variability in
hyposaline waters may constrain the distribution of sensitive species
further (low confidence; Miller et al., 2009; Denman et al., 2011).

443
Ocean Systems Chapter 6
6
6.3.2.5.4. Conclusions
Natural analogs and laboratory and mesocosm experiments provide
evidence for differential effects of ocean acidification on species and
communities. Sensitivity to OA is species specific (high confidence);
differential sensitivities and associated shifts in performance and
distribution will change predator-prey relationships and competitive
interactions (low to medium confidence). OA may stimulate global net
primary production (low confidence) and nitrogen fixation (medium
confidence). OA will increase the abundance and primary production of
non-calcifying macrophytes, but will be harmful to calcifying algae and
many heterotrophs (medium confidence). Ecosystems relying on calcified
structures and at risk of dissolution under OA include warm-water coral
reefs (high confidence) and their cold-water equivalent (medium
confidence). Further studies need to explore how OA may change the
composition of communities, impact food webs, and affect higher
trophic levels.
6.3.3. Life in Hypoxia and Anoxia
6.3.3.1. Principles
Hypoxia constrains organisms which rely on aerobic metabolism
(Section 6.1.1; FAQ 6.2). Below O
2
concentrations of 60 µmol kg
–1
,
commonly termed hypoxic (Section 6.1.1.3), communities undergo
species losses and replacements and are transformed into communities
with species showing characteristic hypoxia adaptations. However, O
2
can limit animal life at even higher levels, just below air saturation (Gilly
et al., 2013). Organisms’ tolerance thresholds have been defined by
either the critical O
2
partial pressure (P
c
) or concentration (O
2
crit).
Thresholds vary across domains and are highest for large multicellular
organisms. Among these, the P
c
at rest varies depending on species,
body size, and life stage. In animals below the P
c
aerobic metabolic rate
fails to be maintained and anaerobic metabolism contributes to energy
production (Pörtner and Grieshaber, 1993). The critical oxygen threshold
is set by the capacity of ventilatory and circulatory systems to supply
O
2
and cover demand. The threshold increases once metabolism is
stimulated by muscular activity, temperature, or food uptake (Pörtner,
2002a; Ekau et al., 2010; Seibel, 2011; see also Figure 6-11). At extreme
temperatures, O
2
crit approaches the oxygen content of air-saturated
water (Pörtner, 2010; McBryan et al., 2013), indicating high sensitivity
to hypoxia in the warmth. Most animals can only sustain anaerobic
metabolism temporarily, even if they are energy efficient and survive
long periods of anoxia (Grieshaber et al., 1994). Such time-limited
tolerance is higher in large than in small individuals or larvae, related
to the higher capacity of anaerobic metabolism in large specimens (Gray
et al., 2002; Jessen et al., 2009).
6.3.3.2. Microbes
Bacteria and protists consume ambient oxygen down to very low
levels in oxygen minimum zones and sustain OMZs by their metabolic
diversity (Figure 6-11; WGI AR5 Section 3.8.3). OMZs form habitat for
both anaerobic and aerobic microbes that can utilize very low (<1 µmol
kg
–1
) O
2
concentrations (Stolper et al., 2010). Hypoxia is paralleled by
e
levated pCO
2
a
nd enhanced acidification. Expanding OMZs will select
for the proliferation of spezialized microbes (high confidence).
6.3.3.3. Animals and Plants
In mesopelagic OMZs, zooplankton also contribute to the development
of hypoxia (Robinson et al., 2010; see also FAQ 6.2). During daytime
zooplankton congregate at the upper margin of OMZs, where the
degradation of organic material causes intensified respiration and oxygen
depletion (Bianchi et al., 2013). Animals living permanently in the OMZ
still cover virtually all energy demand by aerobic metabolism. This requires
special adaptations leading to a reduction in O
2
and energy demand,
and the improved ability to use available O
2
efficiently. Enhanced
hypoxia tolerance reflected in low O
2
crit values is supported by small body
size and by cold temperature (Vetter et al., 1994; Pörtner, 2002b; Levin
et al., 2009). Accordingly, low O
2
levels support abundant meiofauna
(very small fauna, <1 mm) that benefit from abundant food and reduced
predation by larger organisms (Levin, 2003). Under suboxia only
specialists can survive (Vaquer-Sunyer and Duarte, 2008). Expansion of
suboxic and anoxic centres of pelagic OMZs and benthic dead zones
will lead to loss of habitat for animal life (high confidence).
Large, more active animals such as fishes, crustaceans, and muscular
(as opposed to ammoniacal) squids tend to have high O
2
demands
associated with high O
2
crit thresholds, and are therefore excluded from
permanently hypoxic water bodies. However, even in high-activity animal
groups some specialists such as Humboldt squid or bigeye tuna have
adapted to enter hypoxic environments though only temporarily (Richards
et al., 2009; Seibel, 2011). The time-limited tolerance of animals to
hypoxia below the O
2
crit is maximized by the depression of energy demand,
for example, during periods of metabolic arrest (e.g., developmental
arrest or diapause of copepods; Auel et al., 2005). Hypoxia-adapted
lifeforms will benefit from expanding OMZs (high confidence).
There is little information on the hypoxia sensitivity of macrophytes or
their O
2
crit values. In eelgrass (Zostera marina), warming causes the
hypoxia threshold to rise due to a strong increase in tissue respiration.
Concomitant water or sediment hypoxia can elicit tissue anoxia and
sudden die-offs (Raun and Borum, 2013). By contrast, macroalgae
attached to rocks rarely encounter anoxia (Raven and Scrimgeour, 1997).
Expanding benthic OMZs will constrain the distribution of macrophytes
(medium confidence).
6.3.3.4. Ecosystems
OMZs, shoaling, and expanding vertically and laterally (Gilly et al., 2013)
will cause habitat and abundance losses for intolerant taxa such as
mesopelagic (Koslow et al., 2011) and epipelagic fishes with a high O
2
demand (medium confidence; Prince et al., 2010; Stramma et al., 2012;
see also FAQ 6.2). In line with the distribution of hypoxia sensitivities
(Figure 6-11; Sections 6.3.3.1, 6.3.3.3), expanding OMZs will further
constrain the distribution of key zooplankton and nekton species and
influence their diurnal and ontogenetic vertical migrations (medium
confidence; Ekau et al., 2010). The composition of microbial and faunal
pelagic communities will shift from diverse mid-water assemblages to
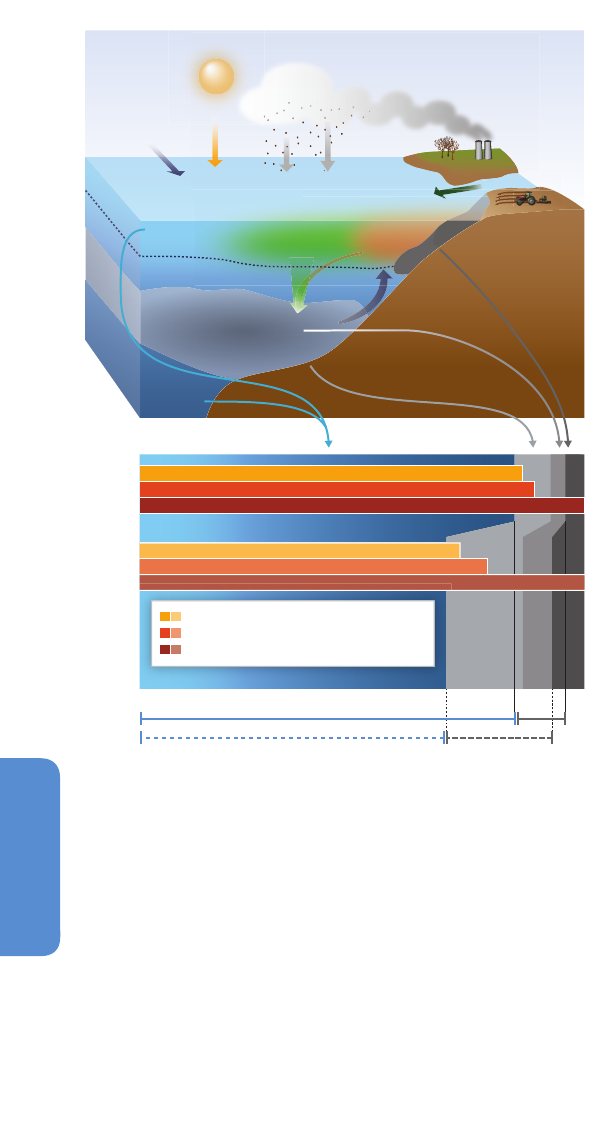
444
Chapter 6 Ocean Systems
6
m
igrant biota that return to oxygenated surface waters at night (Seibel,
2011). Dissolved O
2
, among other factors, plays an important role in
shaping large alternating fluctuations of sardine and anchovy abundances,
particularly off Peru. Anchovies are not strongly affected by a shallow
oxycline (<10 m), while sardines actively avoid such conditions
(Bertrand et al., 2010). Where OMZs intersect the continential shelves,
groundfishes (McClatchie et al., 2010) and large benthic invertebrates
such as crabs display high mortalities (Chan et al., 2008). Susceptibility
of early life stages to hypoxia in both pelagic and benthic ecosystems
(
Ekau et al., 2010) threatens population survival. Effects of hypoxia
propagate along the food chain, constraining fish stocks and top
predators (high confidence; Stramma et al., 2010). Hypoxia reduces
biodiversity (Levin et al., 2009; Gooday et al., 2010) and causes the
marginalization of calcifiers, due to low metabolic rates and high pCO
2
(high confidence; Levin, 2003; Levin et al., 2009).
The expansion and enhanced variability of OMZs increases dissimilatory
nitrate reduction and anaerobic ammonium oxidation (anammox), both
releasing N
2
into the atmosphere, reducing the availability of fixed
nitrogen, and limiting oceanic primary productivity (medium confidence).
Water column denitrification and N
2
fixation are spatially and temporally
variable (limited evidence, low confidence), suggesting that climate
effects on these processes are unlikely to operate uniformly (Brandes
et al., 2007; Fernandez et al., 2011; Franz et al., 2012).
If O
2
levels decline and OMZs expand, tolerant taxa, such as anaerobic
bacteria (Ulloa et al., 2012), gelatinous zooplankton (medusae,
ctenophores), selected fishes (gobies, hake), and possibly selected
cephalopods (Gilly et al., 2006; Bazzino et al., 2010) will respond with
range expansions or population growth. Similar phenomena are
expected with intensified upwelling causing extensive mortalities of
coastal fishes and invertebrates (Box CC-UP). A community change
toward hypoxia-tolerant fauna will occur in mid-water (high confidence).
The diversity of macroorganisms will decrease and, finally, higher
marine organisms will disappear and heterotrophic microorganisms will
dominate (high confidence). In isolated water bodies such as the Black
Sea, warming will lead to the expansion of anoxia and hydrogen sulphide
(H
2
S) poisoning, reduce pelagic and bottom faunal distributions, and
shape trophic relations, energy flows, and productivity (Daskalov, 2003;
Fashchuk, 2011).
6.3.4. Mixed Layer Depth and
Light Shaping Net Primary Production
The upper ocean is characterized by physical and chemical gradients in
the surface mixed layer that influence the magnitude of photosynthetic
carbon fixation, often termed net primary production (NPP). The availability
of light and nutrients to photoautotrophs sets daily rates of NPP and
may be altered directly or indirectly, through changing mixed layer
depths, shifts in the circulation regime at different spatial scales, and
the physical displacement of organisms (Section 6.1.1.4; Box CC-PP;
Figure 6-2). A changing climate will affect mixed layer depth, cloudiness,
and/or sea ice areal extent and thickness and thereby modulate NPP
(high confidence). A stronger vertical density gradient will reduce the
communication between the sunlit upper ocean where photosynthesis
takes place and the underlying nutrient-rich waters (Figure 6-2). The
supplies of plant nutrients (macro-nutrients) such as nitrate, and of
micro-nutrients such as iron (Pitchford and Brindley, 1999) vary seasonally
(Boyd, 2002) and regionally (Moore et al., 2002), such that NPP may be
simultaneously limited (co-limited) by more than one resource (Saito et
al., 2008; see also Section 6.3.5).
The changing range and intensity of underwater light will lead to
changes in NPP as well as in phytoplankton community composition
(Doney, 2006; Boyd et al., 2010). The response of phytoplankton to
B
e
n
t
h
i
c
O
M
Z
“
D
e
a
d
Z
o
n
e
”
OMZ = Oxygen
minimum zone
POM = Particulate
o
rganic matter
“Dead Zone” = Anoxic
+ Sub-oxic zone
P
hytoplankton
bloom
E
nhanced
stratification
M
idwater OMZ
R
espiration
OMZ formation
U
pwelling
S
urface ocean
POM
M
o
s
t
d
e
e
p
o
c
e
a
n
s
H
armful algal
bloom
Nutrient input
CO
2
Upwelling
w
inds
Acidification
Estuary
C
oastal ocean
Open ocean
N-fertilization
L
ight and
w
arming
Hypoxia-adapted
communities
Hypoxia-sensitive communities
Oxic
Present
Present
Projected
Projected
OMZ
S
ub
-
o
x
ic
A
no
x
i
c
Environmental O
2
concentration high low
Large multicellular Eukarya
Small multicellular Eukarya
Specialized unicellular Eukarya, Bacteria, and Archa ea
Figure 6-11 | (a) Principal mechanisms underlying the formation of hypoxic conditions
and their biological background (modified from Levin et al., 2009; Levin and Sibuet,
2012). The buoyancy flux from fluvial discharges produces sharp density stratification
at the base of the freshened layer (also valid for ice melt and high precipitation) near
the surface and, hence, vertical mixing is greatly reduced. In consequence, the nutrient
inputs from the river and the atmosphere accumulate in a narrow upper layer, leading
to blooms of phytoplankton, possibly including harmful algae. The enhancement of
oxygen consumption due to aerobic decomposition of sinking particulate organic
matter (POM) results in hypoxic conditions of benthic and mid-water oxygen minimum
zones (OMZs). Enrichment of nutrients (eutrophication) results in coastal dead zones.
In the open oceans, heating of the upper layer increases stratification, while the
wind-driven upwelling of hypoxic, nutrient-rich water from deeper layers adds to the
formation of the OMZs (Box CC-UP). (b) Distribution of free-living marine organisms
(microbes such as archaea, bacteria, protists, small and large multicellular animals, and
plants) across the ranges of O
2
concentrations in various water layers. Hypoxia
tolerance is enhanced in small compared to large organisms, allowing unicellular
species and small animals to thrive in extremely hypoxic habitats. Species richness and
body size of animals decrease with falling O
2
levels.

445
Ocean Systems Chapter 6
6
c
hanging sunlight involves photo-physiological acclimation via changes
in cellular chlorophyll, but such acclimation is constrained by unidentified
limits (Falkowski and Raven, 1997). A longer growing season, with more
sea ice-free days between 1998 and 2009, may have increased NPP in
open Arctic waters (Arrigo and van Dijken, 2011; see also Box CC-PP),
complemented by massive under-ice blooms as seen in 2011, favored
by light that penetrates surface melt ponds and thinner, for example,
first-year ice (Arrigo et al., 2012). There are also reports of increased
incidences of high phytoplankton stocks, and hence of greater NPP,
deeper in the water column (i.e., where it cannot be detected by satellite)
during summer in the Arctic, which have implications to assessing
changes in NPP from space (Hill et al., 2013). Little is known about shifts
from sea ice algae to free-drifting phytoplankton expected with a
decrease in sea ice cover and effects of increased light in polar waters
in the coming decades (low confidence). In the Arctic, summer ice melt
led to a rapid export of sea-ice algae to the deep ocean (Boetius et al.,
2013). As some krill feed primarily on sea ice algae, it is unclear (low
confidence) whether they will adapt to feeding mainly on free-drifting
phytoplankton (Smetacek and Nichol, 2005).
A range of time series observations, from in situ phytoplankton
abundances to satellite remote sensing, have been used to assess
whether phytoplankton stocks and hence rates of NPP have altered over
recent decades. Increases in phytoplankton stocks were found in regions
where colder waters had warmed in the Northeast Atlantic, whereas
the opposite trend was observed for warm-water regions from a
phytoplankton abundance time series (Richardson and Schoeman,
2004). Lower chlorophyll concentrations at warmer SSTs in nutrient-
poor low-latitude waters, based on satellite ocean color data, have been
interpreted as an effect of increased stratification on phytoplankton stocks.
It has thus been suggested that expanding, permanently stratified, low-
chlorophyll, tropical regions (WGI AR5 Chapter 3) indicate declining
phytoplankton stocks in the warming oligotrophic waters of the North
and South Pacific and North and South Atlantic (limited evidence, low
agreement due to methodological uncertainties; Box CC-PP; Polovina
et al., 2008; Signorini and McClain, 2012; see also Section 30.5.1.1.2).
Furthermore, a transition to conditions favoring increased frequency or
even permanence of El Niño in a warmer future (Wara et al., 2005) and
further expansion of subtropical ocean gyres (Polovina et al., 2008;
see also Section 30.5.6) may lead to lower global ocean NPP (low to
medium confidence).
However, these long-term “blended” projections (i.e., constructing a
biomass time series using multiple proxies such as ocean transparency)
of a global decrease in phytoplankton biomass (Boyce et al., 2010) have
been refuted (Mackas, 2011; McQuatters-Gollop et al., 2011;
Rykaczewski and Dunne, 2011). Time series shorter than 20 years do
not resolve impacts of bi-decadal variation such as the Pacific Decadal
Oscillation or the lunar nodal cycle (e.g., Watanabe et al., 2008; Henson
et al., 2010). Analysis of continental shelf ecosystems, including field
data in the most productive upwelling areas covering the last 20 years
(e.g., Chavez et al., 2011), revealed a large variety of trends at scales of
several decades but a general increase in NPP on most shelves (Sherman
and Hempel, 2009; Bode et al., 2011), possibly caused by natural climate
variability, anthropogenic climate change, and/or anthropogenic
eutrophication. Recent field measurements document increasing quantities
of both anthropogenic fixed N (Duce et al., 2008) and biologically fixed
a
tmospheric nitrogen (Mouriño-Carballido et al., 2011) entering the
open ocean, which could lead to increased NPP especially in warm,
stratified tropical and subtropical oceans provided sufficient phosphate
and other growth requirements are present (low confidence; e.g., Sohm
et al., 2011).
For heterotrophs, from bacteria to fish, mammals, and birds, the uptake
of organic material as food, ultimately provided by NPP, is central not
only to productivity but also for fueling energy-consuming functions
including the resistance of organisms to environmental change and
pathogens (Sections 6.3.1-2). Any direct influence of climate on the
abundance and quality of feed organisms will thus translate to indirect
effects on the productivity and well-being of foraging animals (high
confidence; Figures 6-5a, 6-7a, 6-12).
Overall, pelagic systems respond to climate change by region-specific
changes in productivity with the projection of a small net reduction in
global ocean NPP by 2100 (medium confidence; Box CC-PP). The spatial
reorganization of NPP between latitudes affects higher trophic levels
by alteration of the composition and functioning of pelagic communities
(medium confidence).
6.3.5. Concurrent Responses to Multiple Drivers
Climate change alters oceanic properties globally, with concurrent
changes in temperature, dissolved CO
2
and O
2
, light, and nutrient
concentrations (e.g., Sarmiento et al., 1998; Matear and Hirst, 1999;
Boyd and Doney, 2002; Ekau et al., 2010; see also Figure 6-2). Additional
direct human interventions at regional scale comprise the introduction
of non-native species, overfishing, pollution, long-range atmospheric
transport of nitrogen, point-source eutrophication, and habitat destruction
(Carlton, 2000; Boyd and Hutchins, 2012). Worldwide alterations in
marine ecosystems (Pauly et al., 1998; Österblom et al., 2007) have been
linked to direct human activities, especially fishing (Frank et al., 2005;
deYoung et al., 2008; Casini et al., 2009), but may also be caused to
some extent by climate variability and change (Cheung et al., 2013a).
Alteration of each individual property has pronounced effects on
organisms from microbes to animals, and hence on ecosystems
(Sections 6.3.1-4). The cumulative effects of these factors will result in
complex patterns of change, from organismal physiology to the areal
extent and boundaries of biogeographic regions (Table 6-4). In many
organisms, effects of ocean acidification interact with those of other
key drivers such as temperature and hypoxia (Boyd, 2011; Gruber, 2011;
Pörtner, 2012) and translate from molecular to ecosystem level impacts.
In phytoplankton, low light (Zondervan et al., 2002) or nitrogen limitation
(Sciandra et al., 2003) limit beneficial OA effects on photosynthesis and
have a strong negative effect on plankton calcification (Rokitta and Rost,
2012). Nutrients and light support functional adjustments to OA through
gene expression changes (Dyhrman et al., 2006; Richier et al., 2009).
Similar to today, paleo-events such as the Palaeocene-Eocene Boundary
demonstrate concurrent warming, enhanced stratification of the oceans,
deoxygenation of deeper waters, and OA, albeit at a rate more than 10
times slower than today’s rate (Section 6.1.2). Both the complexity of
paleo-ecosystem changes and the complexity of present effects confound
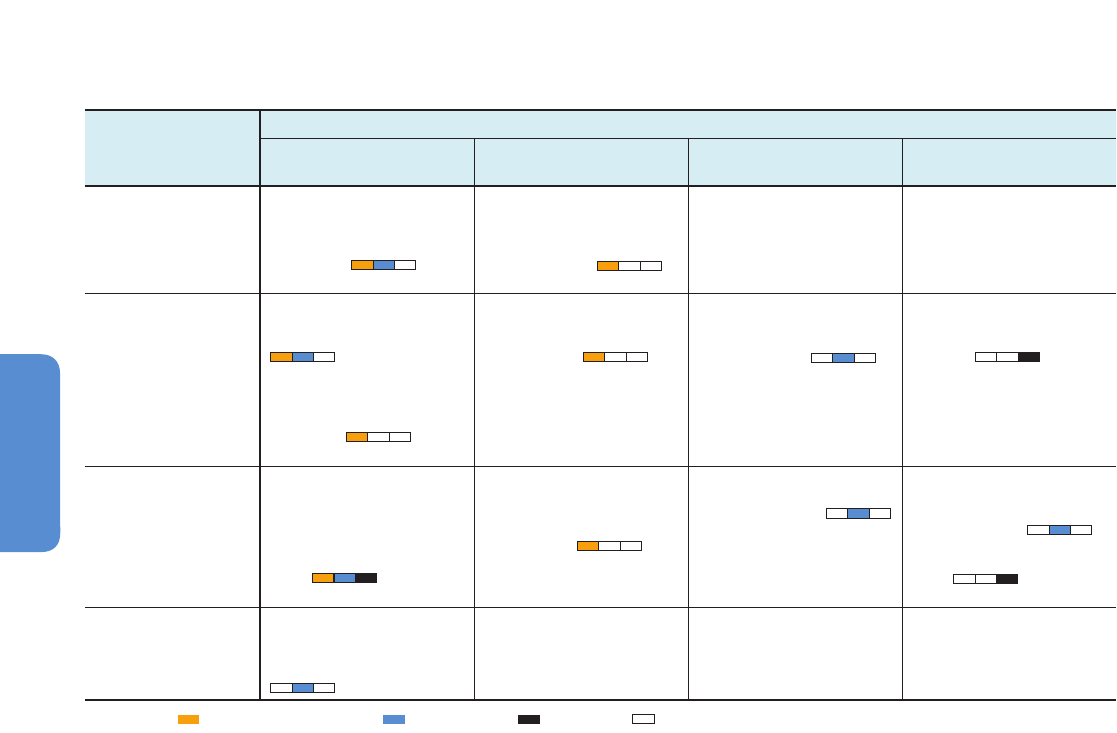
446
Chapter 6 Ocean Systems
6
t
he clear attribution of biological trends to individual drivers (Parmesan
et al., 2011). For warming and hypoxia, changes are accelerated by
effects of shifting seasonal or even diurnal extremes and their frequency
on organisms and ecosystems (medium evidence, medium agreement)
(e.g., Pörtner and Knust, 2007; Díaz and Rosenberg, 2008). This may also
apply to effects of anthropogenic OA (limited evidence, low agreement).
6.3.5.1. Principles
Effects of various climate drivers on ocean ecosystems are intertwined
and effects may be exacerbated by responses of biota. For example,
warming reduces O
2
solubility and enhances biotic O
2
demand, which
exacerbates hypoxia, produces CO
2
, and causes acidification (Millero, 1995;
Brewer and Peltzer, 2009). Drivers act with either additive, synergistic (i.e.,
amplification of) or antagonistic (i.e., diminution of) effects. A meta-
analysis of 171 experimental studies that exposed marine systems to two
or more drivers identified cumulative effects that were additive (26%),
synergistic (36%), or antagonistic (38%) (Crain et al., 2008). Effects range
from direct impacts of ocean warming on organismal physiology (Pörtner
and Knust, 2007) to ocean acidification acting together with warming,
for example, on coccolithophore calcite production and abundances
(Feng et al., 2009), or with hypoxia and/or salinity changes (Table 6-4).
Interactions of predominantly temperature, ocean acidification, and
hypoxia have likely been involved in climate-driven evolutionary crises
during Earth history (Pörtner et al., 2005; see also Section 6.1.2).
E
ffects on individual organisms may also reflect intertwined impacts of
ocean warming, acidification, and hypoxia, which may operate through
interrelated functional principles (Pörtner, 2012). Such knowledge helps
to reconcile apparently contrasting findings. For example, warming
toward the thermal optimum (Figure 6-5a) stimulates resistance to OA;
CO
2
-induced disturbances of growth and calcification were reversed by
concomitant warming (Findlay et al., 2010; Sheppard-Brennand et al.,
2010; Walther et al., 2011). Warming to above optimum temperatures,
however, constrains performance and exacerbates sensitivity to hypoxia
and/or elevated CO
2
(Figure 6-5, e.g., via decreased calcification;
Rodolfo-Metalpa et al., 2011). Both hypoxia and/or elevated CO
2
in turn
enhance heat sensitivity, as seen for CO
2
in crustaceans (via decreased
heat limits: Walther et al., 2009; Findlay et al., 2010), coral reef fishes
(via reduced performance: Munday et al., 2009b), and corals (via
decreased calcification and CO
2
-enhanced bleaching: Reynaud et al.,
2003; Anthony et al., 2008). This translates into a narrowing of the
thermal niche (Walther et al., 2009; see also Figure 6-5), which will shrink
biogeographic ranges, affect species interactions, and shift phenologies
(Figure 6-7a). Hence, extreme warming and hypoxia exacerbate CO
2
effects and vice versa (medium confidence). Such principles need to be
reconfirmed across organism taxa (Pörtner, 2012).
Differences in organism adaptation to a climate zone’s characteristic
temperatures, temperature variability, oxygen content, and ocean
chemistry may shape vulnerability to climate change. In high polar
species evolutionary cold adaptation enhances vulnerability to warming
Biological organization
studied at ecosystem
level
Anthropogenic forcing
Single environmental driver
Multiple environmental
drivers
Fishing / foodwebs Fishing / climate change
Individuals
Lab experiments and field
observations show that warming
alters organismal physiology
and thereby growth (Pörtner and
Knust, 2007).
Shipboard manipulation
experiment addressing interactive
effects of temperature and CO
2
on coccolithophore calcification
(Feng et al., 2009).
NA Unknown
Population
Physiological effects of warming
change population abundance in
situ (Pörtner and Knust, 2007).
Lab cultures show how altered
pH elicits different responses of
coccolithophore species (Langer
et al., 2006).
Lab cultures show differential
responses of cyanobacterial
groups to temperature and CO
2
(Fu et al., 2007).
Altered maturation age and
growth rate of populations due to
fishing (Fairweather et al., 2006;
Hseih et al., 2006).
Interactive effects on cod
populations of fishing and
alteration of salinity (Lindegren et
al., 2010).
Ecosystem
Mesocosm experiments
simulating the effect of individual
drivers (e.g., ocean acidification
effects on benthos: Christen
et al., 2013; and on pelagic
communities: Riebesell et al.,
2013).
Mesocosm experiments studying
differential effects of light and
temperature, on copepods versus
diatoms (Lewandowska and
Sommer, 2010).
Effects of fishing on ecosystem
structure — trophic cascades
(Frank et al., 2005).
Interplay of fishing and climate
pressures on ecosystems
promotes lower trophic levels
(Kirby et al., 2009);
enhances diversity loss in benthic
communities (Griffith et al.,
2011).
Biome
Time series observations on
warming and geographical
shifts of zooplankton biomes
(Beaugrand et al., 2009).
Unknown Unknown Unknown
Table 6-4 | Potential interactions between modes of anthropogenic forcing (environmental; foodwebs; harvesting) on different levels of biological organisation. These
interactions, from simple to complex, are illustrated with examples from the published literature. Unknown denotes no published information is available for each of these
categories. NA denotes not applicable for this category.
Approaches: = Experiments (lab or fi eld) = Observations = Modeling = Not applied

447
Ocean Systems Chapter 6
6
(
medium confidence). In OMZs, marine sediments, and in polar waters
(due to high solubility in the cold), CO
2
levels are elevated and adaptation
may reduce sensitivity and reliance on calcified structures (Clark et al.,
2009; Walther et al., 2011; Maas et al., 2012). The observed shift from
“overcalcified” to “weakly calcified” coccolithophores Emiliania huxleyi
in cold waters may reflect a related shift in ecotype dominance (limited
evidence, medium agreement; Cubillos et al., 2007).
Despite such potential adaptation, polar calcifiers exposed to higher
CO
2
and lower carbonate saturation levels have been hypothesized to
be highly sensitive to further CO
2
accumulation (limited evidence, high
agreement; Orr et al., 2005). Here it appears relevant that cold temperature
reduces energy demand and thereby lowers resistance to ocean
acidification. Both energy demand and resistance are higher in eurytherms
than in high polar and deep sea stenotherms (limited evidence, medium
agreement; Pörtner, 2006; e.g., crustaceans: Pane and Barry, 2007: cf.
Whiteley, 2011). In turn, tropical species may be more sensitive than
temperate zone species (Pörtner et al., 2011). This rough differentiation
of sensitivity is complicated by the local adaptation of populations from
within-species genetic variability (low confidence).
Temperature influences hypoxia sensitivity (Section 6.3.3). Warming
causes the minimum tolerated O
2
level to rise, enhancing vulnerability
(high confidence). Conversely, hypoxia enhances vulnerability to warming
in animals. This may occur fastest in warm oceans, where metabolic
rates are higher and animals live closer to upper thermal limits (medium
confidence; Pörtner, 2010). However, evolutionary adaptation has led to
high hypoxia tolerance (low P
c
or O
2
crit values) in some warm-adapted
coral reef fishes. Further warming then causes a rise in P
c
which cannot
be compensated for (Nilsson et al., 2010). Limits to hypoxia adaptation
coincide with upper thermal limits (medium confidence).
Complexity in responses rises with the number of drivers involved.
Enhanced river runoff and increased precipitation cause a shift from
marine to more brackish and even freshwater communities, with unclear
consequences for effects of other drivers. Falling primary production
reduces resilience of higher trophic levels (Kirby and Beaugrand, 2009;
Stock et al., 2011). The introduction of non-indigenous species, when
supported by climate-induced shifts in interactions, may promote the
displacement of ecotypes and shifts in ecosystem functioning, for
example, in the Mediterranean Sea (Occhipinti-Ambrogi, 2007; Coll et
al., 2010).
6.3.5.2. Microbes
Both synergistic and antagonistic effects of multiple drivers on microbial
biota in the surface ocean have been observed in manipulation or
modeling experiments (Folt et al., 1999; Boyd et al., 2010; Gruber, 2011).
The productivity of many microbes was simultaneously limited by, for
example, availability of nitrate and phosphate, cobalt and iron (Saito et
al., 2002; Bertrand et al., 2007), or iron and light (Boyd et al., 2010; see
also Section 6.2.2). Warming and high CO
2
synergistically enhanced
photo-physiological rates of the cyanobacterium Synechococcus,
whereas the cyanobacterial group Prochlorococcus showed no change
(Fu et al., 2007). The magnitude of CO
2
effects on growth, fixation rates,
or elemental ratios within single species is often strongly modulated by
n
utrient availability and light conditions (e.g., Sciandra et al., 2003;
Zondervan et al., 2002; Kranz et al., 2010). Such differences cause floristic
shifts in phytoplankton with the potential to restructure predator-prey
interactions (Table 6-4).
Co-limiting factors vary by group, such as nitrogen fixers (e.g., Hutchins
et al., 2007; Kranz et al., 2010), diatoms (Boyd et al., 2010), and
coccolithophores (e.g., Feng et al., 2009; Rokitta and Rost, 2012). This
limits the ability to project climate change effects (Boyd et al., 2010).
The most reliable projections at ocean basin scale come from modeling,
which mainly points to synergistic effects, such as those of elevated
CO
2
, hypoxia, and warming. For example, OA is projected to alter sinking
particles (C:N ratio and/or reduced calcite content and slower sinking)
with a consequent knock-on effect on water column O
2
demand already
stimulated by warming, thereby causing expansion of OMZs (Gruber,
2011).
6.3.5.3. Animals and Plants
High oxygen availability alleviates thermal stress as seen in fish and
mollusks (Mark et al., 2002; Pörtner et al., 2006). Conversely, hypoxia
reduces heat tolerance (Section 6.3.5.1), but acclimation to hypoxia
compensates for this and increases thermal tolerance (Burleson and Silva,
2011), for example, by enhancing blood pigment content or reducing
energy demand. Tolerances to hypoxia and to high temperature may
positively correlate in some fishes, indicating potential for adaptive
evolution under climate change (low confidence; McBryan et al.,
2013).
As a consequence of hypoxia narrowing thermal ranges (Section 6.3.5.1),
combined warming and expanding hypoxia may cause mid-water
mesopelagic and demersal fish stocks to decline at rates much quicker
than anticipated in the California Current Ecosystem (McClatchie et al.,
2010; Koslow et al., 2011). In benthic fauna, warming will also increase
vulnerability to hypoxia. Experiments showed a rise in lethal oxygen
concentrations by 25% and thereby reducing survival by 36% at 4°C
warmer temperatures (Vaquer-Sunyer and Duarte, 2011). Hence, warming
is expected to expand the area of ecosystems affected by hypoxia even
if oxygen concentrations remain unchanged (high confidence). Under
combined hypoxia and warming, CO
2
can extend short-term passive
tolerance (despite constraining long-term tolerance). It facilitates a
reduction in energy demand (Reipschläger et al., 1997; Pörtner et al.,
2000), thereby extending survival of transient extremes of temperatures
or hypoxia (medium confidence).
In macroalgae (non-calcifying) light availability modulates the response
to elevated pCO
2
and temperature levels (Russell et al., 2011; Sarker et
al., 2013). In warm-water corals, warming acting synergistically with
CO
2
reduces calcification and increases sensitivity to bleaching (high
confidence; Anthony et al., 2008). Combined warming and OA following
SRES B1 (≈RCP4.5, reduced emission) and A1FI (≈RCP8.5, business-as-
usual) scenarios in mesocosms caused losses of symbionts and corals,
and a nocturnal decalcification of the reef community in summer.
Present-day conditions already imply reduced resilience to episodic
extreme events such as cyclones (Dove et al., 2013; see also Box
CC-CR).

448
Chapter 6 Ocean Systems
6
6.3.5.4. Ecosystems
The cumulative impacts of climate change drivers underlie alterations of
species interactions and ecosystem structure and functioning, including
changes in trophodynamics and the physical and chemical characteristics
of habitats (high confidence). These effects combine with more indirect
effects, such as shifts in stratification and productivity, expanding oxygen
minimum zones, and the changing composition and biomass of food
(partly resulting from direct effects on prey organisms) (high confidence).
These complexities reduce the precision and reliability of quantitative
projections (Section 6.5), including uncertainties concerning shifts in
upwelling and their future role in global primary production and the
development of fish stocks (Box CC-UP).
At the level of animal communities, effects of various drivers remain
largely unexplored, some are highly complex. For example, the net
eastward shift of Pacific skipjack tuna between 1980 and 2009 was linked
to the shifting aggregation of macrozooplankton and micronekton,
involving complex interactions of climate variability (due to ENSO;
Section 30.5.2), warming ocean surface, shallowing mixed layer depth
relative to the position of the warm pool, and the convergence of the
pool with the Pacific Equatorial Divergence Province (Lehodey et al.,
2011; see also Section 30.5.6.1.1). Interactive drivers will affect the
relative performance of interacting species, thereby shifting species
ranges, interactions, and food webs (medium confidence; Figure 6-7a).
Adaptation to various climate zones modifies the roles of light and
temperature in seasonalities and species interactions (Bradshaw and
Holzapfel, 2010). Moderate hypoxia expansion in warming seas, for
example, as the stratified central North Sea (Queste et al., 2013) may
well influence the degree of temperature-induced species displacements
(Figure 6-7b).
Impacts of climate change on benthic ecosystem engineers can also
profoundly alter ecosystems. Tropical corals respond to ocean warming
and acidification by increased bleaching, impeded calcification rates,
and increased incidence of disease (high confidence; Veron et al., 2009;
Veron, 2011; see also Sections 6.3.1-2, 30.5.6; Box CC-CR). In coral reefs
under multiple stressors, differentiation of these large-scale phenomena
into species-specific sensitivities is highly uncertain as trend data are
virtually nonexistent (Brainard et al., 2011). Little is known about impacts
on deep-water or cold-water corals and sponges, tropical calcified algae,
bryozoans, sponges, and tube-forming serpulid worms (Wood, 1999).
The reliance of all of these on surface productivity makes them vulnerable
to any alteration in food supply. Projected severe stress from increased
temperature, hypoxia, and ocean acidification will cause reduced
performance and increasing mortality in ecosystem engineers (high
confidence), and a deterioration of habitat characteristics for other
organisms (medium to low confidence).
As a corollary, shifts in the geographical distributions of marine species
(e.g., to higher latitudes or deeper waters; Figure 6-7b; Section 6.5.2)
cause changes in community composition and interactions (Harley,
2011; Simpson et al., 2011; Hazen et al., 2013). Some species may gain
predominance and abundance from fitness benefits (Figure 6-7) while
others become less competitive or easier prey (Occhipinti-Ambrogi,
2007). Thereby, climate change will reassemble communities and affect
biodiversity, with differences over time and between biomes and
l
atitudes (high confidence; Parmesan and Matthews, 2005; Sala and
Knowlton, 2006; Cheung et al., 2009; Parmesan et al., 2011; see also
Box CC-PP; Section 6.5).
6.3.6. Food Web Consequences
Community reassembly under climate change involves a change in
species composition and strongly alters food web structure, for example,
causing shifts in trophic pathways (Kirby and Beaugrand, 2009; Moloney
et al., 2011; see also Figure 6-12), some of which are irreversible (Jarre
and Shannon, 2010). Through trophic cascades (Cury et al., 2003; Luczak
et al., 2011), climate affects predation, competition, and food availability
(e.g., via changes in NPP; Figure 6-12; Utne-Palm et al., 2010), including
fish stocks (Parsons and Lear, 2001; Brown et al., 2010). Trophic
amplification then drives an ecosystem towards a new stable structure
or regime, which may be difficult to reverse (Folke et al., 2004). Warming
may result in consumer control of food web structure because respiration
of heterotrophic zooplankton and bacteria increases more strongly with
warming than does photosynthesis of autotrophic phytoplankton
(medium confidence; O’Connor et al., 2009).
Many impacts of climate change on food webs resemble those caused
by fishing, pollution, eutrophication, and associated hypoxia (Section
6.3.3), and habitat change (Brander, 2007); unambiguous attribution to
climate remains difficult (low to medium confidence; Parmesan et al.,
2011). Some of these factors also affect food web responses to climate
change. Fishing truncates the age and size structure of populations,
making them more dependent on annual recruitment and reducing their
ability to buffer environmental fluctuations (Genner et al., 2010; Planque
et al., 2010; Botsford et al., 2011; see also Figure 6-12). Both adult and
larval fishes show greater variability in abundance in exploited
compared to unexploited populations (Hsieh et al., 2008). Warming,
acidification, and removal of top or competing predators may all
contribute to large fluctuations in gelatinous plankton (e.g., jellyfish)
populations (low confidence; Molinero et al., 2005; Richardson and
Gibbons, 2008; Richardson et al., 2009; Condon et al., 2012).
Analyzing impacts on key species provides insight into how individual
components of a food web will respond to perturbations. However,
projections of future states must include the complex food web interactions
that influence the species and system-level responses, which affect
stability and resilience of the overall ecosystem (Neutel et al., 2007;
Dunne and Williams, 2009; Romanuk et al., 2009). There is no single
approach currently available that includes the complex links within and
among ecosystems, biogeochemistry, and climate as needed for projections
of future states of marine food webs (Fulton, 2011; Moloney et al., 2011).
In conclusion, there is low confidence in the quantitative projections of
such changes (for further discussion see Section 6.5).
6.3.7. Marine Reptiles, Mammals, and Birds
6.3.7.1. Principles
Marine reptiles (turtles, snakes, crocodiles), mammals, and seabirds
breathe air but live mostly in water; some shift or expand their ranges
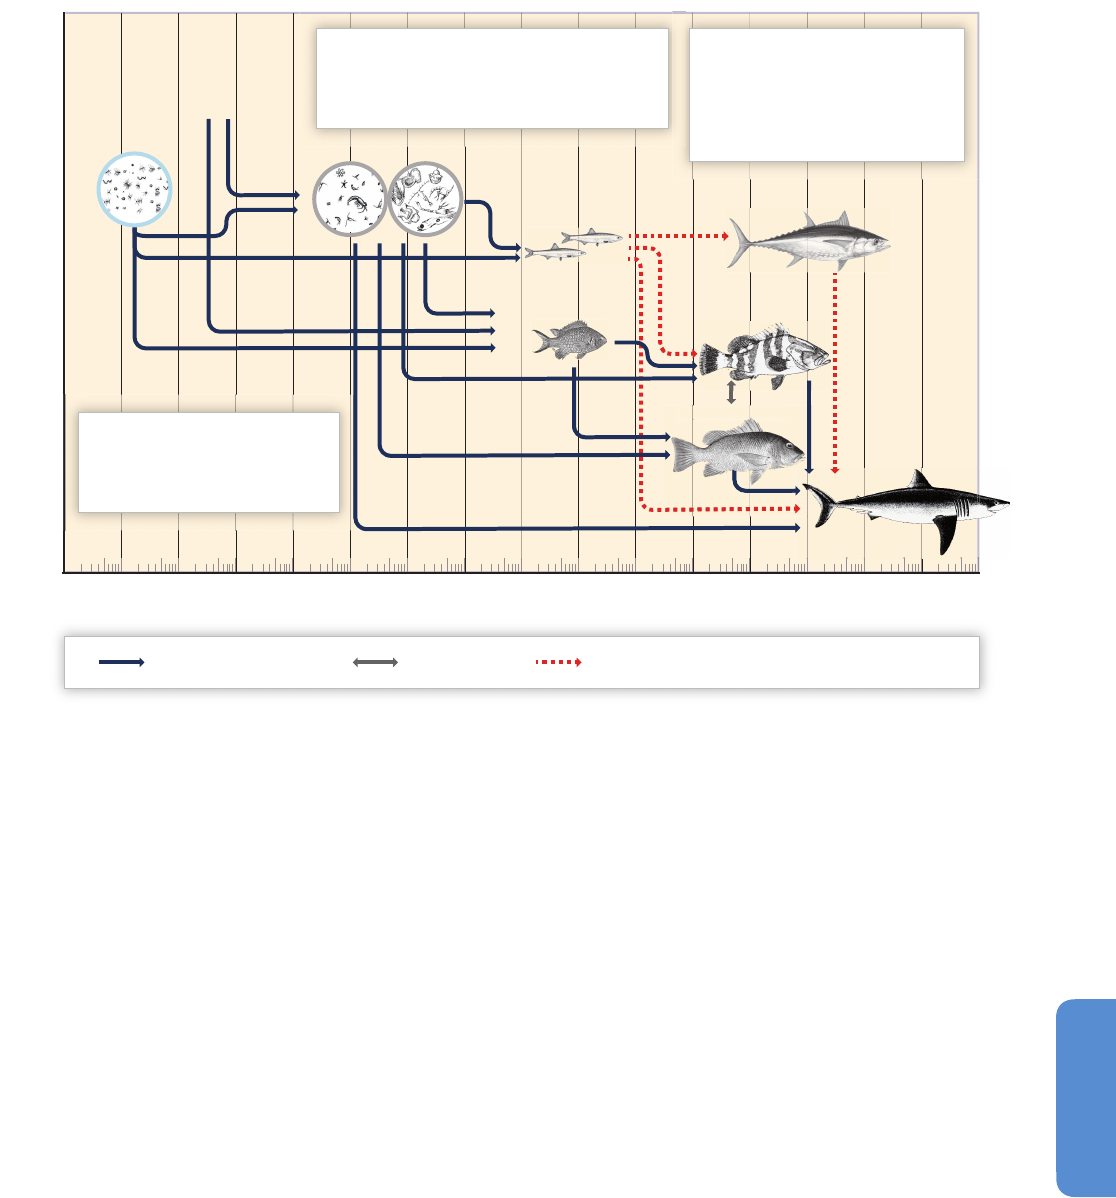
449
Ocean Systems Chapter 6
6
as a result of climate warming. The body temperature of ectothermic
reptiles is set by ambient conditions; only at large body size may their
body store heat and its temperature be higher than ambient. Reptiles
are thus more responsive to temperature than homeothermic seabirds
and marine mammals (McMahon and Hays, 2006), which regulate their
body temperature by adjusting metabolic heat production and insulation
from the environment, a trait beneficial especially in the cold. Various
degrees of body core insulation in mammals and birds constrain their
distribution to either warmer or colder waters (by poor or high insulation,
respectively). However, large body sizes enable some aquatic air
breathers to travel across the widest temperature ranges possible in
some of the largest migrations on Earth.
Changes in water chemistry and hypoxia have minimal direct influences
on the air-breathing vertebrates, reflecting their large independence
from physical and chemical drivers in the oceans. There is evidence for
increased sound propagation in a CO
2
-enriched ocean, but no evidence
yet for any effect on biota (Ilyina et al., 2010). If habitat structures
offering retreat or ambush disappear, this will increase the energetic
costs of life. Warming waters increase the cost of pursuit-diving as prey
fishes increase swimming velocity. The predation success of such
mammals (e.g., sea lions) and seabirds (e.g., penguins, cormorants) is
thus constrained to waters ≤20ºC (Cairns et al., 2008), a trend that
extrapolates into the future (low to medium confidence). As prey
distributions shift, foragers tied to land between trips may be
constrained by the physiological costs of finding prey (Péron et al., 2012;
Hazen et al., 2013). If food items are only found in thermally restricted
areas or move to greater depths, mammals and birds may become
constrained to certain distribution ranges or to the physiological limits
of their diving ability (McIntyre et al., 2011). Conversely, hypoxic habitat
compression for fishes may facilitate foraging opportunities for their
air-breathing predators (Hazen et al., 2009). Accordingly, many air-
breathers encounter changing habitat and food availability with climate
change (high confidence).
6.3.7.2. Field Observations
Some species of seabirds, marine mammals, and sea turtles have
responded to the anomalous ocean climate of the 20th century (high
confidence; Hughes, 2000). There is insufficient information to assess
effects on sea snakes or crocodiles. Poleward distribution shifts of turtles
consistent with recent warming have been recorded in almost all marine
groups. Decadal-scale climate fluctuations affect their recruitment
10
0
10
–1
10
1
10
2
10
3
10
4
10
5
10
6
10
7
10
8
10
–2
10
–3
10
–4
10
–5
10
–6
10
–7
10
–8
P
rimary production
Megafauna
Body Mass (g)
Small fishes (sp. A)
Large fishes (sp. A)
Large fishes (sp. B)
Large fishes (sp. C)
S
mall fishes (sp. B)
Zooplankton and other invertebrates
Detritus / particulate
o
rganic matter
B
iogeographic shifts
S
ome species experience distribution shifts, abundance losses, or
become locally extinct (dashed lines). Loss and invasion of prey
organisms and/or predators may lead to changing diversity and
f
oodweb structure and result in trophic cascade effects.
P
henological shift
C
hanges in phenology due to climate change
m
ay lead to mismatch phenomena between
p
redator and prey, which may reduce
a
bundance of the predator.
C
hanges in body size
M
arine water-breathing ectotherms increase
t
heir consumption rate and have a smaller
m
aximum body size during warming. Changes in
t
he body size spectrum and food consumption
rate may lead to changes in foodweb structure
a
nd dynamics.
Large fishes
(sp
(
(
(
(
(
. C
)
r
Predator–prey interactions Interactions that will be weakened or removed by climate changeCompetition
Figure 6-12 | Schematic diagram of expected responses to climate change in a marine food web. A coupled pelagic and benthic food web is structured by the body size
spectrum of species. Combined warming, hypoxia, and ocean acidification reduce body size, shift biogeographies, change species composition and abundance, and reconfigure
trophic linkages and interaction dynamics. Fishing generally removes large-bodied species and truncates the body-size spectrum of the community. This confounds the detection
and attribution of food web responses to climate change. Arrows represent species interactions (e.g., between predator and prey or competitors for food or space). Broken lines
reflect the potential loss of populations and trophic linkages due to climate change.

450
Chapter 6 Ocean Systems
6
s
uccess and nesting abundance (Van Houtan and Halley, 2011), with an
inverse correlation between warming and abundance in various species
and regions (Balazs and Chaloupka, 2004; Chaloupka et al., 2008;
Mazaris et al., 2009). Extreme weather causes nest flooding, considerably
reducing hatching success (Van Houtan and Bass, 2007); projected sea
level rise (WGI AR5 Chapter 13) will exacerbate such impact. Those with
high fidelity to nesting and foraging sites (Cuevas et al., 2008) are
impacted more than those capable of changing those sites (Fish et al.,
2009; Hawkes et al., 2009). Continued warming, modulated by changing
rainfall (Santidrián Tomillo et al., 2012), may skew turtle sex ratios
toward females, increase egg and hatchling mortality (Fuentes et al.,
2009), cause earlier onset of nesting (Pike et al., 2006; Mazaris et al.,
2008), decrease nesting populations (Chaloupka et al., 2008), and shift
dietary breadths (Hawkes et al., 2009), leading to projected recruitment
declines (e.g., leatherback turtles; Saba et al., 2012). Vulnerability due
to shifting sex ratio alone remains unclear, as nesting beaches have
persisted with low production of male hatchlings over decades or longer
(low confidence; Godfrey et al., 1999; Broderick et al., 2000; Hays et al.,
2003). The absence of sea turtles in certain regions may be best
explained by the temporal unavailability of food resources or strong
thermoclines restricting their bottom foraging abilities (Braun-McNeill
et al., 2008; Gardner et al., 2008).
Seabird range modifications probably caused by climate change were
recorded in polar areas and the temperate zone of the North Atlantic
(Grémillet and Boulinier, 2009). Temperate species have shifted their
ranges to higher latitudes in both hemispheres (Bunce et al., 2002;
Robinson et al., 2005; La Sorte and Jetz, 2010). Some species, like the
king penguin, follow shifting foraging zones (Péron et al., 2012); others,
such as the emperor penguin, are affected by changing habitat structure
(sea ice; Jenouvrier et al., 2012). Warming causes many bird species to
breed earlier (Sydeman and Bograd, 2009). High-latitude, cool-water
species undergo extended breeding seasons (Chambers et al., 2011). There
is often no agreement, whether changes reflect solely ocean warming, or
a combination of factors, such as fishing pressure on seabirds’ prey
species, sea level rise, and pollution (Galbraith et al., 2005; Votier et al.,
2005; Heath et al., 2009). Most shifts in range and seasonal activity
involve shifts in trophic relationships (medium confidence). Seabirds with
narrow geographic domains are expected to be more susceptible to
climate change (Chambers et al., 2005; Grémillet and Boulinier, 2009),
even leading to local extinctions (e.g., the Galápagos penguin: Vargas
et al., 2007; or the marbled murrelet: Becker et al., 2007).
The distribution, phenology, and migratory timing of marine mammals
are also shaped by predator-prey dynamics and climate impacts on
specific habitats (Calambokidis et al., 2009; Salvadeo et al., 2011). Some
marine mammals, that is, dolphin, porpoise, and whale species, shift their
distribution poleward to follow the movement of their prey (medium
confidence; Springer et al., 1999; MacLeod et al., 2005; Simmonds and
Isaac, 2007; Salvadeo et al., 2010 ). As in birds, vulnerability to climate
change is high for marine mammals with narrow geographic ranges
and high habitat dependence. For example, the critically endangered
vaquita, endemic to the Northern Gulf of California, cannot move north
because of the land barrier (MacLeod, 2009). The polar bear (Laidre et
al., 2008; Rode et al., 2012) and the walrus depend on sea ice as a
platform for hunting, resting, and giving birth. For polar bears, access
to prey such as ringed seals has been disrupted by the later formation
a
nd earlier breakup of sea ice in the eastern Canadian Arctic. Seasonal
migrants into the Arctic (fin, minke, gray, killer, humpback whales) may
increasingly compete with species adapted to operate in habitat with
sea ice (some seals, narwhal, bowhead whale, beluga). Both may benefit
from the net loss of sea ice, which will offer them better access to
foraging in a pelagic-dominated ecosystem (Moore and Huntington,
2008).
6.3.8. Summary and Conclusions
An organism’s capacity to perform, but also its access to food energy
fueling that performance, shape its sensitivity to climate change
(high confidence). Extreme temperatures surpassing the fringes of the
thermal envelope cause local abundance losses, extinction, and shifts
in temperature-dependent distribution ranges (high confidence; Section
6.3.1).
Some climate change effects detected in the field can be attributed to
temperature, but few allow clear attribution to other drivers (Sections
6.3.1-5, 6.6). In fishes and invertebrates, specialization in regional climate
regimes co-defines sensitivity to warming, acidification, and hypoxia
(high confidence; Section 6.3.5). In marine mammals, birds, and
ectothermic reptiles, changes in life history and population dynamics have
often not been directly attributed to climate drivers (low confidence), but
rather to the availability of habitat and food (high confidence; Section
6.3.7).
Natural climatic variability (Figure 6-1) and anthropogenic change, with
a strong role of warming, cause large-scale changes in biogeography,
abundance, diversity, community composition, and structure of marine
species (very high confidence; Section 6.3.1). Warming reduces body size
(medium confidence; Section 6.3.1). Differential species responses modify
their interactions across trophic levels through trophic amplification
(medium to high confidence; Section 6.3.6).
Some tropical species and ecosystems exist close to upper thermal limits
placing them among the marine ecosystems most affected by climate
change (high confidence; Section 6.3.1). Corals and coral reefs are
primary examples. However, other factors change concomitantly, such
that quantifying ecosystem changes attributable to warming or other
drivers has not always been possible (Section 6.3.5).
Under future climate change ocean acidification will affect marine
organisms and ecosystems for centuries (high confidence; Sections 6.3.2,
6.3.5). To date, very few ecosystem-level changes in the field have
been attributed to anthropogenic or local ocean acidification (medium
confidence; Section 6.3.2). Concomitant trends of warming, O
2
depletion,
OA, and other drivers prevent clear attribution to OA (Section 6.3.5).
Elevated CO
2
levels stimulate primary production of some macroalgae
and seagrass species (high confidence), causing them to be more
competitive than calcifying organisms (medium confidence; Section
6.3.2). High sensitivities to OA are associated with low capacities to
maintain pH in internal fluids (high confidence). Calcification rates in
sensitive invertebrates, including corals, echinoderms, and mollusks,
decrease under OA, especially if combined with temperature extremes

451
Ocean Systems Chapter 6
6
(high confidence; Section 6.3.5). Thresholds beyond which effects occur
can be quantified only with low confidence; there are differential
sensitivities and thresholds between taxa and species (high confidence;
Section 6.3.2).
Expansion of oxygen minimum zones leads to community shifts clearly
attributable to extreme hypoxia (high confidence; Section 6.3.3). Gradual
effects of a progressive decline in ocean O
2
levels on communities have
not been sufficiently explored.
In general, community reassembly with new species coming in will occur
in the transition to future climates (medium confidence) and lead to
new ecosystem states (low confidence; Section 6.3.6). Climate change
interacts with top-down human interferences, such as fisheries or other
forms of harvesting, which accelerate impacts (medium confidence).
Nonlinearities challenge the projection of marine ecosystem trajectories
(FAQ 6.4).
In microbes, a conceptual foundation suitable to support an integrated
understanding of climate impacts on individual species and communities
is lacking. Specific physiological responses, such as in primary production,
N
2
fixation, or calcification, can be attributed to multiple environmental
drivers associated with climate change (high confidence; Sections 6.3.1-5).
6.4. Human Activities in Marine Ecosystems:
Adaptation Benefits and Threats
Human societies benefit from resources and processes supplied by marine
ecosystems, so-called ecosystem services. Attributing and projecting
Frequently Asked Questions
FAQ 6.4 | What changes in marine ecosystems are likely because of climate change?
There is general consensus among scientists that climate change significantly affects marine ecosystems and may
have profound impacts on future ocean biodiversity. Recent changes in the distribution of species as well as species
richness within some marine communities and the structure of those communities have been attributed to ocean
warming. Projected changes in physical and biogeochemical drivers such as temperature, CO
2
content and acidification,
oxygen levels, the availability of nutrients, and the amount of ocean covered by ice will affect marine life.
Overall, climate change will lead to large-scale shifts in the patterns of marine productivity, biodiversity, community
composition, and ecosystem structure. Regional extinction of species that are sensitive to climate change will lead
to a decrease in species richness. In particular, the impacts of climate change on vulnerable organisms such as warm-
water corals are expected to affect associated ecosystems, such as coral reef communities.
Ocean primary production of the phytoplankton at the base of the marine food chain is expected to change but
the global patterns of these changes are difficult to project. Existing projections suggest an increase in primary
production at high latitudes such as the Arctic and Southern Oceans (because the amount of sunlight available for
photosynthesis of phytoplankton goes up as the amount of water covered by ice decreases). Decreases are projected
for ocean primary production in the tropics and at mid-latitudes because of reduced nutrient supply. Alteration of
the biology, distribution, and seasonal activity of marine organisms will disturb food web interactions such as the
grazing of copepods (tiny crustaceans) on planktonic algae, another important foundational level of the marine
food chain. Increasing temperature, nutrient fluctuations, and human-induced eutrophication may support the
development of harmful algal blooms in coastal areas. Similar effects are expected in upwelling areas where wind
and currents bring colder and nutrient-rich water to the surface. Climate change may also cause shifts in the
distribution and abundance of pathogens such as those that cause cholera.
Most climate change scenarios foresee a shift or expansion of the ranges of many species of plankton, fish, and
invertebrates toward higher latitudes, by tens of kilometers per decade, contributing to changes in species richness
and altered community composition. Organisms less likely to shift to higher latitudes because they are more tolerant
of the direct effects of climate change or less mobile may also be affected because climate change will alter the
existing food webs on which they depend.
In polar areas, populations of species of invertebrates and fish adapted to colder waters may decline as they have
no place to go. Some of those species may face local extinction. Some species in semi-enclosed seas such as the
Wadden Sea and the Mediterranean Sea also face higher risk of local extinction because land boundaries around
those bodies of water will make it difficult for those species to move laterally to escape waters that may be too
warm.

452
Chapter 6 Ocean Systems
6
e
cosystem changes and their effects on human communities caused by
climate change including ocean acidification is challenging. Insufficient
observations compound an understanding of long-term changes and
the definition of baseline conditions. Some of the challenges are related
to the difficulty of projecting how human communities will adapt to
changing marine ecosystem benefits.
6.4.1. Ecosystem Services
Marine ecosystem services (e.g., Chapter 5) include products (food,
fuel, biochemical resources), climate regulation and biogeochemical
processes (CO
2
uptake, carbon storage, microbial water purification),
coastal protection, provision of space and waterways for maritime
transport, cultural services (recreational and spiritual opportunities,
aesthetic enjoyment), and functions supporting all other ecosystem
services (nutrient cycling, photosynthesis, habitat creation). Most
components of the marine environment contribute to more than one
major category of ecosystem service: for example, ocean primary
productivity is classified as a supporting service, but it affects provisioning
services via changes in fisheries, generation of fossil fuel resources,
regulating services via the global carbon cycle and climate regulation,
and cultural services via the enjoyment of a healthy ecosystem. Rarely
has economic damage of climate change to a whole ecosystem been
evaluated and projected. The projected loss of tropical reef cover due to
ocean acidification under SRES A1 and B2 scenarios will cause damages
of US$870 and 528 billion (year 2000 value) by 2100, respectively (cost
rising with parallel economic growth; Brander et al., 2012; see also Box
CC-OA). Such loss is felt most strongly in the respective regions.
6.4.1.1. Food from the Sea
Fisheries provide 3 billion people with almost 20% of their average per
capita intake of animal protein (FAO, 2012a), 400 million depend critically
on fish for their food (Garcia and Rosenberg, 2010). Total world marine
capture fisheries catches stabilized in the mid-1990s at about 90
milliontons per year. Marine aquaculture of primarily mollusks and
crustaceans contributes more than 63 million tons annually to seafood
production, mostly concentrated in coastal areas (FAO, 2012b). The growth
of aquaculture has decelerated, but is still considered a development
opportunity and a strong need in regions such as Africa and Latin America
(Section 7.4.2.2).
Climate-induced shifts in ecosystems and fisheries production will
create significant challenges to sustainability and management (Section
7.5.1.1.3), particularly for countries with fewer resources and lower
adaptive capacity, including many low-latitude and small island nations
(high confidence; Allison et al., 2009; Worm et al., 2009; Cooley et al.,
2012; see also Sections 7.2.1.2, 7.4.2.1, 30.6.2; WGIII AR5 Section 2.1).
Vulnerability will be exacerbated by increases in the frequency and
severity of extreme events (e.g., floods or storms) damaging infrastructure,
homes, health, livelihoods, or non-marine food security (Kovats et al.,
2003; Rosegrant and Cline, 2003; Adger et al., 2005; Haines et al., 2006).
The projected trends in fish stocks will widen the disparity in food
security between developing and developed nations. Fish migrations
d
ue to warming (Section 6.3.1) have already shifted the composition
of fisheries catches (Pinsky and Fogarty, 2012; Cheung et al., 2013a)
and altered stock distributions (Sabatés et al., 2006). Further warming
may be beneficial for fisheries productivity in some regions such as the
North Atlantic, because of the poleward shift of exploited species and
changes in primary productivity (Arnason, 2007; Stenevik and Sundby,
2007; Cheung et al., 2010; see also Box 6-1; Section 30.5.1.1.1), or for
some Pacific Islands due to the eastward redistribution of tuna stocks
(Lehodey, 2000; Lehodey et al., 2011). Resulting changes in accessibility
and fishing operations costs are projected to straddle economic zones,
perturb international fishery agreements, and cause excessive exploitation
(Hannesson, 2007; Sumaila et al., 2011; see also Sections 7.3.2.4, 7.4.2;
WGIII AR5 Section 4.3.7).
Invertebrate fisheries and aquaculture appear very vulnerable to the
impacts of ocean acidification (Barton et al., 2012; see also Box CC-OA;
Figure 6-10). This concerns especially shelled mollusks, with a substantial
decline in their global production projected between 2020 and 2060
under the SRES A2 business-as-usual scenario (Cooley and Doney, 2009;
Cooley et al., 2012). Effects on calcifying plankton will propagate
through the food web, making estimates of economic impact on fish catch
by OA difficult, also due to complex interactions with other stressors
like warming and fisheries management (Griffith et al., 2012; Branch et
al., 2013). Model projections suggest a potential loss of up to 13%
(SRES A1FI scenario) to annual total fishery value in the USA, or globally
more than US$100 billion annually by 2100 (Cooley and Doney, 2009;
Narita et al., 2012). Vulnerability differs highly between nations according
to the contribution of such fisheries to their economy (Cooley et al.,
2012; see also Sections 7.3.2.4, 7.4.2). These projections are sensitive
to the projected vulnerabilities of the organisms to ocean acidification
(medium confidence; Section 6.3.2).
Fishing reduces abundances at high trophic levels, but increases
abundances at mid-trophic levels. It reduces species numbers, simplifies
ecosystem structure, and increases ecosystem sensitivity to climate
change (Perry et al., 2010). Exploitation of fish stocks and the alteration of
their demography, population dynamics, and life history traits (Petitgas
et al., 2006; Perry et al., 2010; Planque et al., 2010) can reduce the
capacity of fish populations to buffer changes in climate variability
(Ottersen et al., 2006; Genner et al., 2010), and increase variability in
population size. Interactions between warming, OA, and human activities
such as fishing may thus exacerbate climate impacts on a wide range
of ocean processes and services, including marine fisheries (medium
confidence; Tables 6-4, 6-6; Section 30.6.2).
A 2°C global temperature increase by 2050 is estimated to cause
globallosses in landed value of US$17 to 41 billion annually (in 2005
value), with an estimated cost of adaptation for the fisheries of US$7
to 30 billion annually over a 40-year time frame between 2010 and
2050. The largest loss in landed value is projected to occur in East Asia
and the Pacific (low confidence;Sumaila and Cheung,2010). Overall
impacts and the regional manifestations will partially depend on the
flexibility and response capacities of food production systems (Elmqvist
et al., 2003; Planque et al., 2011a).
Specific implications for the fishing industry are still poorly known, as
future projections of shifts in primary production and knock-on effects

453
Ocean Systems Chapter 6
6
t
hrough food webs and into fisheries remain uncertain (low confidence
in effects of changing NPP; Planque et al., 2011b; Stock et al., 2011).
6.4.1.2. Other Provisioning Services
Reductions in marine biodiversity due to climate change and other
anthropogenic stressors (Tittensor et al., 2010), such as OA (CBD, 2009)
and pollution, might reduce the discovery of genetic resources from
marine species useful in pharmaceutical, aquaculture, agriculture, and
other industries (Arrieta et al., 2010), leading to a loss of option value
from marine ecosystems. Climate change increases the demand for
marine renewable energy such as wind and wave power, though with
potential ecosystem impacts of their infrastructure (Section 6.4.2).
6.4.1.3. Climate Regulation and Extreme Events
The effect of climate change on marine biota will alter their contribution
to climate regulation, that is, the maintenance of the chemical composition
and physical processes in the atmosphere and oceans (high confidence;
Beaumont et al., 2007). Regulatory mechanisms in which organisms
(especially phytoplankton) play a key role, include control of the level
of atmospheric CO
2
through the balance between photosynthesis and
respiration (Johnson et al., 2010), and through the biological and alkalinity
pump (Falkowski, 1997; Feely et al., 2008). They also include the
modulation of further greenhouse gases such as nitrous oxide (N
2
O;
Jin and Gruber, 2003; Law, 2008; see also Section 6.1.1.3), and the
modulation of other climatically reactive gases such as dimethylsulfide
(DMS; Vogt et al., 2008). A projected decrease in global ocean NPP
(Section 6.5.1) may result in decreased export of biogenic carbon to the
deep ocean (Bopp et al., 2002; Boyd and Doney, 2002; Hashioka and
Yamanaka, 2007). A positive feedback on climate change may result;
however, many of the factors controlling the pump are poorly understood
(Figure 6-4; WGI AR5 Chapter 6).
Coastal marine ecosystems reduce the effects of floods and storm
surges which account for most of the natural disasters affecting people
in coastal regions (IPCC, 2012a). Empirical and modeling studies show
that coral reefs contribute to buffering the impact of tsunamis (Fernando
et al., 2005; Gravelle and Mimura, 2008; see also Sections 5.4.2.4, 30.5;
Box CC-CR). Experiments and models indicate that warming and OA
slow coral growth by nearly 50% by 2050 (Box CC-CR; Section 5.4.2.4),
making some islands and coastal areas more vulnerable to tsunamis,
storm surges, wave energy, and coastal erosion (high confidence).
Wetlands and mangroves provide biologically diverse buffer zones
(Section 5.4.2.3). The combined impacts of climate change, pollution,
deoxygenation, and other overlapping stressors, on mangroves and
wetlands have not been determined (Cooley et al., 2009; Cooley, 2012).
Some of these stressors enhance each other’s effects in coastal systems
(Feely et al., 2010; Cai et al., 2011; Howarth et al., 2011).
6.4.1.4. Cultural Services
Cultural services encompass a wide array of services with marine
biodiversity as a core component supporting recreation and tourism as
t
he economically most relevant. Tropical coral reefs and their enormous
biodiversity sustain substantial tourist industries, presently with global
annual net benefits of about US$9.6 billion (Cesar et al., 2003; see also
Box CC-CR; Section 30.6.2.2). If reef services degrade, coastal visitors
might choose alternative attractions (UNWTO, 2008). Increased travel
to see disappearing ecosystem types (e.g., Antarctica: Liggett et al.,
2011) or in previously inhospitable areas or seasons (Amelung et al.,
2007; Moore, 2010) create new pressures and are unsustainable as the
locations of key attractors shift (e.g., cetaceans: Lambert et al., 2010;
Salvadeo et al., 2013).
Climate change may endanger harvests of marine species with spiritual
and aesthetic importance to indigenous cultures, raising ethical
questions about cultural preservation (e.g., Nuttall, 1998). In coastal
communities, losing the aesthetic values of marine ecosystems may
harm local economies: better water quality and fewer harmful algal
blooms are related to higher shellfish landings and real estate prices
(Jin et al., 2008).
Some heritage benefits of preserving marine ecosystems consist of the
economic value of a healthy, diverse ecosystem to future generations.
Any climate-related biodiversity loss or pollution of marine ecosystems
would decrease the bank of resources for future opportunities. For
example, the research and conservation value of coral reef biodiversity
and its non-use value are estimated together at US$5.5 billion annually
(Cesar et al., 2003). As with spiritual and aesthetic benefits, maintaining
heritage benefits under climate change poses challenges for managers
concerning equity and ethics as well as multigenerational (and possibly
multi-cultural) ethical questions.
6.4.1.5. Supporting Services
Fully identifying the services supporting other ecosystem benefits is
virtually impossible, as they are diverse in nature and scale. Ecosystem
engineers play an important role in these services. Damage to calcifying
algae and corals will reduce habitat for other species (Section 6.3.5),
biodiversity, cultural and leisure values, and their climate regulation
capacity.
Waterways for shipping are expected to change in the next several
decades (very high confidence; Chapter 28; Section 30.6.2.3). Reductions
in Arctic sea ice allow new trade routes such as the Northwest Passage
(Wilson et al., 2004; Granier et al., 2006), enabling economically viable
trans-Arctic shipping, and access to regional resources for exploitation
and tourism. This development would increase emission of greenhouse
gases and other pollutants (Lauer et al., 2009; Corbett et al., 2010), and
facilitate the invasion of non-indigenous species carried on hulls and in
ballast waters (Lewis et al., 2004).
6.4.2. Management-Related Adaptations and Risks
6.4.2.1. Ecosystem Management
A changing climate will have both positive and negative consequences
for managing ocean resources (high confidence) (Eide and Heen, 2002;

454
Chapter 6 Ocean Systems
6
E
ide, 2007; see also Section 6.4.1). Ecosystem-based management
(EBM, an approach recognizing all, including human interactions,
within an ecosystem) or the ecosystem approach (EA, a strategy for the
integrated management of living resources promoting both conservation
and sustainable use) are increasingly adopted globally (FAO, 2003) to
deal with the multitude of human pressures on marine ecosystems
(Sherman et al., 2005; Hoel, 2009). Extended EBM addresses changes
driven by climate and human activities, considering that diverse drivers
will interact and confound each other (Planque et al., 2010; Eero et al.,
2011; see also Section 6.3.5). Human activities will undermine resilience
to other, including climate, impacts or undermine the effectiveness of
mitigation and adaptation measures, by increasing variability (thereby
reducing predictability), and limiting scope for adaptation (high confidence;
e.g., Hughes, 2004; Sissener and Bjørndal, 2005; Eero et al., 2011). Thus,
managing ecosystems under climate change increases the resilience of
ecosystems and adaptive capacity of management systems through
reducing other human perturbations (e.g., overfishing) (Brander, 2008;
see also Section 7.5.1.1.3). Managing ecosystems also reduces the
consequences of ocean acidification until CO
2
emission reduction becomes
effective (Rau et al., 2012; Billé et al., 2013; McLeod et al., 2013; see
also Box CC-OA). Ecosystem resilience is enhanced by reducing regional
eutrophication (Falkenberg et al., 2013), or in aquaculture by avoiding
acidified water (Barton et al., 2012) and by selecting and cultivating
pre-adapted strains (Parker et al., 2012).
However, effects of climate change cannot be reversed by reducing the
impacts of non-climatic drivers, emphasizing the need for adaptive
management. Increased variability of ecosystem responses to climate
change and the low predictability of some biological responses
undermine the effectiveness of management and conservation
measures. A particular risk is that climate change may contribute to
large-scale ecosystem regime shifts (Section 6.3.1.5; Box 6-1). Detecting
and forecasting such shifts from time series of environmental and
biological data (Carpenter and Brock, 2006; deYoung et al., 2008), is
constrained by an insufficient number of observations and limited
quantitative understanding (Section 6.1.2). Biogeographic shifts
challenge spatial management (Box CC-MB; Sections 6.3.1, 6.5), which
is a fundamental part of EBM (Douvere, 2008), and demand that “fixed
in law forever” site-attached zoning to protect specific species may
need to become more flexible to maintain the original objectives as
species move or community structures shift (high confidence; Soto,
2001; Hawkins, 2012).
6.4.2.2. Geoengineering Approaches
Geoengineering approaches to mitigate climate change and its effects,
include Solar Radiation Management (SRM) and Carbon Dioxide
Removal (CDR; see Table 6-5; IPCC, 2012b). SRM aims to reduce warming
by increasing albedo, for example, via stratospheric injection of sulfate
aerosol (Crutzen, 2006). SRM may affect marine ecosystems through
changes in precipitation. With continued CO
2
emissions it leaves ocean
acidification largely unabated as it cannot mitigate rising atmospheric
CO
2
concentrations (Vaughan and Lenton, 2011; Williamson and Turley,
2012). Termination of SRM after its implementation involves the risk of
rapid climate change and more severe effects on ecosystems (Russell
et al., 2012).
P
roposed CDR techniques include both ocean- and land-based
approaches (Vaughan and Lenton, 2011; see also Section 30.6.4). CO
2
storage in geological reservoirs may occur beneath the seafloor, for
example, in porous marine aquifers, and includes the risk of CO
2
leakage
to the marine environment. Proposals to directly or indirectly sequester
CO
2
into the ocean (Caldeira et al., 2005; Boyd, 2008; Shepherd et al.,
2009; see also Table 6-5; WGIII AR5 Section 7.5.5) include, among others,
the use of ocean fertilization techniques by nutrient addition, the direct
storage of biomass in the deep ocean, the addition of alkalinity for
build-up of dissolved inorganic carbon (DIC; i.e., carbonate), and the
direct CO
2
injection into the deep ocean (Williamson et al., 2012). All of
these approaches have potentially negative consequences for marine
ecosystems.
Ocean fertilization by adding iron to high-nutrient low-chlorophyll
(HNLC) oceanic waters could increase productivity and the net export of
organic material to the deep ocean and its consecutive decomposition,
causing deep-water accumulation of CO
2
. Fertilization would affect all
major marine biogeochemical cycles of the ocean with unclear side
effects that could include the formation of methane (CH
4
) and N
2
O (Law,
2008) or the stimulation of harmful algal blooms (Trick et al., 2010). The
enhanced NPP would add more carbon to the base of food webs (de
Baar et al., 2005) and stimulate growth, for example, of deep-sea benthos
(Wolff et al., 2011). Any regional increase in organic material (through
fertilization or intentional storage of biomass) would cause enhanced
O
2
demand and deep-water O
2
depletion (Sarmiento et al., 2010; Table
6-5), increasing the level and extent of hypoxia and associated impacts
on marine ecosystems (Sections 6.3.3, 6.3.5, 30.5.7). The synergistic
effects of CO
2
-induced acidification will exacerbate the biological
impacts (high confidence).
Neutralizing the acidifying water by the addition of alkalinity, for
example, calcium oxide, would require large-scale terrestrial mining
with associated consequences (Caldeira et al., 2005). The biological
effects of increased concentrations of Ca
2+
ions and dissolved inorganic
carbon remain insufficiently explored. Direct injection of CO
2
or its
localized disposal in the ocean (e.g., as a lake in a deep-sea valley)
causes locally highly increased CO
2
and acidification effects on deep-
sea organisms (high confidence; Caldeira et al., 2005; see also Section
6.3.3.4). In contrast to long-term ocean fertilization or storage of
biomass, this technique leaves the oxygen inventory of the deep ocean
untouched (limited evidence, medium agreement; Pörtner et al., 2005).
The knowledge base on the implementation of SRM and CDR techniques
and associated risks is presently insufficient. Comparative assessments
suggest that the main ocean-related geoengineering approaches are
very costly and have large environmental footprints (high confidence;
Boyd, 2008; Vaughan and Lenton, 2011; Russell et al., 2012).
6.4.2.3. Health Issues
Human health and near-shore ecosystems may be directly impacted by
climate change effects on harmful algal blooms (HABs; Edwards et al.,
2006; see also Section 30.6.3) or disease vectors. Planktonic time-series
archives and nearshore sediment cores containing HAB cysts have
revealed few examples of strong linkages between altered HABs and

455
Ocean Systems Chapter 6
6
climate fluctuations (Dale et al., 2006; see also Section 30.5.3.1.2). HABs
can be stimulated by warming, nutrient fluctuations in upwelling areas,
eutrophication in coastal areas, and enhanced surface stratification
(medium confidence). Species-specific responses involve shifts in seasonal
cycles and blooms (Johns et al., 2003). Ocean acidification may exacerbate
the toxicity of species in coastal oceans under nutrient-limited conditions
(Tatters et al., 2012; Sun et al., 2011). Suitable adaptation measures
include appropriate monitoring of biotoxin problems (Hallegraeff, 2010).
Continued warming of tropical and temperate coastal habitats, excessive
nutrient loading leading to phytoplankton and zooplankton blooms,
and sea water inundation due to sea level rise are all projected to
exacerbate the expansion and threat of cholera (medium confidence;
see also Sections 11.5.2.1, 30.6.3), although attribution to climate
change is confounded by climate variability and non-climate drivers
(Lafferty, 2009; Dobson, 2009).
Cholera and its pathogen, the marine bacterium, Vibrio cholera, have
been widely studied. The pathogen associates with marine organisms,
especially chitinized zooplankton (Vezzulli et al., 2010). Where cholera
is endemic (e.g., India, Bangladesh, Latin America), outbreaks correlate
with warming and high zooplankton abundance (Lobitz et al., 2000;
Lipp et al., 2002). Based on an 18-year climate record for Bangladesh,
Pascual et al. (2000) reported cholera outbreaks at ENSO events, and
the recent reappearance of cholera in Peru has also been linked to the
intense 1991–1992 ENSO (Lipp et al., 2002). An increase in sustained
maximum temperatures of the Baltic Sea (Section 30.5.3.1.4) has been
related to an increase in reported Vibrio infections; highest human
mortality rates were associated with V. vulnificus infections (Baker-
Austin et al., 2013). Continued warming of tropical and temperate
coastal habitats, excessive nutrient loading leading to phytoplankton
and zooplankton blooms, and seawater inundation due to sea level rise
are all projected to exacerbate the expansion and threat of cholera
(medium confidence).
Ciguatera poisoning may occur when people consume fish, mainly from
tropical reefs, that have ciguatoxins from the epiphytic dinoflagellate
Gambierdiscus sp. Historical records show significant correlations
between ciguatera poisoning and sea surface temperature in South
Pacific nations (Hales et al., 1999). However, the relationship is nonlinear
and dependent on the thermal window of the specific dinoflagellate
(Llewellyn, 2010). This casts doubt on the accuracy of projected increases
in ciguatera poisoning using linear extrapolations from observations
(low confidence).
Topic Brief description Challenge and impact References
Solar radiation management
t
echniques
Defl ection of approximately 1.8% of sunlight, by
v
arious techniques, is able to offset the global mean
t
emperature effects of a doubling of atmospheric CO
2
content from pre-industrial values.
Will leave ocean acidifi cation unabated (high
c
onfi dence). Response of primary production to light
r
eduction unclear.
Crutzen (2006); Caldeira and Wood (2008)
O
cean storage by direct
injection
C
apture of CO
2
post-combustion from mainly coastal
power plants, followed by injection of liquid CO
2
by
p
ipeline or from a ship into the deep ocean.
W
ill add to ocean acidifi cation and create localized
harm to marine life (high confi dence). Quantities will
b
e small relative to the atmospheric invasion signal.
CO
2
injected will dissolve and be transported by ocean
c
irculation with eventual surface exposure.
C
aldeira et al. (2005)
Sub-sea geologic storage Capture of CO
2
from extracted gas or from post-
combustion followed by well injection into a porous
s
ubmarine aquifer beneath impermeable geologic
strata.
Extensive experience in place from the Norwegian
Sleipner fi eld activity in the North Sea. No evidence of
o
cean impact from leakage to date.
Benson et al. (2005)
O
cean fertilization Spreading of trace amounts of reduced iron over very
large areas of the surface ocean where excess nutrients
o
ccur. Overcoming the local iron defi ciency creates
extensive phytoplankton blooms drawing down sea
surface pCO
2
. Fertilization can also be carried out
b
y using direct or indirect (ocean pipes) addition of
macronutrients to oceanic regions where they are
d
epleted.
M
uch of the exported organic matter is remineralized
at shallow depths, creating local oxygen stress and
s
hallow CO
2
enrichment and methane and N
2
O
production. These effects are temporary and the
effective retention time is short. If sustained, reduced
s
urface ocean and increased deep ocean acidifi cation.
O
2
loss in ocean interior (medium confi dence).
d
e Baar et al. (1995); de Baar et al. (2005);
Pörtner et al. (2005); Boyd et al. (2007);
B
uesseler et al. (2008); Law (2008); Cao
and Caldeira (2010)
Artifi cial upwelling or
d
ownwelling
Ocean fertilization by bringing nutrient rich deep water
(
from 200 to 1000 m) to the surface. Downwelling
occurs in parallel, transporting physically dissolved CO
2
into the deep ocean.
Deep water contains high levels of CO
2
, which if
r
eleased counteracts the binding of CO
2
by fertilization.
No evidence available.
Lovelock and Rapley (2007); Oschlies et
a
l. (2010)
S
equestration of organic
carbon
S
torage of terrestrial biomass in the coastal or deep
ocean.
P
hysical impact, regional loss of oxygen, CO
2
accumulation and acidifi cation during degradation;
increases in methane, N
2
O, and H
2
S. No evidence
available.
M
etzger and Benford (2001); Strand and
Benford (2009)
Carbonate neutralization Dissolution of power plant fl ue gas into sea water
yielding an acidic solution that is neutralized
by addition of crushed limestone. The resulting
bicarbonate-rich fl uid is discharged to the ocean.
Involves the transport and crushing to fi ne scale of
large quantities of limestone and the processing of very
large quantities of sea water. Environmental impact
issues not yet explored.
Rau (2011)
Accelerated olivine
weathering
Uses wind powered electrochemical processes to
remove HCl from the ocean and neutralizes the acid
with silicate minerals such as olivine for disposal. The
net result is to add alkalinity to the ocean akin to
natural silicate weathering processes.
Complex system as yet untested in pilot processes.
Involves mining and crushing large quantities of silicate
minerals. Very long time scale consequences uncertain.
House et al. (2007); Köhler et al. (2010)
Table 6-5 | Challenges for the oceans that will arise from the employment of a range of geoengineering methods (SRM = solar radiation management; CDR = carbon dioxide
removal).

456
Chapter 6 Ocean Systems
6
6.4.3. Conclusions
Human societies benefit from and depend on marine ecosystem services,
including the provisioning of food and other goods, regulation of climate
and extreme events, and cultural and supporting services (Section
6.4.1). Attributing and projecting climate-change-mediated shifts in
these services remains a challenge, due to the intrinsic difficulty of
assessments, lack of baseline and long time series data, and confounding
human impacts. However, empirical and modeling studies indicate that
climate change impacts on marine ecosystems lead to changes in
provisioning, regulating, and supporting services (high confidence), as
well as cultural services (limited evidence, medium agreement).
Food production from the sea is facing diverse stressors (Section 6.4.1.1),
such as overfishing and habitat degradation, which interact with climate
change phenomena, including warming (Section 6.3.1), ocean acidification
(Section 6.3.2), and hypoxia (Section 6.3.3). Projections of impacts on
capture fisheries are constrained by uncertainties in marine primary
production (medium evidence, medium agreement; Section 6.5.1).
Negative effects are projected to be most significant in developing
nations in tropical regions (high confidence). Nations at higher latitudes
may even benefit from climate change effects on ocean ecosystems, at
least initially (Section 6.5.3).
Climate change effects on biota will alter their climate regulation
through mechanisms such as carbonate production, the biological
pump, the balance between photosynthesis and respiration, and the
modulation of greenhouse gases (high confidence; Section 6.4.1.3).
However, projections of the direction and magnitudes of feedbacks are
at an early stage (low confidence).
Future management of ecosystems and fisheries might have to aim for
increasing ecosystem resilience to climate change, for example, through
reductions of other human perturbations (Section 6.4.2.1). Active ocean
geoengineering strategies to ameliorate climate change may prove
detrimental to the functioning of ecosystems, which highlights the need
for further research and careful governance (Section 6.4.2.2). There is
limited understanding of how harmful algal blooms and pathogens
affecting human health will respond to climate change (Section 6.4.2.3;
medium to low confidence).
6.5. Projections of Future Climate Change
Impacts through Modeling Approaches
A range of models explore climate change effects on marine biota, from
primary producers to higher trophic levels, and test hypotheses about
responses of marine species, food webs, and ecosystems (Rose et al.,
2010; Fulton et al., 2011; Stock et al., 2011; see also FAQ 6.2). Both
empirical and mechanistic approaches are used over a range of temporal
and spatial scales (Barange et al., 2010; Stock et al., 2011). There is an
increasing need for upscaling from molecular and physiological to
ecosystem level (e.g., Le Quesne and Pinnegar, 2012). Uncertainty in
projections of changes in marine ecosystems is partly contingent on the
level of confidence in climatic and oceanographic projections (Section
6.1.1; WGI AR5 Section 9.8). Models are currently useful for developing
scenarios of directional changes in net primary productivity, species
d
istributions, community structure, and trophic dynamics of marine
ecosystems, as well as their implications for ecosystem goods and services
under climate change. However, specific quantitative projections by
these models remain imprecise (low confidence; Hannah et al., 2010;
Rose et al., 2010; Stock et al., 2011; FAQ 6.4).
Earth System Models couple atmosphere, cryosphere, and hydrosphere
(including the oceans), as well as climate and carbon cycles, and project
changes in ocean biogeochemistry under a range of CO
2
emission scenarios
(WGI AR5 Chapter 6). Models focusing on population and species level
responses comprise models of population dynamics, models of species
distribution, and models which explicitly link effects of changes in ocean
physics and chemistry to changes in interactions between species at
different trophic levels, or human activities such as fishing and
aquaculture (Rose et al., 2010).
6.5.1. Oceanic Primary Production
Climate-induced effects on global ocean NPP comprise changes in its
long-term average, seasonal timing, and peak amplitude (Henson et al.,
2013). The magnitude, direction, and pattern of projected changes vary
with differences in model structure and parameterization (Box CC-PP;
Figure 6-13). Unknown accuracy of current NPP observations further
increases the uncertainty of projections, as does the incomplete
understanding of effects of multiple drivers on NPP (Sections 6.3.1-5,
6.4). Global coupled climate-ocean biogeochemical Earth System
Models (WGI AR5 Chapter 6) project an increase in NPP at high latitudes
but a decrease in permanently stratified oceans at mid-latitudes, in the
tropics (west tropical Pacific, tropical Indian Ocean, tropical Atlantic),
and in the North Atlantic (medium confidence; Steinacher et al., 2010;
Bopp et al., 2013) (Figure 6-13). The overall result is a reduction in global
mean NPP under all RCP scenarios (medium confidence in the direction
of projected trends, low confidence in the magnitude of change).
6.5.2. Higher Trophic Levels
Projected future changes in temperature and other physical and
chemical oceanographic factors are expected to affect the distribution
and abundance of marine fishes and invertebrates, as elaborated by
species distribution models. Limits of distribution ranges of 1066 exploited
species are projected to undergo shifts by a median of around 50 km
per decade to higher latitudes by 2050 relative to 2000 under the SRES
A1B (≈RCP6.0) scenario (Cheung et al., 2009). Some species shift
toward the equator following a regional temperature gradient (Burrows
et al., 2011; Cheung et al., 2013b; Pinsky et al., 2013). The rate of range
shifts is projected to be three times higher for pelagic than for demersal
fishes (Cheung et al., 2009), the latter shifting at a rate of around 27 to
36 km per decade (Cheung et al., 2013b). However, the expansion of
hypoxic waters may have a greater impact than warming on demersal
fishes (Koslow et al., 2011). As a result of distribution shifts, high-
latitude regions (the Arctic, Southern Ocean) are projected to have high
rates of species invasions. Intermediate latitudes are expected to undergo
both invasions and local extinctions. High rates of local extinction are
projected for the tropics and semi-enclosed seas (e.g., Mediterranean
Sea, Persian Gulf). In addition, the future productivity and distribution
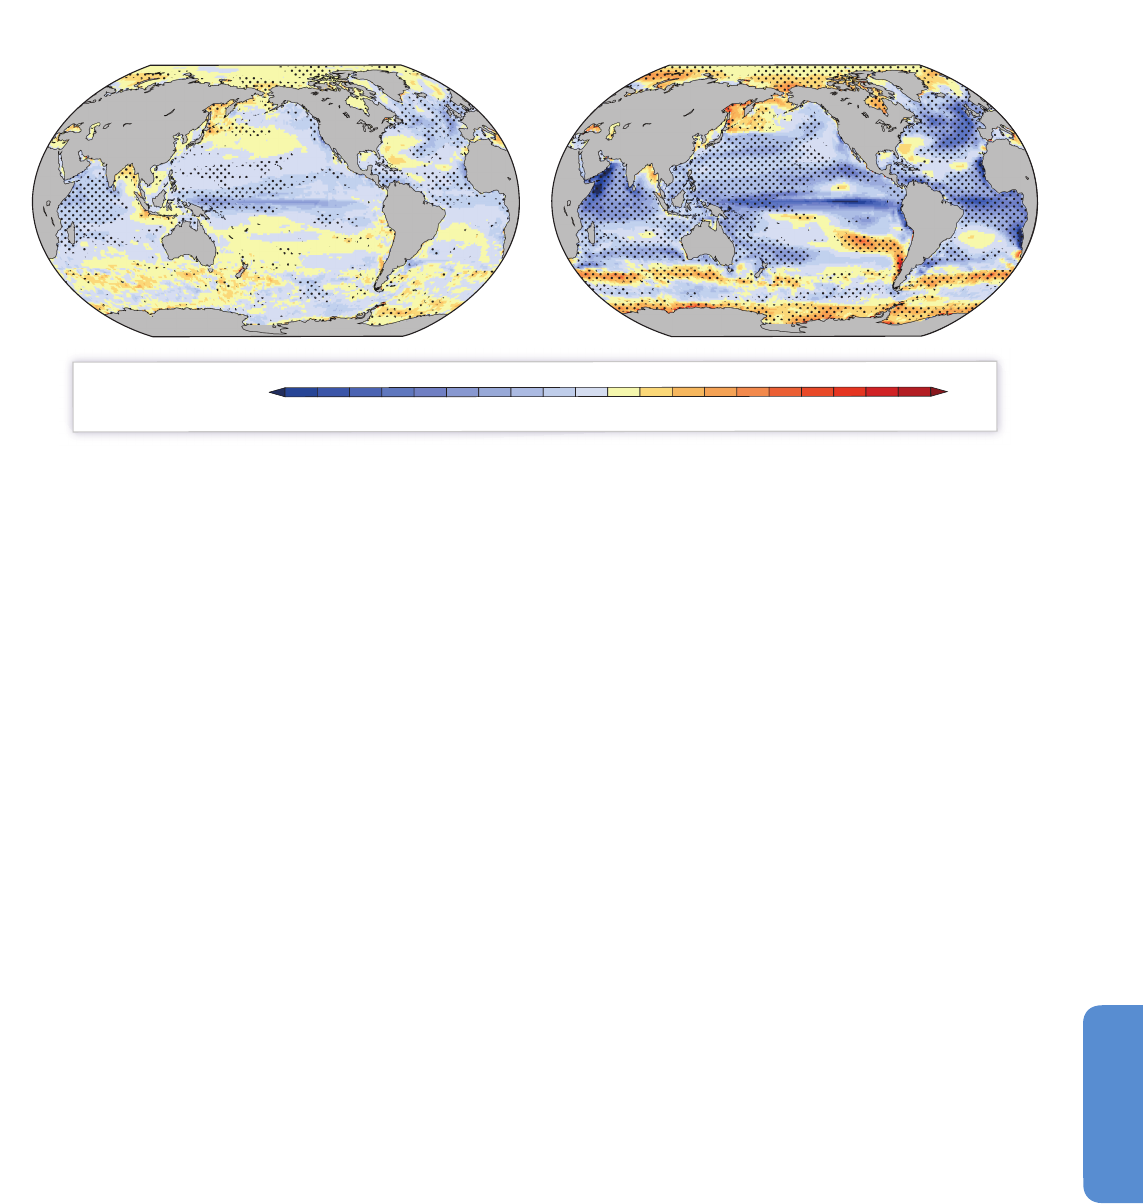
457
Ocean Systems Chapter 6
6
of higher trophic level organisms are projected to change due to changes
in primary productivity (Section 6.3.6). For example, the migration route
of Pacific sardine is projected to shift because of changes in primary
productivity and food availability (Ito et al., 2010). The global pattern
of distribution shifts is generally consistent with regional-scale projections
and past observations (e.g., Lenoir et al., 2011; Cheung et al., 2013a).
However, detailed quantitative projections are sensitive to model structure
and assumptions (Hare et al., 2012; Jones et al., 2013) and responses
of specific populations may differ from average species responses (Hazen
et al., 2013).
Coral reefs are projected to undergo long-term degradation by 2020 to
2100 relative to the 2000s under RCP2.6, 4.5, and 8.5 or their equivalents
(Section 30.5.6). Reefs projected to be threatened most by bleaching
under the SRES A1B scenario by 2100 include the Central and Western
Equatorial Pacific, Coral Triangle, and parts of Micronesia and Melanesia
(Teneva et al., 2012). These projections assume that coral bleaching
occurs when SST exceeds a certain threshold, and that there is limited
potential to shift such threshold by adaptation. Reef degradation will
impact ecosystem services (Hoegh-Guldberg, 2011; see also Section 6.4;
Box CC-CR).
Some groups of marine air-breathing fauna are projected to shift in
distribution and abundance (Section 6.3.7). Cetacean richness will
increase above 40° latitude in both hemispheres, while at lower latitudes
both pinniped and cetacean richness are projected to decrease by 2040–
2049 relative to 1990–1999 under the SRES A1B scenario (Kaschner et
al., 2011). Using SST as a predictor, the distribution of loggerhead turtles
is projected to expand poleward in the Atlantic Ocean and to gain habitat
in the Mediterranean Sea by 2070–2089 relative to 1970–1989 (Witt
et al., 2010). Leatherback turtle may decrease in abundance at a rate
of 7% per decade because of reduced hatching success with warming
following the SRES A2 scenario (Saba et al., 2012). Abundances of some
seabirds such as European breeding seabirds (Huntley et al., 2007),
Cassin’s auklet in the California Current Ecosystem, or emperor penguin
in Antarctica are projected to decline because of climate-induced changes
in oceanographic conditions, such as temperature and upwelling intensity
(Wolf et al., 2010; see also Box CC-UP), or summer sea ice conditions
(Jenouvrier et al., 2012). The diversity of megafaunal responses to climate
change will have cascading ecosystem impacts, and will affect ecosystem
services such as tourism (high confidence; Sections 6.3.7, 6.4.1).
6.5.3. Ecosystems and Fisheries
One of the most direct impacts of climate change on marine ecosystem
services is through fisheries (Sections 6.4.1, 7.2.1.2, 7.3.2.4, 7.4.2).
Projected climate impacts on fisheries are based on recruitment, growth,
mortality, abundance, and distribution of fish stocks as well as changes in
ocean NPP (Cheung et al., 2008), evaluated from chlorophyll concentration
and other variables such as sea surface temperature (Campbell et al.,
2002). Friedland et al. (2012) suggested thatchlorophyll concentration,
indicating both phytoplankton production and biomass, is a better
predictor of the fishery yield in large marine ecosystems than NPP. While
the principle holds that catch potential is dependent on energy from
primary production, quantitative projections of catch potential are
limited by residual uncertainty on the best possible indicators of primary
production and biomass.
Assuming that the potential fish catch is proportional to NPP, the fish
catch in the North Pacific Ocean subtropical biome is projected to
increase by 26% through expansion of the biome, while catches in
the temperate and equatorial biomes may decrease by 38 and 15%,
respectively, through contraction of the biomesby 2100 relative to 2000
under the SRES A2 (RCP6.0 to 8.5) scenario (Polovina et al., 2011).
Changes in phytoplankton size structure are projected to affect fisheries
catch potential (Cheung et al., 2011), resulting in a 0 up to 75.8%
decrease in the potential catch of large fishes in the central North Pacific
∆
P
P
(g
C
m
−
2
=
yea
r
−
1
)
2
0
0
1
8
0
1
6
0
1
4
0
1
2
0
1
0
0
8
0
6
0
4
0
2
0
0
−
2
0
−
4
0
−
6
0
−
8
0
−
1
0
0
−
1
2
0
−
1
4
0
−
1
6
0
−
1
8
0
−
2
0
0
RCP
2
.
6
RCP
8
.
5
(a) (b
)
Fi
g
u
r
e
6
-
1
3
|
M
ult
i-mo
de
l
annual
me
an
c
hange
s
o
f
pr
o
je
c
t
e
d
ve
r
t
ic
ally
int
e
gr
at
e
d
ne
t
pr
imar
y
pr
o
duc
t
io
n
(sma
ll
and
lar
ge
phy
t
o
plank
t
o
n)
unde
r
t
he
lo
w-e
missio
n
sc
e
nar
io
Re
pr
e
se
nt
a
t
ive
C
o
nc
e
nt
r
at
io
n
P
at
hw
ay
2.
6
(RC
P2.
6)
(a
)
and
t
he
high-e
missio
n
sc
e
nar
io
RC
P8.
5
(b)
fo
r
t
he
pe
r
io
d
2090
t
o
2099
r
e
l
at
ive
t
o
1990
t
o
1999
(aft
e
r
Bo
pp
e
t
al
.
,
2
013
)
.
To
indic
at
e
c
o
nsist
e
ncy
in
t
he
sign
o
f
cha
nge,
r
e
gio
n
s
a
r
e
st
ipple
d
whe
r
e
80%
o
f
t
he
10
mo
de
ls
fr
o
m
t
he
C
o
uple
d
M
o
d
e
l
I
nt
e
r
c
o
mpa
r
iso
n
Pr
o
je
c
t
Pha
se
5
(Bo
pp
e
t
a
l
.
2013)
agr
e
e
o
n
t
he
sign
o
f
c
ha
nge.
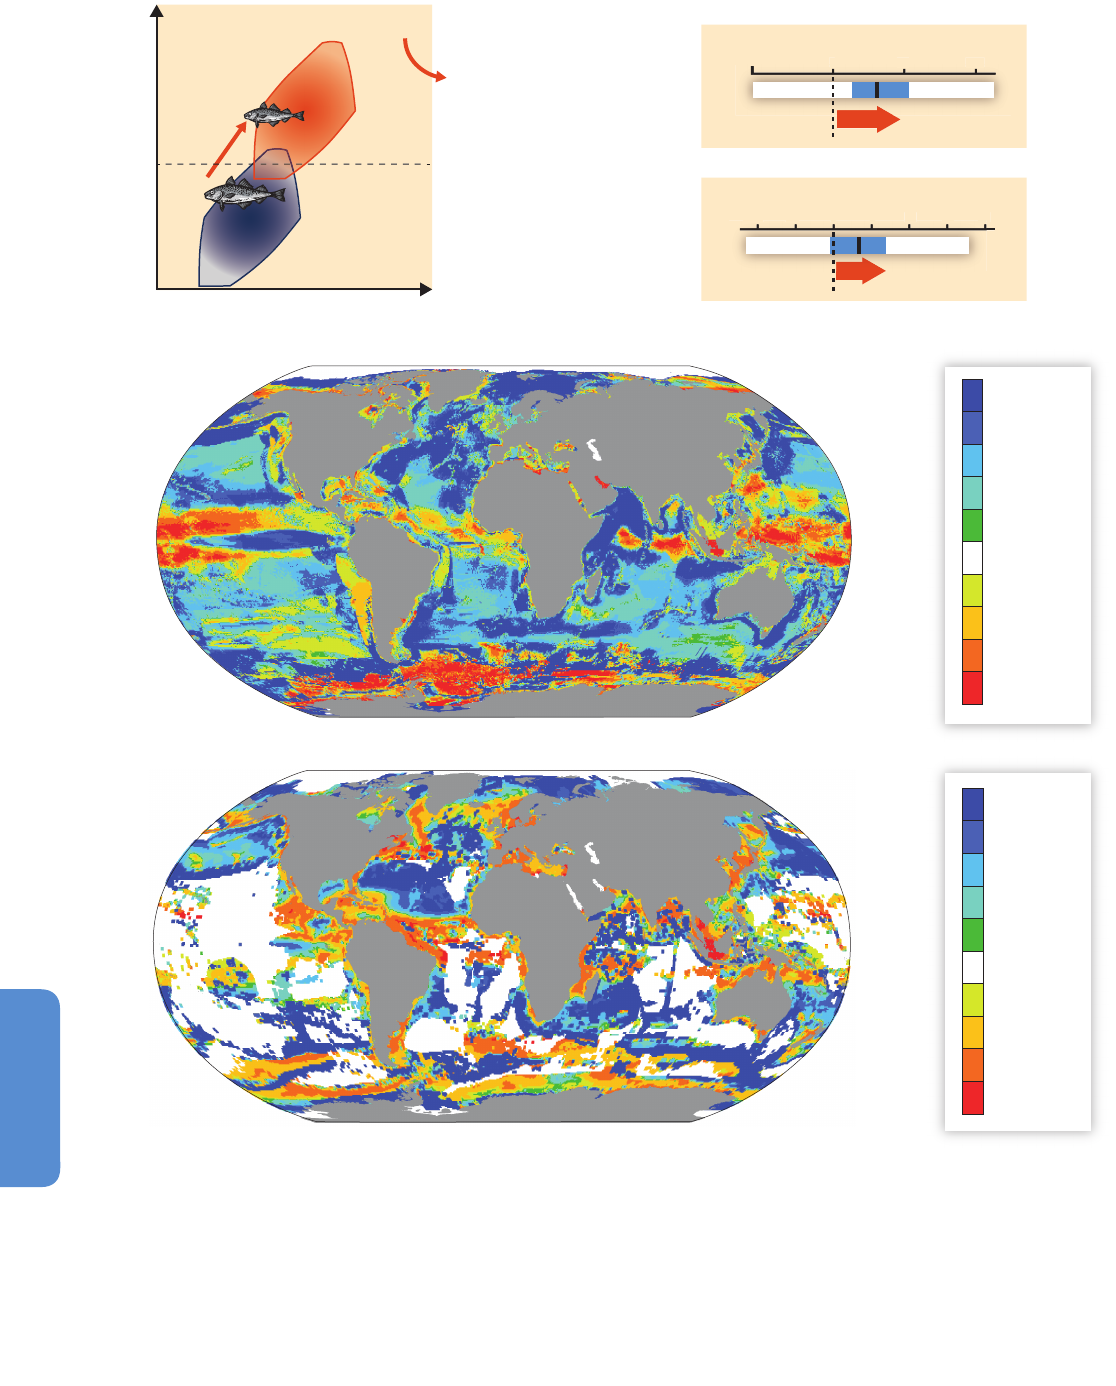
458
Chapter 6 Ocean Systems
6
Latitude
Depth
C
limate-dependent distribution
Local
e
xtinctions
Original distribution
0
(
a) (b)
(
d)
(
c)
Change in maximum body weight
Country A
C
ountry B
(e)
Invasion
R
e
d
u
c
t
i
o
n
i
n
b
o
d
y
s
i
z
e
C
hange in:
-
catch potential (d)
- body size/weight (e)
P
oleward
100
−
50
500
km per decade
S
hifting distribution to cooler water
> 50%
< –50%
−50 to −31%
−30 to −16%
−15 to −1%
16 to 30%
31 to 50%
1 to 15%
no data
0%
>
100%
< –50%
−50 to −21%
−20 to −6%
−5 to −1%
20 to 49%
5
0 to 100%
5 to 19%
0 to 4%
no data
P
l
d
100
50
0
D
eeper
2
00 5 10 15−10 −5
m per decade
D
eep
p
er
2
0
0
5
1
0
1
5
1
0
5
Change in maximum catch potential
Figure 6-14 | Climate change effects on the biogeography, body size, and fisheries’ catch potential of marine fishes and invertebrates. (a) Shifts in distribution range and
reduction in body size of exploited fish driven by projected warming, oxygen depletion, and sea ice retreat (cf. Figure 6-7). Whenever the shift in distribution does not fully
compensate for warming and hypoxia, the result will be a decrease in body size. Shifts in (b) latitudinal and (c) depth distribution of 610 exploited demersal fishes are projected
to have a median (central line of the box) of 31 km per decade and 3.3 m per decade, respectively, with variation between species (box boundary: 25th and 75th percentiles)
from 1991–2010 to 2041–2060 under the SRES A2 (between RCP6.0 and 8.5) scenario (Cheung et al., 2011, 2013b). (d) Combining species’ range shifts with projected changes
in net primary production leads to a projected global redistribution of maximum catch potential. (Analysis includes approximately 1000 species of exploited fishes and
invertebrates, under warming by 2°C according to SRES A1B (≈RCP6.0), comparing the 10-year averages 2001–2010 and 2051–2060; redrawn from Cheung et al., 2010.). (e)
Changes in species distribution and individual growth are projected to lead to reduced maximum body size of fish communities at a certain site. The analysis includes 610 species
of marine fishes, from 1991–2010 to 2041–2060 under SRES A2 (approximately RCP6.0 to 8.5; Cheung et al., 2013b), without analysis of potential impacts of overfishing or
ocean acidification. Key assumptions of the projections are that current distribution ranges reflect the preferences and tolerances of species for temperature and other environ-
mental conditions and that these preferences and tolerances do not change over time. Catch potential is determined by species range and net primary production. Growth and
maximum body size of fishes are a function of temperature and ambient oxygen level.

459
Ocean Systems Chapter 6
6
a
nd increases of up to 43% in the California Current region over the
21st century under the SRES A2 scenario (Woodworth-Jefcoats et al.,
2013). Globally, climate change is projected to cause a large-scale
redistribution of global catch potential, with an average 30 to 70%
increase in yield at high latitudes and up to 89% in some regions, after
2°C warming from preindustrial periods following SRES A1B (≈RCP6.0)
(Cheung et al., 2010; Blanchard et al., 2012; see also Figure 6-14).
Redistribution between areas, with average catch potential remaining
unchanged, will occur at mid latitudes. A 40 to 60% drop will occur in
the tropics and in Antarctica by the 2050s relative to the 2000s (medium
confidence for direction of trends in fisheries yields, low confidence for
the magnitude of change). This highlights high vulnerabilities in the
economies of tropical coastal countries (Allison et al., 2009; see also
Section 6.4).
Fisheries targeting specific species may show more complex responses
to climate change. For example, driven by changes in temperature and
primary production, catches of skipjack and bigeye tuna in the south
Pacific are projected to increase by 2035 relative to 1980–2000 under
the SRES B1 and A2 scenario, but for 2100, skipjack tuna catch is
projected to decrease under the A2 scenario, while bigyeye tuna catch
decreases under both A2 and B1 scenarios (Lehodey et al., 2011).
Regionally, tuna catches in the Western Pacific are projected to decrease,
while those in the Eastern Pacific will increase (Lehodey et al., 2011).
Mollusk fisheries under ocean acidification is discussed under Section
6.4.1.
Identifying responses to climate change is complicated by species
interactions and multiple stressors. Major marine habitats and biodiversity
hotspots are projected to encounter cumulative impact from changes
in temperature, pH, oxygen, and primary productivity by the end of the
21st century (RCP4.5 and 8.5) (Mora et al., 2013). Acidification and
hypoxia will reduce maximum catch potential over 50 years from about
2000 onward in both the North Atlantic and Northeast Pacific
(Ainsworth et al., 2011; Cheung et al., 2011). Changes in O
2
content as
well as warming will drive a global decrease of community-averaged
maximum body size of 14 to 24% of exploited demersal marine fishes
by 2050 relative to the 2000s under the SRES A2 (RCP6.0 to 8.5)
scenario (Cheunget al., 2013b; see also Figure 6-14). The decrease in
maximum body size may affect natural mortality rates and trophic
interactions, and reduce yield-per-recruit and thus potential catch.
Responses of exploited marine species and their fisheries may interact
with other human stressors such as overfishing, exacerbating their
impacts (e.g., Lindegren et al., 2010; Ainsworth et al., 2011). Through
species shifts climate change may also cause overlap of habitats of
species targeted by fishing with habitat of threatened species, potentially
increasing the chances of the latter of being caught as bycatch (Jones
et al., 2013). Moreover, differences in vulnerability and adaptive capacity
of species to changing environmental and ecosystem conditions will
affect the responses of fisheries to climate change (e.g., Le Borgne et
al., 2011; Griffith et al., 2011).
The complex and nonlinear interactions and responses of both biophysical
and socioeconomic systems to climate change may lead to changes that
have a low probability of occurrence based on empirical data (Doak et
al., 2008). The risk of such low-probability but potentially high-impact
events may be underestimated in existing model projections (Williams
a
nd Jackson, 2007; Lindenmayer et al., 2010). Projected changes in the
distribution and production potential of fisheries resources are expected
to affect economics, human livelihood, and food security (Allison et al.,
2009; Sumaila and Cheung, 2010; low confidence in the magnitude and
direction of the projected socioeconomic impacts).
6
.5.4. Conclusions
Modeling projects that the distribution of invertebrates, fishes, and
some marine mammals, birds, and reptiles will shift further under most
emission scenarios, with rates and directions of shifts consistent with
those observed in the last century (high confidence; Sections 6.3.1-7).
These projections are valid for those species that adapt not at all or
incompletely to warmer temperatures and the associated ecosystem
changes, as indicated by present trends (Section 6.3.1; Box CC-MB). For
non-adapting species rates of shift will thus increase with increasing
rates of warming and higher emission scenarios (high confidence),
unless the shift is blocked by geographic or other barriers (e.g., light
regime; Figure 6-7). The average shift in distribution will continue to be
poleward at large spatial scales (high confidence; Section 6.5.2; Box
CC-MB). Species richness and the abundance of warm-water species
will increase at high latitudes (high confidence) and decrease in the
tropics (medium confidence; Section 6.5.2). Projections for individual
species and populations are more variable and sensitive to model
parameters.
Maximum fisheries catch potential is projected to increase at high
and decrease at low latitudes by 2050 under SRES B1 (≈RCP4.5) and
A1B (≈RCP6.0) climate scenarios (medium confidence; Section 6.5.3).
Quantifying such projections is constrained by uncertainties in projected
primary production rates (Sections 6.3.4, 6.5.1), biological responses
such as species interactions (Section 6.3.6), and in projected effects of
multiple climate drivers and human activities (low confidence; Section
6.3.5).
Models that integrate climate and ocean changes with biological
responses and interactions, and with current human activities, have led
to agreement on species and food web responses to climate change
(Section 6.5.3). However, most of these models do not include trophic
interactions. They insufficiently consider physiological principles and
none include evolutionary adaptations that affect responses of biota to
physical and chemical changes.
Projections of ocean biogeochemistry represent the open oceans rather
well, but coastal and shelf regions only poorly. From a global perspective,
open ocean NPP will decrease moderately by 2100 under both medium
(SRES B1 or RCP4.5) and high emission scenarios (medium confidence;
A2 or RCP6.0 to 8.5; Sections 6.3.4, 6.5.1), paralleled by an increase in
NPP at high latitudes and a decrease in the tropics (medium confidence;
Sections 6.3.4, 6.5.1; Box CC-PP).
Overall, the projected responses of marine organisms and ecosystems
to climate change include changes in primary productivity (medium
confidence), species’ life history (medium confidence), distribution,
abundance, and diversity across marine food webs (high confidence) in
a time frame of 20 to 80 years from 2010, with substantially larger
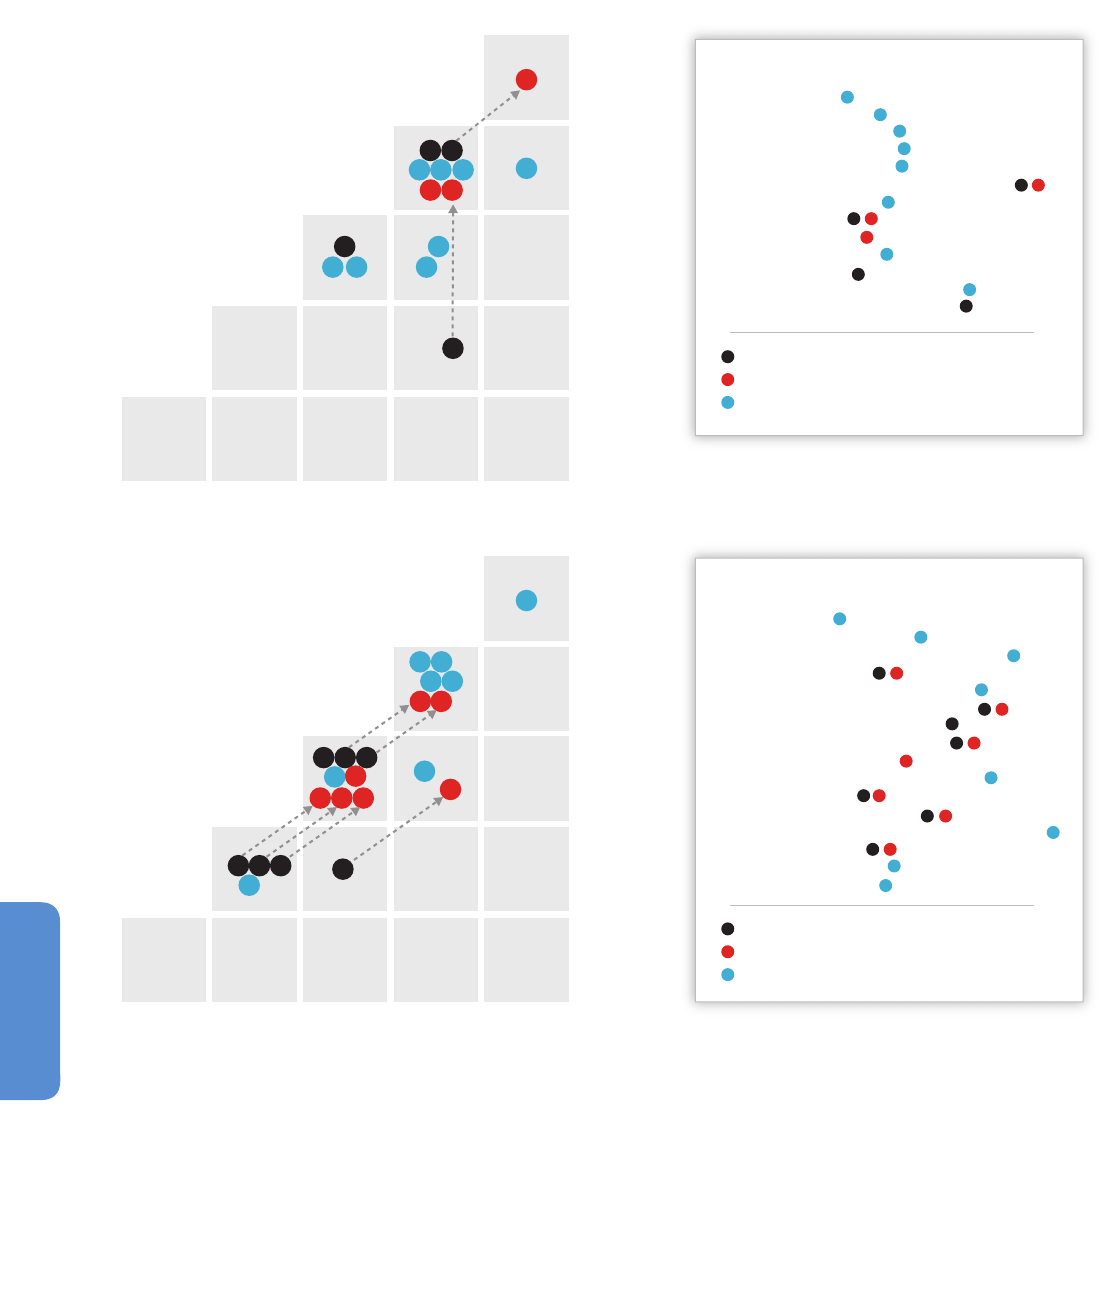
460
Chapter 6 Ocean Systems
6
l
ong-term (end of 21st century) responses under high emission scenarios
(high confidence). These changes will be largest under business-as-usual
scenarios (RCP8.5) and increase the vulnerability of human societies,
b
y affecting income, employment, and food security through their
effects on fisheries, tourism, and regulatory services such as coastal
protection (medium confidence; Section 6.4.1.3; Box CC-CR).
d
b
a
e
f
gj
l
m
k
h
c
h
f
i
c
d
a
b
e
A
tlantic Cod (AC)
Sardines and Anchovies, Japan Sea (SAJ)
Pacific Salmon (PS)
E
elpout, Wadden Sea (EWS)
B
anded Morwong (BM)
f
M
arine Air Breathers (MAB)
g
M
acroorganism Effects (MAE, animals and plants)
l
k
P
lankton Phenology (PP)
j
P
olar Organisms (PO)
i
R
eef-building Warm Water Corals (RWC)
M
id-water Fishes (MWF)
m
O
yster Effects (EO)h
C
alcifying Organisms (CAL)
10 11
1
15
14
6
9
13
12
2
3
5a
7
4
5b
13
4
75b
1110
8
Low Very low Low Medium
Confidence in attribution
High
Very high
Very low Low Medium
Confidence in detection and/or projection
High Very high
Very low
Medium
Confidence in attribution
High Very high
Very low Low Medium
Confidence in detection and/or projection
High Very high
Detection
Projection
Detection and projection have the same levels of confidence
10
2
5a
14
12
9
7
6
15
13
11
8
3
1
Oxygen and Capacity Limited Thermal Tolerance (OCLTT)
Geological Record (GR, observations)
Global Net Primary Production (gNPP)
Synergistic Effects (SE)
Fishery Catch Potential (FCP, species shifts)
Community Composition (CC, under TE, HE, OAE)
Biogeochemical Processes (BG)
Abundance (AB)
Ocean Acidification Effects (OAE)
High-latitude Net Primary Production (hNPP)
Hypoxia Effects (HE)
Temperature Effects (TE)
Species Richness (SR, Fish)
Specific examples
Broad categories
4 Ecosystem Services (ES)
5b Fishery Catch Potential (FCP, changing NPP)
Harmful Algae Blooms (HAB)
Detection
Projection
Detection and projection have the same levels of confidence
Figure 6-15 | Overview of the levels of confidence in detection, as well as in projection, of climate change effects on ocean systems, in relation to the levels of confidence in
attributing these effects to the respective climate forcings. Case studies, processes, and concepts relevant in assessing the effects of climate change are represented by their
acronyms in both text and figure. While confidence in the presence of effects is often high, the direct attribution to one driver in field experiments is difficult, as drivers are often
highly correlated with each other (e.g., warming with changes in stratification, hence reduced nutrient supply). Some climate change impacts have been condensed into broad
categories to avoid overpopulating the figures (e.g., Bio-Geochemical processes, BG). Note that the term “attribution” is used for both present-day detections in the field and
future projections, the latter including qualitative and quantitative extrapolations and simulations of future conditions from fundamental principles, experiments, and models. Firm
knowledge from experiments (field, laboratory, and modeling) simulating future conditions enhances the respective confidence levels to those for detection or projection. The
empirical observations resulting from those experiments are directly attributable to the respective drivers. Confidence in attribution is enhanced if these experiments identify the
underlying mechanisms and their responses. See text for the discussion of depicted examples and categories. Confidence assignments focus on the nature and size of effects, not
on model capacity to quantify their magnitude reliably.

461
Ocean Systems Chapter 6
6
6.6. Chapter Conclusions and Key Uncertainties
This section provides an overview of confidence levels in the detection
and projection of climate change effects on ocean systems, and of
c
onfidence levels in their attribution to different forcings. It distinguishes
between effects previously observed and those projected, and considers
confidence in the knowledge of underlying principles as discussed in
this chapter. While the anthropogenic signal is conspicuous in the oceans
(Section 6.1.1), clear attribution to anthropogenic influences on climate
is not always possible in individual case studies, owing to the inherent
variability of the system (Figure 6-15; acronyms of relevant processes,
capitalized, link between text and figure).
Present-day observations and those from the Geological Record (GR;
Figure 6-15) show similar signs of response to environmental changes, for
example, warming at high CO
2
levels, and similar ecological consequences
in the ocean (robust evidence, medium agreement; medium confidence).
However, the ongoing rate of anthropogenic CO
2
release and hence
ocean acidification is unprecedented in the last 65 Ma (high confidence)
and probably the last 300 Ma (Section 6.1.2).
6.6.1. Key Risks Related to Climate Change:
Constraints on Ecosystem Services
Empirical studies provide evidence that climate change has impacted
marine ecosystems (high confidence; FAQ 6.4; Table 6-6) and has caused
changes in provisioning, regulating, and supportive Ecosystem Services
(ES; medium confidence). Climate change may also have affected cultural
services (limited evidence, medium agreement) but attribution of
impacts to these services remains a challenge (low confidence), owing
to the intrinsic difficulties of assessing these services, the lack of long
time-series data, and confounding human impacts. In light of available
understanding of cause and effect of climate change impacts on marine
ecosystems (high confidence), future climate change will affect some
ecosystem services (high confidence in projection, medium confidence in
attribution). Projected changes in the availability of marine resources and
ecosystem services are expected to affect economics, human livelihood,
and food security. Vulnerability is highest for the national economies of
tropical coastal countries (high confidence).
6.6.1.1. Redistribution and Constraints on
Microbial Functions and Primary Productivity
Laboratory and mesocosm studies have identified various microbially
mediated processes responding to climate-induced changes in light,
nutrient supply, temperature, CO
2
, and hypoxia (high confidence). Such
processes include nitrogen fixation and the nitrogen cycle, carbon
sequestration and export production, calcification, respiration, O
2
production, climate-feedback by dimethylsulfide (DMS) production, and
nutrient recycling. However, changes in these Bio-Geochemical processes
(BG) in the field are difficult to detect, project, and attribute to climate
change (low confidence; Sections 6.3.1-5).
The trends in net primary production recently reported for much of the
low-latitude ocean using satellite observations differ considerably from
t
hose few long-term direct estimates of NPP at oceanic time series sites
(Sections 6.1.2, 6.3.4). Increased NPP at high latitudes (hNPP, detected
and attributable to climate change with medium confidence; Section
6.3.4; Box CC-PP) are indicated by satellite images (medium confidence)
and due to reduction and thinning of sea ice. Trends in NPP will be
strengthened with further warming (medium confidence). Modeling
projects that global NPP (gNPP) will decrease by 2100 under RCP
scenarios (medium confidence; Section 6.5.1; Box CC-PP).
6.6.1.2. Warming-Induced Species Redistribution,
Loss of Biodiversity, and Fisheries Catch Potential
Long-term observations show variability in oceanographic conditions
with a key role of temperature and changing oceanographic regimes
causing observed changes in ecosystem structure and fish stocks (very
high confidence; cf. Section 30.7.1.1). Temperature Effects (TE) reflect the
differential specialization of all life forms in limited ambient temperature
ranges (very high confidence). Temperature exerts strong MAcroorganism
Effects (MAE), that is, on animals and plants. Warming is presently
causing and will cause species displacements and largely poleward
shifts in biogeographic distribution of zooplankton and fishes, paralleled
by altered seasonal activity, species abundance, migration, and body
size (high to very high confidence; Section 6.3.1), and leading to shifts
in Community Composition (CC; high confidence; Box 6-1). Causes and
effects are understood for fishes and most invertebrates via their
Oxygen and Capacity Limited Thermal Tolerance (OCLTT; robust
evidence, medium agreement; high confidence; Section 6.3.1). Such
knowledge supports projections into the future (high confidence;
Section 6.5), which are influenced by the limited potential of organisms
to adapt. Alterations in species ABundance (AB) result when organisms
encounter shifting mean and extreme temperatures (high confidence
in detection and attribution). Such trends will be exacerbated during
future warming (high confidence; Section 6.5.1).
Among prominent examples, warming has caused and will cause
northward shift and expansion of the geographic distribution of North
Atlantic Cod (AC; high confidence in detection or projection, medium
confidence in detection or projection and attribution; Section 6.3.1) and
shifting growth patterns in relation to the distribution of Banded
Morwong around New Zealand (BM; high confidence in detection or
projection, medium confidence in detection or projection and attribution).
Warming has shifted dominant species from Sardines to Anchovies in the
Sea of Japan (SAJ; medium confidence in detection, medium confidence
in detection and attribution; Sections 6.3.1, 6.3.6). Warming extremes
have reduced and will further reduce the abundance of Eelpout in the
Wadden Sea (EWS; high confidence in detection or projection, high
confidence in detection or projection and attribution; Section 6.3.1).
Extreme warming events increase mortalities of Pacific Salmon during
spawning migrations (PS; high confidence in detection, high confidence
in detection and attribution; Section 6.3.1) in Fraser River, Canada. At
temperate and high latitudes, communities display increasing fish Species
Richness (SR) resulting from latitudinal shifts of species and attributed
to warming and loss of sea ice, although the relative contributions of
regional climate variation and long-term global trends have not been
quantified (high confidence in detection, medium confidence in detection
and attribution; Sections 6.3.1, 6.5.2). Latitudinal species shifts are
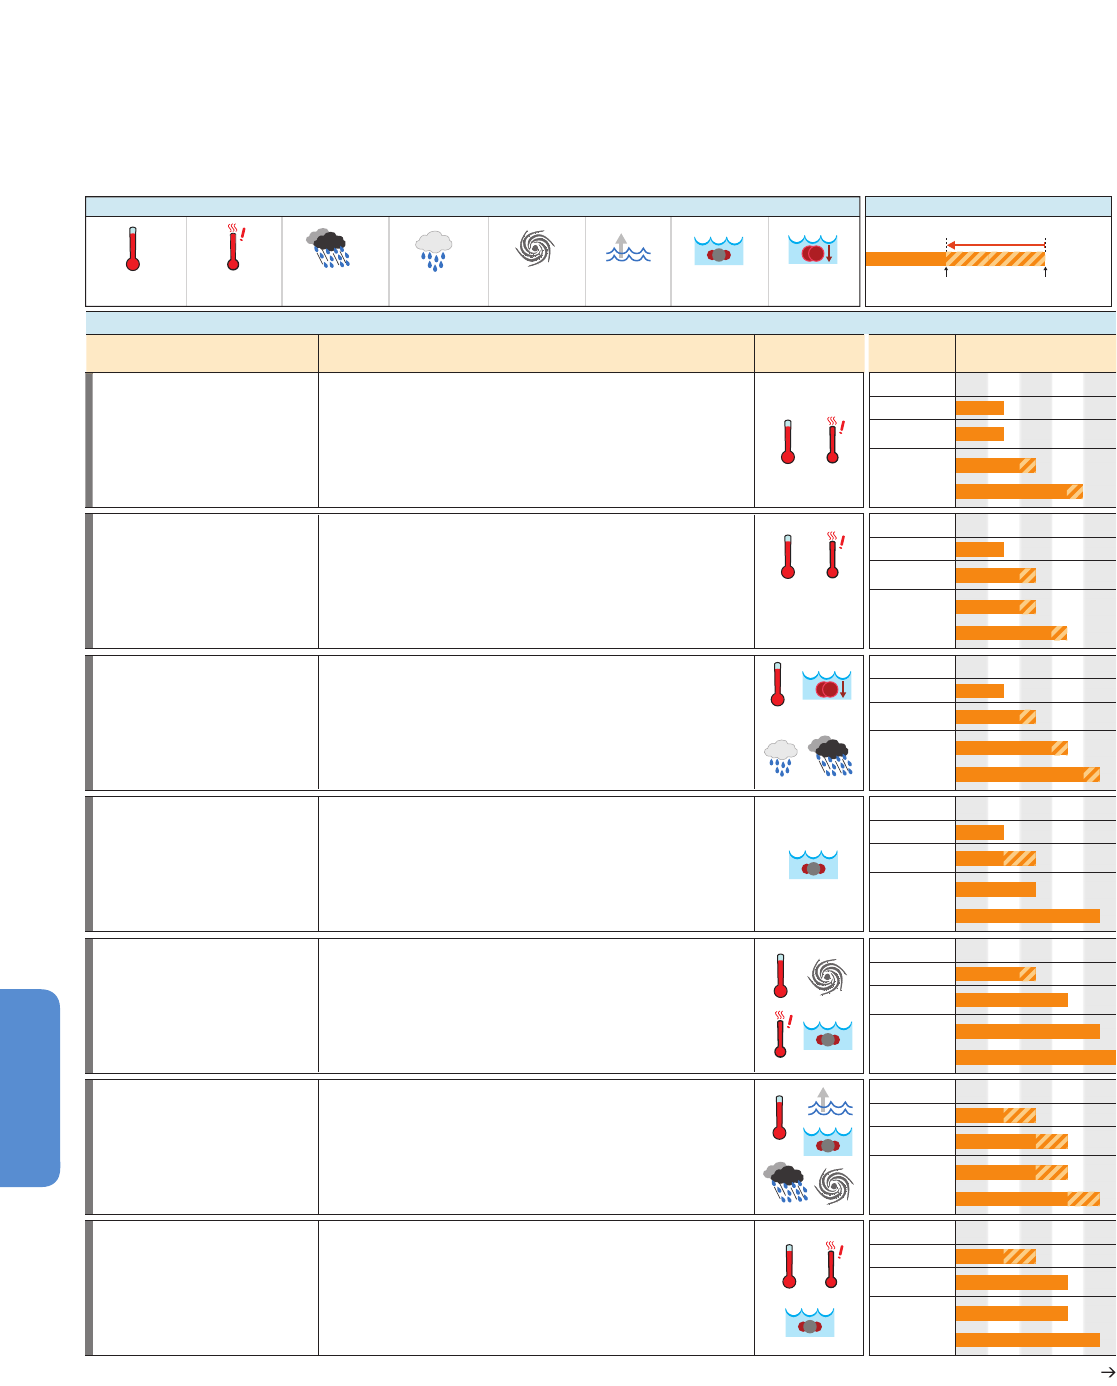
462
Chapter 6 Ocean Systems
6
C
OO
C
OO
C
OO
Key risk Adaptation issues & prospects
Climatic
drivers
Risk & potential for
adaptation
Timeframe
Risks to ecosystems and adaptation options
Present
2
°C
4°C
V
ery
low
Very
high
M
edium
Present
2°C
4°C
Very
l
ow
V
ery
high
Medium
Present
2°C
4°C
Very
l
ow
V
ery
high
Medium
Present
2°C
4°C
Very
low
Very
high
Medium
Present
2°C
4°C
Very
low
Very
high
Medium
Present
2°C
4°C
Very
low
Very
high
Medium
Table 6-6 | Coastal and oceanic key risks from climate change and the potential for risk reduction through mitigation and adaptation. Key risks are identified based on
a
ssessment of the literature and expert judgments made by authors of the various WGII AR5 chapters, with supporting evaluation of evidence and agreement in the referenced
chapter sections. Each key risk is characterized as very low, low, medium, high, or very high. Risk levels are presented for the near-term era of committed climate change (here,
f
or 2030–2040), in which projected levels of global mean temperature increase do not diverge substantially across emissions scenarios. Risk levels are also presented for the
longer-term era of climate options (here, for 2080–2100), for global mean temperature increase of 2°C and 4°C above pre-industrial levels. For each time frame, risk levels are
estimated for the current state of adaptation and for a hypothetical highly adapted state. As the assessment considers potential impacts on different physical, biological, and
human systems, risk levels should not necessarily be used to evaluate relative risk across key risks. Relevant climate variables are indicated by symbols. Acronyms for oceans
sub-regions are as follows: HLSBS = High-Latitude Spring Bloom Systems; EUS = Equatorial Upwelling Systems; SES = Semi-Enclosed Seas; CBS = Coastal Boundary Systems;
EBUE = Eastern Boundary Upwelling Ecosystems; STG = Sub-Tropical Gyres, DS = Deep Sea (>1000 m).
Near term
(2030 – 2040)
Long term
(
2080 – 2100)
N
ear term
(2030 – 2040)
Long term
(2080 – 2100)
Near term
(2030 – 2040)
Long term
(2080 – 2100)
Near term
(2030 – 2040)
Long term
(2080 – 2100)
Near term
(2030 – 2040)
Long term
(2080 – 2100)
Near term
(2030 – 2040)
Long term
(2080 – 2100)
C
hanges in ecosystem productivity
a
ssociated with the redistribution and
loss of net primary productivity in open
oceans. (medium confidence)
[
6.5.1, 6.3.4, 30.5.1-2, Box CC-PP]
A
daptation options are limited to the translocation of industrial fishing activities
d
ue to regional decreases (low latitude) versus increases (high latitude) in
productivity, or to the expansion of aquaculture.
Distributional shift in fish and invertebrate
species, fall in fisheries catch potential at
l
ow latitudes, e.g., in EUS, CBS, and STG
regions. (high confidence)
[6.3.1, 6.5.2-3, 30.5.1-4, 30.6.2,
Box CC-MB]
Evolutionary adaptation potential of fish and invertebrate species to warming is limited
as indicated by their changes in distribution to maintain temperatures. Human adaptation
options involve the large-scale translocation of industrial fishing activities following the
regional decreases (low latitude) versus (possibly transient) increases (high latitude) in
catch potential as well as deploying flexible management that can react to variability and
change. Further options include improving fish resilience to thermal stress by reducing
other stressors such as pollution and eutrophication, the expansion of sustainable
aquaculture and development of alternative livelihoods in some regions.
High mortalities and loss of habitat to
larger fauna including commercial species
due to hypoxia expansion and effects.
(high confidence)
[6.3.3, 30.5.3-5]
Human adaptation options involve the large-scale translocation of industrial
fishing activities as a consequence of the hypoxia-induced decreases in
biodiversity and fisheries catch of pelagic fish and squid. Special fisheries may
benefit (Humboldt squid). Reducing the amount of organic carbon running off
coastlines by controlling nutrients and pollution running off agricultural areas can
reduce microbial activity and consequently limit the extent of the oxygen
drawdown and the formation of coastal dead zones.
Ocean acidification: Reduced growth and
survival of commercially valuable shellfish
and other calcifiers, e.g., reef building
corals, calcareous red algae.
(high confidence)
[5.3.3.5, 6.1.1, 6.3.2, 6.4.1.1, 30.3.2.2,
Box CC-OA]
Evidence for differential resistance and evolutionary adaptation of some species
exists but is likely limited by the CO
2
concentrations and high temperatures
reached; adaptation options include the shift to exploiting more resilient species
or the protection of habitats with low natural CO
2
levels, as well as the reduction
of other stresses, mainly pollution and limiting pressures from tourism and fishing.
Reduced biodiversity, fisheries abundance
and coastal protection by coral reefs due
to heat-induced mass coral bleaching and
mortality increases, exacerbated by ocean
acidification, e.g., in CBS, SES, and STG
regions. (high confidence)
[5.4.2.4, 6.3.1, 6.4.2, 30.3.1.1, 30.3.2.2,
30.5.3-6, Box CC-CR]
Evidence of rapid evolution by corals is very limited or nonexistent. Some corals
may migrate to higher latitudes. However, the movement of entire reef systems is
unlikely given estimates that they need to move at the speed of 10 – 20 km yr
–1
.
Human adaptation options are limited to reducing other stresses, mainly
enhancing water quality and limiting pressures from tourism and fishing. This
option will delay the impacts of climate change by a few decades but is likely to
disappear as thermal stress increases.
Coastal inundation and habitat loss due
to sea level rise, extreme events, changes
in precipitation, and reduced ecological
resilience, e.g., in CBS and STG
subregions. (medium to high confidence)
[5.4.2.3-7, 5.5.2, 5.5.4, 30.5.6, Box
CC-CR]
Options to maintain ecosystem integrity are limited to the reduction of other
stresses, mainly pollution and limiting pressures from tourism, fishing, physical
destruction, and unsustainable aquaculture; reducing deforestation and increasing
reforestation of river catchments and coastal areas to retain sediments and
nutrients; increased mangrove, coral reef, and seagrass protection and restoration
to protect numerous ecosystem goods and services such as coastal protection,
tourist value, and fish habitat.
Damaging
c
yclone
Ocean
a
cidification
Precipitation
C
OO
Climate-related drivers of impacts
Warming
t
rend
Extreme
p
recipitation
Extreme
t
emperature
Sea
l
evel
Level of risk & potential for adaptation
P
otential for additional adaptation
t
o reduce risk
R
isk level with
c
urrent adaptation
R
isk level with
h
igh adaptation
Hypoxia
O
2
Continued next page
C
OO
Near term
(2030 – 2040)
Long term
(2080 – 2100)
Present
2°C
4°C
Very
low
Very
high
Medium
Marine biodiversity loss with high rate of
climate change. (medium confidence)
[6.3.1-3, 6.4.1.2-3, Table 30.4, Box
CC-MB]
Adaptation options are limited to the reduction of other stresses, mainly to
reducing pollution and to limiting pressures from tourism and fishing.
O
2
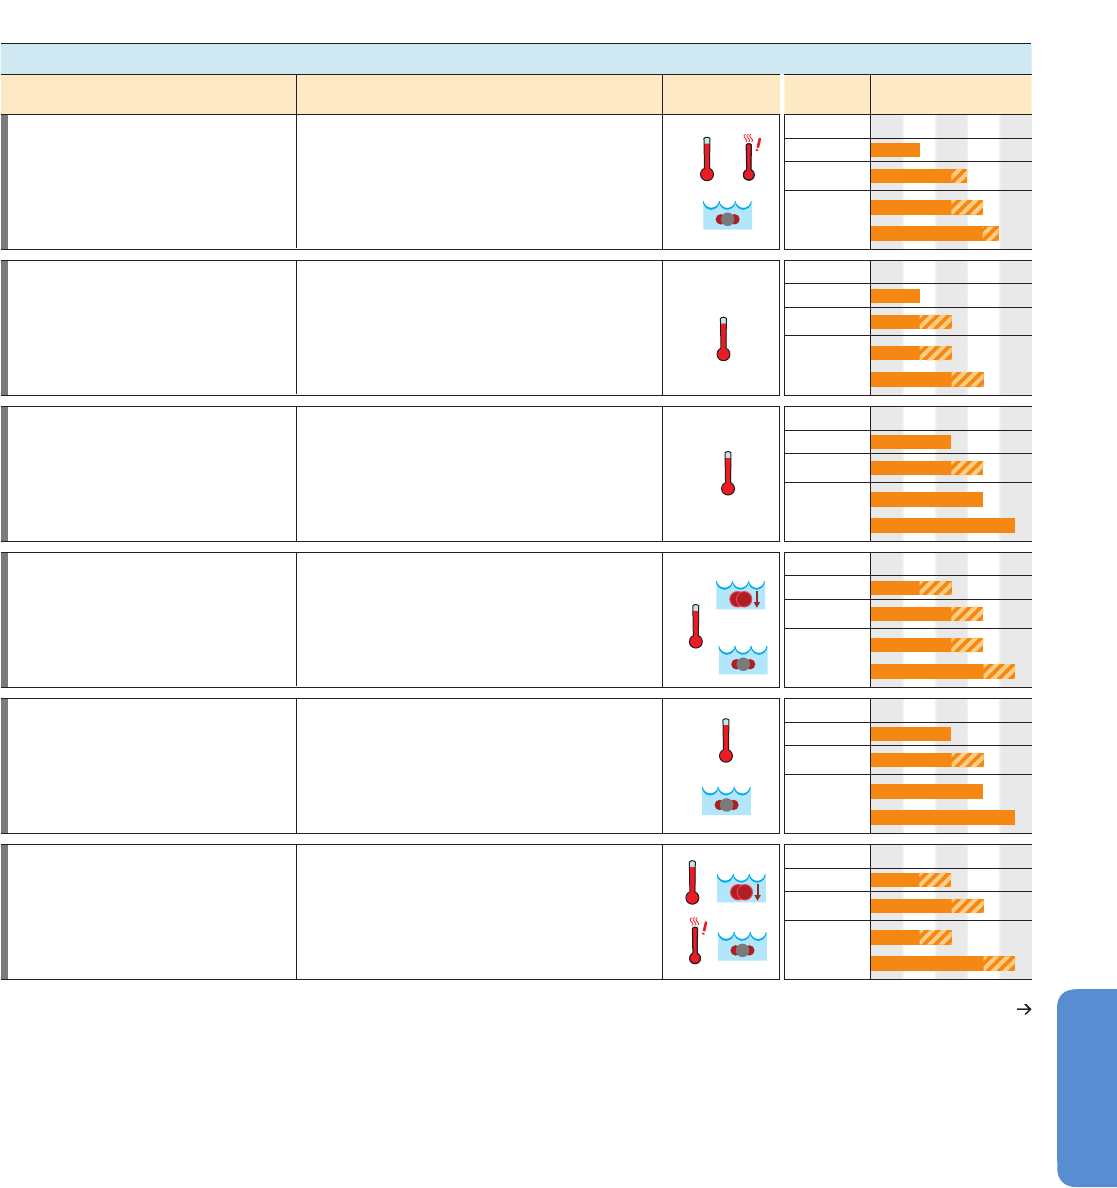
463
Ocean Systems Chapter 6
6
projected to continue in the 21st century under all IPCC emission
scenarios (high confidence; Sections 6.3.1, 6.3.5, 6.3.7, 6.4.1, 6.5.2).
Climate-induced regime shifts and regional changes in Plankton
Phenology (PP; medium confidence) have caused and will cause changes
in food composition and availability to animals. Species shifts and
changing species composition lead to changes in Fishery Catch Potential
(FCP; high confidence; 5a in Figure 6-15), partly attributable to climate
change (high confidence) and to sustained fishing pressure (Section
6.5.3). Fisheries Catch Potentials (FCP) will be redistributed, decrease
at low latitudes, and increase at high latitudes (high confidence; 5a in
Figure 6-15). These trends will possibly be strengthened by the projected
decrease in NPP at low latitudes and increase in NPP at high latitudes
(medium confidence; Sections 6.5.2-3; 5b in Figure 6-15). Polar Organisms
(PO) that are unable to migrate to cooler waters, and to acclimatize or
to adapt to warming, will become marginalized, contributing to the
projected high species turnover in polar areas (high confidence; Sections
6.3.1, 6.5.2).
Detected effects on Marine Air Breathers (MAB: mammals, seabirds, and
reptiles) include changing abundances and phenology, shifts in species
distribution, and in sea turtle sex ratios (high confidence), all of which
are partly attributed to climate change (high confidence). However, few
effects are directly linked to climate drivers (e.g., temperature-driven
turtle sex ratio); most effects are due to shifts in habitat structure (e.g.,
loss of sea ice), changing availability of prey organisms, or changes in
Present
2
°C
4°C
Very
l
ow
V
ery
h
igh
Medium
Present
2°C
4°C
V
ery
low
Very
high
M
edium
C
OO
C
OO
Redistribution of catch potential of large
p
elagic-highly migratory fish resources, such as
tropical Pacific tuna fisheries. (high confidence)
[
6.3.1, 6.4.3, Table 30.4]
International fisheries agreements and instruments, such as the tuna
c
ommissions, may have limited success in establishing sustainable
fisheries yields.
Variability of small pelagic fishes in Eastern
Boundary Upwelling systems is becoming more
extreme at interannual to multi-decadal scales,
making industry and management decisions more
uncertain. (medium confidence)
[6.3.2, 6.3.3, 30.5.5, Box CC-UP]
Development of new and specific management tools and models
may have limited success to sustain yields. Reduction in fishing
intensity increases resilience of the fisheries.
Present
2°C
4°C
Very
low
Very
high
Medium
Present
2°C
4°C
Very
low
Very
high
Medium
Decrease in catch and species diversity of fisheries in
tropical coral reefs, exacerbated by interactions with
other human drivers such as eutrophication and
habitat destruction. (high confidence)
[6.4.1, 30.5.3-4, 30.5.6, Table 30-4, Box CC-CR]
Restoration of overexploited fisheries and reduction of other
stressors on coral reefs delay ecosystem changes. Human adaptation
includes the usage of alternative livelihoods and food sources (e.g.,
coastal aquaculture).
Current spatial management units, especially the
MPAs, may fail in the future due to shifts in species
distribution and community structure.
(high confidence)
[6.3.1, 6.4.2.1, 30.5.1, Box CC-MB]
Continuous revision and shifts of MPA borders, and of MPA goals
and performance.
Present
2°C
4°C
Very
low
V
ery
high
M
edium
Present
2°C
4°C
Very
low
Very
high
Medium
Decreased production of global shellfish fisheries.
(
high confidence)
[6.3.2, 6.3.5, 6.4.1.1, 30.5.5, 30.6.2.1, Box CC-OA]
Effective shift to alternative livelihoods, changes in food
c
onsumption patterns, and adjustment of (global) markets.
G
lobal redistribution and decrease of low-latitude
fisheries yields are paralleled by a global trend to
c
atches having smaller fishes. (medium confidence)
[6.3.1, 6.4.1, 6.5.3, 30.5.4, 30.5.6, 30.6.2]
I
ncreasing coastal poverty at low latitudes as fisheries becomes
smaller – partially compensated by the growth of aquaculture and
m
arine spatial planning, as well as enhanced industrialized fishing
efforts.
C
OO
C
OO
O
2
O
2
Near term
(2030 – 2040)
L
ong term
(
2080 – 2100)
N
ear term
(
2030 – 2040)
L
ong term
(
2080 – 2100)
N
ear term
(
2030 – 2040)
L
ong term
(
2080 – 2100)
Near term
(2030 – 2040)
Long term
(2080 – 2100)
Near term
(2030 – 2040)
Long term
(2080 – 2100)
Near term
(2030 – 2040)
Long term
(2080 – 2100)
Key risk Adaptation issues & prospects
Climatic
drivers
R
isk & potential for
adaptation
Timeframe
Risks to fisheries
Continued next page
Table 6-6 (continued)
Continued next page
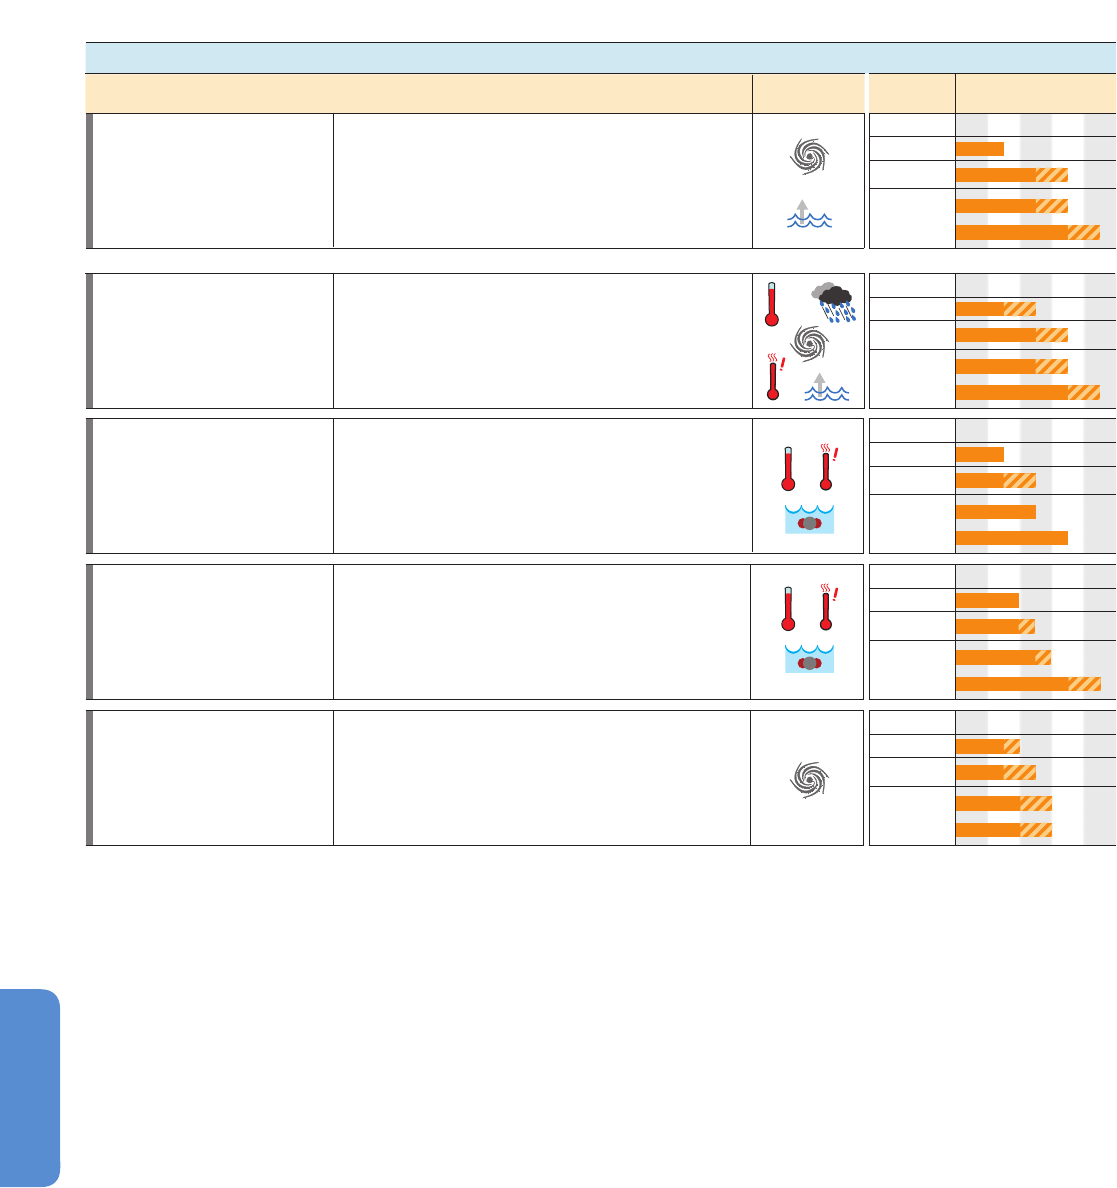
464
Chapter 6 Ocean Systems
6
foraging efficiency, in both mammals (polar bears, walruses) and birds
(penguins, albatrosses). Such trends will be exacerbated by future
warming (high confidence; Sections 6.3.7, 6.5.2).
6.6.1.3. Expanding Hypoxia Affecting Marine Resources
Hypoxic zones in marine sediments and pelagic OMZs will continue to
expand in the future, owing to climate-induced warming trends (Section
6.1.1). Local and regional Hypoxia Effects (HE) have been observed
(medium confidence) and will be exacerbated in the future (high
confidence; Section 6.3.3) causing habitat loss for groundfishes and
pelagic predators and affecting the distribution of key zooplankton and
nekton species (medium confidence). Progressive hypoxia is causing
shifts in community composition toward hypoxia-tolerant species,
excluding calcifiers due to elevated pCO
2
(high confidence), benefiting
specialized microbes, and leading to reduced biodiversity and the loss
of higher life forms (high confidence; Section 6.3.3). Loss of deep habitat
and biomass of Mid-Water Fishes (MWF; Section 6.3.3; medium
confidence in detection) off California is also attributed to hypoxia
(medium confidence). These trends will continue into the future (medium
confidence).
6.6.1.4. Constraints on Marine Calcifiers and Associated Fisheries
and Aquaculture due to Ocean Acidification
Ocean acidification will exert negative effects on species and whole
ecosystems and their services, especially those relying on carbonate
structures such as warm-water coral reefs (high confidence; cf. Section
30.7.1.2). Presently, only a small number of field observations have
detected Ocean Acidification Effects (OAE; medium confidence), but
experiments and natural analogs support reliable but qualitative
projections and attribution (high confidence). A specific glimpse into
the future of anthropogenic OA is provided by negative Effects of
upwelled CO
2
-rich waters on Pacific Oysters (EO) introduced to
aquaculture along the North American west coast (high confidence in
detection, low confidence in attribution to anthropogenic causes).
Findings in experimental laboratory and field studies as well as at
natural analogs support attribution of projected effects to future CO
2
Key risk Adaptation issues & prospects
Climatic
drivers
R
isk & potential for
adaptation
Timeframe
Risks to humans and infrastructure
C
O
O
P
resent
2°C
4°C
Very
low
V
ery
h
igh
M
edium
Present
2
°C
4°C
Very
low
Very
h
igh
Medium
Impacts due to increased frequency of
h
armful algal blooms (medium confidence)
[6.4.2.3, 30.6.3]
Adaptation options include improved monitoring and early warning system,
r
eduction of stresses favoring harmful algal blooms, mainly pollution and
e
utrophication, as well as the avoidance of contaminated areas and fisheries
products.
Impacts on marine resources threatening
regional security as territorial disputes and
food security challenges increase
(limited evidence, medium agreement)
[AR5 SREX, 30.6.5, 30.7.2, 12.4-6, 29.3]
Decrease in marine resources, movements of fish stocks and opening of new
seaways , and impacts of extreme events coupled with increasing populations
will increase the potential for conflict in some regions, drive potential
migration of people, and increase humanitarian crises.
C
OO
Present
2°C
4°C
Very
low
Very
h
igh
Medium
Impacts on shipping and infrastructure for
energy and mineral extraction increases as
storm intensity and wave height increase
in some regions (e.g., high latitudes)
(high confidence)
[AR5 SREX, 30.6.2.3-4, 30.6.5, 29.3]
Adaptation options are to limit activities to particular times of the year and/or
develop strategies to decrease the vulnerability of structures and operations.
Near term
(2030 – 2040)
Long term
(2080 – 2100)
Near term
(2030 – 2040)
Long term
(2080 – 2100)
Near term
(2030 – 2040)
Long term
(2080 – 2100)
Table 6-6 (continued)
Present
2°C
4°C
Very
low
Very
h
igh
M
edium
Reduced livelihoods and increased poverty.
(medium confidence)
[6.4.1-2, 30.6.2, 30.6.5]
Human adaptation options involve the large-scale translocation of industrial
fishing activities following the regional decreases (low latitude) versus increases
(high latitude) in catch potential and shifts in biodiversity. Artisanal local
fisheries are extremely limited in their adaptation options by available financial
resources and technical capacities, except for their potential shift to other
species of interest.
Near term
(2030 – 2040)
L
ong term
(2080 – 2100)
Present
2°C
4°C
Very
l
ow
Very
high
Medium
Coastal socioeconomic security.
(high confidence)
[
5.5.2, 5.5.4, 30.6.5, 30.7.1, Table 30-4]
Human adaptation options involve (1) protection using coastal defences (e.g.
s
eawalls) and soft measures (e.g., mangrove replanting and enhancing coral
g
rowth); (2) accommodation to allow continued occupation of coastal areas by
making changes to human activities and infrastructure; and (3) managed retreat
as a last viable option. Options vary from large-scale engineering works to
s
maller scale community projects. Options are available under the more
traditional CZM (coastal zone management) framework but increasingly under
DRR (disaster risk reduction) and CCA (climate change adaptation) frameworks.
*High confidence in existence of adaptation measures, Low confidence in magnitude of risk reduction
*
*
*
*
N
ear term
(
2030 – 2040)
L
ong term
(
2080 – 2100)

465
Ocean Systems Chapter 6
6
c
oncentrations (medium confidence), with species-specific sensitivities
across phyla (high confidence). Projected effects are most harmful to
strong CALcifiers (CAL; high confidence), for example, some echinoderms,
bivalves, gastropods, warm-water corals, and crustose algae, and less
harmful to some crustaceans and, possibly, fishes. Projections from
experimental studies and observations at natural analogs indicate shifts
in Community Composition (CC) to more active animals and from
calcifiers (CAL) to non-calcifiers in all organism groups (high confidence
in both projection and attribution to increased CO
2
; Section 6.3.2;
Table 6-3).
6.6.1.5. Interactions of Climate-Related Drivers Exacerbating
Impacts on Organisms, Ecosystems, and Their Services
Climate change involves interactions of temperature with other climate-
related drivers and their effects (ocean acidification, hypoxia, freshening,
nutrient supply, organism shifts resulting in changing interactions
between species, changes in habitat structure, e.g., loss of sea ice).
Strong interactions with other human impacts like eutrophication, fishing,
and other forms of harvesting accelerate and amplify climate-induced
changes (high confidence; Section 6.3.5, 30.7.1.1). Harmful algal blooms
(HAB) will be stimulated by warming, nutrient fluctuations in upwelling
areas, eutrophication in coastal areas (Table 6-6), ocean acidification,
and enhanced surface stratification (medium confidence). Synergistic
Effects (SE) will be exacerbated in the future (medium confidence), but
have not yet been clearly detected and attributed in the field (low
confidence). For projected future effects, attribution of observed impacts
to such synergisms is supported by experimental evidence, especially
in animals and plants (medium confidence).
Increased bleaching and decreased calcification displayed by several
Reef-building Warm-water Corals (RWC; very high confidence) over the
last 3 decades are attributed to the ongoing warming trend, and the
associated rise in extreme temperature events and amplitudes (high
confidence; Sections 6.3.1, 30.5.6; Box CC-CR). Such trends will be
exacerbated by future warming and synergistic effects (high confidence;
cf. Section 30.5.4.2), with some amelioration by latitudinal shifts and
evolutionary adaptation (Section 6.3.1; low confidence). Ocean
acidification will have an increasing influence on reefs (high confidence),
as indicated by similar phenomena during mass extinctions in Earth history.
6.6.2. Key Uncertainties
Key uncertainties result from insufficient knowledge of ocean systems.
International organizations (both inter- and non-governmental) have
the opportunity to play a key role in coordinating research concepts and
approaches, working toward a coherent picture of climate change
effects on the global ocean. Countries around the world have limited
capacity and infrastructure to study the ocean’s response to climate
change. Long-term observational time series are especially lacking, in
both quantity and quality. Research has provided valuable insights, but
a unifying approach addressing principles across organism domains and
ecosystems is still missing. Processes investigated so far differ largely
by study organisms (plants, animals, phytoplankton, and bacteria)
and by level of organization (ecosystem, whole organism, tissue, cell,
m
olecular). Especially for microbes, available data are patchy and
reported trends are often in different directions, partly due to different
experimental protocols and/or over-reliance on species or strains of
microbes that are readily culturable, and hence have beenused for
decades in laboratory research. The knowledge base of climate impacts
on species, strains, or communities in the field is insufficient. Scaling from
physiological studies on individual species to ecosystem changes has
been successful in individual cases but has not been widely implemented,
for example, to shifts in species interactions or food webs. An integrated
framework of climate sensitivity at the ecosystem level that considers
multiple drivers and their interactive effects needs to be developed
further. This includes an in depth understanding of ecosystem structure
(physical and biological) and functioning, of ecosystem complexity and
species interactions, and of the resulting implications for biogeochemical
processes. For all climate drivers, especially ocean warming, acidification,
and hypoxia, studies integrating mechanistic knowledge and evolutionary
adaptation over generations are needed. Research should also cover
various climate zones and biomes. Laboratory and modeling experiments
are needed to test hypotheses building on long-term field observations
and observations at natural or paleo-analogs. Models should better
integrate observations and mechanism-based understanding, and better
project future interactions between human and natural systems in a
changing climate.
References
Abed, R.M., F. Garcia-Pichel, and M. Hernandez-Marine, 2002: Polyphasic
characterization of benthic, moderately halophilic, moderately thermophilic
cyanobacteria with very thin trichomes and the proposal of Halomicronema
excentricum gen. nov., sp. nov. Archives of Microbiology, 177(5), 361-370.
Adger, W.N., T.P. Hughes, C. Folke, S.R. Carpenter, and J. Rockström, 2005: Social-
ecological resilience to coastal disasters. Science, 309(5737), 1036-1039.
Ainsworth, C.H., J.F. Samhouri, D.S. Busch, W.W.L. Cheung, J. Dunne, and T.A. Okey,
2011: Potential impacts of climate change on Northeast Pacific marine foodwebs
and fisheries. ICES Journal of Marine Science, 68(6), 1217-1229.
Alheit, J., T. Pohlmann, M. Casini, W. Greve, R. Hinrichs, M. Mathis, K. O’Driscoll, R.
Vorberg, and C. Wagner, 2012: Climate variability drives anchovies and sardines
into North Sea and Baltic Sea. Progress in Oceanography, 96(1), 128-139.
Alker, A.P., G.W. Smith, and K. Kim, 2001: Characterization of Aspergillus sydowii
(Thom et Church), a fungal pathogen of Caribbean sea fan corals. Hydrobiologia,
460, 105-111.
Allison, E.H., A.L. Perry, M.-C. Badjeck, W.N. Adger, K. Brown, D. Conway, A.S. Halls,
G.M. Pilling, J.D. Reynolds, N.L. Andrew, and N.K. Dulvy, 2009: Vulnerability of
national economies to the impacts of climate change on fisheries. Fish and
Fisheries, 10(2), 173-196.
Altizer, S., R.S. Ostfeld, P.T.J. Johnson, S. Kutz, and C.D. Harvell, 2013: Climate change
and infectious diseases: from evidence to a predictive framework. Science,
341(6145), 514-519.
Amelung, B., S. Nicholls, and D. Viner, 2007: Implications of global climate change
for tourism flows and seasonality. Journal of Travel Research, 45(3), 285-296.
Andersson, A.J., F.T. Mackenzie, and J.-P. Gattuso, 2011: Effects of ocean acidification
on benthic processes, organisms, and ecosystems. In: Ocean Acidification [Gattuso,
J.-P. and L. Hansson (eds.)]. Oxford University Press, Oxford, UK, pp. 122-153.
Angilletta, M.J.J., 2009: Thermal Adaptation. A Theoretical and Empirical Synthesis.
Oxford University Press, Oxford, UK, 320 pp.
Anthony, K.R., D.I. Kline, G. Diaz-Pulido, S. Dove, and O. Hoegh-Guldberg, 2008:
Ocean acidification causes bleaching and productivity loss in coral reef builders.
Proceedings of the National Academy of Sciences of the United States of America,
105(45), 17442-17446.
Archer, D., M. Eby, V. Brovkin, A. Ridgwell, L. Cao, U. Mikolajewicz, K. Caldeira, K.
Matsumoto, G. Munhoven, A. Montenegro, and K. Tokos, 2009: Atmospheric
lifetime of fossil fuel carbon dioxide. Annual Review of Earth and Planetary
Sciences, 37(1), 117-134.

466
Chapter 6 Ocean Systems
6
Armbrust, E.V., 2009: The life of diatoms in the world’s oceans. Nature, 459(7244),
185-192.
Armstrong, J.L., J.L. Boldt, A.D. Cross, J.H. Moss, N.D. Davis, K.W. Myers, R.V. Walker,
D.A. Beauchamp, and L.J. Haldorson, 2005: Distribution, size, and interannual,
seasonal and diel food habits of northern Gulf of Alaska juvenile pink salmon,
Oncorhynchus gorbuscha. Deep-Sea Research Part II: Topical Studies in
Oceanography, 52(1-2), 247-265.
Arnason, R., 2007: Climate change and fisheries: assessing the economic impact in
Iceland and Greenland. Natural Resource Modeling, 20(2), 163-197.
Arnold, K.E., H.S. Findlay, J.I. Spicer, C.L. Daniels, and D. Boothroyd, 2009: Effect of
CO
2
-related acidification on aspects of the larval development of the European
lobster, Homarus gammarus (L.). Biogeosciences, 6(8), 1747-1754.
Arnold, T., C. Mealey, H. Leahey, A.W. Miller, J.M. Hall-Spencer, M. Milazzo, and K.
Maers, 2012: Ocean acidification and the loss of phenolic substances in marine
plants. PLoS ONE, 7(4), e35107, doi:10.1371/journal.pone.0035107.
Arrieta, J.M., S. Arnaud-Haond, and C.M. Duarte, 2010: What lies underneath:
conserving the oceans’ genetic resources. Proceedings of the National Academy
of Sciences of the United States of America, 107(43), 18318-18324.
Arrigo, K.R. and G.L. van Dijken, 2011: Secular trends in Arctic Ocean net primary
production. Journal of Geophysical Research, 116(C9), C09011, doi:10.1029/
2011JC007151.
Arrigo, K.R., D.K. Perovich, R.S. Pickart, Z.W. Brown, G.L. van Dijken, K.E. Lowry, M.M.
Mills, M.A. Palmer, W.M. Balch, F. Bahr, N.R. Bates, C. Benitez-Nelson, B. Bowler,
E. Brownlee, J.K. Ehn, K.E. Frey, R. Garley, S.R. Laney, L. Lubelczyk, J. Mathis, A.
Matsuoka, B.G. Mitchell, G.W.K. Moore, E. Ortega-Retuerta, S. Pal, C.M.
Polashenski, R.A. Reynolds, B. Schieber, H.M. Sosik, M. Stephens, and J.H. Swift,
2012: Massive phytoplankton blooms under Arctic sea ice. Science, 336(6087),
1408.
Auel, H., W. Hagen, W. Ekau, and H.M. Verheye, 2005: Metabolic adaptations and
reduced respiration of the copepod Calanoides carinatus during diapause at
depth in the Angola-Benguela Front and northern Benguela upwelling regions.
African Journal of Marine Science, 27(3), 653-657.
Baker, A.C., 2001: Ecosystems: reef corals bleach to survive change. Nature,
411(6839), 765-766.
Baker-Austin, C., J.A. Trinanes, N.G.H. Taylor, R. Hartnell, A. Siitonen, and J. Martinez-
Urtaza, 2013: Emerging Vibrio risk at high latitudes in response to ocean
warming. Nature Climate Change, 3(1), 73-77.
Balazs, G.H. and M. Chaloupka, 2004: Thirty-year recovery trend in the once depleted
Hawaiian green sea turtle stock. Biological Conservation, 117(5), 491-498.
Banse, K., 1991: Rates of phytoplankton cell division in the field and in iron enrichment
experiments. Limnology and Oceanography, 36(8), 1886-1898.
Barange, M., W.W.L. Cheung, G. Merino, and R.I. Perry, 2010: Modelling the potential
impacts of climate change and human activities on the sustainability of marine
resources. Current Opinion in Environmental Sustainability, 2(5-6), 326-333.
Barker, S. and H. Elderfield, 2002: Foraminiferal calcification response to glacial-
interglacial changes in atmospheric CO
2
. Science, 297(5582), 833-836.
Barker, S., P. Diz, M.J. Vautravers, J. Pike, G. Knorr, I.R. Hall, and W.S. Broecker, 2009:
Interhemispheric Atlantic seesaw response during the last deglaciation. Nature,
457(7233), 1097-1102.
Barton, A., B. Hales, G.G. Waldbusser, C. Langdon, and R.A. Feely, 2012: The Pacific
oyster, Crassostrea gigas, shows negative correlation to naturally elevated
carbon dioxide levels: implications for near-term ocean acidification effects.
Limnology and Oceanography, 57(3), 698-710.
Baumann, H., S.C. Talmage, and C.J. Gobler, 2012: Reduced early life growth and
survival in a fish in direct response to increased carbon dioxide. Nature Climate
Change, 2(1), 38-41.
Baumgartner, M., K.O. Stetter, and W. Foissner, 2002: Morphological, small subunit
rRNA, and physiological characterization of Trimyema minutum (Kahl, 1931),
an anaerobic ciliate from submarine hydrothermal vents growing from 28°C
to 52°C. Journal of Eukaryotic Microbiology, 49(3), 227-238.
Bazzino, G., W.F. Gilly, U. Markaida, C.A. Salinas-Zavala, and J. Ramos-Castillejos,
2010: Horizontal movements, vertical-habitat utilization and diet of the jumbo
squid (Dosidicus gigas) in the Pacific Ocean off Baja California Sur, Mexico.
Progress in Oceanography, 86(1-2), 59-71.
Beare, D., F. Burns, E. Jones, K. Peach, E. Portilla, T. Greig, E. McKenzie, and D. Reid, 2004:
An increase in the abundance of anchovies and sardines in the north-western
North Sea since 1995. Global Change Biology, 10(7), 1209-1213.
Beaufort, L., I. Probert, T. de Garidel-Thoron, E.M. Bendif, D. Ruiz-Pino, N. Metzl, C.
Goyet, N. Buchet, P. Coupel, M. Grelaud, B. Rost, R.E.M. Rickaby, and C. de Vargas,
2011: Sensitivity of coccolithophores to carbonate chemistry and ocean
acidification. Nature, 476(7358), 80-83.
Beaugrand, G., 2009: Decadal changes in climate and ecosystems in the North
Atlantic Ocean and adjacent seas. Deep-Sea Research Part II: Topical Studies
in Oceanography, 56(8-10), 656-673.
Beaugrand, G., P.C. Reid, F. Ibañez, J.A. Lindley, and M. Edwards, 2002: Reorganization
of North Atlantic marine copepod biodiversity and climate. Science, 296(5573),
1692-1694.
Beaugrand, G., M. Edwards, K. Brander, C. Luczak, and F. Ibañez, 2008: Causes and
projections of abrupt climate-driven ecosystem shifts in the North Atlantic.
Ecology Letters, 11(11), 1157-1168.
Beaugrand, G., C. Luczak, and M. Edwards, 2009: Rapid biogeographical plankton
shifts in the North Atlantic Ocean. Global Change Biology, 15(7), 1790-1803.
Beaugrand, G., M. Edwards, and L. Legendre, 2010: Marine biodiversity, ecosystem
functioning, and carbon cycles. Proceedings of the National Academy of
Sciences of the United States of America, 107(22), 10120-10124.
Beaugrand, G., A. McQuatters-Gollop, M. Edwards, and E. Goberville, 2013: Long-
term responses of North Atlantic calcifying plankton to climate change. Nature
Climate Change, 3(3), 263-267.
Beaulieu, C., S.A. Henson, J.L. Sarmiento, J.P. Dunne, S.C. Doney, R.R. Rykaczewski,
and L. Bopp, 2013: Factors challenging our ability to detect long-term trends
in ocean chlorophyll. Biogeosciences, 10(4), 2711-2724.
Beaumont, N.J., M.C. Austen, J.P. Atkins, D. Burdon, S. Degraer, T.P. Dentinho, S. Derous,
P. Holm, T. Horton, E. van Ierland, A.H. Marboe, D.J. Starkey, M. Townsend, and
T. Zarzycki, 2007: Identification, definition and quantification of goods and
services provided by marine biodiversity: implications for the ecosystem
approach. Marine Pollution Bulletin, 54(3), 253-265.
Becker, B.H., M.Z. Peery, and S.R. Beissinger, 2007: Ocean climate and prey availability
affect the trophic level and reproductive success of the marbled murrelet, an
endangered seabird. Marine Ecology Progress Series, 329, 267-279.
Bednaršek, N., G.A. Tarling, D.C.E. Bakker, S. Fielding, E.M. Jones, H.J. Venables, P.
Ward, A. Kuzirian, B. Lézé, R.A. Feely, and E.J. Murphy, 2012: Extensive dissolution
of live pteropods in the Southern Ocean. Nature Geoscience, 5(12), 881-885.
Behrenfeld, M., 2011: Uncertain future for ocean algae. Nature Climate Change,
1(1), 33-34.
Beman, J.M., C.-E. Chow, A.L. King, Y. Feng, J.A. Fuhrman, A. Andersson, N.R. Bates,
B.N. Popp, and D.A. Hutchins, 2011: Global declines in oceanic nitrification rates
as a consequence of ocean acidification. Proceedings of the National Academy
of Sciences of the United States of America, 108(1), 208-213.
Beniash, E., A. Ivanina, N.S. Lieb, I. Kurochkin, and I.M. Sokolova, 2010: Elevated level
of carbon dioxide affects metabolism and shell formation in oysters Crassostrea
virginica. Marine Ecology Progress Series, 419, 95-108.
Benson, S., P. Cook, J. Anderson, S. Bachu, H.B. Nimir, B. Basu, J. Bradshaw, G. Deguchi,
J. Gale, G. von Goerne, W. Heidug, S. Holloway, R. Kamal, D. Keith, P. Lloyd, P.
Rocha, B. Senior, J. Thomson, T. Torp, T. Wildenborg, M. Wilson, F. Zarlenga, and
D. Zhou, 2005: Underground geological storage. In: Carbon Dioxide Capture
and Storage: A Special Report of IPCC Working Group III [Metz, B., O. Davidson,
H. de Corninck, M. Loos, and L. Meyer (eds.)]. Cambridge University Press,
Cambridge, UK and New York, NY, USA, pp. 195-276.
Bertrand, A., M. Ballón, and A. Chaigneau, 2010: Acoustic observation of living
organisms reveals the upper limit of the oxygen minimum zone. PLoS ONE,
5(4), e10330, doi:10.1371/journal.pone.0010330.
Bertrand, E.M., M.A. Saito, J.M. Rose, C.R. Riesselman, M.C. Lohan, A.E. Noble, P.A.
Lee, and G.R. DiTullio, 2007: Vitamin B-12 and iron colimitation of phytoplankton
growth in the Ross Sea. Limnology and Oceanography, 52(3), 1079-1093.
Bianchi, D., E.D. Galbraith, D.A. Carozza, K.A.S. Mislan, and C.A. Stock, 2013:
Intensification of open-ocean oxygen depletion by vertically migrating animals.
Nature Geoscience, 6(7), 545-548.
Billé, R., R. Kelly, E. Harrould-Kolieb, D. Herr, F. Joos, K.J. Kroeker, D. Laffoley, A. Oschlies,
and J.-P. Gattuso, 2013: Taking action against ocean acidification: a review of
management and policy options. Environmental Management, 52, 761-779.
Bissinger, J.E., D.J.S. Montagnes, J. Sharples, and D. Atkinson, 2008: Predicting marine
phytoplankton maximum growth rates from temperature: improving on the
Eppley curve using quantile regression. Limnology and Oceanography, 53(2),
487-493.
Blanchard, J.L., S. Jennings, R. Holmes, J. Harle, G. Merino, J.I. Allen, J. Holt, N.K. Dulvy,
and M. Barange, 2012: Potential consequences of climate change for primary
production and fish production in large marine ecosystems. Philosophical
Transactions of the Royal Society B, 367(1605), 2979-2989.

467
Ocean Systems Chapter 6
6
Bode, A., J.A. Hare, W.K.W. Li, X.A.G. Morán, and L. Valdés, 2011: Chlorophyll and
primary production in the North Atlantic. In: ICES Cooperative Research Report
No. 310 [Reid, P.C. and L. Valdés (eds.)]. International Council for the Exploration
of the Sea, Copenhagen, Denmark, pp. 77-102.
Boetius, A., S. Albrecht, K. Bakker, C. Bienhold, J. Felden, M. Fernández-Méndez, S.
Hendricks, C. Katlein, C. Lalande, T. Krumpen, M. Nicolaus, I. Peeken, B. Rabe,
A. Rogacheva, E. Rybakova, R. Somavilla, F. Wenzhöfer, and the RV Polarstern
ARK27-3-Shipboard Science Party, 2013: Export of algal biomass from the melting
arctic sea ice. Science, 339(6126), 1430-1432.
Bolton, J.J. and K. Lüning, 1982: Optimal growth and maximal survival temperatures
of Atlantic Laminaria species (Phaeophyta) in culture. Marine Biology, 66(1),
89-94.
Bopp, L., C. Le Quéré, M. Heimann, A.C. Manning, and P. Monfray, 2002: Climate-
induced oceanic oxygen fluxes: implications for the contemporary carbon budget.
Global Biogeochemical Cycles, 16(2), 1022, doi:10.1029/2001GB001445.
Bopp, L., L. Resplandy, J.D. Orr, S.C. Doney, J.P. Dunne, M. Gehlen, P. Halloran, C.
Heinze, T. Ilyina, R. Séférian, J. Tijiputra, and M. Vichi, 2013: Multiple stressors
of ocean ecosystems in the 21
st
century: projections with CMIP5 models.
Biogeosciences, 10(10), 6225-6245.
Bossdorf, O., C.L. Richards, and M. Pigliucci, 2008: Epigenetics for ecologists. Ecology
Letters, 11(2), 106-115.
Botsford, L.W., M.D. Holland, J.F. Samhouri, J.W. White, and A. Hastings, 2011:
Importance of age structure in models of the response of upper trophic levels to
fishing and climate change. ICES Journal of Marine Science, 68(6), 1270-1283.
Bowler, C., A. Vardi, and A.E. Allen, 2010: Oceanographic and biogeochemical insights
from diatom genomes. Annual Review of Marine Science, 2(1), 333-365.
Bown, P.R., J.A. Lees, and J.R. Young, 2004: Calcareous nannoplankton evolution and
diversity through time. In: Coccolithophores – From Molecular Processes to
Global Impact [Thierstein, H.R. and J.R. Young (eds.)]. Springer, Heidelberg,
Germany, pp. 481-508.
Boyce, D.G., M.R. Lewis, and B. Worm, 2010: Global phytoplankton decline over the
past century. Nature, 466(7306), 591-596.
Boyd, P.W., 2002: Environmental factors controlling phytoplankton processes in the
Southern Ocean. Journal of Phycology, 38(5), 844-861.
Boyd, P.W., 2008: Ranking geo-engineering schemes. Nature Geoscience, 1(11), 722-
724.
Boyd, P.W., 2011: Beyond ocean acidification. Nature Geoscience, 4(5), 273-274.
Boyd, P.W. and S.C. Doney, 2002: Modelling regional responses by marine pelagic
ecosystems to global climate change. Geophysical Research Letters, 29(16),
53-1–53-4, doi:10.1029/2001GL014130.
Boyd, P.W. and D.A. Hutchins, 2012: Understanding the responses of ocean biota to
a complex matrix of cumulative anthropogenic change. Marine Ecology
Progress Series, 470, 125-135.
Boyd, P.W., T. Jickells, C.S. Law, S. Blain, E.A. Boyle, K.O. Buesseler, K.H. Coale, J.J.
Cullen, H.J. de Baar, M. Follows, M. Harvey, C. Lancelot, M. Levasseur, N.P. Owens,
R. Pollard, R.B. Rivkin, J. Sarmiento, V. Schoemann, V. Smetacek, S. Takeda, A.
Tsuda, S. Turner, and A.J. Watson, 2007: Mesoscale iron enrichment experiments
1993-2005: synthesis and future directions. Science, 315(5812), 612-617.
Boyd, P.W., R. Strzepek, F.X. Fu, and D.A. Hutchins, 2010: Environmental control of
open-ocean phytoplankton groups: now and in the future. Limnology and
Oceanography, 55(3), 1353-1376.
Boyd, P.W., C.S. Law, and S.C. Doney, 2011: A climate change atlas for the ocean.
Oceanography, 24(2), 13-16.
Bradshaw, W.E. and C.M. Holzapfel, 2010: Light, time, and the physiology of biotic
response to rapid climate change in animals. Annual Review of Physiology,
72(1), 147-166.
Brainard, R.E., C. Birkeland, C.M. Eakin, P. McElhany, M.W. Miller, M. Patterson, and
G.A. Piniak, 2011: Status Review Report of 82 Candidate Coral Species
Petitioned under The U.S. Endangered Species Act. U.S. Department of Commerce,
National Oceanic and Atmospheric Administration (NOAA) Technical
Memorandum, NOAA-TM-NMFS-PIFSC-27, Washington, DC, USA, 530 pp.
Bralower, T.J., 2002: Evidence of surface water oligotrophy during the Paleocene-
Eocene thermal maximum: nannofossil assemblage data from Ocean Drilling
Program Site 690, Maud Rise, Weddell Sea. Paleoceanography, 17(2), 1-15.
Branch, T.A., B.M. DeJoseph, L.J. Ray, and C.A. Wagner, 2013: Impacts of ocean
acidification on marine seafood. Trends in Ecology and Evolution, 28(3), 178-186.
Brander, K., 2007: Global fish production and climate change. Proceedings of the
National Academy of Sciences of the United States of America, 104(50), 19709-
19714.
Brander, K., 2008: Tackling the old familiar problems of pollution, habitat alteration
and overfishing will help with adapting to climate change. Marine Pollution
Bulletin, 56(12), 1957-1958.
Brander, K., G. Blom, M.F. Borges, K. Erzini, G. Henderson, B.R. MacKenzie, H. Mendes,
J. Ribeiro, A.M.P. Santos, and R. Toresen, 2003: Changes in fish distribution in
the eastern North Atlantic: are we seeing a coherent response to changing
temperature? ICES Marine Science Symposia, 219, 261-270.
Brander, L.M., K. Rehdanz, R.S.J. Tol, and P.J.H. Van Beukering, 2012: The economic
impact of ocean acidification on coral reefs. Climate Change Economics, 3(1),
1250002, doi:10.1142/S2010007812500029.
Brandes, J.A., A.H. Devol, and C. Deutsch, 2007: New developments in the marine
nitrogen cycle. Chemical Reviews, 107(2), 577-589.
Braun-McNeill, J., C.R. Sasso, S.P. Epperly, and C. Rivero, 2008: Feasibility of using
sea surface temperature imagery to mitigate cheloniid sea turtle-fishery
interactions off the coast of northeastern USA. Endangered Species Research,
5(2-3), 257-266.
Breau, C., R.A. Cunjak, and S.J. Peake, 2011: Behaviour during elevated water
temperatures: can physiology explain movement of juvenile Atlantic salmon to
cool water? Journal of Animal Ecology, 80(4), 844-853.
Brewer, P.G. and E.T. Peltzer, 2009: Limits to marine life. Science, 324(5925), 347-
348.
Brinton, E. and A. Townsend, 2003: Decadal variability in abundances of the dominant
euphausiid species in southern sectors of the California Current. Deep-Sea
Research Part II: Topical Studies in Oceanography, 50(14-16), 2449-2472.
Broderick, A.C., B.J. Godley, S. Reece, and J.R. Downie, 2000: Incubation periods and
sex ratios of green turtles: highly female biased hatchling production in the
eastern Mediterranean. Marine Ecology Progress Series, 202, 273-281.
Brotz, L., W.W.L. Cheung, K. Kleisner, E. Pakhomov, and D. Pauly, 2012: Increasing
jellyfish populations: trends in large marine ecosystems. Hydrobiologia, 690(1),
3-20.
Brown, C.J., E.A. Fulton, A.J. Hobday, R.J. Matear, H.P. Possingham, C. Bulman, V.
Christensen, R.E. Forrest, P.C. Gehrke, N.A. Gribble, S.P. Griffiths, H. Lozano-
Montes, J.M. Martin, S. Metcalf, T.A. Okey, R. Watson, and A.J. Richardson, 2010:
Effects of climate-driven primary production change on marine food webs:
implications for fisheries and conservation. Global Change Biology, 16(4),
1194-1212.
Brunel, T. and M. Dickey-Collas, 2010: Effects of temperature and population density
on von Bertalanffy growth parameters in Atlantic herring: a macro-ecological
analysis. Marine Ecology Progress Series, 405, 15-28.
Bruno, J.F. and E.R. Selig, 2007: Regional decline of coral cover in the Indo-Pacific:
timing, extent, and subregional comparisons. PLoS ONE, 2(8), e711, doi:10.1371/
journal.pone.0000711.
Buesseler, K.O., S.C. Doney, D.M. Karl, P.W. Boyd, K. Caldeira, F. Chai, K.H. Coale, H.J.
de Baar, P.G. Falkowski, K.S. Johnson, R.S. Lampitt, A.F. Michaels, S.W.A. Naqvi,
V. Smetacek, S. Takeda, and A.J. Watson, 2008: Ocean iron fertilization – moving
forward in a sea of uncertainty. Science, 319, 162.
Bunce, A., F. Norman, N. Brothers, and R. Gales, 2002: Long-term trends in the
Australasian gannet (Morus serrator) population in Australia: the effect of climate
change and commercial fisheries. Marine Biology, 141(2), 263-269.
Burge, C.A., C.M. Eakin, C.S. Friedman, B. Froelich, P.K. Hershberger, E.E. Hofmann,
L.E. Petes, K.C. Prager, E. Weil, B.L. Willis, S.E. Ford, and C.D. Harvell, 2014:
Climate change influences on marine infectious diseases: implications for
management and society. Annual Review of Marine Science, 6, 249-277.
Burleson, M.L. and P.E. Silva, 2011: Cross tolerance to environmental stressors:
effects of hypoxic acclimation on cardiovascular responses of channel catfish
(Ictalurus punctatus) to a thermal challenge. Journal of Thermal Biology, 36(4),
250-254.
Burrows, M.T., D.S. Schoeman, L.B. Buckley, P. Moore, E.S. Poloczanska, K.M. Brander,
C. Brown, J.F. Bruno, C.M. Duarte, B.S. Halpern, J. Holding, C.V. Kappel, W.
Kiessling, M.I. O’Connor, J.M. Pandolfi, C. Parmesan, F.B. Schwing, W.J. Sydeman,
and A.J. Richardson, 2011: The pace of shifting climate in marine and terrestrial
ecosystems. Science, 334(6056), 652-655.
Cai, W.-J., X. Hu, W.-J. Huang, M.C. Murrell, J.C. Lehrter, S.E. Lohrenz, W.-C. Chou,
W. Zhai, J.T. Hollibaugh, Y. Wang, P. Zhao, X. Guo, K. Gundersen, M. Dai, and
G.-C. Gong, 2011: Acidification of subsurface coastal waters enhanced by
eutrophication. Nature Geoscience, 4(11), 766-770.
Cairns, D.K., A.J. Gaston, and F. Huettmann, 2008: Endothermy, ectothermy and the
global structure of marine vertebrate communities. Marine Ecology Progress
Series, 356, 239-250.

468
Chapter 6 Ocean Systems
6
Calambokidis, J., J. Barlow, J.K.B. Ford, T.E. Chandler, and A.B. Douglas, 2009: Insights
into the population structure of blue whales in the eastern North Pacific from
recent sightings and photographic identification. Marine Mammal Science,
25(4), 816-832.
Caldeira, K. and L. Wood, 2008: Global and Arctic climate engineering: numerical
model studies. Philosophical Transactions of the Royal Society A, 366(1882),
4039-4056.
Caldeira, K., M. Akai, P. Brewer, B. Chen, P. Haugan, T. Iwama, P. Johnston, H. Kheshgi,
Q. Li, T. Ohsumi, H.-O. Pörtner, C. Sabine, Y. Shirayama, and J. Thomson, 2005:
Ocean Storage. In: Carbon Dioxide Capture and Storage: A Special Report
of IPCC Working Group III [Metz, B., O. Davidson, H.C. de Coninck, M. Loos,
and L.A. Meyer (eds.)]. Cambridge University Press, Cambridge UK, pp. 277-
318.
Calosi, P., S.P.S. Rastrick, M. Graziano, S.C. Thomas, C. Baggini, H.A. Carter, J.M. Hall-
Spencer, M. Milazzo, and J.I. Spicer, 2013: Distribution of sea urchins living near
shallow water CO
2
vents is dependent upon species acid–base and ion-
regulatory abilities. Marine Pollution Bulletin, 73(2), 470-484.
Campbell, J., D. Antoine, R. Armstrong, K. Arrigo, W. Balch, R. Barber, M. Behrenfeld,
R. Bidigare, J. Bishop, M.-E. Carr, W. Esaias, P. Falkowski, N. Hoepffner, R. Iverson,
D. Kiefer, S. Lohrenz, J. Marra, A. Morel, J. Ryan, V. Vedernikov, K. Waters, C.
Yentsch, and J. Yoder, 2002: Comparison of algorithms for estimating ocean
primary production from surface chlorophyll, temperature, and irradiance.
Global Biogeochemical Cycles, 16(3), 1035, doi:10.1029/2001GB001444.
Campbell, S.J., L.J. McKenzie, and S.P. Kerville, 2006: Photosynthetic responses of seven
tropical seagrasses to elevated seawater temperature. Journal of Experimental
Marine Biology and Ecology, 330(2), 455-468.
Cao, L. and K. Caldeira, 2010: Can ocean iron fertilization mitigate ocean acidification?
Climatic Change, 99(1-2), 303-311.
Capotondi, A., M.A. Alexander, N.A. Bond, E.N. Curchitser, and J.D. Scott, 2012:
Enhanced upper ocean stratification with climate change in the CMIP3
models. Journal of Geophysical Research, 117(C4), C04031, doi:10.1029/
2011JC007409.
Carlton, J.T., 2000: Global change and biological invasions in the oceans. In: Invasive
Species in a Changing World [Mooney, H.A. and R.J. Hobbs (eds.)]. Island Press,
Covelo, CA, USA, pp. 31-53.
Carpenter, S.R. and W.A. Brock, 2006: Rising variance: a leading indicator of
ecological transition. Ecology Letters, 9(3), 311-318.
Carrillo, C.J., R.C. Smith, and D.M. Karl, 2004: Processes regulating oxygen and
carbon dioxide in surface waters west of the Antarctic Peninsula. Marine
Chemistry, 84(3-4), 161-179.
Casini, M., J. Hjelm, J.C. Molinero, J. Lövgren, M. Cardinale, V. Bartolino, A. Belgrano,
and G. Kornilovs, 2009: Trophic cascades promote threshold-like shifts in pelagic
marine ecosystems. Proceedings of the National Academy of Sciences of the
United States of America, 106(1), 197-202.
Cavalier-Smith, T., 2004: Only six kingdoms of life. Proceedings of the Royal Society
B: Biological Sciences, 271(1545), 1251-1262.
CBD, 2009: Scientific Synthesis of the Impacts of Ocean Acidification on Marine
Biodiversity. Secretariat of the Convention on Biological Diversity (CBD)
Technical Series No. 46, CBD, Montreal, Canada, 61 pp.
Cesar, H., L. Burke, and L. Pet-Soede, 2003: The Economics of Worldwide Coral Reef
Degradation. Cesar Environmental Economics Consulting (CEEC), Arnhem,
Netherlands, 23 pp.
Chaloupka, M., N. Kamezaki, and C. Limpus, 2008: Is climate change affecting the
population dynamics of the endangered Pacific loggerhead sea turtle? Journal
of Experimental Marine Biology and Ecology, 356(1-2), 136-143.
Chambers, L.E., L. Hughes, and M.A. Weston, 2005: Climate change and its impact
on Australia’s avifauna. Emu, 105(1), 1-20.
Chambers, L.E., C.A. Devney, B.C. Congdon, N. Dunlop, E.J. Woehler, and P. Dann,
2011: Observed and predicted effects of climate on Australian seabirds. Emu,
111(3), 235-251.
Chan, F., J.A. Barth, J. Lubchenco, A. Kirincich, H. Weeks, W.T. Peterson, and B.A.
Menge, 2008: Emergence of anoxia in the California Current large marine
ecosystem. Science, 319(5865), 920.
Charpy-Roubaud, C. and A. Sournia, 1990: The comparative estimation of
phytoplanktonic, microphytobenthic and macrophytobenthic primary production
in the oceans. Marine Microbial Food Webs, 4(1), 31-57.
Chavez, F.P., J. Ryan, S.E. Lluch-Cota, and M. Niquen C, 2003: From anchovies to
sardines and back: multidecadal change in the Pacific Ocean. Science,
299(5604), 217-221.
Chavez, F.P., M. Messié, and J.T. Pennington, 2011: Marine primary production in
relation to climate variability and change. Annual Review of Marine Science,
3(1), 227-260.
Checkley Jr., D.M., A.G. Dickson, M. Takahashi, J.A. Radich, N. Eisenkolb, and R. Asch,
2009: Elevated CO
2
enhances otolith growth in young fish. Science, 324(5935),
1683.
Cheung, W.W.L., C. Close, V. Lam, R. Watson, and D. Pauly, 2008: Application of
macroecological theory to predict effects of climate change on global fisheries
potential. Marine Ecology Progress Series, 365, 187-197.
Cheung, W.W.L., V.W.Y. Lam, J.L. Sarmiento, K. Kearney, R. Watson, and D. Pauly, 2009:
Projecting global marine biodiversity impacts under climate change scenarios.
Fish and Fisheries, 10(3), 235-251.
Cheung, W.W.L., V.W.Y. Lam, J.L. Sarmiento, K. Kearney, R. Watson, D. Zeller, and D.
Pauly, 2010: Large-scale redistribution of maximum fisheries catch in the global
ocean under climate change. Global Change Biology, 16(1), 24-35.
Cheung, W.W.L., J. Dunne, J.L. Sarmiento, and D. Pauly, 2011: Integrating ecophysiology
and plankton dynamics into projected maximum fisheries catch potential under
climate change in the Northeast Atlantic. ICES Journal of Marine Science, 68(6),
1008-1018.
Cheung, W.W.L., R. Watson, and D. Pauly, 2013a: Signature of ocean warming in
global fisheries catch. Nature, 497, 365-368.
Cheung, W.W.L., J.L. Sarmiento, J. Dunne, T.L. Frölicher, V.W.Y. Lam, M.L.D. Palomares,
R. Watson, and D. Pauly, 2013b: Shrinking of fishes exacerbates impacts of
global ocean changes on marine ecosystems. Nature Climate Change, 3(3),
254-258.
Chevaldonné, P., C. Fisher, J. Childress, D. Desbruyères, D. Jollivet, F. Zal, and A.
Toulmond, 2000: Thermotolerance and the ‘Pompeii worms’. Marine Ecology
Progess Series, 208, 2093-2295.
Chevin, L.-M., R. Lande, and G.M. Mace, 2010: Adaptation, plasticity, and extinction
in a changing environment: towards a predictive theory. PLoS Biology, 8(4),
e1000357, doi:10.1371/journal.pbio.1000357.
Christen, N., P. Calosi, C.L. McNeill, and S. Widdicombe, 2013: Structural and functional
vulnerability to elevated pCO
2
in marine benthic communities. Marine Biology,
160, 2113-2128.
Christian, J.R. and D.M. Karl, 1995: Bacterial ectoenzymes in marine waters – activity
ratios and temperature responses in 3 oceanographic provinces. Limnology and
Oceanography, 40(6), 1042-1049.
Claiborne, J.B., S.L. Edwards, and A.I. Morrison-Shetlar, 2002: Acid–base regulation
in fishes: cellular and molecular mechanisms. Journal of Experimental Zoology,
293(3), 302-319.
Clark, D., M. Lamare, and M. Barker, 2009: Response of sea urchin pluteus larvae
(Echinodermata: Echinoidea) to reduced seawater pH: a comparison among a
tropical, temperate, and a polar species. Marine Biology, 156(6), 1125-1137.
CLIMAP Project Members, 1976: The surface of the ice-age earth. Science,
191(4232), 1131-1137.
Colbourne, E., J. Craig, C. Fitzpatrick, D. Senciall, P. Stead, and W. Bailey, 2011: An
Assessment of the Physical Oceanographic Environment on the Newfoundland
and Labrador Shelf during 2010. Department of Fisheries and Oceans (DFO),
Canadian Science Advisory Secretariat (CSAS) Science Advisory Report
2011/089, CSAS, Ottawa, Ontario, Canada, 31 pp.
Coll, M., L.J. Shannon, D. Yemane, J.S. Link, H. Ojaveer, S. Neira, D. Jouffre, P. Labrosse,
J.J. Heymans, E.A. Fulton, and Y.-J. Shin, 2010: Ranking the ecological relative
status of exploited marine ecosystems. ICES Journal of Marine Science, 67(4),
769-786.
Comeau, A.M., W.K.W. Li, J.E. Tremblay, E.C. Carmack, and C. Lovejoy, 2011: Arctic
ocean microbial community structure before and after the 2007 record sea ice
minimum. PLoS ONE, 6(11), e27492, doi:10.1371/journal.pone.0027492.
Comeau, S., G. Gorsky, R. Jeffree, J.L. Teyssié, and J.-P. Gattuso, 2009: Impact of ocean
acidification on a key Arctic pelagic mollusc (Limacina helicina). Biogeosciences,
6(9), 1877-1882.
Condon, R.H., W.M. Graham, C.M. Duarte, K.A. Pitt, C.H. Lucas, S.H.D. Haddock, K.R.
Sutherland, K.L. Robinson, M.N. Dawson, M.B. Decker, C.E. Mills, J.E. Purcell, A.
Malej, H. Mianzan, S.-I. Uye, S. Gelcich, and L.P. Madin, 2012: Questioning the
rise of gelatinous zooplankton in the world’s oceans. BioScience, 62(2), 160-
169.
Condon, R.H., C.M. Duarte, K.A. Pitt, K.L. Robinson, C.H. Lucas, K.R. Sutherland, H.W.
Mianzan, M. Bogeberg, J.E. Purcell, M.B. Decker, S. Uye, L.P. Madin, R.D. Brodeur,
S.H.D. Haddock, A. Malej, G.D. Parry, E. Eriksen, J. Quiñones, M. Acha, M. Harvey,
J.M. Arthur, and W.M. Graham, 2013: Recurrent jellyfish blooms are a

469
Ocean Systems Chapter 6
6
consequence of global oscillations. Proceedings of the National Academy of
Sciences of the United States of America, 110(3), 1000-1005.
Cooley, S.R., 2012: How humans could “feel” changing biogeochemistry. Current
Opinion in Environmental Sustainability, 4(3), 258-263.
Cooley, S.R. and S.C. Doney, 2009: Anticipating ocean acidification’s economic
consequences for commercial fisheries. Environmental Research Letters, 4(2),
024007, doi:10.1088/1748-9326/4/2/024007.
Cooley, S.R., H.L. Kite-Powell, and S.C. Doney, 2009: Ocean acidification’s potential
to alter global marine ecosystem services. Oceanography, 22(4), 172-181.
Cooley, S.R., N. Lucey, H. Kite-Powell, and S.C. Doney, 2012: Nutrition and income
from molluscs today imply vulnerability to ocean acidification tomorrow. Fish
and Fisheries, 13(2), 182-215.
Corbett, J.J., D.A. Lack, J.J. Winebrake, S. Harder, J.A. Silberman, and M. Gold, 2010:
Arctic shipping emissions inventories and future scenarios. Atmospheric
Chemistry and Physics, 10(19), 9689-9704.
Costello, J.H., B.K. Sullivan, and D.J. Gifford, 2006: A physical-biological interaction
underlying variable phenological responses to climate change by coastal
zooplankton. Journal of Plankton Research, 28(11), 1099-1105.
Crain, C.M., K. Kroeker, and B.S. Halpern, 2008: Interactive and cumulative effects of
multiple human stressors in marine systems. Ecology Letters, 11(12), 1304-
1315.
Crook, E.D., D. Potts, M. Rebolledo-Vieyra, L. Hernandez, and A. Paytan, 2012:
Calcifying coral abundance near low-pH springs: implications for future ocean
acidification. Coral Reefs, 31(1), 239-245.
Crutzen, P., 2006: Albedo enhancement by stratospheric sulfur injections: a
contribution to resolve a policy dilemma? Climatic Change, 77(3-4), 211-220.
Cubillos, J.C., S.W. Wright, G. Nash, M.F. de Salas, B. Griffiths, B. Tilbrook, A. Poisson,
and G.M. Hallegraeff, 2007: Calcification morphotypes of the coccolithophorid
Emiliania huxleyi in the Southern Ocean: changes in 2001 to 2006 compared
to historical data. Marine Ecology Progress Series, 348, 47-54.
Cuevas, E., F.A. Abreu-Grobois, V. Guzmán-Hernández, M.A. Liceaga-Correa, and R.P.
van Dam, 2008: Post-nesting migratory movements of hawksbill turtles
Eretmochelys imbricata in waters adjacent to the Yucatan Peninsula, Mexico.
Endangered Species Research, 10, 123-133.
Cui, Y., L.R. Kump, A.J. Ridgwell, A.J. Charles, C.K. Junium, A.F. Diefendorf, K.H. Free-
man, N.M. Urban, and I.C. Harding, 2011: Slow release of fossil carbon during
the Palaeocene-Eocene Thermal Maximum. Nature Geoscience, 4(7), 481-485.
Cury, P., L. Shannon, and Y.-J. Shin, 2003: The functioning of marine ecosystems: a
fisheries perspective. In: Responsible Fisheries in the Marine Ecosystem [Sinclair,
M. and G. Valdimarsson (eds.)]. Food and Agriculture Organization of the United
Nations (FAO) and CABI Publishing, Wallingford, UK, pp. 103-124.
Czerny, J., J. Barcelos e Ramos, and U. Riebesell, 2009: Influence of elevated CO
2
concentrations on cell division and nitrogen fixation rates in the bloom-forming
cyanobacterium Nodularia spumigena. Biogeosciences, 6(9), 1865-1875.
Dale, B., M. Edwards, and P.C. Reid, 2006: Climate change and harmful algal blooms.
In: Ecology of Harmful Algae [Granéli, E. and J.T. Turner (eds.)]. Springer, Berlin,
Germany, pp. 367-378.
Danovaro, R., C. Corinaldesi, A. Dell’Anno, J.A. Fuhrman, J.J. Middelburg, R.T. Noble,
and C.A. Suttle, 2011: Marine viruses and global climate change. FEMS
Microbiology Reviews, 35(6), 993-1034.
Daskalov, G.M., 2003: Long-term changes in fish abundance and environmental
indices in the Black Sea. Marine Ecology Progress Series, 255, 259-270.
Daufresne, M., K. Lengfellner, and U. Sommer, 2009: Global warming benefits the
small in aquatic ecosystems. Proceedings of the National Academy of Sciences
of the United States of America, 106(31), 12788-12793.
de Baar, H.J.W., J.T.M. de Jong, D.C.E. Bakker, B.M. Löscher, C. Veth, U. Bathmann,
and V. Smetacek, 1995: Importance of iron for plankton blooms and carbon
dioxide drawdown in the Southern Ocean. Nature, 373, 412-415.
de Baar, H.J.W., P.W. Boyd, K.H. Coale, M.R. Landry, A. Tsuda, P. Assmy, D.C.E. Bakker,
Y. Bozec, R.T. Barber, M.A. Brzezinski, K.O. Buesseler, M. Boyé, P.L. Croot, F.
Gervais, M.Y. Gorbunov, P.J. Harrison, W.T. Hiscock, P. Laan, C. Lancelot, C.S.
Law, M. Levasseur, A. Marchetti, F.J. Millero, J. Nishioka, Y. Nojiri, T. van Oijen, U.
Riebesell, M.J.A. Rijkenberg, H. Saito, S. Takeda, K.R. Timmermans, M.J.W.
Veldhuis, A.M. Waite, and C.-S. Wong, 2005: Synthesis of iron fertilization
experiments: from the Iron Age in the Age of Enlightenment. Journal of
Geophysical Research, 110(C9), C09S16, doi:10.1029/2004JC002601.
De Jonckheere, J.F., M. Baumgartner, F.R. Opperdoes, and K.O. Stetter, 2009:
Marinamoeba thermophila, a new marine heterolobosean amoeba growing at
50°C. European Journal of Protistology, 45(3), 231-236.
De Jonckheere, J.F., M. Baumgartner, S. Eberhardt, F.R. Opperdoes, and K.O. Stetter,
2011: Oramoeba fumarolia gen. nov., sp. nov., a new marine heterolobosean
amoeboflagellate growing at 54°C. European Journal of Protistology, 47(1),
16-23.
de Moel, H., G.M. Ganssen, F.J.C. Peeters, S.J.A. Jung, D. Kroon, G.J.A. Brummer, and
R.E. Zeebe, 2009: Planktic foraminiferal shell thinning in the Arabian Sea due
to anthropogenic ocean acidification? Biogeosciences, 6(9), 1917-1925.
De’ath, G., J.M. Lough, and K.E. Fabricius, 2009: Declining coral calcification on the
Great Barrier Reef. Science, 323(5910), 116-119.
De’ath, G., K.E. Fabricius, H. Sweatman, and M. Puotinen, 2012: The 27-year decline
of coral cover on the Great Barrier Reef and its causes. Proceedings of the
National Academy of Sciences of the United States of America, 109(44), 17995-
17999.
De’ath, G., J.M. Lough, and K.E. Fabricius, 2013: Corrigendum: declining coral
calcification on the Great Barrier Reef. Science, 342(6158), 559.
Deigweiher, K., N. Koschnick, H.-O. Pörtner, and M. Lucassen, 2008: Acclimation of
ion regulatory capacities in gills of marine fish under environmental hypercapnia.
American Journal of Physiology: Regulatory, Integrative and Comparative
Physiology, 295(5), R1660-1670.
Denman, K., J.R. Christian, N. Steiner, H.-O. Pörtner, and Y. Nojiri, 2011: Potential
impacts of future ocean acidification on marine ecosystems and fisheries:
present knowledge and recommendations for future research. ICES Journal of
Marine Science, 68(6), 1019-1029.
Deutsch, C., H. Brix, T. Ito, H. Frenzel, and L. Thompson, 2011: Climate-forced
variability of ocean hypoxia. Science, 333(6040), 336-339.
deYoung, B., R. Harris, J. Alheit, G. Beaugrand, N. Mantua, and L. Shannon, 2004:
Detecting regime shifts in the ocean: data considerations. Progress in
Oceanography, 60(2-4), 143-164.
deYoung, B., M. Barange, G. Beaugrand, R. Harris, R.I. Perry, M. Scheffer, and F.
Werner, 2008: Regime shifts in marine ecosystems: detection, prediction and
management. Trends in Ecology and Evolution, 23(7), 402-409.
DFO, 2011a: Assessment of Capelin in SA 2 + Div. 3KL in 2010. Department of
Fisheries and Oceans (DFO), Canadian Science Advisory Secretariat (CSAS)
Science Advisory Report 2010/090, CSAS, Ottawa, Ontario, Canada, 16 pp.
DFO, 2011b: Recovery potential assessment for the Newfoundland and Labrador
designatable unit (NAFO Divs. 2GHJ, 3KLNO) of Atlantic Cod (Gadus morhua).
Department of Fisheries and Oceans (DFO), Canadian Science Advisory Secretariat
(CSAS) Science Advisory Report 2011/037, CSAS, Ottawa, Ontario, Canada, 30
pp.
Díaz, R.J. and R. Rosenberg, 2008: Spreading dead zones and consequences for
marine ecosystems. Science, 321(5891), 926-929.
Dierssen, H.M., 2010: Perspectives on empirical approaches for ocean color remote
sensing of chlorophyll in a changing climate. Proceedings of the National
Academy of Sciences of the United States of America, 107(40), 17073-17078.
Doak, D.F., J.A. Estes, B.S. Halpern, U. Jacob, D.R. Lindberg, J. Lovvorn, D.H. Monson,
M.T. Tinker, T.M. Williams, J.T. Wootton, I. Carroll, M. Emmerson, F. Micheli, and
M. Novak, 2008: Understanding and predicting ecological dynamics: are major
surprises inevitable? Ecology, 89(4), 952-961.
Dobson, A., 2009: Climate variability, global change, immunity, and the dynamics of
infectious diseases. Ecology, 90(4), 920-927.
Dodds, L.A., J.M. Roberts, A.C. Taylor, and F. Marubini, 2007: Metabolic tolerance of
the cold-water coral Lophelia pertusa (Scleractinia) to temperature and dissolved
oxygen change. Journal of Experimental Marine Biology and Ecology, 349(2),
205-214.
Dodson, J.J., S. Tremblay, F. Colombani, J.E. Carscadden, and F. Lecomte, 2007:
Trans-Arctic dispersals and the evolution of a circumpolar marine fish species
complex, the capelin (Mallotus villosus). Molecular Ecology, 16(23), 5030-5043.
Domenici, P., B. Allan, M.I. McCormick, and P.L. Munday, 2012: Elevated carbon dioxide
affects behavioural lateralization in a coral reef fish. Biology Letters, 8(1), 78-81.
Donelson, J.M., P.L. Munday, M.I. McCormick, and C.R. Pitcher, 2012: Rapid
transgenerational acclimation of a tropical reef fish to climate change. Nature
Climate Change, 2(1), 30-32.
Doney, S.C., 2006: Oceanography: plankton in a warmer world. Nature, 444(7120),
695-696.
Doney, S.C., 2010: The growing human footprint on coastal and open-ocean
biogeochemistry. Science, 328(5985), 1512-1516.
Donner, S.D., W.J. Skirving, C.M. Little, M. Oppenheimer, and O. Hoegh-Guldberg,
2005: Global assessment of coral bleaching and required rates of adaptation
under climate change. Global Change Biology, 11(12), 2251-2265.

470
Chapter 6 Ocean Systems
6
Dore, J.E., R. Lukas, D.W. Sadler, M.J. Church, and D.M. Karl, 2009: Physical and
biogeochemical modulation of ocean acidification in the central North Pacific.
Proceedings of the National Academy of Sciences of the United States of
America, 106(30), 12235-12240.
Douvere, F., 2008: The importance of marine spatial planning in advancing
ecosystem-based sea use management. Marine Policy, 32(5), 762-771.
Dove, S.G., D.I. Kline, O. Pantos, F.E. Angly, G.W. Tyson, and O. Hoegh-Guldberg, 2013:
Future reef decalcification under a business-as-usual CO
2
emission scenario.
Proceedings of the National Academy of Sciences of the United States of
America, 110(38), 15342-15347.
Dowsett, H.J., 2007: The PRISM palaeoclimate reconstruction and Pliocene sea-
surface temperature. In: Deep-time Perspectives on Climate Change: Marrying
the Signal from Computer Models and Biological Proxies [Williams, M., A.M.
Haywood, F.J. Gregory, and D.N. Schmidt (eds.)]. The Micropalaeontological
Society Special Publication, The Geological Society, London, UK, pp. 459-480.
Drinkwater, K.F., 2006: The regime shift of the 1920s and 1930s in the North Atlantic.
Progress in Oceanography, 68(2-4), 134-151.
Drinkwater, K.F., G. Beaugrand, M. Kaeriyama, S. Kim, G. Ottersen, R.I. Perry, H.-O.
Pörtner, J.J. Polovina, and A. Takasuka, 2010: On the processes linking climate
to ecosystem changes. Journal of Marine Systems, 79(3-4), 374-388.
Duce, R.A., J. LaRoche, K. Altieri, K.R. Arrigo, A.R. Baker, D.G. Capone, S. Cornell, F.
Dentener, J. Galloway, R.S. Ganeshram, R.J. Geider, T. Jickells, M.M. Kuypers, R.
Langlois, P.S. Liss, S.M. Liu, J.J. Middelburg, C.M. Moore, S. Nickovic, A. Oschlies,
T. Pedersen, J. Prospero, R. Schlitzer, S. Seitzinger, L.L. Sorensen, M. Uematsu, O.
Ulloa, M. Voss, B. Ward, and L. Zamora, 2008: Impacts of atmospheric
anthropogenic nitrogen on the open ocean. Science, 320(5878), 893-897.
Dulvy, N.K., S.I. Rogers, S. Jennings, V. Stelzenmüller, S.R. Dye, and H.R. Skjoldal, 2008:
Climate change and deepening of the North Sea fish assemblage: a biotic
indicator of warming seas. Journal of Applied Ecology, 45(4), 1029-1039.
Dunkley Jones, T., D.J. Lunt, D.N. Schmidt, A. Ridgwell, A. Sluijs, P.J. Valdes, and M.
Maslin, 2013: Climate model and proxy data constraints on ocean warming
across the Paleocene–Eocene Thermal Maximum. Earth-Science Reviews, 125,
123-145.
Dunne, J.A. and R.J. Williams, 2009: Cascading extinctions and community collapse
in model food webs. Philosophical Transactions of the Royal Society B,
364(1524), 1711-1723.
Dupont, S., B. Lundve, and M. Thorndyke, 2010: Near future ocean acidification
increases growth rate of the lecithotrophic larvae and juveniles of the sea star
Crossaster papposus. Journal of Experimental Zoology Part B: Molecular and
Developmental Evolution, 314(5), 382-389.
Dupont, S., N. Dorey, M. Stumpp, F. Melzner, and M. Thorndyke, 2013: Long-term and
trans-life-cycle effects of exposure to ocean acidification in the green sea urchin
Strongylocentrotus droebachiensis. Marine Biology, 160(8), 1835-1843.
Durack, P.J., S.E. Wijffels, and R.J. Matear, 2012: Ocean salinities reveal strong
global water cycle intensification during 1950 to 2000. Science, 336(6080),
455-458.
Dyhrman, S.T., S.T. Haley, S.R. Birkeland, L.L. Wurch, M.J. Cipriano, and A.G. McArthur,
2006: Long serial analysis of gene expression for gene discovery and
transcriptome profiling in the widespread marine coccolithophore Emiliania
huxleyi. Applied and Environmental Microbiology, 72(1), 252-260.
Easterling, D.R., G.A. Meehl, C. Parmesan, S.A. Changnon, T.R. Karl, and L.O. Mearns,
2000: Climate extremes: observations, modeling, and impacts. Science,
289(5487), 2068-2074.
Edmunds, P.J., 2011: Zooplanktivory ameliorates the effects of ocean acidification
on the reef coral Porites spp. Limnology and Oceanography, 56(6), 2402-2410.
Edwards, M. and A.J. Richardson, 2004: Impact of climate change on marine pelagic
phenology and trophic mismatch. Nature, 430(7002), 881-884.
Edwards, M., P.C. Reid, and B. Planque, 2001: Long-term and regional variability of
phytoplankton biomass in the Northeast Atlantic (1960-1995). ICES Journal of
Marine Science, 58(1), 39-49.
Edwards, M., D.G. Johns, S.C. Leterme, E. Svendsen, and A.J. Richardson, 2006:
Regional climate change and harmful algal blooms in the Northeast Atlantic.
Limnology and Oceanography, 51(2), 820-829.
Edwards, M., G. Beaugrand, P. Helaouët, J. Alheit, and S. Coombs, 2013: Marine
ecosystem response to the Atlantic Multidecadal Oscillation. PLoS ONE, 8(2),
e57212, doi:10.1371/journal.pone.0057212.
Eero, M., B.R. MacKenzie, F.W. Koster, and H. Gislason, 2011: Multi-decadal responses
of a cod (Gadus morhua) population to human-induced trophic changes, fishing,
and climate. Ecological Applications, 21(1), 214-226.
Eggert, A., R.J.W. Visser, P.R. Van Hasselt, and A.M. Breeman, 2006: Differences in
acclimation potential of photosynthesis in seven isolates of the tropical to warm
temperate macrophyte Valonia utricularis (Chlorophyta). Phycologia, 45(5),
546-556.
Eide, A., 2007: Economic impacts of global warming: the case of the Barents Sea
fisheries. Natural Resource Modeling, 20(2), 199-221.
Eide, A. and K. Heen, 2002: Economic impacts of global warming:a study of the
fishing industry in North Norway. Fisheries Research, 56(3), 261-274.
Ekau, W., H. Auel, H.-O. Pörtner, and D. Gilbert, 2010: Impacts of hypoxia on the structure
and processes in pelagic communities (zooplankton, macro-invertebrates and
fish). Biogeosciences, 7(5), 1669-1699.
Eliason, E.J., T.D. Clark, M.J. Hague, L.M. Hanson, Z.S. Gallagher, K.M. Jeffries, M.K.
Gale, D.A. Patterson, S.G. Hinch, and A.P. Farrell, 2011: Differences in thermal
tolerance among sockeye salmon populations. Science, 332(6025), 109-112.
Elmqvist, T., C. Folke, M. Nyström, G. Peterson, J. Bengtsson, B. Walker, and J. Norberg,
2003: Response diversity, ecosystem change, and resilience. Frontiers in Ecology
and the Environment, 1(9), 488-494.
Enfield, D.B., A.M. Mestas-Nuñez, and P.J. Trimble, 2001: The Atlantic Multidecadal
Oscillation and its relation to rainfall and river flows in the continental U.S.
Geophysical Research Letters, 28(10), 2077-2080.
Engel, A., S. Thoms, U. Riebesell, E. Rochelle-Newall, and I. Zondervan, 2004:
Polysaccharide aggregation as a potential sink of marine dissolved organic
carbon. Nature, 428(6986), 929-932.
Eppley, R.W., 1972: Temperature and phytoplankton growth in the sea. Fishery
Bulletin, 70(4), 1063-1085.
Etheridge, D.M., L.P. Steele, R.L. Langenfelds, R.J. Francey, J.M. Barnola, and V.I.
Morgan, 1996: Natural and anthropogenic changes in atmospheric CO
2
over
the last 1000 years from air in Antarctic ice and firn. Journal of Geophysical
Research, 101(D2), 4115-4128.
Fabricius, K.E., C. Langdon, S. Uthicke, C. Humphrey, S. Noonan, G. De’ath, R. Okazaki,
N. Muehllehner, M.S. Glas, and J.M. Lough, 2011: Losers and winners in coral
reefs acclimatized to elevated carbon dioxide concentrations. Nature Climate
Change, 1(3), 165-169.
Fairweather, T.P., C.D. van der Lingen, A.J. Booth, L. Drapeau, and J.J. van der
Westhuizen, 2006: Indicators of sustainable fishing for South African sardine
Sardinops sagax and anchovy Engraulis encrasicolus. African Journal of Marine
Science, 28(3-4), 661-680.
Falkenberg, L.J., S.D. Connell, and B.D. Russell, 2013: Disrupting the effects of synergies
between stressors: improved water quality dampens the effects of future CO
2
on a marine habitat. Journal of Applied Ecology, 50(1), 51-58.
Falkowski, P.G., 1997: Evolution of the nitrogen cycle and its influence on the
biological sequestration of CO
2
in the ocean. Nature, 387(6630), 272-275.
Falkowski, P.G. and J.A. Raven, 1997: Aquatic Photosynthesis. Blackwell Science,
Oxford, UK, 375 pp.
FAO, 2003: The Ecosystem Approach to Fisheries. FAO Technical Guidelines for
Responsible Fisheries, No. 4, Suppl. 2, Food and Agricultural Organization of
the United Nations (FAO), Rome, Italy, 112 pp.
FAO, 2012a: PART 3 – Feeding the world. Trends in the livestock sector. In: FAO
Statistical Yearbook 2012. World Food and Agriculture [Prakash, A. and M.
Stigler (eds.)]. Food and Agriculture Organization of the United Nations (FAO),
Rome, Italy, pp. 198-213.
FAO, 2012b: The State of World Fisheries and Aquaculture 2012. Food and Agriculture
Organization of the United Nations (FAO), Rome, Italy, 209 pp.
Fashchuk, D.Y., 2011: Marine Ecological Geography. Theory and Experience. Springer,
Berlin, Germany, 433 pp.
Feely, R.A., C.L. Sabine, J.M. Hernandez-Ayon, D. Ianson, and B. Hales, 2008: Evidence
for upwelling of corrosive “acidified” water onto the continental shelf. Science,
320(5882), 1490-1492.
Feely, R.A., S.R. Alin, J. Newton, C.L. Sabine, M. Warner, A. Devol, C. Krembs, and C.
Maloy, 2010: The combined effects of ocean acidification, mixing, and respiration
on pH and carbonate saturation in an urbanized estuary. Estuarine, Coastal
and Shelf Science, 88(4), 442-449.
Feng, Y., C.E. Hare, K. Leblanc, J.M. Rose, Y. Zhang, G.R. DiTullio, P.A. Lee, S.W. Wilhelm,
J.M. Rowe, J. Sun, N. Nemcek, C. Gueguen, U. Passow, I. Benner, C. Brown, and
D.A. Hutchins, 2009: Effects of increased pCO
2
and temperature on the North
Atlantic spring bloom. I. The phytoplankton community and biogeochemical
response. Marine Ecology Progress Series, 388, 13-25.
Fernandez, C., L. Farías, and O. Ulloa, 2011: Nitrogen fixation in denitrified marine
waters. PLoS ONE, 6(6), e20539, doi:10.1371/journal.pone.0020539.

471
Ocean Systems Chapter 6
6
Fernández-Reiriz, M.J., P. Range, X.A. Álvarez-Salgado, and U. Labarta, 2011:
Physiological energetics of juvenile clams (Ruditapes decussatus) in a high CO
2
coastal ocean. Marine Ecology Progress Series, 433, 97-105.
Fernando, H.J.S., J.L. McCulley, S.G. Mendis, and K. Perera, 2005: Coral poaching
worsens Tsunami destruction in Sri Lanka. Eos Transactions of the American
Geophysical Union, 86(33), 301-304.
Ferrari, M.C.O., D.L. Dixson, P.L. Munday, M.I. McCormick, M.G. Meekan, A. Sih, and
D.P. Chivers, 2011: Intrageneric variation in antipredator responses of coral reef
fishes affected by ocean acidification: implications for climate change projections
on marine communities. Global Change Biology, 17(9), 2980-2986.
Field, C.B., M.J. Behrenfeld, J.T. Randerson, and P. Falkowski, 1998: Primary production
of the biosphere: integrating terrestrial and oceanic components. Science,
281(5374), 237-240.
Field, D.B., T.R. Baumgartner, C.D. Charles, V. Ferreira-Bartrina, and M.D. Ohman, 2006:
Planktonic foraminifera of the California Current reflect 20
th
-century warming.
Science, 311(5757), 63-66.
Findlay, H.S., M.A. Kendall, J.I. Spicer, and S. Widdicombe, 2010: Post-larval development
of two intertidal barnacles at elevated CO
2
and temperature. Marine Biology,
157(4), 725-735.
Fish, M.R., A. Lombana, and C. Drews, 2009: Climate Change and Marine Turtles in
the Wider Caribbean: Regional Climate Projections. World Wildlife Federation
(WWF) Report, San José, Costa Rica, 18 pp.
Flombaum, P., J.L. Gallegos, R.A. Gordillo, J. Rincón, L.L. Zabala, N. Jiao, D.M. Karl,
W.K.W. Li, M.W. Lomas, D. Veneziano, C.S. Vera, J.A. Vrugt, and A.C. Martiny,
2013: Present and future global distributions of the marine Cyanobacteria
Prochlorococcus and Synechococcus. Proceedings of the National Academy of
Sciences of the United States of America, 110(24), 9824-9829.
Folke, C., S. Carpenter, B. Walker, M. Scheffer, T. Elmqvist, L. Gunderson, and C.S.
Holling, 2004: Regime shifts, resilience, and biodiversity in ecosystem
management. Annual Review of Ecology, Evolution, and Systematics, 35(1),
557-581.
Folt, C.L., C.Y. Chen, M.V. Moore, and J. Burnaford, 1999: Synergism and antagonism
among multiple stressors. Limnology and Oceanography, 44(3), 864-877.
Form, A. and U. Riebesell, 2012: Acclimation to ocean acidification during long-term
CO
2
exposure in the cold-water coral Lophelia pertusa. Global Change Biology,
18(3), 843-853.
Foster, L.C., D.N. Schmidt, E. Thomas, S. Arndt, and A. Ridgwell, 2013: Surviving rapid
climate change in the deep sea during the Paleogene hyperthermals. Proceedings
of the National Academy of Sciences of the United States of America, 110(23),
9273-9276.
Frank, K.T., B. Petrie, J.S. Choi, and W.C. Leggett, 2005: Trophic cascades in a formerly
cod-dominated ecosystem. Science, 308(5728), 1621-1623.
Franz, J., G. Krahmann, G. Lavik, P. Grasse, T. Dittmar, and U. Riebesell, 2012: Dynamics
and stoichiometry of nutrients and phytoplankton in waters influenced by the
oxygen minimum zone in the eastern tropical Pacific. Deep-Sea Research Part
I: Oceanographic Research Papers, 62, 20-31.
Friedland, K.D. and C.D. Todd, 2012: Changes in Northwest Atlantic Arctic and
Subarctic conditions and the growth response of Atlantic salmon. Polar Biology,
35(4), 593-609.
Friedland, K.D., C. Stock, K.F. Drinkwater, J.S. Link, R.T. Leaf, B.V. Shank, J.M. Rose,
C.H. Pilskaln, and M.J. Fogarty, 2012: Pathways between primary production
and fisheries yields of large marine ecosystems. PLoS ONE, 7(1), e28945,
doi:10.1371/journal.pone.0028945.
Friedrich, T., A. Timmermann, A. Abe-Ouchi, N.R. Bates, M.O. Chikamoto, M.J. Church,
J.E. Dore, D.K. Gledhill, M. González-Dávila, M. Heinemann, T. Ilyina, J.H.
Jungclaus, E. McLeod, A. Mouchet, and J.M. Santana-Casiano, 2012: Detecting
regional anthropogenic trends in ocean acidification against natural variability.
Nature Climate Change, 2(3), 167-171.
Frommel, A.Y., R. Maneja, D. Lowe, A.M. Malzahn, A.J. Geffen, A. Folkvord, U.
Piatkowski, T.B.H. Reusch, and C. Clemmesen, 2012: Severe tissue damage in
Atlantic cod larvae under increasing ocean acidification. Nature Climate
Change, 2(1), 42-46.
Fu, F.-X., M.E. Warner, Y. Zhang, Y. Feng, and D.A. Hutchins, 2007: Effects of increased
temperature and CO
2
on photosynthesis, growth, and elemental ratios in
marine Synechococcus and Prochlorococcus (Cyanobacteria). Journal of
Phycology, 43(3), 485-496.
Fu, F.-X., Y. Zhang, M.E. Warner, Y. Feng, J. Sun, and D.A. Hutchins, 2008: A comparison
of future increased CO
2
and temperature effects on sympatric Heterosigma
akashiwo and Prorocentrum minimum. Harmful Algae, 7(1), 76-90.
Fu, F.-X., A.R. Place, N.S. Garcia, and D.A. Hutchins, 2010: CO
2
and phosphate
availability control the toxicity of the harmful bloom dinoflagellate Karlodinium
veneficum. Aquatic Microbial Ecology, 59(1), 55-65.
Fu, F.-X., A.O. Tatters, and D.A. Hutchins, 2012: Global change and the future of harmful
algal blooms in the ocean. Marine Ecology Progress Series, 470, 207-233.
Fuentes, M.M.P.B., J.A. Maynard, M. Guinea, I.P. Bell, P.J. Werdell, and M. Hamann,
2009: Proxy indicators of sand temperature help project impacts of global
warming on sea turtles in northern Australia. Endangered Species Research,
9(1), 33-40.
Fulton, E.A., 2011: Interesting times: winners, losers, and system shifts under climate
change around Australia. ICES Journal of Marine Science, 68(6), 1329-1342.
Fulton, E.A., J.S. Link, I.C. Kaplan, M. Savina-Rolland, P. Johnson, C. Ainsworth, P.
Horne, R. Gorton, R.J. Gamble, A.D.M. Smith, and D.C. Smith, 2011: Lessons in
modelling and management of marine ecosystems: the Atlantis experience.
Fish and Fisheries, 12(2), 171-188.
Galbraith, H., R. Jones, R. Park, J. Clough, S. Herrod-Julius, B. Harrington, and G. Page,
2005: Global climate and sea level rise: potential losses of intertidal habitat
for shorebirds. In: Bird Conservation Implementation and Integration in the
Americas: Proceedings of the Third International Partners in Flight Conference,
2002, March 20-24, Asilomar, CA, Vol. 2 [Ralph, C.J. and T.D. Rich (eds.)]. General
Technical Report, PSW-GTR-191, U.S. Department of Agriculture, Forest Service,
Pacific Southwest Research Station, Albany, CA, USA, pp. 1119-1122.
Garcia, S.M. and A.A. Rosenberg, 2010: Food security and marine capture fisheries:
characteristics, trends, drivers and future perspectives. Philosophical Transactions
of the Royal Society B, 365(1554), 2869-2880.
Gardner, B., P.J. Sullivan, S. Epperly, and S.J. Morreale, 2008: Hierarchical modeling
of bycatch rates of sea turtles in the western North Atlantic. Endangered
Species Research, 5, 279-289.
Gazeau, F., L.M. Parker, S. Comeau, J.-P. Gattuso, W.A. O’Connor, S. Martin, H.-O. Pörtner,
and P.M. Ross, 2013: Impacts of ocean acidification on marine shelled molluscs.
Marine Biology, 160(8), 2207-2245.
Genner, M.J., D.W. Sims, V.J. Wearmouth, E.J. Southall, A.J. Southward, P.A. Henderson,
and S.J. Hawkins, 2004: Regional climatic warming drives long-term community
changes of British marine fish. Proceedings of the Royal Society B, 271(1539),
655-661.
Genner, M.J., D.W. Sims, A.J. Southward, G.C. Budd, P. Masterson, M. McHugh, P.
Rendle, E.J. Southall, V.J. Wearmouth, and S.J. Hawkins, 2010: Body size-
dependent responses of a marine fish assemblage to climate change and
fishing over a century-long scale. Global Change Biology, 16(2), 517-527.
Gibbs, S.J., P.R. Bown, J.A. Sessa, T.J. Bralower, and P.A. Wilson, 2006: Nannoplankton
extinction and origination across the Paleocene-Eocene Thermal Maximum.
Science, 314(5806), 1770-1773.
Gilly, W.F., U. Markaida, C.H. Baxter, B.A. Block, A. Boustany, L. Zeidberg, K.
Reisenbichler, B. Robison, G. Bazzino, and C. Salinas, 2006: Vertical and horizontal
migrations by the jumbo squid Dosidicus gigas revealed by electronic tagging.
Marine Ecology Progress Series, 324, 1-17.
Gilly, W.F., J.M. Beman, S.Y. Litvin, and B.H. Robison, 2013: Oceanographic and
biological effects of shoaling of the oxygen minimum zone. Annual Review of
Marine Science, 5, 393-420.
Giordano, M., J. Beardall, and J.A. Raven, 2005: CO
2
concentrating mechanisms in
algae: mechanisms, environmental modulation, and evolution. Annual Review
of Plant Biology, 56, 99-131.
Giovannoni, S.J. and K.L. Vergin, 2012: Seasonality in ocean microbial communities.
Science, 335(6069), 671-676.
Glynn, P.W. and L. D’Croz, 1990: Experimental evidence for high temperature stress
as the cause of El Niño-coincident coral mortality. Coral Reefs, 8(4), 181-191.
Godfrey, M.H., A.F. D’Amato, M.Â. Marcovaldi, and N. Mrosovsky, 1999: Pivotal
temperature and predicted sex ratios for hatchling hawksbill turtles from Brazil.
Canadian Journal of Zoology, 77(9), 1465-1473.
Gómez, I., A. Wulff, M. Roleda, P. Huovinen, U. Karsten, M.L. Quartino, K. Dunton,
and C. Wiencke, 2011: Light and temperature demands of benthic algae in the
polar regions. In: Biology of Polar Benthic Algae [Wiencke, C. (ed.)]. de Gruyter,
Berlin, Germany, pp. 195-220.
González-Taboada, F. and R. Anadón, 2012: Patterns of change in sea surface
temperature in the North Atlantic during the last three decades: beyond mean
trends. Climatic Change, 115(2), 419-431.
Gooday, A.J., B.J. Bett, E. Escobar, B. Ingole, L.A. Levin, C. Neira, A.V. Raman, and J.
Sellanes, 2010: Habitat heterogeneity and its relationship to biodiversity in
oxygen minimum zones. Marine Ecology, 31, 125-147.

472
Chapter 6 Ocean Systems
6
Gooding, R.A., C.D.G. Harley, and E. Tang, 2009: Elevated water temperature and
carbon dioxide concentration increase the growth of a keystone echinoderm.
Proceedings of the National Academy of Sciences of the United States of
America, 106(23), 9316-9321.
Goreau, T.J. and R.L. Hayes, 1994: Coral bleaching and ocean “Hot Spots”. Ambio,
23(3), 176-180.
Granier, C., U. Niemeier, J.H. Jungclaus, L. Emmons, P. Hess, J.F. Lamarque, S. Walters,
and G.P. Brasseur, 2006: Ozone pollution from future ship traffic in the Arctic
northern passages. Geophysical Research Letters, 33(13), L13807, doi:10.1029/
2006GL026180.
Gravelle, G. and N. Mimura, 2008: Vulnerability assessment of sea-level rise in Viti
Levu, Fiji Islands. Sustainability Science, 3(2), 171-180.
Gray, J.S., R.S.S. Wu, and Y.Y. Or, 2002: Effects of hypoxia and organic enrichment
on the coastal marine environment. Marine Ecology Progress Series, 238, 249-
279.
Green, J.L., B.J.M. Bohannan, and R.J. Whitaker, 2008: Microbial biogeography: from
taxonomy to traits. Science, 320(5879), 1039-1043.
Greene, C.H. and A.J. Pershing, 2003: The flip-side of the North Atlantic Oscillation
and modal shifts in slope-water circulation patterns. Limnology and
Oceanography, 48(1), 319-322.
Greene, C.H. and A.J. Pershing, 2007: Climate drives sea change. Science, 315(5815),
1084-1085.
Greene, C.H., A.J. Pershing, R.D. Kenney, and J.W. Jossi, 2003: Impact of climate
variability on the recovery of endangered North Atlantic right whales.
Oceanography, 16(4), 98-103.
Grémillet, D. and T. Boulinier, 2009: Spatial ecology and conservation of seabirds
facing global climate change: a review. Marine Ecology Progress Series, 391,
121-137.
Grieshaber, M., I. Hardewig, U. Kreutzer, and H.-O. Pörtner, 1994: Physiological and
metabolic responses to hypoxia in invertebrates. In: Reviews of Physiology,
Biochemistry and Pharmacology [Blaustein, M.P., H. Grunicke, E. Habermann,
D. Pette, H. Reuter, B. Sakmann, M. Schweiger, E. Weibel, and E.M. Wright (eds.)].
Springer, Berlin Heidelberg, Germany, pp. 43-147.
Griffith, G.P., E.A. Fulton, and A.J. Richardson, 2011: Effects of fishing and acidification-
related benthic mortality on the southeast Australian marine ecosystem. Global
Change Biology, 17(10), 3058-3074.
Griffith, G.P., E.A. Fulton, R. Gorton, and A.J. Richardson, 2012: Predicting interactions
among fishing, ocean warming, and ocean acidification in a marine system
with whole-ecosystem models. Conservation Biology, 26(6), 1145-1152.
Grossart, H.P., M. Allgaier, U. Passow, and U. Riebesell, 2006: Testing the effect of
CO
2
concentration on the dynamics of marine heterotrophic bacterioplankton.
Limnology and Oceanography, 51(1), 1-11.
Gruber, N., 2011: Warming up, turning sour, losing breath: ocean biogeochemistry
under global change. Philosophical Transactions of the Royal Society A,
369(1943), 1980-1996.
Guinotte, J.M., J. Orr, S. Cairns, A. Freiwald, L. Morgan, and R. George, 2006: Will
human-induced changes in seawater chemistry alter the distribution of deep-
sea scleractinian corals? Frontiers in Ecology and the Environment, 4(3), 141-
146.
Gutowska, M.A., H.-O. Pörtner, and F. Melzner, 2008: Growth and calcification in the
cephalopod Sepia officinalis under elevated seawater pCO
2
. Marine Ecology
Progress Series, 373, 303-309.
Haines, A., R.S. Kovats, D. Campbell-Lendrum, and C. Corvalan, 2006: Climate change
and human health: impacts, vulnerability, and mitigation. The Lancet,
367(9528), 2101-2109.
Hales, S., P. Weinstein, and A. Woodward, 1999: Ciguatera (fish poisoning), El Niño,
and Pacific sea surface temperatures. Ecosystem Health, 5(1), 20-25.
Halfar, J., S. Hetzinger, W. Adey, T. Zack, G. Gamboa, B. Kunz, B. Williams, and D.E. Jacob,
2011: Coralline algal growth-increment widths archive North Atlantic climate
variability. Palaeogeography, Palaeoclimatology, Palaeoecology, 302(1-2), 71-
80.
Hall-Spencer, J.M., R. Rodolfo-Metalpa, S. Martin, E. Ransome, M. Fine, S.M. Turner,
S.J. Rowley, D. Tedesco, and M.-C. Buia, 2008: Volcanic carbon dioxide vents
show ecosystem effects of ocean acidification. Nature, 454(7200), 96-99.
Hallegraeff, G.M., 2010: Ocean climate change, phytoplankton community
responses, and harmful algal blooms: a formidable predictive challenge. Journal
of Phycology, 46(2), 220-235.
Hannah, C., A. Vezina, and M. St. John, 2010: The case for marine ecosystem models
of intermediate complexity. Progress in Oceanography, 84(1-2), 121-128.
Hannesson, R., 2007: Global warming and fish migrations. Natural Resource
Modeling, 20(2), 301-319.
Hansen, P.J., N. Lundholm, and B. Rost, 2007: Growth limitation in marine red-tide
dinoflagellates: effects of pH versus inorganic carbon availability. Marine
Ecology Progress Series, 334, 63-71.
Hare, J.A., M.J. Wuenschel, and M.E. Kimball, 2012: Projecting range limits with
coupled thermal tolerance –climate change models: an example based on gray
snapper (Lutjanus griseus) along the U.S. east coast. PLoS ONE, 7(12), e52294,
doi:10.1371/journal.pone.0052294.
Harley, C.D.G., 2011: Climate change, keystone predation, and biodiversity loss.
Science, 334(6059), 1124-1127.
Harley, C.D.G., K.M. Anderson, K.W. Demes, J.P. Jorve, R.L. Kordas, T.A. Coyle, and
M.H. Graham, 2012: Effects of climate change on global seaweed communities.
Journal of Phycology, 48(5), 1064-1078.
Harvell, D., S. Altizer, I.M. Cattadori, L. Harrington, and E. Weil, 2009: Climate change
and wildlife diseases: when does the host matter the most? Ecology, 90(4),
912-920.
Harvey, B.P., D. Gwynn-Jones, and P.J. Moore, 2013: Meta-analysis reveals complex
marine biological responses to the interactive effects of ocean acidification and
warming. Ecology and Evolution, 3(4), 1016-1030.
Hashioka, T. and Y. Yamanaka, 2007: Ecosystem change in the western North Pacific
associated with global warming using 3D-NEMURO. Ecological Modelling,
202(1-2), 95-104.
Hawkes, L.A., A.C. Broderick, M.H. Godfrey, and B.J. Godley, 2009: Climate change
and marine turtles. Endangered Species Research, 7(2), 137-154.
Hawkins, S.J., 2012: Marine conservation in a rapidly changing world. Aquatic
Conservation: Marine and Freshwater Ecosystems, 22(3), 281-287.
Hays, G.C., A.C. Broderick, F. Glen, and B.J. Godley, 2003: Climate change and sea
turtles: a 150-year reconstruction of incubation temperatures at a major marine
turtle rookery. Global Change Biology, 9(4), 642-646.
Haywood, A.M., M.A. Chandler, P.J. Valdes, U. Salzmann, D.J. Lunt, and H.J. Dowsett,
2009: Comparison of mid-Pliocene climate predictions produced by the
HadAM3 and GCMAM3 General Circulation Models. Global and Planetary
Change, 66(3-4), 208-224.
Hazen, E.L., J.K. Craig, C.P. Good, and L.B. Crowder, 2009: Vertical distribution of fish
biomass in hypoxic waters on the Gulf of Mexico shelf. Marine Ecology Progress
Series, 375, 195-207.
Hazen, E.L., S. Jorgensen, R.R. Rykaczewski, S.J. Bograd, D.G. Foley, I.D. Jonsen, S.A.
Shaffer, J.P. Dunne, D.P. Costa, L.B. Crowder, and B.A. Block, 2013: Predicted
habitat shifts of Pacific top predators in a changing climate. Nature Climate
Change, 3, 234-238.
Head, E.J.H. and P. Pepin, 2010: Spatial and inter-decadal variability in plankton
abundance and composition in the Northwest Atlantic (1958–2006). Journal
of Plankton Research, 32(12), 1633-1648.
Heath, M., M. Edwards, R. Furness, J. Pinnegar, and S. Wanless, 2009: A view from
above: changing seas, seabirds and food sources. In: Marine Climate Change
Ecosystem Linkages Report Card [Baxter, J.M., P.J. Buckley, and M.T. Frost (eds.)].
Marine Climate Change Impacts Partnership (MCCIP), Lowestoft, UK, 24 pp.
Heisler, N. (ed.), 1986: Acid-base Regulation in Animals. Elsevier, Amsterdam,
Netherlands, 492 pp.
Helm, K.P., N.L. Bindoff, and J.A. Church, 2010: Changes in the global hydrological-
cycle inferred from ocean salinity. Geophysical Research Letters, 37(18),
L18701, doi:10.1029/2010GL044222.
Henson, S., J.L. Sarmiento, J.P. Dunne, L. Bopp, I. Lima, S.C. Doney, J. John, and C.
Beaulieu, 2010: Detection of anthropogenic climate change in satellite records
of ocean chlorophyll and productivity. Biogeosciences, 7(2), 621-640.
Henson, S., H. Cole, C. Beaulieu, and A. Yool, 2013: The impact of global warming on
seasonality of ocean primary production. Biogeosciences, 10, 4357-4369.
Higginson, M.J., M.A. Altabet, D.W. Murray, R.W. Murray, and T.D. Herbert, 2004:
Geochemical evidence for abrupt changes in relative strength of the Arabian
monsoons during a stadial/interstadial climate transition. Geochimica et
Cosmochimica Acta, 68(19), 3807-3826.
Hill, V.J., P.A. Matrai, E. Olson, S. Suttles, M. Steele, L.A. Codispoti, and R.C.
Zimmerman, 2013: Synthesis of integrated primary production in the Arctic
Ocean: II. In situ and remotely sensed estimates. Progress in Oceanography,
110, 107-125.
Hinder, S.L., G.C. Hays, M. Edwards, E.C. Roberts, A.W. Walne, and M.B. Gravenor,
2012: Changes in marine dinoflagellate and diatom abundance under climate
change. Nature Climate Change, 2(4), 271-275.

473
Ocean Systems Chapter 6
6
Hoegh-Guldberg, O., 1999: Climate change, coral bleaching and the future of the
world’s coral reefs. Marine and Freshwater Research, 50(8), 839-866.
Hoegh-Guldberg, O., 2011: Coral reef ecosystems and anthropogenic climate
change. Regional Environmental Change, 11, 215-227.
Hoegh-Guldberg, O. and J.F. Bruno, 2010: The impact of climate change on the
world’s marine ecosystems. Science, 328(5985), 1523-1528.
Hoegh-Guldberg, O. and B. Salvat, 1995: Periodic mass-bleaching and elevated sea
temperatures: bleaching of outer reef slope communities in Moorea, French
Polynesia. Marine Ecology Progress Series, 121, 181-190.
Hoegh-Guldberg, O. and G.J. Smith, 1989: The effect of sudden changes in
temperature, light and salinity on the population density and export of
zooxanthellae from the reef corals Stylophora pistillata Esper and Seriatopora
hystrix Dana. Journal of Experimental Marine Biology and Ecology, 129(3),
279-303.
Hoel, A.H., 2009: Best Practices in Ecosystem Based Ocean Management in the Arctic.
Norsk Polarinstitutt, Tromsø, Norway, 116 pp.
Hoffmann, L.J., E. Breitbarth, P.W. Boyd, and K.A. Hunter, 2012: Influence of ocean
warming and acidification on trace metal biogeochemistry. Marine Ecology
Progress Series, 470, 191-205.
Holcomb, M., A.L. Cohen, and D.C. McCorkle, 2012: An investigation of the calcification
response of the scleractinian coral Astrangia poculata to elevated pCO
2
and the
effects of nutrients, zooxanthellae and gender. Biogeosciences, 9(1), 29-39.
Holt, J., S. Wakelin, J. Lowe, and J. Tinker, 2010: The potential impacts of climate
change on the hydrography of the northwest European continental shelf.
Progress in Oceanography, 86(3-4), 361-379.
Hönisch, B., A. Ridgwell, D.N. Schmidt, E. Thomas, S.J. Gibbs, A. Sluijs, R. Zeebe, L.
Kump, R.C. Martindale, S.E. Greene, W. Kiessling, J. Ries, J.C. Zachos, D.L. Royer,
S. Barker, T.M. Marchitto, R. Moyer, C. Pelejero, P. Ziveri, G.L. Foster, and B.
Williams, 2012: The geological record of ocean acidification. Science,
335(6072), 1058-1063.
Hoppe, C.J.M., G. Langer, and B. Rost, 2011: Emiliania huxleyi shows identical
responses to elevated pCO
2
in TA and DIC manipulations. Journal of Experimental
Marine Biology and Ecology, 406(1-2), 54-62.
Hoppe, H.-G., K. Gocke, R. Koppe, and C. Begler, 2002: Bacterial growth and primary
production along a north-south transect of the Atlantic Ocean. Nature,
416(6877), 168-171.
House, K.Z., C.H. House, D.P. Schrag, and M.J. Aziz, 2007: Electrochemical acceleration
of chemical weathering as an energetically feasible approach to mitigating
anthropogenic climate change. Environmental Science & Technology, 41(24),
8464-8470.
Howarth, R., F. Chan, D.J. Conley, J. Garnier, S.C. Doney, R. Marino, and G. Billen, 2011:
Coupled biogeochemical cycles: eutrophication and hypoxia in temperate estuaries
and coastal marine ecosystems. Frontiers in Ecology and the Environment, 9(1),
18-26.
Howells, E.J., V.H. Beltran, N.W. Larsen, L.K. Bay, B.L. Willis, and M.J.H. van Oppen,
2012: Coral thermal tolerance shaped by local adaptation of photosymbionts.
Nature Climate Change, 2(2), 116-120.
Hsieh, C.-H., C.S. Reiss, J.R. Hunter, J.R. Beddington, R.M. May, and G. Sugihara, 2006:
Fishing elevates variability in the abundance of exploited species. Nature,
443(7113), 859-862.
Hsieh, C.-H., C.S. Reiss, R.P. Hewitt, and G. Sugihara, 2008: Spatial analysis shows
that fishing enhances the climatic sensitivity of marine fishes. Canadian Journal
of Fisheries and Aquatic Sciences, 65(5), 947-961.
Huber, R., T.A. Langworthy, H. König, M. Thomm, C.R. Woese, U.B. Sleytr, and K.O.
Stetter, 1986: Thermotoga maritima sp. nov. represents a new genus of unique
extremely thermophilic eubacteria growing up to 90°C. Archives of Microbiology,
144(4), 324-333.
Huey, R.B. and J.G. Kingsolver, 1989: Evolution of thermal sensitivity of ectotherm
performance. Trends in Ecology and Evolution, 4(5), 131-135.
Hughes, L., 2000: Biological consequences of global warming: is the signal already
apparent? Trends in Ecology and Evolution, 15(2), 56-61.
Hughes, R.G., 2004: Climate change and loss of saltmarshes: consequences for birds.
Ibis, 146, 21-28.
Hughes, T.P., A.H. Baird, E.A. Dinsdale, N.A. Moltschaniwskyj, M.S. Pratchett, J.E.
Tanner, and B.L. Willis, 2012: Assembly rules of reef corals are flexible along a
steep climatic gradient. Current Biology, 22(8), 736-741.
Hunt, B.P.V., E.A. Pakhomov, G.W. Hosie, V. Siegel, P. Ward, and K. Bernard, 2008:
Pteropods in Southern Ocean ecosystems. Progress in Oceanography, 78(3),
193-221.
Huntley, B., R.E. Green, Y.C. Collingham, and S.G. Willis, 2007: A Climatic Atlas of
European Breeding Birds. Lynx Editions, Barcelona, Spain, 521 pp.
Hutchins, D.A., F.-X. Fu, Y. Zhang, M.E. Warner, Y. Feng, K. Portune, P.W. Bernhardt,
and M.R. Mulholland, 2007: CO
2
control of Trichodesmium N
2
fixation,
photosynthesis, growth rates, and elemental ratios: implications for past,
present, and future ocean biogeochemistry. Limnology and Oceanography,
52(4), 1293-1304.
Hutchins, D.A., M.R. Mulholland, and F.-X. Fu, 2009: Nutrient cycles and marine
microbes in a CO
2
-enriched ocean. Oceanography, 22(4), 128-145.
Hutchins, D.A., F.-X. Fu, E.A. Webb, N. Walworth, and A. Tagliabue, 2013: Taxon-
specific response of marine nitrogen fixers to elevated carbon dioxide
concentrations. Nature Geoscience, 6, 790-795.
Iglesias-Rodriguez, M.D., P.R. Halloran, R.E. Rickaby, I.R. Hall, E. Colmenero-Hidalgo,
J.R. Gittins, D.R. Green, T. Tyrrell, S.J. Gibbs, P. von Dassow, E. Rehm, E.V.
Armbrust, and K.P. Boessenkool, 2008: Phytoplankton calcification in a high-
CO
2
world. Science, 320(5874), 336-340.
Ilyina, T., R.E. Zeebe, and P.G. Brewer, 2010: Future ocean increasingly transparent
to low-frequency sound owing to carbon dioxide emissions. Nature Geoscience,
3(1), 18-22.
IPCC, 2000: Emissions Scenarios. A Special Report of Working Group III of the
Intergovernmental Panel on Climate Change [Nakićenović, N. and R. Swart
(eds.)]. Cambridge University Press, Cambridge, UK and New York, NY, USA,
570 pp.
IPCC, 2012a: Managing the Risks of Extreme Events and Disasters to Advance
Climate Change Adaptation. A Special Report of Working Groups I and II of the
Intergovernmental Panel on Climate Change [Field, C.B., V. Barros, T.F. Stocker,
D. Qin, D.J. Dokken, K.L. Ebi, M.D. Mastrandrea, K.J. Mach, G.-K. Plattner, S.K.
Allen, M. Tignor, and P.M. Midgley (eds.)]. Cambridge University Press,
Cambridge, UK and New York, NY, USA, 594 pp.
IPCC, 2012b: Meeting Report of the Intergovernmental Panel on Climate Change
Expert Meeting on Geoengineering [Edenhofer, O., R. Pichs-Madruga, Y. Sokona,
C. Field, V. Barros, T.F. Stocker, Q. Dahe, J. Minx, K. Mach, G.-K. Plattner, S.
Schlömer, G. Hansen, and M. Mastrandrea (eds.)]. IPCC Working Group III
Technical Support Unit, Potsdam Institute for Climate Impact Research,
Potsdam, Germany, 99 pp.
Ishimatsu, A. and A. Dissanayake, 2010: Life threatened in acidic coastal waters. In:
Coastal Environmental and Ecosystem Issues of the East China Sea [Ishimatsu,
A. and H.-J. Lie (eds.)]. Terra Scientific Publishing Company (TERRAPUB) and
Nagasaki University, Nagasaki, Japan, pp. 283-303.
Ishimatsu, A., M. Hayashi, and T. Kikkawa, 2008: Fishes in high-CO
2
, acidified oceans.
Marine Ecology Progress Series, 373, 295-302.
Ito, S., K.A. Rose, A.J. Miller, K. Drinkwater, K. Brander, J.E. Overland, S. Sundby, E.
Curchitser, J.W. Hurrell, and Y. Yamanaka, 2010: Ocean ecosystem responses to
future global change scenarios: a way forward. In: Global Change and Marine
Ecosystems [Barange, M., J.G. Field, R.P. Harris, E.E. Hofmann, R.I. Perry, and F.
Werner (eds.)]. Oxford University Press, Oxford, UK, pp. 287-322.
Jaccard, S.L. and E.D. Galbraith, 2012: Large climate-driven changes of oceanic
oxygen concentrations during the last deglaciation. Nature Geoscience, 5(2),
151-156.
Jackson, G.A. and A.B. Burd, 2001: A model for the distribution of particle flux in the
mid-water column controlled by subsurface biotic interactions. Deep-Sea
Research Part II: Topical Studies in Oceanography, 49(1-3), 193-217.
Jackson, J.B.C. and K.G. Johnson, 2000: Life in the last few million years. Paleobiology,
26(4), 221-235.
Jacobs, S.S. and C.F. Giulivi, 2010: Large multidecadal salinity trends near the Pacific-
Antarctic continental margin. Journal of Climate, 23(17), 4508-4524.
Jantzen, C., V. Häussermann, G. Försterra, J. Laudien, M. Ardelan, S. Maier, and C.
Richter, 2013: Occurrence of a cold-water coral along natural pH gradients
(Patagonia, Chile). Marine Biology, 160(10), 2597-2607.
Jarre, A. and L.J. Shannon, 2010: Regime shifts: physical-biological interactions under
climatic and anthropogenic pressures. In: Marine Ecocystems and Global
Change [Barange, M., J.G. Field, R.P. Harris, E.E. Hofmann, R.I. Perry, and F.
Werner (eds.)]. Oxford University Press, Oxford, UK, pp. 215-216.
Jenkyns, H.C., 2010: Geochemistry of oceanic anoxic events. Geochemistry
Geophysics Geosystems, 11(3), Q03004, doi:10.1029/2009GC002788.
Jenouvrier, S., M. Holland, J. Stroeve, C. Barbraud, H. Weimerskirch, M. Serreze, and
H. Caswell, 2012: Effects of climate change on an emperor penguin population:
analysis of coupled demographic and climate models. Global Change Biology,
18(9), 2756-2770.

474
Chapter 6 Ocean Systems
6
Jessen, G.L., R.A. Quiñones, and R.R. González, 2009: Aerobic and anaerobic enzymatic
activity and allometric scaling of the deep benthic polychaete Hyalinoecia
artifex (Polychaeta: Onuphidae). Journal of the Marine Biological Association
of the United Kingdom, 89(6), 1171-1175.
Jin, D., E. Thunberg, and P. Hoagland, 2008: Economic impact of the 2005 red tide
event on commercial shellfish fisheries in New England. Ocean & Coastal
Management, 51(5), 420-429.
Jin, X. and N. Gruber, 2003: Offsetting the radiative benefit of ocean iron fertilization
by enhancing N
2
O emissions. Geophysical Research Letters, 30(24), 2249,
doi:10.1029/2003GL018458.
Johns, D.G., M. Edwards, and S.D. Batten, 2001: Arctic boreal plankton species in the
Northwest Atlantic. Canadian Journal of Fisheries and Aquatic Sciences, 58(11),
2121-2124.
Johns, D.G., M. Edwards, A. Richardson, and J.I. Spicer, 2003: Increased blooms of a
dinoflagellate in the NW Atlantic. Marine Ecology Progress Series, 265, 283-287.
Johnson, K.S., S.C. Riser, and D.M. Karl, 2010: Nitrate supply from deep to near-
surface waters of the North Pacific subtropical gyre. Nature, 465(7301), 1062-
1065.
Joint, I., S.C. Doney, and D.M. Karl, 2011: Will ocean acidification affect marine
microbes? ISME Journal, 5(1), 1-7, doi:10.1038/ismej.2010.79.
Jones, A.M., R. Berkelmans, M.J.H. van Oppen, J.C. Mieog, and W. Sinclair, 2008: A
community change in the algal endosymbionts of a scleractinian coral following
a natural bleaching event: field evidence of acclimatization. Proceedings of the
Royal Society B, 275(1641), 1359-1365.
Jones, M.C., S.R. Dye, J.A. Fernandes, T.L. Frölicher, J.K. Pinnegar, R. Warren, and W.W.L.
Cheung, 2013: Predicting the impact of climate change on threatened species
in UK waters. PLoS ONE, 8(1), e54216, doi:10.1371/journal.pone.0054216.
Jones, P.D., M. New, D.E. Parker, S. Martin, and I.G. Rigor, 1999: Surface air temperature
and its changes over the past 150 years. Reviews of Geophysics, 37(2), 173-
199.
Jones, R.J., O. Hoegh-Guldberg, A.W.D. Larkum, and U. Schreiber, 1998: Temperature-
induced bleaching of corals begins with impairment of the CO
2
fixation
mechanism in zooxanthellae. Plant, Cell and Environment, 21(12), 1219-1230.
Jutfelt, F., K. Bresolin de Souza, A. Vuylsteke, and J. Sturve, 2013: Behavioural
disturbances in a temperate fish exposed to sustained high-CO
2
levels. PLoS
ONE, 8(6), e65825, doi:10.1371/journal.pone.0065825.
Kaniewska, P., P.R. Campbell, D.I. Kline, M. Rodriguez-Lanetty, D.J. Miller, S. Dove,
and O. Hoegh-Guldberg, 2012: Major cellular and physiological impacts of
ocean acidification on a reef building coral. PLoS ONE, 7(4), e34659,
doi:10.1371/journal.pone.0034659.
Karl, D.M., R.R. Bidigare, and R.M. Letelier, 2001: Long-term changes in plankton
community structure and productivity in the North Pacific Subtropical Gyre: the
domain shift hypothesis. Deep-Sea Research Part II: Topical Studies in
Oceanography, 48(8-9), 1449-1470.
Karl, D.M., N. Bates, S. Emerson, P.J. Harrison, C. Jeandel, O. Llinás, K.K. Liu, J.-C. Matry,
A.F. Michaels, J.C. Miquel, S. Neuer, Y. Nojiri, and C.S. Wong, 2003: Temporal
studies of biogeochemical processes determined from ocean time-series
observations during the JGOFS era. In: Ocean Biogeochemistry: The Role of the
Ocean Carbon Cycle in Global Change [Fasham, M.J.R. (ed.)]. Springer, Berlin,
Germany, pp. 239-267.
Karstensen, J., L. Stramma, and M. Visbeck, 2008: Oxygen minimum zones in the
eastern tropical Atlantic and Pacific oceans. Progress in Oceanography, 77(4),
331-350.
Kaschner, K., D.P. Tittensor, J. Ready, T. Gerrodette, and B. Worm, 2011: Current and
future patterns of global marine mammal biodiversity. PLoS ONE, 6(5), e19653,
doi:10.1371/journal.pone.0019653.
Kashefi, K. and D.R. Lovley, 2003: Extending the upper temperature limit for life.
Science, 301(5635), 934.
Katsikatsou, M., A. Anestis, H.-O. Pörtner, A. Vratsistas, K. Aligizaki, and B. Michaelidis,
2012: Field studies and projections of climate change effects on the bearded
horse mussel Modiolus barbatus in the Gulf of Thermaikos, Greece. Marine
Ecology Progress Series, 449, 183-196.
Keeling, C.D., S.C. Piper, R.B. Bacastow, M. Wahlen, T.P. Whorf, M. Heimann, and H.A.
Meijer, 2005: Atmospheric CO
2
and
13
CO
2
exchange with the terrestrial
biosphere and oceans from 1978 to 2000: observations and carbon cycle
implications. In: A History of Atmospheric CO
2
and its Effects on Plants, Animals,
and Ecosystems [Baldwin, I.T., M.M. Caldwell, G. Heldmaier, R.B. Jackson, O.L.
Lange, H.A. Mooney, E.-D. Schulze, and U. Sommer (eds.)]. Springer, New York,
NY, USA, pp. 83-113.
Keeling, R.F., A. Körtzinger, and N. Gruber, 2010: Ocean deoxygenation in a warming
world. Annual Review of Marine Science, 2(1), 199-229.
Kelly, M.W., E. Sanford, and R.K. Grosberg, 2012: Limited potential for adaptation
to climate change in a broadly distributed marine crustacean. Proceedings of
the Royal Society B, 279(1727), 349-356.
Kennett, J.P. and L.D. Stott, 1991: Abrupt deep-sea warming, palaeoceanographic
changes and benthic extinctions at the end of the Paleocene. Nature,
353(6341), 225-229.
Kiessling, W. and C. Simpson, 2011: On the potential for ocean acidification to be a
general cause of ancient reef crises. Global Change Biology, 17(1), 56-67.
Kiessling, W., C. Simpson, B. Beck, H. Mewis, and J.M. Pandolfi, 2012: Equatorial
decline of reef corals during the last Pleistocene interglacial. Proceedings of
the National Academy of Sciences of the United States of America, 109(52),
21378-21383.
Kim, J.-M., K. Lee, K. Shin, E.J. Yang, A. Engel, D.M. Karl, and H.-C. Kim, 2011: Shifts
in biogenic carbon flow from particulate to dissolved forms under high carbon
dioxide and warm ocean conditions. Geophysical Research Letters, 38(8),
L08612, doi:10.1029/2011GL047346.
Kirby, R.R. and G. Beaugrand, 2009: Trophic amplification of climate warming.
Proceedings of the Royal Society B, 276(1676), 4095-4103.
Kirby, R.R., G. Beaugrand, and J.A. Lindley, 2009: Synergistic effects of climate and
fishing in a marine ecosystem. Ecosystems, 12(4), 548-561.
Kirchman, D.L., X.A. Morán, and H. Ducklow, 2009: Microbial growth in the polar
oceans – role of temperature and potential impact of climate change. Nature
Reviews Microbiology, 7(6), 451-459.
Kirk, J.T.O., 1994: Light and Photosynthesis in Aquatic Ecosystems. Cambridge
University Press, Cambridge, UK, 662 pp.
Klaas, C. and D.E. Archer, 2002: Association of sinking organic matter with various
types of mineral ballast in the deep sea: implications for the rain ratio. Global
Biogeochemical Cycles, 16(4), 1116, doi:10.1029/2001GB001765.
Kleypas, J.A. and C. Langdon, 2006: Coral reefs and changing seawater chemistry.
In: Coral Reefs and Climate Change: Science and Management [Phinney, J., O.
Hoegh-Guldberg, J. Kleypas, W. Skirving, and A.E. Strong (eds.)]. American
Geophysical Union, Washington, DC, USA, pp. 73-110.
Knies, J.L., R. Izem, K.L. Supler, J.G. Kingsolver, and C.L. Burch, 2006: The genetic basis
of thermal reaction norm evolution in lab and natural phage populations. PLoS
Biology, 4(7), e201, doi:10.1371/journal.pbio.0040201.
Knoll, A. and W.W. Fischer, 2011: Skeletons and ocean chemistry: the long view. In:
Ocean Acidification [Gattuso, J.-P. and L. Hansson (eds.)]. Oxford University
Press, Oxford, UK, pp. 67-82.
Knoll, A., R.K. Bambach, J.L. Payne, S. Pruss, and W.W. Fischer, 2007: Paleophysiology
and end-Permian mass extinction. Earth and Planetary Science Letters,
256(3-4), 295-313.
Köhler, P., J. Hartmann, and D.A. Wolf-Gladrow, 2010: Geoengineering potential
of artificially enhanced silicate weathering of olivine. Proceedings of the
National Academy of Sciences of the United States of America, 107(47), 20228-
20233.
Koslow, J.A., R. Goericke, A. Lara-Lopez, and W. Watson, 2011: Impact of declining
intermediate-water oxygen on deepwater fishes in the California Current.
Marine Ecology Progress Series, 436, 207-218.
Kovach, R.P., A.J. Gharrett, and D.A. Tallmon, 2012: Genetic change for earlier
migration timing in a pink salmon population. Proceedings of the Royal Society
B, 279(1743), 3870-3878.
Kovats, R.S., M.J. Bouma, S. Hajat, E. Worrall, and A. Haines, 2003: El Niño and health.
The Lancet, 362(9394), 1481-1489.
Kranz, S.A., O. Levitan, K.U. Richter, O. Prášil, I. Berman-Frank, and B. Rost, 2010:
Combined effects of CO
2
and light on the N
2
-fixing cyanobacterium
Trichodesmium IMS101: physiological responses. Plant Physiology, 154(1), 334-
345.
Kranz, S.A., M. Eichner, and B. Rost, 2011: Interactions between CCM and N
2
fixation
in Trichodesmium. Photosynthesis Research, 109(1-3), 73-84.
Krause, E., A. Wichels, L. Giménez, M. Lunau, M.B. Schilhabel, and G. Gerdts, 2012:
Small changes in pH have direct effects on marine bacterial community
composition: a microcosm approach. PLoS ONE, 7(10), e47035, doi:10.1371/
journal.pone.0047035.
Kroeker, K.J., F. Micheli, M.C. Gambi, and T.R. Martz, 2011: Divergent ecosystem
responses within a benthic marine community to ocean acidification.
Proceedings of the National Academy of Sciences of the United States of
America, 108(35), 14515-14520.

475
Ocean Systems Chapter 6
6
Kroeker, K.J., R.L. Kordas, R. Crim, I.E. Hendriks, L. Ramajo, G.S. Singh, C.M. Duarte,
and J.-P. Gattuso, 2013: Impacts of ocean acidification on marine organisms:
quantifying sensitivities and interaction with warming. Global Change Biology,
19(6), 1884-1896.
Kübler, J.E. and I.R. Davison, 1995: Thermal acclimation of light use characteristics
of Chondrus crispus (Rhodophyta). European Journal of Phycology, 30(3), 189-
195.
Kurihara, H. and Y. Shirayama, 2004: Effects of increased amospheric CO
2
on sea
urchin early development. Marine Ecology Progress Series, 274, 161-169.
La Sorte, F.A. and W. Jetz, 2010: Avian distributions under climate change: towards
improved projections. Journal of Experimental Biology, 213(6), 862-869.
Lafferty, K.D., 2009: Calling for an ecological approach to studying climate change
and infectious diseases. Ecology, 90(4), 932-933.
Laidre, K.L., I. Stirling, L.F. Lowry, O. Wiig, M.P. Heide-Jørgensen, and S.H. Ferguson,
2008: Quantifying the sensitivity of Arctic marine mammals to climate-induced
habitat change. Ecological Applications, 18(Suppl 2), S97-S125.
Lam, P.J. and J.K.B. Bishop, 2008: The continental margin is a key source of iron to
the HNLC North Pacific Ocean. Geophysical Research Letters, 35(7), L07608,
doi:10.1029/2008GL033294.
Lambert, E., C. Hunter, G.J. Pierce, and C.D. MacLeod, 2010: Sustainable whale-
watching tourism and climate change: towards a framework of resilience.
Journal of Sustainable Tourism, 18(3), 409-427.
Langdon, C. and M.J. Atkinson, 2005: Effect of elevated pCO
2
on photosynthesis and
calcification of corals and interactions with seasonal change in temperature/
irradiance and nutrient enrichment. Journal of Geophysical Research, 110(C9),
C09S07, doi:10.1029/2004JC002576.
Langenbuch, M. and H.-O. Pörtner, 2002: Changes in metabolic rate and N excretion
in the marine invertebrate Sipunculus nudus under conditions of environmental
hypercapnia: identifying effective acid-base variables. Journal of Experimental
Biology, 205(8), 1153-1160.
Langenbuch, M. and H.-O. Pörtner, 2003: Energy budget of hepatocytes from Antarctic
fish (Pachycara brachycephalum and Lepidonotothen kempi) as a function of
ambient CO
2
: pH-dependent limitations of cellular protein biosynthesis? Journal
of Experimental Biology, 206(22), 3895-3903.
Langenbuch, M., C. Bock, D. Leibfritz, and H.-O. Pörtner, 2006: Effects of environmental
hypercapnia on animal physiology: a
13
C NMR study of protein synthesis rates
in the marine invertebrate Sipunculus nudus. Comparative Biochemistry and
Physiology A: Molecular and Integrative Physiology, 144(4), 479-484.
Langer, G., M. Geisen, K.-H. Baumann, J. Kläs, U. Riebesell, S. Thoms, and J.R. Young,
2006: Species-specific responses of calcifying algae to changing seawater
carbonate chemistry. Geochemistry Geophysics Geosystems, 7(9), Q09006.
Langer, G., G. Nehrke, I. Probert, J. Ly, and P. Ziveri, 2009: Strain-specific responses
of Emiliania huxleyi to changing seawater carbonate chemistry. Biogeosciences,
6(11), 2637-2646.
Langer, G., I. Probert, G. Nehrke, and P. Ziveri, 2011: The morphological response of
Emiliania huxleyi to seawater carbonate chemistry changes: an inter-strain
comparison. Journal of Nannoplankton Research, 32(1), 27-32.
Lauer, A., V. Eyring, J.J. Corbett, C.F. Wang, and J.J. Winebrake, 2009: Assessment of
near-future policy instruments for oceangoing shipping: impact on atmospheric
aerosol burdens and the Earth’s radiation budget. Environmental Science &
Technology, 43(15), 5592-5598.
Lavaniegos, B.E. and M.D. Ohman, 2003: Long-term changes in pelagic tunicates of the
California Current. Deep-Sea Research Part II: Topical Studies in Oceanography,
50(14-16), 2473-2498.
Law, C.S., 2008: Predicting and monitoring the effects of large-scale ocean iron
fertilization on marine trace gas emissions. Marine Ecology Progress Series,
364, 283-288.
Law, C.S., E. Breitbarth, L.J. Hoffmann, C.M. McGraw, R.J. Langlois, J. LaRoche, A.
Marriner, and K.A. Safi, 2012: No stimulation of nitrogen fixation by non-
filamentous diazotrophs under elevated CO
2
in the South Pacific. Global Change
Biology, 18(10), 3004-3014.
Le Borgne, R., V. Allain, S.P. Griffiths, R.J. Matear, A.D. McKinnon, A.J. Richardson, and
J.W. Young, 2011: Vulnerability of oceanic food webs in the tropical Pacific to
climate change. In: Vulnerability of Tropical Pacific Fisheries and Aquaculture
to Climate Change [Bell, J.D., J.E. Johnson, and A.J. Hobday (eds.)]. Secretariat
of the Pacific Community, Noumea, New Caledonia, pp. 189-250.
Le Quesne, W.J.F. and J.K. Pinnegar, 2012: The potential impacts of ocean
acidification: scaling from physiology to fisheries. Fish and Fisheries, 13(3),
333-344.
Leckie, R.M., T.J. Bralower, and R. Cashman, 2002: Oceanic anoxic events and
planktonic evolution: biotic response to tectonic forcing during the mid-
Cretaceous. Paleoceanography, 17(3), doi:10.1029/2001PA000623.
Leclercq, N., J.-P. Gattuso, and J. Jaubert, 2002: Primary production, respiration, and
calcification of a coral reef mesocosm under increased CO
2
partial pressure.
Limnology and Oceanography, 47(2), 558-564.
Lehodey, P., 2000: Impacts of the El Niño Southern Oscillation on Tuna Populations
and Fisheries in the Tropical Pacific Ocean. SCTB 13 Working Paper RG-1, 13th
Meeting of Standing Committee on Tuna and Billfish (SCTB), Noumea, New
Caledonia, 5-12 July 2000, Secretariat of the Pacific Community, Noumea, New
Caledonia, 32 pp.
Lehodey, P., J. Hampton, R.W. Brill, S. Nicol, I. Senina, B. Calmetters, H.-O. Pörtner, L.
Bopp, T. Llyina, J.D. Bell, and J. Sibert, 2011: Vulnerability of oceanic fisheries in
the tropical Pacific to climate change. In: Vulnerability of Tropical Pacific
Fisheries and Aquaculture to Climate Change [Bell, J.D., J.E. Johnson, and A.J.
Hobday (eds.)]. Secretariat of the Pacific Community, Noumea, New Caledonia,
pp. 433-492.
Lenoir, S., G. Beaugrand, and É. Lecuyer, 2011: Modelled spatial distribution of marine
fish and projected modifications in the North Atlantic Ocean. Global Change
Biology, 17(1), 115-129.
Levin, L.A., 2003: Oxygen minimum zone benthos: adaptation and community
response to hypoxia. Oceanography and Marine Biology: an Annual Review,
41, 1-45.
Levin, L.A. and M. Sibuet, 2012: Understanding continental margin biodiversity: a
new imperative. Annual Review of Marine Science, 4(1), 79-112.
Levin, L.A., W. Ekau, A.J. Gooday, F. Jorissen, J.J. Middelburg, S.W.A. Naqvi, C. Neira,
N.N. Rabalais, and J. Zhang, 2009: Effects of natural and human-induced
hypoxia on coastal benthos. Biogeosciences, 6(10), 2063-2098.
Levitan, O., G. Rosenberg, I. Setlik, E. Setlikova, J. Grigel, J. Klepetar, O. Prášil, and I.
Berman-Frank, 2007: Elevated CO
2
enhances nitrogen fixation and growth in
the marine cyanobacterium Trichodesmium. Global Change Biology, 13(2), 531-
538.
Levitan, O., S.A. Kranz, D. Spungin, O. Prášil, B. Rost, and I. Berman-Frank, 2010:
Combined effects of CO
2
and light on the N
2
-fixing cyanobacterium
Trichodesmium IMS101: a mechanistic view. Plant Physiology, 154(1), 346-356.
Lewandowska, A. and U. Sommer, 2010: Climate change and the spring bloom: a
mesocosm study on the influence of light and temperature on phytoplankton
and mesozooplankton. Marine Ecology Progress Series, 405, 101-111.
Lewis, P.N., M.J. Riddle, and C.L. Hewitt, 2004: Management of exogenous threats
to Antarctica and the sub-Antarctic islands: balancing risks from TBT and non-
indigenous marine organisms. Marine Pollution Bulletin, 49(11-12), 999-1005.
Liggett, D., A. McIntosh, A. Thompson, N. Gilbert, and B. Storey, 2011: From frozen
continent to tourism hotspot? Five decades of Antarctic tourism development
and management, and a glimpse into the future. Tourism Management, 32(2),
357-366.
Lima, F.P., P.A. Ribeiro, N. Queiroz, S.J. Hawkins, and A.M. Santos, 2007: Do distributional
shifts of northern and southern species of algae match the warming pattern?
Global Change Biology, 13(12), 2592-2604.
Lindegren, M., C. Möllmann, A. Nielsen, K. Brander, B.R. MacKenzie, and N.C.
Stenseth, 2010: Ecological forecasting under climate change: the case of Baltic
cod. Proceedings of the Royal Society B, 277(1691), 2121-2130.
Lindenmayer, D.B., G.E. Likens, C.J. Krebs, and R.J. Hobbs, 2010: Improved probability
of detection of ecological “surprises”. Proceedings of the National Academy
of Sciences of the United States of America, 107(51), 21957-21962.
Lindley, J.A., G. Beaugrand, C. Luczak, J.M. Dewarumez, and R.R. Kirby, 2010: Warm-
water decapods and the trophic amplification of climate in the North Sea.
Biology Letters, 6(6), 773-776.
Lipp, E.K., A. Huq, and R.R. Colwell, 2002: Effects of global climate on infectious
disease: the cholera model. Clinical Microbiology Reviews, 15(4), 757-770.
Lischka, S., J. Büdenbender, T. Boxhammer, and U. Riebesell, 2011: Impact of ocean
acidification and elevated temperatures on early juveniles of the polar shelled
pteropod Limacina helicina: mortality, shell degradation, and shell growth.
Biogeosciences, 8(4), 919-932.
Liu, J., M.G. Weinbauer, C. Maier, M.H. Dai, and J.-P. Gattuso, 2010: Effect of ocean
acidification on microbial diversity and on microbe-driven biogeochemistry and
ecosystem functioning. Aquatic Microbial Ecology, 61(3), 291-305.
Liu, W. and M. He, 2012: Effects of ocean acidification on the metabolic rates of three
species of bivalve from southern coast of China. Chinese Journal of Oceanology
and Limnology, 30(2), 206-211.

476
Chapter 6 Ocean Systems
6
Llewellyn, L.E., 2010: Revisiting the association between sea surface temperature
and the epidemiology of fish poisoning in the South Pacific: reassessing the
link between ciguatera and climate change. Toxicon, 56(5), 691-697.
Lloret, J. and H.-J. Rätz, 2000: Condition of cod (Gadus morhua) off Greenland during
1982-1998. Fisheries Research, 48(1), 79-86.
Lobitz, B., L. Beck, A. Huq, B. Wood, G. Fuchs, A.S.G. Faruque, and R. Colwell, 2000:
Climate and infectious disease: use of remote sensing for detection of Vibrio
cholerae by indirect measurement. Proceedings of the National Academy of
Sciences of the United States of America, 97(4), 1438-1443.
Lohbeck, K.T., U. Riebesell, and T.B.H. Reusch, 2012: Adaptive evolution of a key
phytoplankton species to ocean acidification. Nature Geoscience, 5(5), 346-
351.
Lomas, M.W., B.M. Hopkinson, J.L. Losh, D.E. Ryan, D.L. Shi, Y. Xu, and F.M.M. Morel,
2012: Effect of ocean acidification on cyanobacteria in the subtropical North
Atlantic. Aquatic Microbial Ecology, 66(3), 211-222.
Lombard, F., R.E. da Rocha, J. Bijma, and J.-P. Gattuso, 2010: Effect of carbonate ion
concentration and irradiance on calcification in planktonic foraminifera.
Biogeosciences, 7(1), 247-255.
Lovelock, J.E. and C.G. Rapley, 2007: Ocean pipes could help the Earth to cure itself.
Nature, 449(7161), 403.
Loya, Y., K. Sakai, K. Yamazato, Y. Nakano, H. Sambali, and R. van Woesik, 2001: Coral
bleaching: the winners and the losers. Ecology Letters, 4(2), 122-131.
Luczak, C., G. Beaugrand, M. Jaffré, and S. Lenoir, 2011: Climate change impact on
Balearic shearwater through a trophic cascade. Biology Letters, 7(5), 702-705.
Maas, A.E., K.F. Wishner, and B.A. Seibel, 2012: The metabolic response of pteropods
to ocean acidification reflects natural CO
2
-exposure in oxygen minimum zones.
Biogeosciences, 9(2), 747-757.
Mackas, D.L., 2011: Does blending of chlorophyll data bias temporal trend? Nature,
472(7342), E4-E5.
Mackas, D.L., R.H. Goldblatt, and A.G. Lewis, 1998: Interdecadal variation in
developmental timing of Neocalanus plumchrus populations at Ocean Station
P in the subarctic North Pacific. Canadian Journal of Fisheries and Aquatic
Sciences, 55(8), 1878-1893.
MacLeod, C.D., 2009: Global climate change, range changes and potential implications
for the conservation of marine cetaceans: a review and synthesis. Endangered
Species Research, 7, 125-136.
MacLeod, C.D., S.M. Bannon, G.J. Pierce, C. Schweder, J.A. Learmonth, J.S. Herman,
and R.J. Reid, 2005: Climate change and the cetacean community of north-west
Scotland. Biological Conservation, 124(4), 477-483.
Maier, C., J. Hegeman, M.G. Weinbauer, and J.-P. Gattuso, 2009: Calcification of the
cold-water coral Lophelia pertusa under ambient and reduced pH.
Biogeosciences, 6(8), 1671-1680.
Maier, C., A. Schubert, M.M. Berzunza Sànchez, M.G. Weinbauer, P. Watremez, and
J.-P. Gattuso, 2013: End of the century pCO
2
levels do not impact calcification
in Mediterranean cold-water corals. PLoS ONE, 8(4), e62655, doi:10.1371/
journal.pone.0062655.
Manzello, D.P., J.A. Kleypas, D.A. Budd, C.M. Eakin, P.W. Glynn, and C. Langdon, 2008:
Poorly cemented coral reefs of the eastern tropical Pacific: possible insights
into reef development in a high-CO
2
world. Proceedings of the National
Academy of Sciences of the United States of America, 105(30), 10450-10455.
Marañón, E., P. Cermeño, M. Latasa, and R.D. Tadonléké, 2012: Temperature,
resources, and phytoplankton size structure in the ocean. Limnology and
Oceanography, 57(5), 1266-1278.
Marbà, N. and C.M. Duarte, 2010: Mediterranean warming triggers seagrass
(Posidonia oceanica) shoot mortality. Global Change Biology, 16(8), 2366-
2375.
Margalef, R., 1978: Life-forms of phytoplankton as survival alternatives in an
unstable environment. Oceanologica Acta, 1(4), 493-509.
MARGO Project Members, 2009: Constraints on the magnitude and patterns of
ocean cooling at the Last Glacial Maximum. Nature Geoscience, 2(2), 127-132.
Mark, F.C., C. Bock, and H.-O. Pörtner, 2002: Oxygen-limited thermal tolerance in
Antarctic fish investigated by MRI and
31
P-MRS. American Journal of Physiology:
Regulatory, Integrative and Comparative Physiology, 283(5), R1254-1262.
Martin, S. and J.-P. Gattuso, 2009: Response of Mediterranean coralline algae to
ocean acidification and elevated temperature. Global Change Biology, 15(8),
2089-2100.
Martin, S., R. Rodolfo-Metalpa, E. Ransome, S. Rowley, M.C. Buia, J.-P. Gattuso, and
J. Hall-Spencer, 2008: Effects of naturally acidified seawater on seagrass
calcareous epibionts. Biology Letters, 4(6), 689-692.
Martin, S., S. Richier, M.-L. Pedrotti, S. Dupont, C. Castejon, Y. Gerakis, M.-E. Kerros,
F. Oberhänsli, J.-L. Teyssié, R. Jeffree, and J.-P. Gattuso, 2011: Early development
and molecular plasticity in the Mediterranean sea urchin Paracentrotus lividus
exposed to CO
2
-driven acidification. Journal of Experimental Biology, 214(8),
1357-1368.
Martrat, B., J.O. Grimalt, C. Lopez-Martinez, I. Cacho, F.J. Sierro, J.A. Flores, R. Zahn,
M. Canals, J.H. Curtis, and D.A. Hodell, 2004: Abrupt temperature changes in
the Western Mediterranean over the past 250,000 years. Science, 306(5702),
1762-1765.
Matear, R.J. and A.C. Hirst, 1999: Climate change feedback on the future oceanic
CO
2
uptake. Tellus Series B: Chemical and Physical Meteorology, 51(3), 722-
733.
Mazaris, A.D., A.S. Kallimanis, S.P. Sgardelis, and J.D. Pantis, 2008: Do long-term
changes in sea surface temperature at the breeding areas affect the breeding
dates and reproduction performance of Mediterranean loggerhead turtles?
Implications for climate change. Journal of Experimental Marine Biology and
Ecology, 367(2), 219-226.
Mazaris, A.D., A.S. Kallimanis, J. Tzanopoulos, S.P. Sgardelis, and J.D. Pantis, 2009: Sea
surface temperature variations in core foraging grounds drive nesting trends
and phenology of loggerhead turtles in the Mediterranean Sea. Journal of
Experimental Marine Biology and Ecology, 379(1-2), 23-27.
McBryan, T.L., K. Anttila, T.M. Healy, and P.M. Schulte, 2013: Responses to temperature
and hypoxia as interacting stressors in fish: implications for adaptation to
environmental change. Integrative and Comparative Biology, 53(4), 648-659.
McClain, C.R., 2009: A decade of satellite ocean color observations. Annual Review
of Marine Science, 1(1), 19-42.
McClatchie, S., R. Goericke, R. Cosgrove, G. Auad, and R. Vetter, 2010: Oxygen in the
Southern California Bight: multidecadal trends and implications for demersal
fisheries. Geophysical Research Letters, 37, L19602, doi:10.1029/2010GL044497.
McCulloch, M., J. Falter, J. Trotter, and P. Montagna, 2012: Coral resilience to ocean
acidification and global warming through pH up-regulation. Nature Climate
Change, 2(8), 623-627.
McDaniel, L.D., E. Young, J. Delaney, F. Ruhnau, K.B. Ritchie, and J.H. Paul, 2010: High
frequency of horizontal gene transfer in the oceans. Science, 330(6000), 50.
McIntyre, T., I.J. Ansorge, H. Bornemann, J. Plötz, C.A. Tosh, and M.N. Bester, 2011:
Elephant seal dive behaviour is influenced by ocean temperature: implications
for climate change impacts on an ocean predator. Marine Ecology Progress
Series, 441, 257-272.
McLeod, E., K.R.N. Anthony, A. Andersson, R. Beeden, Y. Golbuu, J. Kleypas, K. Kroeker,
D. Manzello, R.V. Salm, H. Schuttenberg, and J.E. Smith, 2013: Preparing to
manage coral reefs for ocean acidification: lessons from coral bleaching.
Frontiers in Ecology and the Environment, 11(1), 20-27.
McMahon, C.R. and G.C. Hays, 2006: Thermal niche, large-scale movements and
implications of climate change for a critically endangered marine vertebrate.
Global Change Biology, 12(7), 1330-1338.
McQuatters-Gollop, A., P.C. Reid, M. Edwards, P.H. Burkill, C. Castellani, S. Batten,
W. Gieskes, D. Beare, R.R. Bidigare, E. Head, R. Johnson, M. Kahru, J.A. Koslow,
and A. Pena, 2011: Is there a decline in marine phytoplankton? Nature,
472(7342), E6-E7.
Meinshausen, M., S.J. Smith, K. Calvin, J.S. Daniel, M.L.T. Kainuma, J.F. Lamarque, K.
Matsumoto, S.A. Montzka, S.C.B. Raper, K. Riahi, A. Thomson, G.J.M. Velders,
and D.P.P. van Vuuren, 2011: The RCP greenhouse gas concentrations and their
extensions from 1765 to 2300. Climatic Change, 109(1-2), 213-241.
Meissner, K.J., T. Lippmann, and A. Sen Gupta, 2012: Large-scale stress factors
affecting coral reefs: open ocean sea surface temperature and surface seawater
aragonite saturation over the next 400 years. Coral Reefs, 31(2), 309-319.
Melzner, F., S. Göbel, M. Langenbuch, M.A. Gutowska, H.-O. Pörtner, and M. Lucassen,
2009: Swimming performance in Atlantic Cod (Gadus morhua) following long-
term (4-12 months) acclimation to elevated seawater P(CO
2
). Aquatic Toxicology,
92(1), 30-37.
Melzner, F., P. Stange, K. Trubenbach, J. Thomsen, I. Casties, U. Panknin, S.N. Gorb,
and M.A. Gutowska, 2011: Food supply and seawater pCO
2
impact calcification
and internal shell dissolution in the blue mussel Mytilus edulis. PLoS ONE, 6(9),
e24223, doi:10.1371/journal.pone.0024223.
Merico, A., T. Tyrrell, E.J. Lessard, T. Oguz, P.J. Stabeno, S.I. Zeeman, and T.E. Whitledge,
2004: Modelling phytoplankton succession on the Bering Sea shelf: role of
climate influences and trophic interactions in generating Emiliania huxleyi
blooms 1997-2000. Deep-Sea Research Part I: Oceanographic Research Papers,
51(12), 1803-1826.

477
Ocean Systems Chapter 6
6
Metzger, R.A. and G. Benford, 2001: Sequestering of atmospheric carbon through
permanent disposal of crop residue. Climatic Change, 49(1-2), 11-19.
Michaelidis, B., C. Ouzounis, A. Paleras, and H.-O. Pörtner, 2005: Effects of long-term
moderate hypercapnia on acid-base balance and growth rate in marine mussels
Mytilus galloprovincialis. Marine Ecology Progress Series, 293, 109-118.
Milazzo, M., S. Mirto, P. Domenici, and M. Gristina, 2013: Climate change exacerbates
interspecific interactions in sympatric coastal fishes. Journal of Animal Ecology,
82(2), 468-477.
Miller, A.W., A.C. Reynolds, C. Sobrino, and G.F. Riedel, 2009: Shellfish face uncertain
future in high CO
2
world: influence of acidification on oyster larvae calcification
and growth in estuaries. PLoS ONE, 4(5), e5661, doi:10.1371/
journal.pone.0005661.
Millero, F.J., 1995: Thermodynamics of the carbon dioxide system in the oceans.
Geochimica et Cosmochimica Acta, 59(4), 661-677.
Mills, C.E., 2001: Jellyfish blooms: are populations increasing globally in response
to changing ocean conditions? Hydrobiologia, 451, 55-68.
Milly, P.C.D., J. Betancourt, M. Falkenmark, R.M. Hirsch, Z.W. Kundzewicz, D.P.
Lettenmaier, and R.J. Stouffer, 2008: Stationarity is dead: whither water
management? Science, 319(5863), 573-574.
Molinero, J.B., F. Ibanez, P. Nival, E. Buecher, and S. Souissi, 2005: North Atlantic
climate and northwestern Mediterranean plankton variability. Limnology and
Oceanography, 50(4), 1213-1220.
Moloney, C.L., M.A. St. John, K.L. Denman, D.M. Karl, F.W. Köster, S. Sundby, and R.P.
Wilson, 2011: Weaving marine food webs from end to end under global change.
Journal of Marine Systems, 84(3-4), 106-116.
Moore, J.K., S.C. Doney, D.M. Glover, and I.Y. Fung, 2002: Iron cycling and nutrient-
limitation patterns in surface waters of the World Ocean. Deep-Sea Research
Part II: Topical Studies in Oceanography, 49(1-3), 463-507.
Moore, S.E. and H.P. Huntington, 2008: Arctic marine mammals and climate change:
impacts and resilience. Ecological Applications, 18(2), S157-S165.
Moore, W.R., 2010: The impact of climate change on Caribbean tourism demand.
Current Issues in Tourism, 13(5), 495-505.
Mora, C., C.-L. Wei, A. Rollo, T. Amaro, A.R. Baco, D. Billett, L. Bopp, Q. Chen, M. Collier,
R. Danovaro, A.J. Gooday, B.M. Grupe, P.R. Halloran, J. Ingels, D.O.B. Jones, L.A.
Levin, H. Nakano, K. Norling, E. Ramirez-Llodra, M. Rex, H.A. Ruhl, C.R. Smith,
A.K. Sweetman, A.R. Thurber, J.F. Tjiputra, P. Usseglio, L. Watling, T. Wu, and M.
Yasuhara, 2013: Biotic and human vulnerability to projected changes in ocean
biogeochemistry over the 21
st
century. PLoS Biology, 11(10), e1001682,
doi:10.1371/journal.pbio.1001682.
Morán, X.A.G., Á. López-Urrutia, A. Calvo-Díaz, and W.K.W. Li, 2010: Increasing
importance of small phytoplankton in a warmer ocean. Global Change Biology,
16(3), 1137-1144.
Moss, R.H., J.A. Edmonds, K.A. Hibbard, M.R. Manning, S.K. Rose, D.P. van Vuuren,
T.R. Carter, S. Emori, M. Kainuma, T. Kram, G.A. Meehl, J.F.B. Mitchell, N.
Nakićenović, K. Riahi, S.J. Smith, R.J. Stouffer, A.M. Thomson, J.P. Weyant, and
T.J. Wilbanks, 2010: The next generation of scenarios for climate change
research and assessment. Nature, 463(7282), 747-756.
Mountain, D.G. and J. Kane, 2010: Major changes in the Georges Bank ecosystem,
1980s to the 1990s. Marine Ecology Progress Series, 398, 81-91.
Mouriño-Carballido, B., R. Graña, A. Fernández, A. Bode, M. Varela, J.F. Domínguez,
J. Escánez, D. de Armas, and E. Marañón, 2011: Importance of N
2
fixation vs.
nitrate eddy diffusion along a latitudinal transect in the Atlantic Ocean.
Limnology and Oceanography, 56(3), 999-1007.
Moy, A.D., W.R. Howard, S.G. Bray, and T.W. Trull, 2009: Reduced calcification in
modern Southern Ocean planktonic foraminifera. Nature Geoscience, 2(4), 276-
280.
Moya, A., L. Huisman, E.E. Ball, D.C. Hayward, L.C. Grasso, C.M. Chua, H.N. Woo, J.-P.
Gattuso, S. Forêt, and D.J. Miller, 2012: Whole transcriptome analysis of the
coral Acropora millepora reveals complex responses to CO
2
-driven acidification
during the initiation of calcification. Molecular Ecology, 21(10), 2440-2454.
Müller, R., T. Laepple, I. Bartsch, and C. Wiencke, 2009: Impact of oceanic warming
on the distribution of seaweeds in polar and cold-temperate waters. Botanica
Marina, 52(6), 617-638.
Munday, P.L., J.M. Donelson, D.L. Dixson, and G.G. Endo, 2009a: Effects of ocean
acidification on the early life history of a tropical marine fish. Proceedings of
the Royal Society B, 276(1671), 3275-3283.
Munday, P.L., N.E. Crawley, and G.E. Nilsson, 2009b: Interacting effects of elevated
temperature and ocean acidification on the aerobic performance of coral reef
fishes. Marine Ecology Progress Series, 388, 235-242.
Munday, P.L., D.L. Dixson, M.I. McCormick, M. Meekan, M.C.O. Ferrari, and D.P.
Chivers, 2010: Replenishment of fish populations is threatened by ocean
acidification. Proceedings of the National Academy of Sciences of the United
States of America, 107(29), 12930-12934.
Munday, P.L., M. Gagliano, J.M. Donelson, D.L. Dixson, and S.R. Thorrold, 2011a:
Ocean acidification does not affect the early life history development of a
tropical marine fish. Marine Ecology Progress Series, 423, 211-221.
Munday, P.L., V. Hernaman, D.L. Dixson, and S.R. Thorrold, 2011b: Effect of ocean
acidification on otolith development in larvae of a tropical marine fish.
Biogeosciences, 8(2), 1631-1641.
Naqvi, S.W.A., D.A. Jayakumar, P.V. Narvekar, H. Naik, V.V.S.S. Sarma, W. D’Souza, S.
Joseph, and M.D. George, 2000: Increased marine production of N
2
O due to
intensifying anoxia on the Indian continental shelf. Nature, 408(6810), 346-
349.
Narita, D., K. Rehdanz, and R.S.J. Tol, 2012: Economic costs of ocean acidification: a
look into the impacts on global shellfish production. Climatic Change, 113(3-4),
1049-1063.
Navarro, J.M., R. Torres, K. Acuña, C. Duarte, P.H. Manriquez, M. Lardies, N.A. Lagos,
C. Vargas, and V. Aguilera, 2013: Impact of medium-term exposure to elevated
pCO
2
levels on the physiological energetics of the mussel Mytilus chilensis.
Chemosphere, 90(3), 1242-1248.
Neuheimer, A.B. and P. Grønkjær, 2012: Climate effects on size-at-age: growth in
warming waters compensates for earlier maturity in an exploited marine fish.
Global Change Biology, 18(6), 1812-1822.
Neuheimer, A.B., R.E. Thresher, J.M. Lyle, and J.M. Semmens, 2011: Tolerance limit
for fish growth exceeded by warming waters. Nature Climate Change, 1(2),
110-113.
Neutel, A.M., J.A.P. Heesterbeek, J. van de Koppel, G. Hoenderboom, A. Vos, C. Kaldeway,
F. Berendse, and P.C. de Ruiter, 2007: Reconciling complexity with stability in
naturally assembling food webs. Nature, 449, 599-602.
Nilsson, G.E., N. Crawley, I.G. Lunde, and P.L. Munday, 2009: Elevated temperature
reduces the respiratory scope of coral reef fishes. Global Change Biology, 15(6),
1405-1412.
Nilsson, G.E., S. Östlund-Nilsson, and P.L. Munday, 2010: Effects of elevated
temperature on coral reef fishes: loss of hypoxia tolerance and inability to
acclimate. Comparative Biochemistry and Physiology A: Molecular and Integrative
Physiology, 156(4), 389-393.
Nilsson, G.E., D.L. Dixson, P. Domenici, M.I. McCormick, C. Sørensen, S.-A. Watson,
and P.L. Munday, 2012: Near-future carbon dioxide levels alter fish behaviour
by interfering with neurotransmitter function. Nature Climate Change, 2(3),
201-204.
NOAA, 2012: NOAA Extended Reconstructed Sea Surface Temperature (SST) Version
3b. From: PSD Climate and Weather Data, NOAA/OAR/ESRL Physical Sciences
Division, Boulder, CO, USA, www.esrl.noaa.gov/psd/data/gridded/
data.noaa.ersst.html.
Nuttall, M., 1998: Protecting the Arctic: Indigenous Peoples and Cultural Survival.
Routledge, London, 195 pp.
O’Connor, M.I., M.F. Piehler, D.M. Leech, A. Anton, and J.F. Bruno, 2009: Warming
and resource availability shift food web structure and metabolism. PLoS
Biology, 7(8), e1000178, doi:10.1371/journal.pbio.1000178.
O’Donnell, M.J., A.E. Todgham, M.A. Sewell, L.M. Hammond, K. Ruggiero, N.A. Fangue,
M.L. Zippay, and G.E. Hofmann, 2010: Ocean acidification alters skeletogenesis
and gene expression in larval sea urchins. Marine Ecology Progress Series, 398,
157-171.
Occhipinti-Ambrogi, A., 2007: Global change and marine communities: alien species
and climate change. Marine Pollution Bulletin, 55(7-9), 342-352.
Ohman, M.D., B.E. Lavaniegos, and A.W. Townsend, 2009: Multi-decadal variations
in calcareous holozooplankton in the California Current System: thecosome
pteropods, heteropods, and foraminifera. Geophysical Research Letters, 36,
L18608, doi:10.1029/2009GL039901.
Olafsson, J., S.R. Olafsdottir, A. Benoit-Cattin, M. Danielsen, T.S. Arnarson, and T.
Takahashi, 2009: Rate of Iceland Sea acidification from time series measurements.
Biogeosciences, 6(11), 2661-2668.
Orr, J.C., V.J. Fabry, O. Aumont, L. Bopp, S.C. Doney, R.A. Feely, A. Gnanadesikan, N.
Gruber, A. Ishida, F. Joos, R.M. Key, K. Lindsay, E. Maier-Reimer, R. Matear, P.
Monfray, A. Mouchet, R.G. Najjar, G.-K. Plattner, K.B. Rodgers, C.L. Sabine, J.L.
Sarmiento, R. Schlitzer, R.D. Slater, I.J. Totterdell, M.-F. Weirig, Y. Yamanaka, and
A. Yool, 2005: Anthropogenic ocean acidification over the twenty-first century
and its impact on calcifying organisms. Nature, 437(7059), 681-686.

478
Chapter 6 Ocean Systems
6
Oschlies, A., M. Pahlow, A. Yool, and R.J. Matear, 2010: Climate engineering by
artificial ocean upwelling: channelling the sorcerer’s apprentice. Geophysical
Research Letters, 37, L04701, doi:10.1029/2009GL041961.
Österblom, H., S. Hansson, U. Larsson, O. Hjerne, F. Wulff, R. Elmgren, and C. Folke,
2007: Human-induced trophic cascades and ecological regime shifts in the
Baltic Sea. Ecosystems, 10(6), 877-889.
Ottersen, G., D.O. Hjermann, and N.C. Stenseth, 2006: Changes in spawning stock
structure strengthen the link between climate and recruitment in a heavily
fished cod (Gadus morhua) stock. Fisheries Oceanography, 15(3), 230-243.
Ottersen, G., S. Kim, G. Huse, J.J. Polovina, and N.C. Stenseth, 2010: Major pathways
by which climate may force marine fish populations. Journal of Marine Systems,
79(3-4), 343-360.
Pagani, M., Z. Liu, J. LaRiviere, and A.C. Ravelo, 2010: High Earth-system climate
sensitivity determined from Pliocene carbon dioxide concentrations. Nature
Geoscience, 3(1), 27-30.
Pakker, H., A.M. Breeman, W.F.P. van Reine, and C. van den Hoek, 1995: A comparative
study of temperature responses of Carribean seaweeds from different
biogeographic groups. Journal of Phycology, 31(4), 499-507.
Palacios, S.L. and R.C. Zimmerman, 2007: Response of eelgrass Zostera marina
to CO
2
enrichment: possible impacts of climate change and potential for
remediation of coastal habitats. Marine Ecology Progress Series, 344, 1-13.
Pancost, R.D., N. Crawford, S. Magness, A. Turner, H.C. Jenkyns, and J.R. Maxwell,
2004: Further evidence for the development of photic-zone euxinic conditions
during Mesozoic oceanic anoxic events. Journal of the Geological Society, 161,
353-364.
Pane, E.F. and J.P. Barry, 2007: Extracellular acid-base regulation during short-term
hypercapnia is effective in a shallow-water crab, but ineffective in a deep-sea
crab. Marine Ecology Progress Series, 334, 1-9.
Parker, L.M., P.M. Ross, and W.A. O’Connor, 2011: Populations of the Sydney rock
oyster, Saccostrea glomerata, vary in response to ocean acidification. Marine
Biology, 158(3), 689-697.
Parker, L.M., P.M. Ross, W.A. O’Connor, L. Borysko, D.A. Raftos, and H.-O. Pörtner,
2012: Adult exposure influences offspring response to ocean acidification in
oysters. Global Change Biology, 18(1), 82-92.
Parmesan, C. and J. Matthews, 2005: Biological impacts of climate change. In:
Principles of Conservation Biology [Groom, M.J., G.K. Meffe, and C.R. Carroll
(eds.)]. Sinauer, Sunderland, MA, pp. 333-374.
Parmesan, C., C. Duarte, E. Poloczanska, A.J. Richardson, and M.C. Singer, 2011:
Overstretching attribution. Nature Climate Change, 1(1), 2-4.
Parsons, L.S. and W.H. Lear, 2001: Climate variability and marine ecosystem impacts:
a North Atlantic perspective. Progress in Oceanography, 49(1-4), 167-188.
Pascual, M., X. Rodo, S.P. Ellner, R. Colwell, and M.J. Bouma, 2000: Cholera dynamics
and El Niño-Southern Oscillation. Science, 289(5485), 1766-1769.
Paulmier, A. and D. Ruiz-Pino, 2009: Oxygen minimum zones (OMZs) in the modern
ocean. Progress in Oceanography, 80(3-4), 113-128.
Paulmier, A., D. Ruiz-Pino, and V. Garçon, 2011: CO
2
maximum in the oxygen
minimum zone (OMZ). Biogeosciences, 8(2), 239-252.
Pauly, D., V. Christensen, J. Dalsgaard, R. Froese, and F. Torres Jr., 1998: Fishing down
marine food webs. Science, 279(5352), 860-863.
Peck, L.S., S.A. Morley and M.S. Clark, 2010: Poor acclimation capacities in Antarctic
marine ectotherms. Marine Biology, 157(9), 2051-2059.
Péron, C., H. Weimerskirch, and C.-A. Bost, 2012: Projected poleward shift of king
penguins’ (Aptenodytes patagonicus) foraging range at the Crozet Islands,
southern Indian Ocean. Proceedings of the Royal Society B: Biological Sciences,
279(1738), 2515-2523.
Perry, A.L., P.J. Low, J.R. Ellis, and J.D. Reynolds, 2005: Climate change and distribution
shifts in marine fishes. Science, 308(5730), 1912-1915.
Perry, R.I., P. Cury, K. Brander, S. Jennings, C. Möllmann, and B. Planque, 2010:
Sensitivity of marine systems to climate and fishing: concepts, issues and
management responses. Journal of Marine Systems, 79(3-4), 427-435.
Pershing, A.J., C.H. Greene, J.W. Jossi, L. O’Brien, J.K.T. Brodziak, and B.A. Bailey,
2005: Interdecadal variability in the Gulf of Maine zooplankton community,
with potential impacts on fish recruitment. ICES Journal of Marine Science,
62(7), 1511-1523.
Pershing, A.J., E.H.J. Head, C.H. Greene, and J.W. Jossi, 2010: Pattern and scale of
variability among Northwest Atlantic Shelf plankton communities. Journal of
Plankton Research, 32(12), 1661-1674.
Pespeni, M.H., E. Sanford, B. Gaylord, T.M. Hill, J.D. Hosfelt, H.K. Jaris, M. LaVigne,
E.A. Lenz, A.D. Russell, M.K. Young, and S.R. Palumbi, 2013: Evolutionary change
during experimental ocean acidification. Proceedings of the National Academy
of Sciences of the United States of America, 110(17), 6937-6942.
Petitgas, P., D. Reid, B. Planque, E. Nogueira, B. O’Hea, and U. Cotano, 2006: The
entrainment hypothesis: an explanation for the persistance and innovation in
spawning migrations and life cycle spatial patterns. In: International Council
for the Exploration of the Sea (ICES) Conference and Meeting Documents (CM)
2006 [ICES (ed.)]. ICES CM 2006/B07, ICES, Maastricht, Netherlands, 9 pp.
Philippart, C.J.M., R. Anadón, R. Danovaro, J.W. Dippner, K.F. Drinkwater, S.J. Hawkins,
T. Oguz, G. O’Sullivan, and P.C. Reid, 2011: Impacts of climate change on
European marine ecosystems: observations, expectations and indicators.
Journal of Experimental Marine Biology and Ecology, 400(1-2), 52-69.
Pierce, D.W., P.J. Gleckler, T.P. Barnett, B.D. Santer, and P.J. Durack, 2012: The fingerprint
of human-induced changes in the ocean’s salinity and temperature fields.
Geophysical Research Letters, 39(21), L21704, doi:10.1029/2012GL053389.
Pike, D.A., R.L. Antworth, and J.C. Stiner, 2006: Earlier nesting contributes to shorter
nesting seasons for the loggerhead seaturtle, Caretta caretta. Journal of
Herpetology, 40(1), 91-94.
Pinsky, M.L. and M. Fogarty, 2012: Lagged social-ecological responses to climate
and range shifts in fisheries. Climatic Change, 115(3-4), 883-891.
Pinsky, M.L., B. Worm, M.J. Fogarty, J.L. Sarmiento, and S.A. Levin, 2013: Marine taxa
track local climate velocities. Science, 341(6151), 1239-1242.
Piontek, J., M. Lunau, N. Händel, C. Borchard, M. Wurst, and A. Engel, 2010:
Acidification increases microbial polysaccharide degradation in the ocean.
Biogeosciences, 7(5), 1615-1624.
Pitchford, J.W. and J. Brindley, 1999: Iron limitation, grazing pressure and oceanic
high nutrient-low chlorophyll (HNLC) regions. Journal of Plankton Research,
21(3), 525-547.
Planque, B., J.-M. Fromentin, P. Cury, K.F. Drinkwater, S. Jennings, R.I. Perry, and S.
Kifani, 2010: How does fishing alter marine populations and ecosystems
sensitivity to climate? Journal of Marine Systems, 79(3-4), 403-417.
Planque, B., E. Bellier, and C. Loots, 2011a: Uncertainties in projecting spatial
distributions of marine populations. ICES Journal of Marine Science, 68(6),
1045-1050.
Planque, B., C. Loots, P. Petitgas, U. Lindstrøm, and S. Vaz, 2011b: Understanding
what controls the spatial distribution of fish populations using a multi-model
approach. Fisheries Oceanography, 20(1), 1-17.
Poloczanska, E.S., S.J. Hawkins, A.J. Southward, and M.T. Burrows, 2008: Modeling
the response of populations of competing species to climate change. Ecology,
89(11), 3138-3149.
Poloczanska, E.S., C.J. Brown, W.J. Sydeman, W. Kiessling, D.S. Schoeman, P.J. Moore,
K. Brander, J.F. Bruno, L.B. Buckley, M.T. Burrows, C.M. Duarte, B.S. Halpern, J.
Holding, C.V. Kappel, M.I. O’Connor, J.M. Pandolfi, C. Parmesan, F. Schwing, S.A.
Thompson, and A.J. Richardson, 2013: Global imprint of climate change on
marine life. Nature Climate Change, 3(10), 919-925.
Polovina, J.J., E.A. Howell, and M. Abecassis, 2008: Ocean’s least productive waters
are expanding. Geophysical Research Letters, 35(3), L03618, doi:10.1029/
2007GL031745.
Polovina, J.J., J.P. Dunne, P.A. Woodworth, and E.A. Howell, 2011: Projected expansion
of the subtropical biome and contraction of the temperate and equatorial
upwelling biomes in the North Pacific under global warming. ICES Journal of
Marine Science, 68(6), 986-995.
Pörtner, H.-O., 2002a: Climate variations and the physiological basis of temperature
dependent biogeography: systemic to molecular hierarchy of thermal tolerance
in animals. Comparative Biochemistry and Physiology A: Molecular and
Integrative Physiology, 132(4), 739-761.
Pörtner, H.-O., 2002b: Environmental and functional limits to muscular exercise and
body size in marine invertebrate athletes. Comparative Biochemistry and
Physiology A: Molecular and Integrative Physiology, 133(2), 303-321.
Pörtner, H.-O., 2006: Climate-dependent evolution of Antarctic ectotherms: an
integrative analysis. Deep-Sea Research Part II: Topical Studies in Oceanography,
53(8-10), 1071-1104.
Pörtner, H.-O., 2008: Ecosystem effects of ocean acidification in times of ocean
warming: a physiologist’s view. Marine Ecology Progress Series, 373, 203-217.
Pörtner, H.-O., 2010: Oxygen- and capacity-limitation of thermal tolerance: a matrix
for integrating climate-related stressor effects in marine ecosystems. Journal
of Experimental Biology, 213(6), 881-893.
Pörtner, H.-O., 2012: Integrating climate-related stressor effects on marine organisms:
unifying principles linking molecule to ecosystem-level changes. Marine Ecology
Progress Series, 470, 273-290.

479
Ocean Systems Chapter 6
6
Pörtner, H.-O. and A.P. Farrell, 2008: Ecology: physiology and climate change. Science,
322(5902), 690-692.
Pörtner, H.-O. and M.K. Grieshaber, 1993: Critical Po
2
(s) in oxyconforming and
oxyregulating animals: gas exchange, metabolic rate and the mode of energy
production. In: The Vertebrate Gas Transport Cascade: Adaptations to Environment
and Mode of Life [Bicudo, J.E.P.W. (ed.)]. CRC Press Inc, Boca Raton, FL, USA,
pp. 330-357.
Pörtner, H.-O. and R. Knust, 2007: Climate change affects marine fishes through the
oxygen limitation of thermal tolerance. Science, 315(5808), 95-97.
Pörtner, H.-O. and M.A. Peck, 2010: Climate change effects on fishes and fisheries:
towards a cause-and-effect understanding. Journal of Fish Biology, 77(8), 1745-
1779.
Pörtner, H.-O., A. Reipschläger, and N. Heisler, 1998: Acid-base regulation, metabolism
and energetics in Sipunculus nudus as a function of ambient carbon dioxide
level. Journal of Experimental Biology, 201(1), 43-55.
Pörtner, H.-O., C. Bock, and A. Reipschläger, 2000: Modulation of the cost of pHi
regulation during metabolic depression: a
3
1
P-NMR study in invertebrate
(Sipunculus nudus) isolated muscle. Journal of Experimental Biology, 203(16),
2417-2428.
Pörtner, H.-O., M. Langenbuch, and B. Michaelidis, 2005: Synergistic effects of
temperature extremes, hypoxia, and increases in CO
2
on marine animals: from
Earth history to global change. Journal of Geophysical Research, 110(C9),
C09S10, doi:10.1029/2004JC002561.
Pörtner, H.-O., L.S. Peck, and T. Hirse, 2006: Hyperoxia alleviates thermal stress in
the Antarctic bivalve, Laternula elliptica: evidence for oxygen limited thermal
tolerance. Polar Biology, 29(8), 688-693.
Pörtner, H.-O., C. Bock, R. Knust, G. Lannig, M. Lucassen, F.C. Mark, and F.J. Sartoris,
2008: Cod and climate in a latitudinal cline: physiological analyses of climate
effects in marine fishes. Climate Research, 37(2-3), 253-270.
Pörtner, H.-O., P.M. Schulte, C.M. Wood, and F. Schiemer, 2010: Niche dimensions in
fishes: an integrative view. Physiological and Biochemical Zoology, 83(5), 808-
826.
Pörtner, H.-O., M. Gutowska, A. Ishimatsu, M. Lucassen, F. Melzner, and B. Seibel, 2011:
Effects of ocean acidification on nektonic organisms. In: Ocean Acidification
[Gattuso, J.-P. and L. Hansson (eds.)]. Oxford University Press, Oxford, UK, pp.
154-175.
Pörtner, H.-O., L.S. Peck, and G.N. Somero, 2012: Mechanisms defining thermal limits
and adaptation in marine ectotherms: integrative view. In: Antarctic Ecosystems:
An Extreme Environment in a Changing World [Rogers, A., N.M. Johnston, E.J.
Murphy, and A. Clarke (eds.)]. Wiley-Blackwell, Chichester, UK, pp. 360-396.
Porzio, L., M.C. Buia, and J.M. Hall-Spencer, 2011: Effects of ocean acidification on
macroalgal communities. Journal of Experimental Marine Biology and Ecology,
400(1-2), 278-287.
Prince, E.D., J. Luo, C.P. Goodyear, J.P. Hoolihan, D. Snodgrass, E.S. Orbesen, J.E. Serafy,
M. Ortiz, and M.J. Schirripa, 2010: Ocean scale hypoxia-based habitat
compression of Atlantic istiophorid billfishes. Fisheries Oceanography, 19(6),
448-462.
Purcell, J.E. and M.B. Decker, 2005: Effects of climate on relative predation by
scyphomedusae and ctenophores on copepods in Chesapeake Bay during 1987-
2000. Limnology and Oceanography, 50(1), 376-387.
Quartino M.L., D. Deregibus, G,L, Campana, G.E.J. Latorre, and F.R. Momo, 2013:
Evidence of macroalgal colonization on newly ice-free areas following glacial
retreat in Potter Cove (South Shetland Islands), Antarctica. PLoS ONE 8(3),
e58223. doi:10.1371/journal.pone.0058223.
Queste, B.Y., L. Fernand, T.D. Jickells, and K.J. Heywood, 2013: Spatial extent and
historical context of North Sea oxygen depletion in August 2010. Biogeochemistry,
113(1-3), 53-68.
Raab, K., M. Llope, L.A.J. Nagelkerke, A.D. Rijnsdorp, L.R. Teal, P. Licandro, P. Ruardij,
and M. Dickey-Collas, 2013: Influence of temperature and food availability on
juvenile European anchovy Engraulis encrasicolus at its northern boundary.
Marine Ecology Progress Series, 488, 233-245.
Ragazzola, F., L.C. Foster, A. Form, P.S.L. Anderson, T.H. Hansteen, and J. Fietzke, 2012:
Ocean acidification weakens the structural integrity of coralline algae. Global
Change Biology, 18(9), 2804-2812.
Rando, O.J. and K.J. Verstrepen, 2007: Timescales of genetic and epigenetic inheritance.
Cell, 128(4), 655-668.
Ratkowsky, D.A., R.K. Lowry, T.A. McMeekin, A.N. Stokes, and R.E. Chandler, 1983:
Model for bacterial culture growth rate throughout the entire biokinetic
temperature range. Journal of Bacteriology, 154(3), 1222-1226.
Rau, G.H., 2011: CO
2
mitigation via capture and chemical conversion in seawater.
Environmental Science & Technology, 45(3), 1088-1092.
Rau, G.H., E.L. McLeod, and O. Hoegh-Guldberg, 2012: The need for new ocean
conservation strategies in a high-carbon dioxide world. Nature Climate Change,
2(10), 720-724.
Raun, A.L. and J. Borum, 2013: Combined impact of water column oxygen and
temperature on internal oxygen status and growth of Zostera marina seedlings
and adult shoots. Journal of Experimental Marine Biology and Ecology, 441,
16-22.
Raven, J.A. and C.M. Scrimgeour, 1997: The influence of anoxia on plants of saline
habitats with special reference to the sulphur cycle. Annals of Botany, 79, 79-
86.
Raven, J.A., M. Giordano, J. Beardall, and S.C. Maberly, 2012: Algal evolution in
relation to atmospheric CO
2
: carboxylases, carbon-concentrating mechanisms
and carbon oxidation cycles. Philosophical Transactions of the Royal Society B:
Biological Sciences, 367(1588), 493-507.
Reid, P.C., M.F. Borges, and E. Svendsen, 2001: A regime shift in the North Sea circa
1988 linked to changes in the North Sea horse mackerel fishery. Fisheries
Research, 50(1-2), 163-171.
Reipschläger, A. and H.-O. Pörtner, 1996: Metabolic depression during environmental
stress: the role of extracellular versus intracellular pH in Sipunculus nudus.
Journal of Experimental Biology, 199(8), 1801-1807.
Reipschläger, A., G.E. Nilsson, and H.-O. Pörtner, 1997: A role for adenosine in
metabolic depression in the marine invertebrate Sipunculus nudus. American
Journal of Physiology: Regulatory, Integrative and Comparative Physiology,
272(1), R350-356.
Reusch, T.B.H. and T.E. Wood, 2007: Molecular ecology of global change. Molecular
Ecology, 16(19), 3973-3992.
Reusch, T.B.H. and P.W. Boyd, 2013: Experimental evolution meets marine
phytoplankton. Evolution, 67(7), 1849-1859.
Reynaud, S., N. Leclercq, S. Romaine-Lioud, C. Ferrier-Pagès, J. Jaubert, and J.-P.
Gattuso, 2003: Interacting effects of CO
2
partial pressure and temperature on
photosynthesis and calcification in a scleractinian coral. Global Change Biology,
9(11), 1660-1668.
Richards, E.J., 2006: Inherited epigenetic variation – revisiting soft inheritance.
Nature Reviews Genetics, 7(5), 395-401.
Richards, J.G., A.P. Farrell, and C.J. Brauner (eds.), 2009: Hypoxia. Elsevier Academic
Press, Amsterdam, 525 pp.
Richardson, A.J. and M.J. Gibbons, 2008: Are jellyfish increasing in response to ocean
acidification? Limnology and Oceanography, 53(5), 2040-2045.
Richardson, A.J. and D.S. Schoeman, 2004: Climate impact on plankton ecosystems
in the Northeast Atlantic. Science, 305(5690), 1609-1612.
Richardson, A.J., A.W. Walne, A.W.G. John, T.D. Jonas, J.A. Lindley, D.W. Sims, D.
Stevens, and M. Witt, 2006: Using continuous plankton recorder data. Progress
in Oceanography, 68(1), 27-74.
Richardson, A.J., A. Bakun, G.C. Hays, and M.J. Gibbons, 2009: The jellyfish joyride:
causes, consequences and management responses to a more gelatinous future.
Trends in Ecology and Evolution, 24(6), 312-322.
Richier, S., M.E. Kerros, C. de Vargas, L. Haramaty, P.G. Falkowski, and J.-P. Gattuso,
2009: Light-dependent transcriptional regulation of genes of biogeochemical
interest in the diploid and haploid life cycle stages of Emiliania huxleyi. Applied
and Environmental Microbiology, 75(10), 3366-3369.
Ridgwell, A. and D.N. Schmidt, 2010: Past constraints on the vulnerability of marine
calcifiers to massive carbon dioxide release. Nature Geoscience, 3(3), 196-200.
Riebesell, U., 2004: Effects of CO
2
enrichment on marine phytoplankton. Journal of
Oceanography, 60(4), 719-729.
Riebesell, U., I. Zondervan, B. Rost, P.D. Tortell, R.E. Zeebe, and F.M.M. Morel, 2000:
Reduced calcification of marine plankton in response to increased atmospheric
CO
2
. Nature, 407(6802), 364-367.
Riebesell, U., K.G. Schulz, R.G.J. Bellerby, M. Botros, P. Fritsche, M. Meyerhöfer, C.
Neill, G. Nondal, A. Oschlies, J. Wohlers, and E. Zöllner, 2007: Enhanced biological
carbon consumption in a high CO
2
ocean. Nature, 450(7169), 545-548.
Riebesell, U., R.G.J. Bellerby, H.P. Grossart, and F. Thingstad, 2008: Mesocosm CO
2
perturbation studies: from organism to community level. Biogeosciences, 5(4),
1157-1164.
Riebesell, U., J.-P. Gattuso, T.F. Thingstad, and J. Middelburg (eds.), 2013: Special
Issue: Arctic Ocean Acidification: Pelagic Ecosystem and Biogeochemical
Responses during a Mesocosm Study. Biogeosciences, www.biogeosciences.net/
special_issue120.html.

480
Chapter 6 Ocean Systems
6
Ries, J.B., A.L. Cohen, and D.C. McCorkle, 2009: Marine calcifiers exhibit mixed
responses to CO
2
-induced ocean acidification. Geology, 37(12), 1131-1134.
Robinson, C., D.K. Steinberg, T.R. Anderson, J. Arístegui, C.A. Carlson, J.R. Frost, J.F.
Ghiglione, S. Hernández-Léon, G.A. Jackson, R. Koppelmann, B. Queguiner, O.
Ragueneau, F. Rassoulzadegan, B.H. Robison, C. Tamburini, T. Tanaka, K.F.
Wishner, and J. Zhang, 2010: Mesopelagic zone ecology and biogeochemistry
– a synthesis. Deep-Sea Research Part II: Topical Studies in Oceanography,
57(16), 1504-1518.
Robinson, R.A., J.A. Learmonth, A.M. Hutson, C.D. MacLeod, T.H. Sparks, D.I. Leech,
G.J. Pierce, M.M. Rehfisch, and H.Q.P. Crick, 2005: Climate Change and Migratory
Species. British Trust for Ornithology (BTO) Research Report 414 for DEFRA,
BTO, Thetford, UK, 304 pp.
Rode, K.D., E. Peacock, M. Taylor, I. Stirling, E.W. Born, K.L. Laidre, and Ø. Wiig, 2012:
A tale of two polar bear populations: ice habitat, harvest, and body condition.
Population Ecology, 54(1), 3-18.
Rodolfo-Metalpa, R., F. Houlbrèque, É. Tambutté, F. Boisson, C. Baggini, F.P. Patti, R.
Jeffree, M. Fine, A. Foggo, J.-P. Gattuso, and J.M. Hall-Spencer, 2011: Coral and
mollusc resistance to ocean acidification adversely affected by warming. Nature
Climate Change, 1(6), 308-312.
Rokitta, S.D. and B. Rost, 2012: Effects of CO
2
and their modulation by light in the
life-cycle stages of the coccolithophore Emiliania huxleyi. Limnology and
Oceanography, 57(2), 607-618.
Romanuk, T.N., Y. Zhou, U. Brose, E.L. Berlow, R.J. Williams, and N.D. Martinez, 2009:
Predicting invasion success in complex ecological networks. Philosophical
Transactions of the Royal Society B, 364, 1743-1754.
Rose, G. and R.L. O’Driscoll, 2002: Capelin are good for cod: can the northern stock
rebuild without them? ICES Journal of Marine Science, 59(5), 1018-1026.
Rose, J.M., Y. Feng, C.J. Gobler, R. Gutierrez, C.E. Hare, K. Leblanc, and D.A. Hutchins,
2009: Effects of increased pCO
2
and temperature on the North Atlantic spring
bloom. II. Microzooplankton abundance and grazing. Marine Ecology Progress
Series, 388, 27-40.
Rose, K.A., J.I. Allen, Y. Artioli, M. Barange, J. Blackford, F. Carlotti, R. Cropp, U. Daewel,
K. Edwards, K. Flynn, S.L. Hill, R. HilleRisLambers, G. Huse, S. Mackinson, B.
Megrey, A. Moll, R. Rivkin, B. Salihoglu, C. Schrum, L. Shannon, Y.-J. Shin, S.L.
Smith, C. Smith, C. Solidoro, M. St. John, and M. Zhou, 2010: End-to-end models
for the analysis of marine ecosystems: challenges, issues, and next steps. Marine
and Coastal Fisheries, 2(1), 115-130.
Rosegrant, M.W. and S.A. Cline, 2003: Global food security: challenges and policies.
Science, 302(5652), 1917-1919.
Rossoll, D., R. Bermúdez, H. Hauss, K.G. Schulz, U. Riebesell, U. Sommer, and M.
Winder, 2012: Ocean acidification-induced food quality deterioration constrains
trophic transfer. PLoS ONE, 7(4), e34737, doi:10.1371/journal.pone.0034737.
Rost, B., U. Riebesell, S. Burkhardt, and D. Sültemeyer, 2003: Carbon acquisition of
bloom-forming marine phytoplankton. Limnology and Oceanography, 48(1),
55-67.
Rost, B., I. Zondervan, and D. Wolf-Gladrow, 2008: Sensitivity of phytoplankton
to future changes in ocean carbonate chemistry: current knowledge,
contradictions and research directions. Marine Ecology Progress Series, 373,
227-237.
Russell, B.D., C.A. Passarelli, and S.D. Connell, 2011: Forecasted CO
2
modifies the
influence of light in shaping subtidal habitat. Journal of Phycology, 47(4), 744-
752.
Russell, L.M., P.J. Rasch, G.M. Mace, R.B. Jackson, J. Shepherd, P. Liss, M. Leinen, D.
Schimel, N.E. Vaughan, A.C. Janetos, P.W. Boyd, R.J. Norby, K. Caldeira, J.
Merikanto, P. Artaxo, J. Melillo, and M.G. Morgan, 2012: Ecosystem impacts of
geoengineering: a review for developing a science plan. Ambio, 41(4), 350-
369.
Rykaczewski, R.R. and J.P. Dunne, 2011: A measured look at ocean chlorophyll
trends. Nature, 472(7342), E5-E6.
Saba, G.K., O. Schofield, J.J. Torres, E.H. Ombres, and D.K. Steinberg, 2012: Increased
feeding and nutrient excretion of adult Antarctic krill, Euphausia superba,
exposed to enhanced carbon dioxide (CO
2
). PLoS ONE, 7(12), e52224,
doi:10.1371/journal.pone.0052224.
Saba, V.S., M.A.M. Friedrichs, D. Antoine, R.A. Armstrong, I. Asanuma, M.J. Behrenfeld,
A.M. Ciotti, M. Dowell, N. Hoepffner, K.J.W. Hyde, J. Ishizaka, T. Kameda, J. Marra,
F. Mélin, A. Morel, J. O’Reilly, M. Scardi, W.O. Smith Jr., T.J. Smyth, S. Tang, J. Uitz,
K. Waters, and T.K. Westberry, 2011: An evaluation of ocean color model
estimates of marine primary productivity in coastal and pelagic regions across
the globe. Biogeosciences, 8(2), 489-503.
Saba, V.S., C.A. Stock, J.R. Spotila, F.V. Paladino, and P.S. Tomillo, 2012: Projected
response of an endangered marine turtle population to climate change. Nature
Climate Change, 2(11), 814-820.
Sabatés, A., P. Martín, J. Lloret, and V. Raya, 2006: Sea warming and fish distribution:
the case of the small pelagic fish, Sardinella aurita, in the western Mediterranean.
Global Change Biology, 12(11), 2209-2219.
Saito, M.A., J.W. Moffett, S.W. Chisholm, and J.B. Waterbury, 2002: Cobalt limitation
and uptake in Prochlorococcus. Limnology and Oceanography, 47(6), 1629-
1636.
Saito, M.A., T.J. Goepfert, and J.T. Ritt, 2008: Some thoughts on the concept of
colimitation: three definitions and the importance of bioavailability. Limnology
and Oceanography, 53(1), 276-290.
Sala, E. and N. Knowlton, 2006: Global marine biodiversity trends. Annual Review of
Environment and Resources, 31(1), 93-122.
Sallée, J.B., E. Shuckburgh, N. Bruneau, A.J.S. Meijers, T.J. Bracegirdle, and Z. Wang,
2013: Assessment of Southern Ocean mixed-layer depths in CMIP5 models:
historical bias and forcing response. Journal of Geophysical Research: Oceans,
118(4), 1845-1862.
Salvadeo, C., D. Lluch-Belda, A. Gómez-Gallardo, J. Urbán-Ramírez, and C.D.
MacLeod, 2010: Climate change and a poleward shift in the distribution of the
Pacific white-sided dolphin in the northeastern Pacific. Endangered Species
Research, 11(1), 13-19.
Salvadeo, C., D. Lluch-Belda, S. Lluch-Cota, and M. Mercuri, 2011: Review of long term
macro-fauna movement by multi-decadal warming trends in the Northeastern
Pacific. In: Climate Change: Geophysical Foundations and Ecological Effects
[Blanco, J. and H. Kheradmand (eds.)]. InTech, Rijeka, Croatia, pp. 217-230.
Salvadeo, C., S. Lluch-Cota, M. Maravilla-Chávez, S. Álvarez-Castañeda, M. Mercuri,
and A. Ortega-Rubio, 2013: Impact of climate change on sustainable
management of gray whale (Eschrichtius robustus) populations: whale-watching
and conservation. Archives of Biological Sciences, 65(3), 997-1005.
Santidrián Tomillo, P., V.S. Saba, G.S. Blanco, C.A. Stock, F.V. Paladino, and J.R. Spotila,
2012: Climate driven egg and hatchling mortality threatens survival of eastern
Pacific leatherback turtles. PLoS ONE, 7(5), e37602, doi:10.1371/
journal.pone.0037602.
Sarker, M.Y., I. Bartsch, M. Olischläger, L. Gutow, and C. Wiencke, 2013: Combined
effects of CO
2
, temperature, irradiance and time on the physiological performance
of Chondrus crispus (Rhodophyta). Botanica Marina, 56(1), 63-74.
Sarmento, H., J.M. Montoya, E. Vázquez-Domínguez, D. Vaqué, and J.M. Gasol, 2010:
Warming effects on marine microbial food web processes: how far can we go
when it comes to predictions? Philosophical Transactions of the Royal Society
B, 365(1549), 2137-2149.
Sarmiento, J.L. and N. Gruber, 2006: Ocean Biogeochemical Dynamics. Princetion
University Press, Princeton, NJ, USA, 526 pp.
Sarmiento, J.L., T.M.C. Hughes, R.J. Stouffer, and S. Manabe, 1998: Simulated
response of the ocean carbon cycle to anthropogenic climate warming. Nature,
393(6682), 245-249.
Sarmiento, J.L., R.D. Slater, J. Dunne, A. Gnanadesikan, and M.R. Hiscock, 2010:
Efficiency of small scale carbon mitigation by patch iron fertilization.
Biogeosciences, 7(11), 3593-3624.
Scheibner, C. and R.P. Speijer, 2008: Late Paleocene-early Eocene Tethyan carbonate
platform evolution – a response to long- and short-term paleoclimatic change.
Earth-Science Reviews, 90(3-4), 71-102.
Schlüter, M.H., A. Merico, K.H. Wiltshire, W. Greve, and H. von Storch, 2008: A
statistical analysis of climate variability and ecosystem response in the German
Bight. Ocean Dynamics, 58(3-4), 169-186.
Schlüter, M.H., A. Merico, M. Reginatto, M. Boersma, K.H. Wiltshire, and W. Greve,
2010: Phenological shifts of three interacting zooplankton groups in relation
to climate change. Global Change Biology, 16(11), 3144-3153.
Schöne, B.R., W. Oschmann, J. Rössler, A.D.F. Castro, S.D. Houk, I. Kröncke, W. Dreyer,
R. Janssen, H. Rumohr, and E. Dunca, 2003: North Atlantic Oscillation dynamics
recorded in shells of a long-lived bivalve mollusk. Geology, 31(12), 1037-1040.
Sciandra, A., J. Harlay, D. Lefèvre, R. Lemée, P. Rimmelin, M. Denis, and J.-P. Gattuso,
2003: Response of coccolithophorid Emiliania huxleyi to elevated partial pressure
of CO
2
under nitrogen limitation. Marine Ecology Progress Series, 261, 111-122.
Seibel, B.A., 2011: Critical oxygen levels and metabolic suppression in oceanic
oxygen minimum zones. Journal of Experimental Biology, 214(2), 326-336.
Seki, O., G.L. Foster, D.N. Schmidt, A. Mackensen, K. Kawamura, and R.D. Pancost,
2010: Alkenone and boron-based Pliocene pCO
2
records. Earth and Planetary
Science Letters, 292(1-2), 201-211.

481
Ocean Systems Chapter 6
6
Sen Gupta, A. and B. McNeil, 2012: Variability and change in the ocean. In: The
Future of the World’s Climate [Henderson-Sellers, A. and K. McGuffie (eds.)].
Elsevier, Amsterdam, Netherlands, pp. 141-165.
Shepherd, J., K. Caldeira, P. Cox, J. Haigh, D. Keith, B. Launder, G. Mace, G. MacKerron,
J. Pyle, S. Rayner, C. Redgwell, A. Watson, R. Garthwaite, R. Heap, A. Parker, and
J. Wilsdon, 2009: Geoengineering the Climate. The Royal Society, London, UK,
98 pp.
Sheppard-Brennand, H., N. Soars, S.A. Dworjanyn, A.R. Davis, and M. Byrne, 2010:
Impact of ocean warming and ocean acidification on larval development and
calcification in the sea urchin Tripneustes gratilla. PLoS ONE, 5(6), e11372,
doi:10.1371/journal.pone.0011372.
Sherman, K. and G. Hempel, 2009: The UNEP Large Marine Ecosystem Report: A
Perspective on Changing Conditions in Lmes of the World’s Regional Seas.
UNEP Regional Seas Reports and Studies No. 182, United Nations Environment
Programme (UNEP), Nairobi, Kenya, 872 pp.
Sherman, K., M. Sissenwine, V. Christensen, A. Duda, G. Hempel, C. Ibe, S. Levin, D.
Lluch-Belda, G. Matishov, J. McGlade, M. O’Toole, S. Seitzinger, R. Serra, H.-R.
Skjoldal, Q. Tang, J. Thulin, V. Vandeweerd, and K. Zwanenburg, 2005: A global
movement toward an ecosystem approach to management of marine resources.
Marine Ecology Progress Series, 300, 275-279.
Short, F.T. and H.A. Neckles, 1999: The effects of global climate change on seagrasses.
Aquatic Botany, 63(3-4), 169-196.
Signorini, S.R. and C.R. McClain, 2012: Subtropical gyre variability as seen from
satellites. Remote Sensing Letters, 3(6), 471-479.
Signorini, S.R., R.G. Murtugudde, C.R. McClain, J.R. Christian, J. Picaut, and A.J.
Busalacchi, 1999: Biological and physical signatures in the tropical and
subtropical Atlantic. Journal of Geophysical Research, 104(8), 18376-18382.
Simmonds, M.P. and S.J. Isaac, 2007: The impacts of climate change on marine
mammals: early signs of significant problems. Oryx, 41(1), 19-26.
Simpson, S.D., S. Jennings, M.P. Johnson, J.L. Blanchard, P.-J. Schön, D.W. Sims, and
M.J. Genner, 2011: Continental shelf-wide response of a fish assemblage to
rapid warming of the sea. Current Biology, 21(18), 1565-1570.
Sissener, E.H. and T. Bjørndal, 2005: Climate change and the migratory pattern for
Norwegian spring-spawning herring – implications for management. Marine
Policy, 29(4), 299-309.
Sluijs, A. and H. Brinkhuis, 2009: A dynamic climate and ecosystem state during the
Paleocene-Eocene Thermal Maximum: inferences from dinoflagellate cyst
assemblages on the New Jersey Shelf. Biogeosciences, 6(8), 1755-1781.
Smetacek, V. and S. Nicol, 2005: Polar ocean ecosystems in a changing world. Nature,
437(7057), 362-368.
Smith, K.L., Jr., H.A. Ruhl, B.J. Bett, D.S. Billett, R.S. Lampitt, and R.S. Kaufmann, 2009:
Climate, carbon cycling, and deep-ocean ecosystems. Proceedings of the National
Academy of Sciences of the United States of America, 106(46), 19211-19218.
Smith, S.V., 1981: Marine macrophytes as a global carbon sink. Science, 211(4484),
838-840.
Snyder, M.A., L.C. Sloan, N.S. Diffenbaugh, and J.L. Bell, 2003: Future climate change
and upwelling in the California Current. Geophysical Research Letters, 30(15),
1823, doi:10.1029/2003GL017647.
Sohm, J.A., E.A. Webb, and D.G. Capone, 2011: Emerging patterns of marine nitrogen
fixation. Nature Reviews Microbiology, 9(7), 499-508.
Sorokin, C. and R.W. Krauss, 1962: Effects of temperature & illuminance on Chlorella
growth uncoupled from cell division. Plant Physiology, 37(1), 37-42.
Soto, C.G., 2001: The potential impacts of global climate change on marine protected
areas. Reviews in Fish Biology and Fisheries, 11(3), 181-195.
Springer, A.M., J.F. Piatt, V.P. Shuntov, G.B. Van Vliet, V.L. Vladimirov, A.E. Kuzin, and
A.S. Perlov, 1999: Marine birds and mammals of the Pacific Subarctic Gyres.
Progress in Oceanography, 43(2-4), 443-487.
Stassen, P., E. Thomas, and R.P. Speijer, 2012: The progression of environmental
changes during the onset of the Paleocene-Eocene Thermal Maximum (New
Jersey Coastal Plain). Austrian Journal of Earth Sciences, 105(1), 169-178.
Steinacher, M., F. Joos, T.L. Frölicher, G.-K. Plattner, and S.C. Doney, 2009: Imminent
ocean acidification in the Arctic projected with the NCAR global coupled carbon
cycle-climate model. Biogeosciences, 6(4), 515-533.
Steinacher, M., F. Joos, T.L. Frölicher, L. Bopp, P. Cadule, V. Cocco, S.C. Doney, M. Gehlen,
K. Lindsay, J.K. Moore, B. Schneider, and J. Segschneider, 2010: Projected 21
st
century decrease in marine productivity: a multi-model analysis. Biogeosciences,
7(3), 979-1005.
Stenevik, E.K. and S. Sundby, 2007: Impacts of climate change on commercial fish
stocks in Norwegian waters. Marine Policy, 31(1), 19-31.
Stige, L.C., G. Ottersen, P. Dalpadado, K.-S. Chan, D. Hjermann, D.L. Lajus, N.A. Yaragina,
and N.C. Stenseth, 2010: Direct and indirect climate forcing in a multi-species
marine system. Proceedings of the Royal Society B, 277(1699), 3411-3420.
Stock, C. and J. Dunne, 2010: Controls on the ratio of mesozooplankton production
to primary production in marine ecosystems. Deep-Sea Research Part I:
Oceanographic Research Papers, 57(1), 95-112.
Stock, C.A., M.A. Alexander, N.A. Bond, K.M. Brander, W.W.L. Cheung, E.N. Curchitser,
T.L. Delworth, J.P. Dunne, S.M. Griffies, M.A. Haltuch, J.A. Hare, A.B. Hollowed,
P. Lehodey, S.A. Levin, J.S. Link, K.A. Rose, R.R. Rykaczewski, J.L. Sarmiento, R.J.
Stouffer, F.B. Schwing, G.A. Vecchi, and F.E. Werner, 2011: On the use of IPCC-
class models to assess the impact of climate on living marine resources.
Progress in Oceanography, 88(1-4), 1-27.
Stolper, D.A., N.P. Revsbech, and D.E. Canfield, 2010: Aerobic growth at nanomolar
oxygen concentrations. Proceedings of the National Academy of Sciences of
the United States of America, 107(44), 18755-18760.
Stramma, L., G.C. Johnson, J. Sprintall, and V. Mohrholz, 2008: Expanding oxygen-
minimum zones in the tropical oceans. Science, 320(5876), 655-658.
Stramma, L., S. Schmidtko, L.A. Levin, and G.C. Johnson, 2010: Ocean oxygen minima
expansions and their biological impacts. Deep-Sea Research Part I:
Oceanographic Research Papers, 57(4), 587-595.
Stramma, L., E.D. Prince, S. Schmidtko, J. Luo, J.P. Hoolihan, M. Visbeck, D.W.R.
Wallace, P. Brandt, and A. Kortzinger, 2012: Expansion of oxygen minimum
zones may reduce available habitat for tropical pelagic fishes. Nature Climate
Change, 2(1), 33-37.
Strand, S.E. and G. Benford, 2009: Ocean sequestration of crop residue carbon:
recycling fossil fuel carbon back to deep sediments. Environmental Science &
Technology, 43(4), 1000-1007.
Strong, A.E., G. Liu, W. Skirving, and C.M. Eakin, 2011: NOAA’s Coral Reef Watch
program from satellite observations. Annals of GIS, 17(2), 83-92.
Stumpp, M., K. Trubenbach, D. Brennecke, M.Y. Hu, and F. Melzner, 2012: Resource
allocation and extracellular acid-base status in the sea urchin Strongylocentrotus
droebachiensis in response to CO
2
induced seawater acidification. Aquatic
Toxicology, 110-111, 194-207.
Sumaila, U.R. and W.W.L. Cheung, 2010: Development and Climate Change: Cost of
Adapting Fisheries to Climate Change. Discussion Paper Number 5, International
Bank for Reconstruction and Development/ World Bank, Washington, DC, USA,
37 pp.
Sumaila, U.R., W.W.L. Cheung, V.W.Y. Lam, D. Pauly, and S. Herrick, 2011: Climate
change impacts on the biophysics and economics of world fisheries. Nature
Climate Change, 1(9), 449-456.
Sun, J., D.A. Hutchins, Y. Feng, E.L. Seubert, D.A. Caron, and F.-X. Fu, 2011: Effects of
changing pCO
2
and phosphate availability on domoic acid production and
physiology of the marine harmful bloom diatom Pseudo-nitzschia multiseries.
Limnology and Oceanography, 56(3), 829-840.
Sunday, J.M., R.N. Crim, C.D.G. Harley, and M.W. Hart, 2011: Quantifying rates of
evolutionary adaptation in response to ocean acidification. PLoS ONE, 6(8),
e22881, doi:10.1371/journal.pone.0022881.
Sunday, J.M., A.E. Bates, and N.K. Dulvy, 2012: Thermal tolerance and the global
redistribution of animals. Nature Climate Change, 2(9), 686-690.
Sverdrup, H.U., 1953: On conditions for the vernal blooming of phytoplankton. ICES
Journal of Marine Science, 18(3), 287-295.
Sydeman, W.J. and S.J. Bograd, 2009: Marine ecosystems, climate and phenology:
introduction. Marine Ecology Progress Series, 393, 185-188.
Takai, K., A. Inoue, and K. Horikoshi, 1999: Thermaerobacter marianensis gen. nov.,
sp. nov., an aerobic extremely thermophilic marine bacterium from the 11000
m deep Mariana Trench. International Journal of Systematic Bacteriology, 49(2),
619-628.
Takai, K., K. Nakamura, T. Toki, U. Tsunogai, M. Miyazaki, J. Miyazaki, H. Hirayama, S.
Nakagawa, T. Nunoura, and K. Horikoshi, 2008: Cell proliferation at 122°C and
isotopically heavy CH
4
production by a hyperthermophilic methanogen under
high-pressure cultivation. Proceedings of the National Academy of Sciences of
the United States of America, 105(31), 10949-10954.
Takasuka, A. and I. Aoki, 2006: Environmental determinants of growth rates for
larval Japanese anchovy Engraulis japonicus in different waters. Fisheries
Oceanography, 15(2), 139-149.
Takasuka, A., Y. Oozeki, and I. Aoki, 2007: Optimal growth temperature hypothesis:
why do anchovy flourish and sardine collapse or vice versa under the same
ocean regime? Canadian Journal of Fisheries and Aquatic Sciences, 64(5), 768-
776.

482
Chapter 6 Ocean Systems
6
Takasuka, A., Y. Oozeki, and H. Kubota, 2008: Multi-species regime shifts reflected
in spawning temperature optima of small pelagic fish in the western North
Pacific. Marine Ecology Progress Series, 360, 211-217.
Tatters, A.O., F.-X. Fu, and D.A. Hutchins, 2012: High CO
2
and silicate limitation
synergistically increase the toxicity of Pseudo-nitzschia fraudulenta. PLoS ONE,
7(2), e32116, doi:10.1371/journal.pone.0032116.
Tatters, A.O., A. Schnetzer, F. Fu, A.Y.A. Lie, D.A. Caron, and D.A. Hutchins, 2013: Short-
versus long-term responses to changing CO
2
in a coastal dinoflagellate bloom:
implications for interspecific competitive interactions and community structure.
Evolution, 67(7), 1879-1891.
Taucher, J. and A. Oschlies, 2011: Can we predict the direction of marine primary
production change under global warming? Geophysical Research Letters, 38(2),
L02603, doi:10.1029/2010GL045934.
Taylor, A.R., A. Chrachri, G. Wheeler, H. Goddard, and C. Brownlee, 2011: A voltage-
gated H
+
channel underlying pH homeostasis in calcifying Coccolithophores.
PLoS Biology, 9(6), e1001085, doi:10.1371/journal.pbio.1001085.
Taylor, C.C., 1958: Cod growth and temperature. ICES Journal of Marine Science, 23,
366-370.
Teneva, L., M. Karnauskas, C.A. Logan, L. Bianucci, J.C. Currie, and J.A. Kleypas, 2012:
Predicting coral bleaching hotspots: the role of regional variability in thermal
stress and potential adaptation rates. Coral Reefs, 31(1), 1-12.
Tenreiro, S., M.F. Nobre, F.A. Rainey, C. Miguel, and M.S. Da Costa, 1997: Thermonema
rossianum sp. nov., a new thermophilic and slightly halophilic species from
saline hot springs in Naples, Italy. International Journal of Systematic
Bacteriology, 47(1), 122-126.
Thackeray, S.J., T.H. Sparks, M. Frederiksen, S. Burthe, P.J. Bacon, J.R. Bell, M.S.
Botham, T.M. Brereton, P.W. Bright, L. Carvalho, T. Clutton-Brock, A. Dawson,
M. Edwards, J.M. Elliott, R. Harrington, D. Johns, I.D. Jones, J.T. Jones, D.I. Leech,
D.B. Roy, W.A. Scott, M. Smith, R.J. Smithers, I.J. Winfield, and S. Wanless, 2010:
Trophic level asynchrony in rates of phenological change for marine, freshwater
and terrestrial environments. Global Change Biology, 16(12), 3304-3313.
Thomas, E., 2003: Extinction and food at the seafloor: a high-resolution benthic
foraminiferal record across the Initial Eocene Thermal Maximum, Southern
Ocean Site 690. In: Causes and Consequences of Globally Warm Climates in
the Early Paleogene [Wing, S.L., P.D. Gingerich, B. Schmitz, and E. Thomas (eds.)].
Geological Society of America Special Paper 369, Geological Society of America,
Boulder, CO, USA, pp. 319-332.
Thomas, E., 2007: Cenozoic mass extinctions in the deep sea: what perturbs the
largest habitat on earth? In: Large Scale Ecosystem Perturbation: Causes and
Consequences [Monechi, S., R. Coccioni, and M.R. Rampino (eds.)]. Geological
Society of America Special Paper 424, Geological Society of America, Boulder,
CO, USA, pp. 1-23.
Thomas, M.K., C.T. Kremer, C.A. Klausmeier, and E. Litchman, 2012: A global pattern
of thermal adaptation in marine phytoplankton. Science, 338(6110), 1085-
1088.
Thomsen, J. and F. Melzner, 2010: Moderate seawater acidification does not elicit
long-term metabolic depression in the blue mussel Mytilus edulis. Marine
Biology, 157(12), 2667-2676.
Thresher, R.E., B. Tilbrook, S. Fallon, N.C. Wilson, and J. Adkins, 2011: Effects of chronic
low carbonate saturation levels on the distribution, growth and skeletal chemistry
of deep-sea corals and other seamount megabenthos. Marine Ecology Progress
Series, 442, 87-99.
Tittensor, D.P., C. Mora, W. Jetz, H.K. Lotze, D. Ricard, E.V. Berghe, and B. Worm, 2010:
Global patterns and predictors of marine biodiversity across taxa. Nature,
466(7310), 1098-1101.
Tortell, P.D., C.D. Payne, Y. Li, S. Trimborn, B. Rost, W.O. Smith, C. Riesselman, R.B.
Dunbar, P. Sedwick, and G.R. DiTullio, 2008: CO
2
sensitivity of Southern Ocean
phytoplankton. Geophysical Research Letters, 35(4), L04605, doi:10.1029/
2007GL032583.
Trick, C.G., B.D. Bill, W.P. Cochlan, M.L. Wells, V.L. Trainer, and L.D. Pickell, 2010: Iron
enrichment stimulates toxic diatom production in high-nitrate, low-chlorophyll
areas. Proceedings of the National Academy of Sciences of the United States
of America, 107(13), 5887-5892.
Trimborn, S., N. Lundholm, S. Thoms, K.U. Richter, B. Krock, P.J. Hansen, and B. Rost,
2008: Inorganic carbon acquisition in potentially toxic and non-toxic diatoms:
the effect of pH-induced changes in seawater carbonate chemistry. Physiologia
Plantarum, 133(1), 92-105.
Trotter, J., P. Montagna, M. McCulloch, S. Silenzi, S. Reynaud, G. Mortimer, S. Martin,
C. Ferrier-Pagès, J.-P. Gattuso, and R. Rodolfo-Metalpa, 2011: Quantifying the
pH ‘vital effect’ in the temperate zooxanthellate coral Cladocora caespitosa:
validation of the boron seawater pH proxy. Earth and Planetary Science Letters,
303(3-4), 163-173.
Tseng, Y.-C., M.Y. Hu, M. Stumpp, L.-Y. Lin, F. Melzner, and P.-P. Hwang, 2013: CO
2
-
driven seawater acidification differentially affects development and molecular
plasticity along life history of fish (Oryzias latipes). Comparative Biochemistry
and Physiology A: Molecular and Integrative Physiology, 165(2), 119-130.
Ulloa, O., D.E. Canfield, E.F. DeLong, R.M. Letelier, and F.J. Stewart, 2012: Microbial
oceanography of anoxic oxygen minimum zones. Proceedings of the National
Academy of Sciences of the United States of America, 109(40), 15996-16003.
UNWTO, 2008: Climate Change and Tourism – Responding to Global Challenges.
World Tourism Organization and the United Nations Environment Programme,
Madrid, Spain, 272 pp.
Urban, M.C., J.J. Tewksbury, and K.S. Sheldon, 2012: On a collision course: competition
and dispersal differences create no-analogue communities and cause extinctions
during climate change. Proceedings of the Royal Society B, 279, 2072-2080.
Utne-Palm, A.C., A.G. Salvanes, B. Currie, S. Kaartvedt, G.E. Nilsson, V.A. Braithwaite,
J.A. Stecyk, M. Hundt, M. van der Bank, B. Flynn, G.K. Sandvik, T.A. Klevjer, A.K.
Sweetman, V. Bruchert, K. Pittman, K.R. Peard, I.G. Lunde, R.A. Strandabo, and
M.J. Gibbons, 2010: Trophic structure and community stability in an overfished
ecosystem. Science, 329(5989), 333-336.
Valdimarsson, H., O.S. Astthorsson, and J. Palsson, 2012: Hydrographic variability in
Icelandic waters during recent decades and related changes in distribution of
some fish species. ICES Journal of Marine Science, 69(5), 816-825.
Van Houtan, K.S. and O.L. Bass, 2007: Stormy oceans are associated with declines
in sea turtle hatching. Current Biology, 17(15), 590-591.
Van Houtan, K.S. and J.M. Halley, 2011: Long-term climate forcing in loggerhead
sea turtle nesting. PLoS ONE, 6(4), e19043, doi:10.1371/journal.pone.0019043.
Vaquer-Sunyer, R. and C.M. Duarte, 2008: Thresholds of hypoxia for marine
biodiversity. Proceedings of the National Academy of Sciences of the United
States of America, 105(40), 15452-15457.
Vaquer-Sunyer, R. and C.M. Duarte, 2011: Temperature effects on oxygen thresholds
for hypoxia in marine benthic organisms. Global Change Biology, 17(5), 1788-
1797.
Vargas, F.H., R.C. Lacy, P.J. Johnson, A. Steinfurth, R.J.M. Crawford, P. Dee Boersma,
and D.W. Macdonald, 2007: Modelling the effect of El Niño on the persistence
of small populations: the Galápagos penguin as a case study. Biological
Conservation, 137(1), 138-148.
Vásquez-Bedoya, L.F., A.L. Cohen, D.W. Oppo, and P. Blanchon, 2012: Corals record
persistent multidecadal SST variability in the Atlantic Warm Pool since 1775
AD. Paleoceanography, 27, PA3231, doi:10.1029/2012PA002313.
Vaughan, N.E. and T.M. Lenton, 2011: A review of climate geoengineering proposals.
Climatic Change, 109(3-4), 745-790.
Vecchi, G.A. and B.J. Soden, 2007: Increased tropical Atlantic wind shear in model
projections of global warming. Geophysical Research Letters, 34, L08702,
doi:10.1029/2006GL028905.
Vélez-Belchí, P., A. Hernández-Guerra, E. Fraile-Nuez, and V. Benítez-Barrios, 2010:
Changes in temperature and salinity tendencies of the upper subtropical North
Atlantic ocean at 24.5°N. Journal of Physical Oceanography, 40(11), 2546-
2555.
Venn, A.A., E. Tambutté, M. Holcomb, J. Laurent, D. Allemand, and S. Tambutté, 2013:
Impact of seawater acidification on pH at the tissue-skeleton interface and
alcification in reef corals. Proceedings of the National Academy of Sciences of
the United States of America, 110(5), 1634-1639.
Ventura, S., C. Viti, R. Pastorelli, and L. Giovannetti, 2000: Revision of species
delineation in the genus Ectothiorhodospira. International Journal of Systematic
and Evolutionary Microbiology, 50(2), 583-591.
Vermeij, G.J. and E.J. Petuch, 1986: Differential extinction in tropical American
molluscs: endemism, architecture, and the Panama land bridge. Malacologia,
27(1), 29-41.
Veron, J.E.N., O. Hoegh-Guldberg, T.M. Lenton, J.M. Lough, D.O. Obura, P. Pearce-
Kelly, C.R. Sheppard, M. Spalding, M.G. Stafford-Smith, and A.D. Rogers, 2009:
The coral reef crisis: the critical importance of < 350 ppm CO
2
. Marine Pollution
Bulletin, 58(10), 1428-1436.
Veron, J.E.N., 2011: Ocean acidification and coral reefs: an emerging big picture.
Diversity, 3(2), 262-274.
Vetter, R.D., E.A. Lynn, M. Garza, and A.S. Costa, 1994: Depth zonation and metabolic
adaptation in Dover sole, Microstomus pacificus, and other deep-living
flatfishes: factors that affect the sole. Marine Biology, 120(1), 145-159.

483
Ocean Systems Chapter 6
6
Vezzoli, A., M. Gussoni, F. Greco, L. Zetta, and P. Cerretelli, 2004: Temperature and
pH dependence of energy balance by
31
P- and
1
H-MRS in anaerobic frog muscle.
Biochimica et Biophysica Acta, 1608(2-3), 163-170.
Vezzulli, L., C. Pruzzo, A. Huq, and R.R. Colwell, 2010: Environmental reservoirs of
Vibrio cholerae and their role in cholera. Environmental Microbiology Reports,
2(1), 27-33.
Vitasse, Y., C.C. Bresson, A. Kremer, R. Michalet, and S. Delzon, 2010: Quantifying
phenological plasticity to temperature in two temperate tree species. Functional
Ecology, 24(6), 1211-1218.
Vogt, M., M. Steinke, S. Turner, A. Paulino, M. Meyerhofer, U. Riebesell, C. LeQuéré, and
P. Liss, 2008: Dynamics of dimethylsulphoniopropionate and dimethylsulphide
under different CO
2
concentrations during a mesocosm experiment.
Biogeosciences, 5, 407-419.
Votier, S.C., B.J. Hatchwell, A. Beckerman, R.H. McCleery, F.M. Hunter, J. Pellatt, M.
Trinder, and T.R. Birkhead, 2005: Oil pollution and climate have wide-scale
impacts on seabird demographics. Ecology Letters, 8(11), 1157-1164.
Walther, K., F.J. Sartoris, C. Bock, and H.-O. Pörtner, 2009: Impact of anthropogenic
ocean acidification on thermal tolerance of the spider crab Hyas araneus.
Biogeosciences, 6(10), 2207-2215.
Walther, K., K. Anger, and H.-O. Pörtner, 2010: Effects of ocean acidification and
warming on the larval development of the spider crab Hyas araneus from
different latitudes (54° vs. 79°N). Marine Ecology Progress Series, 417, 159-170.
Walther, K., F.J. Sartoris, and H.-O. Pörtner, 2011: Impacts of temperature and
acidification on larval calcification of the spider crab Hyas araneus from different
latitudes (54° vs. 79°N). Marine Biology, 158(9), 2043-2053.
Wara, M.W., A.C. Ravelo, and M.L. Delaney, 2005: Permanent El Niño-like conditions
during the Pliocene warm period. Science, 309(5735), 758-761.
Ware, D.M. and R.E. Thomson, 2005: Bottom-up ecosystem trophic dynamics deter-
mine fish production in the northeast Pacific. Science, 308(5726), 1280-1284.
Watanabe, Y.W., M. Shigemitsu, and K. Tadokoro, 2008: Evidence of a change in
oceanic fixed nitrogen with decadal climate change in the North Pacific
subpolar region. Geophysical Research Letters, 35(1), L01602, doi:10.1029/
2007GL032188.
Watson, A.J., U. Schuster, D.C.E. Bakker, N.R. Bates, A. Corbière, M. González-Dávila,
T. Friedrich, J. Hauck, C. Heinze, T. Johannessen, A. Körtzinger, N. Metzl, J. Olaf-
sson, A. Olsen, A. Oschlies, X.A. Padin, B. Pfeil, J.M. Santana-Casiano, T. Steinhoff,
M. Telszewski, A.F. Rios, D.W.R. Wallace, and R. Wanninkhof, 2009: Tracking
the variable North Atlantic sink for atmospheric CO
2
. Science, 326(5958), 1391-
1393.
Webb, A.E., L.R. Leighton, S.A. Schellenberg, E.A. Landau, and E. Thomas, 2009:
Impact of the Paleocene-Eocene thermal maximum on deep-ocean microbenthic
community structure: using rank-abundance curves to quantify paleoecological
response. Geology, 37(9), 783-786.
Weinbauer, M.G., X. Mari, and J.-P. Gattuso, 2011: Effects of ocean acidification on
the diversity and activity of heterotrophic marine microorganisms. In: Ocean
Acidification [Gattuso, J.-P. and L. Hansson (eds.)]. Oxford University Press,
Oxford, UK, pp. 83-98.
Wernberg, T., D.A. Smale, F. Tuya, M.S. Thomsen, T.J. Langlois, T. de Bettignies, S.
Bennett, and C.S. Rousseaux, 2013: An extreme climatic event alters marine
ecosystem structure in a global biodiversity hotspot. Nature Climate Change,
3(1), 78-82.
Westbrook, G.K., K.E. Thatcher, E.J. Rohling, A.M. Piotrowski, H. Pälike, A.H. Osborne,
E.G. Nisbet, T.A. Minshull, M. Lanoisellé, R.H. James, V. Hühnerbach, D. Green,
R.E. Fisher, A.J. Crocker, A. Chabert, C. Bolton, A. Beszczynska-Möller, C. Berndt,
and A. Aquilina, 2009: Escape of methane gas from the seabed along the West
Spitsbergen continental margin. Geophysical Research Letters, 36(15), L15608,
doi:10.1029/2009GL039191.
Wethey, D.S., S.A. Woodin, T.J. Hilbish, S.J. Jones, F.P. Lima, and P.M. Brannock, 2011:
Response of intertidal populations to climate: effects of extreme events versus
long term change. Journal of Experimental Marine Biology and Ecology,
400(1-2), 132-144.
Whiteley, N.M., 2011: Physiological and ecological responses of crustaceans to ocean
acidification. Marine Ecology Progress Series, 430, 257-271.
Whitney, F.A., 2011: Nutrient variability in the mixed layer of the subarctic Pacific
Ocean, 1987-2010. Journal of Oceanography, 67(4), 481-492.
Williams, J.W. and S.T. Jackson, 2007: Novel climates, no-analog communities, and
ecological surprises. Frontiers in Ecology and the Environment, 5(9), 475-482.
Williamson, P. and C. Turley, 2012: Ocean acidification in a geoengineering context.
Philosophical Transactions of the Royal Society A, 370(1974), 4317-4342.
Williamson, P., R.T. Watson, G. Mace, P. Artaxo, R. Bodle, V. Galaz, A. Parker, D. Santillo,
C. Vivian, D. Cooper, J. Webbe, A. Cung, and E. Woods, 2012: Impacts of Climate-
Related Geoengineering on Biological Diversity. Part I: Geoengineering in
Relation to the Convention on Biological Diversity: Technical and Regulatory
Matters. Secretariat of the Convention on Biological Diversity, Montreal,
Technical Series No. 66, 152 pp.
Wilson, K.J., J. Falkingham, H. Melling, and R. De Abreu, 2004: Shipping in the
Canadian Arctic: other possible climate change scenarios. Geoscience and
Remote Sensing Symposium Proceedings, 3, 1853-1856.
Wilson, R., A. Tudhope, P. Brohan, K. Briffa, T. Osborn, and S. Tett, 2006: Two-hundred-
fifty years of reconstructed and modeled tropical temperatures. Journal of
Geophysical Research, 111(C10), C10007, doi:10.1029/2005JC003188.
Wilson, S.E., D.K. Steinberg, and K.O. Buesseler, 2008: Changes in fecal pellet
characteristics with depth as indicators of zooplankton repackaging of particles
in the mesopelagic zone of the subtropical and subarctic North Pacific Ocean.
Deep-Sea Research Part II: Topical Studies in Oceanography, 55(14-15), 1636-
1647.
Wiltshire, K., A. Kraberg, I. Bartsch, M. Boersma, H.-D. Franke, J. Freund, C. Gebühr,
G. Gerdts, K. Stockmann, and A. Wichels, 2010: Helgoland roads, North Sea:
45years of change. Estuaries and Coasts, 33(2), 295-310.
Witt, M.J., L.A. Hawkes, M.H. Godfrey, B.J. Godley, and A.C. Broderick, 2010: Predicting
the impacts of climate change on a globally distributed species: the case of the
loggerhead turtle. Journal of Experimental Biology, 213, 901-911.
Wittmann, A.C. and H.-O. Pörtner, 2013: Sensitivities of extant animal taxa to ocean
acidification. Nature Climate Change, 3, 995-1001.
Woese, C.R., O. Kandler, and M.L. Wheelis, 1990: Towards a natural system of
organisms: proposal for the domains Archaea, Bacteria, and Eucarya. Proceedings
of the National Academy of Sciences of the United States of America, 87(12),
4576-4579.
Wohlers-Zöllner, J., P. Breithaupt, K. Walther, K. Jürgens, and U. Riebesell, 2011:
Temperature and nutrient stoichiometry interactively modulate organic matter
cycling in a pelagic algal-bacterial community. Limnology and Oceanography,
56(2), 599-610.
Wolf, S.G., M.A. Snyder, W.J. Sydeman, D.F. Doak, and D.A. Croll, 2010: Predicting
population consequences of ocean climate change for an ecosystem sentinel,
the seabird Cassin’s auklet. Global Change Biology, 16(7), 1923-1935.
Wolff, G.A., D.S.M. Billett, B.J. Bett, J. Holtvoeth, T. FitzGeorge-Balfour, E.H. Fisher, I.
Cross, R. Shannon, I. Salter, B. Boorman, N.J. King, A. Jamieson, and F. Chaillan,
2011: The effects of natural iron fertilisation on deep-sea ecology: the Crozet
plateau, Southern Indian Ocean. PLoS ONE, 6(6), e20697, doi:10.1371/
journal.pone.0020697.
Wood, H.L., J.I. Spicer, and S. Widdicombe, 2008: Ocean acidification may increase
calcification rates, but at a cost. Proceedings of the Royal Society B, 275(1644),
1767-1773.
Wood, R., 1999: Reef Evolution. Oxford University Press, Oxford, UK, 414 pp.
Woodworth-Jefcoats, P.A., J.J. Polovina, J.P. Dunne, and J.L. Blanchard, 2013:
Ecosystem size structure response to 21
st
century climate projection: large fish
abundance decreases in the central North Pacific and increases in the California
Current. Global Change Biology, 19(3), 724-733.
Wootton, J.T., C.A. Pfister, and J.D. Forester, 2008: Dynamic patterns and ecological
impacts of declining ocean pH in a high-resolution multi-year dataset.
Proceedings of the National Academy of Sciences of the United States of
America, 105(48), 18848-18853.
Worm, B., R. Hilborn, J.K. Baum, T.A. Branch, J.S. Collie, C. Costello, M.J. Fogarty, E.A.
Fulton, J.A. Hutchings, S. Jennings, O.P. Jensen, H.K. Lotze, P.M. Mace, T.R.
McClanahan, C. Minto, S.R. Palumbi, A.M. Parma, D. Ricard, A.A. Rosenberg, R.
Watson, and D. Zeller, 2009: Rebuilding global fisheries. Science, 325(5940),
578-585.
Zachos, J.C., U. Röhl, S.A. Schellenberg, A. Sluijs, D.A. Hodell, D.C. Kelly, E. Thomas,
M. Nicolo, I. Raffi, L.J. Lourens, H. McCarren, and D. Kroon, 2005: Rapid
acidification of the ocean during the Paleocene-Eocene Thermal Maximum.
Science, 308(5728), 1611-1615.
Zeebe, R.E. and P. Westbroek, 2003: A simple model for the CaCO
3
saturation
state of the ocean: the “Strangelove”, the “Neritan”, and the “Cretan”
Ocean. Geochemistry Geophysics Geosystems, 4(12), 1104, doi:10.1029/
2003GC000538.
Zeebe, R.E., J.C. Zachos, and G.R. Dickens, 2009: Carbon dioxide forcing alone
insufficient to explain Palaeocene-Eocene Thermal Maximum warming. Nature
Geoscience, 2(8), 576-580.

484
Chapter 6 Ocean Systems
6
Zhang, J., D. Gilbert, A.J. Gooday, L. Levin, S.W.A. Naqvi, J.J. Middelburg, M. Scranton,
W. Ekau, A. Peña, B. Dewitte, T. Oguz, P.M.S. Monteiro, E. Urban, N.N. Rabalais,
V. Ittekkot, W.M. Kemp, O. Ulloa, R. Elmgren, E. Escobar-Briones, and A.K. Van
der Plas, 2010: Natural and human-induced hypoxia and consequences for
coastal areas: synthesis and future development. Biogeosciences, 7(5), 1443-
1467.
Zondervan, I., R.E. Zeebe, B. Rost, and U. Riebesell, 2001: Decreasing marine biogenic
calcification: a negative feedback on rising atmospheric pCO
2
. Global
Biogeochemical Cycles, 15(2), 507-516.
Zondervan, I., B. Rost, and U. Riebesell, 2002: Effect of CO
2
concentration on the
PIC/POC ratio in the coccolithophore Emiliania huxleyi grown under light-
limiting conditions and different daylengths. Journal of Experimental Marine
Biology and Ecology, 272(1), 55-70.
