
511
7
Energy Systems
Coordinating Lead Authors:
Thomas Bruckner (Germany), Igor Alexeyevich Bashmakov (Russian Federation), Yacob Mulugetta
(Ethiopia / UK)
Lead Authors:
Helena Chum (Brazil / USA), Angel De la Vega Navarro (Mexico), James Edmonds (USA), Andre
Faaij (Netherlands), Bundit Fungtammasan (Thailand), Amit Garg (India), Edgar Hertwich
(Austria / Norway), Damon Honnery (Australia), David Infield (UK), Mikiko Kainuma (Japan), Smail
Khennas (Algeria / UK), Suduk Kim (Republic of Korea), Hassan Bashir Nimir (Sudan), Keywan Riahi
(Austria), Neil Strachan (UK), Ryan Wiser (USA), Xiliang Zhang (China)
Contributing Authors:
Yumiko Asayama (Japan), Giovanni Baiocchi (UK / Italy), Francesco Cherubini (Italy / Norway),
Anna Czajkowska (Poland / UK), Naim Darghouth (USA), James J. Dooley (USA), Thomas Gibon
(France / Norway), Haruna Gujba (Ethiopia / Nigeria), Ben Hoen (USA), David de Jager (Netherlands),
Jessica Jewell (IIASA / USA), Susanne Kadner (Germany), Son H. Kim (USA), Peter Larsen (USA), Axel
Michaelowa (Germany / Switzerland), Andrew Mills (USA), Kanako Morita (Japan), Karsten Neuhoff
(Germany), Ariel Macaspac Hernandez (Philippines / Germany), H-Holger Rogner (Germany),
Joseph Salvatore (UK), Steffen Schlömer (Germany), Kristin Seyboth (USA), Christoph von Stechow
(Germany), Jigeesha Upadhyay (India)
Review Editors:
Kirit Parikh (India), Jim Skea (UK)
Chapter Science Assistant:
Ariel Macaspac Hernandez (Philippines / Germany)

512512
Energy Systems
7
Chapter 7
This chapter should be cited as:
Bruckner T., I. A. Bashmakov, Y. Mulugetta, H. Chum, A. de la Vega Navarro, J. Edmonds, A. Faaij, B. Fungtammasan, A. Garg,
E. Hertwich, D. Honnery, D. Infield, M. Kainuma, S. Khennas, S. Kim, H. B. Nimir, K. Riahi, N. Strachan, R. Wiser, and X. Zhang,
2014: Energy Systems. In: Climate Change 2014: Mitigation of Climate Change. Contribution of Working Group III to the
Fifth Assessment Report of the Intergovernmental Panel on Climate Change [Edenhofer, O., R. Pichs-Madruga, Y. Sokona, E.
Farahani, S. Kadner, K. Seyboth, A. Adler, I. Baum, S. Brunner, P. Eickemeier, B. Kriemann, J. Savolainen, S. Schlömer, C. von
Stechow, T. Zwickel and J.C. Minx (eds.)]. Cambridge University Press, Cambridge, United Kingdom and New York, NY, USA.

513513
Energy Systems
7
Chapter 7
Contents
Executive Summary � � � � � � � � � � � � � � � � � � � � � � � � � � � � � � � � � � � � � � � � � � � � � � � � � � � � � � � � � � � � � � � � � � � � � � � � � � � � � � � � � � � � � � � � � � � � � � � � � � � � � � � � � � � � � � � 482
7�1 Introduction � � � � � � � � � � � � � � � � � � � � � � � � � � � � � � � � � � � � � � � � � � � � � � � � � � � � � � � � � � � � � � � � � � � � � � � � � � � � � � � � � � � � � � � � � � � � � � � � � � � � � � � � � � � 518
7�2 Energy production, conversion, transmission and distribution � � � � � � � � � � � � � � � � � � � � � � � � � � � � � � � � � � � � � � � � 519
7�3 New developments in emission trends and drivers � � � � � � � � � � � � � � � � � � � � � � � � � � � � � � � � � � � � � � � � � � � � � � � � � � � � � � � 522
7�4 Resources and resource availability � � � � � � � � � � � � � � � � � � � � � � � � � � � � � � � � � � � � � � � � � � � � � � � � � � � � � � � � � � � � � � � � � � � � � � � � � � � � 524
7�4�1 Fossil fuels
� � � � � � � � � � � � � � � � � � � � � � � � � � � � � � � � � � � � � � � � � � � � � � � � � � � � � � � � � � � � � � � � � � � � � � � � � � � � � � � � � � � � � � � � � � � � � � � � � � � 524
7�4�2 Renewable energy
� � � � � � � � � � � � � � � � � � � � � � � � � � � � � � � � � � � � � � � � � � � � � � � � � � � � � � � � � � � � � � � � � � � � � � � � � � � � � � � � � � � � � � � � � � � 525
7�4�3 Nuclear energy
� � � � � � � � � � � � � � � � � � � � � � � � � � � � � � � � � � � � � � � � � � � � � � � � � � � � � � � � � � � � � � � � � � � � � � � � � � � � � � � � � � � � � � � � � � � � � � � 526
7�5 Mitigation technology options, practices and behavioral aspects � � � � � � � � � � � � � � � � � � � � � � � � � � � � � � � � � � � � 527
7�5�1 Fossil fuel extraction, conversion, and fuel switching
� � � � � � � � � � � � � � � � � � � � � � � � � � � � � � � � � � � � � � � � � � � � � � � � � � � � � 527
7�5�2 Energy efficiency in transmission and distribution
� � � � � � � � � � � � � � � � � � � � � � � � � � � � � � � � � � � � � � � � � � � � � � � � � � � � � � � � � 528
7�5�3 Renewable energy technologies
� � � � � � � � � � � � � � � � � � � � � � � � � � � � � � � � � � � � � � � � � � � � � � � � � � � � � � � � � � � � � � � � � � � � � � � � � � � � 528
7�5�4 Nuclear energy
� � � � � � � � � � � � � � � � � � � � � � � � � � � � � � � � � � � � � � � � � � � � � � � � � � � � � � � � � � � � � � � � � � � � � � � � � � � � � � � � � � � � � � � � � � � � � � 530
7�5�5 Carbon dioxide capture and storage (CCS)
� � � � � � � � � � � � � � � � � � � � � � � � � � � � � � � � � � � � � � � � � � � � � � � � � � � � � � � � � � � � � � � � � 532
7�6 Infrastructure and systemic perspectives� � � � � � � � � � � � � � � � � � � � � � � � � � � � � � � � � � � � � � � � � � � � � � � � � � � � � � � � � � � � � � � � � � � � � 534
7�6�1 Electrical power systems
� � � � � � � � � � � � � � � � � � � � � � � � � � � � � � � � � � � � � � � � � � � � � � � � � � � � � � � � � � � � � � � � � � � � � � � � � � � � � � � � � � � 534
7.6.1.1 System balancing — flexible generation and loads
. . . . . . . . . . . . . . . . . . . . . . . . . . . . . . . . . . . . . . . . . . . . . . . . . . . 534
7.6.1.2 Capacity adequacy
. . . . . . . . . . . . . . . . . . . . . . . . . . . . . . . . . . . . . . . . . . . . . . . . . . . . . . . . . . . . . . . . . . . . . . . . . . . . . . . . . . . . 535
7.6.1.3 Transmission and distribution
. . . . . . . . . . . . . . . . . . . . . . . . . . . . . . . . . . . . . . . . . . . . . . . . . . . . . . . . . . . . . . . . . . . . . . . . . 535
7�6�2 Heating and cooling networks
� � � � � � � � � � � � � � � � � � � � � � � � � � � � � � � � � � � � � � � � � � � � � � � � � � � � � � � � � � � � � � � � � � � � � � � � � � � � � � 535
7�6�3 Fuel supply systems
� � � � � � � � � � � � � � � � � � � � � � � � � � � � � � � � � � � � � � � � � � � � � � � � � � � � � � � � � � � � � � � � � � � � � � � � � � � � � � � � � � � � � � � � � 536
7�6�4 CO
2
transport � � � � � � � � � � � � � � � � � � � � � � � � � � � � � � � � � � � � � � � � � � � � � � � � � � � � � � � � � � � � � � � � � � � � � � � � � � � � � � � � � � � � � � � � � � � � � � � � 536

514514
Energy Systems
7
Chapter 7
7�7 Climate change feedback and interaction with adaptation � � � � � � � � � � � � � � � � � � � � � � � � � � � � � � � � � � � � � � � � � � � � � 537
7�8 Costs and potentials � � � � � � � � � � � � � � � � � � � � � � � � � � � � � � � � � � � � � � � � � � � � � � � � � � � � � � � � � � � � � � � � � � � � � � � � � � � � � � � � � � � � � � � � � � � � � � � � 538
7�8�1 Potential emission reduction from mitigation measures
� � � � � � � � � � � � � � � � � � � � � � � � � � � � � � � � � � � � � � � � � � � � � � � � � � � 538
7�8�2 Cost assessment of mitigation measures
� � � � � � � � � � � � � � � � � � � � � � � � � � � � � � � � � � � � � � � � � � � � � � � � � � � � � � � � � � � � � � � � � � � 542
7�8�3 Economic potentials of mitigation measures
� � � � � � � � � � � � � � � � � � � � � � � � � � � � � � � � � � � � � � � � � � � � � � � � � � � � � � � � � � � � � � � 543
7�9 Co-benefits, risks and spillovers � � � � � � � � � � � � � � � � � � � � � � � � � � � � � � � � � � � � � � � � � � � � � � � � � � � � � � � � � � � � � � � � � � � � � � � � � � � � � � � � � 544
7�9�1 Socio-economic effects
� � � � � � � � � � � � � � � � � � � � � � � � � � � � � � � � � � � � � � � � � � � � � � � � � � � � � � � � � � � � � � � � � � � � � � � � � � � � � � � � � � � � � � 544
7�9�2 Environmental and health effects
� � � � � � � � � � � � � � � � � � � � � � � � � � � � � � � � � � � � � � � � � � � � � � � � � � � � � � � � � � � � � � � � � � � � � � � � � � � 546
7�9�3 Technical risks
� � � � � � � � � � � � � � � � � � � � � � � � � � � � � � � � � � � � � � � � � � � � � � � � � � � � � � � � � � � � � � � � � � � � � � � � � � � � � � � � � � � � � � � � � � � � � � � 549
7�9�4 Public perception
� � � � � � � � � � � � � � � � � � � � � � � � � � � � � � � � � � � � � � � � � � � � � � � � � � � � � � � � � � � � � � � � � � � � � � � � � � � � � � � � � � � � � � � � � � � � 551
7�10 Barriers and opportunities � � � � � � � � � � � � � � � � � � � � � � � � � � � � � � � � � � � � � � � � � � � � � � � � � � � � � � � � � � � � � � � � � � � � � � � � � � � � � � � � � � � � � � � � 551
7�10�1 Technical aspects
� � � � � � � � � � � � � � � � � � � � � � � � � � � � � � � � � � � � � � � � � � � � � � � � � � � � � � � � � � � � � � � � � � � � � � � � � � � � � � � � � � � � � � � � � � � � 551
7�10�2 Financial and investment barriers and opportunities
� � � � � � � � � � � � � � � � � � � � � � � � � � � � � � � � � � � � � � � � � � � � � � � � � � � � � � 552
7�10�3 Cultural, institutional, and legal barriers and opportunities
� � � � � � � � � � � � � � � � � � � � � � � � � � � � � � � � � � � � � � � � � � � � � � � 552
7�10�4 Human capital capacity building
� � � � � � � � � � � � � � � � � � � � � � � � � � � � � � � � � � � � � � � � � � � � � � � � � � � � � � � � � � � � � � � � � � � � � � � � � � � � 553
7�10�5 Inertia in energy systems physical capital stock turnover
� � � � � � � � � � � � � � � � � � � � � � � � � � � � � � � � � � � � � � � � � � � � � � � � � � 553
7�11 Sectoral implication of transformation pathways and sustainable development � � � � � � � � � � � � � � � 554
7�11�1 Energy-related greenhouse gas emissions
� � � � � � � � � � � � � � � � � � � � � � � � � � � � � � � � � � � � � � � � � � � � � � � � � � � � � � � � � � � � � � � � � � 554
7�11�2 Energy supply in low-stabilization scenarios
� � � � � � � � � � � � � � � � � � � � � � � � � � � � � � � � � � � � � � � � � � � � � � � � � � � � � � � � � � � � � � � 555
7�11�3 Role of the electricity sector in climate change mitigation
� � � � � � � � � � � � � � � � � � � � � � � � � � � � � � � � � � � � � � � � � � � � � � � � 559
7�11�4 Relationship between short-term action and long-term targets
� � � � � � � � � � � � � � � � � � � � � � � � � � � � � � � � � � � � � � � � � � � 562

515515
Energy Systems
7
Chapter 7
7�12 Sectoral policies � � � � � � � � � � � � � � � � � � � � � � � � � � � � � � � � � � � � � � � � � � � � � � � � � � � � � � � � � � � � � � � � � � � � � � � � � � � � � � � � � � � � � � � � � � � � � � � � � � � � � � 564
7�12�1 Economic instruments
� � � � � � � � � � � � � � � � � � � � � � � � � � � � � � � � � � � � � � � � � � � � � � � � � � � � � � � � � � � � � � � � � � � � � � � � � � � � � � � � � � � � � � � 565
7�12�2 Regulatory approaches
� � � � � � � � � � � � � � � � � � � � � � � � � � � � � � � � � � � � � � � � � � � � � � � � � � � � � � � � � � � � � � � � � � � � � � � � � � � � � � � � � � � � � � 567
7�12�3 Information programmes
� � � � � � � � � � � � � � � � � � � � � � � � � � � � � � � � � � � � � � � � � � � � � � � � � � � � � � � � � � � � � � � � � � � � � � � � � � � � � � � � � � � 567
7�12�4 Government provision of public goods or services
� � � � � � � � � � � � � � � � � � � � � � � � � � � � � � � � � � � � � � � � � � � � � � � � � � � � � � � � � 567
7�12�5 Voluntary actions
� � � � � � � � � � � � � � � � � � � � � � � � � � � � � � � � � � � � � � � � � � � � � � � � � � � � � � � � � � � � � � � � � � � � � � � � � � � � � � � � � � � � � � � � � � � 568
7�13 Gaps in knowledge and data � � � � � � � � � � � � � � � � � � � � � � � � � � � � � � � � � � � � � � � � � � � � � � � � � � � � � � � � � � � � � � � � � � � � � � � � � � � � � � � � � � � � � 568
7�14 Frequently Asked Questions � � � � � � � � � � � � � � � � � � � � � � � � � � � � � � � � � � � � � � � � � � � � � � � � � � � � � � � � � � � � � � � � � � � � � � � � � � � � � � � � � � � � � � 568
References � � � � � � � � � � � � � � � � � � � � � � � � � � � � � � � � � � � � � � � � � � � � � � � � � � � � � � � � � � � � � � � � � � � � � � � � � � � � � � � � � � � � � � � � � � � � � � � � � � � � � � � � � � � � � � � � � � � � � � � � � � 570

516516
Energy Systems
7
Chapter 7
Executive Summary
The energy systems chapter addresses issues related to the
mitigation of greenhouse gas emissions (GHG) from the energy
supply sector� The energy supply sector, as defined in this report,
comprises all energy extraction, conversion, storage, transmission, and
distribution processes that deliver final energy to the end-use sectors
(industry, transport, and building, as well as agriculture and forestry).
Demand side measures in the energy end-use sectors are discussed in
chapters 8 – 11.
The energy supply sector is the largest contributor to global
greenhouse gas emissions (robust evidence, high agreement). In
2010, the energy supply sector was responsible for approximately 35 %
of total anthropogenic GHG emissions. Despite the United Nations
Framework Convention on Climate Change (UNFCCC) and the Kyoto
Protocol, GHG emissions grew more rapidly between 2000 and 2010
than in the previous decade. Annual GHG-emissions growth in the global
energy supply sector accelerated from 1.7 % per year from 1990 – 2000
to 3.1 % per year from 2000 – 2010. The main contributors to this trend
were a higher energy demand associated with rapid economic growth
and an increase of the share of coal in the global fuel mix. [7.2, 7.3]
In the baseline scenarios assessed in AR5, direct CO
2
emissions
of the energy supply sector increase from 14�4 GtCO
2
/ yr in
2010 to 24 – 33 GtCO
2
/ yr in 2050 (25 – 75th percentile; full range
15 – 42 GtCO
2
/ yr), with most of the baseline scenarios assessed
in AR5 showing a significant increase (medium evidence, medium
agreement). The lower end of the full range is dominated by scenarios
with a focus on energy intensity improvements that go well beyond
the observed improvements over the past 40 years. The availability of
fossil fuels alone will not be sufficient to limit CO
2
-equivalent (CO
2
eq)
concentrations to levels such as 450 ppm, 550 ppm, or 650 ppm. [6.3.4,
Figures 6.15, 7.4, 7.11.1, Figure TS 15]
Multiple options exist to reduce energy supply sector GHG
emissions (robust evidence, high agreement). These include energy
efficiency improvements and fugitive emission reductions in fuel
extraction as well as in energy conversion, transmission, and distribu-
tion systems; fossil fuel switching; and low-GHG energy supply tech-
nologies such as renewable energy (RE), nuclear power, and carbon
dioxide capture and storage (CCS). [7.5, 7.8.1, 7.11]
The stabilization of GHG concentrations at low levels requires
a fundamental transformation of the energy supply system,
including the long-term substitution of unabated
1
fossil fuel
conversion technologies by low-GHG alternatives (robust evi-
dence, high agreement). Concentrations of CO
2
in the atmosphere
can only be stabilized if global (net) CO
2
emissions peak and decline
1
These are fossil fuel conversion technologies not using carbon dioxide capture and
storage technologies.
toward zero in the long term. Improving the energy efficiencies of fos-
sil power plants and / or the shift from coal to gas will not by itself be
sufficient to achieve this. Low-GHG energy supply technologies are
found to be necessary if this goal is to be achieved. [ 7.5.1, 7.8.1,
7.11]
Decarbonizing (i� e� reducing the carbon intensity of) electric-
ity generation is a key component of cost-effective mitigation
strategies in achieving low-stabilization levels (430 – 530 ppm
CO
2
eq); in most integrated modelling scenarios, decarboniza-
tion happens more rapidly in electricity generation than in the
industry, buildings and transport sectors (medium evidence, high
agreement). In the majority of low-stabilization scenarios, the share
of low-carbon electricity supply (comprising RE, nuclear and CCS)
increases from the current share of approximately 30 % to more than
80 % by 2050, and fossil fuel power generation without CCS is phased
out almost entirely by 2100. [7.11]
Since the Intergovernmental Panel on Climate Change (IPCC)
Fourth Assessment Report (AR4), many RE technologies have
demonstrated substantial performance improvements and cost
reductions, and a growing number of RE technologies have
achieved a level of maturity to enable deployment at signifi-
cant scale (robust evidence, high agreement). Some technologies are
already economically competitive in various settings. While the level-
ized cost of photovoltaic (PV) systems fell most substantially between
2009 and 2012, a less marked trend has been observed for many other
RE technologies. Regarding electricity generation alone, RE accounted
for just over half of the new electricity-generating capacity added glob-
ally in 2012, led by growth in wind, hydro, and solar power. Decentral-
ized RE supply to meet rural energy needs has also increased, including
various modern and advanced traditional biomass options as well as
small hydropower, PV, and wind.
RE technology policies have been successful in driving the recent
growth of RE. Nevertheless many RE technologies still need direct
support (e. g., feed-in tariffs, RE quota obligations, and tendering / bid-
ding) and / or indirect support (e. g., sufficiently high carbon prices and
the internalization of other externalities) if their market shares are to
be significantly increased. Additional enabling policies are needed to
address issues associated with the integration of RE into future energy
systems (medium evidence, medium agreement). [7.5.3, 7.6.1, 7.8.2,
7.12, 11.13]
There are often co-benefits from the use of RE, such as a reduc-
tion of air pollution, local employment opportunities, few
severe accidents compared to some other forms of energy sup-
ply, as well as improved energy access and security (medium
evidence, medium agreement). At the same time, however, some RE
technologies can have technology- and location-specific adverse side-
effects, though those can be reduced to a degree through appropriate
technology selection, operational adjustments, and siting of facilities.
[7.9]

517517
Energy Systems
7
Chapter 7
Infrastructure and integration challenges vary by RE technology
and the characteristics of the existing background energy sys-
tem (medium evidence, medium agreement). Operating experience and
studies of medium to high penetrations of RE indicate that these issues
can be managed with various technical and institutional tools. As RE
penetrations increase, such issues are more challenging, must be care-
fully considered in energy supply planning and operations to ensure
reliable energy supply, and may result in higher costs. [7.6, 7.8.2]
Nuclear energy is a mature low-GHG emission source of base-
load power, but its share of global electricity generation has
been declining (since 1993)� Nuclear energy could make an
increasing contribution to low-carbon energy supply, but a vari-
ety of barriers and risks exist (robust evidence, high agreement).
Its specific emissions are below 100 gCO
2
eq
per kWh on a lifecycle
basis and with more than 400operational nuclear reactors worldwide,
nuclear electricity represented 11 % of the world’s electricity genera-
tion in 2012, down from a high of 17 % in 1993. Pricing the externali-
ties of GHG emissions (carbon pricing) could improve the competitive-
ness of nuclear power plants. [7.2, 7.5.4, 7.8.1, 7.12]
Barriers to and risks associated with an increasing use of nuclear
energy include operational risks and the associated safety con-
cerns, uranium mining risks, financial and regulatory risks, unre-
solved waste management issues, nuclear weapon proliferation
concerns, and adverse public opinion (robust evidence, high agree-
ment). New fuel cycles and reactor technologies addressing some of
these issues are under development and progress has been made con-
cerning safety and waste disposal (medium evidence, medium agree-
ment). [7.5.4, 7.8.2, 7.9, 7.11]
Carbon dioxide capture and storage technologies could reduce
the lifecycle GHG emissions of fossil fuel power plants (medium
evidence, medium agreement). While all components of integrated CCS
systems exist and are in use today by the fossil fuel extraction and
refining industry, CCS has not yet been applied at scale to a large, com-
mercial fossil fuel power plant. A variety of pilot and demonstrations
projects have led to critical advances in the knowledge of CCS sys-
tems and related engineering, technical, economic and policy issues.
CCS power plants could be seen in the market if they are required for
fossil fuel facilities by regulation or if they become competitive with
their unabated counterparts, for instance, if the additional investment
and operational costs, caused in part by efficiency reductions, are com-
pensated by sufficiently high carbon prices (or direct financial sup-
port). Beyond economic incentives, well-defined regulations concern-
ing short- and long-term responsibilities for storage are essential for a
large-scale future deployment of CCS. [7.5.5, 7.8.1]
Barriers to large-scale deployment of CCS technologies include
concerns about the operational safety and long-term integrity
of CO
2
storage as well as transport risks (limited evidence, medium
agreement). There is, however, a growing body of literature on how
to ensure the integrity of CO
2
wells, on the potential consequences of
a pressure buildup within a geologic formation caused by CO
2
stor-
age (such as induced seismicity), and on the potential human health
and environmental impacts from CO
2
that migrates out of the primary
injection zone (limited evidence, medium agreement). [7.5.5, 7.9]
Combining bioenergy with CCS (BECCS) offers the prospect of
energy supply with large-scale net negative emissions, which
plays an important role in many low-stabilization scenarios,
while it entails challenges and risks (limited evidence, medium
agreement). These challenges and risks include those associated with
the upstream provision of the biomass that is used in the CCS facility
as well as those associated with the CCS technology itself. BECCS faces
large challenges in financing and currently no such plants have been
built and tested at scale. [7.5.5, 7.8.2, 7.9, 7.12, 11.13]
GHG emissions from energy supply can be reduced significantly
by replacing current world average coal-fired power plants with
modern, highly efficient natural gas combined-cycle (NGCC)
power plants or combined heat and power (CHP) plants, pro-
vided that natural gas is available and the fugitive emissions
associated with its extraction and supply are low or mitigated
(robust evidence, high agreement). Lifecycle assessments indicate a
reduction of specific GHG emissions of approximately 50 % for a shift
from a current world-average coal power plant to a modern NGCC
plant depending on natural gas upstream emissions. Substitution of
natural gas for renewable energy forms increases emissions. Mitiga-
tion scenarios with low-GHG concentration targets (430 – 530 ppm
CO
2
eq) require a fundamental transformation of the energy system in
the long term. In mitigation scenarios reaching about 450 ppm CO
2
eq
by 2100, natural gas power generation without CCS typically acts as
a bridge technology, with deployment increasing before peaking and
falling to below current levels by 2050 and declining further in the sec-
ond half of the century (robust evidence, high agreement). [7.5.1, 7.8,
7.9, 7.11]
Direct GHG emissions from the fossil fuel chain can be reduced
through various measures (medium evidence, high agreement).
These include the capture or oxidation of coal bed methane, the reduc-
tion of venting and flaring in oil and gas systems, as well as energy
efficiency improvements and the use of low-GHG energy sources in the
fuel chain. [7.5.1]
Greenhouse gas emission trading and GHG taxes have been
enacted to address the market externalities associated with
GHG emissions (high evidence, high agreement). In the longer term,
GHG pricing can support the adoption of low-GHG energy technolo-
gies due to the resulting fuel- and technology-dependent mark up in
marginal costs. Technology policies (e. g., feed-in tariffs, quotas, and
tendering / bidding) have proven successful in increasing the share of
RE technologies (medium evidence, medium agreement). [7.12]
The success of energy policies depends on capacity building, the
removal of financial barriers, the development of a solid legal

518518
Energy Systems
7
Chapter 7
framework, and sufficient regulatory stability (robust evidence,
high agreement). Property rights, contract enforcement, and emissions
accounting are essential for the successful implementation of climate
policies in the energy supply sector. [7.10, 7.12]
The energy infrastructure in developing countries, especially
in Least Developed Countries (LDCs), is still undeveloped and
not diversified (robust evidence, high agreement). There are often
co-benefits associated with the implementation of mitigation energy
technologies at centralized and distributed scales, which include local
employment creation, income generation for poverty alleviation, as
well as building much-needed technical capability and knowledge
transfer. There are also risks in that the distributive impacts of higher
prices for low-carbon energy might become a burden on low-income
households, thereby undermining energy-access programmes, which
can, however, be addressed by policies to support the poor. [7.9, 7.10]
Although significant progress has been made since AR4 in the
development of mitigation options in the energy supply sector,
important knowledge gaps still exist that can be reduced with
further research and development (R&D)� These especially com-
prise the technological challenges, risks, and co-benefits associated
with the upscaling and integration of low-carbon technologies into
future energy systems, and the resulting costs. In addition, research on
the economic efficiency of climate-related energy policies, and espe-
cially concerning their interaction with other policies applied in the
energy sector, is limited. [7.13]
7.1 Introduction
The energy supply sector is the largest contributor to global greenhouse
gas (GHG) emissions. In 2010, approximately 35 % of total anthropo-
genic GHG emissions were attributed to this sector. Despite the United
Nations Framework Convention on Climate Change (UNFCCC) and the
Kyoto Protocol, annual GHG-emissions growth from the global energy
supply sector accelerated from 1.7 % per year in 1990 – 2000 to 3.1 %
in 2000 – 2010 (Section 7.3). Rapid economic growth (with the associ-
ated higher demand for power, heat, and transport services) and an
increase of the share of coal in the global fuel mix were the main con-
tributors to this trend.
The energy supply sector, as defined in this chapter (Figure 7.1), com-
prises all energy extraction, conversion, storage, transmission, and dis-
tribution processes with the exception of those that use final energy
to provide energy services in the end-use sectors (industry, transport,
and building, as well as agriculture and forestry). Concerning energy
statistics data as reported in Sections 7.2 and 7.3, power, heat, or fuels
that are generated on site for own use exclusively are not accounted
for in the assessment of the energy supply sector. Note that many sce-
narios in the literature do not provide a sectoral split of energy-related
emissions; hence, the discussion of transformation pathways in Section
7.11 focuses on aggregated energy-related emissions comprising the
supply and the end-use sectors.
The allocation of cross-cutting issues among other chapters allows for
a better understanding of the Chapter 7 boundaries (see Figure 7.1).
The importance of energy for social and economic development is
reviewed in Chapters 4 and 5 and to a lesser degree in Section 7.9 of
this chapter. Chapter 6 presents long-term transformation pathways
and futures for energy systems.
Transport fuel supply, use in vehicles, modal choice, and the local
infrastructure are discussed in Chapter 8. Building integrated power
and heat generation as well as biomass use for cooking are addressed
in Chapter 9. Responsive load issues are dealt with by chapters 8 – 10.
Chapter 7 considers mitigation options in energy-extraction indus-
tries (oil, gas, coal, uranium, etc.), while other extractive industries
are addressed in Chapter 10. Together with aspects related to bioen-
ergy usage, provision of biomass is discussed in Chapter 11, which
covers land uses including agriculture and forestry. Only energy sup-
ply sector-related policies are covered in Chapter 7 while the broader
and more-detailed climate policy picture is presented in Chapters
13 – 15.
The derivation of least-cost mitigation strategies must take into
account the interdependencies between energy demand and supply.
Due to the selected division of labor described above, Chapter7 does
not discuss demand-side measures from a technological point of view.
Tradeoffs between demand- and supply-side options, however, are
considered by the integrated models (IAM) that delivered the trans-
formation pathways collected in the WGIII AR5 Scenario Database (see
Annex II.10 and, concerning energy supply aspects, Section 7.11).
Chapter 7 assesses the literature evolution of energy systems from
earlier Intergovernmental Panel on Climate Change (IPCC) reports,
comprising the Special Report on Carbon Dioxide Capture and Stor-
age (IPCC, 2005), the Fourth Assessment Report (AR4) (IPCC, 2007),
and the Special Report on Renewable Energy Sources and Climate
Change Mitigation (SRREN) (IPCC, 2011a). Section 7.2 describes the
current status of global and regional energy markets. Energy-related
GHG-emissions trends together with associated drivers are presented
in Section 7.3. The next section provides data on energy resources.
Section 7.5 discusses advances in the field of mitigation technologies.
Issues related to the integration of low-carbon technologies are cov-
ered in Section 7.6, while Section 7.7 describes how climate change
may impact energy demand and supply. Section 7.8 discusses emis-
sion-reduction potentials and related costs. Section 7.9 covers issues
of co-benefits and adverse side effects of mitigation options. Mitiga-
tion barriers are dealt with in Section 7.10. The implications of various
transformation pathways for the energy sector are covered in Section
7.11. Section 7.12 presents energy supply sector-specific policies. Sec-
tion 7.13 addresses knowledge gaps and Section7.14 summarizes fre-
quently asked questions (FAQ).
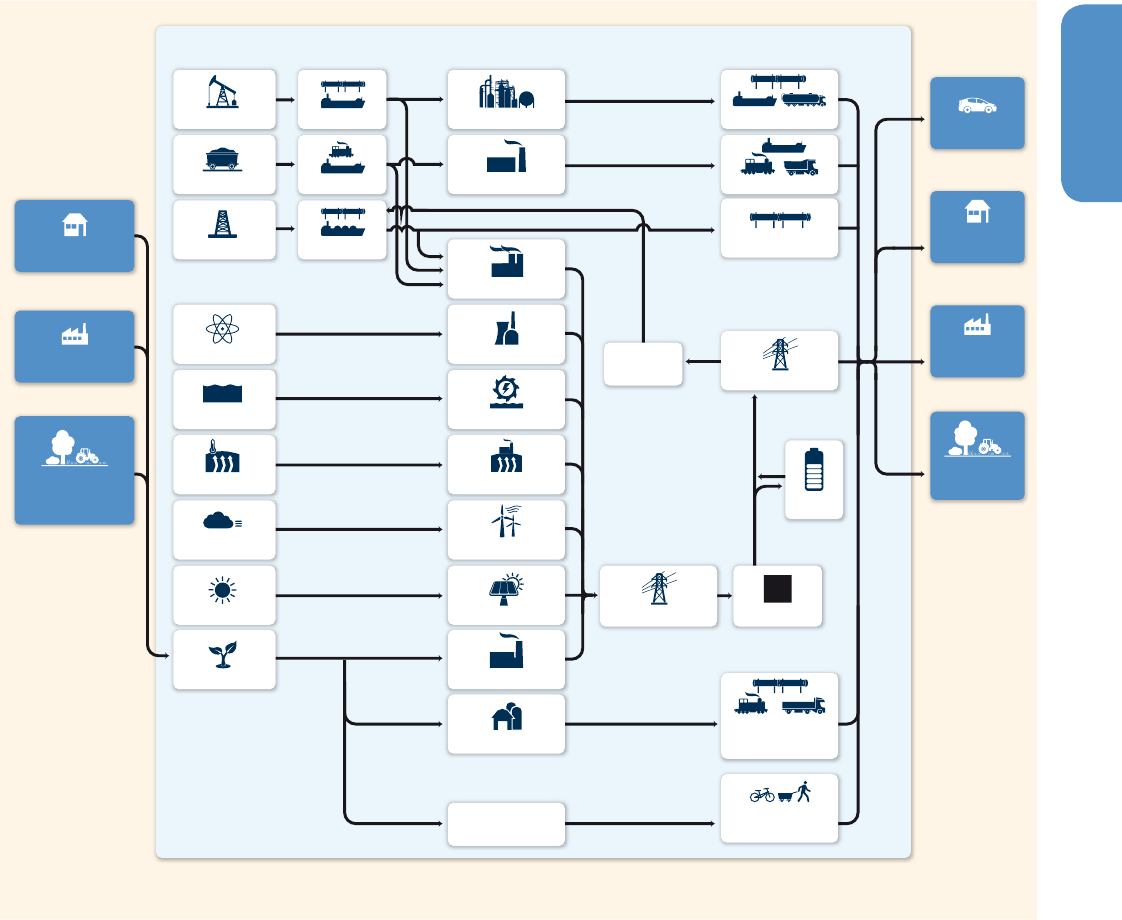
Figure 7�1 | Illustrative energy supply paths shown in order to illustrate the boundaries of the energy supply sector as defined in this report. The self-generation of heat and power
in the end-use sectors (i. e., transport, buildings, industry, and Agriculture, Forestry, and Other Land Use (AFOLU)) is discussed in Chapters 8 – 11.
Chapter 8
Transport
Chapter 10
Industry
Chapter 11
AFOLU
Chapter 9
Building
Primary Energy
Bioenergy
Wind Energy
Geothermal Energy
Hydro Power
Nuclear Energy
Natural Gas
Coal
Crude Oil
Transport
Gas Transport
Coal Transport
Oil Transport
Chapter 11 AFOLU
(Energy Plants and
Residues)
Chapter 10 Industry
(Waste)
Chapter 9 Building
(Waste)
Final Energy/Demand
for Energy Services
Gas Transport
Electric Power Grid
Transport of Traditional
Biomass
Unprocessed Usage
of Traditional Biomass
Power to
Gas
Bioenergy (Biogas, Biofuel,
Biomass)Transport
Storages
Coal Transport
Oil Transport
TransportSecondary Energy
Bioenergy Power Station
Bioenergy Conversion
Solar Power Plant
Wind Energy Conversion
Geothermal Power Plant
Hydro Power Plant
Nuclear Power Plant
Electric Power Station
Cokery
Refinery
Conversion
Solar Energy
Chapter 7 on Energy Systems
Electric Power Grid Transformer
519519
Energy Systems
7
Chapter 7
7.2 Energy production,
conversion, transmission
and distribution
The energy supply sector converts over 75 % of total primary energy
supply (TPES) into other forms, namely, electricity, heat, refined oil
products, coke, enriched coal, and natural gas. Industry (including
non-energy use) consumes 84 % of final use of coal and peat, 26 % of
petroleum products, 47 % of natural gas, 40 % of electricity, and 43 %
of heat. Transportation consumes 62 % of liquid fuels final use. The
building sector is responsible for 46 % of final natural gas consump-
tion, 76 % of combustible renewables and waste, 52 % of electricity
use, and 51 % of heat (Table 7.1). Forces driving final energy-consump-
tion evolution in all these sectors (Chapters 8 – 11) have a significant
impact on the evolution of energy supply systems, both in scale and
structure.
The energy supply sector is itself the largest energy user. Energy losses
assessed as the difference between the energy inputs to (78 % of
the TPES) and outputs from this sector (48.7 % of TPES) account for
29.3 % of TPES (Table 7.1). The TPES is not only a function of end users’
demand for higher-quality energy carriers, but also the relatively low
average global efficiency of energy conversion, transmission, and
distribution processes (only 37 % efficiency for fossil fuel power and
just 83 % for fossil fuel district heat generation). However, low effi-
ciencies and large own energy use of the energy sector result in high
emissions; hence, the discussion of transformation pathways in Section
7.11 focuses on aggregated energy-related emissions comprising the
supply and the end-use sectors.
The allocation of cross-cutting issues among other chapters allows for
a better understanding of the Chapter 7 boundaries (see Figure 7.1).
The importance of energy for social and economic development is
reviewed in Chapters 4 and 5 and to a lesser degree in Section 7.9 of
this chapter. Chapter 6 presents long-term transformation pathways
and futures for energy systems.
Transport fuel supply, use in vehicles, modal choice, and the local
infrastructure are discussed in Chapter 8. Building integrated power
and heat generation as well as biomass use for cooking are addressed
in Chapter 9. Responsive load issues are dealt with by chapters 8 – 10.
Chapter 7 considers mitigation options in energy-extraction indus-
tries (oil, gas, coal, uranium, etc.), while other extractive industries
are addressed in Chapter 10. Together with aspects related to bioen-
ergy usage, provision of biomass is discussed in Chapter 11, which
covers land uses including agriculture and forestry. Only energy sup-
ply sector-related policies are covered in Chapter 7 while the broader
and more-detailed climate policy picture is presented in Chapters
13 – 15.
The derivation of least-cost mitigation strategies must take into
account the interdependencies between energy demand and supply.
Due to the selected division of labor described above, Chapter7 does
not discuss demand-side measures from a technological point of view.
Tradeoffs between demand- and supply-side options, however, are
considered by the integrated models (IAM) that delivered the trans-
formation pathways collected in the WGIII AR5 Scenario Database (see
Annex II.10 and, concerning energy supply aspects, Section 7.11).
Chapter 7 assesses the literature evolution of energy systems from
earlier Intergovernmental Panel on Climate Change (IPCC) reports,
comprising the Special Report on Carbon Dioxide Capture and Stor-
age (IPCC, 2005), the Fourth Assessment Report (AR4) (IPCC, 2007),
and the Special Report on Renewable Energy Sources and Climate
Change Mitigation (SRREN) (IPCC, 2011a). Section 7.2 describes the
current status of global and regional energy markets. Energy-related
GHG-emissions trends together with associated drivers are presented
in Section 7.3. The next section provides data on energy resources.
Section 7.5 discusses advances in the field of mitigation technologies.
Issues related to the integration of low-carbon technologies are cov-
ered in Section 7.6, while Section 7.7 describes how climate change
may impact energy demand and supply. Section 7.8 discusses emis-
sion-reduction potentials and related costs. Section 7.9 covers issues
of co-benefits and adverse side effects of mitigation options. Mitiga-
tion barriers are dealt with in Section 7.10. The implications of various
transformation pathways for the energy sector are covered in Section
7.11. Section 7.12 presents energy supply sector-specific policies. Sec-
tion 7.13 addresses knowledge gaps and Section7.14 summarizes fre-
quently asked questions (FAQ).
Figure 7�1 | Illustrative energy supply paths shown in order to illustrate the boundaries of the energy supply sector as defined in this report. The self-generation of heat and power
in the end-use sectors (i. e., transport, buildings, industry, and Agriculture, Forestry, and Other Land Use (AFOLU)) is discussed in Chapters 8 – 11.
Chapter 8
Transport
Chapter 10
Industry
Chapter 11
AFOLU
Chapter 9
Building
Primary Energy
Bioenergy
Wind Energy
Geothermal Energy
Hydro Power
Nuclear Energy
Natural Gas
Coal
Crude Oil
Transport
Gas Transport
Coal Transport
Oil Transport
Chapter 11 AFOLU
(Energy Plants and
Residues)
Chapter 10 Industry
(Waste)
Chapter 9 Building
(Waste)
Final Energy/Demand
for Energy Services
Gas Transport
Electric Power Grid
Transport of Traditional
Biomass
Unprocessed Usage
of Traditional Biomass
Power to
Gas
Bioenergy (Biogas, Biofuel,
Biomass)Transport
Storages
Coal Transport
Oil Transport
TransportSecondary Energy
Bioenergy Power Station
Bioenergy Conversion
Solar Power Plant
Wind Energy Conversion
Geothermal Power Plant
Hydro Power Plant
Nuclear Power Plant
Electric Power Station
Cokery
Refinery
Conversion
Solar Energy
Chapter 7 on Energy Systems
Electric Power Grid Transformer

520520
Energy Systems
7
Chapter 7
Table 7�1 | 2010 World Energy Balance (EJ on a net calorific value basis applying the direct equivalent method).
Source: See IEA (2012a) for data, methodology, and definitions. International Energy Agency (IEA) data were modified to convert to primary energy by applying the direct equivalent method (see Annex II.4). Negative numbers in energy
sector reflect energy spent or lost, while positive ones indicate that specific forms of energy were generated.
Supply and consumption
Coal and
peat
Crude oil
Oil
products
Gas Nuclear Hydro
Geo-
thermal�
Solar,
etc�
Com-
bustible
renew-
ables and
waste
Electricity Heat Total*
Share in
TPES (%)
Share in
FEC (%)
Conversion
efficiency* and
losses (%)
Production 150�56 170�38 0�00 113�84 9�95 12�38 2�91 53�47 0 0�04 513�52 101.20 %
Imports 26.83 96.09 44.12 34.21 0.45 2.12 0.00 203.81 39.92 %
Exports – 28.52 – 92.59 – 46.55 – 34.60 – 0.39 – 2.08 0.00 – 204.73 – 40.10 %
Stock Changes – 3.34 0.27 0.26 0.75 – 0.02 – 2.09 – 0.41 %
Total Primary Energy Supply (TPES) 145�52 174�14 – 2�17 114�20 9�95 12�38 2�91 53�51 0�04 0�04 510�52 100.00 %
Share in total TPES (%) 28.51 % 34.11 % – 0.43 % 22.37 % 1.95 % 2.42 % 0.57 % 10.48 % 0.01 % 100.00 %
Transfers 0.00 – 6.56 7.51 0.00 0.95 – 0.19 %
Statistical Differences – 2.07 0.47 – 1.13 – 0.07 – 0.01 – 0.02 0.28 0.00 – 2.55 0.50 %
Electricity Plants – 82.68 – 1.45 – 8.44 – 29.54 – 9.89 – 12.38 – 1.61 – 2.65 65.37 – 0.01 – 83.28 16.31 % 37.13 %
Combined Heat and Power Plants – 6.75 – 0.94 – 12.76 – 0.06 0 – 0.02 – 1.47 6.85 5.86 – 9.31 1.82 % 57.72 %
Electricity generation (TWh) 8698 28 961 4768 2756 3437 450 332 2 21431
Share in electricity generation (%) 40.58 % 0.13 % 4.49 % 22.25 % 12.86 % 16.04 % 2.10 % 1.55 % 0.01 % 100.00 %
Heat Plants – 4.34 – 0.03 – 0.54 – 3.77 – 0.34 – 0.44 – 0.01 7.05 – 2.42 0.47 % 83.28 %
Gas Works – 0.37 – 0.15 0.12 – 0.40 0.08 % 22.79 %
Oil Refineries – 164.70 162.86 – 0.03 – 1.87 0.37 % 98.86 %
Coal Transformation – 9.19 0.00 – 0.13 0.00 0.00 – 9.33 1.83 %
Liquefaction Plants – 0.68 0.33 0.00 – 0.30 – 0.65 0.13 % 33.69 %
Other Transformation 0.00 0.01 – 0.01 – 0.09 – 2.22 – 0.01 – 2.33 0.30 %
Energy Industry Own Use – 3.61 – 0.42 – 8.81 – 11.53 – 0.01 – 0.56 – 6.10 – 1.43 – 32.46 6.36 % 6.36 %
Losses – 0.11 – 0.34 – 0.02 – 1.03 – 0.01 – 0.01 – 6.08 – 0.89 – 8.49 1.66 % 1.66 %
Total energy sector – 107�73 – 173�18 151�33 – 58�94 – 9�95 – 12�38 – 1�98 – 7�35 60�02 10�56 – 149�60 29.30 %
Share of energy sector in TPES by fuels (%) 74.03 % 99.45 % 7.08 % 51.61 % 100.00 % 100.00 % 68.00 % 13.74 % 8.17 % 18.21 % – 29.30 %
Total Final Consumption (TFC) 35�72 1�44 148�02 55�19 0�00 0�00 0�92 46�14 60�35 10�60 358�37 70.20 % 100.0 %
Share of energy carriers in TFC (%) 9.97 % 0.40 % 41.30 % 15.40 % 0.00 % 0.00 % 0.26 % 12.87 % 16.84 % 2.96 % 100.00 %
Industry 28.38 0.52 12.98 19.42 0.02 8.20 24.26 4.61 98.39 19.27 % 27.46 %
Transport 0.14 0.00 91.94 3.73 2.41
0.97 0.00 99.20 19.43 % 27.68 %
Buildings 4.25 0.03 13.13 25.15 0.48 35.10 31.46 5.37 114.96 22.52 % 32.08 %
Agriculture / forestry / fishing 0.46 0.00 4.51 0.25 0.03 0.31 1.58 0.14 7.29 1.43 % 2.03 %
Non-Specified 0.98 0.25 0.60 0.26 0.39 0.11 2.07 0.49 5.15 1.01 % 1.44 %
Non-Energy Use 1.51 0.63 24.87 6.38 33.38 6.54 % 9.32 %
*Only for fossil fuel-powered generation. Totals may not add up due to rounding.
521521
Energy Systems
7
Chapter 7
indirect multiplication effects of energy savings from end users. One
argument (Bashmakov, 2009) is that in estimating indirect energy
efficiency effects, transformation should be done not only for electric-
ity, for which it is regularly performed, but also for district heating as
well as for any activity in the energy supply sector, and even for fuels
transportation. Based on this argument, global energy savings multi-
plication factors are much higher if assessed comprehensively and are
equal to 1.07 for coal and petroleum products, 4.7 for electricity, and
2.7 for heat.
Between 2000 – 2010, TPES grew by 27 % globally (2.4 % per annum),
while for the regions it was 79 % in Asia, 47 % in Middle East and
Africa (MAF), 32 % in Latin America (LAM), 13 % in Economies
in Transition (EIT), and it was nearly stable for the countries of the
Organisation for Economic Co-operation and Development 1990
(OECD90)
2
(IEA, 2012a). After 2010, global TPES grew slower (close
to 2 % per annum over 2010 – 2012) with Asia, MAF, and LAM show-
2
For regional aggregation, see Annex II.2
ing nearly half their 2000 – 2010 average annual growth rates and
declining energy use in EIT and OECD90 (BP, 2013; Enerdata, 2013).
Thus all additional energy demand after 2000 was generated out-
side of the OECD90 (Figure 7.2). The dynamics of the energy mar-
kets evolution in Asia differs considerably from the other markets.
This region accounted for close to 70 % of the global TPES increment
in 2000 – 2010 (over 90 % in 2010 – 2012), for all additional coal
demand, about 70 % of additional oil demand, over 70 % of addi-
tional hydro, and 25 % of additional wind generation (IEA, 2012a; BP,
2013; Enerdata, 2013). Between 2000 – 2010, China alone more than
doubled its TPES and contributed to over half of the global TPES incre-
ment, making it now the leading energy-consuming nation.
Led by Asia, global coal consumption grew in 2000 – 2010 by over 4 %
per annum and a slightly slower rate in 2010 – 2012. Coal contributed
44 % of the growth in energy use and this growth alone matched the
total increase in global TPES for 1990 – 2000 (Figure 7.2). Power gener-
ation remains the main global coal renaissance driver (US DOE, 2012).
China is the leading coal producer (47 % of world 2012 production),
followed by the United States, Australia, Indonesia, and India (BP,
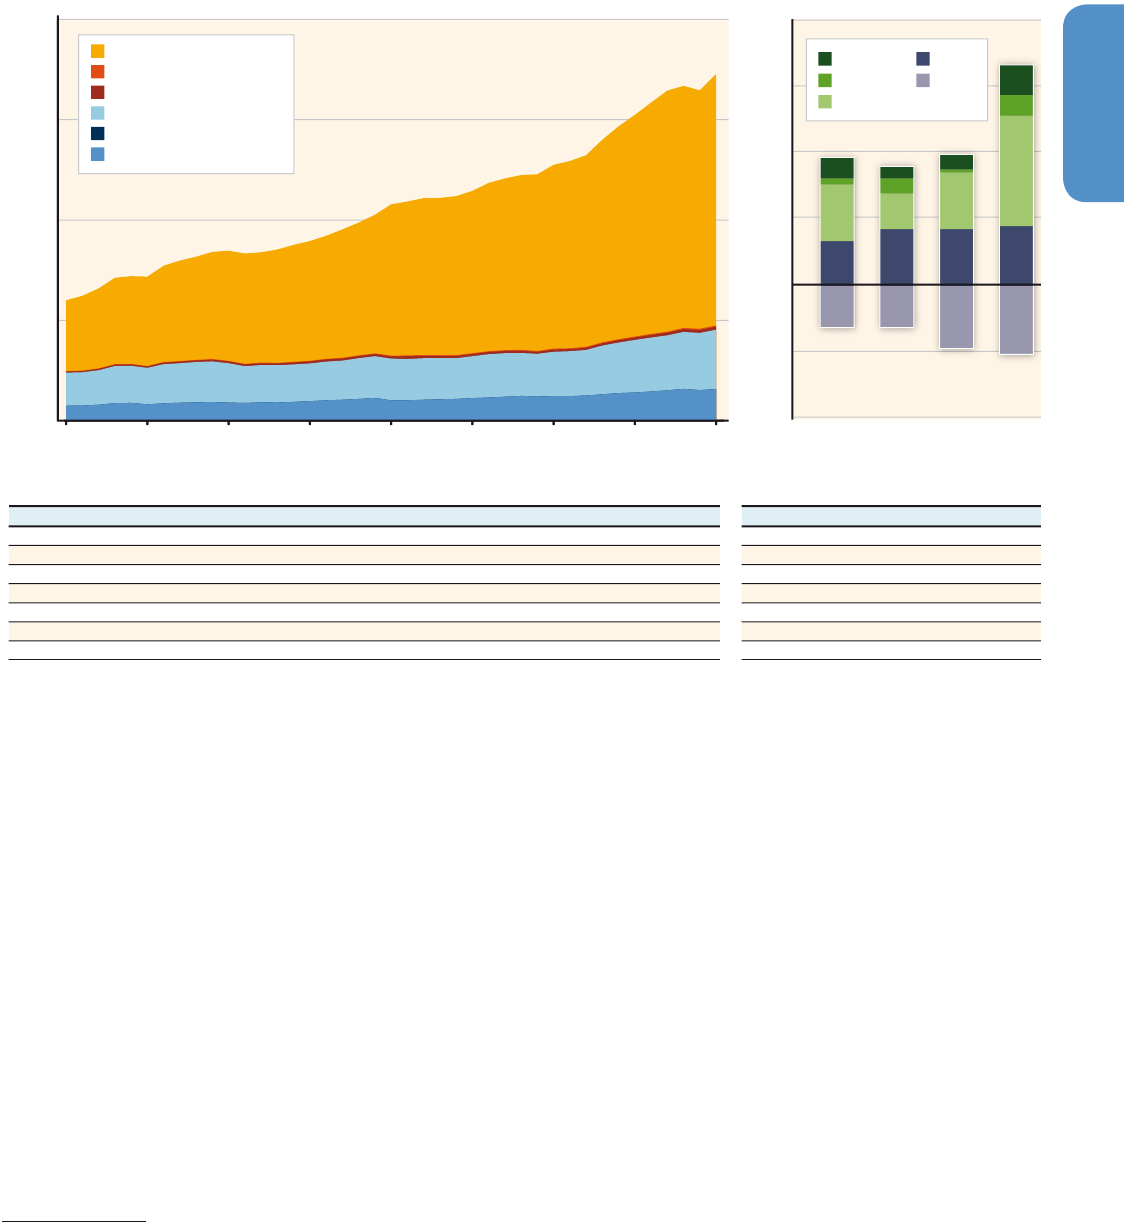
Figure 7�2 | Contribution of energy sources to global and regional primary energy use increments. Notes: Modern biomass contributes 40 % of the total biomass share. Underlying
data from IEA (2012a) for this figure have been converted using the direct equivalent method of accounting for primary energy (see Annex.II.4). Legend: OECD-1990 (OECD-1990),
Asia (ASIA), Economies in Transition (EIT), Middle East and Africa (MAF), and Latin America (LAM),total primary energy supply (TPES).
Solar, Wind, etc.
World Marine and Aviation Bunkers
Hydro
Nuclear
Geothermal
Combustible Renewables and Waste
Natural Gas
Oil
Coal and Peat
TPES
Contribution to Global TPES Growth (%)
48%
0%
-48%
5%
11%
7%
23%
16%
59%
69%
100%
100%
OECD-1990 Countries Economies in Transition Latin America Africa and Middle East Asia World
0
-50
-40
-30
-20
-10
10
20
30
40
50
60
70
80
90
100
110
120
140
130
Increments of TPES [EJ]
-40
-30
-20
-10
0
10
20
30
40
50
60
70
80
90
100
110
120
1990-2000 2000-2010 1990-2000 2000-2010 1990-2000 2000-2010 1990-2000 2000-2010 1990-2000 2000-2010 1990-2000 2000-2010
Contribution to Global TPES Growth [%]

522522
Energy Systems
7
Chapter 7
2013). Competitive power markets flexible to gas and coal price
spreads are creating stronger links between gas and coal markets driv-
ing recent coal use down in the USA, but up in EU (IEA, 2012b).
Although use of liquid fuels has grown in non-OECD countries (mostly
in Asia and the MAF), falling demand in the OECD90 has seen oil’s
share of global energy supply continue to fall in 2000 – 2012. Meet-
ing demand has required mobilization of both conventional and
unconventional liquid supplies. Relatively low transportation costs
have given rise to a truly global oil market with 55 % of crude con-
sumption and 28 % of petroleum products being derived from cross-
border trade (Table 7.1). The Organization of the Petroleum Export-
ing Countries (OPEC) in 2012 provided 43 % of the world’s total oil
supply keeping its share above its 1980 level; 33 % came from the
Middle East (BP, 2013). The most significant non-OPEC contributors
to production growth since 2000 were Russia, Canada, United States,
Kazakhstan, Brazil, and China (GEA, 2012; IEA, 2012b; US DOE, 2012;
BP, 2013). Growing reliance on oil imports raises concerns of Asia and
other non-OECD regions about oil prices and supply security (IEA,
2012b).
In the global gas balance, the share of unconventional gas produc-
tion (shale gas, tight gas, coal-bed methane, and biogas) grew to 16 %
in 2011 (IEA, 2012c). The shale gas revolution put the United States
(where the share of unconventional gas more than doubled since
2000, and reached 67 % in 2011) on top of the list of major contrib-
utors to additional (since 2000) gas supply, followed by Qatar, Iran,
China, Norway, and Russia (BP, 2013; US DOE, 2013a). Although the
2000 – 2010 natural gas consumption increments are more widely dis-
tributed among the regions than for oil and coal, gas increments in
Asia and the MAF dominate. The low energy density of gas means that
transmission and storage make up a large fraction of the total supply
chain costs, thus limiting market development. Escalation of Liquefied
Natural Gas (LNG) markets to 32 % of international gas trade in 2012
(BP, 2013) has, however, created greater flexibility and opened the way
to global trade in gas (MIT, 2011). Growth in United States natural gas
production and associated domestic gas prices decline have resulted in
the switching of LNG supplies to markets with higher prices in South
America, Europe, and Asia (IEA, 2012b). Nevertheless, natural gas sup-
ply by pipelines still delivers the largest gas volumes in North America
and in Europe (US DOE, 2012; BP, 2013).
Renewables contributed 13.5 % of global TPES in 2010 (Table 7.1). The
share of renewables in global electricity generation approached 21 %
in 2012 (BP, 2013; Enerdata, 2013), making them the third-largest con-
tributor to global electricity production, just behind coal and gas, with
large chances to become the second-largest contributor well before
2020. Greatest growth during 2005 – 2012 occurred in wind and solar
with generation from wind increasing 5-fold, and from solar photovol-
taic, which grew 25-fold. By 2012, wind power accounted for over 2 %
of world electricity production (gaining 0.3 % share each year since
2008). Additional energy use from solar and wind energy was driven
mostly by two regions, OECD90 and Asia, with a small contribution
from the rest of the world (IEA, 2012d). In 2012, hydroelectricity sup-
plied 16.3 % of world electricity (BP, 2013).
New post-2000 trends were registered for nuclear’s role in global
energy systems. In recent years, the share of nuclear energy in world
power generation has declined. Nuclear electricity represented 11 % of
the world’s electricity generation in 2012, down from a high of 17 %
in 1993; its contribution to global TPES is declining since 2002 (IEA,
2012b; BP, 2013). Those trends were formed well before the incident at
the Fukushima nuclear plants in March 2011 and following revision of
policies towards nuclear power by several governments (IEA, 2012e).
Growing nuclear contribution to TPES after 2000 was observed only in
EIT and Asia (mostly in Russia and China).
Additional information on regional total and per-capita energy con-
sumption and emissions, historic emissions trends and drivers, and
embedded (consumption-based) emissions is reported in Chapter5.
7.3 New developments
in emission trends
and drivers
In 2010, the energy supply sector accounts for 49 % of all energy-
related GHG emissions
3
(JRC / PBL, 2013) and 35 % of anthropogenic
GHG emissions, up 13 % from 22 % in 1970, making it the largest sec-
toral contributor to global emissions. According to the Historic Emis-
sion Database, Emissions Database for Global Atmospheric Research
(EDGAR) / International Energy Agency (IEA) dataset, 2000 – 2010 global
energy supply sector GHG emissions increased by 35.7 % and grew on
average nearly 1 % per year faster than global anthropogenic GHG
emissions. Despite the UNFCCC and the Kyoto Protocol, GHG emissions
grew more rapidly between 2000 and 2010 than in the previous
decade. Growth in the energy supply sector GHG emissions accelerated
from 1.7 % per year from 1990 – 2000 to 3.1 % per year from
2000 – 2010 (Figure 7.3). In 2012, the sector emitted 6 % more than in
2010 (BP, 2013), or over 18 GtCO
2
eq. In 2010, 43 % of CO
2
emissions
from fuel combustion were produced from coal, 36 % from oil, and
20 % from gas (IEA, 2012f).
Emissions from electricity and heat generation contributed 75 % of the
last decade increment followed by 16 % for fuel production and trans-
mission and 8 % for petroleum refining. Although sector emissions
were predominantly CO
2
, also emitted were methane (of which 31 %
is attributed to mainly coal and gas production and transmission), and
3
The remaining energy-related emissions occur in the consumer sectors (see
Figure7.1). The IEA reports energy sector share at 46 % (IEA, 2012f).
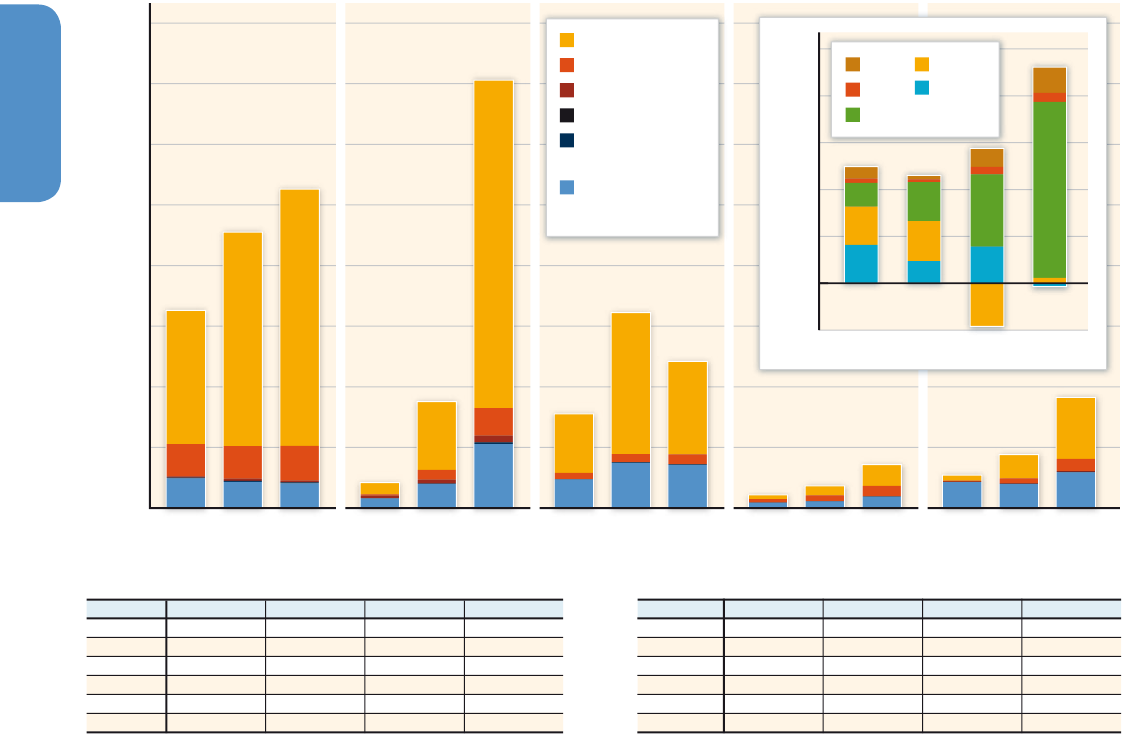
Figure 7�3 | Energy supply sector GHG emissions by subsectors. Table shows average annual growth rates of emissions over decades and the shares (related to absolute emissions)
of different emission sources. Right-hand graph displays contribution of different drivers (POP = population, GDP = gross domestic product, FEC = final energy consumption, TPES
= total primary energy supply) to energy supply sector GHG (GHGs) decadal emissions increments. It is based on (IEA, 2012a). The large graph and table are based on the Historic
Emission Database EDGAR / IEA dataset (IEA, 2012g; JRC / PBL, 2013).
70s 80s 90s 00s 1990 20101970
Electricity & Heat
Petroleum Refining
Manufacture of Solid Fuels
Fuel Production and Transmission
Others
N
2
O Emissions from Energy
Total Energy Sector
Average Annual Growth Rates Shares (%)
20102005199519851975 2000199019801970
GHG Emissions [GtCO
2
eq/yr]
1970-
1980
1980-
1990
1990-
2000
2000-
2010
4.51%
2.09%
4.26%
1.78%
3.77%
4.74%
3.53%
3.22%
1.11%
8.26%
0.59%
2.00%
2.19%
2.43%
1.96%
1.88%
1.16%
0.60%
-0.48%
2.17%
1.68%
3.19%
2.58%
5.05%
2.94%
3.72%
2.66%
3.10%
58.9
12.3
0.0
27.5
1.1
0.3
100.0
69.9
9.4
0.0
19.3
1.0
0.3
100.0
72.6
9.1
0.0
17.1
0.9
0.3
100.0
Change in GHG Emissions [GtCO
2
eq/yr]
0
5
10
15
20
-4
-2
0
2
4
6
8
Electricity and Heat
N
2
O Emissions from Energy
Others
Fuel Production and Transmission
Manufacture of Solid Fuels
Petroleum Refining
GHGs/TPES
TPES/FEC
GDP/POP
POP
FEC/GDP
523523
Energy Systems
7
Chapter 7
indirect nitrous oxide (of which 9 % comes from coal and fuel-wood
combustion) (IEA, 2012f).
4
Decomposition analysis (Figure 7.3), shows that population growth
contributed 39.7 % of additional sector emissions in 2000 – 2010,
with Gross Domestic Product (GDP) per capita 72.4 %. Over the same
period, energy intensity decline (final energy consumption (FEC) per
unit of GDP) reduced the emissions increment by 45.4 %. Since elec-
tricity production grew by 1 % per year faster than TPES, the ratio of
TPES / FEC increased contributing 13.1 % of the additional emissions.
Sector carbon intensity relative to TPES was responsible for 20.2 % of
additional energy supply sector GHG emissions.
4
As in the case with energy, there is some disagreement on the historical level
of global energy- related GHG emissions (See Andres et al., 2012). Moreover,
emission data provided by IEA or EDGAR often do not match data from national
communications to UNFCCC. For example, Bashmakov and Myshak (2012) argue
that EDGAR does not provide adequate data for Russian GHG emissions: accord-
ing to national communication, energy-related CO
2
emissions in 1990 – 2010 are
37 % down while EDGAR reports only a 28 % decline.
In addition to the stronger TPES growth, the last decade was marked
by a lack of progress in the decarbonization of the global fuel mix.
With 3.1 % annual growth in energy supply sector emissions, the
decade with the strongest-ever mitigation policies was the one with
the strongest emissions growth in the last 30 years.
Carbon intensity decline was fastest in OECD90 followed closely by
EIT in 1990 – 2000, and by LAM in 2000 – 2010 (IEA, 2012a; US DOE,
2012); most developing countries show little or no decarbonization.
Energy decarbonization progress in OECD90 (– 0.4 % per annum in
2000 – 2010) was smaller than the three previous decades, but enough
to compensate their small TPES increment keeping 2010 emissions
below 2000 levels. In non-OECD90 countries, energy-related emissions
increased on average from 1.7 % per year in 1990 – 2000 to 5.0 % in
2000 – 2010 due to TPES growth accompanied by a 0.6 % per annum
growth in energy carbon intensity, driven largely by coal demand in
Asia (IEA, 2012b). As a result, in 2010 non-OECD90 countries’ energy
supply sector GHG emissions were 2.3fold that for OECD90 countries.
In 1990, OECD90 was the world’s highest emitter of energy supply sec-
tor GHGs (42 % of the global total), followed by the EIT region (30 %).
from the rest of the world (IEA, 2012d). In 2012, hydroelectricity sup-
plied 16.3 % of world electricity (BP, 2013).
New post-2000 trends were registered for nuclear’s role in global
energy systems. In recent years, the share of nuclear energy in world
power generation has declined. Nuclear electricity represented 11 % of
the world’s electricity generation in 2012, down from a high of 17 %
in 1993; its contribution to global TPES is declining since 2002 (IEA,
2012b; BP, 2013). Those trends were formed well before the incident at
the Fukushima nuclear plants in March 2011 and following revision of
policies towards nuclear power by several governments (IEA, 2012e).
Growing nuclear contribution to TPES after 2000 was observed only in
EIT and Asia (mostly in Russia and China).
Additional information on regional total and per-capita energy con-
sumption and emissions, historic emissions trends and drivers, and
embedded (consumption-based) emissions is reported in Chapter5.
7.3 New developments
in emission trends
and drivers
In 2010, the energy supply sector accounts for 49 % of all energy-
related GHG emissions
3
(JRC / PBL, 2013) and 35 % of anthropogenic
GHG emissions, up 13 % from 22 % in 1970, making it the largest sec-
toral contributor to global emissions. According to the Historic Emis-
sion Database, Emissions Database for Global Atmospheric Research
(EDGAR) / International Energy Agency (IEA) dataset, 2000 – 2010 global
energy supply sector GHG emissions increased by 35.7 % and grew on
average nearly 1 % per year faster than global anthropogenic GHG
emissions. Despite the UNFCCC and the Kyoto Protocol, GHG emissions
grew more rapidly between 2000 and 2010 than in the previous
decade. Growth in the energy supply sector GHG emissions accelerated
from 1.7 % per year from 1990 – 2000 to 3.1 % per year from
2000 – 2010 (Figure 7.3). In 2012, the sector emitted 6 % more than in
2010 (BP, 2013), or over 18 GtCO
2
eq. In 2010, 43 % of CO
2
emissions
from fuel combustion were produced from coal, 36 % from oil, and
20 % from gas (IEA, 2012f).
Emissions from electricity and heat generation contributed 75 % of the
last decade increment followed by 16 % for fuel production and trans-
mission and 8 % for petroleum refining. Although sector emissions
were predominantly CO
2
, also emitted were methane (of which 31 %
is attributed to mainly coal and gas production and transmission), and
3
The remaining energy-related emissions occur in the consumer sectors (see
Figure7.1). The IEA reports energy sector share at 46 % (IEA, 2012f).
Figure 7�3 | Energy supply sector GHG emissions by subsectors. Table shows average annual growth rates of emissions over decades and the shares (related to absolute emissions)
of different emission sources. Right-hand graph displays contribution of different drivers (POP = population, GDP = gross domestic product, FEC = final energy consumption, TPES
= total primary energy supply) to energy supply sector GHG (GHGs) decadal emissions increments. It is based on (IEA, 2012a). The large graph and table are based on the Historic
Emission Database EDGAR / IEA dataset (IEA, 2012g; JRC / PBL, 2013).
70s 80s 90s 00s 1990 20101970
Electricity & Heat
Petroleum Refining
Manufacture of Solid Fuels
Fuel Production and Transmission
Others
N
2
O Emissions from Energy
Total Energy Sector
Average Annual Growth Rates Shares (%)
20102005199519851975 2000199019801970
GHG Emissions [GtCO
2
eq/yr]
1970-
1980
1980-
1990
1990-
2000
2000-
2010
4.51%
2.09%
4.26%
1.78%
3.77%
4.74%
3.53%
3.22%
1.11%
8.26%
0.59%
2.00%
2.19%
2.43%
1.96%
1.88%
1.16%
0.60%
-0.48%
2.17%
1.68%
3.19%
2.58%
5.05%
2.94%
3.72%
2.66%
3.10%
58.9
12.3
0.0
27.5
1.1
0.3
100.0
69.9
9.4
0.0
19.3
1.0
0.3
100.0
72.6
9.1
0.0
17.1
0.9
0.3
100.0
Change in GHG Emissions [GtCO
2
eq/yr]
0
5
10
15
20
-4
-2
0
2
4
6
8
Electricity and Heat
N
2
O Emissions from Energy
Others
Fuel Production and Transmission
Manufacture of Solid Fuels
Petroleum Refining
GHGs/TPES
TPES/FEC
GDP/POP
POP
FEC/GDP
524524
Energy Systems
7
Chapter 7
By 2010, Asia had become the major emitter with 41 % share. China’s
emissions surpassed those of the United States, and India’s surpassed
Russia’s (IEA, 2012f). Asia accounted for 79 % of additional energy
supply sector emissions in 1990 – 2000 and 83 % in 2000 – 2010, fol-
lowed well behind by the MAF and LAM regions (Figure 7.4). The rapid
increase in energy supply sector GHG emissions in developing Asia was
due to the region’s economic growth and increased use of fossil fuels.
The per-capita energy supply sector GHGs emissions in developing
countries are below the global average, but the gap is shrinking, espe-
cially for Asia (Figure 7.4). The per-capita energy supply sector CO
2
emissions of Asia (excluding China) in 2010 was only 0.75 tCO
2
,
against the world average of 2.06tCO
2
, while the 2010 Chinese energy
supply sector CO
2
emissions per capita of 2.86 tCO
2
exceeded the
2.83tCO
2
of OECD-Europe (IEA, 2012f).
Another region with large income-driven energy supply sector GHG
emissions in 2000 – 2010 was EIT, although neutralized by improve-
ments in energy intensity there. This region was the only one that man-
aged to decouple economic growth from energy supply sector emis-
sions; its GDP in 2010 being 10 % above the 1990 level, while energy
supply sector GHG emissions declined by 29 % over the same period.
Additional information on regional total and per-capita emissions, his-
toric emissions trends and drivers and embedded (consumption based)
emissions is reported in Chapter 5.
7.4 Resources and resource
availability
7�4�1 Fossil fuels
Table 7.2 provides a summary of fossil fuel resource estimates in terms
of energy and carbon contents. Fossil fuel resources are not fixed; they
are a dynamically evolving quantity. The estimates shown span quite a
range reflecting the general uncertainty associated with limited knowl-
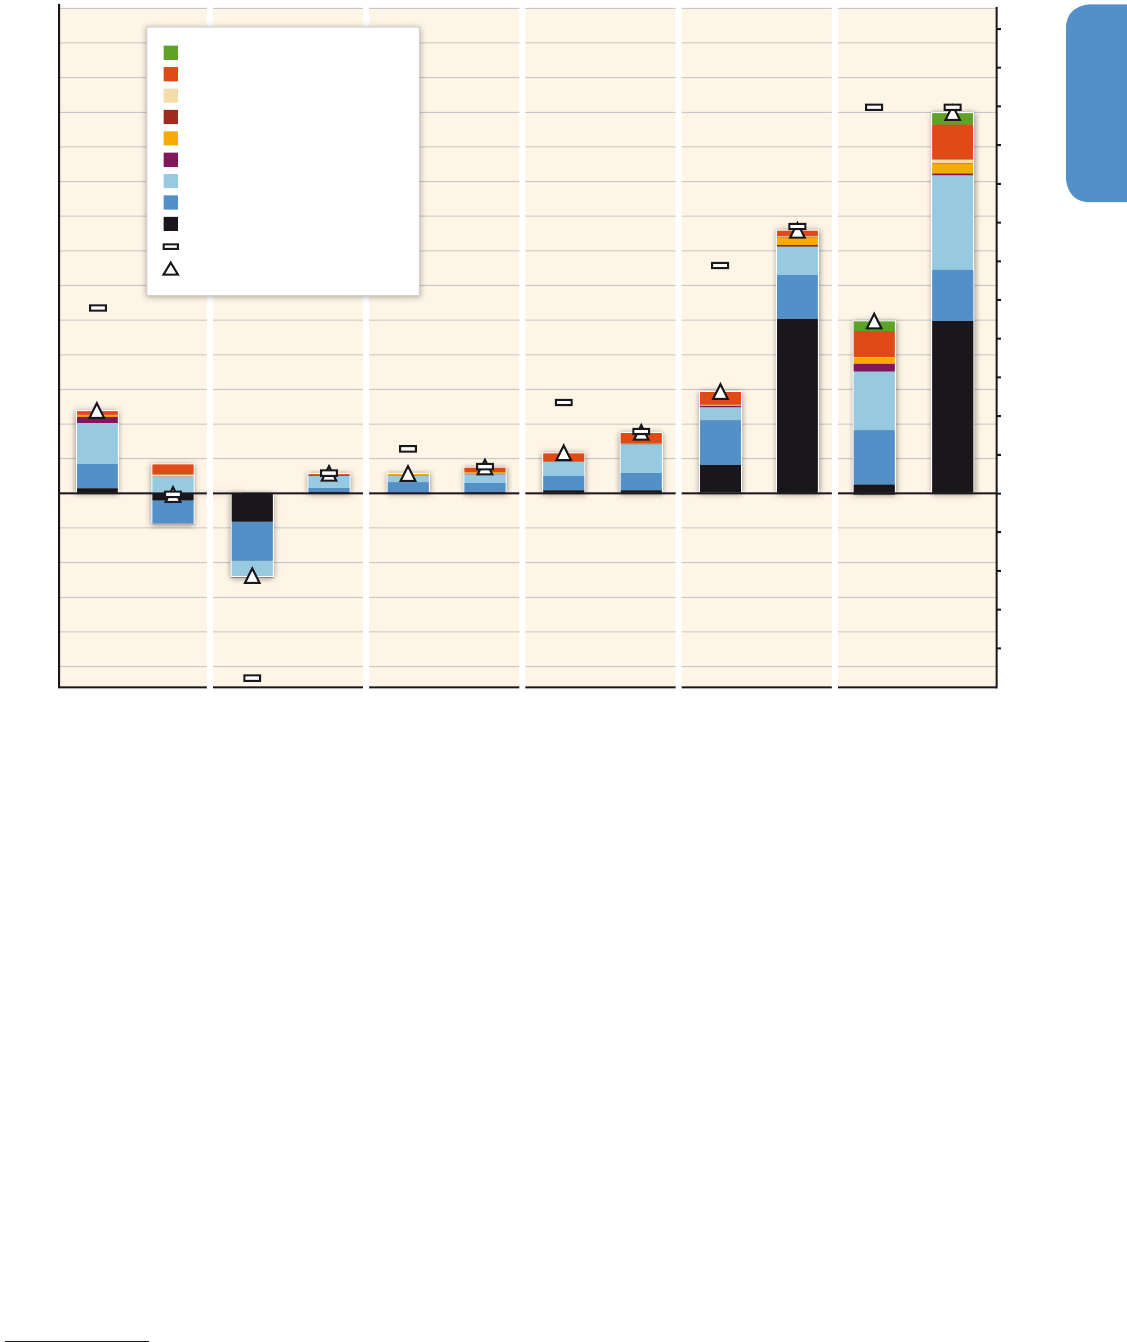
Figure 7�4 | Energy supply sector GHG emissions by subsectors and regions: OECD90, ASIA countries, Economies in Transition (EIT), Africa and the Middle East (MAF), and Latin
America (LAM). Right-hand graph shows contribution of different regions to decadal emissions increments. Source: Historic Emission Database EDGAR / IEA (IEA, 2012g; JRC / PBL,
2013).
GHG Emissions [GtCO
2
eq/yr]
1970 201019901970 201019901970 201019901970 201019901970 20101990
OECD-1990 ASIA EIT LAM MAF
0
1
2
3
4
5
6
7
8
Change in GHG Emissions [GtCO
2
eq/yr]
0
1
2
3
4
5
MAF
LAM
ASIA
EIT
OECD-1990
-1
Total world
OECD-1990
EIT
ASIA
LAM
MAF
Total world
OECD-1990
EIT
ASIA
LAM
MAF
70s
3.53%
2.26%
4.31%
8.23%
3.67%
3.89%
1980
1.91
5.10
6.18
0.40
0.85
1.39
1990
2.03
5.32
7.80
0.62
0.83
1.15
2000
2.08
5.81
5.61
1.00
1.00
1.30
2010
2.50
5.34
5.93
1.92
1.21
1.46
80s
2.43%
1.10%
3.12%
6.64%
1.77%
1.00%
90s
1.68%
1.59%
-3.31%
6.52%
3.64%
3.76%
00s
3.10%
-0.13%
0.49%
7.89%
3.13%
3.66%
Average Annual Growth Rates Per Capita Energy Sector Emission [tCO
2
eq/yr]
2000-
2010
1990-
2000
1980-
1990
1970-
1980
Electricity and Heat
Petroleum Refining
Others
Manufacture of Solid Fuels
Indirect N
2
O Emissions
from Energy
Fuel Production and
Transmission
4.55
5.26
3.26
0.42
1.76
7.06
1.55
3.22
2.42
0.22
0.37
0.72
0.54
1.83
0.88

525525
Energy Systems
7
Chapter 7
edge and boundaries. Changing economic conditions, technological
progress, and environmental policies may expand or contract the eco-
nomically recoverable quantities altering the balance between future
reserves and resources.
Coal reserve and resource estimates are subject to uncertainty and
ambiguity, especially when reported in mass units (tonnes) and with-
out a clear distinction of their specific energy contents, which can vary
considerably. For both reserves and resources, the quantity of hard
(black) coal significantly outnumbers the quantity of lignite (brown
coal), and despite resources being far greater than reserves, the pos-
sibility for resources to cross over to reserves is expected to be limited
since coal reserves are likely to last around 100 years at current rates
of production (Rogner etal., 2012).
Cumulative past production of conventional oil falls between the esti-
mates of the remaining reserves, suggesting that the peak in conven-
tional oil production is imminent or has already been passed (Höök
etal., 2009; Owen etal., 2010; Sorrell etal., 2012). Including resources
extends conventional oil availability considerably. However, depending
on such factors as demand, the depletion and recovery rates achiev-
able from the oil fields (IEA, 2008a; Sorrell et al., 2012), even the
higher range in reserves and resources will only postpone the peak by
about two decades, after which global conventional oil production is
expected to begin to decline, leading to greater reliance on unconven-
tional sources.
Unconventional oil resources are larger than those for conventional
oils. Large quantities of these in the form of shale oil, heavy oil, bitu-
men, oil (tar) sands, and extra-heavy oil are trapped in sedimentary
rocks in several thousand basins around the world. Oil prices in excess
of USD
2010
80 / barrel are probably needed to stimulate investment in
unconventional oil development (Engemann and Owyang, 2010; Rog-
ner etal., 2012; Maugeri, 2012).
Unlike oil, natural gas reserve additions have consistently outpaced
production volumes and resource estimations have increased steadily
since the 1970s (IEA, 2011a). The global natural gas resource base is
vast and more widely dispersed geographically than oil. Unconven-
tional natural gas reserves, i. e., coal bed methane, shale gas, deep for-
mation and tight gas are now estimated to be larger than conventional
reserves and resources combined. In some parts of the world, supply
of unconventional gas now represents a significant proportion of gas
withdrawals, see Section7.2.
For climate change, it is the CO
2
emitted to the atmosphere from the
burning of fossil fuels that matters. When compared to the estimated
CO
2
budgets of the emission scenarios presented in Chapter 6 (Table
6.2), the estimate of the total fossil fuel reserves and resources con-
tains sufficient carbon, if released, to yield radiative forcing above that
required to limit global mean temperature change to less than 2 °C.
The scenario analysis carried out in Section 6.3.4 illustrates in detail
that the availability of fossil fuels alone will not be sufficient to limit
CO
2
eq concentration to levels such as 450 ppm, 550 ppm, or 650 ppm
[Figure 6.15]. Mitigation scenarios are further discussed in Section 7.11
and Chapter 6.
7�4�2 Renewable energy
For the purpose of AR5, renewable energy (RE) is defined as in the
SRREN (IPCC, 2011a) to include bioenergy, direct solar energy, geo-
thermal energy, hydropower, ocean energy, and wind energy.
5
The
technical potential for RE is defined in Verbruggen etal. (2011) as “the
amount of renewable energy output obtainable by full implementation
of demonstrated technologies or practices.” A variety of practical, land
use, environmental, and / or economic constraints are sometimes used
in estimating the technical potential of RE, but with little uniformity
across studies in the treatment of these factors, including costs. Defini-
tions of technical potential therefore vary by study (e. g., Verbruggen
etal., 2010), as do the data, assumptions, and methods used to esti-
mate it (e. g., Angelis-Dimakis etal., 2011). There have also been ques-
5
Note that, in practice, the RE sources as defined here are sometimes extracted
at a rate that exceeds the natural rate of replenishment (e. g., some forms of
biomass and geothermal energy). Most, but not all, RE sources impose smaller
GHG burdens than do fossil fuels when providing similar energy services (see Sec-
tion7.8.1).
Table 7�2 | Estimates of fossil reserves and resource, and their carbon content. Source: (Rogner etal. 2012)*.
Reserves Resources
[EJ] [Gt C] [EJ] [Gt C]
Conventional oil 4,900 – 7,610 98 – 152 4,170 – 6,150 83 – 123
Unconventional oil 3,750 – 5,600 75 – 112 11,280 – 14,800 226 – 297
Conventional gas 5,000 – 7,100 76 – 108 7,200 – 8,900 110 – 136
Unconventional gas 20,100 – 67,100 307 – 1,026 40,200 – 121,900 614 – 1,863
Coal 17,300 – 21,000 446 – 542 291,000 – 435,000 7,510 – 11,230
Total 51,050 – 108,410 1 002 – 1,940 353,850 – 586,750 8,543 – 13,649
*
Reserves are those quantities able to be recovered under existing economic and operating conditions (BP, 2011); resources are those where economic extraction is potentially
feasible (UNECE, 2010a).

526526
Energy Systems
7
Chapter 7
tions raised about the validity of some of the ‘bottom up’ estimates
of technical potential for RE that are often reported in the literature,
and whether those estimates are consistent with real physical limits
(e. g., de Castro etal., 2011; Jacobson and Archer, 2012; Adams and
Keith, 2013). Finally, it should be emphasized that technical potential
estimates do not seek to address all practical or economic limits to
deployment; many of those additional limits are noted at the end of
this section, and are discussed elsewhere in Chapter7.
Though comprehensive and consistent estimates for each individual
RE source are not available, and reported RE technical potentials are
not always comparable to those for fossil fuels and nuclear energy due
to differing study methodologies, the SRREN (IPCC, 2011a) concludes
that the aggregated global technical potential for RE as a whole is sig-
nificantly higher than global energy demands. Figure 7.12 (shown in
Section 7.11) summarizes the ranges of global technical potentials as
estimated in the literature for the different RE sources, as reported in
IPCC (2011a). The technical potential for solar is shown to be the larg-
est by a large magnitude, but sizable potential exists for many forms of
RE. Also important is the regional distribution of the technical poten-
tial. Though the regional distribution of each source varies (see, e. g.,
IPCC, 2011a), Fischedick etal. (2011) reports that the technical poten-
tial of RE as a whole is at least 2.6 times as large as the 2007 total
primary energy demand in all regions of the world.
Considering all RE sources together, the estimates reported by this
literature suggest that global and regional technical potentials are
unlikely to pose a physical constraint on the combined contribution of
RE to the mitigation of climate change (also see GEA, 2012). Addition-
ally, as noted in IPCC (2011b), “Even in regions with relatively low lev-
els of technical potential for any individual renewable energy source,
there are typically significant opportunities for increased deployment
compared to current levels”. Moreover, as with other energy sources,
all else being equal, continued technological advancements can be
expected to increase estimates of the technical potential for RE in the
future, as they have in the past (Verbruggen etal., 2011).
Nonetheless, the long-term percentage contribution of some indi-
vidual RE sources to climate change mitigation may be limited by the
available technical potential if deep reductions in GHG emissions are
sought (e. g., hydropower, bioenergy, and ocean energy), while even RE
sources with seemingly higher technical potentials (e. g., solar, wind)
will be constrained in certain regions (see Fischedick et al., 2011).
Additionally, as RE deployment increases, progressively lower-quality
resources are likely to remain for incremental use and energy conver-
sion losses may increase, e. g., if conversion to alternative carriers such
as hydrogen is required (Moriarty and Honnery, 2012). Competition
for land and other resources among different RE sources may impact
aggregate technical potentials, as might concerns about the carbon
footprint and sustainability of the resource (e. g., biomass) as well as
materials demands (cf. Annex Bioenergy in Chapter 11; de Vries etal.,
2007; Kleijn and van der Voet, 2010; Graedel, 2011). In other cases,
economic factors, environmental concerns, public acceptance, and / or
the infrastructure required to manage system integration (e. g., invest-
ments needed to accommodate variable output or transmit renewable
electricity to load centres) are likely to limit the deployment of individ-
ual RE technologies before absolute technical resource potential limits
are reached (IPCC, 2011a).
7�4�3 Nuclear energy
The average uranium (U) concentration in the continental Earth’s
crust is about 2.8 ppm, while the average concentration in ocean
water is 3 to 4 ppb (Bunn etal., 2003). The theoretically available
uranium in the Earth’s crust is estimated at 100 teratonnes (Tt) U,
of which 25Tt U occur within 1.6 km of the surface (Lewis, 1972).
The amount of uranium dissolved in seawater is estimated at 4.5
Gt (Bunn et al., 2003). Without substantial research and develop-
ment (R&D) efforts to develop vastly improved and less expensive
extraction technologies, these occurrences do not represent practi-
cally extractable uranium. Current market and technology conditions
limit extraction of conventional uranium resources to concentrations
above 100 ppm U.
Altogether, there are 4200 EJ (or 7.1 MtU) of identified conven-
tional uranium resources available at extraction costs of less than
USD 260 / kgU (current consumption amounts to about 53,760 tU per
year). Additional conventional uranium resources (yet to be discov-
ered) estimated at some 4400 EJ can be mobilized at costs larger than
USD 260 / kgU (NEA and IAEA, 2012). Present uranium resources are
sufficient to fuel existing demand for more than 130 years, and if all
conventional uranium occurrences are considered, for more than 250
years. Reprocessing of spent fuel and recycling of uranium and plu-
tonium in used fuel would double the reach of each category (IAEA,
2009). Fast breeder reactor technology can theoretically increase ura-
nium utilization 50-fold or even more with corresponding reductions in
high-level waste (HLW) generation and disposal requirements (IAEA,
2004). However, reprocessing of spent fuel and recycling is not eco-
nomically competitive below uranium prices of USD
2010
425 / kgU(Bunn
etal., 2003). Thorium is a widely distributed slightly radioactive metal.
Although the present knowledge of the world’s thorium resource base
is poor and incomplete, it is three to four times more abundant than
uranium in the Earth’s outer crust (NEA, 2006). Identified thorium
resource availability is estimated at more than 2.5 Mt at production
costs of less than USD
2010
82 / kgTh (NEA, 2008).
Further information concerning reactor technologies, costs, risks, co-
benefits, deployment barriers and policy aspects can be found in Sec-
tions 7.5.4, 7.8.2, 7.9, 7.10, and 7.12, respectively.

527527
Energy Systems
7
Chapter 7
7.5 Mitigation technology
options, practices and
behavioral aspects
Climate change can only be mitigated and global temperature be sta-
bilized when the total amount of CO
2
emitted is limited and emissions
eventually approach zero (Allen etal., 2009; Meinshausen etal., 2009).
Options to reduce GHG emissions in the energy supply sector reduce
the lifecycle GHG-emissions intensity of a unit of final energy (electric-
ity, heat, fuels) supplied to end users. Section 7.5 therefore addresses
options to replace unabated fossil fuel usage with technologies with-
out direct GHG emissions, such as renewable and nuclear energy
sources, and options to mitigate GHG emissions from the extraction,
transport, and conversion of fossil fuels through increased efficiency,
fuel switching, and GHG capture. In assessing the performance of
these options, lifecycle emissions have to be considered. Appropri-
ate policies need to be in place to ensure that the adoption of such
options leads to a reduction and ultimate phaseout of freely emitting
(i. e., unabated) fossil technologies and not only to reduced additional
energy consumption, as indicated in Section 7.12.
Options discussed in this section put some emphasis on electricity pro-
duction, but many of the same options could be used to produce heat or
transport fuels or deliver heating and transportation services through
electrification of those demands. The dedicated provision of transport
fuels is treated in Chapter 8, of heat for buildings is covered in Chapter
9, and of heat for industrial processes in Chapter 10. Options to reduce
final energy demand are addressed in Chapters 8 – 12. Options covered
in this section mainly address technology solutions. Behavioural issues
in the energy supply sector often concern the selection of and invest-
ment in technology, and these issues are addressed in Sections 7.10,
7.11, and 7.12. Costs and emission-reduction potentials associated
with the options are discussed in Section 7.8, whereas co-benefits and
risks are addressed in Section7.9.
7�5�1 Fossil fuel extraction, conversion, and
fuel switching
Several important trends shape the opportunity to mitigate emissions
associated with the extraction, transport, and conversion of fossil
fuels: (1) new technologies that make accessible substantial reservoirs
of shale gas and unconventional oil; (2) a renewed focus on fugitive
methane emissions, especially those associated with gas production;
(3) increased effort required to find and extract oil; and (4) improved
technologies for energy efficiency and the capture or prevention of
methane emissions in the fuel supply chain. Carbon dioxide capture
technologies are discussed in Section7.5.5.
A key development since AR4 is the rapid deployment of hydraulic-
fracturing and horizontal-drilling technologies, which has increased
and diversified the gas supply and allowed for a more extensive
switching of power and heat production from coal to gas (IEA, 2012b);
this is an important reason for a reduction of GHG emissions in the
United States. At the same time, the increasing utilization of gas has
raised the issue of fugitive emissions of methane from both conven-
tional and shale gas production. While some studies estimate that
around 5 % of the produced gas escapes in the supply chain, other
analyses estimate emissions as low as 1 % (Stephenson etal., 2011;
Howarth etal., 2011; Cathles etal., 2012). Central emission estimates
of recent analyses are 2 % — 3 % (+ / – 1 %) of the gas produced, where
the emissions from conventional and unconventional gas are compa-
rable (Jaramillo etal., 2007; O’Sullivan and Paltsev, 2012; Weber and
Clavin, 2012). Fugitive emissions depend to a significant degree on
whether low-emission practices, such as the separation and capture
of hydrocarbons during well completion and the detection and repair
of leaks throughout gas extraction and transport, are mandated and
how they are implemented in the field (Barlas, 2011; Wang etal., 2011;
O’Sullivan and Paltsev, 2012). Empirical research is required to reduce
uncertainties and to better understand the variability of fugitive gas
emissions (Jackson etal., 2013) as well as to provide a more-global
perspective. Recent empirical research has not yet resolved these
uncertainties (Levi, 2012; Petron etal., 2012). The main focus of the
discussion has been drilling, well completion, and gas product, but gas
grids (Ryerson etal., 2013) and liquefaction (Jaramillo etal., 2007) are
also important.
There has also been some attention to fugitive emissions of methane
from coal mines (Su etal., 2011; Saghafi, 2012) in connection with
opportunities to capture and use or treat coal-seam gas (Karacan etal.,
2011). Emission rates vary widely based on geological factors such as
the age of the coal and previous leakage from the coal seam (Moore,
2012).
Taking into account revised estimates for fugitive methane emis-
sions, recent lifecycle assessments indicate that specific GHG emis-
sions are reduced by one half (on a per-kWh basis) when shifting
from the current world-average coal-fired power plant to a modern
natural gas combined-cycle (NGCC) power plant, evaluated using the
100-year global warming potentials (GWP) (Burnham etal., 2012), as
indicated in Figure 7.6 (Section 7.8). This reduction is the result of
the lower carbon content of natural gas (15.3 gC / MJ compared to,
e. g., 26.2 gC / MJ for sub-bituminous coal) and the higher efficiency
of combined-cycle power plants (IEA, 2011a). A better appreciation
of the importance of fugitive emissions in fuel chains since AR4 has
resulted in a downward adjustment of the estimated benefit from fuel
switching. More modest emissions reductions result when shifting
from current average coal plants to the best available coal technology
or less-advanced gas power plants. Climate mitigation consistent with
the Cancun Agreement requires a reduction of emissions rates below
that of NGCC plants by the middle of this century (Figure 7.7, Section
7.8.2 and Figure 7.9, Section 7.11), but natural gas may play a role
as a transition fuel in combination with variable renewable sources
(Levi, 2013).

528528
Energy Systems
7
Chapter 7
Combined heat and power (CHP) plants are capable of recovering a
share of the waste heat that is otherwise released by power plants
that generate only electricity. The global average efficiency of fossil-
fuelled power plants is 37 %, whereas the global average efficiency
of CHP units is 58 % if both power and the recovered heat are taken
into account (see Table 7.1 in 7.2). State of the art CHP plants are able
to approach efficiencies over 85 % (IEA, 2012b). The usefulness of
decentralized cogeneration units is discussed in (Pehnt, 2008). Further
emissions reductions from fossil fuel systems are possible through CO
2
capture and storage (Section 7.5.5).
Producing oil from unconventional sources and from mature con-
ventional oil fields requires more energy than producing it from vir-
gin conventional fields (Brandt and Farrell, 2007; Gagnon, Luc etal.,
2009; Lechtenböhmer and Dienst, 2010). Literature indicates that the
net energy return on investment has fallen steadily for conventional
oil to less than 10GJ / GJ (Guilford etal.; Brandt etal., 2013). For oil
sands, the net energy return ratio of the product delivered to the
customer is about 3GJ / GJ invested (Brandt etal., 2013), with simi-
lar values expected for oil shale (Dale etal., 2013). As a result, emis-
sions associated with synthetic crude production from oil sands are
higher than those from most conventional oil resources (Charpentier
etal., 2009; Brandt, 2011). These emissions are related to extra energy
requirements, fugitive emissions from venting and flaring (Johnson and
Coderre, 2011), and land use (Rooney etal., 2012). Emissions associ-
ated with extraction of oil sands and refining to gasoline are estimated
to be 35 – 55 gCO
2
eq / MJ fuel, compared to emissions of 20 gCO
2
eq / MJ
for the production and refining of regular petroleum and 70 gCO
2
eq / MJ
associated with combusting this fuel (Burnham etal., 2012). Overall,
fossil fuel extraction and distribution are currently estimated to con-
tribute 5 % – 10 % of total fossil-fuel-related GHG emissions (Alsalam
and Ragnauth, 2011; IEA, 2011a; Burnham et al., 2012). Emissions
associated with fuel production and transmission can be reduced
through higher energy efficiency and the use of lower-carbon energy
sources in mines, fields, and transportation networks (IPIECA and API,
2007; Hasan etal., 2011), the capture and utilization (UNECE, 2010b),
or treatment (US EPA, 2006; IEA, 2009a; Karacan etal., 2011; Karakurt
etal., 2011; Su etal., 2011) of methane from coal mining, the reduc-
tion of venting and flaring from oil and gas production (IPIECA and
API, 2009; Johnson and Coderre, 2011), and leak detection and repair
for natural gas systems (Goedbloed, 2011; Wilwerding, 2011).
7�5�2 Energy efficiency in transmission and
distribution
Electrical losses associated with the high-voltage transmission system
are generally less than losses within the lower-voltage distribution sys-
tem mainly because the total length of transmission lines is far less
than that for distribution in most power systems, and that currents and
thus losses are lower at high voltages. These losses are due to a combi-
nation of cable or line losses and transformer losses and vary with the
nature of the power system, particularly its geographical layout. Losses
as a fraction of power generated vary considerably between countries,
with developed countries tending to have lower losses, and a number
of developing countries having losses of over 20 % in 2010 according
to IEA online data (IEA, 2010a). Combined transmission and distribu-
tion losses for the OECD countries taken together were 6.5 % of total
electricity output in 2000 (IEA, 2003a), which is close to the EU aver-
age (European Copper Institute, 1999).
Approximately 25 % of all losses in Europe, and 40 % of distribution
losses, are due to distribution transformers (and these losses will be simi-
lar in OECD countries); therefore, use of improved transformer designs
can make a significant impact (see European Copper Institute, 1999 and
in particular Appendix A therein). Roughly a further 25 % of losses are
due to the distribution system conductors and cables. An increase in dis-
tributed generation can reduce these losses since generation typically
takes place closer to loads than with central generation and thus the
electricity does not need to travel so far (Méndez Quezada etal., 2006;
Thomson and Infield, 2007). However, if a large amount of distributed
power generation is exported back into the main power system to meet
more distant loads, then losses can increase again. The use of greater
interconnection to ease the integration of time varying renewables into
power systems would be expected to increase the bulk transfer of power
over considerable distances and thus the losses (see Section7.6.1). High-
voltage direct current transmission (HVDC) has the potential to reduce
transmission losses and is cost-effective for very long above-ground
lines. However, sub-sea HVDC has lower losses over 55 to 70 kms (Bar-
beris Negra etal., 2006) and will most likely be used for the connection
of large offshore wind farms due to the adverse reactive power charac-
teristics of long sub-sea alternating current (AC) transmission cables.
Crude oil transportation from upstream production facilities to refin-
eries and subsequent moving of petroleum products to service sta-
tions or end user is an energy-consuming process if it is not effectively
performed (PetroMin Pipeliner, 2010). Pipelines are the most efficient
means to transport fluids. Additives can ease the flow of oil and reduce
the energy used (Bratland, 2010). New pumps technology, pipeline
pigging facilities, chemicals such as pour point depressants (for waxy
crude oil), and drag-reducing agents are good examples of these tech-
nologies that increase the pipeline throughput.
Finally, it is worth noting that the decarbonization of heat through
heat pumps and transport through an increased use of electric vehicles
(EVs), could require major additions to generation capacity and aligned
with this, an improved transmission and distribution infrastructure.
Exactly how much will depend on whether these new loads are con-
trolled and rescheduled through the day by demand-side management
(see Section8.3.4.2 for more detail).
7�5�3 Renewable energy technologies
Only a small fraction of the renewable energy (RE) technical potential
has been tapped so far (see Section 7.4.2; IPCC 2011a), and most — but

529529
Energy Systems
7
Chapter 7
not all — forms of RE supply have low lifecycle GHG emissions in
comparison to fossil fuels (see Section7.8.1). Though RE sources are
often discussed together as a group, the specific conversion technolo-
gies used are numerous and diverse. A comprehensive survey of the
literature is available in IPCC (2011a). Renewable energy sources are
capable of supplying electricity, but some sources are also able to sup-
ply thermal and mechanical energy, as well as produce fuels that can
satisfy multiple energy service needs (Moomaw etal., 2011b).
Many RE sources are primarily deployed within larger, central-
ized energy networks, but some technologies can be — and often
are — deployed at the point of use in a decentralized fashion (Sath-
aye etal., 2011; Sims etal., 2011; REN21, 2013). The use of RE in the
transport, buildings, and industrial sectors — as well as in agriculture,
forestry, and human settlements — is addressed more fully in Chapters
8 – 12.
Fischedick etal. (2011) find that, while there is no obvious single domi-
nant RE technology likely to be deployed at a global level, bioenergy,
wind, and solar may experience the largest incremental growth. The
mix of RE technologies suited to a specific location, however, will
depend on local conditions, with hydropower and geothermal playing
a significant role in certain countries.
Because some forms of RE are primarily used to produce electricity
(e. g., Armaroli and Balzani, 2011), the ultimate contribution of RE to
overall energy supply may be dictated in part by the future electrifica-
tion of transportation and heating / cooling or by using RE to produce
other energy carriers, e. g., hydrogen (Sims etal., 2011; Jacobson and
Delucchi, 2011; see also other chapters of AR5).
The performance and cost of many RE technologies have advanced
substantially in recent decades and since AR4 (e. g., IPCC, 2011a;
Arent etal., 2011). For example, improvements in photovoltaic (PV)
technologies and manufacturing processes, along with changed mar-
ket conditions (i. e., manufacturing capacity exceeding demand) and
reduced non-hardware costs, have substantially reduced PV costs and
prices. Continued increases in the size and therefore energy capture
of individual wind turbines have reduced the levelized cost of land-
based wind energy and improved the prospects for future reductions
in the cost of offshore wind energy. Concentrated solar thermal power
(CSP) technologies, some together with thermal storage or as gas / CSP
hybrids, have been installed in a number of countries. Research, devel-
opment, and demonstration of enhanced geothermal systems has con-
tinued, enhancing the prospects for future commercial deployments.
Performance improvements have also been made in cropping systems,
logistics, and multiple conversion technologies for bioenergy (see
11.13). IPCC (2011a) provides further examples from a broader array
of RE technologies.
As discussed in IPCC (2011a), a growing number of RE technologies
have achieved a level of technical and economic maturity to enable
deployment at significant scale (with some already being deployed
at significant scale in many regions of the world), while others are
less mature and not yet widely deployed. Most hydropower technolo-
gies, for example, are technically and economically mature. Bioenergy
technologies, meanwhile, are diverse and span a wide range; exam-
ples of mature technologies include conventional biomass-fuelled
power plants and heating systems as well as ethanol production from
sugar and starch, while many lignocellulose-based transport fuels are
at a pre-commercial stage (see Section11.13). The maturity of solar
energy ranges from the R&D stage (e. g., fuels produced from solar
energy), to relatively more technically mature (e. g., CSP), to techni-
cally mature (e. g., solar heating and wafer-based silicon PV); how-
ever, even the technologies that are more technically mature have
not all reached a state of economic competitiveness. Geothermal
power and heat technologies that rely on hydrothermal resources
use mature technologies (though reservoir risks remain substantial),
whereas enhanced geothermal systems continue to undergo R&D
with some limited demonstration plants now deployed. Except for
certain types of tidal barrages, ocean energy technologies are also
at the demonstration phase and require additional R&D. Traditional
land-based wind technologies are mature, while the use of wind
energy in offshore locations is increasing but is typically more costly
than land-based wind.
With regard to traditional biomass, the conversion of wood to charcoal
in traditional kilns results in low-conversion efficiencies. A wide range
of interventions have tried to overcome this challenge by promoting
more efficient kilns, but the adoption rate has been limited in many
countries, particularly in sub-Saharan Africa (Chidumayo and Gumbo,
2013). Although not yielding large GHG savings in global terms,
increasing the efficiency of charcoal production offers local benefits
such as improved charcoal delivery and lower health and environmen-
tal impacts (FAO, 2010).
Because the cost of energy from many (but not all) RE technologies
has historically been higher than market energy prices (e. g. Fischedick
etal., 2011; Section 7.8), public R&D programmes have been impor-
tant, and government policies have played a major role in defining the
amount and location of RE deployment (IEA, 2011b; Mitchell et al.,
2011; REN21, 2013). Additionally, because RE relies on natural energy
flows, some (but not all) RE technologies must be located at or near
the energy resource, collect energy from diffuse energy flows, and pro-
duce energy output that is variable and — though power-output fore-
casting has improved — to some degree unpredictable (IPCC, 2011b).
The implications of these characteristics for infrastructure development
and network integration are addressed in Section 7.6.1.
Renewable energy currently constitutes a relatively small fraction of
global energy supply, especially if one excludes traditional biomass.
However, RE provided almost 21 % of global electricity supply in 2012,
and RE deployment has increased significantly since the AR4 (see Sec-
tion 7.2). In 2012, RE power capacity grew rapidly: REN21 (2013)
reports that RE accounted for just over half of the new electricity-gen-

530530
Energy Systems
7
Chapter 7
erating capacity added globally in 2012.
6
As shown in Figure 7.5, the
fastest-growing sources of RE power capacity included wind power (45
GW added in 2012), hydropower (30GW), and PV (29 GW).
7
In aggregate, the growth in cumulative renewable electricity capac-
ity equalled 8 % from 2010 to 2011 and from 2011 to 2012 (REN21,
2013). Biofuels accounted for 3.4 % of global road transport fuel
demand in 2012 (REN21, 2013); though growth was limited from 2010
to 2012, growth since the IPCC’s AR4 has been substantial. By the
end of 2012, the use of RE in hot water / heating markets included 293
GWth of modern biomass, 255 GWth of solar, and 66 GWth of geother-
mal heating (REN21, 2013).
Collectively, developing countries host a substantial fraction of the
global renewable electricity generation capacity, with China add-
ing more capacity than any other country in 2012 (REN21, 2013).
Cost reductions for PV have been particularly sizable in recent years,
resulting in and reflecting strong percentage growth rates (albeit from
a small base), with the majority of new installations through 2012
coming from Europe (and to a lesser degree Asia and North America)
but with manufacturing shifting to Asia (REN21, 2013; see also Sec-
tion 7.8). The United States and Brazil accounted for 61 % and 26 %,
respectively, of global bioethanol production in 2012, while China led
in the use of solar hot water (REN21, 2013).
6
A better metric would be based on energy supply, not installed capacity, especially
because of the relatively low capacity factors of some RE sources. Energy supply
statistics for power plants constructed in 2012, however, are not available.
7
REN21 (2013) estimates that biomass power capacity increased by 9 GW in 2012,
CSP by 1 GW, and geothermal power by 0.3 GW.
Decentralized RE to meet rural energy needs, particularly in the less-
developed countries, has also increased, including various modern and
advanced traditional biomass options as well as small hydropower,
PV, and wind, thereby expanding and improving energy access (IPCC,
2011a; REN21, 2013).
7�5�4 Nuclear energy
Nuclear energy is utilized for electricity generation in 30 countries
around the world (IAEA, 2013a). There are 434 operational nuclear
reactors with a total installed capacity of 371 GWe as of Septem-
ber 2013 (IAEA, 2013a). Nuclear electricity represented 11 % of the
world’s electricity generation in 2012, with a total generation of 2346
TWh (IAEA, 2013b). The 2012 share of global nuclear electricity gen-
eration is down from a high of 17 % in 1993 (IEA, 2012b; BP, 2013).
The United States, France, Japan, Russia, and Korea (Rep. of) — with
99, 63, 44, 24, and 21 GW
e
of nuclear power, respectively — are the top
five countries in installed nuclear capacity and together represent 68 %
of total global nuclear capacity as of September 2013 (IAEA, 2013a).
The majority of the world’s reactors are based on light-water technol-
ogy of similar concept, design, and fuel cycle. Of the reactors world-
wide, 354 are light-water reactors (LWR), of which 270 are pressurized
water reactors (PWR) and 84 are boiling water reactors (BWR) (IAEA,
2013a). The remaining reactor types consist of 48 heavy-water reactors
(PHWR), 15 gas-cooled reactors (GCR), 15 graphite-moderated reac-
tors (RBMK / LWGR), and 2 fast breeder reactors (FBR) (IAEA, 2013a).
The choice of reactor technologies has implications for safety, cost,
and nuclear fuel cycle issues.
Growing demand for electricity, energy diversification, and climate
change mitigation motivate the construction of new nuclear reactors.
Figure 7�5 | Selected indicators of recent global growth in RE deployment (REN21, 2013). Note: A better metric of the relative contribution of RE would be based on energy supply,
not installed capacity, especially because of the relatively low capacity factors of some RE sources. Energy supply statistics for power plants constructed in the most recent years,
however, are not available.
0
300
600
900
1200
1500
Solar Hot Water
Capacity (GWth)
Solar PV
Capacity
Wind Power
Capacity
Hydropower
Capacity
RE Electric
Power Capacity
0
20
40
60
80
100
Biodiesel
Production
Ethanol
Production
Production [Billion l/yr]
Total Installed Capacity [GW]
8%
8%
3%
3%
20%
19%
78%
41%
14%
14%
-1%
-1%
21%
0%
2010
2011
2012

531531
Energy Systems
7
Chapter 7
The electricity from nuclear power does not contribute to direct GHG
emissions. There are 69 reactors, representing 67 GWe of capacity, cur-
rently under construction in 14 countries (IAEA, 2013a). The bulk of the
new builds are in China, Russia, India, Korea (Rep. of), and the United
States — with 28, 10, 7, 5, and 3 reactors under construction, respectively
(IAEA, 2013a). New reactors consist of 57 PWR, 5 PHWR, 4 BWR, 2 FBR,
and one high-temperature gas-cooled reactor (HTGR) (IAEA, 2013a).
Commercial reactors currently under construction — such as the
Advanced Passive-1000 (AP-1000, USA-Japan), Advanced Boiling
Water Reactor (ABWR, USA-Japan), European Pressurized Reactor (EPR,
France), Water-Water Energetic Reactor-1200 (VVER-1200, Russia), and
Advanced Power Reactor-1400 (APR-1400, Rep. of Korea) — are Gen III
and Gen III+ reactors that have evolutionary designs with improved
active and passive safety features over the previous generation of
reactors (Cummins etal., 2003; IAEA, 2006; Kim, 2009; Goldberg and
Rosner, 2011).
Other more revolutionary small modular reactors (SMR) with additional
passive safety features are under development (Rosner and Goldberg,
2011; IAEA, 2012a; Vujic etal., 2012; World Nuclear Association, 2013).
The size of these reactors is typically less than 300 MWe, much smaller
than the 1000 MWe or larger size of current LWRs. The idea of a smaller
reactor is not new, but recent SMR designs with low power density,
large heat capacity, and heat removal through natural means have the
potential for enhanced safety (IAEA, 2005a, 2012a). Additional motiva-
tions for the interest in SMRs are economies of manufacturing from
modular construction techniques, shorter construction periods, incre-
mental power capacity additions, and potential for improved financing
(Rosner and Goldberg, 2011; Vujic etal., 2012; World Nuclear Associa-
tion, 2013). Several SMR designs are under consideration. Light-water
SMRs are intended to rely on the substantial experience with current
LWRs and utilize existing fuel-cycle infrastructure. Gas-cooled SMRs
that operate at higher temperatures have the potential for increased
electricity generation efficiencies relative to LWRs and industrial appli-
cations as a source of high-temperature process heat (EPRI, 2003;
Zhang etal., 2009). A 210 MWe demonstration high-temperature peb-
ble-bed reactor (HTR-PM) is under construction in China (Zhang etal.,
2009). While several countries have interest in the development of
SMRs, their widespread adoption remains uncertain.
The choice of the nuclear fuel cycle has a direct impact on uranium
resource utilization, nuclear proliferation, and waste management. The
use of enriched uranium fuels for LWRs in a once-through fuel cycle
dominates the current nuclear energy system. In this fuel cycle, only a
small portion of the uranium in the fuel is utilized for energy produc-
tion, while most of the uranium remains unused. The composition of
spent or used LWR fuel is approximately 94 % uranium, 1 %plutonium,
and 5 % waste products (ORNL, 2012). The uranium and converted plu-
tonium in the spent fuel can be used as new fuel through reprocessing.
While the ultimate availability of natural uranium resources is uncer-
tain (see Section7.4.3), dependence on LWRs and the once-through
fuel cycle implies greater demand for natural uranium. Transition to
ore grades of lower uranium concentration for increasing uranium sup-
ply could result in higher extraction costs (Schneider and Sailor, 2008).
Uranium ore costs are a small component of nuclear electricity costs,
however, so higher uranium extraction cost may not have a significant
impact on the competitiveness of nuclear power (IAEA, 2012b).
The necessity for uranium enrichment for LWRs and the presence of
plutonium in the spent fuel are the primary proliferation concerns.
There are differing national policies for the use or storage of fissile
plutonium in the spent fuel, with some nations electing to recycle plu-
tonium for use in new fuels and others electing to leave it intact within
the spent fuel (IAEA, 2008a). The presence of plutonium and minor
actinides in the spent fuel leads to greater waste-disposal challenges
as well. Heavy isotopes such as plutonium and minor actinides have
very long half-lives, as high as tens to hundreds of thousands of years
(NRC, 1996), which require final waste-disposal strategies to address
safety of waste disposal on such great timescales. Alternative strate-
gies to isolate and dispose of fission products and their components
apart from actinides could have significant beneficial impact on waste-
disposal requirements (Wigeland etal., 2006). Others have argued that
separation and transmutation of actinides would have little or no prac-
tical benefit for waste disposal (NRC, 1996; Bunn etal., 2003).
Alternative nuclear fuel cycles, beyond the once-through uranium
cycle, and related reactor technologies are under investigation. Par-
tial recycling of used fuels, such as the use of mixed-oxide (MOX)
fuels where U-235 in enriched uranium fuel is replaced with recycled
or excess plutonium, is utilized in some nations to improve uranium
resource utilization and waste-minimization efforts (OECD and NEA,
2007; World Nuclear Association, 2013). The thorium fuel cycle is an
alternative to the uranium fuel cycle, and the abundance of thorium
resources motivates its potential use (see Section7.4.3). Unlike natural
uranium, however, thorium does not contain any fissile isotopes. An
external source of fissile material is necessary to initiate the thorium
fuel cycle, and breeding of fissile U-233 from fertile Th-232 is necessary
to sustain the fuel cycle (IAEA, 2005b).
Ultimately, full recycling options based on either uranium or thorium
fuel cycles that are combined with advanced reactor designs — includ-
ing fast and thermal neutron spectrum reactors — where only fission
products are relegated as waste can significantly extend nuclear
resources and reduce high-level wastes (GIF, 2002, 2009; IAEA, 2005b).
Current drawbacks include higher economic costs, as well as increased
complexities and the associated risks of advanced fuel cycles and reac-
tor technologies. Potential access to fissile materials from widespread
application of reprocessing technologies further raises proliferation
concerns. The advantages and disadvantages of alternative reprocess-
ing technologies are under investigation.
There is not a commonly accepted, single worldwide approach to dealing
with the long-term storage and permanent disposal of high-level waste.
Regional differences in the availability of uranium ore and land resources,
technical infrastructure and capability, nuclear fuel cost, and societal

532532
Energy Systems
7
Chapter 7
acceptance of waste disposal have resulted in alternative approaches to
waste storage and disposal. Regardless of these differences and the fuel
cycle ultimately chosen, some form of long-term storage and permanent
disposal, whether surface or geologic (subsurface), is required.
There is no final geologic disposal of high-level waste from commercial
nuclear power plants currently in operation, but Finland and Sweden
are the furthest along in the development of geologic disposal facilities
for the direct disposal of spent fuel (Posiva Oy, 2011, 2012; SKB, 2011).
In Finland, construction of the geologic disposal facility is in prog-
ress and final disposal of spent fuel is to begin in early 2020 (Posiva
Oy, 2012). Other countries, such as France and Japan, have chosen
to reprocess spent fuel to use the recovered uranium and plutonium
for fresh fuel and to dispose of fission products and other actinides
in a geologic repository (OECD and NEA, 2007; Butler, 2010). Yet oth-
ers, such as Korea (Rep. of), are pursuing a synergistic application of
light and heavy water reactors to reduce the total waste by extract-
ing more energy from used fuels (Myung etal., 2006). In the United
States, waste-disposal options are currently under review with the ter-
mination of the Yucca Mountain nuclear waste repository in Nevada
(CRS, 2012). Indefinite dry cask storage of high-level waste at reactor
sites and interim storage facilities are to be pursued until decisions on
waste disposal are resolved.
The implementation of climate change mitigation policies increases the
competiveness of nuclear energy technologies relative to other tech-
nology options that emit GHG emissions (See 7.11, Nicholson etal.,
2011). The choice of nuclear reactor technologies and fuel cycles will
affect the potential risks associated with an expanded global response
of nuclear energy in addressing climate change.
Nuclear power has been in use for several decades. With low levels of
lifecycle GHG emissions (see Section7.8.1), nuclear power contributes
to emissions reduction today and potentially in the future. Continued
use and expansion of nuclear energy worldwide as a response to cli-
mate change mitigation require greater efforts to address the safety,
economics, uranium utilization, waste management, and proliferation
concerns of nuclear energy use (IPCC, 2007, Chapter 4; GEA, 2012).
Research and development of the next-generation nuclear energy
system, beyond the evolutionary LWRs, is being undertaken through
national and international efforts (GIF, 2009). New fuel cycles and
reactor technologies are under investigation in an effort to address
the concerns of nuclear energy use. Further information concerning
resources, costs, risks and co-benefits, deployment barriers, and policy
aspects can be found in Sections 7.4.3, 7.8.2, 7.9, 7.10, and 7.12.
7�5�5 Carbon dioxide capture and storage
(CCS)
As of mid-2013, CCS has not yet been applied at scale to a large, com-
mercial fossil-fired power generation facility. However, all of the com-
ponents of integrated CCS systems exist and are in use today by the
hydrocarbon exploration, production, and transport, as well as the pet-
rochemical refining sectors.
A ‘complete end-to-end CCS system’ captures CO
2
from large (e. g.,
typically larger than 0.1 MtCO
2
/ year) stationary point sources (e. g.,
hydrocarbon-fuelled power plants, refineries, cement plants, and steel
mills), transports and injects the compressed CO
2
into a suitable deep
(typically more than 800 m below the surface) geologic structure, and
then applies a suite of measurement, monitoring, and verification
(MMV) technologies to ensure the safety, efficacy, and permanence of
the captured CO
2
’s isolation from the atmosphere (IPCC, 2005; Herzog,
2011). As of mid2013, five large end-to-end commercial CCS facili-
ties were in operation around the world. Collectively, they have stored
more than 30 MtCO
2
over their lifetimes (Eiken etal., 2011; Whittaker
etal., 2011; MIT, 2013). All of them capture a high-purity CO
2
stream
from industrial (i. e., non-electricity-generating) facilities such as natu-
ral gas processing plants. The near-term deployment of CCS is likely to
arise in just these kinds of industrial facilities that produce high-purity
(which connotes relatively inexpensive to capture) CO
2
waste streams
that would otherwise be vented to the atmosphere and / or in situations
where the captured CO
2
can be used in a value-added manner as is the
case with CO
2
-driven tertiary hydrocarbon recovery (IPCC, 2005; Bak-
ker etal., 2010; Vergragt etal., 2011).
In the long term, the largest market for CCS systems is most likely
found in the electric power sector, where the cost of deploying CCS
(measured on a USD / tCO
2
basis) will be much higher and, as a result,
will be done solely for the purpose of isolating anthropogenic CO
2
from
the atmosphere. However, this is unlikely to occur without sufficiently
stringent limits on GHG emissions to make it economic to incur these
additional costs, regulatory mandates that would require the use of
CCS (for example, on new facilities), or sufficient direct or indirect
financial support (IPCC, 2005; Herzog, 2011).
Research aimed at improving the performance and cost of CO
2
capture
systems for the electric power sector is significant across three broad
classes of CO
2
capture technologies: pre-combustion (Rubin et al.,
2007; Figueroa et al., 2008), post-combustion (Lin and Chen, 2011;
Padurean etal., 2011; Versteeg and Rubin, 2011), and oxyfuel capture
(Scheffknecht etal., 2011; Wall etal., 2011).
The risks associated with a large-scale deployment of CCS technologies
include concerns about the lifecycle toxicity of some capture solvents
(IEAGHG, 2010; Korre etal., 2010; Corsten etal., 2013), the operational
safety and long-term integrity of CO
2
storage sites (Birkholzer etal.,
2009; Oruganti and Bryant, 2009; Juanes etal., 2010, 2012; Morris
etal., 2011; Mazzoldi etal., 2012), as well as risks associated with CO
2
transport via dedicated pipelines (Aines etal., 2009; Mazzoldi etal.,
2012).
There is, however, a growing body of literature on how to minimize
capture risks and to ensure the integrity of CO
2
wells (Carey et al.,

533533
Energy Systems
7
Chapter 7
2007, 2010; Jordan and Benson, 2009; Crow etal., 2010; Zhang and
Bachu, 2011; Matteo and Scherer, 2012), as well as on using detailed
measurement, monitoring, and verification data to lower the threshold
for detecting any leakage out of the intended injection zone (Hovo-
rka etal., 2006; Gilfillan etal., 2009; Jordan and Benson, 2009; Eiken
etal., 2011). The literature is also quantifying potential consequences
of a pressure buildup within a formation caused by CO
2
storage such
as induced seismicity (Juanes etal., 2012; Mazzoldi etal., 2012; NAS,
2013a), the potential human health impacts (Roberts etal., 2011; de
Lary etal., 2012; Atchley etal., 2013), and environmental consequences
from CO
2
that might migrate out of the primary injection zone (Gaus,
2010; Romanak etal., 2012; Zheng etal., 2012) as well as mechanisms
for actively managing the storage formation such as withdrawing for-
mation waters to reduce pressure buildup (Esposito and Benson, 2012;
Réveillère etal., 2012; Sullivan etal., 2013).
The deployment of CCS at a scale of 100s of GtCO
2
over the course
of this century (which is consistent with the stabilization scenarios
described in Chapter 6 and in Section 7.11) would imply that large,
regional, deep-geologic basins would have to accommodate multiple
large-scale CO
2
injection projects (Bachu, 2008; Nicot, 2008; Birkholzer
and Zhou, 2009; Juanes etal., 2010) while taking into account other
industrial activities in the region that could impact the integrity of CO
2
storage reservoirs (Elliot and Celia, 2012). The peer-reviewed literature
that has looked at these large CCS deployment scenarios stress the
need for good CO
2
storage site selection that would explicitly address
the cumulative far-field pressure effects from multiple injection proj-
ects in a given basin.
A considerable body of practical engineering and scientific knowl-
edge has been generated from the first five large-scale, complete
CCS deployments as well as from numerous smaller-scale CCS field
experiments and technology demonstrations (Cavanagh etal., 2010;
IEAGHG, 2011; NETL, 2012). In particular, a key advance has been the
field testing of MMV technologies to monitor injected CO
2
in a vari-
ety of settings. These real-world MMV deployments are the beginnings
of a broader portfolio of MMV technologies that can be matched to
site-specific geology and project- and jurisdiction-specific MMV needs
(Mathieson etal., 2010; Vasco etal., 2010; Sato etal., 2011). The value
of high-quality MMV data is becoming clearer as these data allow for
the active management of a geologic CO
2
storage formation and can
provide operators and regulators with the ability to detect possible
leakage out of the target formation at low levels, which, in turn, can
reduce the probability and magnitude of adverse events (Dooley etal.,
2010; Torvanger etal., 2012; Buscheck etal., 2012; Schloemer etal.,
2013).
As noted by Bachu (2008), Krevor etal., (2012), and IPCC (2005), there
are a number of key physical and chemical processes that work in con-
cert to help ensure the efficacy of deep-geologic CO
2
storage over time.
The accumulated knowledge from the five commercial CCS facilities
mentioned above, from many smaller field experiments and technol-
ogy demonstrations, and from laboratory-based research suggests a
declining long-term risk profile for CO
2
stored in deep-geologic reser-
voirs once active CO
2
injection into the reservoir has ceased (Hovorka
etal., 2006; Gilfillan etal., 2009; Jordan and Benson, 2009). Torvanger
etal. (2012) builds upon this accumulated knowledge and concludes,
“only in the most unfortunate conditions could such CO
2
escape [from
deep-geologic CO
2
storage reservoirs and] compromise [humanity’s
ability to not exceed a] maximum 2.5 °C warming.”
Further information concerning transport risks, costs, deployment bar-
riers, and policy aspects can be found in Sections 7.6.4, 7.8.2, 7.10, and
7.12, respectively. The use of CCS in the industrial sector is described
in Section 10.4.
The direct CO
2
emissions from biogenic feedstock combustion broadly
correspond to the amount of atmospheric CO
2
sequestered through the
growth cycle of bioenergy production.
8
A net removal of atmospheric
CO
2
therefore would result, once the direct emissions are captured and
stored using CCS technologies (see Section11.13, Figure 11.22). As a
consequence, a combination of bio-energy and CCS (BECCS) generally
will result in net negative emissions (see IEA, 2011c, 2012c; IEAGHG,
2011). Currently, two small-scale examples of commercial precursors
to BECCS are capturing CO
2
emissions from ethanol production facili-
ties for enhanced oil recovery in close-proximity facilities (DiPietro and
Balash, 2012).
BECCS is one of the few technologies that is capable of removing
past CO
2
emissions remaining in the atmosphere. As this enhances
the ‘when’ (i. e., temporal) flexibility during the design of mitigation
scenarios considerably, BECCS plays a prominent role in many of the
low-stabilization pathways discussed in Chapter 6 and Section 7.11.
Potential risks associated with BECCS technologies are related to those
associated with the upstream provision of the used biomass
9
(see Sec-
tion11.13) as well as those originating from the capture, transport,
and long-term underground storage of CO
2
that would be emitted oth-
erwise (see above).
8
Non-vanishing life-cycle emissions originate from fossil fuels used during the
planting, regrowth, and harvesting cycle and potential emissions from land-use
and management change, among others. The lifecycle emissions depend on the
type of feedstock, specific location, scale and practices of biomass production, and
on the dynamics and management of land use. In some cases, if biomass growth
accumulates carbon in the soil until reaching equilibrium, additional carbon
sequestration can occur, but these may be short-term effects. Indirect emissions
relate more directly to the use of food crops for energy than to the use of lignocel-
lulosic biomass (see Section11.13). Short rotation species (herbaceous plants)
wastes have near-zero net emissions cycles.
9
BECCS costs can be reduced by using large-scale biomass conversion facilities,
which, in turn, require the development of cost-effective and low-emitting large-
scale feedstock and supply logistics (Section 11.13.3).

534534
Energy Systems
7
Chapter 7
7.6 Infrastructure and
systemic perspectives
7�6�1 Electrical power systems
Reducing GHG emissions from the electric power sector will require
infrastructure investments and changes in the operations of power
systems — these will both depend on the mitigation technologies
employed. The fundamental reliability constraints that underpin this
process are the requirements that power supply and electricity demand
remain in balance at all times (system balancing), that adequate gen-
eration capacity is installed to meet (peak) residual demand (capacity
adequacy)
10
, and that transmission and distribution network infrastruc-
ture is sufficient to deliver generation to end users (transmission and
distribution). Studies of high variable RE penetration (Mason et al.,
2010; Delucchi and Jacobson, 2011; Denholm and Hand, 2011; Huva
etal., 2012; Elliston etal., 2012; Haller etal., 2012; Rasmussen etal.,
2012; Budischak etal., 2013) and the broader literature (summarized
in Sims etal., 2011) suggest that integrating significant RE genera-
tion technology is technically feasible, though economic and institu-
tional barriers may hinder uptake. Integrating high penetrations of RE
resources, particularly those that are intrinsically time variable, along-
side operationally inflexible generation is expected to result in higher
system-balancing costs. Compared to other mitigation options variable
renewable generation will contribute less to capacity adequacy, and, if
remote from loads, will also increase transmission costs. The determi-
nation of least-cost portfolios of those options that facilitate the inte-
gration of fluctuating power sources is a field of active and ongoing
research (Haller etal., 2012; Steinke etal., 2013).
7�6�1�1 System balancing — flexible generation and
loads
Variable RE resources may increase the need for system balancing
beyond that required to meet variations in demand. Existing generating
resources can contribute to this additional flexibility. An IEA assessment
shows the amount of variable RE electricity that can be accommodated
using ‘existing’ balancing resources exceeds 20 % of total annual elec-
tricity supply in seven regions and is above 40 % in two regions and
one country (IEA, 2011d). Higher RE penetrations will require additional
flexible resources (De Vos etal., 2013). Surplus renewable supply can be
curtailed by switching off unwanted plants or through regulation of the
power output, but with corresponding economic consequences (Brand-
stätt etal., 2011; Jacobsen and Schröder, 2012).
Some low-carbon power technologies (such as nuclear) have relatively
high up-front and low operating costs, making them attractive for
10
Sometimes called resource adequacy.
baseload operation rather than providing flexible generation to assist
in system balancing. Depending on the pattern of electricity demand,
a relatively high share of energy can be provided by these baseload
technologies but at some point, further increases in their penetration
will require part-loaded operation,
11
load following, time shifting of
demand (via load management or demand response), and / or deploy-
ment of storage where it is cost-effective (Knapp, 1969; Johnson and
Keith, 2004; Chalmers etal., 2009; Pouret etal., 2009).
Part-load operation of nuclear plants is possible as in France, though
in other regions it may be restricted by institutional barriers (Perez-
Arriaga and Batlle, 2012). Load following by nuclear power plants is
more challenging and must be considered at the design stage (NEA,
2011a, 2012; Greenblatt etal., 2012). Flexible operation of a CCS-fitted
generation plant is also an active area of research (Chalmers and Gib-
bins, 2007; Nord etal., 2009; Cohen etal., 2011). Operational flexibility
of combined heat and power (CHP) plants may be constrained by heat
loads, though thermal storages and complementary heat sources can
mitigate this effect (e. g., Lund and Andersen, 2005; Christidis etal.,
2012; Blarke, 2012; Nuytten etal., 2013), however, the capital intensity
of CHP will favor high load factors. Reservoir hydropower can be useful
in balancing due to its flexibility.
Certain combinations may present further challenges (Ludig et al.,
2011): high shares of variable RE power, for example, may not be
ideally complemented by nuclear, CCS, and CHP plants (without heat
storage). If those plants cannot be operated in a flexible manner,
additional flexibility is required and can be obtained from a number
of sources including investment in new flexible generation, improve-
ments in the flexibility of existing power plants, demand response, and
storage as summarized in the SRREN (Sims et al., 2011). Obtaining
flexibility from fossil generation has a cost (see Section7.8.2) and can
affect the overall GHG reduction potential of variable RE (Pehnt etal.,
2008; Fripp, 2011; Wiser etal., 2011; Perez-Arriaga and Batlle, 2012).
Demand response
12
is of increasing interest due to its potentially low
cost (see chapter 9 and 10; IEA, 2003b; Depuru etal., 2011; Cook etal.,
2012; Joung and Kim, 2013; Procter, 2013), albeit some emphasize its
limitation compared to flexible conventional supply technologies (Cut-
ter etal., 2012). Smart meters and remote controls are key compo-
nents of the so-called smart grid where information technology is used
to improve the operation of power systems, especially with resources
located at the distribution level (IEA, 2011e).
Energy storage might play an increasing role in the field of system bal-
ancing (Zafirakis etal., 2013). Today pumped hydro storage is the only
widely deployed storage technology (Kanakasabapathy, 2013). Other
storage technologies including compressed air energy storage (CAES)
and batteries may be deployed at greater scale within centralized
power systems in the future (Pickard etal., 2009a; b; Roberts and Sand-
11
In the field of RE this is called “curtailment“.
12
Demand response is load management triggered by power price signals derived
from the spot market prices or other control signals (IEA, 2003b).

535535
Energy Systems
7
Chapter 7
berg, 2011), and the latter can be decentralized. These short-term stor-
age resources can be used to compensate the day-night cycle of solar
and short-term fluctuation of wind power (Denholm and Sioshansi,
2009; Chen etal., 2009; Loisel etal., 2010; Beaudin etal., 2010). With
the exception of pumped hydro storage, full (levelized) storage costs
are still high, but storage costs are expected to decline with technol-
ogy development (IEA, 2009b; Deane etal., 2010; Dunn etal., 2011;
EIA, 2012). ‘Power to heat’ and ‘power to gas’ (H
2
or methane) tech-
nologies might allow for translating surplus renewable electricity into
other useful final energy forms (see Sections 7.6.2 and 7.6.3).
7�6�1�2 Capacity adequacy
One measure of reliability in a power system is the probability that
demand will exceed available generation. The contribution of different
generation technologies to ensuring the availability of sufficient gener-
ation is called the capacity credit or capacity value (Keane etal., 2011).
The capacity credit of nuclear, thermal plants with CCS, geothermal,
and large hydro is expected to be higher than 90 % (i. e., within 10 % of
the plant nameplate capacity) as long as fuel supply and cooling water
is sufficient and maintenance is scheduled outside critical periods. Vari-
able RE will generally have a lower capacity credit that depends on
the correlation between generation availability and periods of high
demand. The capacity credit of wind power, for instance, ranges from
5 % to 40 % of the nameplate capacity (Mason etal., 2010; Holttinen
etal., 2011); ranges of capacity credits for other RE resources are sum-
marized in Sims etal. (2011).
The addition of significant plants with low capacity credit can lead to
the need for a higher planning-reserve margin (defined as the ratio of
the sum of the nameplate capacity of all generation to peak demand)
to ensure the same degree of system reliability. If specifically tied to
RE generation, energy storage can increase the capacity credit of that
source; for example, the capacity credit of CSP with thermal storage is
greater than without thermal storage (Madaeni etal., 2011).
7�6�1�3 Transmission and distribution
Due to the geographical diversity of RE resources, connecting RE
sources to the existing transmission system may require the installa-
tion of additional transmission capacity and strengthening the exist-
ing system if significantly greater power flows are required across the
system (Sims etal., 2011). Increased interconnection and strengthened
transmission systems provide power system operators the capability
to move surplus generation in one region to meet otherwise unmet
demand in another, exploiting the geographical diversity of both loads
and generation (Rasmussen et al., 2012). Although there will be a
need for additional transmission capacity, its installation often faces
institutional challenges, and it can be visually intrusive and unpopular
in the affected areas. Infrastructure challenges are particularly acute
for RE deployment in developing countries, which is why stand-alone
decentralized generation, such as with solar home systems, is often
favored.
Transmission considerations applied to CCS plants have to reflect the
tradeoff between the cost of electrical transmission and the cost of
pipeline transport of CO
2
to final depositories (Svensson etal., 2004;
Benson etal., 2005; Herzog etal., 2005; Spiecker etal., 2011). Trans-
mission investments may also be needed for future nuclear plants if
these are located at some distance from load centers due to public per-
ceptions of health and safety, access to cooling water, or other factors.
Distributed generation (DG), where small generating units (often
renewable technologies, cogeneration units, or fuel cells) are con-
nected directly to the electricity distribution system and near loads,
may not have the same need for expansion of the transmission system.
The net impact of DG on distribution networks depends on the local
penetration level, the location of DG relative to loads, and temporal
coincidence of DG generation and loads (Cossent etal., 2011). As DG
grows, system operators would like to have increased visibility and
controllability of DG to ensure overall system reliability. Smart grids
might include components to facilitate the integration of various DG
technologies, allow for more active control of the distribution network,
and improve the market value of DG through aggregation into virtual
power plants (Pudjianto etal., 2007; Clastres, 2011; IEA, 2011e; Wiss-
ner, 2011; Ardito etal., 2013; Hashmi etal., 2013).
7�6�2 Heating and cooling networks
Globally, 15.8 EJ were used in 2010 (2.6 % of global TPES) to produce
nearly 14.3 EJ
13
of district heat for sale at CHP (44 %) and heat-only
boilers (56 %) (Table 7.1). After a long decline in the 1990s, district
heat returned to a growing trajectory in the last decade, rising by about
21 % above the year-2000 level (IEA, 2012a). This market is dominated
by the Russian Federation with a 42 % share in the global heat gen-
eration, followed by Ukraine, United States, Germany, Kazakhstan, and
Poland. Natural gas dominates in the fuel balance of heat generation
(46 %), followed by coal (40 %), oil (5 %), biofuels and waste (5 %),
geothermal and other renewables (2.4 %), and a small contribution
from nuclear. Development of intelligent district heating and cooling
networks in combination with (seasonal) heat storage allows for more
flexibility and diversity (combination of wind and CHP production in
Denmark) and facilitates additional opportunities for low-carbon tech-
nologies (CHP, waste heat use, heat pumps, and solar heating and
cooling) (IEA, 2012a). In addition, excess renewable electricity can be
converted into heat to replace what otherwise would have been pro-
duced by fossil fuels (Meibom etal., 2007).
Statistically reported average global efficiency of heat generation by
heat-only boilers is 83 %, while it is possible to improve it to 90 – 95 %
13
UNES reports lower number. For 2008 this sources assess the total production of
district heat equal to 10.7 EJ (UNES, 2011).

536536
Energy Systems
7
Chapter 7
depending on fuel used. About 6.9 % of globally generated heat for sale
is lost in heating networks (Table 7.1). In some Russian and Ukrainian
municipal heating systems, such losses amount to 20 – 25 % as a result
of excessive centralization of many district heating systems and of
worn and poorly maintained heat supply systems (Bashmakov, 2009).
The promotion of district heating and cooling system should also
account for future technology developments that impact the district
heating sector (building heat demand reduction, high-efficiency single-
housing boilers, heat-pump technology, cogeneration reciprocating
engines, or fuel cells, etc.), which may allow switching to more-effi-
cient decentralized systems (GEA, 2012). District heating and cooling
systems could be more energy and economically efficient when heat
or coldness load density is high through the development of tri-gener-
ation, the utilization of waste heat by communities or industrial sites, if
heat (cooling) and power loads show similar patterns, and if heat-loss
control systems are well-designed and managed (see 9.4.1.1).
7�6�3 Fuel supply systems
As noted in Section 7.5.1, fossil fuel extraction and distribution contrib-
utes around 5 – 10 % of total fossil fuel related GHG emissions. It has
also been noted that specific emissions from this sector will increase
due to increased energy requirements of extraction and processing of
oil and gas from mature fields and unconventional sources, and the
mining of coal from deeper mines. The fuel supply system supporting
this sector does, however, provide opportunities to reduce GHG emis-
sions by enabling the delivery of low-carbon fuels (such as biofuels,
biogas, renewable H
2
,or renewable methane).
Opportunities for delivery of liquid fuels are likely limited to fuels such
as biodiesel and ethanol at points in the system that enable either
storage or blending before transport to distribution nodes, which is
discussed in Section 8.3.3; for gaseous fuels, supply of low-carbon
fuels could occur across much of the gas delivery network.
More than 50 countries transport high-pressure natural gas through
pipe networks greater than 1,000km in length (Central Intelligence
Agency, 2011). Although individual layout varies, connected to these
are the lower-pressure networks that distribute gas for power genera-
tion, industry, and domestic use. Because of their ability to carry natu-
ral gas substitutes, these networks provide an opportunity to expand
production of these gases; depending on the availability of resources,
estimates suggest substitutes could replace 17.4 EJ of natural gas used
in Europe by 2020 (IPCC, 2011a). Low CO
2
-emitting natural gas sub-
stitutes can be produced from surplus fluctuating renewable electric-
ity generation, e. g., ‘power to methane’ (Sterner, 2009; Arvizu etal.,
2011), from other renewable sources such as biomass and waste, or
via coal when combined with CCS; CCS can be added to gas produc-
tion from biomass to further enhance the CO
2
-mitigation potential
(Carbo etal., 2011). Provided the substitute natural gas meets the rel-
evant gas quality standard (IEA Bioenergy, 2006, 2009; IPCC, 2011a),
and gas cleanup may be required to achieve this, there are no tech-
nical barriers to the injection of gas substitutes into the existing gas
networks (Hagen etal., 2001). Biomethane produced from a variety
of sources is already being injected into a number of natural gas net-
works (IEA Bioenergy, 2011; IPCC, 2011a).
The existing natural gas network also has the potential to transport
and distribute hydrogen provided the injected fraction remains below
20 % by volume, although estimates vary (Naturalhy 2004). Limiting
factors are gas quality standard and equipment compliance, pipeline
integrity (failure, fire, and explosion) and end-user safety (Naturalhy,
2004; Tabkhi etal., 2008). Where the pipelines are suitable and more-
frequent inspections can be undertaken, a higher fraction of hydrogen
can be carried, although the lower volumetric energy density of hydro-
gen will reduce energy flow, unless gas pressure can be increased. If
required, hydrogen separation is possible via a range of existing tech-
nologies.
For dedicated hydrogen delivery, transport distance is an important
consideration; pipelines are favoured over shorter delivery distances
and at high flow rates, while batch delivery of liquid hydrogen is
favoured by long distances (Yang and Ogden, 2007). Hydrogen can be
produced from renewable sources such as wind and solar (IEA, 2006;
Moriarty and Honnery, 2007; Gahleitner, 2013) as well as biomass. Its
production from intermittent renewable sources can provide greater
system flexibility; drawbacks are the additional cost and reduced over-
all efficiency in energy delivery (Mason and Zweibel, 2007; Honnery
and Moriarty, 2009; IPCC, 2011a).
7�6�4 CO
2
transport
There are more than 6,300 km of existing CO
2
pipeline in the U.S and
much has been learned from the decades of operational experience
obtained from these existing CO
2
pipeline systems (Dooley etal., 2011).
There is a growing body of research that describes the magnitude and
region-specific nature of future CO
2
transport systems. Specifically, there
are a growing number of bottom-up studies that examine spatial rela-
tionships between where CO
2
capture units might be located and the
very heterogeneous distribution, capacity, and quality of candidate geo-
logic storage reservoirs. For example, the work of Dahowski etal., (2005,
2012) suggests that more than 90 % of the large stationary CO
2
point
sources in the United States are within 160km of at least one candidate
geologic storage reservoir and 80 % of China’s large stationary point
sources are within 80km of at least one candidate storage reservoir.
For regions like these, the proximity of most large stationary CO
2
point
sources to large and geographically distributed geologic CO
2
storage
reservoirs suggests that — at least early on in the commercial deploy-
ment of CCS technologies — facilities might rely on dedicated pipelines
linking the CO
2
source to an appropriate sink. The work of Johnson and
Ogden (2011) suggests that once there is a critical density of CO
2
cap-
ture and storage projects in a region, a more-integrated national pipe-
line network may evolve. For other regions, especially Western / Northern

537537
Energy Systems
7
Chapter 7
Europe, Japan, and Korea, where onshore storage options are not widely
distributed, more care is needed in planning pipeline networks given
the geographical (and political) challenges of linking distributed CO
2
sources to the available / usable predominantly offshore geologic stor-
age options. This requires longer-term planning as well as political / legal
agreements between countries in those regions as more coordination
and cross-boundary transport will be necessary / desired (Huh et al.,
2011; Ogawa etal., 2011; Strachan etal., 2011; ZEP, 2011a). While pipe-
lines are likely to be the transport mode of choice for onshore and most
offshore storage projects (IPCC, 2005), in certain circumstances, trans-
porting CO
2
by large ocean going vessels could be a technically feasible
and cost-effective option (Aspelund etal., 2006; Decarre etal., 2010;
Ozaki and Ohsumi, 2011; Yoo etal., 2011).
The United States oil and gas industry has more than 40 years of expe-
rience associated with transporting large volumes of CO
2
via dedicated
commercial pipelines (IPCC, 2005; Meyer, 2007). Available data sug-
gests that these CO
2
pipelines have safety records that are as good or
better than large interstate natural gas pipelines, their closest indus-
trial analogue (Gale and Davison, 2004; IPCC, 2005; Cole etal., 2011).
There is also a growing body of work combining pipeline fluid flow,
pipeline engineering models, and atmospheric dispersion models sug-
gesting that the hazard associated with potential ruptures in CO
2
pipe-
lines is likely to be small for most plausible releases to the atmosphere
(Aines et al., 2009; Koornneef et al., 2010; Mazzoldi et al., 2011).
Although much can be learned from existing CO
2
pipeline systems,
knowledge gaps exist for systems that integrate multiple CO
2
source
points. Because of their impact on pipeline integrity, gas stream prop-
erties and flow management, impurity control is emerging as a major
design feature of these systems (Oosterkamp and Ramsen, 2008; Cole
etal., 2011) with particular importance given to limiting the amount of
water in the gas stream at its source to avoid corrosion.
Estimates for the cost of transporting, injecting into a suitable forma-
tion, site closure, and long-term post-injection monitoring are summa-
rized at the end of Section 7.8.2. Options for CO
2
geologic storage are
presented in Section7.5.5 and a discussion of the cost of CO
2
capture
is presented in Section7.8.2.
7.7 Climate change
feedback and interaction
with adaptation
Climate change will affect heating and cooling energy demands (see
also Chapter 9.5; Arent etal., 2014), thereby also influencing energy
supply needs. The effect on overall energy demand will vary geographi-
cally (Mideksa and Kallbekken, 2010; Pilli-Sihvola et al., 2010; Wan
et al., 2011). Many studies indicate that demand for electricity will
increase because of greater need for space cooling, while demand for
natural gas and oil will decline because of less need for space heating
(Isaac and van Vuuren, 2009; Akpinar-Ferrand and Singh, 2010; Arent
etal., 2014). Peak electricity demand could also increase, especially
as a result of extreme events, requiring a disproportionate increase
in energy infrastructure (US EPA, 2008). Although impacts on energy
demands outside of heating and cooling are less clear, possible effects
include increased energy use for climate-sensitive processes, such as
pumping water for irrigated agriculture and municipal uses (US EPA,
2008; Aromar and Sattherhwaite, 2014). As another example, reduc-
tions or changes to surface water flows could increase energy demand
for desalination (Boyé, 2008; Scholes and Settele, 2014).
In addition to impacting energy supply through changes in energy
demand, climate change will have various impacts on the potential
future role of mitigation technologies in the energy supply sector.
Though these impacts are summarized here, further details on poten-
tial impacts, as well as a summary of how conventional higher-car-
bon energy supplies might be affected, are available in the WGII AR5
report, especially but not limited to Chapter 10 (Arent etal., 2014).
Though the impact of climate change on the primary resource base
for fossil fuels is likely to be small (World Bank, 2011a), RE sources
can be particularly sensitive to climate change impacts. In general, any
impacts are expected to increase with the level of climate change, but
the nature and magnitude of these effects are technology-dependent
and somewhat uncertain, and they may vary substantially on regional
and local levels (IPCC, 2011a; Schaeffer etal., 2012; Arent etal., 2014).
The SRREN SPM (IPCC, 2011a, p.12), summarizes the available litera-
ture as follows:
“The future technical potential for bioenergy could be
influenced by climate change through impacts on biomass
production such as altered soil conditions, precipitation, crop
productivity, and other factors. The overall impact of a global
mean temperature change of less than 2 °C on the technical
potential of bioenergy is expected to be relatively small on a
global basis. However, considerable regional differences could
be expected and uncertainties are larger and more difficult to
assess compared to other RE options due to the large number
of feedback mechanisms involved. For solar energy, though cli-
mate change is expected to influence the distribution and vari-
ability of cloud cover, the impact of these changes on overall
technical potential is expected to be small. For hydropower the
overall impacts on the global technical potential is expected
to be slightly positive. However, results also indicate the pos-
sibility of substantial variations across regions and even within
countries. Research to date suggests that climate change is not
expected to greatly impact the global technical potential for
wind energy development but changes in the regional distribu-
tion of the wind energy resource may be expected. Climate
change is not anticipated to have significant impacts on the
size or geographic distribution of geothermal or ocean energy
resources.”

538538
Energy Systems
7
Chapter 7
A decline in renewable resource potential in one area could lead to
a shift in the location of electricity-generation technologies over time
to areas where the resource has not degraded. Long-lived transmis-
sion and other infrastructure built to accommodate these technolo-
gies, however, may be stranded. The longer lifetimes of hydropower
dams may mean that these facilities are also less adaptable to climate
changes such as changes in local precipitation; nonetheless, dams also
offer the opportunity for energy and water storage that may provide
climate-adaptation benefits (Kumar etal., 2011; Schaeffer etal., 2012).
Climate change may also impact the design and operation of energy
sourcing and delivery facilities (e. g., US DOE, 2013b). Offshore infra-
structure, including gas and oil wells but also certain RE facilities such
as offshore wind power plants, are vulnerable to extreme weather
events (Karl etal., 2009; Wiser etal., 2011; World Bank, 2011a; Rose
etal., 2012; Arent etal., 2014). Production losses from thermal power
plants (whether low- or high-carbon facilities) and efficiency losses
from energy-delivery infrastructures increase when temperatures
exceed standard design criteria (Schaeffer etal., 2012; Sathaye etal.,
2013). Some power-generation facilities will also be impacted by
changes in access to and the temperature of cooling water, while both
power-generation facilities and energy-delivery infrastructures can be
impacted by sea-level rise and extreme weather events (Kopytko and
Perkins, 2011; Schaeffer et al., 2012; Arent etal., 2014). Adaptation
strategies include infrastructure relocation and reinforcement, cooling-
facility retrofit, and proactive water-resource management (Rübbelke
and Vögele, 2011; Arent etal., 2014).
Finally, interdependencies between the energy supply sector and other
sectors of the economy are important to consider (de Lucena etal.,
2009). For example, if climate change detrimentally impacts crop
yields, bioenergy potential may decline and costs may rise because
more land is demanded for food crop production (Porter and Xie 2014;
11.13). Climate change may also exacerbate water and energy ten-
sions across sectors and regions, potentially impacting hydropower
(either positively or negatively, depending on whether the potential
climate-adaptation benefits of hydropower facilities are realized) and
other technologies that require water (Kumar etal., 2011; Arent etal.,
2014; Cisneros and Oki, 2014).
7.8 Costs and potentials
7�8�1 Potential emission reduction from miti-
gation measures
When assessing the potential of different mitigation opportunities, it is
important to evaluate the options from a lifecycle perspective to take
into account the emissions in the fuel chain and the manufacturing of
the energy conversion technology (Annex II.6.3). This section contains
a review of life-cycle GHG emissions associated with different energy
supply technologies per unit of final energy delivered, with a focus on
electricity generation (Figure 7.6).
The largest lifecycle GHG emissions are associated with the com-
bustion of coal. Lifecycle assessments reviewed in SRREN (IPCC,
2011a), showed a range of 675 – 1689 gCO
2
eq / kWh electricity. Cor-
responding ranges for oil and gas were 510 – 1170gCO
2
eq / kWh and
290 – 930 gCO
2
eq / kWh
14
. For the AR5, the performance of prospec-
tive new fossil fuel power plants was assessed, taking into account
a revised assessment of fugitive methane emission from coal min-
ing and natural gas supply (Section 7.5.1). According to this assess-
ment, modern-to-advanced hard coal power plants show a range of
710 – 950 gCO
2
eq / kWh, while natural gas combined-cycle plants have
emissions in the range of 410 – 650 gCO
2
eq / kWh, with high uncertainty
and variability associated with methane emissions from gas produc-
tion (Section 7.5.1; Annex II.6). Compared to a separate provision of
heat, cooling, and power from stand-alone fossil fuel-based facilities,
combined heat and power plants reduce emissions by one quarter
(Pehnt, 2008). The transformation pathways that achieve a stabiliza-
tion of the global temperature consistent with the Cancun Agreement
(Chapter 6, Section 7.11, Figure 7.9), however, are based on emissions
intensities approaching zero in the second half of the 21st century, so
that the employment of technologies with even lower emissions (than
the one mentioned for gas-fired power and combined heat and power
plants) is called for if these goals are to be achieved.
A number of power supply technologies offer very low lifecycle GHG
emissions (Figure 7.6). The use of CCS is expected to reduce GHG
emissions to 70 – 290 gCO
2
eq / kWh for coal (98 – 396gCO
2
eq / kWh in
SRREN). For gas power, the literature specifies 120 – 170 gCO
2
eq / kWh
assuming a leakage of 1 % of natural gas (Koornneef et al., 2008;
Singh et al., 2011; Corsten et al., 2013), while SRREN specified
65 – 245 gCO
2
eq / kWh. According to the literature, natural gas leakage
is between 0.8 % – 5.5 % (Burnham etal., 2012) (see Section 7.5.1 for
a discussion and more references), resulting in emissions between 90
and 370gCO
2
eq / kWh (Figure 7.6). Most of these assessments assume
that 90 % of the CO
2
in the flue gas is captured, while the remaining
emissions are mainly connected to the fuel chain. The upper range of
emissions for CCS-based power plants is flexible since plants can be
designed to capture less, something that results in lower cost and less
equipment required. (Figure 7.6).
Renewable heat and power generation and nuclear energy can
bring more significant reductions in GHG emissions. The informa-
tion provided here has been updated from the data provided in
SRREN, taking into account new findings and reviews, where avail-
able. The ranges of harmonized lifecycle greenhouse gas emissions
reported in the literature are 18 – 180 gCO
2
eq / kWh for PV (Kim etal.,
2012; Hsu etal., 2012), 9 – 63gCO
2
eq / kWh for CSP (Burkhardt etal.,
14
All reported SRREN numbers are from Table A.II.4 in Moomaw et al.(2011)
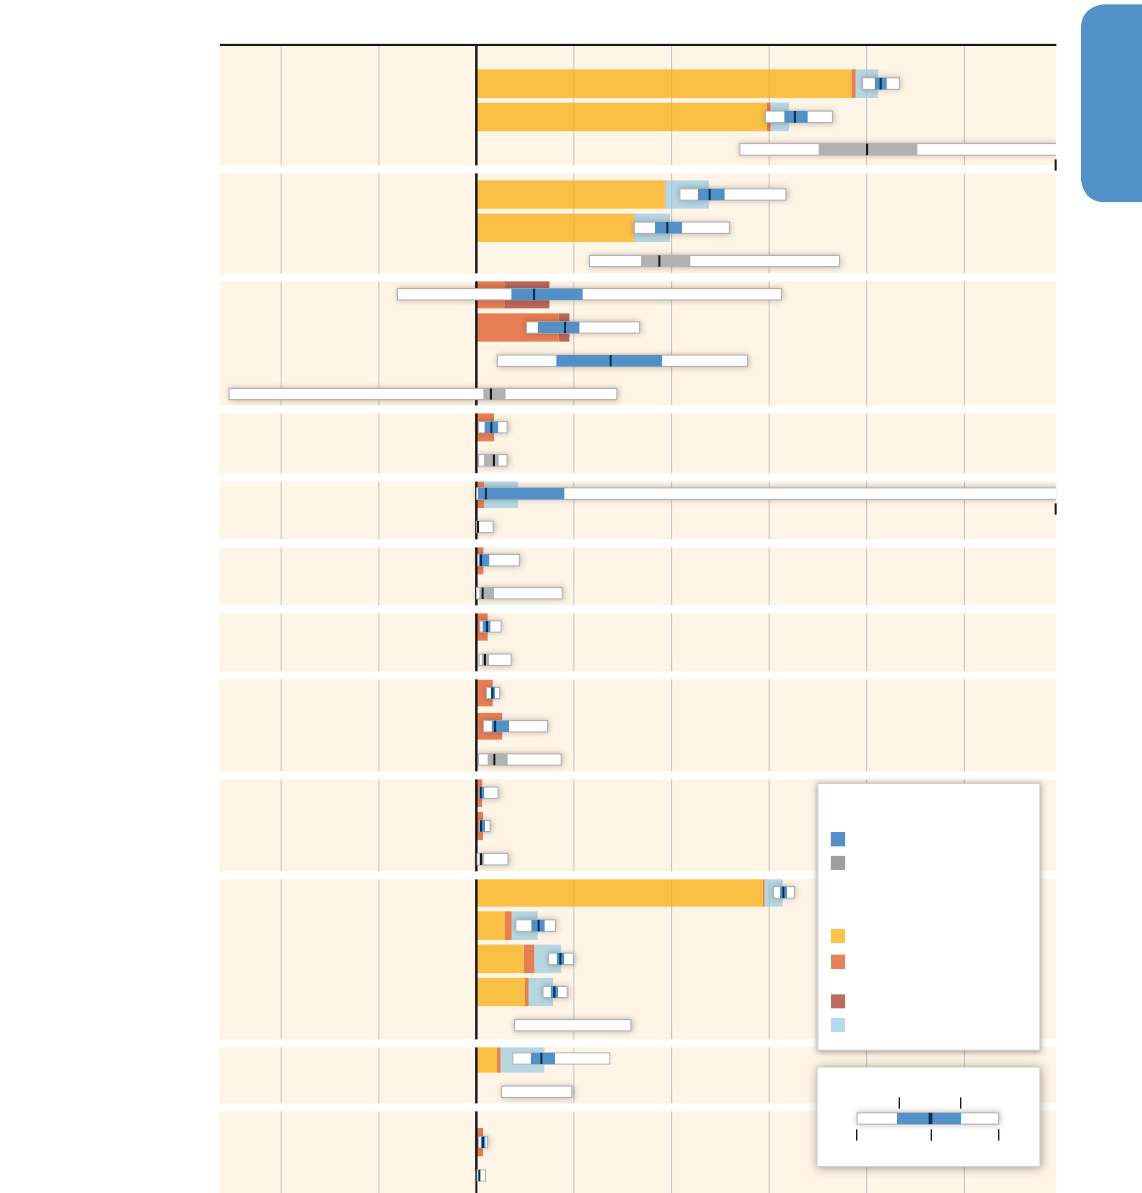
539539
Energy Systems
7
Chapter 7
⇒
Figure 7�6 | Comparative lifecycle greenhouse gas emissions from electricity supplied by commercially available technologies (fossil fuels, renewable, and nuclear power) and
projected emissions of future commercial plants of currently pre-commercial technologies (advanced fossil systems with CCS and ocean energy). The figure shows distributions of
lifecycle emissions (harmonization of literature values for WGIII AR5 and the full range of published values for SRREN for comparison) and typical contributions to lifecycle emis-
sions by source (cf. the notes below). Note that percentiles were displayed for RE and traditional coal and gas in the SRREN, but not for coal CCS and gas CCS. In the latter cases,
the entire range is therefore shown. For fossil technologies, fugitive emissions of methane from the fuel chain are the largest indirect contribution and hence shown separately. For
hydropower, the variation in biogenic methane emissions from project to project are the main cause of the large range. See also Annex II and Annex III.
2200
1700
-250-500 0 1250750250 500 1000
Emissions [gCO
2
eq/kWh]
Direct Emissions
Infrastructure and Supply
Chain Emissions
Biogenic CO
2
and Albedo
Methane
Typical Contributions to Lifecycle
Emissions by Source
Lifecycle Emissions as Estimated
in AR5 and SRREN
AR5
SRREN
Biomass - Dedicated & Crop Residues
Biogas - Corn and Manure
Biopower
Geothermal - Electricity
Geothermal - Electricity
Hydropower
Hydropower
Wind Onshore
Solar PV
Solar PV - Utility
Solar PV - Rooftop
Concentrated Solar Power
Concentrated Solar Power
Nuclear
Nuclear
CCS - Gas - Combined Cycle
CCS - Natural Gas
Ocean - Wave and Tidal
Ocean Energy
CCS - Coal
CCS - Coal - IGCC
CCS - Coal - PC
CCS - Coal - Oxyfuel
Coal - IGCC
Wind Energy
Wind Offshore
World Average Coal
Coal - PC
Coal
World Average Gas
Gas - Combined Cycle
Natural Gas
Biomass - Forest Wood
Minimum
75
th
percentile
Maximum Median
25
th
percentile

540540
Energy Systems
7
Chapter 7
2012), and 4 – 110 gCO
2
eq / kWh for nuclear power (Warner and
Heath, 2012). The harmonization has narrowed the ranges down
from 5 – 217 gCO
2
eq / kWh for PV, 7 – 89 gCO
2
eq / kWh for CSP, and
1 – 220 gCO
2
eq / kWh for nuclear energy. A new literature review for
wind power published since 2002 reports 7 – 56 gCO
2
eq / kWh, where
the upper part of the range is associated with smaller turbines (<100
kW) (Arvesen and Hertwich, 2012), compared to 2 – 81 gCO
2
eq / kWh
reported in SRREN. For all of these technologies, at least five studies are
reviewed. The empirical basis for estimating the emissions associated
with geothermal and ocean energy is much weaker. SRREN reported
6 – 79 gCO
2
eq / kWh for geothermal power and 2 – 23 gCO
2
eq / kWh
for ocean energy (IPCC, 2011a). For ocean power, Figure 7.6 shows
only the results of newer assessments, which range between
10 – 30 gCO
2
eq / kWh for tidal barrages, marine current turbines, and
wave power (Walker and Howell, 2011; Kelly etal., 2012). For RE, emis-
sions are mainly associated with the manufacturing and installation of
the power plants, but for nuclear power, uranium enrichment can be
significant (Warner and Heath, 2012). Generally, the ranges are quite
wide reflecting differences in local resource conditions, technology,
and methodological choices of the assessment. The lower end of esti-
mates often reflects incomplete systems while the higher end reflects
poor local conditions or outdated technology.
Lifecycle direct global climate impacts of bioenergy in Figure 7.6 come
from the peer-reviewed literature from 2010 to 2012 (reviewed in Sec-
tion11.13.4) and are based on a range of electric conversion efficien-
cies of 30 % – 50 %. The category ‘Biomass-dedicated and crop residues’
includes perennial grasses like switchgrass and miscanthus, short-rota-
tion species like willow and eucalyptus, and agricultural byproducts
like wheat straw and corn stover. ‘Biomass-forest wood’ refers to sus-
tainably harvested forest biomass from long-rotation species in various
climate regions. The range in ‘Biomass-forest wood’ is representative of
various forests and climates, e. g., aspen forest in Wisconsin (US), mixed
forest in Pacific Northwest (US), pine forest in Saskatchewan (Canada),
and spruce forest in Southeast Norway. Impacts from biogenic CO
2
and albedo are included in the same manner as the other GHGs, i. e.,
converted to gCO
2
eq after characterization of emissions from combus-
tion with case-specific GWPs (Cherubini etal., 2012). In areas affected
by seasonal snow cover, the cooling contribution from the temporary
change in surface albedo can be larger than the warming associated
with biogenic CO
2
fluxes and the bioenergy system can have a net neg-
ative impact (i. e., cooling). Change in soil organic carbon can have a
substantial influence on the overall GHG balance of bioenergy systems,
especially for the case ‘Biomass – dedicated and crop residues’, but are
not covered here due to their high dependence on local soil conditions
and previous land use (Don etal., 2012; Gelfand etal., 2013).
The climate effect of hydropower is very project-specific. Lifecycle
emissions from fossil fuel combustion and cement production related
to the construction and operation of hydropower stations reported in
the literature fall in the range of up to 40 gCO
2
eq / kWh for the stud-
ies reviewed in the SRREN (Kumar et al, 2011) and 3 – 7 gCO
2
eq / kWh
for studies reviewed in (Dones etal., 2007). Emissions of biogenic CH
4
result from the degradation of organic carbon primarily in hydropower
reservoirs (Tremblay etal., 2005; Barros etal., 2011; Demarty and Bas-
tien, 2011), although some reservoirs act as sinks (Chanudet et. al
2011). Few studies appraise net emissions from freshwater reservoirs,
i. e., adjusting for pre-existing natural sources and sinks and unrelated
anthropogenic sources (Kumar et al, 2011, Section 5.6.3.2). A recent
meta-analysis of 80 reservoirs indicates that CH
4
emission factors are
log-normally distributed, with the majority of measurements being
below 20 gCO
2
eq / kWh (Hertwich, 2013), but emissions of approxi-
mately 2 kgCO
2
eq / kWh coming from a few reservoirs with a large
area in relation to electricity production and thus low power inten-
sity (W / m
2
) (Abril etal., 2005; Kemenes etal., 2007, 2011). The global
average emission rate was estimated to be 70 gCO
2
eq / kWh (Maeck
etal., 2013; Hertwich, 2013). Due to the high variability among power
stations, the average emissions rate is not suitable for the estimation
of emissions of individual countries or projects. Ideas for mitigating
existing methane emissions have been presented (Ramos etal., 2009;
Stolaroff etal., 2012).
The literature reviewed in this section shows that a range of technol-
ogies can provide electricity with less than 5 % of the lifecycle GHG
emissions of coal power: wind, solar, nuclear, and hydropower in suit-
able locations. In the future, further reductions of lifecycle emissions on
these technologies could be attained through performance improve-
ments (Caduff etal., 2012; Dale and Benson, 2013) and as a result
of a cleaner energy supply in the manufacturing of the technologies
(Arvesen and Hertwich, 2011).
Abbreviations: AR5 — IPCC WG III Fifth Assessment Report, CCS — CO
2
capture and storage, IGCC — integrated coal gasification combined cycle, PC — pulverized hard coal,
PV — photovoltaic, SRREN — IPCC Special Report on Renewable Energy Sources and Climate Change Mitigation. Sources: SRREN (IPCC, 2011a), Wind (Arvesen and Hertwich,
2012), PV (Kim etal., 2012; Hsu etal., 2012), CSP (Burkhardt etal., 2012), ocean and wave (Walker and Howell, 2011; Kelly etal., 2012), geothermal power (Sathaye etal., 2011),
hydropower (Sathaye etal., 2011; Hertwich, 2013), nuclear power (Warner and Heath, 2012), bioenergy (Cherubini etal., 2012).
Notes: Harmonized values have been used where available and the mean values of the typical contributions are shown for the set of those cases where the data base allowed the
separation. For world average coal and gas, the uncertainty range represents the uncertainty in the mean; the range of the uncerlying distribution is much larger. For the fossil fuel
technologies, all fugitive methane emissions were calculated based on the range provided by (Burnham etal., 2012), infrastructure and supplies are based on (Singh etal., 2011),
and direct emissions are based on (Singh etal., 2011; Corsten etal., 2013). For bioenergy, ranges include global climate impacts of CO
2
emissions from combustion of regenerative
biomass (i. e., biogenic CO
2
) and the associated changes in surface albedo following ecosystem disturbances, quantified according to the IPCC framework for emission metrics (see
the 4th IPCC Assessment Report, (Forster etal., 2007)) and using global warming potentials (GWP) with TH = 100 years as characterization factors (Cherubini etal., 2012; Section
11.13.4). These impacts are site-specific and generally more significant for long rotation species. The category ‘Biogas’ includes cases where manure, dedicated crops (e. g., maize),
or a mixture of both are used as feedstocks. In addition to the variability in the substrates, the large range in the results reflects different degrees of CH
4
emissions from leakage and
digestate storage, with the latter that can be reduced in closed storage systems (Boulamanti etal., 2013). No contribution analysis was available for this category. For methodologi-
cal issues, see Annex II.6 and Section 11.13.4, for a discussion of the data sources see Annex II.9.3. The numbers are presented in Table A.III.2.
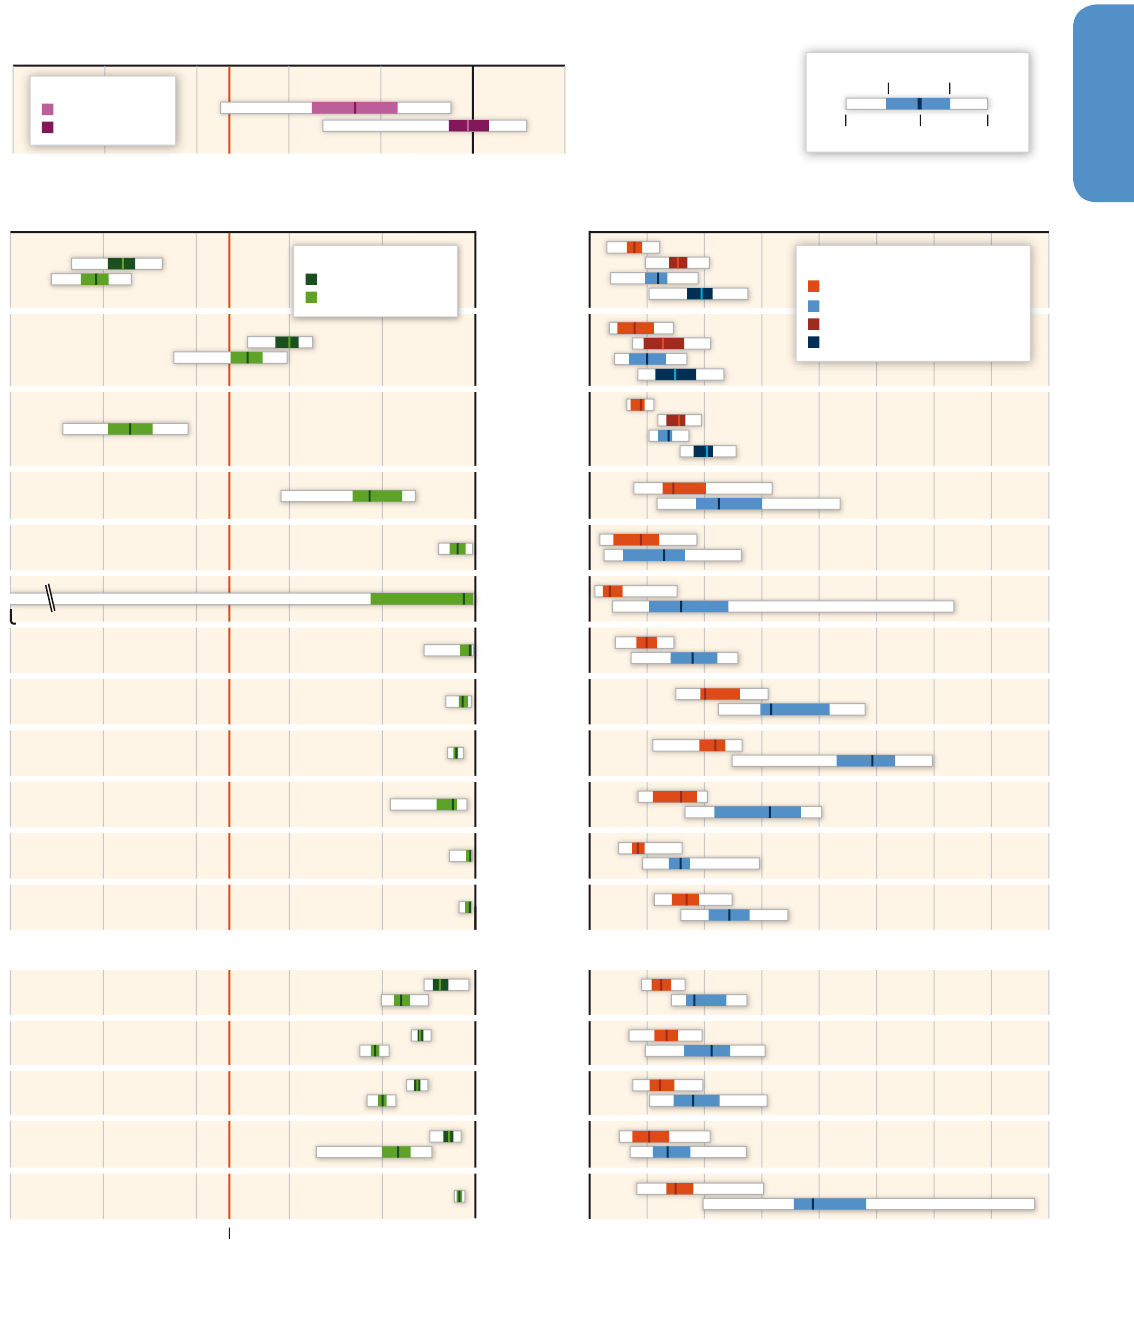
541541
Energy Systems
7
Chapter 7
Global Average Direct Emission Intensity, 2010
Emission Intensity of Electricity [gCO
2
/kWh]
Emission Intensity of Electricity [gCO
2
eq/kWh]
Levelized Cost of Electricity at 10% Weighted Average Cost of Capital (WACC) [USD
2010
/MWh]
Pre-commercial Technologies
0 -2002004006008001000
0200 0 100 200 300 400 500 600 700 8004006008001000
Scenarios Reaching 430-530 ppm CO
2
eq in 2100 in Integrated Models
Currently Commercially Available Technologies
High Full Load Hours
Low Full Load Hours
High Full Load Hours, 100 USD
2010
/tCO
2
eq*
Low Full Load Hours, 100 USD
2010
/tCO
2
eq*
Conditions of Operation
Direct Emissions
Lifecycle Emissions
Emission Intensity Based on:
Global Average, 2030
Global Average, 2050
Direct Emission Intensity
2200
1
Assuming biomass feedstocks are dedicated energy plants and crop residues and 80-95% coal input.
2
Assuming feedstocks are dedicated energy plants and crop residues.
*
Carbon price levied on direct emissions. Effects shown where significant.
3
Direct emissions of biomass power plants are not shown explicitly, but included in the lifecycle
emissions. Lifecycle emissions include albedo effect.
4
LCOE of nuclear include front and back-end fuel costs as well as decommissioning costs.
5
Transport and storage costs of CCS are set to 10 USD
2010
/tCO
2
.
Coal - PC
Gas -
Combined Cycle
Biomass
Cofiring
1,3
Biomass
Dedicated
2,3
Geothermal -
Electricity
Hydropower
Nuclear
4
Concentrated
Solar Power
Solar PV -
Rooftop
Solar PV -
Utility
Wind Onshore
Wind Offshore
CCS - Coal
- Oxyfuel
5
CCS - Coal - PC
5
CCS - Coal - IGCC
5
CCS - Gas -
Combined Cycle
5
Ocean -
Wave & Tidal
Minimum
75
th
percentile
Maximum Median
25
th
percentile
⇒

542542
Energy Systems
7
Chapter 7
7�8�2 Cost assessment of mitigation measures
Though there are limits to its use as a tool for comparing the com-
petitiveness of energy supply technologies, the concept of ‘levelized
costs of energy’ (LCOE, also called levelized unit costs or levelized gen-
eration costs)
15
is frequently applied (IEA, 2005, 2010b, 2011a; GEA,
2012).
Figure 7.7 shows a current assessment of the private cost
16
of various
low-carbon power supply technologies in comparison to their conven-
tional counterparts.
The LCOE ranges are broad as values vary across the globe depend-
ing on the site-specific (renewable) energy resource base, on local fuel
and feedstock prices as well as on country and site-specific projected
costs of investment, and operation and maintenance. Investment
decisions therefore should not be based on the LCOE data provided
here; instead, site-, project-, and investor-specific conditions are to be
considered. Integration costs, time-dependent revenue opportunities
(especially in the case of intermittent renewables), and relative envi-
ronmental impacts (e. g., external costs) play an important role as well
(Heptonstall, 2007; Fischedick etal., 2011; Joskow, 2011; Borenstein,
2012; Edenhofer etal., 2013; Hirth, 2013).
The LCOE of many low-carbon technologies changed considerably
since the release of the AR4. Even compared to the numbers published
in the SRREN (IPCC, 2011a), the decline of LCOE of some RE technolo-
gies have been significant.
17
The LCOE of (crystalline silicon) photovol-
taic systems, for instance, fell by 57 % since 2009. Compared to PV, a
similar, albeit less-extreme trend towards lower LCOE (from the second
quarter of 2009 to the first quarter of 2013) has been observed for
onshore wind (– 15 %), land-fill gas (– 16 %), municipal solid waste
(– 15 %), and biomass gasification (– 26 %) (BNEF and Frankfurt
School-UNEP Centre, 2013).
15
A basic description of this concept, including its merits and shortcomings, can be
found in Annex II of this report.
16
Beyond variations in carbon prices, additional external costs are not considered in
the following. Although the term ‘private’ will be omitted in the remainder of this
section, the reader should be aware that all costs discussed here are private costs.
An extended discussion of external costs is given in Fischedick et al., (2011).
17
The subsequent percent values in LCOE data refer to changes between the second
quarter (Q2) of 2009 and the first quarter (Q1) of 2013 (BNEF and Frankfurt
School-UNEP Centre, 2013). Although the SRREN was published in 2011, the cost
data base used there refers to 2009.
Due to their rapid cost decline, some RE sources have become an eco-
nomical solution for energy supply in an increasing number of coun-
tries (IRENA, 2013). Under favourable conditions (see Figure 7.7),
large-scale hydropower (IEA, 2008b), larger geothermal projects
(>30MWe) (IEA, 2007), and wind onshore power plants (IEA, 2010c)
are already competitive. The same is true for selected off-grid PV appli-
cations (IEA, 2010d, 2011b). As emphasized by the SRREN (2011a) and
IEA (IEA, 2008b, 2011b, 2012h) support policies, however, are still nec-
essary in order to promote the deployment of many RE in most regions
of the world.
Continuous cost reductions are not always a given (see BNEF and
Frankfurt School-UNEP Centre, 2013), as illustrated by the recent
increase in costs of offshore wind (+44 %) and technologies in an
early stage of their development (marine wave and tidal, binary
plant geothermal systems). This however, does not necessarily imply
that technological learning has stopped. As observed for PV and
wind onshore (see SRREN, IPCC, 2011a), phases characterized by an
increase of the price might be followed by a subsequent decline, if,
for instance, a shortage of input material is eliminated or a ‘shake
out’ due to increasing supplier competition is happening (Junginger
et al., 2005, 2010). In contrast, a production overcapacity as cur-
rently observed in the PV market might result in system prices that
are temporarily below production costs (IEA, 2013a). A critical dis-
cussion of the solar photovoltaic grid-parity issue can be found in
IEA (2013b).
While nuclear power plants, which are capable of delivering base-
load electrical energy with low lifecycle emissions, have low oper-
ating costs (NEA, 2011b), investments in nuclear power are char-
acterized by very large up-front investment costs, and significant
technical, market, and regulatory risks (IEA, 2011a). Potential project
and financial risks are illustrated by the significant time and cost
over-runs of the two novel European Pressurized Reactors (EPR) in
Finland and France (Kessides, 2012). Without support from govern-
ments, investments in new nuclear power plants are currently gen-
erally not economically attractive within liberalized markets, which
have access to relatively cheap coal and / or gas (IEA, 2012b). Carbon
pricing could improve the competitiveness of nuclear power plants
(NEA, 2011b). The post Fukushima assessment of the economics
and future fate of nuclear power is mixed. According to the IEA, the
economic performance and future prospects of nuclear power might
be significantly affected (IEA, 2011a, 2012b). Joskow and Parsons
(2012) assesses that the effect will be quite modest at the global
level, albeit based on a pre-Fukushima baseline evolution, which is a
moderate one itself.
Figure 7�7 | Specific direct and lifecycle emissions (gCO
2
eq / kWh) and levelized cost of electricity (LCOE in USD
2010
/ MWh) for various power-generating technologies (cf. Figure 7.6
for lifecycle; Annex III, Section A.III.2 for data and assumptions and Annex II, Section A.II.3.1 and Section A.II.9.3 for methodological issues). The upper left graph shows global aver-
ages of specific direct CO
2
emissions (gCO
2
/ kWh) of power generation in 2030 and 2050 for the set of 430 – 530 ppm scenarios that are contained in the AR5 database (cf. Annex II,
Section A.II.10). The global average of specific direct CO
2
emissions (gCO
2
/ kWh) of power generation in 2010 is shown as a vertical line (IEA, 2013a).
Note: The inter-comparability of LCOE is limited. For details on general methodological issues and interpretation see Annexes as mentioned above.

543543
Energy Systems
7
Chapter 7
As there is still no commercial large-scale CCS power plant in opera-
tion today, the estimation of their projected costs has to be carried on
the basis of design studies and few existing pilot projects. The associ-
ated problems are described in (Yeh and Rubin, 2010; Global CCS Insti-
tute, 2011; Rubin, 2012). The CCS technologies applied in the power
sector will only become competitive with unabated technologies if the
additional equipment attached to the power plant and their decreased
efficiency as well as the additional cost for CO
2
transport and stor-
age is compensated by sufficiently high carbon prices or direct finan-
cial support (Lohwasser and Madlener, 2011; IEA, 2013c). BECCS faces
large challenges in financing and currently no such plants have been
built and tested at scale (see Section 7.5.5).
The deployment of CCS requires infrastructure for long-term storage of
waste products, which includes direct CO
2
transport and storage costs,
along with costs associated with long-term measurement, monitoring,
and verification. The related cost of transport and storage (excluding
capture costs) are unlikely to exceed USD 15 / tCO
2
for the majority of
CCS deployment scenarios (Herzog et al., 2005; Herzog, 2011; ZEP,
2011b) and some estimates are below USD 5 / tCO
2
(McCoy and Rubin,
2008; Dahowski etal., 2011). Figure 7.7 relies on an assumed cost of
USD 10 / tCO
2
.
System integration costs (cf. Section7.6.1, and not included in Figure
7.7) typically increase with the level of deployment and are depen-
dent on the mitigation technology and the state of the background
energy system. From the available evidence, these costs appear to
be greater for variable renewable technologies than they are for dis-
patchable power plants (Hirth, 2013). The costs comprise (1) balancing
costs (originating from the required flexibility to maintain a balance
between supply and demand), (2) capacity adequacy costs (due to the
need to ensure operation even at peak times of the residual load), and
(3) transmission and distribution costs.
(1) Based on assessments carried out for OECD countries, the provision
of additional balancing reserves increases the system costs of wind
energy by approximately USD 1 to 7 / MWh for wind energy market
shares of up to approximately 30 % of annual electricity demand (IEA,
2010e, 2011d; Wiser et al., 2011; Holttinen et al., 2011). Balancing
costs for PV are in a similar range (Hoke and Komor, 2012).
(2) As described in Section7.6.1, the contribution of variable renew-
ables like wind, solar, and tidal energy to meeting peak demand is less
than the resources’ nameplate capacity. Still, determining the cost of
additional conventional capacity needed to ensure that peak demands
are met is contentious (Sims etal., 2011). Estimates of this cost for
wind power range from USD 0 to 10 / MWh (IEA, 2010e, 2011d; Wiser
etal., 2011). Because of the coincidence of solar generation with air-
conditioning loads, solar at low-penetration levels can in some regions
displace a larger amount of capacity, per unit of energy generated,
than other supply options, yielding estimates of infrastructure savings
as high as USD 23 / MWh greater than the savings from baseload sup-
ply options (Mills etal., 2011).
(3) Estimates of the additional cost of transmission infrastructure
for wind energy in OECD countries are often in the range of USD 0
to 15 / MWh, depending on the amount of wind energy supply, region,
and study assumptions (IEA, 2010e, 2011d; Wiser etal., 2011; Holt-
tinen etal., 2011). Infrastructure costs are generally higher for time-
variable and location-dependent RE, at least when developed as large
centralized plants, than for other sources of energy supply (e. g., Sims
etal., 2007; Hoogwijk etal., 2007; Delucchi and Jacobson, 2011). If
mitigation technologies can be deployed near demand centres within
the distribution network, or used to serve isolated autonomous sys-
tems (e. g., in less developed countries), such deployments may defer
or avoid the need for additional transmission and distribution, poten-
tially reducing infrastructure costs relative to a BAU scenario.
18
7�8�3 Economic potentials of mitigation
measures
Quantifying the economic potential of major GHG-mitigation options
is problematic due to the definition of welfare metrics, broader impacts
throughout the energy-economic system, and the background energy
system carbon intensity, and energy prices (see Sections 3.4.3 and
3.7.1 for a general discussion). Three major approaches to reveal the
economic potentials of mitigation measures are discussed in the lit-
erature:
One approach is to use energy supply cost curves, which summarize
energy resource estimates (GEA, 2012) into a production cost curve on
an annual or cumulative basis. Uncertainties associated with energy
cost curves include the relationship between confirmed reserves and
speculative resources, the impact of unconventional sources of fuels,
future technological change and energy market structures, discount-
ing, physical conditions (e. g., wind speeds), scenarios (e. g., land-use
tradeoffs in energy vs. food production) and the uneven data avail-
ability on global energy resources. Illustrative renewable resource cost
curves are discussed in Section 10.4 and Figure 10.29 of Fischedick
etal., (2011).
A second and broader approach are marginal abatement cost (MAC)
curves. The MAC curves (discussed in Section 3.9.3) discretely rank
mitigation measures according to their GHG emission abatement cost
(in USD / tCO
2
) for a given amount of emission reduction (in million
tCO
2
). The MAC curves have become a standard policy communica-
tion tool in assessing cost-effective emissions reductions (Kesicki and
Ekins, 2011). There is wide heterogeneity (discussed in detail in Sec-
tion3.9.3) in the method of construction, the use of experts vs. mod-
els, and the year / region to which the MAC is applied. Recent global
18
The ability for distributed resources to defer distribution investments depends
on the correlation of the generation profile and load, as well as on location-
specific factors (Mendez et al., 2006; Thomson and Infield, 2007; Hernández et
al., 2008; Wang et al., 2010; Agah and Abyaneh, 2011). At higher penetrations of
distributed generation, additional distribution infrastructure may be required (e. g.,
Cossent et al., 2011).

544544
Energy Systems
7
Chapter 7
MAC curve studies (van Vuuren etal., 2004; IEA, 2008c; Clapp etal.,
2009; Nauclér and Enkvist, 2009) give overall mitigation potentials
ranging from 20 – 100 % of the baseline for costs up to USD 100 / tCO
2
.
These MACs can be a useful summary mechanism but improved treat-
ment of interactions between mitigation measures and the path-
dependency of potential cost reductions due to technological learning
(e. g., Luderer etal., 2012), as well as more sophisticated modelling of
interactions throughout the energy systems and wider economy are
required.
A third approach — utilized in the AR5 — overcomes these shortcom-
ings through integrated modelling exercises in order to calculate the
economic potential of specific supply-side mitigation options. These
models are able to determine the economic potential of single options
within the context of (other) competing supply-side and demand-side
mitigation options by taking their interaction and potential endog-
enous learning effects into account. The results obtained in this way
are discussed in Chapter 6; the different deployment paths of various
supply-side mitigation options as part of least-cost climate protection
strategies are shown in Section 7.11.
7.9 Co-benefits, risks
and spillovers
Besides economic cost aspects, the final deployment of mitigation
measures will depend on a variety of additional factors, including syn-
ergies and tradeoffs across mitigation and other policy objectives. The
implementation of mitigation policies and measures can have positive
or negative effects on these other objectives – and vice versa. To the
extent these side-effects are positive, they can be deemed ‘co-bene-
fits’; if adverse and uncertain, they imply risks.
19
Co-benefits, adverse side effects, technical risks and uncertainties
associated with alternative mitigation measures and their reliability
(Sections 7.9.1 – 7.9.3) as well as public perception thereof (Section
7.9.4) can affect investment decisions, individual behaviour as well
as priority setting of policymakers. Table 7.3 provides an overview of
the potential co-benefits and adverse side effects of the main mitiga-
tion measures that are assessed in this chapter. In accordance with the
three sustainable development pillars described in Chapter 4, the table
19
Co-benefits and adverse side-effects describe effects in non-monetary units
without yet evaluating the net effect on overall social welfare. Please refer to the
respective Sections in the framing chapters as well as to the glossary in Annex I
for concepts and definitions – particularly Sections 2.4, 3.6.3, and 4.8. The extent
to which co-benefits and adverse side-effects will materialize in practice as well as
their net effect on social welfare will differ greatly across regions, and depend on
local circumstances, implementation practices, as well as the scale and pace of the
deployment of the different measures.
presents effects on objectives that may be economic, social, environ-
mental, and health-related.
7�9�1 Socio-economic effects
There is an increasing body of work showing that the implementation
of energy mitigation options can lead to a range of socio-economic
co-benefits for, e. g., employment, energy security, and better access
to energy services in rural areas (Shrestha and Pradhan, 2010; IPCC,
2011a; UNEP, 2011).
Employment� Analysis by Cai etal. (2011) shows that as a result of the
increased share of renewable energy in China, the power sector regis-
tered 472,000 net job gains in 2010. For the same amount of power
generated, solar PV requires as many as 18 and 7 times more jobs than
nuclear and wind, respectively. Using conservative assumptions on
local content of manufacturing activities, van der Zwaan etal. (2013)
show that renewable sources of power generation could account for
about 155,000 direct and 115,000 indirect jobs in the Middle East by
2050. Examples of Germany and Spain are also noteworthy where 500
to 600 thousand people could be employed in the renewable energy
supply sector in each country by 2030 (Lehr etal., 2012; Ruiz-Romero
etal., 2012) while the net effect is less clear. Wei etal. (2010) also
found that over 4 million full-time jobs could be created by 2030 from
the combined effect of implementing aggressive energy-efficiency
measures coupled with meeting a 30 % renewable energy target. An
additional 500,000 jobs could be generated by increasing the share
of nuclear power to 25 % and CCS to 10 % of overall total generation
capacity. In line with these trends, Kenley etal. (2009) show that add-
ing 50,000 megawatts by 2020 of new nuclear generating capacity in
the United States would lead to 117,000 new jobs, 250,000 indirect
jobs, and an additional 242,000 non-nuclear induced jobs. Relating
to CCS, although development in this sector could deliver additional
employment (Yuan and Lyon, 2012; Bezdek and Wendling, 2013), safe-
guarding jobs in the fossil-based industry is expected to be the main
employment co-benefit (Frankhauser etal., 2008). Whilst recognizing
the growing contribution of mitigation options for employment, some
sobering studies have highlighted that this potentially carries a high
cost. In the PV sector in Germany, for example, the cost per job created
can be as high as USD
2010
236,000 (€175,000 in 2008) (Frondel etal.,
2010), underlining that continued employment and welfare gains will
remain dependent on the level and availability of support and financ-
ing mechanisms (Alvarez etal., 2010; Furchtgott-Roth, 2012; Böhringer
etal., 2013). Furthermore, given the higher cost of electricity genera-
tion from RE and CCS-based fossil fuels, at least in the short-term,
jobs in energy-intensive economic sectors are expected to be affected
(Delina and Diesendorf, 2013). The structure of the economy and wage
levels will nonetheless influence the extent of industry restructuring
and its impact of labour redeployment.
Energy security� As discussed in Section 6.6.2.2, energy security can
generally be understood as “low vulnerability of vital energy systems”

545545
Energy Systems
7
Chapter 7
Table 7�3 | Overview of potential co-benefits (green arrows) and adverse side-effects (orange arrows) of the main mitigation measures in the energy supply sector. Arrows pointing
up / down denote positive / negative effect on the respective objective / concern; a question mark (?) denotes an uncertain net effect. Please refer to Sections 11.7 and 11.13.6 for
possible upstream effects of biomass supply on additional objectives. Co-benefits and adverse side-effects depend on local circumstances as well as on the implementation practice,
pace, and scale (see Section 6.6). For an assessment of macroeconomic, cross-sectoral effects associated with mitigation policies (e. g., on energy prices, consumption, growth, and
trade), see Sections 3.9, 6.3.6, 13.2.2.3, and 14.4.2. Numbers correspond to references listed below the table.
Mitigation
measures
Effect on additional objectives / concerns
Economic Social (including health) Environmental Other
Nuclear
replacing coal
power
↑
↑
↑
Energy security (reduced exposure to fuel
price volatility)
1
Local employment impact (but uncertain
net effect)
2
Legacy cost of waste and abandoned
reactors
3
↓
↑
↑
Health impact via
Air pollution
4
and coal-mining accidents
5
Nuclear accidents
6
and waste treatment,
uranium mining and milling
7
Safety and waste concerns
8
↓
↑
Ecosystem impact via
Air pollution
9
and coal mining
10
Nuclear accidents
11
Proliferation risk
12
RE (wind, PV,
CSP, hydro,
geothermal,
bioenergy)
replacing coal
↑
↑
↑
↑
Energy security (resource sufficiency,
diversity in the near / medium term)
13
Local employment impact (but uncertain
net effect)
14
Irrigation, flood control, navigation, water
availability (for multipurpose use of
reservoirs and regulated rivers)
15
Extra measures to match demand (for PV,
wind, and some CSP)
16
↓
↓
↑
?
↑
Health impact via
Air pollution (except bioenergy)
17
Coal-mining accidents
18
Contribution to (off-grid) energy access
19
Project-specific public acceptance concerns
(e. g., visibility of wind)
20
Threat of displacement (for large hydro)
21
↓
↓
↑
↑
↓
↑
Ecosystem impact via
Air pollution (except bioenergy)
22
Coal mining
23
Habitat impacts (for some hydro)
24
Landscape and wildlife impact (for
wind)
25
Water use (for wind and PV)
26
Water use (for bioenergy, CSP, geo-
thermal, and reservoir hydro)
27
Higher use of
critical metals
for PV and
direct drive wind
turbines
28
Fossil CCS
replacing coal
↑↑
Preservation vs. lock-in of human and
physical capital in the fossil industry
29
↑
↑
↑
Health impact via
Risk of CO
2
leakage
30
Upstream supply-chain activities
31
Safety concerns (CO
2
storage and
transport)
32
↑
↑
Ecosystem impact via upstream
supply-chain activities
33
Water use
34
Long-term
monitoring of CO
2
storage
35
BECCS replacing
coal
See fossil CCS where applicable. For possible upstream effect of biomass supply, see Sections 11.7 and 11.13.6
Methane
leakage
prevention,
capture, or
treatment
↑
Energy security (potential to use gas in
some cases)
36
↑
↓
Occupational safety at coal mines
37
Health impact via reduced air pollution
38
↓
Ecosystem impact via reduced air
pollution
39
References:
1
Adamantiades and Kessides (2009); Rogner (2010, 2012a; b). For the low share of fuel expenditures in LCOE, see IAEA (2008b) and Annex III. For the energy security
effects of a general increase in nuclear power, see NEA (2010) and Jewell (2011a).
2
Cai etal. (2011); Wei etal. (2010); Kenley etal. (2009); McMillen etal. (2011).
3
Marra and Palmer
(2011); Greenberg, (2013a); Schwenk-Ferrero (2013a); Skipperud etal. (2013); Tyler etal. (2013a).
4
Smith and Haigler (2008); Smith etal. (2012b); Smith etal. (2013); Gohlke etal.
(2011); Rückerl etal. (2011), and WGII Section 11.9 on health impacts from air pollution attributable to coal; Solli etal. (2006); Dones etal. (2007); Dones etal. (2005); Simons and
Bauer (2012) on air pollution attributable to nuclear; see Section 7.9.2 for comparison.
5
See Section 7.9.3 and references cited therein: Epstein etal. (2010); Burgherr etal. (2012);
Chen etal. (2012); Chan and Griffiths (2010); Asfaw etal. (2013).
6
See Section 7.9.3, in particular Cardis etal. (2006); Balonov etal. (2011); Moomaw etal. (2011a); WHO (2013).
7
Abdelouas (2006); Al-Zoughool and Kewski (2009) cited in Sathaye etal. (2011a); Smith etal. (2013); Schnelzer etal. (2010); Tirmarche (2012); Brugge and Buchner (2011).
8
Visschers
and Siegrist (2012); Greenberg (2013a); Kim etal. (2013); Visschers and Siegrist (2012); see Section 7.9.4 and references cited therein: Bickerstaff etal. (2008); Sjoberg and Drottz-Sjo-
berg (2009); Corner etal. (2011); Ahearne (2011).
9
Simons and Bauer (2012) for comparison of nuclear and coal. See Section 7.9.2 and references cited therein for ecological impacts
of coal: Galloway etal. (2008); Doney (2010); Hertwich etal. (2010); Rockstrom etal. (2009); van Grinsven etal. (2013) for eutrophication and acidification; Emberson etal. (2012);
van Geothem etal. (2013) for photooxidants; IEA (2011a); Pacyna etal. (2007) for increased metal emissions; and Nagajyoti etal. (2010); Sevcikova etal. (2011); Mahboob (2013)
for the ecosystem effects of those emissions.
10
Adibee etal. (2013); Cormier etal. (2013); Smith etal. (2013), and reference cited therein: Palmer etal. (2010).
11
Møller etal. (2012);
Hiyama etal. (2013); Mousseau and Møller (2013); Møller and Mousseau (2011); Møller etal. (2011).
12
von Hippel etal. (2011, 2012); Sagan (2011); Yim and Li (2013); Adamantiades
and Kessides (2009); Rogner (2010).
13
Sathaye etal. (2011); McCollum etal. (2013b); Jewell etal. (2014); Cherp etal. (2013).
14
van der Zwaan etal. (2013); Cai etal. (2011); Lehr
etal. (2012); Ruiz-Romero etal. (2012); Böhringer etal. (2013); Sathaye etal. (2011), and references cited therein, e. g., Frondel etal. (2010) and Barbier (2009).
15
Kumar et al. (2011);
Schaeffer et al. (2012); Smith etal. (2013); WCD (2000) and Moore etal. (2010), cited in Sathaye etal. (2011a).
16
IEA (2011d); Williams etal. (2012); Sims etal. (2011); Holttinen etal.
(2011); Rasmussen etal. (2012).
17
Sathaye etal. (2011); Smith, GEA (2012); Smith etal. (2013); Figure 7.8, Annex II and references cited therein.
18
Section 7.9.3, especially Moomaw
etal. (2011a); Chen etal. (2012); Burgherr etal. (2012).
19
Pachauri etal. (2012); Sathaye etal. (2011); Kanagawa and Nakata (2008); Bazilian etal. (2012); Sokona etal. (2012); Byrne
etal. (2007); D’Agostino etal. (2011); Pachauri etal. (2012); Díaz etal. (2013); van der Vleuten etal. (2013); Nguyen, (2007); Narula etal. (2012); Sudhakara-Reddy etal. (2009).
20
Lovich and Ennen (2013); Sathaye etal. (2011); Wiser etal. (2011).
21
Bao (2010); Scudder (2005); Kumar etal. (2011); Sathaye etal. (2011a) and references cited therein: Richter
etal. (2010); Smith etal. (2013) and references cited therein: Hwang etal. (2011); McDonald-Wilmsen and Webber (2010); Finley-Brook and Thomas (2010).
22
See Section 7.9.2 and
references cited therein for ecological impacts of coal: Galloway etal., (2008); Doney, (2010); Hertwich etal., (2010); Rockstrom etal. (2009); van Grinsven (2013) for eutrophication
⇒

546546
Energy Systems
7
Chapter 7
(Cherp etal., 2012). Energy security concerns can be grouped as (1)
the sufficiency of resources to meet national energy demand at com-
petitive and stable prices, and (2) the resilience of the energy supply.
20
Since vital energy systems and their vulnerabilities differ from one
country to another, the concept of energy security also differs between
countries (Chester, 2009; Cherp and Jewell, 2011; Winzer, 2012). Coun-
tries with a high share of energy imports in total imports (or export
earnings) are relatively more vulnerable to price fluctuations and his-
torically have focused on curtailing energy imports (GNESD, 2010; Jain,
2010; Sathaye etal., 2011), but more recently, also building the resil-
ience of energy supply (IEA, 2011a; Jewell, 2011b). For energy import-
ers, climate policies can increase the sufficiency of national energy
demand by decreasing imports and energy intensity while at the
same time increasing the domestic resource buffer and the diversity of
energy supply (Turton and Barreto, 2006; Costantini etal., 2007; Kruyt
etal., 2009; McCollum etal., 2013a; Jewell etal., 2014). Energy-export-
ing countries are similarly interested in stable and competitive global
prices, but they have the opposite interest of maintaining or increasing
energy export revenues (Sathaye etal., 2011; Cherp and Jewell, 2011).
There is uncertainty over how climate policies would impact energy
export revenues and volumes as discussed in Section6.3.6.6. One of
the biggest energy security issues facing developing countries is the
necessity to dramatically expand energy systems to support economic
growth and development (Kuik etal., 2011; Cherp etal., 2012), which
makes energy security in low- and middle-income countries closely
related to the energy-access challenge, discussed in the next para-
graphs and in Section 6.6.2.3.
Rural development� In various developing countries such as India,
Nepal, Brazil, and parts of Africa, especially in remote and rural areas,
some renewables are already cost-competitive options for increas-
ing energy access (Nguyen, 2007; Goldemberg etal., 2008; Cherian,
2009; Sudhakara Reddy etal., 2009; Walter etal., 2011; Narula etal.,
2012). Educational benefits as a function of rural electrification
(Kanagawa and Nakata, 2008), and enhanced support for the produc-
20
These dimensions are roughly in line with the treatment of energy security in the
SRREN albeit with terminology based on recent literature – along the lines of the
sovereignty and robustness perspectives on the one hand and resilience on the
other described by Cherp and Jewell (2011). It is also very similar to the IEA’s dis-
tinction between energy system risks and resilience capacities (IEA, 2011a; Jewell,
2011b).
tive sector and income generation opportunities (Bazilian etal., 2012;
Sokona, Y. etal., 2012; Pachauri etal., 2013) are some of the impor-
tant co-benefits of some mitigation options. However, the co-benefits
may not be evenly distributed within countries and local jurisdictions.
While there is a regressive impact of higher energy prices in devel-
oped countries (Grainger and Kolstad, 2010), the empirical evidence
is more mixed for developing countries (Jakob and Steckel, 2013). The
impact depends on the type of fuel used by different income groups,
the redistribution of the revenues through, e. g., a carbon tax, and
in what way pro-poor measures are able to mitigate adverse effects
(Casillas and Kammen, 2010) (see Section 15.5.2.3 for a discussion of
the distributional incidence of fuel taxes). Hence, regulators need to
pay attention that the distributive impacts of higher prices for low-
carbon electricity (fuel) do not become a burden on low-income rural
households (Rao, 2013). The success of energy access programmes
will be measured against affordability and reliability criteria for the
poor.
Other positive spillover effects from implementation of renewable
energy options include technology trade and knowledge transfer (see
Chapter 13), reduction in the exposure of a regional economy to the
volatility of the price of fossil fuels (Magnani and Vaona, 2013; see
Chapter 14), and enhanced livelihoods conditions at the household
level (Cooke etal., 2008; Oparoacha and Dutta, 2011).
7�9�2 Environmental and health effects
Energy supply options differ with regard to their overall environ-
mental and health impacts, not only their GHG emissions (Table 7.3).
Renewable energies are often seen as environmentally benign by
nature; however, no technology — particularly in large scale applica-
tion — comes without environmental impacts. To evaluate the relative
burden of energy systems within the environment, full energy supply
chains need to be considered on a lifecycle basis, including all system
components, and across all impact categories.
To avoid creating new environmental and health problems, assess-
ments of mitigation technologies need to address a wide range of
issues, such as land and water use, as well as air, water, and soil pol-
lution, which are often location-specific. Whilst information is scarce
Box 7�1 | Energy systems of LDCs: Opportunities & challenges for low-carbon development
One of the critical indicators of progress towards achieving devel-
opment goals in the Least Developed Countries (LDCs) is the level
of access to modern energy services. It is estimated that 79 % of
the LDC population lacked access to electricity in 2009, compared
to a 28 % average in the developing countries (WHO and UNDP,
2009). About 71 % of people in LDCs relied exclusively on biomass
burning for cooking in 2009. The dominance of subsistence
agriculture in LDCs as the mainstay of livelihoods, combined with
a high degree of population dispersal, and widespread income
poverty have shaped the nature of energy systems in this category
of countries (Banuri, 2009; Sokona, Y. etal., 2012). The LDCs from
sub-Saharan Africa and parts of Asia, with limited access to fossil-
based electricity (and heat), would need to explore a variety of
appropriate sustainable technologies to fuel their development
goals (Guruswamy, 2011). In addition to deploying fossil-based
and renewable technologies, improved biomass cooking from
biogas and sustainably produced wood for charcoal will remain
essential in LDCs (Guruswamy, 2011).
Bioenergy production from unsustainable biomass harvesting, for
direct combustion and charcoal production is commonly practiced
in most LDCs. The net GHG emissions from these practices is
significant (FAO, 2011), and rapid urbanization trends is likely to
intensify harvesting for wood, contributing further to rises in GHG
emissions, along with other localized environmental impacts. How-
ever, important initiatives from multilateral organizations and from
the private sector with innovative business models are improving
agricultural productivity for food and creating bioenergy develop-
ment opportunities. One example produces liquid biofuels for
stove cooking while creating, near cities, agroforestry zones with
rows of fast-growing leguminous trees / shrubs and alleys planted
with annual crop rotations, surrounded by a forestry shelterbelt
zone that contains indigenous trees and oilseed trees and provides
business opportunities across the value chain including for women
(WWF-UK, 2011). The mixture of crops and trees produces food
with higher nutritive values, enables clean biofuels production for
stove cooking, develops businesses, and simultaneously avoids
GHG emissions from deforestation to produce charcoal for cooking
(Zvinavashe etal., 2011). A dearth of documented information
and a lack of integration of outcomes of the many successful
specific projects that show improved management practices of
so-called traditional forest biomass resource into sustainably
managed forest propagate the impression that all traditional
biomass is unsustainable. As more data emerge, the record will be
clarified. Holistic biomass programmes that address the full value
chain, from sustainable production of wood-based fuels to their
processing, conversion, distribution, and marketing, and use with
the potential to reduce future GHG emissions are currently being
promoted (see Box 11.6). Other co-benefits associated with these
programmes include reduced burden of fuel collection, employ-
ment, and improved health conditions of the end users (Reddy
etal., 2000; Lambrou and Piana, 2006; Hutton etal., 2007; Anen-
berg etal., 2013; Owen etal., 2013). The LDC contribution to cli-
mate stabilization requires minimizing future GHG emissions while
meeting unmet (or suppressed) energy demand, which is likely to
rise. For example, though emissions levels remain low, the rate of
growth in emissions in Africa is currently above the world average,
and the continent’s share of global emissions is likely to increase
in the coming decades (Canadell etal., 2009). Whilst growth in
GHG emissions is expected as countries build their industrial base
and consumption moves beyond meeting basic needs, minimizing
this trend will involve exploring new opportunities for scaling up
modern energy access where possible by embracing cleaner and
more-efficient energy options that are consistent with regional
and global sustainability goals. One such opportunity is the avoid-
ance of associated natural gas flaring in oil- and gas-producing
developing countries where venting and flaring amounts to 69 %
of world total of 150billion cubic metres – representing 1.2 % of
global CO
2
emissions (Farina, 2011; GGFR and World Bank, 2011).
For a country such as Nigeria, which flares about 15 billion m
3
of
gas – sufficient to meet its energy needs along with the current
needs of many neighbouring countries (Dung etal., 2008), this
represents an opportunity towards a low-carbon pathway (Hassan
and Kouhy, 2013). Collier and Venables (2012) argue that while
abundant natural endowments in renewable and fossil resources
in Africa and other LDCs should create opportunities for green
energy development, energy sourcing, conversion, distribution, and
usage are economic activities that require the fulfilment of factors
such as capital, governance capacity, and skills (see Box 1.1).
and acidification; Emberson etal. (2012) and van Geothem etal. (2013) for photooxidants. See Arversen and Hertwich (2011, 2012) for wind, Fthenakis etal. (2008) and Laleman
etal. (2011) for PV, Becerralopez and Golding (2007) and Moomaw etal. (2011a) for CSP, and Moomaw etal. (2011b) for a general comparison.
23
See footnote 10 on ecosystem
impact from coal mining.
24
Kumar etal. (2011); Alho (2011); Kunz etal. (2011); Smith etal. (2013); Ziv etal. (2012).
25
Wiser etal. (2011); Lovich and Ennen (2013); Garvin etal. (2011);
Grodsky etal. (2011); Dahl etal. (2012); de Lucas etal. (2012); Dahl etal. (Dahl etal., 2012); Jain etal. (2011).
26
Pachauri etal. (2012); Fthenakis and Kim (2010); Sathaye etal. (2011);
Moomaw etal. (2011a); Meldrum etal. (2013).
27
Pachauri etal. (2012); Fthenakis and Kim (2010); Sathaye etal. (2011); Moomaw etal. (2011a); Meldrum etal. (2013); Berndes
(2008); Pfister etal. (2011); Fingerman etal. (2011); Mekonnen and Hoekstra (2012); Bayer etal. (2013a).
28
Section 7.9.2, Kleijn and van der Voet (2010); Graedel (2011); Zuser and
Rechberger (2011); Fthenakis and Anctil (2013); Ravikumar and Malghan (2013); Pihl etal. (2012); Hoenderdaal etal. (2013).
29
Vergragt etal. (2011); Markusson etal. (2012); IPCC
(2005); Benson etal. (2005); Fankhauser etal. (2008); Shackley and Thompson (2012).
30
Atchley etal. (2013) – simarly applicable to animal health; Apps etal. (2010); Siirila etal.
(2012); Wang and Jaffe (2004).
31
Koorneef etal. (2011); Singh etal. (2011); Hertwich etal. (2008); Veltman etal. (2010); Corsten etal.(2013).
32
Ashworth etal. (2012); Einsiedel etal.
(2013); IPCC (2005); Miller etal. (2007); de Best-Waldhober etal. (2009); Shackley etal. (2009); Wong-Parodi and Ray (2009); Waööquist etal. (2009, 2010); Reiner and Nuttall
(2011).
33
Koorneef etal. (2011); Singh etal. (2011); Hertwich etal. (2008); Veltman etal. (2010); Corsten etal.(2013).
34
Zhai etal. (2011); Koorneef etal. (2011); Sathaye etal. (2011);
Moomaw etal. (2011a).
35
Haszeldine etal. (2009); Sauer etal. (2013); Kudryavtsev etal. (2012); Held and Edenhofer (2009).
36
Wilkinson (2011); Song and Liu (2012).
37
Karacan etal.
(2011); Deng etal. (2013); Wang etal. (2012); Zhang etal. (2013); Cheng etal. (2011).
38
IEA, (2009c); Jerrett etal. (2009); Shindell etal. (2012); Smith etal. (2013), and references
cited therein: Kim etal. (2013); Ito etal. (2005); Ji etal. (2011).
39
Van Dingenen etal. (2009); Shindell etal. (2012); van Goethem etal. (2013).

547547
Energy Systems
7
Chapter 7
and often difficult to generalize, tradeoffs among the different types
of impacts, affecting different species, and at different times, become
important in carrying out the assessments (Sathaye etal., 2011). Also,
the analysis has to go beyond marginal changes (see Section 3.6.3) in
the existing system to address alternative futures. Environmental and
health implications of different low-carbon technologies as they are
understood today are briefly discussed below.
Combustion-related emissions cause substantial human health and eco-
logical impacts. Exposure to outdoor particulate matter emitted directly
or formed from products of incomplete combustion, i. e., sulphur, nitro-
gen oxides, and ammonia, lead to cardiovascular disease, chronic and
acute respiratory illness, lung cancer, and other health damages, caus-
ing in the order of 3.2 million premature deaths per year (Pope etal.,
2009; Lim etal., 2012; Smith etal., 2012a). Despite air pollution policies,
tive sector and income generation opportunities (Bazilian etal., 2012;
Sokona, Y. etal., 2012; Pachauri etal., 2013) are some of the impor-
tant co-benefits of some mitigation options. However, the co-benefits
may not be evenly distributed within countries and local jurisdictions.
While there is a regressive impact of higher energy prices in devel-
oped countries (Grainger and Kolstad, 2010), the empirical evidence
is more mixed for developing countries (Jakob and Steckel, 2013). The
impact depends on the type of fuel used by different income groups,
the redistribution of the revenues through, e. g., a carbon tax, and
in what way pro-poor measures are able to mitigate adverse effects
(Casillas and Kammen, 2010) (see Section 15.5.2.3 for a discussion of
the distributional incidence of fuel taxes). Hence, regulators need to
pay attention that the distributive impacts of higher prices for low-
carbon electricity (fuel) do not become a burden on low-income rural
households (Rao, 2013). The success of energy access programmes
will be measured against affordability and reliability criteria for the
poor.
Other positive spillover effects from implementation of renewable
energy options include technology trade and knowledge transfer (see
Chapter 13), reduction in the exposure of a regional economy to the
volatility of the price of fossil fuels (Magnani and Vaona, 2013; see
Chapter 14), and enhanced livelihoods conditions at the household
level (Cooke etal., 2008; Oparoacha and Dutta, 2011).
7�9�2 Environmental and health effects
Energy supply options differ with regard to their overall environ-
mental and health impacts, not only their GHG emissions (Table 7.3).
Renewable energies are often seen as environmentally benign by
nature; however, no technology — particularly in large scale applica-
tion — comes without environmental impacts. To evaluate the relative
burden of energy systems within the environment, full energy supply
chains need to be considered on a lifecycle basis, including all system
components, and across all impact categories.
To avoid creating new environmental and health problems, assess-
ments of mitigation technologies need to address a wide range of
issues, such as land and water use, as well as air, water, and soil pol-
lution, which are often location-specific. Whilst information is scarce
Box 7�1 | Energy systems of LDCs: Opportunities & challenges for low-carbon development
One of the critical indicators of progress towards achieving devel-
opment goals in the Least Developed Countries (LDCs) is the level
of access to modern energy services. It is estimated that 79 % of
the LDC population lacked access to electricity in 2009, compared
to a 28 % average in the developing countries (WHO and UNDP,
2009). About 71 % of people in LDCs relied exclusively on biomass
burning for cooking in 2009. The dominance of subsistence
agriculture in LDCs as the mainstay of livelihoods, combined with
a high degree of population dispersal, and widespread income
poverty have shaped the nature of energy systems in this category
of countries (Banuri, 2009; Sokona, Y. etal., 2012). The LDCs from
sub-Saharan Africa and parts of Asia, with limited access to fossil-
based electricity (and heat), would need to explore a variety of
appropriate sustainable technologies to fuel their development
goals (Guruswamy, 2011). In addition to deploying fossil-based
and renewable technologies, improved biomass cooking from
biogas and sustainably produced wood for charcoal will remain
essential in LDCs (Guruswamy, 2011).
Bioenergy production from unsustainable biomass harvesting, for
direct combustion and charcoal production is commonly practiced
in most LDCs. The net GHG emissions from these practices is
significant (FAO, 2011), and rapid urbanization trends is likely to
intensify harvesting for wood, contributing further to rises in GHG
emissions, along with other localized environmental impacts. How-
ever, important initiatives from multilateral organizations and from
the private sector with innovative business models are improving
agricultural productivity for food and creating bioenergy develop-
ment opportunities. One example produces liquid biofuels for
stove cooking while creating, near cities, agroforestry zones with
rows of fast-growing leguminous trees / shrubs and alleys planted
with annual crop rotations, surrounded by a forestry shelterbelt
zone that contains indigenous trees and oilseed trees and provides
business opportunities across the value chain including for women
(WWF-UK, 2011). The mixture of crops and trees produces food
with higher nutritive values, enables clean biofuels production for
stove cooking, develops businesses, and simultaneously avoids
GHG emissions from deforestation to produce charcoal for cooking
(Zvinavashe etal., 2011). A dearth of documented information
and a lack of integration of outcomes of the many successful
specific projects that show improved management practices of
so-called traditional forest biomass resource into sustainably
managed forest propagate the impression that all traditional
biomass is unsustainable. As more data emerge, the record will be
clarified. Holistic biomass programmes that address the full value
chain, from sustainable production of wood-based fuels to their
processing, conversion, distribution, and marketing, and use with
the potential to reduce future GHG emissions are currently being
promoted (see Box 11.6). Other co-benefits associated with these
programmes include reduced burden of fuel collection, employ-
ment, and improved health conditions of the end users (Reddy
etal., 2000; Lambrou and Piana, 2006; Hutton etal., 2007; Anen-
berg etal., 2013; Owen etal., 2013). The LDC contribution to cli-
mate stabilization requires minimizing future GHG emissions while
meeting unmet (or suppressed) energy demand, which is likely to
rise. For example, though emissions levels remain low, the rate of
growth in emissions in Africa is currently above the world average,
and the continent’s share of global emissions is likely to increase
in the coming decades (Canadell etal., 2009). Whilst growth in
GHG emissions is expected as countries build their industrial base
and consumption moves beyond meeting basic needs, minimizing
this trend will involve exploring new opportunities for scaling up
modern energy access where possible by embracing cleaner and
more-efficient energy options that are consistent with regional
and global sustainability goals. One such opportunity is the avoid-
ance of associated natural gas flaring in oil- and gas-producing
developing countries where venting and flaring amounts to 69 %
of world total of 150billion cubic metres – representing 1.2 % of
global CO
2
emissions (Farina, 2011; GGFR and World Bank, 2011).
For a country such as Nigeria, which flares about 15 billion m
3
of
gas – sufficient to meet its energy needs along with the current
needs of many neighbouring countries (Dung etal., 2008), this
represents an opportunity towards a low-carbon pathway (Hassan
and Kouhy, 2013). Collier and Venables (2012) argue that while
abundant natural endowments in renewable and fossil resources
in Africa and other LDCs should create opportunities for green
energy development, energy sourcing, conversion, distribution, and
usage are economic activities that require the fulfilment of factors
such as capital, governance capacity, and skills (see Box 1.1).
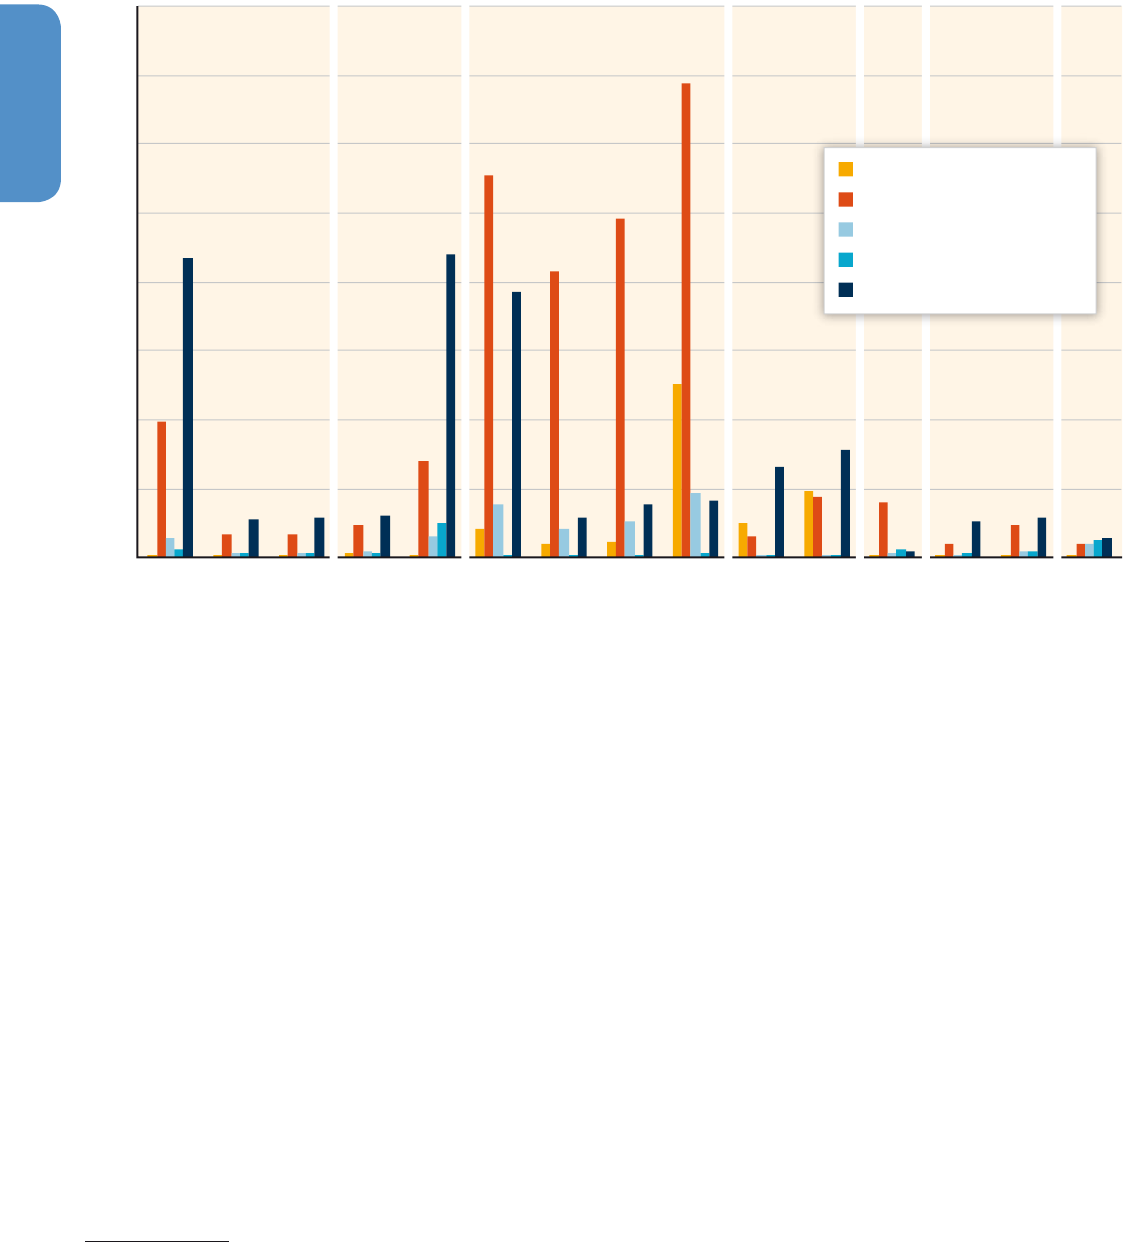
548548
Energy Systems
7
Chapter 7
the exposure to ambient air pollution of 80 % of the world’s population
is estimated to exceed the World Health Organization (WHO) recom-
mendation of 10 μg / m
3
for PM2.5 (Brauer et al., 2012; Rao et al.,
2013).
21
Sulphur and nitrogen oxides are involved in the acidification of
fresh water and soils; and nitrogen oxides in the eutrophication of water
bodies (Galloway etal., 2008; Doney, 2010), both threatening biodiver-
sity (Rockstrom etal., 2009; Hertwich etal., 2010; van Grinsven etal.,
2013). Volatile organic compounds and nitrogen oxides cause the for-
mation of photochemical oxidants (summer smog), which impact
human health (Lim etal., 2012) and ecosystems (Emberson etal., 2012;
van Goethem etal., 2013).
22
Coal is an important source of mercury
(IEA, 2011a) and other toxic metals (Pacyna etal., 2007), harming eco-
systems (Nagajyoti etal., 2010; Sevcikova etal., 2011; Mahboob, 2013),
21
See WGII 11.9 (Smith et al., 2014) and Chapter 4 of the Global Energy Assessment
“Energy and Health” (Smith et al., 2012) for a recent overview of human health
effects associated with air pollution.
22
See Chapter 3 of the Global Energy Assessment “Energy and Environment”
(Emberson et al., 2012) for a recent overview of environmental effects associated
with air pollution.
and potentially also human health (van der Voet etal., 2012; Tchoun-
wou etal., 2012). Many of these pollutants can be significantly reduced
through various types of pollution control equipment, but even with this
equipment in place, some amount of pollution remains. In addition, sur-
face mining of coal and tar sand causes substantial land use and mining
waste (Yeh etal., 2010; Elliott Campbell etal., 2012; Jordaan, 2012).
Reducing fossil fuel combustion, especially coal combustion, can
reduce many forms of pollution and may thus yield co-benefits for
health and ecosystems. Figure 7.8 indicates that most renewable
power projects offer a reduction of emissions contributing to particu-
late matter exposure even compared to modern fossil fuel-fired power
plants with state-of-the-art pollution control equipment.
Ecological and health impacts of renewable energy have been com-
prehensively assessed in the SRREN, which also provides a review of
life-cycle assessments of nuclear and fossil-based power generation
(Sathaye et al., 2011). Renewable energy sources depend on large
areas to harvest energy, so these technologies have a range of eco-
Figure 7�8 | Life-cycle inventory results of the production of 1 kWh of electricity for important air pollutants contributing to particulate matter (PM) exposure, the leading cause
of health impact from air pollution. The technology modelling considers state-of-the-art pollution control equipment for fossil power plants. Data sources: Arvesen and Hertwich
(2011); Burkhardt etal. (2011); Whitaker (2013), Dones etal. (2005); Singh etal. (2011). Abbreviations: PC = pulverized coal, PV = photovoltaic, CSP = concentrating solar power,
Poly-Si = polycrystalline silicon, CIGS = copper indium gallium selenide thin film, CdTe = cadmium telluride thin film, IGCC = integrated gasification combined cycle, CCS = CO
2
capture and storage, SCPC = supercritical pulverized coal, NGCC = natural gas combined cycle, PWR = pressurized water reactor.
0.0
0.1
0.2
0.3
0.4
0.5
0.6
0.7
0.8
Poly-Si
CIGS
CdTe
Trough
Tower
PC
IGCC
IGCC with CCS
SCPC with CCS
NGCC
NGCC with CCS
Reservoir
Onshore
Offshore
PWR
PV CSP Coal Gas Hydro Wind Nuclear
[g/kWh]
Ammonia
Nitrogen Oxides
Particulates < 2.5 µm
Particulates > 2.5 µm and < 10µm
Sulfur Dioxide

549549
Energy Systems
7
Chapter 7
logical impacts related to habitat change, which — depending on site
characteristics and the implementation of the technology — may be
higher than that of fossil fuel-based systems (Sathaye et al., 2011).
For wind power plants, collisions with raptors and bats, as well as site
disturbance during construction cause ecological concerns (Garvin
etal., 2011; Grodsky etal., 2011; Dahl etal., 2012). Adjustments in the
location, design and operation of facilities can mitigate some of these
damages (Arnett etal., 2011; de Lucas etal., 2012). For hydropower
plants, dams present an obstacle to migratory species (Alho, 2011; Ziv
etal., 2012). The large-scale modification of river flow regimes affects
the amount and timing of water release, reduces seasonal flood-
ing, and sediment and nutrient transport to flood plains (Kunz etal.,
2011). These modifications result in a change of habitat of species
adapted to seasonal flooding or living on flood plains (Young etal.,
2011). Geothermal (Bayer etal., 2013b) and concentrating solar power
(CSP) (Damerau etal., 2011) can cause potential concerns about water
use / pollution, depending on design and technological choices.
Wind, ocean, and CSP need more iron and cement than fossil fuel
fired power plants, while photovoltaic power relies on a range of
scarce materials (Burkhardt etal., 2011; Graedel, 2011; Kleijn etal.,
2011; Arvesen and Hertwich, 2011). Furthermore, mining and material
processing is associated with environmental impacts (Norgate etal.,
2007), which make a substantial contribution to the total life-cycle
impacts of renewable power systems. There has been a significant
concern about the availability of critical metals and the environmen-
tal impacts associated with their production. Silver, tellurium, indium,
and gallium have been identified as metals potentially constraining
the choice of PV technology, but not presenting a fundamental obsta-
cle to PV deployment (Graedel, 2011; Zuser and Rechberger, 2011;
Fthenakis and Anctil, 2013; Ravikumar and Malghan, 2013). Silver is
also a concern for CSP (Pihl etal., 2012). The limited availability of
rare earth elements used to construct powerful permanent magnets,
especially dysprosium and neodymium, may limit the application of
efficient direct-drive wind turbines (Hoenderdaal etal., 2013). Recy-
cling is necessary to ensure the long-term supply of critical metals and
may also reduce environmental impacts compared to virgin materials
(Anctil and Fthenakis, 2013; Binnemans etal., 2013). With improve-
ments in the performance of renewable energy systems in recent years,
their specific material demand and environmental impacts have also
declined (Arvesen and Hertwich, 2011; Caduff etal., 2012).
While reducing atmospheric GHG emissions from power generation,
CCS will increase environmental burdens associated with the fuel sup-
ply chains due to the energy, water, chemicals, and additional equip-
ment required to capture and store CO
2
. This is likely to increase the
pressure on human health and ecosystems through chemical mecha-
nisms by 0 – 60 % compared to the best available fossil fuel power
plants (Singh, et al., 2011). However, these impacts are considered
to be lower than the ecological and human health impacts avoided
through reduced climate change (Singh etal., 2012). Uncertainties and
risks associated with long-term storage also have to be considered
(Sections 7.5.5 and 7.9.3; Ketzer etal., 2011; Koornneef etal., 2011).
For an overview of mitigation options and their unresolved challenges,
see Section 7.5.
The handling of radioactive material
23
poses a continuous challenge to
the operation of the nuclear fuel chain and leads to releases of radio-
nuclides. The most significant routine emissions of radionuclides occurs
during fuel processing and mining (Simons and Bauer, 2012). The leg-
acy of abandoned mines, sites, and waste storage causes some con-
cerns (Marra and Palmer, 2011; Greenberg, 2013b; Schwenk-Ferrero,
2013; Skipperud etal., 2013; Tyler etal., 2013).
Epidemiological studies indicate an increase in childhood leukemia of
populations living within 5 km of a nuclear power plant in a minority
of sites studied (Kaatsch etal., 2008; Raaschou-Nielsen etal., 2008;
Laurier et al., 2008; Heinävaara et al., 2010; Spycher et al., 2011;
Koerblein and Fairlie, 2012; Sermage-Faure etal., 2012), so that the
significance of a potential effect is not resolved (Fairlie and Körblein,
2010; Laurier etal., 2010).
Thermal power plants with high cooling loads and hydropower reser-
voirs lead to reduced surface water flows through increased evapora-
tion (IPCC, 2008; Dai, 2011), which can adversely affect the biodiver-
sity of rivers (Hanafiah etal., 2011) and wetlands (Amores etal., 2013;
Verones etal., 2013).
While any low-carbon energy system should be subject to scrutiny
to assure environmental integrity, the outcome must be compared
against the performance of the current energy system as a baseline,
and well-designed low-carbon electricity supply outperforms fossil-
based systems on most indicators. In this context, it should be noted
that the environmental performance of fossil-based technologies is
expected to decline with increasing use of unconventional resources
with their associated adverse environmental impacts of extraction
(Jordaan etal., 2009; Yeh etal., 2010).
7�9�3 Technical risks
Within the context of sustainable development, a comprehensive
assessment of energy supply and mitigation options needs to take
into account technical risks, especially those related to accidents risks.
In the event of accidents, fatality and injury may occur among work-
ers and residents. Evacuation and resettlements of residents may also
take place. This section, therefore, updates the risk assessment pre-
sented in Chapter 9 of the SRREN (IPCC, 2011a): “Accidental events
can be triggered by natural hazards (e. g., Steinberg etal., 2008; Kaiser
etal., 2009; Cozzani etal., 2010), technological failures (e. g., Hirsch-
berg etal., 2004; Burgherr etal., 2008), purposefully malicious action
(e. g., Giroux, 2008), and human errors (e. g., Meshakti, 2007; Ale etal.,
2008)”, (IPCC, 2011a, p.745). An analysis of the fatalities caused by
23
Accidents are addressed in Section 7.9.3.

550550
Energy Systems
7
Chapter 7
large accidents (≥ 5 fatalities or ≥ 10 injured or ≥ 200 evacuated)
recorded in the Energy-Related Severe Accident Database (ENSAD)
(Burgherr etal., 2011), as presented in SRREN, allows for a comparison
of the potential impacts. The analysis in SRREN included accidents in
the fuel chain, such as coal mining and oil shipping, 1970 – 2008.
SRREN indicates high fatality rates (>20 fatalities per PWh)
24
associ-
ated with coal, oil, and hydropower in non-OECD countries and low
fatalities (< 2 fatalities per PWh) associated with renewable and
nuclear power in OECD countries (Figure 9.12 in Sathaye etal., 2011).
Coal and oil power in OECD countries and gas power everywhere were
associated with impacts on the order of 10fatalities per PWh.
Coal mining accidents in China were identified to have contributed to
25,000 of the historical total of 33,000 fatalities in severe accidents
from 1970 – 2008 (Epstein et al., 2010; Burgherr et al., 2012). New
analysis indicates that the accident rate in Chinese coal mining has
been reduced substantially, from 5670 deaths in 2001 to 1400 in 2010,
or from 5.1 to 0.76 fatalities per Mt coal produced (Chen etal., 2012).
The majority of these fatalities is apparently associated with smaller
accidents not covered in the ENSAD database. In China, accident rates
in smaller coal mines are higher than those in larger mines (Chan and
Griffiths, 2010), and in the United States, less profitable mines have
higher rates than more profitable ones (Asfaw etal., 2013). A wide
range of research into underlying causes of accidents and measures to
prevent future accidents is currently under way.
For oil and gas, fatalities related to severe accidents at the transport
and distribution stage are a major component of the accident related
external costs. Over 22,000 fatalities in severe accidents for the oil
chain were reported, 4000 for LPG, and 2800 for the natural gas chain
(Burgherr etal., 2011, 2012). Shipping and road transport of fuels are
associated with the highest number of fatalities, and accident rates in
non-OECD countries are higher than those in OECD countries (Eckle
and Burgherr, 2013).
For hydropower, a single event, the 1975 Banqiao / Shimantan dam
failure in China, accounted for 26,000 immediate fatalities. Remain-
ing fatalities from large hydropower accidents amount to nearly 4000,
but only 14 were recorded in OECD countries (Moomaw etal., 2011a;
Sathaye etal., 2011).
Severe nuclear accidents have occurred at Three-Mile Island in 1979,
Chernobyl in 1986, and Fukushima in 2011. For Three-Mile Island, no
fatalities or injuries were reported. For Chernobyl, 31immediate fatali-
ties occurred and 370 persons were injured (Moomaw etal., 2011a).
Chernobyl resulted in high emissions of iodine-131, which has caused
measureable increases of thyroid cancer in the surrounding areas (Car-
dis etal., 2006). The United Nations Scientific Committee on the Effects
of Atomic Radiation (UNSCEAR) identified 6000 thyroid cases in indi-
24
The global electricity production in 2008 was 17 PWh.
viduals who were below the age of 18 at the time of the accident, 15
of which had resulted in mortalities (Balonov etal., 2011). A significant
fraction of these are above the background rate. Epidemiological evi-
dence for other cancer effects does not exist; published risk estimates
often assume a linear no-threshold dose-response relationship, which
is controversial (Tubiana etal., 2009). Between 14,000 and 130,000
cancer cases may potentially result (Cardis et al., 2006), and up to
9,000 potential fatalities in the Ukraine, Belarus, and Russia in the 70
years after the accident (Hirschberg etal., 1998). The potential radia-
tion-induced increase in cancer incidence in a population of 500 mil-
lion would be too low to be detected by an epidemiological study and
such estimates are neither endorsed nor disputed by UNSCEAR (Balo-
nov etal., 2011). Adverse effects on other species have been reported
within the 30-km exclusion zone (Alexakhin etal., 2007; Møller etal.,
2012; Geras’kin etal., 2013; Mousseau and Møller, 2013).
The Fukushima accident resulted in much lower radiation exposure.
Some 30 workers received radiation exposure above 100 mSv, and
population exposure has been low (Boice, 2012). Following the linear,
no-threshold assumption, 130 (15 – 1100) cancer-related mortalities,
and 180 (24 – 1800) cancer-related morbidities have been estimated
(Ten Hoeve and Jacobson, 2012). The WHO does not estimate cancer
incidence from low-dose population exposure, but identifies the high-
est lifetime attributable risk to be thyroid cancer in girls exposed dur-
ing infancy in the Fukushima prefecture, with an increase of a maxi-
mum of 70 % above relatively low background rates. In the highest
exposed locations, leukemia in boys may increase by 5 % above back-
ground, and breast cancer in girls by 4 % (WHO, 2013).
Design improvements for nuclear reactors have resulted in so-called
Generation III+ designs with simplified and standardized instrumen-
tation, strengthened containments, and ‘passive’ safety designs seek-
ing to provide emergency cooling even when power is lost for days.
Nuclear power reactor designs incorporating a ‘defence-in-depth’
approach possess multiple safety systems including both physical bar-
riers with various layers and institutional controls, redundancy, and
diversification — all targeted at minimizing the probability of accidents
and avoiding major human consequences from radiation when they
occur (NEA, 2008).
The fatality rates of non-hydro RE technologies are lower than those
of fossil chains, and are comparable to hydro and nuclear power in
developed countries. Their decentralized nature limits their capacity to
have catastrophic impacts.
As indicated by the SRREN, accidents can result in the contamination
of large land and water areas with radionuclides or hydrocarbons. The
accidental releases of crude oil and its refined products into the mari-
time environment have been substantially reduced since the 1970s
through technical measures, international conventions, national leg-
islations, and increased financial liabilities (see e. g. Kontovas etal.,
2010; IPCC, 2011a; Sathaye etal., 2011). Still, oil spills are common
and can affect both marine and freshwater resources (Jernelöv, 2010;

551551
Energy Systems
7
Chapter 7
Rogowska and Namiesnik, 2010). Furthermore, increased drilling in
deep offshore waters (e. g., Gulf of Mexico, Brazil) and extreme envi-
ronments (e. g., the Arctic) poses a risk of potentially high environmen-
tal and economic impacts (Peterson etal., 2012; Moreno etal., 2013;
Paul etal., 2013). Leakage of chemicals used in hydraulic fracturing
during shale gas and geothermal operations can potentially contami-
nate local water flows and reservoirs (Aksoy etal., 2009; Kargbo etal.,
2010; Jackson etal., 2013). Further research is needed to investigate
a range of yet poorly understood risks and risk factors related to CCS
storage (see Sections 7.5.5 and 7.9.4). Risks of CO
2
transport are dis-
cussed in Section7.6.4.
7�9�4 Public perception
25
Although public concerns are often directed at higher-GHG-emitting
energy sources, concerns also exist for lower-emitting sources, and
opposition can impede their deployment. Although RE sources often
receive relatively wide public support, public concerns do exist, which,
because of the diversity of RE sources and applications, vary by tech-
nology (Sathaye etal., 2011). For bioenergy, concerns focus on direct
and indirect land use and related GHG emissions, deforestation, and
possible competition with food supplies (e. g., Chum etal., 2011; and
Bioenergy Annex of chapter 11). For hydropower, concerns include the
possibility of the displacement of human populations, negative envi-
ronmental impacts, and altered recreational opportunities (e. g., Kumar
etal., 2011). For wind energy, concerns primarily relate to visibility and
landscape impacts as well as potential nuisance effects, such as noise
(e. g., Wiser etal., 2011). For solar energy, land area requirements can
be a concern for large, utility-scale plants (e. g., Arvizu etal., 2011).
For ocean energy, sea area requirements are a concern (e. g., Lewis
etal., 2011). Concerns for geothermal energy include the possibility
of induced local seismicity and impacts on natural — especially recre-
ational — areas (e. g., Goldstein etal., 2011).
For nuclear energy, anxieties often focus on health and safety (e. g.,
accidents, disposal of wastes, decommissioning) and proliferation (e. g.,
terrorism, civil unrest). Further, perceptions are dependent on how the
debate around nuclear is framed relative to other sources of energy
supply (e. g., Bickerstaff etal., 2008; Sjoberg and Drottz-Sjoberg, 2009;
Corner etal., 2011; Ahearne, 2011; Visschers and Siegrist, 2012; Green-
berg, 2013b; Kim etal., 2013).
25
Other portions of this chapter and AR5 contain discussions of actual ecological
and environmental impacts of various energy sources. Although not addressed
here, energy transmission infrastructure can also be the focus of public concern.
See also Chapters 2, 6, and 10, which cover issues of public acceptance through
complementary lenses.
Among CCS technologies, early
26
misgivings include the ecological
impacts associated with different storage media, the potential for
accidental release and related storage effectiveness of stored CO
2
, and
the perception that CCS technologies do not prevent all of the non-
GHG social and environmental impacts of fossil energy sources (e. g.,
IPCC, 2005; Miller etal., 2007; de Best-Waldhober etal., 2009; Shack-
ley et al., 2009; Wong-Parodi and Ray, 2009; Wallquist etal., 2009,
2010; Reiner and Nuttall, 2011; Ashworth etal., 2012; Einsiedel etal.,
2013). For natural gas, the recent increase in the use of unconventional
extraction methods, such as hydraulic fracturing, has created concerns
about potential risks to local water quality and public health (e. g., US
EPA, 2011; IEA, 2012i).
Though impacts, and related public concerns, cannot be entirely elimi-
nated, assessing, minimizing and mitigating impacts and concerns are
elements of many jurisdictions’ planning, siting, and permitting pro-
cesses. Technical mitigation options show promise, as do procedural
techniques, such as ensuring the availability of accurate and unbiased
information about the technology, its impacts and benefits; aligning
the expectations and interests of different stakeholders; adjusting
to the local societal context; adopting benefit-sharing mechanisms;
obtaining explicit support at local and national levels prior to develop-
ment; building collaborative networks; and developing mechanisms for
articulating conflict and engaging in negotiation (e. g., Ashworth etal.,
2010; Fleishman, De Bruin, and Morgan, 2010; Mitchell etal., 2011;
Terwel etal., 2010).
7.10 Barriers and opportunities
7�10�1 Technical aspects
From a global perspective, the large number of different technologies
that are available to mitigate climate change (Section7.5.) facilitates
the achievement of prescribed climate protection goals. Given that
many different combinations of the mitigation technologies are often
feasible, least-cost portfolios can be determined that select those
options that interact in the best possible way (Chapter 6, Section7.11).
On a local scale and / or concerning specific technologies, however,
technological barriers might constrain their mitigation potential. These
limits are discussed in Sections7.4, 7.5, 7.6, and 7.9.
26
Knowledge about the social acceptability of CCS is limited due to the early
state of the technologies’ deployment, though early research has deepened our
understanding of the issues related to CCS significantly (de Best-Waldhober et al.,
2009; Malone et al., 2010; Ter Mors et al., 2010; Corry and Reiner, 2011. See also
Section 2.6.6.2)

552552
Energy Systems
7
Chapter 7
7�10�2 Financial and investment barriers and
opportunities
The total global investment in the energy supply sector in 2010 is esti-
mated to be USD 1,076 to 1,350 billion per year, of which 43 – 48 % is
invested in the power sector and 37 – 50 % is invested in fossil extrac-
tion. In the power sector, 49 – 55 % of the investments is used for
power generation and 45 – 51 % is used for transmission and distribu-
tion (see Section 16.2.2).
The total investment in renewables excluding hydropower in 2012 was
USD 244 billion, which was six times the level in 2004. Out of this
total, USD 140 billion was for solar and USD 80 billion for wind power.
The total was down 12 % from a record USD 279 billion in 2011 in
part due to changes in support policies and also due to sharp reduc-
tions in renewable energy technology costs. Total investment in devel-
oped countries fell 29 % in 2012 to USD 132 billion, while investment
in developing countries rose 19 % to USD 112 billion. The investment
in renewables is smaller than gross investment on fossil-fuel plants
(including replacement plant) at USD 262 billion, but much larger
than net investment in fossil-fuel technologies, at USD 148 billion. The
amount of installed capacity of renewables excluding hydropower was
85GW, up from 2011's 80GW (BNEF and Frankfurt School-UNEP Cen-
tre, 2013; REN21, 2013).
Additional investments required in the energy supply sector by 2050
are estimated to be USD 190billion to USD 900 billion / year to limit the
temperature increase below 2 °C (about 0.30 % to 1.4 % of world GDP
in 2010) (GEA, 2012; IEA, 2012h; Kainuma etal., 2013). The additional
investment costs from both supply and demand sides are estimated to
about USD 800 billion / year according to McCollum etal. (2014). With a
greater anticipated increase in energy demands, developing countries
are expected to require more investments than the developed coun-
tries (see also Chapter6 and Chapter 16).
Investment needs in the energy supply sector increase under low-GHG
scenarios. However, this should be set in the context of the total value
of the world’s financial stock, which (including global stock market
capitalization) stood at more than USD 210 trillion at the end of 2010
(Roxburgh et al., 2011). Moreover, the investment needs described
above would be offset, to a degree, by the lower operating costs of
many low-GHG energy supply sources, as well as those due to energy-
efficiency improvements in the end-use sectors (IEA, 2012h).
Though only a fraction of the available private-sector capital stock
would be needed to cover the costs of low-GHG energy supply even
in aggressive GHG-reduction scenarios, private capital will not be
mobilized automatically for such purposes. For this reason, various
measures — such as climate investment funds, carbon pricing, feed-in
tariffs, RE quotas and RE-tendering / bidding schemes, carbon offset
markets, removal of fossil fuel subsidies and private / public initiatives
aimed at lowering barriers for investors — are currently being imple-
mented (see Section 7.12, chapters 13, 14, and Section 15.2), and still
more measures may be needed to achieve low-GHG stabilization sce-
narios. Uncertainty in policies is also a barrier to investment in low-
GHG energy supply sources (United Nations, 2010; World Bank, 2011b;
IEA, 2012h; IRENA, 2012a; BNEF and Frankfurt School-UNEP Centre,
2013).
Investment in LDCs may be a particular challenge given their less-
developed capital markets. Multilateral development banks and insti-
tutions for bilateral developmental cooperation will have an impor-
tant role towards increasing levels of confidence for private investors.
Innovative insurance schemes to address regulatory and policy barriers
could encourage participation of more diverse types of institutional
investors (Patel, 2011). Building capacity in local governments in devel-
oping countries for designing and implementing appropriate policies
and regulations, including those for efficient and transparent procure-
ment for infrastructure investment, is also important (World Economic
Forum, 2011; IRENA, 2012a; Sudo, 2013).
Rural areas in LDCs are often characterized by very low population
densities and income levels. Even with the significant decline in the
price of PV systems, investment cost barriers are often substantial in
these areas (IPCC, 2011b). Micro-finance mechanisms (grants, conces-
sional loans) adapted to the pattern of rural activities (for instance,
installments correlated with income from agriculture) may be nec-
essary to lift rural populations out of the energy poverty trap and
increase the deployment of low-carbon energy technologies in these
areas (Rao etal., 2009; Bazilian etal., 2012; IRENA, 2012c).
7�10�3 Cultural, institutional, and legal barriers
and opportunities
Managing the transition from fossil fuels to energy systems with a
large penetration of low-carbon technologies and improved energy
efficiency will pose a series of challenges and opportunities, particu-
larly in the case of poor countries. Depending on the regions and the
development, barriers and opportunities may differ dramatically.
Taking the example in the United States, Sovacool (Sovacool, 2009)
points to significant social and cultural barriers facing renewable
power systems as policymakers continue to frame electricity generation
as a mere technical challenge. He argues that in the absence of a wider
public discourse around energy systems and challenging entrenched
values about perceived entitlements to cheap and abundant forms of
electricity, RE and energy-efficiency programmes will continue to face
public acceptability problems. Indeed, attitudes towards RE in addi-
tion to rationality are driven by emotions and psychological issues. To
be successful, RE deployment, as well as information and awareness
efforts and strategies need to take this explicitly into account (Sath-
aye etal., 2011). Legal regulations and procedures are also impacting
on the deployment of nuclear energy, CCS, shale gas, and renewable
energy. However, the fundamental reasons (environment, health, and
safety) may differ according to the different types of energy. The under-

553553
Energy Systems
7
Chapter 7
lying risks are discussed in Sections7.5 and 7.9, and enabling policies
to address them are in Section7.12.
A huge barrier in the case of poor, developing countries is the cultural,
economic, and social gap between rural and urban areas (Khennas,
2012). For instance, cooking fuels, particularly firewood, is widely used
in rural areas because it is a suitable fuel for these communities in
addition to its access without payment apart from the time devoted
to its collection. Indeed, values such as time have different percep-
tions and opportunity costs depending on the social and geographi-
cal context. Furthermore, legal barriers are often hindering the pen-
etration of modern energy services and distorting the economics of
energy systems. For instance, informal settlements in poor peripheral
urban areas mean legal barriers to get access to electricity. Land ten-
ancy issues and illegal settlements are major constraints to energy
access, which are often overcome by illegal power connections with
an impact on the safety of the end users and economic loss for the
utility due to meter tampering. In addition, in many slums, there is a
culture of non-payment of the bills (UN Habitat and GENUS, 2009).
Orthodox electrification approaches appear to be inefficient in the
context of urban slums, particularly in sub-Saharan Africa. Adopting
a holistic approach encompassing cultural, institutional, and legal
issues in the formulation and implementation of energy policies and
strategies is increasingly perceived particularly in sub-Saharan Africa
as essential to addressing access to modern energy services. In South
Africa, the Electricity Supply Commission (ESKOM), the large utility in
Africa, implemented a holistic Energy Losses Management Program
(UN Habitat and GENUS, 2009), with strong community involvement
to deal with the problem of energy loss management and theft. As
a result prepayment was successfully implemented as it gives poor
customers a daily visibility of consumption and a different culture and
understanding of access to modern energy services.
7�10�4 Human capital capacity building
Lack of human capital is widely recognized as one of the barriers to
development, acquisition, deployment, and diffusion of technologies
required for meeting energy-related CO
2
emissions reduction targets
(IRENA, 2012d). Human capacity is critical in providing a sustainable
enabling environment for technology transfer in both the host and
recipient countries (Barker etal., 2007; Halsnæs etal., 2007). Human
workforce development has thus been identified as an important near-
term priority (IEA, 2010c).
There is increasing concern in the energy supply sector in many coun-
tries that the current educational system is not producing sufficient
qualified workers to fill current and future jobs, which increasingly
require science, technology, engineering, and mathematics (STEM)
skills. This is true not only in the booming oil and gas and traditional
power industries, but also in the rapidly expanding RE supply sector
(NAS, 2013b). Skilled workforce in the areas of RE and decentral-
ized energy systems, which form an important part of ‘green jobs’
(Strietska-Ilina et al., 2011), requires different skill sets for different
technologies and local context, and hence requires specific train-
ing (Moomaw etal., 2011b). Developing the skills to install, operate,
and maintain the RE equipment is exceedingly important for a suc-
cessful RE project, particularly in developing countries (UNEP, 2011),
where shortages of teachers and trainers in subjects related to the
fast-growing RE supply sector have been reported (Strietska-Ilina etal.,
2011) (ILO and EU, 2011). Well-qualified workers will also be required
on other low-carbon energy technologies, particularly nuclear and
CCS — should there be large-scale implementation (Creutzig and Kam-
men, 2011; NAS, 2013b).
Apart from technology-oriented skills, capacity for decision support
and policymaking in the design and enactment stages is also essential,
particularly on assessing and choosing technology and policy options,
and designing holistic policies that effectively integrate renewable
energy with other low-carbon options, other policy goals, and across
different but interconnected sectors (Mitchell etal., 2011; Jagger etal.,
2013).
To avoid future skill shortages, countries will need to formulate
short- and long-term capacity development strategies based on well-
informed policy decisions, and adequate information on labour mar-
ket and skill needs in the context of low-carbon transition and green
jobs (Strietska-Ilina etal., 2011; Jagger etal., 2013). But producing
a skilled workforce with the right skills at the right time requires
additional or alternatives to conventional approaches. These include,
but are not limited to, increased industry-education-government
partnership, particularly with industry organizations, in job demand
forecasting, designing education and training curricula, augmenting
available skills with specific skills, and adding energy supply sector
experience in education and training (Strietska-Ilina et al., 2011;
NAS, 2013b).
7�10�5 Inertia in energy systems physical
capital stock turnover
The long life of capital stock in energy supply systems (discussed in
detail in Section 5.6.3) gives the possibility of path-dependant car-
bon lock-in (Unruh, 2002). The largest contribution to GHG emissions
from existing high-carbon energy capital stock is in the global elec-
tricity sector, which is also characterized by long-lived facilities — with
historical plant lifetimes for coal, natural gas, and oil plant of 38.6,
35.8, and 33.8 years, respectively (Davis etal., 2010). Of the 1549 GW
investments (from 2000 – 2010) in the global electricity sector (EIA,
2011), 516 GW (33.3 %) were coal and 482 GW (31.1 %) were natural
gas. Only 34 GW (2.2 %) were nuclear investments, with combined
renewable source power plants at 317 GW (20.5 %). The investment
share for RE power plants accelerated toward the end of the decade.
The transport, industrial, commercial, and residential sectors gener-
ally have smaller technology sizes, shorter lifetimes, and limited plant
level data for directly emitting GHG facilities; however, in combina-

554554
Energy Systems
7
Chapter 7
tion, contribute over half of the GHG emissions from existing primary
energy capital stock (Davis etal., 2010).
Long-lived fossil energy system investments represent an effective
(high-carbon) lock-in. Typical lifetime of central fossil-fuelled power
plants are between 30 and 40 years; those of electricity and gas
infrastructures between 25 – 50 years (Philibert and Pershing, 2002).
Although such capital stock is not an irreversible investment, prema-
ture retirement (or retrofitting with CCS if feasible) is generally expen-
sive. Examples include low natural gas prices in the United States due
to shale gas production making existing coal plants uneconomic to run,
or merit order consequences of new renewable plants, which endanger
the economic viability of dispatchable fossil fuel power plants in some
European countries under current market conditions (IEA, 2013b). Fur-
thermore, removal of existing fossil plants must overcome inertia from
existing providers, and consider wider physical, financial, human capi-
tal, and institutional barriers.
Explicit analysis of path dependency from existing energy fossil tech-
nologies (450 ppm scenario, IEA, 2011a) illustrates that if current
trends continue, by 2015 at least 90 % of the available ‘carbon budget’
will be allocated to existing energy and industrial infrastructure, and in
a small number of subsequent years there will be extremely little room
for manoeuvre at all (IEA, 2011a, Figure 6.12).
Effective lock-in from long-lived energy technologies is particularly
relevant for future investments by developing economies, which are
projected to account for over 90 % of the increase in primary energy
demand by 2035 (IEA, 2011a). The relative lack of existing energy capi-
tal in many developing countries bolsters the potential opportunities
to develop a low-carbon energy system, and hence reduce the effective
carbon lock-in from broader energy infrastructures (e. g., oil refineries,
industrial heat provision, transport networks) (Guivarch and Halle-
gatte, 2011), or the very long-lived capital stock embodied in buildings
and urban patterns (Jaccard and Rivers, 2007).
7.11 Sectoral implication
of transformation
pathways and sustainable
development
This section reviews long-term integrated scenarios and transforma-
tion pathways with regard to their implication for the global energy
system. Focus is given to energy-related CO
2
emissions and the
required changes to the energy system to achieve emissions reduc-
tions compatible with a range of long-term climate targets. Aggre-
gated energy-related emissions, as primarily discussed in this sec-
tion, comprise the full energy system, including energy sourcing,
conversion, transmission, as well as the supply of energy carries to
the end-use sectors and their use in the end-use sectors. Aggregated
energy-related emissions are further split into emissions from elec-
tricity generation and the rest of the energy system.
27,28
This section
builds upon about 1200 emissions scenarios, which were collated
by Chapter 6 in the WGIII AR5 Scenario Database (Section 6.2.2 and
Annex II.10). The scenarios were grouped into baseline and mitiga-
tion scenarios. As described in more detail in Section 6.3.2, the sce-
narios are further categorized into bins based on 2100 concentrations:
between 430 – 480 ppm CO
2
eq, 480 – 530 ppm CO
2
eq, 530 – 580 ppm
CO
2
eq, 580 – 650 ppm CO
2
eq, 650 – 720 ppm CO
2
eq, 720 – 1000 ppm
CO
2
eq, and >1000 ppm CO
2
eq by 2100. An assessment of geophysical
climate uncertainties consistent with the dynamics of Earth System
Models assessed in WGI found that the most stringent of these sce-
narios — leading to 2100 concentrations between 430 and 480 ppm
CO
2
eq — would lead to an end-of-century median temperature change
between 1.5 to 1.7 °C compared to pre-industrial times, although
uncertainties in understanding of the climate system mean that the
possible temperature range is much wider than this. These scenarios
were found to maintain temperature change below 2 °C over the
course of the century with a likely chance. Scenarios in the concen-
tration category of 650 – 720 ppm CO
2
eq correspond to comparatively
modest mitigation efforts, and were found to lead to median tempera-
ture rise of approximately 2.6 – 2.9 °C in 2100 (see Section 6.3.2 for
details).
7�11�1 Energy-related greenhouse gas
emissions
In the baseline scenarios assessed in AR5, direct CO
2
emis-
sions of the energy supply sector increase from 14.4 GtCO
2
/ yr in
2010 to 24 – 33 GtCO
2
/ yr in 2050 (25 – 75th percentile; full range
15 – 42 GtCO
2
/ yr), with most of the baseline scenarios assessed in AR5
showing a significant increase. The lower end of the full range is domi-
nated by scenarios with a focus on energy intensity improvements that
go well beyond the observed improvements over the past 40 years
[Figure TS 15].
In absence of climate change mitigation policies,
29
energy-related CO
2
emissions (i. e. those taking into account the emissions of the energy
27
Note that the other Sections in Chapter 7 are focusing on the energy supply
sector, which comprises only energy extraction, conversion, transmission, and
distribution. As noted in Section 7.3, CO
2
emissions from the energy supply sector
are the most important source of climate forcing. Climate forcing associated with
emissions from non-CO
2
greenhouse gases (e. g., CH
4
and N
2
O) of the energy sup-
ply sector is smaller than for CO
2
. For the most part, non-CO
2
greenhouse gases
are emitted by other non-energy sectors, though CH
4
is released in primary energy
sourcing and supply as a bi-product of oil, gas, and coal production as well as in
the transmission and distribution of methane to markets. While its share in total
GHG emissions is relatively small, the energy supply sector is, however, a major
source of sulphur and other aerosol emissions. (See also Section 6.6)
28
The mitigation scenarios in the WGIII AR5 Scenario Database do not provide
information on energy-related emissions of non-CO
2
gases. The assessment in this
section thus focuses on CO
2
emissions only.
29
Beyond those already in effect.
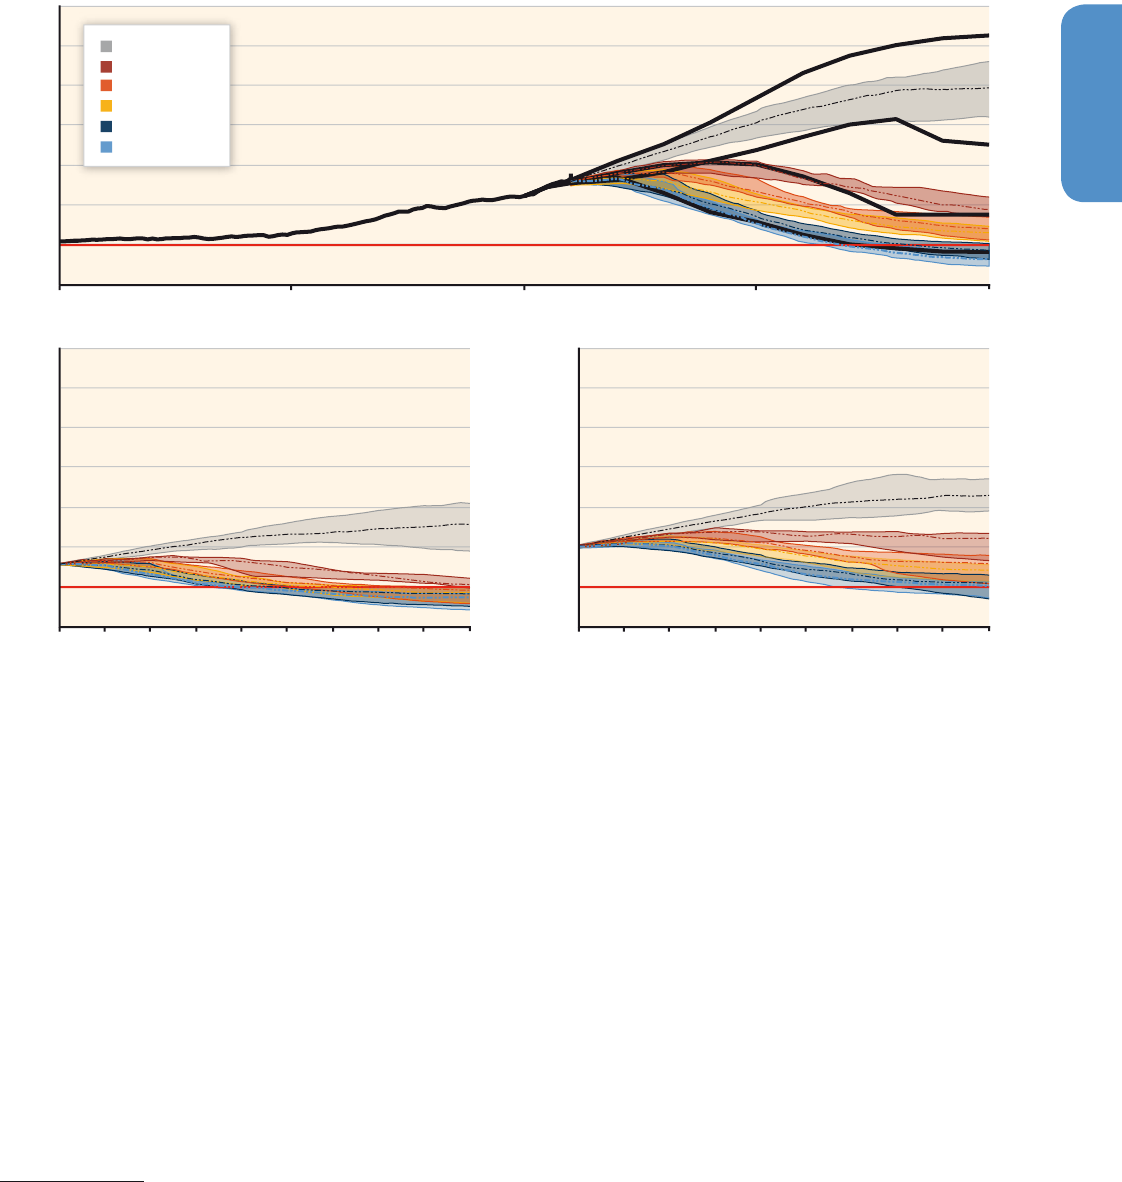
555555
Energy Systems
7
Chapter 7
supply sector and those in the end-use sectors) are expected to con-
tinue to increase from current levels to about 55 – 70 GtCO
2
by 2050
(25th – 75th percentile of the scenarios in the WGIII AR5 Scenario Data-
base, see Figure 7.9).
30
This corresponds to an increase of between
80 % and 130 % compared to emissions of about 30 GtCO
2
in the year
2010.
By the end of the 21st century, emissions could grow further, the
75th percentile of scenarios reaching about 90 GtCO
2
.
31,32
The stabilization of GHG concentrations requires fundamental
changes in the global energy system relative to a baseline scenario.
For example, in mitigation scenarios reaching 450 ppm CO
2
eq con-
centrations in 2100, CO
2
emissions from the energy supply sec-
30
Note that the total energy-related emissions include in some scenarios also fossil
fuel emissions from industrial processes, such as the use of fossil fuel feedstocks
for lubricants, asphalt, or cement production. A split between energy and indus-
trial process emissions is not available from the WGIII AR5 Scenario Database.
31
The full uncertainty range of the WGIII AR5 Scenario Database includes high-
emissions scenarios approaching 80 GtCO
2
by 2050, and almost 120 GtCO
2
by
2100.
32
If not otherwise mentioned, ranges refer to the 25th — 75th percentile of the
WGIII AR5 Scenario Database.
tor decline over the next decades, reach 90 % below 2010 levels
between 2040 and 2070 and in many scenarios decline to below
zero thereafter. As discussed in Section 7.11.4, unlike traditional
pollutants, CO
2
concentrations can only be stabilized if global emis-
sions peak and in the long term, decline toward zero. The lower
the concentration at which CO
2
is to be stabilized, the sooner and
lower is the peak. For example, in the majority of the scenarios
compatible with a long-term concentration goal of below 480 ppm
CO
2
eq, energy-related emissions peak between 2020 and 2030,
and decline to about 10 – 15 GtCO
2
by 2050 (Figure 7.9). This cor-
responds to emissions reductions by 2050 of 50 – 70 % compared
to the year 2010, and 75 – 90 % compared to the business-as-usual
(25th – 75thpercentile).
7�11�2 Energy supply in low-stabilization
scenarios
While stabilizing CO
2
eq concentrations requires fundamental changes
to the global energy supply systems, a portfolio of measures is avail-
able that includes the reduction of final energy demand through
Figure 7�9 | Global development of annual CO
2
emissions for the full energy system including energy supply, and end uses (upper panel), and the split between electricity and non-
electric emissions (lower panels). The baseline emissions range (grey) is compared to the range of emissions from mitigation scenarios grouped according to their long-term CO
2
eq
concentration level by 2100. Shaded areas correspond to the 25th – 75th percentile and dashed lines to the median across the scenarios. ‘Non-electric’ comprises emissions from
the full chain of non-electric conversion processes as well as emissions from fossil fuels supplied to the end-use sectors. The upper panel includes in addition also the representa-
tive concentration pathways (RCPs) (black lines, see Chapter 6, Table 6.2). Source: WGIII AR5 Scenario Database (See Section 6.2.2 and Annex II.10). Note: Some scenarios report
industrial process emissions (e. g., CO
2
released from cement manufacture beyond energy-related emissions) as part of the energy system.
2010 2020 2030 2040 2050 2060 2070 2080 2090 2100
CO
2
Emissions [GtCO
2
]
-20
0
20
40
60
80
100
120
2010 2020 2030 2040 2050 2060 2070 2080 2090 2100
CO
2
Emissions [GtCO
2
]
-20
0
20
40
60
80
100
120
1900 1950 2000 2050 2100
CO
2
Emissions [GtCO
2
]
-20
0
20
40
60
80
100
120
RCP 8.5
RCP 6.0
RCP 4.5
RCP 2.6
Full Energy Sector Emissions
Non-Electric
Electricity
430-480 ppm CO
2
eq
480-530 ppm CO
2
eq
530-580 ppm CO
2
eq
650-720 ppm CO
2
eq
580-650 ppm CO
2
eq
Baseline
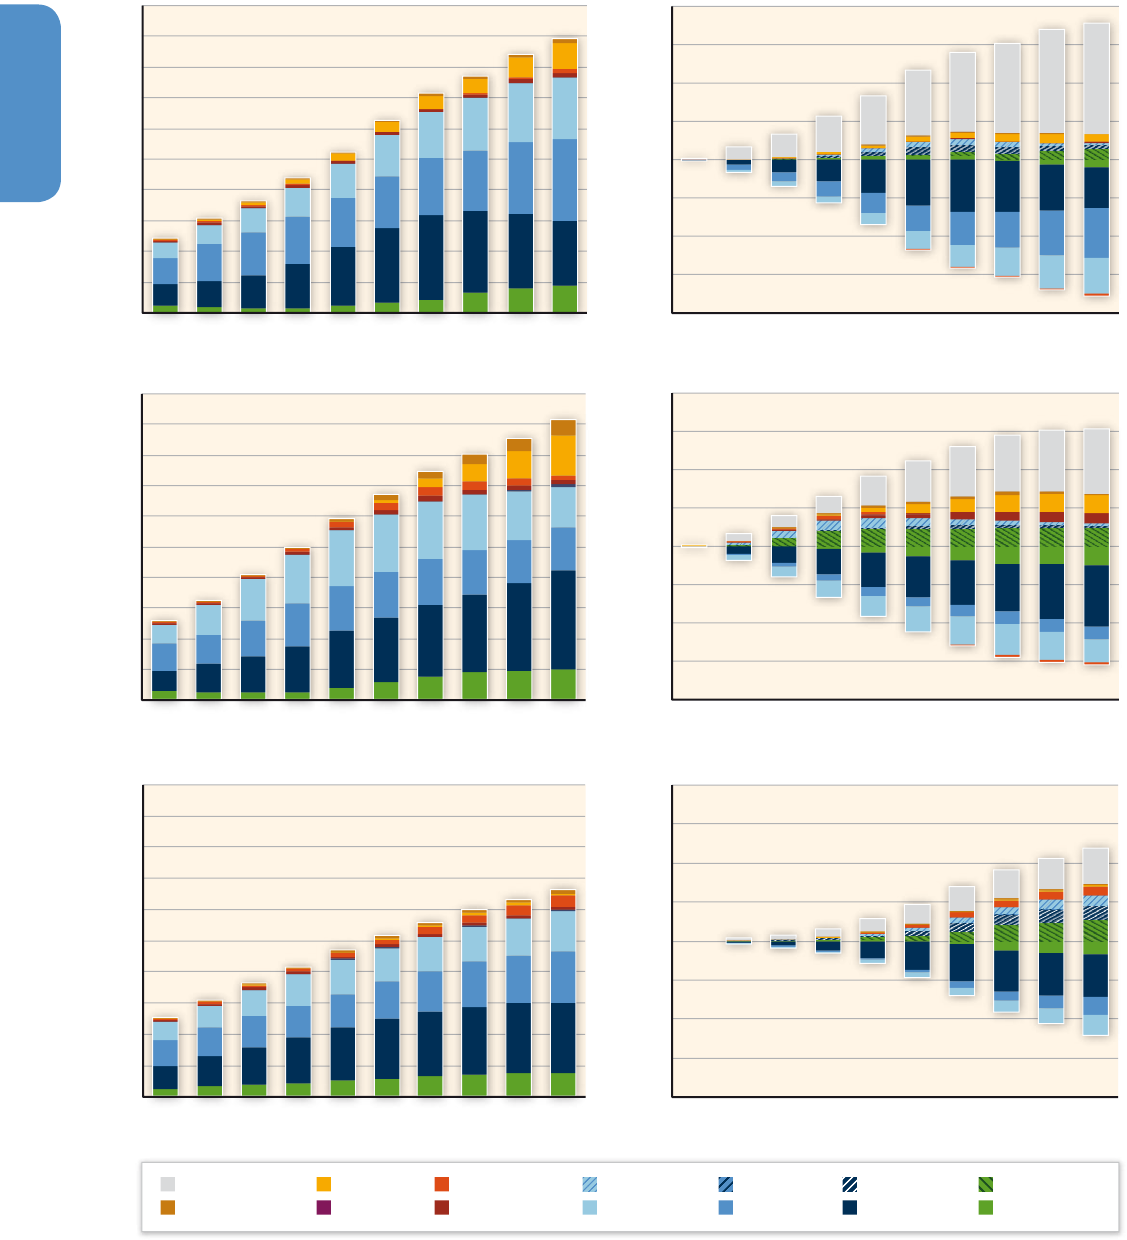
556556
Energy Systems
7
Chapter 7
Figure 7�10 | Development of annual primary energy supply (EJ) in three illustrative baseline scenarios (left-hand panel); and the change in primary energy compared to the base-
line to meet a long-term concentration target between 430 and 530 ppm CO
2
eq. Source: ReMIND (RoSE: Bauer etal., 2013); GCAM (AME: Calvin etal., 2012); MESSAGE (GEA:
Riahi etal., 2012).*
*
Note that ‘Savings’ is calculated as the residual reduction in total primary energy.
0
200
400
600
800
1000
1200
1400
1600
1800
2000
Total Primary Energy Supply [EJ]
0
200
400
600
800
1000
1200
1400
1600
1800
2000
Total Primary Energy Supply [EJ]
0
200
400
600
800
1000
1200
1400
1600
1800
2000
2010
2020
2030
2040
2050
2060
2070
2080
2090
2100
2010
2020
2030
2040
2050
2060
2070
2080
2090
2100
2010
2020
2030
2040
2050
2060
2070
2080
2090
2100
2010
2020
2030
2040
2050
2060
2070
2080
2090
2100
2010
2020
2030
2040
2050
2060
2070
2080
2090
2100
2010
2020
2030
2040
2050
2060
2070
2080
2090
2100
Total Primary Energy Supply [EJ]
MESSAGE
-1600
-1200
-800
-400
0
400
800
1200
1600
-1600
-1200
-800
-400
0
400
800
1200
1600
-1600
-1200
-800
-400
0
400
800
1200
1600
Change in Total Primary Energy Supply
Compared to the Baseline [EJ]
MESSAGE
GCAM GCAM
REMIND REMIND
Efficiency/Demand
Wind
Solar
Ocean
Nuclear
Geothermal
Biomass w/CCS
Biomass w/o CCS
Coal w/CCS
Coal w/o CCS
Oil w/CCS
Oil w/o CCS
Gas w/CCS
Gas w/o CCS
Change in Total Primary Energy Supply
Compared to the Baseline [EJ]
Change in Total Primary Energy Supply
Compared to the Baseline [EJ]
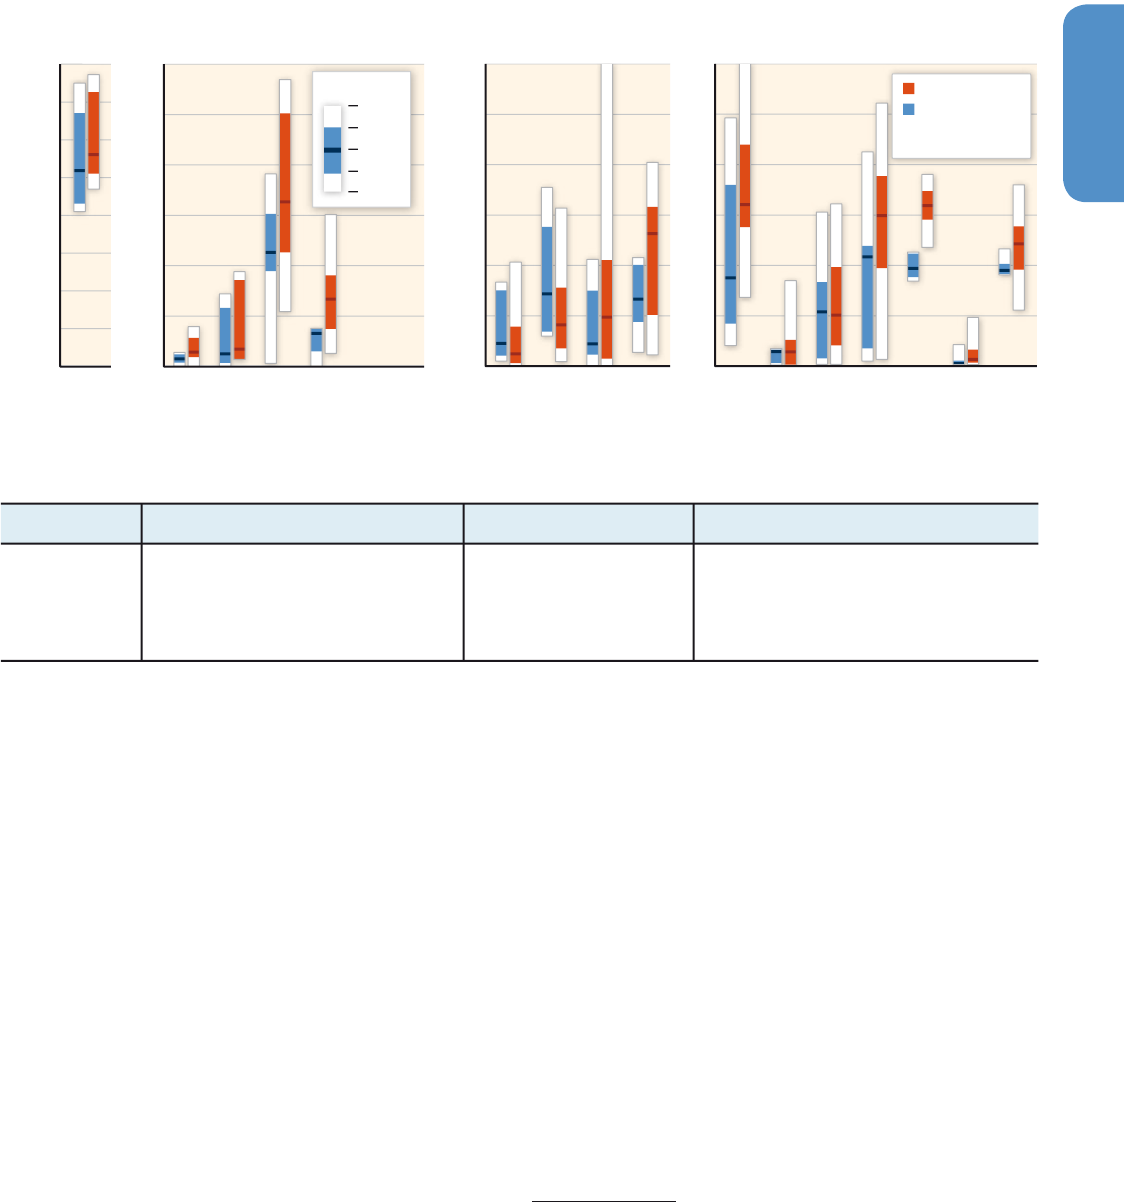
557557
Energy Systems
7
Chapter 7
enhanced efficiency or behavioural changes as well as fuel switch-
ing (e. g., from coal to gas) and the introduction of low-carbon supply
options such as renewables, nuclear, CCS, in combination with fossil or
biomass energy conversion processes, and finally, improvements in the
efficiency of fossil fuel use. These are discussed in Section 7.5 as well
as in Chapters 8 – 10.
Figure 7.10 shows three examples of alternative energy system trans-
formation pathways that are consistent with limiting CO
2
eq concen-
trations to about 480 ppm CO
2
eq by 2100. The scenarios from the
three selected models are broadly representative of different strate-
gies for how to transform the energy system. In absence of new poli-
cies to reduce GHG emissions, the energy supply portfolio of the sce-
narios continues to be dominated by fossil fuels. Global energy supply
in the three baseline scenarios increases from present levels to
900 – 1200 EJ / yr by 2050 (left-hand panels of Figure 7.10). Limiting
concentrations to low levels requires the rapid and pervasive replace-
ment of fossil fuel without CCS (see the negative numbers at the
right-hand panels of Figure 7.10). Between 60 and 300 EJ of fossil
fuels are replaced across the three scenarios over the next two
decades (by 2030). By 2050 fossil energy use is 230 – 670 EJ lower
than in non-climate-policy baseline scenarios.
33
The three scenarios achieve their concentration goals using different
portfolios. These differences reflect the wide range in assumptions
about technology availability and the policy environment.
34
While the
pace of the transformation differs across the scenarios (and depends
also on the carbon-intensity and energy-demand development in the
baseline), all three illustrative scenarios show the importance of mea-
sures to reduce energy demand over the short term. For instance, by
33
The numbers refer to the replacement of freely emitting (unabated) fossil fuels
without CCS. The contribution of fossil fuels with CCS is increasing in the mitiga-
tion scenarios.
34
For example, the MESSAGE scenario corresponds to the so-called “efficiency” case
of the Global Energy Assessment, which depicts low energy demand to test the
possibility of meeting the concentration goal even if nuclear power were phased
out. GCAM on the other hand imposed no energy supply technology availability
constraints and assumed advances across a broad suite of technologies.
Figure 7�11 | Influence of energy demand on the deployment of energy supply technologies for stringent mitigation scenarios (430 – 530 ppm CO
2
eq) in 2050. Blue bars for ‘low
energy demand’ show the deployment range of scenarios with limited growth of final energy of <20 % in 2050 compared to 2010. Red bars show the deployment range of tech-
nologies in case of ‘high energy demand’ (>20 % growth in 2050 compared to 2010). For each technology, the median-, interquartile-, and full-deployment range is displayed.
(Source: WGIII AR5 Scenario Database; see Annex II.10).
Notes: Scenarios assuming technology restrictions and scenarios with final energy in the base-year outside ± 5 % of 2010 inventories are excluded. Ranges include results from
many different integrated models. Multiple scenario results from the same model were averaged to avoid sampling biases. For further details see Chapter6.
Min
75
th
Max
Median
25
th
Percentile
4321
Secondary Energy Supply [EJ/yr]
0
10
20
30
40
50
60
Secondary Energy Supply [EJ/yr]
0
10
20
30
40
50
60
Secondary Energy Supply [EJ/yr]
0
10
20
30
40
50
60
Secondary Energy Supply [EJ/yr]
0
20
40
60
80
100
120
140
160
High Energy Demand
Low Energy Demand
In 430-530 ppm CO
2
eq
Mitigation Scenarios
Oil Products
Liquids Coal
Liquids Gas
Liquids Biomass
Hydrogen
Nuclear
Biomass w/o CCS
Biomass w/ CCS
Solar
Wind
Geothermal
Hydro
Coal w/o CCS
Coal w/ CCS
Gas w/o CCS
Gas w/ CCS
Electricity Generation
Coal and Natural Gas
Non-Fossil
Liquids and Hydrogen
Oil
Other Liquids and H
2
High energy
demand scenarios
show higher levels
of oil supply.
In high energy demand scenarios, alternative liquid
and hydrogen technologies are scaled up more
rapidly.
High energy demand scenarios show
a more rapid up-scaling of CCS
technologies but a more rapid phase-
out of unabated fossil fuel conversion
technologies.
In high energy demand scenarios non-fossil electricity
generation technologies are scaled up more rapidly.
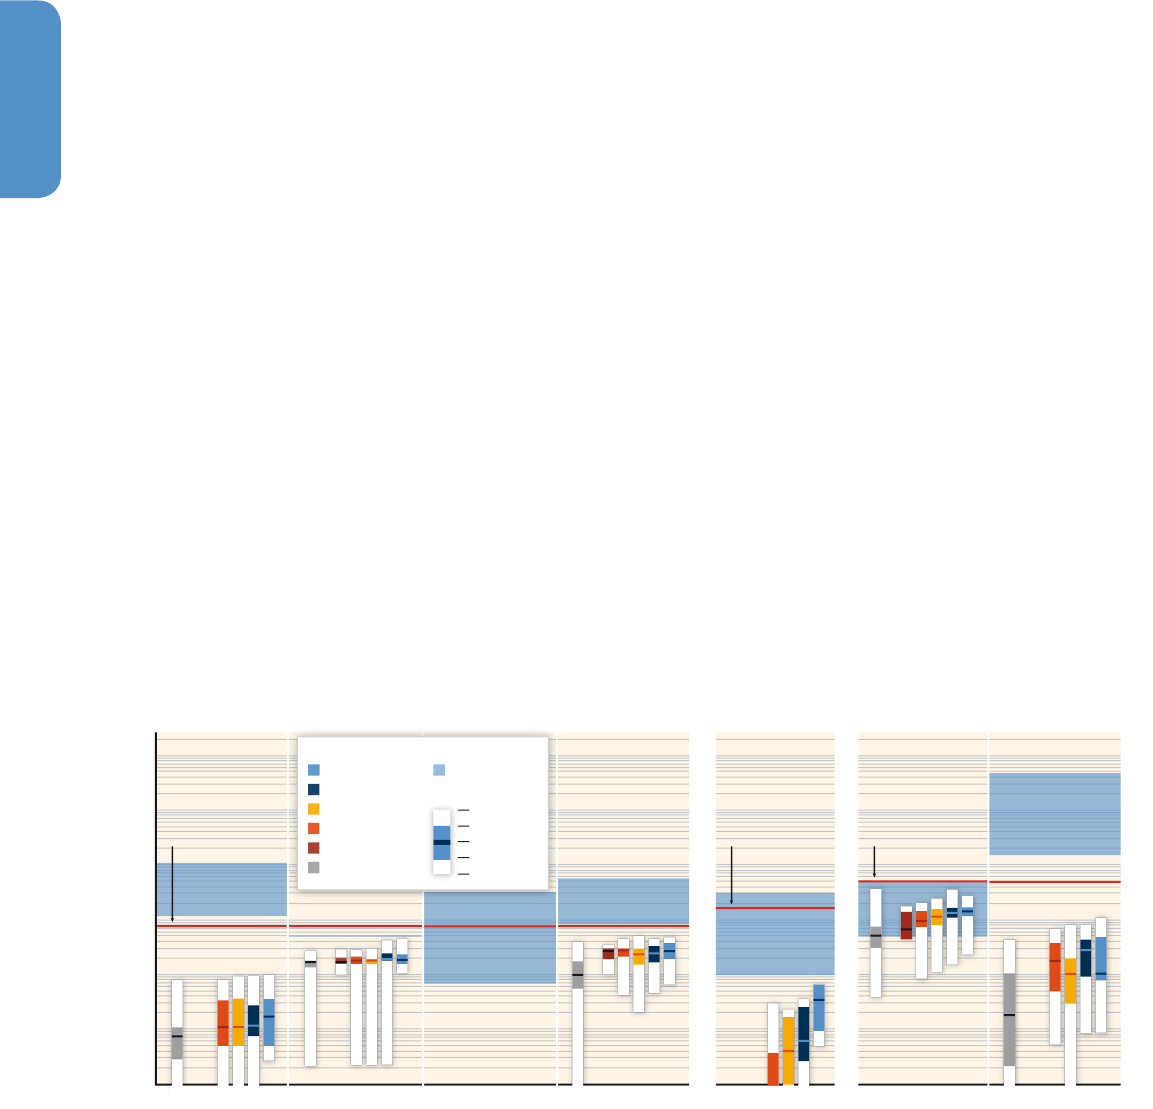
558558
Energy Systems
7
Chapter 7
2030, between 40 – 90 % of the emissions reductions are achieved
through energy-demand savings, thus reducing the need for fossil
fuels. The long-term contribution of energy-demand savings differs,
however, significantly across the three scenarios. For instance, in MES-
SAGE about 1200 EJ of fossil fuels are replaced through efficiency and
demand-side improvements by 2100, compared to about 400 EJ in the
GCAM scenario.
Achieving concentrations at low levels (430 – 530 ppm CO
2
eq) requires
significant up-scaling of low-carbon energy supply options. The up-
scaling of low-carbon options depends greatly on the development
of energy demand, which determines the overall ‘size’ of the sys-
tem. Hence, scenarios with greater emphasis on efficiency and other
measures to limit energy demand, generally show less pervasive and
rapid up-scaling of supply-side options (see right-side panels of Fig-
ure 7.11). Figure 7.11 compares stringent mitigation scenarios with
low and comparatively high global energy demands by 2050. The
higher energy-demand scenarios are generally accompanied by higher
deployment rates for low-carbon options and more rapid phaseout of
freely emitting fossil fuels without CCS. Moreover, and as also shown
by Figure 7.11, high energy demand leads to a further ‘lock-in’ into
fossil-intensive oil-supply infrastructures, which puts additional pres-
sure on the supply system of other sectors that need to decarbonize
more rapidly to compensate for the increased emissions from oil prod-
ucts. The results confirm the importance of measures to limit energy
demand (Wilson et al, 2013) to increase the flexibility of energy supply
systems, thus reducing the risk that stringent mitigation stabilization
scenarios might get out of reach (Riahi etal., 2013). Note also that
even at very low concentration levels, a significant fraction of energy
supply in 2050 may be provided by freely emitting fossil energy (with-
out CCS).
The projected deployment of renewable energy technologies in the
mitigation scenarios (Figure 7.12), with the exception of biomass, is
well within the estimated global technical potentials assessed by the
IPCC (2011a). As illustrated in Figure 7.12, global technical potentials
of, for instance, wind, solar, geothermal, and ocean energy are often
more than an order of magnitude larger than the projected deploy-
ment of these technologies by 2050. Also for hydropower the technical
potentials are larger than the projected deployment, whereas for bio-
mass, projected global deployment is within the wide range of global
technical potential estimates. Considering the large up-scaling in the
mitigation scenarios, global technical potentials of biomass and hydro-
power seem to be more limiting than for other renewables (Figure
7.12). That said, considering not only global potentials, but also
regional potentials, other renewable energy sources may also be lim-
ited by technical potentials under mitigation scenarios (Fischedick
etal., 2011).
Figure 7�12 | Comparison of global technical potentials of renewable energy sources (Moomaw etal., 2011b) and deployment of renewable energy technologies in integrated
model scenarios in 2050 (WGIII AR5 Scenario Database, see Annex II.10). Solar energy and biomass are displayed as primary energy as they can serve multiple uses. Note that the
figure is presented in logarithmic scale due to the wide range of assessed data. Integrated model mitigation scenarios are presented for different ranges of CO
2
eq concentration
levels (see Chapter 6).
Notes: The reported technical potentials refer to the total worldwide annual RE supply. Any potential that is already in use is not deducted. Renewable energy power sources could
also supply heating applications, whereas solar and biomass resources are represented in terms of primary energy because they could be used for multiple (e. g., power, heat, and
transport) services. The ranges were derived by using various methodologies and the given values refer to different years in the future. As a result, the displayed ranges cannot be
strictly compared across different technologies. Additional information concerning data sources and additional notes that should be taken into account in interpreting the figure,
see Moomaw etal. (2011b). Contribution of ocean energy in the integrated model scenarios is less than 0.1 EJ and thus outside the logarithmic scale of the figure. Note that not
all scenarios report deployment for all RE sources. The number of assessed scenarios differs thus across RE sources and scenario categories. The abbreviation ‘n. a.’ indicates lack of
data for a specific concentration category and RE. Scenarios assuming technology restrictions are excluded.
[EJ/yr]
0.1
1
10
100
1000
10,000
100,000
Geothermal Hydro Ocean Wind Geothermal Biomass Solar
Electricity Heat Primary Energy
n.a.
n.a.
n.a.
n.a.
Global Electricity
Demand, 2010: 77 EJ
Global Heat
Demand, 2008: 164 EJ
Global Primary Energy
Supply, 2010: 510 EJ
430-480 ppm CO
2
eq
480-530 ppm CO
2
eq
530-580 ppm CO
2
eq
650-720 ppm CO
2
eq
580-650 ppm CO
2
eq
Baseline
Scenarios in AR5
Min
75
th
Max
Percentile
Median
25
th
Technical Potential

559559
Energy Systems
7
Chapter 7
Additionally, reaching the global deployment levels as projected by
the mitigation scenarios requires addressing potential environmental
concerns, public acceptance, the infrastructure requirements to man-
age system integration and deliver renewable energy to load centres,
and other barriers (see Section 7.4.2, 7.6, 7.8, 7.9, 7.10; IPCC, 2011a).
Competition for land and other resources among different renewables
may also impact aggregate technical potentials as well as deployment
levels, as might concerns about the carbon footprint and sustainability
of the resource (e. g., biomass) as well as materials demands (cf. Annex
Bioenergy in Chapter 11; de Vries etal., 2007; Kleijn and van der Voet,
2010; Graedel, 2011). In many mitigation scenarios with low demand,
nuclear energy supply is projected to increase in 2050 by about a fac-
tor of two compared to today, and even a factor of 3 or more in case
of relatively high energy demand (Figure 7.11). Resource endowments
will not be a major constraint for such an expansion, however, greater
efforts will be necessary to improve the safety, uranium utilization,
waste management, and proliferation concerns of nuclear energy use
(see also Sections7.5.4, 7.4.3, 7.8, 7.9, and 7.10).
Integrated models (see Section 6.2) tend to agree that at about USD
100 – 150 / tCO
2
the electricity sector is largely decarbonized with a sig-
nificant fraction being from CCS deployment (Krey and Riahi, 2009;
Luckow etal., 2010; Wise etal., 2010). Many scenarios in the WGIII
AR5 Scenario Database achieve this decarbonization at a carbon
tax of approximately USD 100 / tCO
2
. This price is sufficient, in most
scenarios, to produce large-scale utilization of bioenergy with CCS
(BECCS) (Krey and Riahi, 2009; Azar etal., 2010; Luckow etal., 2010;
Edmonds etal., 2013). BECCS in turn allows net removal of CO
2
from
the atmosphere while simultaneously producing electricity (Sections
7.5.5 and 11.13). In terms of large-scale deployment of CCS in the
power sector, Herzog (2011, p.597), and many others have noted that
“Significant challenges remain in growing CCS from the megatonne
level where it is today to the gigatonne level where it needs to be
to help mitigate global climate change. These challenges, none of
which are showstoppers, include lowering costs, developing needed
infrastructure, reducing subsurface uncertainty, and addressing legal
and regulatory issues”. In addition, the up-scaling of BECCS, which
plays a prominent role in many of the stringent mitigation scenarios
in the literature, will require overcoming potential technical barriers
to increase the size of biomass plants. Potential adverse side effects
related to the biomass feedstock usage remain the same as for bio-
mass technologies without CCS (Sections 7.5.5, 11.13, particularly
11.7, 11.13.6, and 11.13.7).
Over the past decade, a standardized geologic CO
2
storage-capacity
methodology for different types of deep geologic formations (Bachu
etal., 2007; Bradshaw etal., 2007; Kopp etal., 2009; Orr, 2009; Good-
man etal., 2011; De Silva etal., 2012) has been developed and applied
in many regions of the world. The resulting literature has been sur-
veyed by Dooley (2013), who reports that, depending on the quality of
the underlying data used to calculate a region’s geologic CO
2
storage
capacity, and on the type and stringency of various engineering and
economic constraints, global theoretical CO
2
storage could be as much
as 35,000 GtCO
2
, global effective storage capacity is 13,500 GtCO
2
,
global practical storage capacity is 3,900 GtCO
2
, and matched geo-
logic CO
2
storage capacity for those regions of the globe where this
has been computed is 300 GtCO
2
. Dooley (2013) compared these esti-
mates of geologic storage capacity to the potential demand for stor-
age capacity in the 21st century by looking across more than 100 peer-
reviewed scenarios of CCS deployment. He concludes that a lack of
geologic storage space is unlikely to be the primary impediment to CCS
deployment as the average demand for geologic CO
2
storage for sce-
narios that have end-of-century CO
2
concentrations of 400 – 500 ppm
ranges from 448 GtCO
2
to 1,000 GtCO
2
.
Energy system response to a prescribed climate policy varies across
models and regions. There are multiple alternative transition path-
ways, for both the global energy system as a whole, and for individual
regional energy systems. In fact the special circumstances encountered
by individual regions imply greater regional variety in energy mitiga-
tion portfolios than in the global portfolio (Calvin etal., 2012; Bauer
etal., 2013).
7�11�3 Role of the electricity sector in climate
change mitigation
Electrification of the energy system has been a major driver of the his-
torical energy transformation from an originally biomass-dominated
energy system in the 19th century to a modern system with high reli-
ance on coal and gas (two of the major sources of electricity genera-
tion today). Many mitigation scenario studies (Edmonds etal., 2006;
as well as the AR5 database; cf. Sections 6.3.4 and 6.8) have three
generic components: (1) decarbonize power generation; (2) substitute
electricity for direct use of fossil fuels in buildings and industry (see
Sections 9.3 and 10.4), and in part for transportation fuels (Chapter
8); and (3) reduce aggregate energy demands through technology and
other substitutions.
Most scenarios in the WGIII AR5 Scenario Database report a continu-
ation of the global electrification trend in the future (Figure 7.13). In
the baseline scenarios (assuming no new climate policies) most of the
demand for electricity continues to be in the residential, commercial,
and industry sectors (see Chapters 9 and 10), while transport sectors
rely predominantly on liquid fuels (Section 8.9). Biofuels and electricity
both have the potential to provide transport services without fossil fuel
emissions. The relative contribution of each depends at least in part on
the character of technologies that evolve to provide transport services
with each fuel.
Electricity production is the largest single sector emitting fossil fuel CO
2
at present and in baseline scenarios of the future. A variety of mitiga-
tion options exist in the electricity sector, including renewables (wind,
solar energy, biomass, hydro, geothermal), nuclear, and the possibility
of fossil or biomass with CCS. The electricity sector plays a major role
in mitigation scenarios with deep cuts of GHG emissions. Many mitiga-
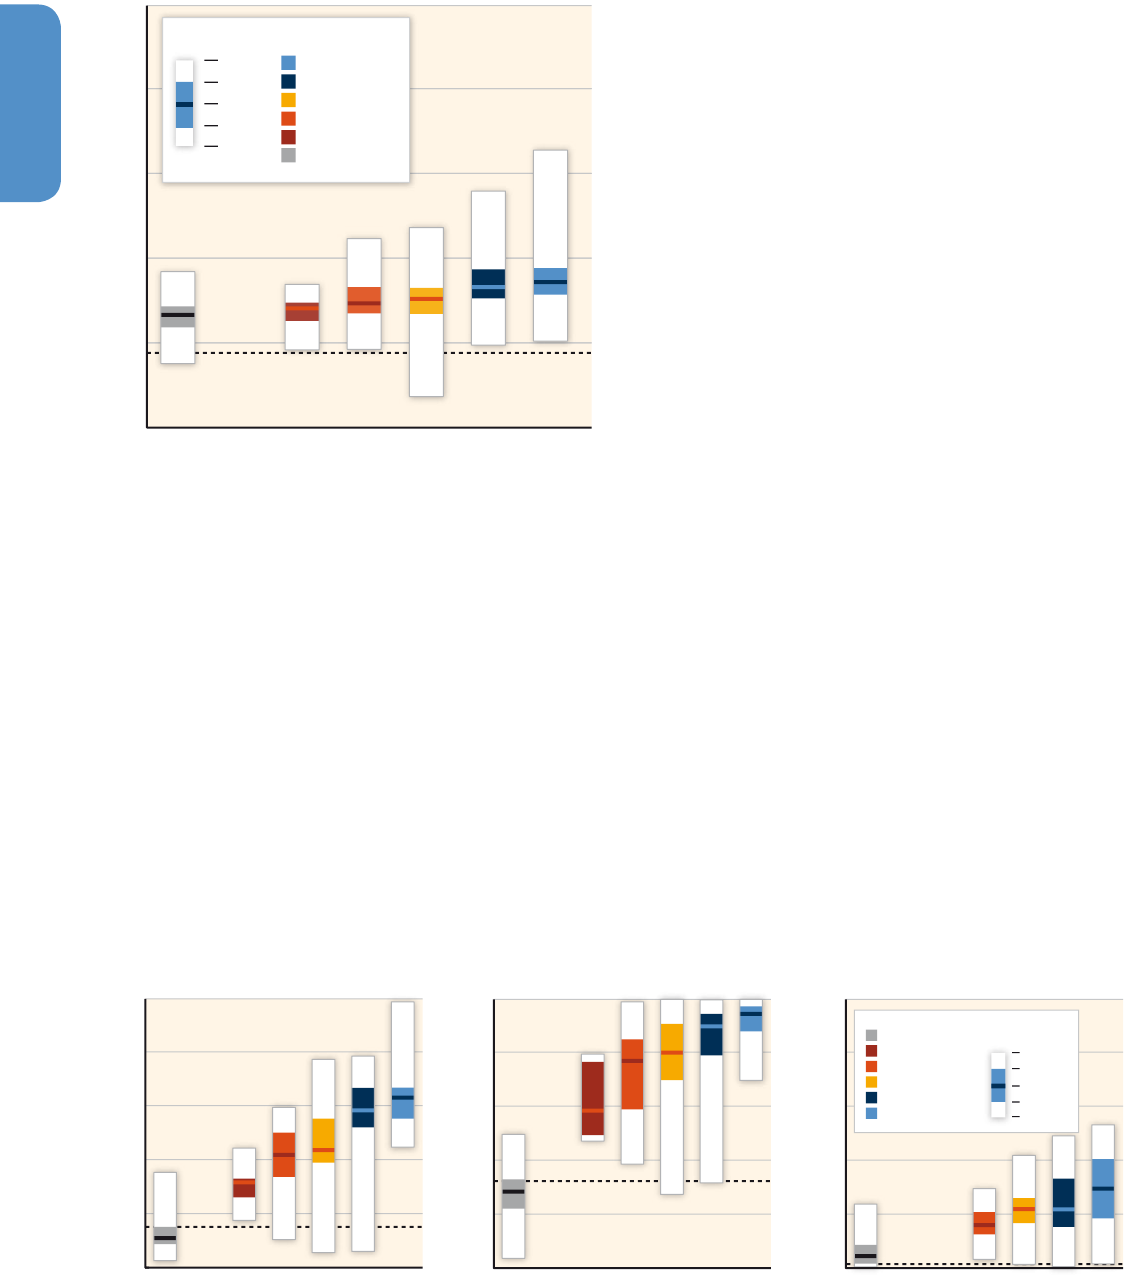
560560
Energy Systems
7
Chapter 7
tion scenario studies report an acceleration of the electrification trend
in mitigation scenarios (Figure 7.13).
Mitigation scenario studies indicate that the decarbonization of the
electricity sector may be achieved at a much higher pace than in the
rest of the energy system (Figure 7.14). In the majority of stringent
mitigation scenarios (430 – 480 ppm and 480 – 530 ppm), the share of
low-carbon energy increases from presently about 30 % to more than
80 % by 2050. In the long term (2100), fossil-based electricity genera-
tion without CCS is phased out entirely in these scenarios.
Figure 7.15 shows the evolution over time of transformation pathways
for primary energy supply, electricity supply, and liquid fuels supply for
reference scenarios and low-concentration scenarios (430 – 530 ppm
CO
2
eq). The development of the full scenario ensemble is further com-
pared to the three illustrative mitigation scenarios by the ReMIND,
MESSAGE, and GCAM models discussed in Section 7.11.2 (see Figure
7.10). The effect of climate policy plays out differently in each of the
three supply domains. In aggregate, mitigation leads to a reduction
in primary energy demands. However, two distinctly different mitiga-
tion portfolios emerge – one in which hydro-carbon fuels, including
biomass, BECCS, and fossil CCS play a prominent role; and the other
where, taken together, non-biomass renewables and nuclear power
take center stage. In both instances, the share of fossil energy without
CCS declines to less than 20 % of the total by 2100. Note that in the
scenarios examined here, the major branch point occurs around the
2050 period, while the foundations are laid in the 2030 to 2050 period.
Electricity generation is a somewhat different story. While as previously
noted, electricity generation decarbonizes rapidly and completely (in
many scenarios emissions actually become negative), taken together,
non-biomass renewables and nuclear power always play an impor-
tant role. The role of CCS varies greatly, but even when CCS becomes
extremely important to the overall mitigation strategy, it never exceeds
half of power generation. By 2050, the contribution of fossil CCS tech-
nologies is in most scenarios larger than BECCS (see Figure 7.11). In
contrast to the overall scale of primary energy supply, which falls in cli-
mate policy scenarios relative to baseline scenarios, the scale of power
generation can be higher in the presence of climate policy depending
on whether the pace of electrification proceeds more or less rapidly
than the rate of end-use energy demand reductions. With regards to
the deployment of individual non-biomass renewables or different CCS
technologies, see also Figure 7.11 and Figure 7.12.
Liquid fuels are presently supplied by refining petroleum. Many sce-
narios report increasing shares for liquids derived from other primary
Figure 7�14 | Share of low-carbon energy in total primary energy, electricity and liquid supply sectors for the year 2050. Colored bars show the interquartile range and white bars
indicate the full range across the baseline and mitigation scenarios for different CO
2
eq ppm concentration levels in 2100 (Section 6.3.2). Dashed horizontal lines show the low-
carbon share for the year 2010. Low-carbon energy includes nuclear, renewables, fossil fuels with CCS and bioenergy with CCS: WGIII AR5 Scenario Database (see Annex II.10).
Scenarios assuming technology restrictions are excluded.
0
20
40
60
80
100
2010
2010
Low Carbon Share of Primary Energy (2050) [%]
Primary Energy
0
20
40
60
80
100
Low Carbon Share of Electricity (2050) [%]
Electricity
n.a.
2010
0
20
40
60
80
100
Low Carbon Share of Liquids Supply (2050) [%]
Liquid Fuels Supply
430-480 ppm CO
2
eq
480-530 ppm CO
2
eq
530-580 ppm CO
2
eq
580-650 ppm CO
2
eq
Baselines
650-720 ppm CO
2
eq
Min
75
th
Max
Percentile
Median
25
th
Figure 7�13 | Share of electricity in total final energy for the year 2050 in baseline
scenarios and five different levels of mitigation stringency (long-term concentration lev-
els in ppm CO
2
eq by 2100). Colored bars show the interquartile range and white bars
indicate the full range across the baseline and mitigation scenarios (See Section 6.3.2).
Dashed horizontal line shows the electricity share for the year 2010. Source: WGIII AR5
Scenario Database (see Annex II.10). Scenarios assuming technology restrictions are
excluded.
0
20
40
60
80
100
2010
Electricity Share of Final Energy (2050) [%]
Min
75
th
Max
Median
25
th
Percentile
Baselines
430-480 ppm CO
2
eq
480-530 ppm CO
2
eq
530-580 ppm CO
2
eq
580-650 ppm CO
2
eq
650-720 ppm CO
2
eq
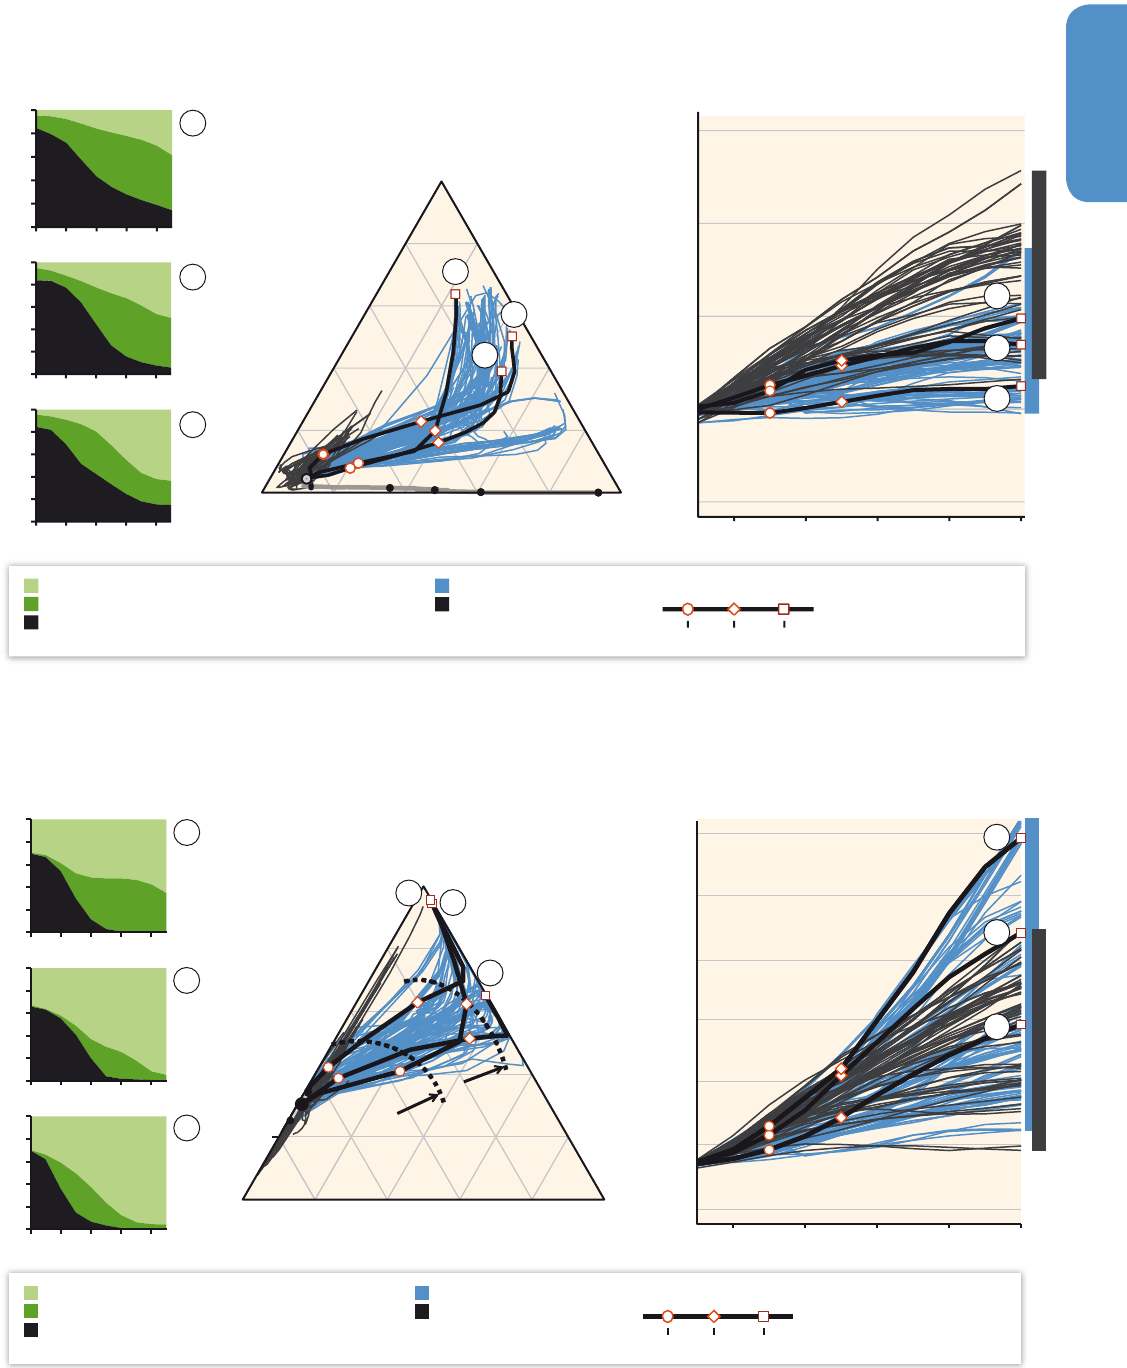
561561
Energy Systems
7
Chapter 7
ALL Biomass,
BECCS, Fossil CCS
0.8
0.6
0.4
0.2
0.8
Fossil Fuels (w/o CCS)
1850
2020 2040 2060 2080 2100
0
500
1000
1500
2000
Primary Energy [EJ/yr]
0.2
0.4
0.6
0.8
0.6
0.4
0.2
0.8
1900
1920
1950
1970
A
A
A
B
B
B
C
C
C
Primary Energy Shares
(AR5 Scenarios)
Primary Energy Shares
(Three Illustrative Scenarios)
Total Primary Energy
(AR5 Scenarios)
2010 2030 2050 2070 2090
0.0
0.2
0.4
0.6
0.8
1.0
2010 2030 2050 2070 2090
0.0
0.2
0.4
0.6
0.8
1.0
REMIND
MESSAGE
GCAM
ALL Non-Biomass
Renewables and Nuclear
2010 2030 2050 2070 2090
0.0
0.2
0.4
0.6
0.8
1.0
ALL Fossil Fuels
(w/o CCS)
Biomass +
BECCS +
Fossil CCS
Renewables
+ Nuclear
0.2
0.4
0.6
0.8
430-530 ppm CO
2
eq (AR5 Scenarios)
Baselines (AR5 Scenarios)
2030
2050
2100
Three Illustrative Scenarios
Renewables and Nuclear
Biomass + BECCS + Fossil CCS
Fossil Fuels (w/o CCS)
a) Primary Energy
430-530 ppm CO
2
eq (AR5 Scenarios)
Baselines (AR5 Scenarios)
2030
2050
2100
Three Illustrative Scenarios
2020 2040 2060 2080 2100
0
100
200
300
400
500
600
Electricity [EJ/yr]
0.2
0.4
0.6
0.8
0.2
0.4
0.6
0.8
0.8
0.6
0.4
0.2
0.8
0.6
0.4
0.2
0.8
Fossil Fuels (w/o CCS)
2030
2050
2010 2030 2050 2070 2090
0.0
0.2
0.4
0.6
0.8
1.0
2010 2030 2050 2070 2090
0.0
0.2
0.4
0.6
0.8
1.0
2010 2030 2050 2070 2090
0.0
0.2
0.4
0.6
0.8
1.0
REMIND
MESSAGE
GCAM
Renewables and Nuclear
Biomass + BECCS + Fossil CCS
Fossil Fuels (w/o CCS)
ALL Non-Biomass
Renewables and Nuclear
ALL Biomass,
BECCS, Fossil CCS
Biomass +
BECCS +
Fossil CCS
Renewables
+ Nuclear
Electricity Shares
(AR5 Scenarios)
Electricity Shares
(Three Illustrative Scenarios)
Total Electricity Supply
(AR5 Scenarios)
ALL Fossil Fuels
(w/o CCS)
A
A
A
B
B
B
C
C
C
b) Electricity Generation
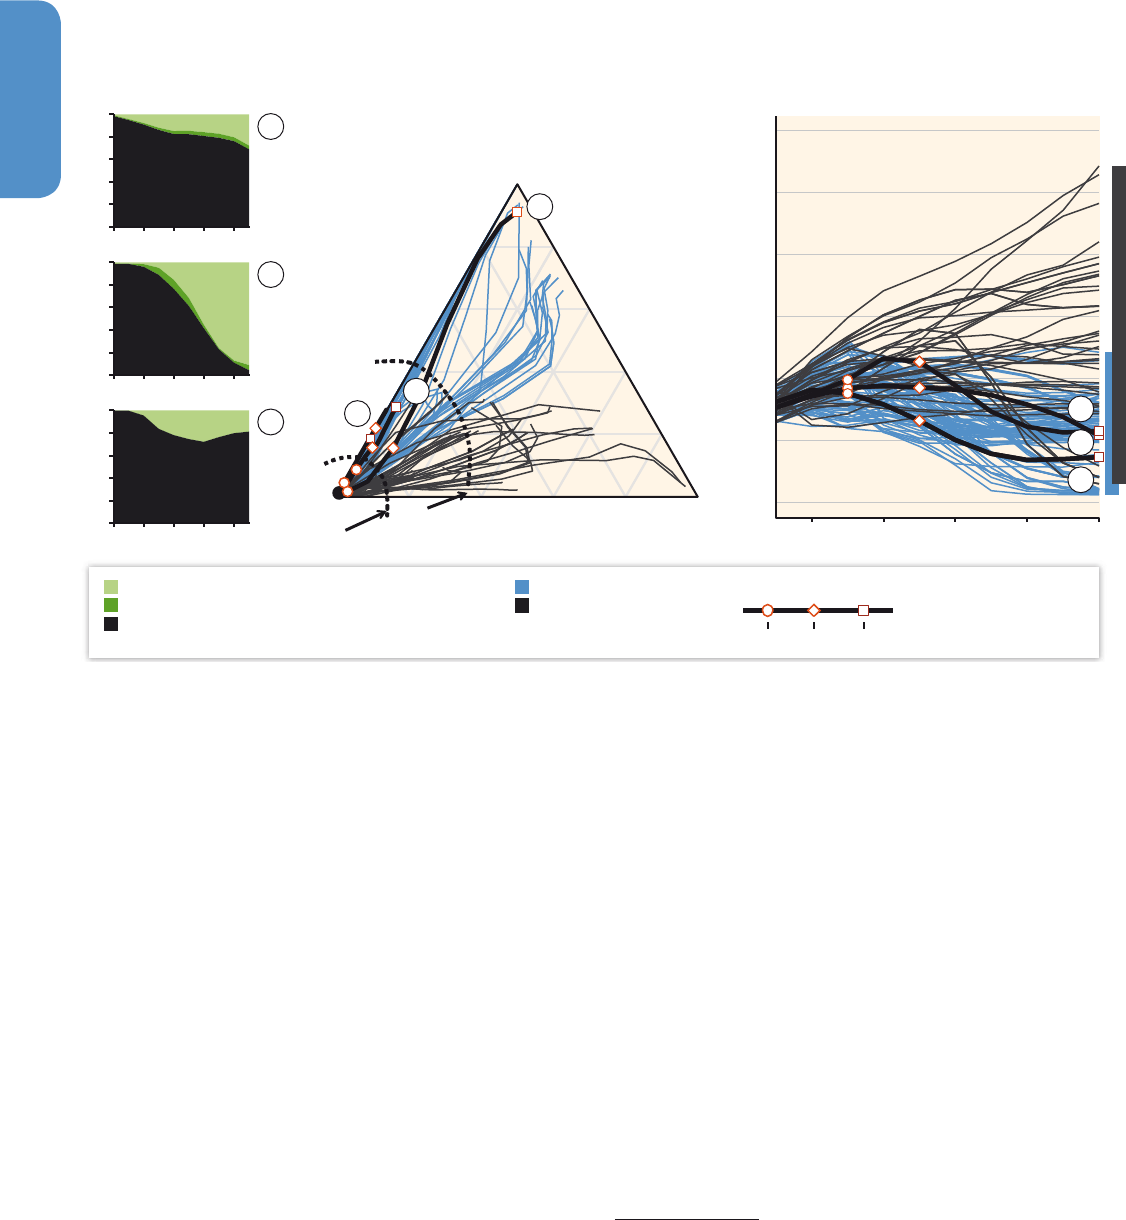
562562
Energy Systems
7
Chapter 7
energy feedstocks such as bioenergy, coal, and natural gas. This transi-
tion is gradual, and becomes more pronounced in the second half of
the century. Like aggregate primary energy supply, the supply of liquid
fuels is reduced in climate policy scenarios compared with baseline
scenarios. In addition, the primary feedstock shifts from petroleum and
other fossil fuels to bioenergy.
7�11�4 Relationship between short-term action
and long-term targets
The relationship between near-term actions and long-term goals is
complex and has received a great deal of attention in the research
literature. Unlike short-lived species (e. g., CH
4
, CO, NO
x
, and SO
2
) for
which stable concentrations are associated with stable emissions, sta-
ble concentrations of CO
2
ultimately in the long term require net emis-
sions to decline to zero (Kheshgi etal., 2005).
35
Two important implica-
tions follow from this observation.
First, it is cumulative emissions over the entire century that to a first
approximation determines the CO
2
concentration at the end of the
century, and therefore no individual year’s emissions are critical (for
cumulative CO
2
emissions consistent with different concentration
goals see Section6.3.2, and Meinshausen et al, 2009). For any stable
concentration of CO
2
, emissions must peak and then decline toward
zero, and for low concentrations, some period of negative emissions
may prove necessary.
35
The precise relationship is subject to uncertainty surrounding processes in both
the oceans and on land that govern the carbon cycle. Processes to augment ocean
uptake are constrained by international agreements.
Figure 7�15 | Transition Pathways for the Aggregate Energy Supply Transformation System (a), Electricity Supply (b), and the Supply of Liquid Fuels (c): 2010 to 2100 for baseline
and stringent mitigation scenarios (430 – 530 ppm CO
2
eq). The pathways of three illustrative scenarios (cases A, B, and C) are highlighted for comparison. The illustrative pathways
correspond to the same scenarios as shown in Figure 7.10. Dashed lines in the middle panels show the development to 2030 and 2050, and are indicative only for central trends
across the majority of the scenarios. Source: WGIII AR5 Scenario Database (see Section 6.2.2 and Annex II.10) and three illustrative scenarios from ReMIND (Rose: Bauer etal.,
2013); GCAM (AME: Calvin etal., 2012); and the MESSAGE model (GEA: Riahi etal., 2012).
Note: Scenarios assuming technology restrictions and scenarios with significant deviations for the base-year (2010) are excluded.
C
430-530 ppm CO
2
eq (AR5 Scenarios)
Baselines (AR5 Scenarios)
2030
2050
2100
Three Illustrative Scenarios
ALL
Biofuels
0.6
0.4
0.8
0.2
0.2
0.4
0.6
0.8
0.2
0.4
0.6
0.8
Oil Products
2020 2040 2060 2080 2100
0
100
200
300
400
500
600
Secondary Liquids [EJ/yr]
Liquid Fuel Shares
(
AR5
Scenarios)
Liquid Fuel Shares
(Three Illustrative Scenarios)
Total Liquid Fuel Supply
(
AR5
Scenarios)
2010 2030 2050 2070 2090
0.0
0.2
0.4
0.6
0.8
1.0
2010 2030 2050 2070 2090
0.0
0.2
0.4
0.6
0.8
1.0
2010 2030 2050 2070 2090
0.0
0.2
0.4
0.6
0.8
1.0
2030
REMIND
MESSAGE
GCAM
Biofuels
Gas and Coal to Liquids
Oil Products
2050
ALL Oil
Products
ALL Gas to Liquids
Coal to Liquids
Biomass
Gas to Liquids
and Coal to Liquids
A
A
A
B
B
C
C
C
B
c) Liquid Fuels Supply
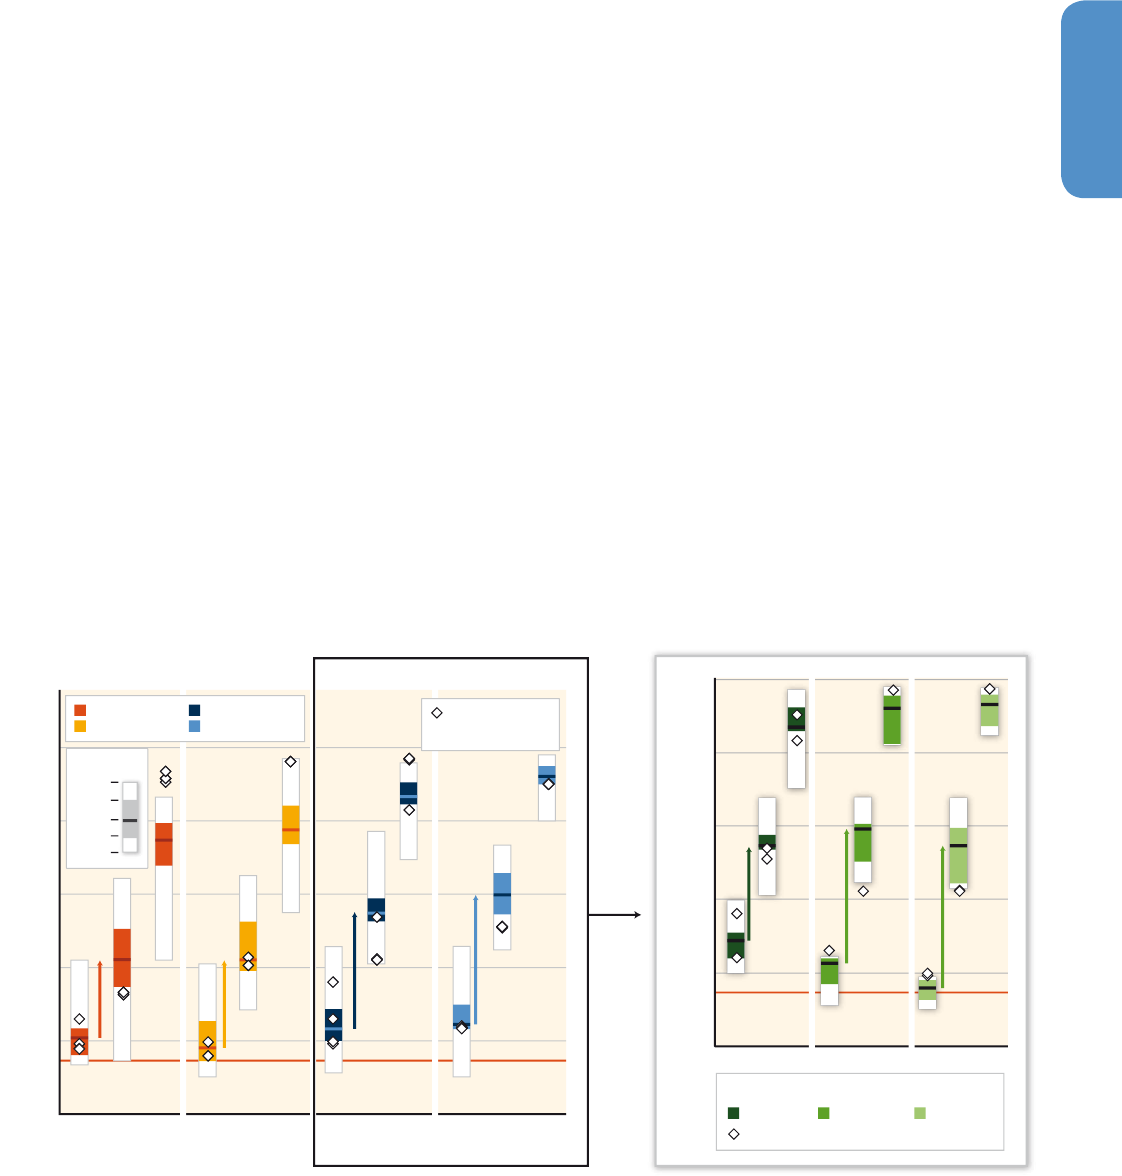
563563
Energy Systems
7
Chapter 7
Second, minimization of global social cost implies an immediate initia-
tion of global emissions mitigation, relative to a reference, no-climate-
policy scenario, with a marginal value of carbon that rises exponentially
(Hotelling, 1931; Peck and Wan, 1996). The consequence of this latter
feature is that emissions abatement and the deployment of mitigation
technologies grows over time. When only a long-term state, e. g., a fixed
level of radiative forcing in a specific year such as 2.6Wm
– 2
in 2100, is
prescribed, the interim path can theoretically take on any value before
the target year. ‘Overshoot scenarios’ are scenarios for which target
values are exceeded during the period before the target date. They
are possible because carbon is removed from the atmosphere by the
oceans over an extended period of time, and can be further extended
by the ability of society to create negative emissions through seques-
tration in terrestrial systems (Section 7.5, Chapter 11), production of
bioenergy in conjunction with CCS technology (Section 7.5.5), and / or
direct air capture (DAC). See for example, Edmonds, etal. (2013).
Even so, the bounded nature of the cumulative emissions associated
with any long-term CO
2
concentration limit creates a derived limit on
near-term emissions. Beyond some point, the system cannot adjust suf-
ficiently to achieve the goal. Early work linking near-term actions with
long-term goals was undertaken by researchers such as Swart, etal.
(1998), the ‘safe landing’ concept, and Bruckner, etal., (1999), the ‘tol-
erable windows’ concept. O’Neill, etal., (2010) and Rogelj etal., (2013)
assessed the relationship between emissions levels in 2020 and 2050
to meet a range of long-term targets (in 2100). They identified ‘emis-
sions windows’ through which global energy systems would need to
pass to achieve various concentration goals.
Recent intermodel comparison projects AMPERE, LIMITS and RoSE
(Bauer etal., 2013; Eom etal., 2013; Kriegler etal., 2013; Luderer etal.,
2013; Riahi etal., 2013; Tavoni etal., 2014) have explored the implica-
tions of different near-term emissions targets for the attainability and
costs of reaching low-concentrations levels of 430 – 530 ppm CO
2
eq.
The studies illustrate that the pace of the energy transformation will
strongly depend on the attainable level of emissions in the near term
(Figure 7.16). Scenarios that achieve comparatively lower global emis-
sions levels by 2030 (<50GtCO
2
eq) show a more gradual transforma-
tion to 2050 corresponding to about a doubling of the low-carbon
energy share every 20 years. Scenarios with higher 2030 emissions lev-
els (>55GtCO
2
eq) lead to a further ‘lock-in’ into GHG-intensive energy
infrastructures without any significant change in terms of the low-car-
bon energy share by 2030. This poses a significant challenge for the
time period between 2030 and 2050, where the low-carbon share in
these scenarios would need to be rapidly scaled by nearly a factor of
four (from about 15 % to about 60 % in 20 years).
Figure 7�16 | The up-scaling of low-carbon energy in scenarios meeting different 2100 CO
2
eq concentration levels (left panel). The right panel shows the rate of up-scaling for
different levels of emissions in 2030 in mitigation scenarios reaching 450 to 500 (430 – 530) ppm CO
2
eq concentrations by 2100. Colored bars show the interquartile range and
white bars indicate the full range across the scenarios, excluding those with large net negative global emissions (>20 GtCO
2
/ yr) (see Section 6.3.2 for more details). Scenarios
with large net negative global emissions are shown as individual points. The arrows indicate the magnitude of zero- and low-carbon energy supply up-scaling from 2030 to 2050.
Zero- and low-carbon energy supply includes renewables, nuclear energy, fossil energy with CCS, and bioenergy with CCS (BECCS). Note: Only scenarios that apply the full, uncon-
strained mitigation technology portfolio of the underlying models (default technology assumption) are shown. Scenarios with exogenous carbon price assumptions are excluded in
both panels. In the right panel, scenarios with policies affecting the timing of mitigation other than 2030 interim targets are also excluded. Sources: WGIII AR5 Scenario Database
(see Annex II.10). The right panel builds strongly upon scenarios from multimodel comparisons with explicit 2030 emissions targets: AMPERE: Riahi etal. (2013), Eom etal. (2013);
LIMITS: Kriegler etal. (2013), ROSE: Luderer etal. (2013).
2030 2050 2100 2030 2050 2100 2030 2050 2100 2030 2050 2100
2030 2050 2100 2030 2050 2100 2030 2050 2100
Low-Carbon Energy Share of Primary Energy [%]
Low-Carbon Energy Share of Primary Energy [%]
GHG Emission Levels in 2030:
0
20
40
60
80
100
+105%
+135%
+135%
+145%
2010
2010
0
20
40
60
80
100
+90%
+160%
+240%
430−480 ppm CO
2
eq
480−530 ppm CO
2
eq
530−580 ppm CO
2
eq
580−650 ppm CO
2
eq
< 50 GtCO
2
eq 50-55 GtCO
2
eq > 55 GtCO
2
eq
Min
75
th
Percentile
Max
Median
25
th
Scenarios with High Net
Negative Emissions
>20 GtCO
2
/yr
Scenarios with High Net Negative Emissions >20 GtCO
2
/yr
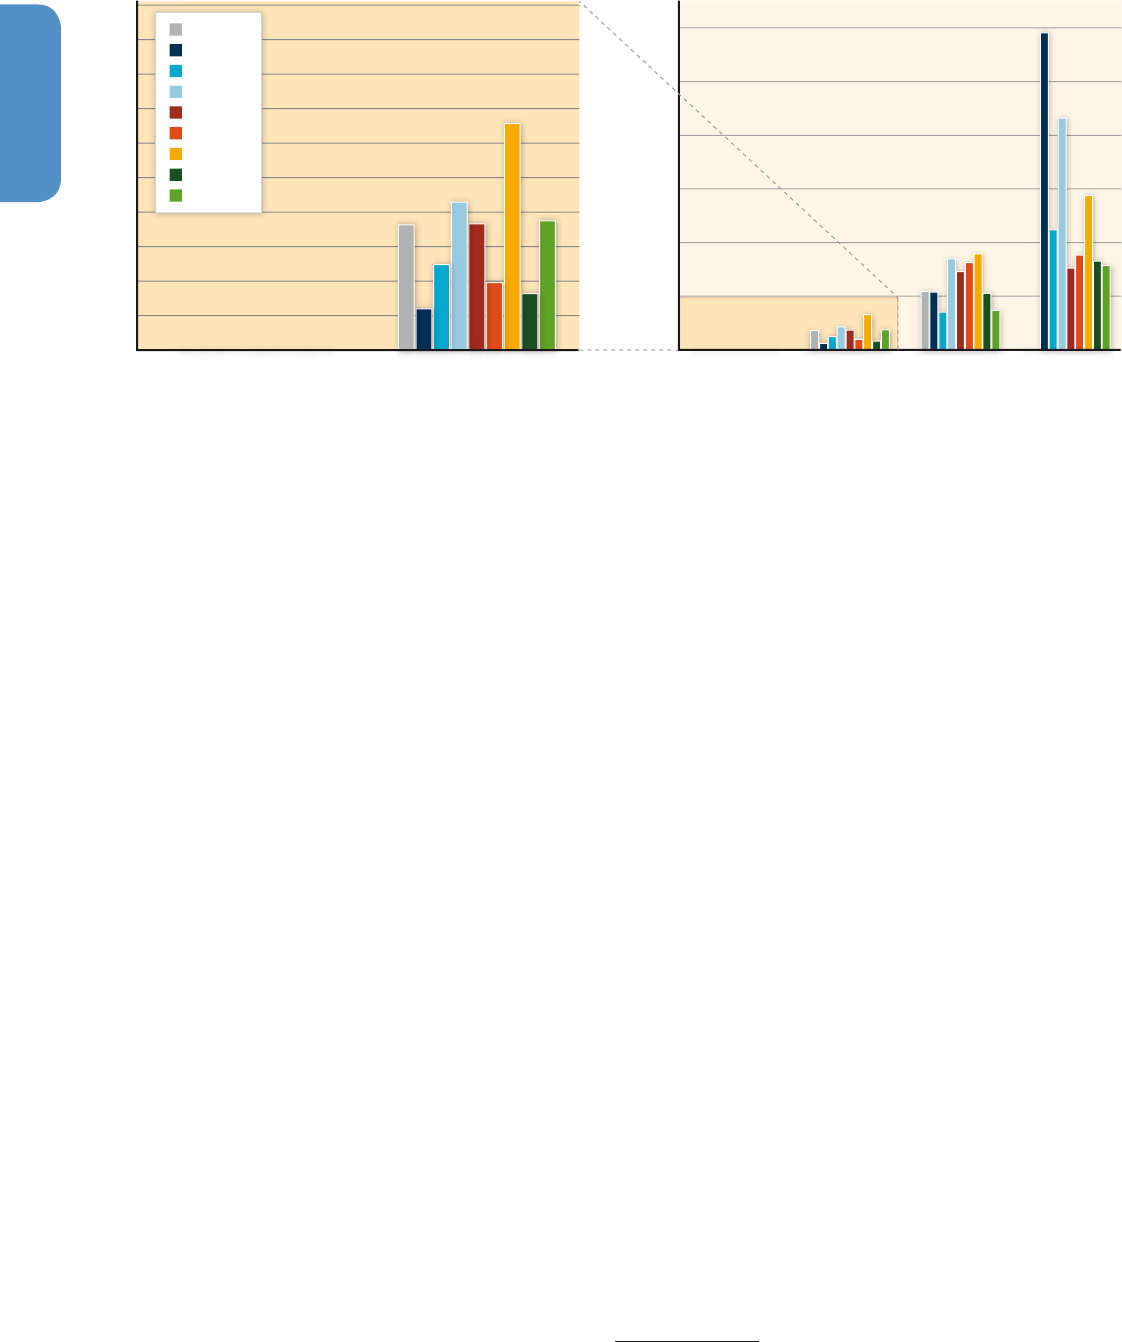
564564
Energy Systems
7
Chapter 7
Eom et al. (2013) indicates that such rapid transformations due to
delays in near-term emissions reductions would pose enormous chal-
lenges with respect to the up-scaling of individual technologies. The
study shows that depending on the assumptions about the technol-
ogy portfolio, a quadrupling of the low-carbon share over 20 years
(2030 – 2050) would lead on average to the construction of 29 to 107
new nuclear plants per year. While the lower-bound estimate corre-
sponds to about the observed rate of nuclear power installations in
the 1980s (Wilson etal., 2013), the high estimate is historically unprec-
edented. The study further indicates an enormous requirement for the
future up-scaling of RE technologies. For instance, solar power is pro-
jected in the models to increase by 50 – 360 times of the year-2011
global solar capacity between 2030 and 2050. With respect to the
attainability of such high deployment rates, the recent study by Wilson
etal. (2013) indicates that the diffusion of successful technologies in
the past has been generally more rapid than the projected technology
diffusion by integrated models.
As shown in Figure 7.17, cost-effective pathways (without delay) show
a remarkable near-term up-scaling (between 2008 and 2030) of CCS
technologies by about three orders of magnitude from the current CCS
facilities that store a total of 5 MtCO
2
per year (see also, Sathre etal.,
2012). The deployment of CCS in these scenarios is projected to accel-
erate even further reaching CO
2
storage rates of about half to double
current global CO
2
emissions from fossil fuel and industry by 2100. The
majority of the models indicate that in absence of this CCS potential,
the transformation to low-GHG concentrations (about 480 ppm CO
2
eq)
might not be attainable if mitigation is delayed to 2030 (Riahi etal.,
2013). Delays in mitigation thus reduce technology choices, and as a
result some of the currently optional technologies might become ‘a
must’ in the future (Riahi etal., 2012, 2013; Rogelj et al., 2013). It
should be noted that even at the level of CCS deployment as depicted
by the cost-effective scenarios, CO
2
storage capacity is unlikely to be a
major limiting factor for CCS (see 7.11.2.), however, various concerns
related to potential ecological impacts, accidental release of CO
2
, and
related storage effectiveness of CCS technologies might pose barriers
to deployment. (See Section7.9)
7.12 Sectoral policies
The stabilization of GHG concentrations at a level consistent with
the Cancun agreement requires a fundamental transformation of the
energy supply system, and the long-term substitution of freely emit-
ting (i. e., unabated)
36
fossil fuel conversion technologies by low-carbon
alternatives (Chapter 6, Section7.11). Studies that have analyzed cur-
rent policies plus the emission reduction pledges under the Cancun
agreement have found that global GHG emissions are expected to
grow (den Elzen etal., 2011; IEA, 2011a; e. g., Carraro and Massetti,
2012). As a consequence, additional policies must be enacted and / or
the coverage and stringency of the existing ones must be increased if
the Cancun agreement is to be fulfilled.
Currently, most countries combine instruments from three domains:
economic instruments to guide investments of profit-maximizing firms,
information and regulation approaches to guide choices where eco-
nomic instruments are politically not feasible or not fully reflected in
satisficing behaviour of private actors, and innovation and infrastruc-
ture policies reflecting public investment in long-term transformation
needs (Grubb etal., 2013). This section discusses the outcome of exist-
ing climate policies that address the energy supply sector in terms of
36
These are those not using carbon dioxide capture and storage technologies.
Figure 7�17 | Annual Levels of Geological Carbon Dioxide Storage in cost-effective mitigation scenarios reaching 430 – 530 ppm CO
2
eq. Source: AMPERE intermodelling compari-
son; Eom etal. (2013), Riahi etal. (2013). Source: Reprinted from Technological Forecasting and Social Change, Eom J. etal., “The impact of near-term climate policy choices on
technology and emission transition pathways”, 2013, with permission from Elsevier.
10
20
30
40
50
60
0
2008 2030 2050 2100
0
1
2
3
4
5
6
7
8
9
10
Geological Carbon Dioxide Storage [GtCO
2
/yr]
Geological Carbon Dioxide Storage [GtCO
2
/yr]
0.01
2008 2030
DNE21
IMACLIM
IMAGE
GCAM
MERGE-ETL
MESSAGE
POLES
REMIND
WITCH

565565
Energy Systems
7
Chapter 7
their GHG-emission reduction, their influence on the operation, and
(via changed investments) on the structure of the energy system, as
well as the associated side effects. The policy categories considered
in the following are those introduced in Section 3.8. The motivation
behind the policies (e. g., their economic justification) and problems
arising from enacting multiple policies simultaneously are discussed in
Sections 3.8.6, 3.8.7, 15.3, and 15.7. A general evaluation of the per-
formance of the policies is carried out in Section15.5.
7�12�1 Economic instruments
GHG pricing policies, such as GHG-emission trading schemes (ETS) and
GHG-emission taxes, have been frequently proposed to address the
market externalities associated with GHG emissions (see Sections 3.8
and 15.5). In the power sector, GHG pricing has primarily been pursued
through emission trading mechanisms and, to a lower extent, by car-
bon taxes (Sumner etal., 2009; IEA, 2010f; Lin and Li, 2011). Economic
instruments associated with the provision of transport fuels and heat
are discussed in chapters 8 – 10.
The existence of GHG (allowance or tax) prices increases the cost of
electricity from fossil-fuelled power plants and, as a consequence,
average electricity prices. The short-term economic impacts of power
price increases for industrial and private consumers have been widely
discussed (Parry, 2004; Hourcade etal., 2007). To address the associ-
ated distributional impacts, various compensation schemes have been
proposed (IEA, 2010f; Burtraw etal., 2012; EU Commission, 2012). The
impact of an emission trading scheme on the profitability of power
generation can vary. Allowances that are allocated for free lead to
windfall gains (Keats and Neuhoff, 2005; IEA, 2010f). With full auction-
ing, the impact on profitability can vary between different power sta-
tions (Keppler and Cruciani, 2010).
From an operational point of view, what counts is the fuel- and tech-
nology-dependent mark up in the marginal costs of fossil fuel power
plants due to GHG prices. Power plants with low specific GHG emis-
sions (e. g., combined cycle gas turbines) will see a smaller increase
of their marginal costs compared to those with higher specific emis-
sions (e. g., coal power plants). The resulting influence on the relative
competiveness of different power plants and the associated effect on
the generation mix depends, in part, on fuel prices (which help set the
marginal cost reference levels) and the stringency of the GHG-emission
cap or tax (defining the GHG price) (IEA, 2010f).
Although GHG taxes are expected to have a high economic efficiency
(see Section15.5.2), explicit GHG taxes that must be obeyed by the
power sector (e. g., as part of an economy-wide system) have only
been enacted in a couple of countries (WEC, 2008; Tanaka, 2011).
In contrast, taxes on fuels are common (Section15.5.2). Concerning
operational decisions, GHG taxes, taxes or charges on input fuels and
emission permit schemes are equal as long as the resulting (explicit
or implicit) GHG price is the same. Concerning investment decisions
(especially those made under uncertainty), there are differences that
are discussed as part of the ‘prices versus quantities’ debate (see
Weitzman, 1974, 2007; OECD, 2009). Due to some weaknesses of
existing ETSs and associated uncertainties, there is a renewed interest
in hybrid systems, which combine the merits of both approaches by
introducing price caps (serving as ‘safety valves’) and price floors into
emission trading schemes to increase their flexibility in the context of
uncertain costs (Pizer, 2002; Philibert, 2008). Concerning the issue of
potential intertemporal and spatial leakages, as discussed in the Green
Paradox literature (Section15.5.2.4), differences between tax and GHG
ETSs exist as well. Options to address these issues are discussed in Sec-
tion15.5.3.8 and Kalkuhl and Edenhofer (2013).
The EU ETS
37
is perhaps the world’s most-prominent example of a GHG
trading scheme, and the GHG prices observed in that market, in com-
bination with other policies that have been enacted simultaneously,
have been effective in changing operating and investment choices in
a way that has allowed the short-term fulfilment of the sector-specific
GHG reduction goals (Ellerman etal., 2010; IEA, 2010f). The significant
associated emission reductions compared to the baseline are discussed
in Section14.4.2.1. Shortcomings of emissions trading in general, and
the EU ETS in particular (e. g., the high GHG price volatility and the
resulting lack of stable price signals), are addressed by (Grubb etal.,
2006; Neuhoff etal., 2006; Åhman etal., 2007; Kettner etal., 2008;
Ellerman etal., 2010; IEA, 2010f; Pahle etal., 2011). According to the
IEA (2010f), these shortcomings can be mitigated by setting long-term
emission caps that are consistent with given GHG concentration stabi-
lization goals and by avoiding a free allocation of allowances to power
producers. A general discussion of the performance of GHG trading
schemes is given in Section15.5.3, including programs outside Europe.
The main factors that have contributed to the low EU ETS carbon prices
currently observed include caps that are modest in comparison to the
Cancun agreement, relatively low electricity demand due to the eco-
nomic crisis in the EU, increasing shares of RE, as well as an unex-
pected high inflow of certificates from CDM projects (IEA, 2013c).
In the longer term and provided that sufficiently stringent emissions
caps are set, GHG pricing (potentially supplemented by technology
support, see Section15.6) can support low-emitting technologies (e. g.,
RE, nuclear power, and CCS) due to the fuel- and technology-depen-
dent mark-up in the marginal costs of fossil fuel power plants:
(a) The economic performance of nuclear power plants, for instance,
can be improved by the establishment of GHG pricing schemes (NEA,
2011b; Linares and Conchado, 2013).
(b) CCS technologies applied in the power sector will only become
competitive with their freely emitting (i. e., unabated) counterparts if
the additional investment and operational costs associated with the
CCS technology are compensated for by sufficiently high carbon prices
37
For additional information on the history and general success of this policy see
Sections14.4.2.1, and 15.5.3.

566566
Energy Systems
7
Chapter 7
or direct financial support (Herzog, 2011; IEA, 2013c). In terms of the
price volatility seen in the ETS, Oda and Akimoto (2011) analyzed the
influence of carbon price volatility on CCS investments and concluded
that carbon prices need to be higher to compensate for the associ-
ated uncertainty. The provision of capital grants, investment tax cred-
its, credit guarantees, and / or insurance are considered to be suitable
means to support CCS technologies as long as they are in their early
stages of development (IEA, 2013c).
(c) Many RE technologies still need direct (e. g., price-based or quan-
tity-based deployment policies) or indirect (e. g., sufficiently high car-
bon prices and the internalization of other externalities) support if
their market shares are to be increased (see Section 7.8.2; IPCC, 2011a;
IRENA, 2012a). To achieve this goal, specific RE deployment policies
have been enacted in a large number of countries (Halsnæs et al.,
2012; Zhang etal., 2012; REN21, 2013). These policies are designed
to facilitate the process of bringing RE technologies down the learn-
ing curve (IEA, 2011f; IRENA, 2012a). Taken together, RE policies have
been successful in driving an escalated growth in the deployment of
RE (IPCC, 2011a). Price-based mechanisms (such as feed-in tariffs
(FITs)) and quantity-based systems (such as quotas or renewable port-
folio standards, RPS, and tendering / bidding) are the most common RE
deployment policies in the power sector (Section 15.6, Halsnæs etal.,
2012; REN21, 2013). With respect to their success and efficiency, the
SRREN SPM (IPCC, 2011a, p.25) notes “that some feed in tariffs have
been effective and efficient at promoting RE electricity, mainly due to
the combination of long-term fixed price or premium payments, net-
work connections, and guaranteed purchase of all RE electricity gener-
ated. Quota policies can be effective and efficient if designed to reduce
risk; for example, with long-term contracts”. Supported by Klessmann
etal. (2013), a new study confirms: “Generally, it can be concluded
that support schemes, which are technology specific, and those that
avoid unnecessary risks in project revenues, are more effective and
efficient than technology-neutral support schemes, or schemes with
higher revenue risk” (Ragwitz and Steinhilber, 2013).
Especially in systems with increasing and substantial shares of RE and
“despite the historic success of FITs, there is a tendency to shift to ten-
der-based systems because guaranteed tariffs without a limit on the
total subsidy are difficult to handle in government budgets. Conversely
a system with competitive bidding for a specified amount of electricity
limits the total amount of subsidy required” (Halsnæs etal., 2012, p.6).
A renewed tendency to shift to tender-based systems with public com-
petitive bidding to deploy renewables is observed by REN21 (2013) as
well. Assessing the economic efficiency of RE policies requires a clear
distinction between whether a complete macroeconomic assessment is
intended (i. e., one where competing mitigation options are taken into
account as well) or whether prescribed and time-dependent RE shares
are to be achieved in a cost-effective manner. In addition, the planning
horizon must be clearly stated. RE policies might be considered to be
inefficient in a short-term (myopic) perspective, while they could be
potentially justified in an intertemporal setting where a dynamic opti-
mization over a couple of decades is carried out (see Section 15.6, IEA,
2011f; SRREN Sections 11.1.1 and 11.5.7.3 in IPCC, 2011a; Kalkuhl
etal., 2012, 2013).
Issues related to synergetic as well as adverse interactions of RE poli-
cies with GHG policies (Halsnæs etal., 2012) are discussed in detail in
Section 15.7 and SRREN Sections 11.1.1 and 11.5.7.3. A new line of
reasoning shows that delayed emission-pricing policies can be partially
compensated by near-term support of RE (Bauer etal., 2012). The mac-
roeconomic burden associated with the promotion of RE is emphasized
by Frondel etal. (2010). The relationship between RE policy support and
larger power markets is also an area of focus. Due to the ‘merit order
effect’, RE can, in the short term, reduce wholesale electricity prices by
displacing power plants with higher marginal costs (Bode, 2006; Sens-
fuß etal., 2008; Woo etal., 2011; Würzburg etal., 2013), though in the
long term, the impact may be more on the temporal profile of whole-
sale prices and less on overall average prices. The promotion of low-
carbon technologies can have an impact on the economics of backup
power plants needed for supply security. The associated challenges and
options to address them are discussed in Lamont, (2008); Sáenz de
Miera etal., (2008); Green and Vasilakos, (2011); Hood, (2011); Traber
and Kemfert, (2011); IEA, (2012b, 2013b; c); and Hirth, (2013).
According to Michaelowa et al., (2006); Purohit and Michaelowa,
(2007); Restuti and Michaelowa, (2007); Bodas Freitas etal., (2012);
Hultman etal., (2012); Zhang etal., (2012); and Spalding-Fecher etal.,
(2012), the emissions credits generated by the Clean Development
Mechanism (CDM) have been a significant incentive for the expansion
of renewable energy in developing countries.
Zavodov (2012), however, has questioned this view and argues that
CDM in its current form is not a reliable policy tool for long-term RE
development plans. In addition, CCS has been accepted as an eligible
measure under the CDM by the UN (IEA, 2010g).
The phaseout of inefficient fossil fuel subsidies as discussed during the
G-20 summit meetings in 2009, 2010, 2011, and 2012 will have a vis-
ible influence on global energy-related carbon emissions (Bruvoll etal.,
2011; IEA, 2011g, 2013c). Removing these subsidies could lead to a
13 % decline in CO
2
emissions and generate positive spillover effects
by reducing global energy demand (IMF, 2013). In addition, ineffi-
ciently low pricing of externalities (e. g., environmental and social costs
of electricity production) in the energy supply sector introduces a bias
against the development of many forms of low-carbon technologies
(IRENA, 2012a).
A mitigation of GHG emissions in absolute terms is only possible
through policies / measures that either reduce the amount of fossil fuel
carbon oxidized and / or that capture and permanently remove GHGs
from fossil fuel extraction, processing, and use from the atmosphere
(Sections7.5, 7.11). The deployment of renewable or nuclear energy
or energy efficiency as such does not guarantee that fossil fuels will
not be burned (in an unabated manner). The interplay between growth
in energy demand, energy-efficient improvements, the usage of low-

567567
Energy Systems
7
Chapter 7
carbon energy, and fossil fuel is discussed in detail in SRREN Chapter 1
(Figure 1.14), and Chapter 10 (IPCC, 2011a).
The question whether or not the deployment of low-carbon technolo-
gies substitutes fossil fuels that otherwise would have emitted GHG
have to take into account the complexity of economic systems and
human behaviour (York, 2012). A central aspect in this context is the
rebound effect, which is extensively discussed in Sections 3.9.5 and
5.6.2. Spillover effects that are highly related to this issue are dis-
cussed in Section 6.3.6. To constrain the related adverse effects, care-
fully drafted packages combining GHG pricing schemes with tech-
nology policies in a way that avoids negative interactions have been
proposed (see SRREN Chapter 11 in IPCC, 2011a).
7�12�2 Regulatory approaches
The formulation of low-carbon technologies targets can help technol-
ogy companies to anticipate the scale of the market and to identify
opportunities for their products and services (Lester and Neuhoff,
2009), thus, motivating investments in innovation and production facil-
ities while reducing costs for low-carbon technologies. Currently, for
instance, about 138 countries have renewable targets in place. More
than half of them are developing countries (REN21, 2013).
The success of energy policies heavily depends on the development of
an underlying solid legal framework as well as a sufficient regulatory
stability (Reiche et al., 2006; IPCC, 2011a). Property rights, contract
enforcement, appropriate liability schemes, and emissions account-
ing are essential for a successful implementation of climate policies.
For example, well-defined responsibilities for the long-term reliability
of geologic storages are an important pre-requisite for successful CCS
applications (IEA, 2013c), while non-discriminatory access to the grid
is of similar importance for RE.
Concerning the promotion of RE, the specific challenges that are
faced by developing countries and countries with regulated markets
are addressed by IRENA (2012a); IRENA, (2012b); Kahrl (2011); and
Zhang etal. (2012). Renewable portfolio standards (or quota obliga-
tions, see Section15.5.4.1) are usually combined with the trading of
green certificates and therefore have been discussed under the topic of
economic instruments (see Section 7.12.1). Efficiency and environmen-
tal performance standards are usual regulatory instruments applied to
fossil fuel power plants.
In the field of nuclear energy, a stable policy environment comprising
a regulatory and institutional framework that addresses operational
safety and the appropriate management of nuclear waste as well as
long-term commitments to the use of nuclear energy are requested to
minimize investment risks for new nuclear power plants (NEA, 2013).
To regain public acceptance after the Fukushima accident, comprehen-
sive safety reviews have been carried out in many countries. Some of
them included ‘stress tests’, which investigated the capability of exist-
ing and projected reactors to cope with extreme natural and man-
made events, especially those lying outside the reactor design assump-
tions. As a result of the accident and the subsequent investigations, a
“radical revision of the worst-case assumptions for safety planning” is
expected to occur (Rogner, 2013, p.291).
7�12�3 Information programmes
Though information programs play a minor role in the field of power
plant-related energy efficiency improvements and fossil fuel switching,
awareness creation, capacity building, and information dissemination
to stakeholders outside of the traditional power plant sector plays
an important role especially in the use of decentralized RE in LDCs
(IRENA, 2012c). Other low-carbon technologies like CCS and nuclear
would require specifically trained personnel (see Section 7.10.4). Fur-
thermore, enhanced transparency of information improves public and
private decisions and can enhance public perception (see Section
7.9.4).
7�12�4 Government provision of public goods
or services
Public energy-related R&D expenditures in the IEA countries peaked
in 2009 as a result of economic stimulus packages, but soon after suf-
fered a substantial decline. Although R&D spending is now again ris-
ing, energy-related expenditures still account for less than 5 % of total
government R&D – compared to 11 % that was observed in 1980 (IEA,
2012j). Nuclear has received significant support in many countries and
the share of research, development, and demonstration (RD&D) for RE
has increased, but public R&D for CSS is lower, and does not reflect its
potential importance (see Section7.11) for the achievement of nega-
tive emissions (von Stechow etal., 2011; Scott etal., 2013) IEA, 2012j).
Although private R&D expenditures are seldom disclosed,
38
they are
estimated to represent a large share of the overall spending for RD&D
activities (IEA, 2012j). Private R&D investments are not only stimu-
lated by R&D policies. Additional policies (e. g., deployment policies,
see 7.12.1 and Section15.6) addressing other parts of the innovation
chain as well as broad GHG pricing policies might assist in triggering
private investments in R&D (IPCC, 2011a; Rogge etal., 2011; Battelle,
2012).
The integration of variable RE poses additional challenges, as discussed
earlier in Section 7.6, with a variety of possible technical and institu-
tional responses. Many of these technical and institutional measures
require an enabling regulatory framework facilitating their application.
Infrastructure challenges, e. g., grid extension, are particularly acute
38
A rare exception is the annual forecast of Battelle (2012).

568568
Energy Systems
7
Chapter 7
for RE deployment in developing countries, sometimes preventing
deployment (IRENA, 2012a). Governments can play a prominent role in
providing the infrastructure (e. g., transmissions grids or the provision
of district heating and cooling systems) that is needed to allow for a
transformation of energy systems towards lower GHG emissions (IEA,
2012b; Grubb etal., 2013).
7�12�5 Voluntary actions
Voluntary agreements (see Section 15.5.7.4) have been frequently
applied in various sectors around the globe, though they often have
been replaced by mandatory schemes in the long-term (Halsnæs etal.,
2012). According to Chapter 15, their success is mixed. “Voluntary
agreements had a positive effect on energy efficiency improvements,
but results in terms of GHG emissions reductions have been mod-
est, with the exception of Japan, where the status of these voluntary
agreements has also been much more ‘binding’ than in other countries
in line with Japanese cultural traditions” (Halsnæs etal., 2012, p.13;
IPCC, 2007; Yamaguchi, 2012).
7.13 Gaps in knowledge
and data
Gaps in knowledge and data are addressed to identify those that can
be closed through additional research and others that are inherent to
the problems discussed and are therefore expected to persist. Chapter
7 is confronted by various gaps in knowledge, especially those related
to methodological issues and availability of data:
• The diversity of energy statistic and GHG emission accounting
methodologies as well as several years delay in the availability of
energy statistics data limit reliable descriptions of current and his-
toric energy use and emission data on a global scale (Section7.2,
7.3).
• Although fundamental problems in identifying fossil fuel and
nuclear resource deposits, the extent of potential carbon storage
sites, and technical potentials of RE are acknowledged, the devel-
opment of unified and consistent reporting schemes, the collection
of additional field data, and further geological modelling activities
could reduce the currently existing uncertainties (Section 7.4).
• There is a gap in our knowledge concerning fugitive CH
4
emissions
as well as adverse environmental side effects associated with the
increasing exploitation of unconventional fossil fuels. As novel
technologies are applied in these fields, research could help reduce
the gap. Operational and supply chain risks of nuclear power
plants, the safety of CCS storage sites and adverse side effects
of some RE, especially biomass and hydropower, are often highly
dependent on the selected technologies and the locational and
regulatory context in which they are applied. The associated risks
are therefore hard to quantify, although further research could, in
part, reduce the associated knowledge gaps (Section7.5).
• There is limited research on the integration issues associated with
high levels of low-carbon technology utilization (Section7.6).
• Knowledge gaps pertain to the regional and local impacts of cli-
mate change on the technical potential for renewable energy and
appropriate adaptation, design, and operational strategies to mini-
mize the impact of climate change on energy infrastructure (Sec-
tion 7.7).
• The current literature provides a limited number of comprehen-
sive studies on the economic, environmental, social, and cultural
implications that are associated with low-carbon emission paths.
Especially, there is a lack of consistent and comprehensive global
surveys concerning the current cost of sourcing and using uncon-
ventional fossil fuels, RE, nuclear power, and the expected ones for
CCS and BECCS. In addition, there is a lack of globally comprehen-
sive assessments of the external cost of energy supply and GHG-
related mitigation options (Sections 7.8, 7.9, 7.10).
• Integrated decision making requires further development of energy
market models as well as integrated assessment modelling frame-
works, accounting for the range of possible cobenefits and trade off
between different policies in the energy sector that tackle energy
access, energy security, and / or environmental concerns (Sec-
tion7.11).
• Research on the effectiveness and cost-efficiency of climate-
related energy policies and especially concerning their interaction
with other policies in the energy sector is limited (Section7.12).
7.14 Frequently Asked
Questions
FAQ 7�1 How much does the energy sup-
ply sector contribute to the GHG
emissions?
The energy supply sector comprises all energy extraction, conversion,
storage, transmission, and distribution processes with the exception of
those that use final energy in the demand sectors (industry, transport,
and building). In 2010, the energy supply sector was responsible for
46 % of all energy-related GHG emissions (IEA, 2012b) and 35 % of
anthropogenic GHG emissions, up from 22 % in 1970 (Section7.3).

569569
Energy Systems
7
Chapter 7
In the last 10 years, the growth of GHG emissions from the energy sup-
ply sector has outpaced the growth of all anthropogenic GHG emis-
sions by nearly 1 % per year. Most of the primary energy delivered to
the sector is transformed into a diverse range of final energy products
including electricity, heat, refined oil products, coke, enriched coal, and
natural gas. A significant amount of energy is used for transformation,
making the sector the largest consumer of energy. Energy use in the
sector results from end-user demand for higher-quality energy carriers
such as electricity, but also the relatively low average global efficiency
of energy conversion and delivery processes (Sections7.2, 7.3).
Increasing demand for high-quality energy carriers by end users in
many developing countries has resulted in significant growth in the
sectors’ GHG emission, particularly as much of this growth has been
fuelled by the increased use of coal in Asia, mitigated to some extent
by increased use of gas in other regions and the continued uptake of
low-carbon technologies. While total output from low-carbon tech-
nologies, such as hydro, wind, solar, biomass, geothermal, and nuclear
power, has continued to grow, their share of global primary energy
supply has remained relatively constant; fossil fuels have maintained
their dominance and carbon dioxide capture and storage (CCS) has yet
to be applied to electricity production at scale (Sections 7.2, 7.5).
Biomass and hydropower dominate renewable energy, particularly
in developing countries where biomass remains an important source
of energy for heating and cooking; per capita emissions from many
developing countries remain lower than the global average. Renew-
able energy accounts for one-fifth of global electricity production, with
hydroelectricity taking the largest share. Importantly, the last 10 years
have seen significant growth in both wind and solar, which combine to
deliver around one-tenth of all renewable electricity. Nuclear energy’s
share of electricity production declined from maximum peak of 17 % in
1993 to 11 % in 2012 (Sections7.2, 7.5).
FAQ 7�2 What are the main mitigation options in
the energy supply sector?
The main mitigation options in the energy supply sector are energy
efficiency improvements, the reduction of fugitive non-CO
2
GHG emis-
sions, switching from (unabated) fossil fuels with high specific GHG
emissions (e. g., coal) to those with lower ones (e. g., natural gas), use
of renewable energy, use of nuclear energy, and carbon dioxide cap-
ture and storage (CCS). (Section7.5).
No single mitigation option in the energy supply sector will be suffi-
cient to hold the increase in global average temperature change below
2 °C above pre-industrial levels. A combination of some, but not neces-
sarily all, of the options is needed. Significant emission reductions can
be achieved by energy-efficiency improvements and fossil fuel switch-
ing, but they are not sufficient by themselves to provide the deep cuts
needed. Achieving deep cuts will require more intensive use of low-
GHG technologies such as renewable energy, nuclear energy, and CCS.
Using electricity to substitute for other fuels in end-use sectors plays
an important role in deep emission cuts, since the cost of decarbon-
izing power generation is expected to be lower than that in other parts
of the energy supply sector (Chapter 6, Section 7.11).
While the combined global technical potential of low-carbon technolo-
gies is sufficient to enable deep cuts in emissions, there are local and
regional constraints on individual technologies (Sections 7.4, 7.11). The
contribution of mitigation technologies depends on site- and context-
specific factors such as resource availability, mitigation and integration
costs, co-benefits / adverse side effects, and public perception (Sections
7.8, 7.9, 7.10). Infrastructure and integration challenges vary by miti-
gation technology and region. While these challenges are not in gen-
eral technically insurmountable, they must be carefully considered in
energy supply planning and operations to ensure reliable and afford-
able energy supply (Section 7.6).
FAQ 7�3 What barriers need to be overcome in
the energy supply sector to enable a
transformation to low-GHG emissions?
The principal barriers to transforming the energy supply sector are
mobilizing capital investment; lock-in to long-lived high-carbon sys-
tems; cultural, institutional, and legal aspects; human capital; and lack
of perceived clarity about climate policy (Section 7.10).
Though only a fraction of available private-sector capital investment
would be needed to cover the costs of future low-GHG energy supply,
a range of mechanisms — including climate investment funds, carbon
pricing, removal of fossil fuel subsidies and private / public initiatives
aimed at lowering barriers for investors — need to be utilized to direct
investment towards energy supply (Section7.10.2).
Long-lived fossil energy system investments represent an effective
(high-carbon) lock-in. The relative lack of existing energy capital in
many developing countries therefore provides opportunities to develop
a low-carbon energy system (Section 7.10.5).
A holistic approach encompassing cultural, institutional, and legal issues
in the formulation and implementation of energy supply strategies is
essential, especially in areas of urban and rural poverty where conven-
tional market approaches are insufficient. Human capital capacity build-
ing — encompassing technological, project planning, and institutional
and public engagement elements — is required to develop a skilled
workforce and to facilitate wide-spread adoption of renewable, nuclear,
CCS, and other low-GHG energy supply options (Sections 7.10.3, 7.10.4).
Elements of an effective policy aimed at achieving deep cuts in CO
2
emissions would include a global carbon-pricing scheme supple-
mented by technology support, regulation, and institutional develop-
ment tailored to the needs to individual countries (notably less-devel-
oped countries) (Section 7.12, Chapters 13 – 15).

570570
Energy Systems
7
Chapter 7
References
Abdelouas A� (2006)� Uranium mill tailings: Geochemistry, mineralogy, and envi-
ronmental impact. Elements 2, 335 – 341.
Abril G�, F� Guérin, S� Richard, R� Delmas, C� Galy-Lacaux, P� Gosse, A� Trem-
blay, L� Varfalvy, M� A� Dos Santos, and B� Matvienko (2005)� Carbon
dioxide and methane emissions and the carbon budget of a 10-year old tropi-
cal reservoir (Petit Saut, French Guiana). Global Biogeochem. Cycles 19. doi:
10.1029 / 2005GB002457.
Adamantiades A�, and I� Kessides (2009)� Nuclear power for sustainable devel-
opment: Current status and future prospects. Energy Policy 37, 5149 – 5166.
Adams A� S�, and D� W� Keith (2013)� Are global wind power resource estimates
overstated? Environmental Research Letters 8, 015021. doi: 10.1088 / 1748-
9326 / 8 / 1 / 015021, ISSN: 1748-9326.
Adibee N�, M� Osanloo, and M� Rahmanpour (2013)� Adverse effects of coal
mine waste dumps on the environment and their management. Environmental
Earth Sciences 70, 1581 – 1592.
Agah S� M� M�, and H� A� Abyaneh (2011)� Quantification of the distribution
transformer life extension value of distributed generation. IEEE Transactions
on Power Delivery 26, 1820 – 1828. doi: 10.1109 / TPWRD.2011.2115257, ISSN:
0885-8977.
Ahearne J� F� (2011)� Prospects for nuclear energy. Energy Economics 33, 572 – 580.
doi: 16 / j.eneco.2010.11.014, ISSN: 0140-9883.
Åhman M�, D� Burtraw, J� Kruger, and L� Zetterberg (2007)� A ten-year rule to
guide the allocation of EU emission allowances. Energy Policy 35, 1718 – 1730.
Aines R� D�, M� J� Leach, T� H� Weisgraber, M� D� Simpson, S� Friedmann, and C� J�
Burton (2009)� Quantifying the potential exposure hazard due to energetic
releases of CO
2
from a failed sequestration well. Energy Procedia 1, 2421 – 2429.
doi: http: / / dx.doi.org / 10.1016 / j.egypro.2009.02.003.
Akpinar-Ferrand E�, and A� Singh (2010)� Modeling increased demand of energy
for air conditioners and consequent CO
2
emissions to minimize health risks due
to climate change in India. Environmental Science & Policy 13, 702 – 712.
Aksoy N�, C� Şimşe, and O� Gunduz (2009)� Groundwater contamination mecha-
nism in a geothermal field: A case study of Balcova, Turkey. Journal of Contami-
nant Hydrology 103, 13 – 28.
Ale B� J� M�, H� Baksteen, L� J� Bellamy, A� Bloemhof, L� Goossens, A� Hale, M� L�
Mude, J� I� H� Oh, I� A� Papazoglou, J� Post, and J� Y� Whiston (2008)� Quanti-
fying occupational risk: The development of an occupational risk model. Safesty
Science 46, 176 – 185.
Alexakhin R� M�, N� I� Sanzharova, S� V� Fesenko, S� I� Spiridonov, and A� V� Panov
(2007)� Chernobyl radionuclide distribution, migration, and environmental and
agricultural impacts. Health Physics 93, 418 – 426. Available at: http: / / www.
scopus. com / inward / record.url?eid=2-s2.0-37349067417&partnerID=40&md5
=9a7b6d1acd16987f8113ea83768c23e7.
Alho C� J� R� (2011)� Environmental effects of hydropower reservoirs on wild mam-
mals and freshwater turtles in amazonia: A review. Oecologia Australis 15,
593 – 604. Available at: http: / / www. scopus. com / inward / record.url?eid=2-s2.0-
80052867044&partnerID=40&md5=99294977641dd31eaad3a128fd651e6d.
Allen M� R�, D� J� Frame, C� Huntingford, C� D� Jones, J� A� Lowe, M� Meinshau-
sen, and N� Meinshausen (2009)� Warming caused by cumulative carbon
emissions towards the trillionth tonne. Nature 458, 1163 – 1166.
Alsalam J�, and S� Ragnauth (2011)� Draft Global Antropogenic Non- CO
2
Greenhouse Gas Emissions: 1990 – 2030. US EPA, Washington. Available at:
http: / / www. epa. gov / climatechange / Downloads / EPAactivities / EPA_NonCO2_
Projections_2011_draft.pdf.
Alvarez G� C�, R� M� Jara, and J� R� R� Julian (2010)� Study of the effects on employ-
ment of public aid to renewable energy sources. Procesos de Mercado. Universi-
dad Rey Juan Carlos VII. ISSN: 1697-6797 – 13.
Amores M� J�, F� Verones, C� Raptis, R� Juraske, S� Pfister, F� Stoessel, A� Antón,
F� Castells, and S� Hellweg (2013)� Biodiversity impacts from salinity increase
in a coastal wetland. Environmental Science and Technology 47, 6384 – 6392.
Available at: http: / / www. scopus. com / inward / record.url?eid=2-s2.0-
84879211765&partnerID=40&md5=dc52468ee59667b56dd36b635eb5e0be.
Anctil A�, and V� Fthenakis (2013)� Critical metals in strategic photovoltaic
technologies: Abundance versus recyclability. Progress in Photovoltaics:
Research and Applications 21, 1253 – 1259. Available at: http: / / www. scopus.
com / inward / record.url?eid=2-s2.0-84883053696&partnerID=40&md5=0287b
3b2e3fcb1b53a1c91e77c770b59.
Andres R� J�, T� A� Boden, F� M� Bréon, P� Ciais, S� Davis, D� Erickson, J� S� Gregg,
A� Jacobson, G� Marland, J� Miller, T� Oda, J� G� J� Olivier, M� R� Raupach,
P� Rayner, and K� Treanton (2012)� A synthesis of carbon dioxide emissions
from fossil-fuel combustion. Biogeosciences 9, 1845 – 1871. doi: 10.5194 / bg-9-
1845-2012.
Anenberg S� C�, K� Balakrishnan, J� Jetter, O� Masera, S� Mehta, J� Moss, and V�
Ramanathan (2013)� Cleaner Cooking Solutions to Achieve Health, Climate,
and Economic Cobenefits. Environmental Science & Technology 47, 3944 – 3952.
Angelis-Dimakis A�, M� Biberacher, J� Dominguez, G� Fiorese, S� Gadocha, E�
Gnansounou, G� Guariso, A� Kartalidis, L� Panichelli, I� Pinedo, and M�
Robba (2011)� Methods and tools to evaluate the availability of renewable
energy sources. Renewable and Sustainable Energy Reviews 15, 1182 – 1200.
doi: 10.1016 / j.rser.2010.09.049, ISSN: 1364-0321.
Apps J� A�, L� Zheng, Y� Zhang, T� Xu, and J� T� Birkholzer (2010)� Evaluation of
potential changes in groundwater quality in response to CO
2
leakage from
deep geologic storage. Transport in Porous Media 82, 215 – 246. Available at:
http: / / www. scopus. com / inward / record.url?eid=2-s2.0-76749137129&partnerI
D=40&md5=f5417af7652df88f0f16ed28c7be7766.
Ardito L�, G� Procaccianti, G� Menga, and M� Morisio (2013)� Smart Grid Tech-
nologies in Europe: An Overview. Energies 6, 251 – 281.
Arent D�, R� Tol, E� Faust, J� Hella, S� Kumar, K� Strzepek, F� Toth, and D� Yan
(2014)� Chapter 10. Key Economic Sectors and Services. In: Climate Change
2013: Impacts, Adaptation, and Vulnerability. Fifth Assessment Report of Work-
ing Group II. Cambride University Press, Cambridge, UK.
Arent D�, A� Wise, and R� Gelman (2011)� The status and prospects of renewable
energy for combating global warming. Energy Economics 33, 584 – 593. doi:
10.1016 / j.eneco.2010.11.003, ISSN: 0140-9883.
Armaroli N�, and V� Balzani (2011)� Towards an electricity-powered world. Energy
Environ. Sci. 4, 3193 – 3222. doi: 10.1039 / C1EE01249E.
Arnett E� B�, M� M� P� Huso, M� R� Schirmacher, and J� P� Hayes (2011)� Alter-
ing turbine speed reduces bat mortality at wind-energy facilities. Frontiers in
Ecology and the Environment 9, 209 – 214. Available at: http: / / www. scopus.
com / inward / record.url?eid=2-s2.0-79955607686&partnerID=40&md5=4cf566
47fe02d70061e2e13659dc7e1d.

571571
Energy Systems
7
Chapter 7
Aromar R�, and D� Sattherhwaite (2014)� Chapter 8 — Urban Areas. In: Climate
Change 2013: Impacts, Adaptation, and Vulnerability. Fifth Assessment Report
of Working Group II. Cambride University Press, Cambridge, UK.
Arvesen A�, and E� G� Hertwich (2011)� Environmental implications of large-scale
adoption of wind power: a scenario-based life cycle assessment. Environmental
Research Letters 6, 045102. doi: 10.1088 / 1748-9326 / 6 / 4 / 045102, ISSN: 1748-
9326.
Arvesen A�, and E� G� Hertwich (2012)� Assessing the life cycle environmental
impacts of wind power: A review of present knowledge and research needs.
Renewable and Sustainable Energy Reviews. doi: dx.doi.org / 10.1016 / j.
rser.2012.06.023.
Arvizu D�, P� Balaya, L� Cabeza, T� Hollands, A� Jäger-Waldau, M� Kondo, C�
Konseibo, V� Meleshko, W� Stein, Y� Tamaura, H� Xu, and R� Zilles (2011)�
Direct Solar Energy. In: IPCC Special Report on Renewable Energy Sources
and Climate Change Mitigation. Prepared by Working Group III of the Inter-
governmental Panel on Climate Change [O. Edenhofer, R. Pichs-Madruga, Y.
Sokona, K. Seyboth, P. Matschoss, S. Kadner, T. Zwickel, P. Eickemeier, G. Hansen,
S. Schlömer, C. von Stechow (eds.)]. Cambridge University Press, Cambridge,
United Kingdom and New York, NY, USA.
Asfaw A�, C� Mark, and R� Pana-Cryan (2013)� Profitability and occupational
injuries in U. S. underground coal mines. Accident Analysis and Prevention 50,
778 – 786. Available at: http: / / www. scopus. com / inward / record.url?eid=2-s2.0-
84870292672&partnerID=40&md5=cdc9949f18f6ef8a8986edb9e26db15c.
Ashworth P�, N� Boughen, M� Mayhew, and F� Millar (2010)� From research to
action: Now we have to move on CCS communication. International Journal of
Greenhouse Gas Control 4, 426 – 433. doi: 10.1016 / j.ijggc.2009.10.012, ISSN:
1750-5836.
Ashworth P�, J� Bradbury, S� Wade, C� F� J� Ynke Feenstra, S� Greenberg, G�
Hund, and T� Mikunda (2012)� What’s in store: Lessons from implementing
CCS. International Journal of Greenhouse Gas Control 9, 402 – 409.
Aspelund A�, M� J� Mølnvik, and G� De Koeijer (2006)� Ship Transport of CO
2
:
Technical Solutions and Analysis of Costs, Energy Utilization, Exergy Efficiency
and CO
2
Emissions. Chemical Engineering Research and Design 84, 847 – 855.
doi: 10.1205 / cherd.5147, ISSN: 0263-8762.
Atchley A�, Z� Nie, and S� Durucan (2013)� Human Health Risk Assessment of
CO
2
Leakage into Overlying Aquifers Using a Stochastic, Geochemical Reactive
Transport Approach. Environmental Science & Technology 47, 5954 – 5962. doi:
10.1021 / es400316c.
Azar C�, K� Lindgren, M� Obersteiner, M� Riahi, D� Vuuren, K� Elzen, K� Möller-
sten, and E� Larson (2010)� The feasibility of low CO
2
concentration targets
and the role of bio-energy with carbon capture and storage (BECCS). Climate
Change 100, 195 – 202.
Bachu S� (2008)� CO
2
storage in geological media: Role, means, status and barriers
to deployment. Progress in Energy and Combustion Science 34, 254 – 273. doi:
10.1016 / j.pecs.2007.10.001.
Bachu S�, D� Bonijoly, J� Bradshaw, R� Burruss, S� Holloway, N� P� Christensen,
and O� M� Mathiassen (2007)� CO
2
storage capacity estimation: Methodology
and gaps. International Journal of Greenhouse Gas Control 1, 430 – 443. doi:
10.1016 / S1750-5836(07)00086-2, ISSN: 1750-5836.
Bakker S�, H� de Coninck, and H� Groenenberg (2010)� Progress on including
CCS projects in the CDM: Insights on increased awareness, market potential
and baseline methodologies. International Journal of Greenhouse Gas Control
4, 321 – 326. doi: 10.1016 / j.ijggc.2009.10.011, ISSN: 1750-5836.
Balonov M�, G� R� Howe, A� Bouville, A� Guskova, V� Ivanov, J� Kenigsberg, I�
Likhtarev, F� Mettler, R� Shore, G� Thomas, M� Tirmarche, and L� Zablotska
(2011)� Annex D — Health Effects due to Radiation from the Chernobyl Acci-
dent. In: Sources and Effects of Ionizing Radiation — UNSCEAR 2008 — Report
to the General Assembly with Scientific Annnexes. UNSCEAR, (ed.), United
Nations Scientific Committee on the Efects of Atomic Radiation, New York,
ISBN: 978-92-1-142280-1.
Banuri T� (2009)� Climate change and sustainable development. Natural Resources
Forum 33, 254 – 258.
Bao G� (2010)� Study on the ecological impacts of hydropower resettlement in the
Nujiang area. Journal of Hydroelectric Engineering 29, 120 – 124.
Barberis Negra N�, J� Todorovic, and T� Ackermann (2006)� Loss evaluation of
HVAC and HVDC transmission solutions for large offshore wind farms. Electric
Power Systems Research 76, 916 – 927.
Barbier E� B� (2009)� Rethinking the Economic Recovery: A Global Green New
Deal. UNEP, Nairobi. Available at: http: / / www. sustainable-innovations.
org / GE / UNEP%20 %5B2009 %5D%20A%20global%20green%20new%20
deal.pdf.
Barker T�, L� Bernstein, J� E� Bogner, I� Bashmakov, P� R� Bosch, R� Dave,, O� R�
Davidson, B� S� Fisher, S� Gupta, K� Halsnæs, G� J� Heij, S� Kahn Ribeiro,
S� Kobayashi, M� D� Levine, D� L� Martino, O� Masera, B� Metz, L� A� Meyer,
G�-J� Nabuurs, N� Nakicenovic, H� -H� Rogner, J� Roy, J� Sathaye, R� Schock,
P� Shukla,, R� E� H� Sims, P� Smith, D� A� Tirpak, D� Urge-Vorsatz, and D� Zhou
(2007)� Technical Summary. In: Climate Change 2007: Mitigation. Contribution
of Working Group III to the Fourth Assessment Report of the Intergovernmen-
tal Panel on Climate Change [B. Metz, O. R. Davidson, P. R. Bosch, R. Dave, L. A.
Meyer (eds.)]. Cambridge University Press, Cambridge, United Kingdom and
New York, NY, USA, 35 – 37 pp.
Barlas S� (2011)� Green Completions for Shale Gas Come to Fore as Methane Emis-
sions Reduction Tool. Pipeline and Gas Journal 238. Available at: http: / / www.
scopus. com / inward / record.url?eid=2-s2.0-84856189359&partnerID=40&md5
=1f262679bef24e2d935db76b469a757f.
Barros N�, J� Cole J�, L� J� Tranvik, Y� T� Prairie, D� Bastviken, V� L� M� Huszar, P�
del Giorgio, and F� Roland (2011)� Carbon emission from hydroelectric reser-
voirs linked to reservoir age and latitude. Nature Geoscience 4, 593 – 596. doi:
10.1038 / ngeo1211.
Bashmakov I� (2009)� Resource of energy efficiency in Russia: scale, costs, and
benefits. Energy Efficiency 2, 369 – 386. Available at: www. mdpi. com / jour-
nal / sustainability.
Bashmakov I�, and A� Myshak (2012)� Factors Driving Russian Energy Related
GHG Emissions. Analysis Based on National GHG Inventory Data. Roshydromet
and Russian Academy of Sciences, Moscow, 130 pp.
Battelle (2012)� 2012 Global R&D Funding Forecast. Battelle, Columbus, OH. Avail-
able at: http: / / battelle.org / docs / default-document-library / 2012_global_fore-
cast.pdf.
Bauer N�, L� Baumstark, and M� Leimbach (2012)� The REMIND-R model: the role
of renewables in the low-carbon transformation — first-best vs. second-best
worlds. Climatic Change 114, 145 – 168.
Bauer N�, I� Mouratiadou, L� Baumstark, R� J� Brecha, O� Edenhofer, and E�
Kriegler (2013)� Global Fossil Energy Markets and Climate Change Mitiga-
tion — An Analysis with ReMIND. Climatic Change, 14. doi: DOI 10.1007 / s1058
4 – 013 – 0901 – 6, ISSN: 1573-1480.

572572
Energy Systems
7
Chapter 7
Bayer P�, L� Rybach, P� Blum, and R� Brauchler (2013a)� Review on life cycle
environmental effects of geothermal power generation. Renewable and Sus-
tainable Energy Reviews 26, 446 – 463. Available at: http: / / www. scopus.
com / inward / record.url?eid=2-s2.0-84879985527&partnerID=40&md5=ac2d3
106b1942a8f7344b3880afdb9ea.
Bayer P�, L� Rybach, P� Blum, and R� Brauchler (2013b)� Review of life cycle envi-
ronmental effects of geothermal power generation. Renewable and Sustainable
Energy Reviews, 446 – 463.
Bazilian M�, P� Nussbaumer, C� Eibs-Singer, A� Brew-Hammond, V� Modi, B�
Sovacool, V� Ramana, and P� K� Aqrawi (2012)� Improving Access to Modern
Energy Services: Insights from Case Studies. The Electricity Journal 25, 93 – 114.
Beaudin M�, H� Zareipour, A� Schellenberglabe, and W� Rosehart (2010)�
Energy storage for mitigating the variability of renewable electricity sources:
An updated review. Energy for Sustainable Development 14, 302 – 314. doi:
10.1016 / j.esd.2010.09.007, ISSN: 0973-0826.
Becerralopez H�, and P� Golding (2007)� Dynamic exergy analysis for capacity
expansion of regional power-generation systems: Case study of far West Texas.
Energy 32, 2167 – 2186. doi: 10.1016 / j.energy.2007.04.009, ISSN: 03605442.
Benson S�, P� Cook, J� Anderson, S� Bachu, H� Nimir, B� Basu, J� Bradshaw, G�
Deguchi, J� Gale, G� von Goerne, W� Heidug, S� Holloway, R� Kamal, D�
Keith, P� Lloyd, P� Rocha, B� Senior, J� Thomson, T� Torp, T� Wildenborg, M�
Wilson, F� Zarlenga, and D� Zhou (2005)� Underground Geological Storage.
In: IPCC Special Report on Carbon Dioxide Capture and Storage. Prepared by
Working Group III of the Intergovernmental Panel on Climate Change [Metz,
B., O. Davidson, H. C. de Coninck, M. Loos, and L. A. Meyer (eds.)]. Cambridge,
UK and New York, NY, USA, pp. 442. Available at: http: / / www. ipcc. ch / publica-
tions_and_data / _reports_carbon_dioxide.htm.
Berndes G� (2008)� Future Biomass Energy Supply: The Consumptive Water Use Per-
spective. International Journal of Water Resources Development 24, 235 – 245.
doi: 10.1080 / 07900620701723489, ISSN: 0790-0627, 1360 – 0648.
De Best-Waldhober M�, D� Daamen, and A� Faaij (2009)� Informed and unin-
formed public opinions on CO
2
capture and storage technologies in the Neth-
erlands. International Journal of Greenhouse Gas Control 3, 322 – 332. doi:
10.1016 / j.ijggc.2008.09.001, ISSN: 1750-5836.
Bezdek R�, and R� M� Wendling (2013)� The return on investment of the clean coal
technology program in the USA. Energy Policy 54, 104 – 112.
Bickerstaff K�, I� Lorenzoni, N� F� Pidgeon, W� Poortinga, and P� Simmons
(2008)� Reframing nuclear power in the UK energy debate: nuclear power, cli-
mate change mitigation and radioactive waste. Public Understanding of Science
17, 145 – 169. doi: 10.1177 / 0963662506066719.
Binnemans K�, P� T� Jones, B� Blanpain, T� Van Gerven, Y� Yang, A� Walton, and M�
Buchert (2013)� Recycling of rare earths: A critical review. Journal of Cleaner
Production 51, 1 – 22. Available at: http: / / www. scopus. com / inward / record.
url?eid=2-s2.0-84879926400&partnerID=40&md5=40216849dbbe602d34c65
5b01a6453d1.
Birkholzer J� T�, and Q� Zhou (2009)� Basin-scale hydrogeologic impacts of CO
2
storage: Capacity and regulatory implications. International Journal of Green-
house Gas Control 3, 745 – 756. doi: 10.1016 / j.ijggc.2009.07.002, ISSN: 1750-
5836.
Birkholzer J� T�, Q� Zhou, and C�-F� Tsang (2009)� Large-scale impact of CO
2
stor-
age in deep saline aquifers: A sensitivity study on pressure response in strati-
fied systems. International Journal of Greenhouse Gas Control 3, 181 – 194. doi:
10.1016 / j.ijggc.2008.08.002, ISSN: 1750-5836.
Blarke M� B� (2012)� Towards an intermittency-friendly energy system: Comparing
electric boilers and heat pumps in distributed cogeneration. Applied Energy 91,
349 – 365. doi: 10.1016 / j.apenergy.2011.09.038, ISSN: 0306-2619.
BNEF, and Frankfurt School-UNEP Centre (2013)� Global Trends in Renew-
able Energy Investment 2013. Bloomberg New Energy Finance and Frankfurt
School — UNEP Centre, Frankfurt am Main.
Bodas Freitas I�, E� Dantas, and M� Iizuka (2012)� The Kyoto mechanisms and
the diffusion of renewable energy technologies in the BRICS. Energy Policy 42,
118 – 128.
Bode S� (2006)� On the impact of renewable energy support schemes on power
prices. HWWI Research Paper 4.
Böhringer C�, A� Keller, and E� van der Werf (2013)� Are green hopes too rosy?
Employment and welfare impacts of renewable energy promotion. Energy Eco-
nomics 36, 277 – 285.
Boice J� J� (2012)� Radiation Epidemiology: A Perspective on Fukushima. Journal of
Radiological Protection 32, N33 – N40.
Borenstein S� (2012)� The Private and Public Economics of Renewable Electricity
Generation. Journal of Economic Perspectives, American Economic Association
26, 67 – 92.
Boulamanti A�, S� D� Maglio, J� Giuntoli, and A� Agostini (2013)� Influence of dif-
ferent practices on biogas sustainability. Biomass and Bioenergy 53, 149 – 161.
Boyé H� (2008)� Water, energy, desalination & climate change in the Mediterra-
nean. Blue Plan, Regional Activity Center. Available at: http: / / www. planbleu.
org / publications / Regional_study_desalination_EN.pdf.
BP (2011)� BP Statistical Review of World Energy. Available at: http: / / www. bp.
com / statisticalreview.
BP (2012)� BP Statistical Review of World Energy. Available at: http: / / www. bp.
com / statisticalreview.
BP (2013)� BP Statistical Review of World Energy. Available at: http: / / www. bp.
com / en / global / corporate / about-bp / statistical-review-of-world-energy-2013.
html.
Bradshaw J�, S� Bachu, D� Bonijoly, R� Burruss, S� Holloway, N� P� Christensen,
and O� M� Mathiassen (2007)� CO
2
storage capacity estimation: Issues and
development of standards. International Journal of Greenhouse Gas Control 1,
62 – 68. doi: 10.1016 / S1750-5836(07)00027-8, ISSN: 1750-5836.
Brandstätt C�, G� Brunekreeft, and K� Jahnke (2011)� How to deal with negative
power price spikes? — Flexible voluntary curtailment agreements for large-scale
integration of wind. Energy Policy 39, 3732 – 3740.
Brandt A� R� (2011)� Variability and Uncertainty in Life Cycle Assessment Models for
Greenhouse Gas Emissions from Canadian Oil Sands Production. Environ. Sci.
Technol. 46, 1253 – 1261. doi: 10.1021 / es202312p, ISSN: 0013-936X.
Brandt A� R�, J� Englander, and S� Bharadwaj (2013)� The energy efficiency of oil
sands extraction: Energy return ratios from 1970 to 2010. Energy 55, 693 – 702.
doi: 10.1016 / j.energy.2013.03.080, ISSN: 0360-5442.
Brandt A� R�, and A� E� Farrell (2007)� Scraping the bottom of the barrel: Green-
house gas emission consequences of a transition to low-quality and synthetic
petroleum resources. Climatic Change 84, 241 – 263. Available at: http: / / www.
scopus. com / inward / record.url?eid=2-s2.0-36148957478&partnerID=40&md5
=0fe496aff8dd3db95377fd6f4f3e6daa.
Bratland O� (2010)� Pipe Flow 2 — Multi-Phase Flow Assurance. Available at:
http: / / www. drbratland. com / free-book-pipe-flow-2-multi-phase-flow-assur-
ance / .

573573
Energy Systems
7
Chapter 7
Brauer M�, M� Amann, R� T� Burnett, A� Cohen, F� Dentener, M� Ezzati, S� B�
Henderson, M� Krzyzanowski, R� V� Martin, R� Van Dingenen, A� Van Don-
kelaar, and G� D� Thurston (2012)� Exposure assessment for estimation of the
global burden of disease attributable to outdoor air pollution. Environmen-
tal Science and Technology 46, 652 – 660. Available at: http: / / www. scopus.
com / inward / record.url?eid=2-s2.0-84863420410&partnerID=40&md5=26628
0b5d8a2a681d4fc23174f8439dc.
Bruckner T�, G� Petschel-Held, G� Toth, F� L� Fussel, C� Helm, M� Leimbach, and
H� J� Schnellnhuber (1999)� Climate change decision-support and the toler-
able windows approach. Environmental Modeling and Assessment 4, 217 – 234.
Brugge D�, and V� Buchner (2011)� Health effects of uranium: new research find-
ings. Reviews on Environmental Health 26. doi: 10.1515 / REVEH.2011.032,
ISSN: 2191-0308, 0048 – 7554.
Bruvoll A�, S� J� Magne, and H� Vennemo (2011)� Reforming Environmentally
Harmful Subsidies. How to Counteract Distributional Impacts. TemaNord,
Nordic Council of Ministers, Copenhagen. Available at: http: / / www. norden.
org / en / publications / publikationer / 2011-551.
Budischak C�, D� Sewell, H� Thomson, L� Mach, D� E� Veron, and W� Kempton
(2013)� Cost-minimized combinations of wind power, solar power and electro-
chemical storage, powering the grid up to 99.9 % of the time. Journal of Power
Sources 225, 60 – 74. doi: 10.1016 / j.jpowsour.2012.09.054, ISSN: 0378-7753.
Bunn M�, S� Fetter, J� Holdren, and B� van der Zwaan (2003)� The Economics of
Reprocessing vs. Direct Disposal of Spent Nuclear Fuel. Project on Managing
the Atom. Belfer Center for Science and International Affairs, John F. Kennedy
School of Government, Harvard University, Cambridge, MA.
Burgherr P�, P� Eckle, and S� Hirschberg (2012)� Comparative assessment of
severe accident risks in the coal, oil and natural gas chains. Reliability Engi-
neering and System Safety 105, 97 – 103. Available at: http: / / www. scopus.
com / inward / record.url?eid=2-s2.0-84863987998&partnerID=40&md5=535fbc
23cfa28af76f6d5fc814c41eec.
Burgherr P�, P� Eckle, S� Hirschberg, and E� Cazzoli (2011)� Final Report on
Severe Accident Risks Including Key Indicators. Paul Scherrer Institute, Villingen,
Switzerland. Available at: http: / / gabe.web.psi.ch / pdfs / secure / SECURE_Deliver-
able_D5_7_2_Severe_Accident_Risks.pdf.
Burgherr P�, S� Hirschberg, and E� Cazzoli (2008)� Final Report on Quantifica-
tion of Risk Indicators for Sustainability Assessment of Future Electricity Supply
Options. New Energy Externalities Developments for Sustainability, Brussels,
Belgium.
Burkhardt J� J�, G� Heath, and E� Cohen (2012)� Life Cycle Greenhouse Gas
Emissions of Trough and Tower Concentrating Solar Power Electricity Gen-
eration. Journal of Industrial Ecology 16, S93 – S109. doi: 10.1111 / j.1530-
9290.2012.00474.x, ISSN: 1530-9290.
Burkhardt J� J�, G� A� Heath, and C� S� Turchi (2011)� Life Cycle Assessment of a
Parabolic Trough Concentrating Solar Power Plant and the Impacts of Key
Design Alternatives. Environmental Science & Technology 45, 2457 – 2464.
Burnham A�, J� Han, C� E� Clark, M� Wang, J� B� Dunn, and I� Palou-Rivera (2012)�
Life-cycle greenhouse gas emissions of shale gas, natural gas, coal, and petro-
leum. Environmental Science and Technology 46, 619 – 627.
Burtraw D�, J� Blonz, and M� Walls (2012)� Social Safety Nets and US Climate
Policy Costs. Climate Policy 12, 1 – 17.
Buscheck T� A�, Y� Sun, M� Chen, Y� Hao, T� J� Wolery, W� L� Bourcier, B� Court, M� A�
Celia, S� Julio Friedmann, and R� D� Aines (2012)� Active CO
2
2 reservoir
management for carbon storage: Analysis of operational strategies to relieve
pressure buildup and improve injectivity. International Journal of Greenhouse
Gas Control 6, 230 – 245. doi: 10.1016 / j.ijggc.2011.11.007. ISSN: 1750-5836.
Butler D� (2010)� France digs deep for nuclear waste. Nature 466, 804 – 805.
Byrne J�, A� Zhou, B� Shen, and K� Hughes (2007)� Evaluating the potential of
small-scale renewable energy options to meet rural livelihoods needs: A
GIS- and lifecycle cost-based assessment of Western China’s options. Energy
Policy 35, 4391 – 4401. Available at: http: / / www. scopus. com / inward / record.
url?eid=2-s2.0-34248585361&partnerID=40&md5=4a339fa5ad37c5eff458b1
f5a2695dd8.
Caduff M�, M� A� J� Huijbregts, H� J� Althaus, A� Koehler, and S� Hellweg (2012)�
Wind power electricity: The bigger the turbine, the greener the electricity? Envi-
ronmental Science and Technology 46, 4725 – 4733. Available at: http: / / www.
scopus. com / inward / record.url?eid=2-s2.0-84860454335&partnerID=40&md5
=4d1a8548e3f31657fca9e0ee75800b40.
Cai W�, C� Wang, J� Chen, and S� Wang (2011)� Green economy and green jobs:
Myth or reality? The case of China’s power generation sector. Energy Economics
36, 277 – 285.
Calvin K�, L� Clarke, V� Krey, G� Blanford, K� Jiang, M� Kainuma, E� Kriegler,
G� Luderer, and P� R� Shukla (2012)� The role of Asia in mitigating climate
change: Results from the Asia modeling exercise. Energy Economics 34,
251 – 260.
Canadell J� G�, M� R� Raupach, and R� A� Houghton (2009)� Anthropogenic CO
2
emissions in Africa. Biogeosciences 6, 463 – 468.
Carbo M� C�, R� Smit, B� van der Drift, and D� Jansen (2011)� Bio energy with
CCS (BECCS): Large potential for BioSNG at low CO
2
avoidance cost. Energy
Procedia 4, 2950 – 2954. doi: 10.1016 / j.egypro.2011.02.203, ISSN: 1876-6102.
Cardis E�, D� Krewski, M� Boniol, V� Drozdovitch, S� Darby, E� S� Gilbert, S� Akiba,
J� Benichou, J� Ferlay, S� Gandini, C� Hill, G� Howe, A� Kesminiene, M� Mos-
ner, M� Sanchez, H� Storm, L� Voisin, and P� Boyle (2006)� Estimates of the
Cancer Burden in Europe from Radioactive Fallout from the Chernobyl Accident.
International Journal of Cancer 119, 1224 – 1235. doi: 10.1002 / ijc.22037.
Carey J� W�, R� Svec, R� Grigg, J� Zhang, and W� Crow (2010)� Experimental
investigation of wellbore integrity and CO
2
-brine flow along the casing-cement
microannulus. International Journal of Greenhouse Gas Control 4, 272 – 282.
doi: 10.1016 / j.ijggc.2009.09.018, ISSN: 1750-5836.
Carey J� W�, M� Wigand, S� J� Chipera, G� WoldeGabriel, R� Pawar, P� C� Lichtner,
S� C� Wehner, M� A� Raines, and J� G� D� Guthrie (2007)� Analysis and perfor-
mance of oil well cement with 30 years of CO
2
exposure from the SACROC Unit,
West Texas, USA. International Journal of Greenhouse Gas Control 1, 75 – 85.
doi: 10.1016 / s1750-5836(06)00004-1, ISSN: 1750-5836.
Carraro C�, and E� Massetti (2012)� Beyond Copenhagen: a realistic climate policy
in a fragmented world. Climatic Change 110. doi: 10.1007 / s10584-011-0125-6.
Casillas C� E�, and D� M� Kammen (2010)� Environment and development. The
energy-poverty-climate nexus. Science 330, 1181 – 1182.
De Castro C�, M� Mediavilla, L� J� Miguel, and F� Frechoso (2011)� Global
wind power potential: Physical and technological limits. Energy Policy 39,
6677 – 6682. doi: 10.1016 / j.enpol.2011.06.027, ISSN: 0301-4215.
Cathles I�, L� Brown, M� Taak, and A� Hunter (2012)� A Commentary on “The
Greenhouse-gas Footprint of Natural Gas in Shale Formations” by R. W. How-
arth, R. Santoro, and Anthony Ingraffea. Climate Change 113, 525 – 535.

574574
Energy Systems
7
Chapter 7
Cavanagh A� J�, R� S� Haszeldine, and M� J� Blunt (2010)� Open or closed? A
discussion of the mistaken assumptions in the Economides pressure analysis
of carbon sequestration. Journal of Petroleum Science and Engineering 74,
107 – 110. doi: 10.1016 / j.petrol.2010.08.017.
Central Intelligence Agency (2011)� The World Factbook. Available at:
https: / / www. cia. gov / library / publications / the-world-factbook / fields / 2117.
html#as.
Chalmers H�, and J� Gibbins (2007)� Initial evaluation of the impact of post-com-
bustion capture of carbon dioxide on supercritical pulverised coal power plant
part load performance. Fuel 86, 2109 – 2123. doi: 10.1016 / j.fuel.2007.01.028,
ISSN: 0016-2361.
Chalmers, M� Lucquiaud, J� Gibbins, and M� Leach (2009)� Flexible operation
of coal fired power plants with postcombustion capture of carbon dioxide.
Journal of Environmental Engineering 135, 449. doi: 10.1061 / (ASCE)EE.1943-
7870.0000007, ISSN: 07339372.
Chan E� Y� Y�, and S� M� Griffiths (2010)� The epidemiology of mine accidents
in China. The Lancet 376, 575 – 577. Available at: http: / / www. scopus.
com / inward / record.url?eid=2-s2.0-77956049158&partnerID=40&md5=67e5d
c9aab2067a0d5b35f9ba8db397f.
Charpentier A� D�, J� A� Bergerson, and H� L� MacLean (2009)� Understanding
the Canadian oil sands industry’s greenhouse gas emissions. Environmen-
tal Research Letters 4. Available at: http: / / www. scopus. com / inward / record.
url?eid=2-s2.0-67650269786&partnerID=40&md5=234b9d5805675dea858bc
bae040ff8c5.
Chen H�, T� N� Cong, W� Yang, C� Tan, Y� Li, and Y� Ding (2009)� Progress in electri-
cal energy storage system: A critical review. Progress in Natural Science 19,
291 – 312. doi: 10.1016 / j.pnsc.2008.07.014, ISSN: 1002-0071.
Chen H�, H� Qi, R� Long, and M� Zhang (2012)� Research on 10-year tendency of
China coal mine accidents and the characteristics of human factors. Safety Sci-
ence 50, 745 – 750. doi: 10.1016 / j.ssci.2011.08.040, ISSN: 0925-7535.
Cheng Y� P�, L� Wang, and X� L� Zhang (2011)� Environmental impact of coal mine
methane emissions and responding strategies in China. International Journal
of Greenhouse Gas Control 5, 157 – 166. Available at: http: / / www. scopus.
com / inward / record.url?eid=2-s2.0-78650973741&partnerID=40&md5=dd175
24e9d2471b14771b630cb577c57.
Cherian A� (2009)� Bridging the Divide Between Poverty Reduction and Climate
Change through Sustainable and Innovative Energy Technologies. Environment
and Energy Group, United Nations Development Programme, New York, NY,
USA.
Cherp A�, A� Adenikinju, A� Goldthau, F� Hernandez, L� Hughes, J� Jansen, J�
Jewell, M� Olshanskaya, R� Soares de Oliveira, B� Sovacool, and S� Vaku-
lenko (2012)� Energy and Security. In: Global Energy Assessment: Toward a
Sustainable Future. N. Nakicenovic, A. Patwardhan, L. Gomez-Echeverri, T.
Johansson (eds.). Cambridge Univeristy Press, Laxenburg, Austria; Cambridge,
UK & New York, USA, pp. 325 – 384.
Cherp A�, and J� Jewell (2011)� The Three Perspectives on Energy Security: Intel-
lectual History, Disciplinary Roots and the Potential for Integration. Cur-
rent Opinion in Environmental Sustainability 3, 202 – 212. doi: 10.1016 / j.
cosust.2011.07.001.
Cherp A�, J� Jewell, V� Vinichenko, N� Bauer, and E� De Cian (2013)� Global
energy security under different climate policies, GDP growth rates and fossil
resource availabilities. Climatic Change. doi: 10.1007 / s10584-013-0950-x.
Cherubini F�, R� Bright, and A� Strømman (2012)� Site-specific global warming
potentials of biogenic CO
2
for bioenergy: Contributions from carbon fluxes
and albedo dynamics. Environmental Research Letters 7. doi: 10.1088 / 1748-
9326 / 7 / 4 / 045902.
Chester L� (2009)� Conceptualising Energy Security and Making Explicit Its Polyse-
mic Nature. Energy Policy 38, 887 – 895. doi: 10.1016 / j.enpol.2009.10.039.
Chidumayo E� N�, and D� J� Gumbo (2013)� The environmental impacts of charcoal
production in tropical ecosystems of the world: A synthesis. Energy for Sustain-
able Development 17, 86 – 94.
Christidis A�, C� Koch, L� Pottel, and G� Tsatsaronis (2012)� The contribution of
heat storage to the profitable operation of combined heat and power plants in
liberalized electricity markets. Energy 41, 75 – 82.
Chum H�, A� Faaij, J� Moreira, G� Berndes, P� Dhamija, H� Dong, B� Gabri-
elle, G� Goss Eng, W� Lucht, M� Mapako, O� Masera Cerutti, T� McIntyre,
T� Minowa, and K� Pingoud (2011)� Bioenergy. In: IPCC Special Report on
Renewable Energy Sources and Climate Change Mitigation. Prepared by Work-
ing Group III of the Intergovernmental Panel on Climate Change [O. Edenhofer,
R. Pichs-Madruga, Y. Sokona, K. Seyboth, P. Matschoss, S. Kadner, T. Zwickel, P.
Eickemeier, G. Hansen, S. Schlömer, C. von Stechow (eds.)]. Cambridge Univer-
sity Press, Cambridge, United Kingdom and New York, NY, USA.
Cisneros B� J�, and T� Oki (2014)� Chapter 3. Freshwater Resources. In: Climate
Change 2013: Impacts, Adaptation, and Vulnerability. Fifth Assessment Report
of Working Group II. Cambridge Univeristy Press, Cambridge, UK.
Clapp C�, K� Karousakis, B� Buchner, and J� Chateau (2009)� National and Sec-
toral GHG Mitigation Potential: A Comparison Across Models. Organisation for
Economic Co-Operation and Development, Paris.
Clastres C� (2011)� Smart grids: Another step towards competition, energy security
and climate change objectives. Energy Policy 39, 5399 – 5408.
Cohen S�, H� Chalmers, M� Webber, and C� King (2011)� Comparing post-com-
bustion CO
2
capture operation at retrofitted coal-fired power plants in the Texas
and Great Britain electric grids. Environmental Research Letters 6, 024001. doi:
10.1088 / 1748-9326 / 6 / 2 / 024001, ISSN: 1748-9326.
Cole I� S�, P� Corrigan, S� Sim, and N� Birbilis (2011)� Corrosion of pipelines used
for CO
2
transport in CCS: Is it a real problem? International Journal of Green-
house Gas Control 5, 749 – 756. doi: 10.1016 / j.ijggc.2011.05.010, ISSN: 1750-
5836.
Collier P�, and A� J� Venables (2012)� Greening Africa? Technologies, endowments
and the latecomer effect. Energy Economics 34, S75 – S84.
Cook B�, J� Gazzano, Z� Gunay, L� Hiller, S� Mahajan, A� Taskan, and S� Vilogorac
(2012)� The smart meter and a smarter consumer: quantifying the benefits of
smart meter implementation in the United States. Chemistry Central Journal 6,
1 – 16.
Cooke P�, G� Kohlin, and W� F� Hyde (2008)� Fuelwood, Forests and Community
Management: Evidence from Household Studies. Environment and Develop-
ment Economics 13, 103 – 135.
Cormier S�, S� Wilkes, and L� Zheng (2013)� Relationship of land use and elevated
ionic strength in Appalachian watersheds. Environmental Toxicology and Chem-
istry 32, 296 – 303. doi: 10.1002 / etc.2055.
Corner A�, D� Venables, A� Spence, W� Poortinga, C� Demski, and N� Pidgeon
(2011)� Nuclear power, climate change and energy security: Exploring British
public attitudes. Energy Policy 39, 4823 – 4833.

575575
Energy Systems
7
Chapter 7
Corry O�, and D� Reiner (2011)� Evaluating Global Carbon Capture and Stor-
age (CCS) Communication Materials: A Survey of Global CCS Communica-
tions. Cambridge — Judge Business School, 46 pp. Available at: http: / / www.
globalccsinstitute. com / publications / evaluating-global-ccs-communications.
Corsten M�, A� Ramírez, L� Shen, J� Koornneef, and A� Faaij (2013)� Environ-
mental impact assessment of CCS chains — Lessons learned and limitations
from LCA literature. International Journal of Greenhouse Gas Control 13,
59 – 71. Available at: http: / / www. scopus. com / inward / record.url?eid=2-s2.0-
84872421378&partnerID=40&md5=1aed2b9726e322bc529253388cdd0749.
Cossent R�, L� Olmos, T� Gómez, C� Mateo, and P� Frías (2011)� Distribution net-
work costs under different penetration levels of distributed generation. Euro-
pean Transactions on Electrical Power 21, 1869 – 1888. doi: 10.1002 / etep.503,
ISSN: 1546-3109.
Costantini V�, F� Gracceva, A� Markandya, and G� Vicini (2007)� Security of
energy supply: Comparing scenarios from a European Perspective. Energy Policy
35, 210 – 226.
Cozzani V�, M� Campedela, E� Renni, and E� Krausmann (2010)� Industrial acci-
dents triggered by flood events: Analysis of past accidents. Journal of Hazard-
ous Materials 175, 501 – 509.
Creutzig F� S�, and D� M� Kammen (2011)� The Post-Copenhagen Roadmap
Towards Sustainability: Differentiated Geographic Approaches, Integrated Over
Goals. Innovations: Technology, Governance, Globalization 4, 301 – 321.
Crow W�, J� W� Carey, S� Gasda, D� Brian Williams, and M� Celia (2010)� Wellbore
integrity analysis of a natural CO
2
producer. International Journal of Green-
house Gas Control 4, 186 – 197. ISSN: 17505836 (ISSN).
CRS (2012)� Closing Yucca Mountain: Litigation Associated with Attempts to Aban-
don the Planned Nuclear Waste Repository. Congressional Research Service,
Washington, DC,
Cummins W� E�, M� M� Corletti, and T� L� Schulz (2003)� Westinghouse AP1000
Advanced Passive Plant. In: Proceedings of International Congress on Advances
in Nuclear Power Plants (ICAPP ’03). Cordoba, Spain.
Cutter E�, C� W� Woo, F� Kahrl, and A� Taylor (2012)� Maximizing the Value of
Responsive Load. The Electricity Journal 25, 6 – 16.
D’Agostino A� L�, B� K� Sovacool, and M� J� Bambawale (2011)� And then what
happened? A retrospective appraisal of China’s Renewable Energy Devel-
opment Project (REDP). Renewable Energy 36, 3154 – 3165. Available at:
http: / / www. scopus. com / inward / record.url?eid=2-s2.0-79957827651&partnerI
D=40&md5=86b4ff42ed6acd6e3a601a2778c05c31.
Dahl E� L�, K� Bevanger, T� Nygård, E� Røskaft, and B� G� Stokke (2012)� Reduced
breeding success in white-tailed eagles at Smøla windfarm, western Nor-
way, is caused by mortality and displacement. Biological Conservation 145,
79 – 85. Available at: http: / / www. scopus. com / inward / record.url?eid=2-s2.0-
84856235825&partnerID=40&md5=482f29339d3c94ae1e4000559314cd31.
Dahowski R� T�, C� Davidson, and J� Dooley (2011)� Comparing large scale CCS
deployment potential in the USA and China: A detailed analysis based on coun-
try-specific CO
2
transport & storage cost curves. Energy Procedia 4, 2732 – 2739.
doi: 10.1016 / j.egypro.2011.02.175, ISSN: 1876-6102.
Dahowski R� T�, C� L� Davidson, X� Li, and N� Wei (2012)� A $70 / tCO
2
greenhouse
gas mitigation backstop for China’s industrial and electric power sectors:
Insights from a comprehensive CCS cost curve. International Journal of Green-
house Gas Control 11, 73 – 85.
Dahowski R�, J� Dooley, C� Davidson, S� Bachu, and N� Gupta (2005)� Building
the Cost Curves for CO2 Storage: North America. IEA Greenhouse Gas R&D Pro-
gramme, Cheltenham, UK.
Dai A� (2011)� Drought under global warming: a review. Wiley Interdisciplinary
Reviews: Climate Change 2, 45 – 65.
Dale M�, and S� M� Benson (2013)� Energy Balance of the Global Photovoltaic (PV)
Industry — Is the PV Industry a Net Electricity Producer? Environmental Science
& Technology 47, 3482 – 3489. doi: 10.1021 / es3038824, ISSN: 0013-936X.
Dale A� T�, V� Khanna, R� D� Vidic, and M� M� Bilec (2013)� Process based life-
cycle assessment of natural gas from the marcellus shale. Environmental
Science & Technology 47, 5459 – 5466. Available at: http: / / www. scopus.
com / inward / record.url?eid=2-s2.0-84878225327&partnerID=40&md5=fb339
0ca2c94400b0e0ee8de6299ae0f.
Damerau K�, K� Williges, A� G� Patt, and P� Gauché (2011)� Costs of reducing
water use 326 of concentrating solar power to sustainable levels: Scenarios for
North Africa. Energy Policy 39, 4391 – 4398.
Davis S� J�, K� Caldeira, and H� D� Matthews (2010)� Future CO
2
emissions and
climate change from existing energy infrastructure. Science 329, 1330 – 3. doi:
10.1126 / science.1188566, ISSN: 1095-9203 0036 – 8075.
Deane J� P�, B� P� Gallachóir, and E� J� McKeogh (2010)� Techno-economic review
of existing and new pumped hydro energy storage plant. Renewable and Sus-
tainable Energy Reviews 14, 1293 – 1302. doi: 10.1016 / j.rser.2009.11.015,
ISSN: 1364-0321.
Decarre S�, J� Berthiaud, N� Butin, and J�-L� Guillaume-Combecave (2010)� CO
2
maritime transportation. International Journal of Greenhouse Gas Control 4,
857 – 864. doi: 10.1016 / j.ijggc.2010.05.005, ISSN: 1750-5836.
Delina L� L�, and M� Diesendorf (2013)� Is wartime mobilisation a suitable policy
model for rapid national climate mitigation? Energy Policy 58, 371 – 380.
Delucchi M�, and M� Jacobson (2011)� Providing all global energy with wind,
water, and solar power, Part II: Reliability, system and transmission costs, and
policies. Energy Policy 39, 1170 – 1190. doi: 16 / j.enpol.2010.11.045, ISSN:
0301-4215.
Demarty M�, and J� Bastien (2011)� GHG emissions from hydroelectric reservoirs
in tropical and equatorial regions: Review of 20 years of CH
4
emission measure-
ments. Energy Policy 39, 4197 – 4206.
Deng J�, Y� Xu, H� Jiang, and S� Hu (2013)� Safe and effective production of coal
mine promoted by coalbed methane reclamation. Advanced Materials Research
616 – 618, 310 – 315. Available at: http: / / www. scopus. com / inward / record.
url?eid=2-s2.0-84871877312&partnerID=40&md5=217e31c02bcddd08098b4
0dcb9790525.
Denholm P�, and M� Hand (2011)� Grid flexibility and storage required to achieve
very high penetration of variable renewable electricity. Energy Policy 39,
1817 – 1830. doi: 16 / j.enpol.2011.01.019, ISSN: 0301-4215.
Denholm P�, and R� Sioshansi (2009)� The value of compressed air energy storage
with wind in transmission-constrained electric power systems. Energy Policy 37,
3149 – 3158.
Depuru S� S� S� R�, L� Wang, and V� Devabhaktuni (2011)� Smart meters for power
grid: Challenges, issues, advantages and status. Renewable and Sustainable
Energy Reviews 15, 2736 – 2742.

576576
Energy Systems
7
Chapter 7
DERA (2011)� Kurzstudie — Reserven, Ressourcen und Verfügbarkeit von Ener-
gierohstoffen 2011. Deutsche Rohstoff Agentur (DERA), Bundesanstalt fuer
Geowissenschaften und Rohstoffe, 92 pp. Available at: http: / / www. bgr.
bund. de / DE / Themen / Energie / Downloads / Energiestudie-Kurzf-2011.pdf?__
blob=publicationFile&v=3.
Díaz P�, C� A� Arias, M� Gomez-Gonzalez, D� Sandoval, and R� Lobato (2013)�
Solar home system electrification in dispersed rural areas: A 10-year experience
in Jujuy, Argentina. Progress in Photovoltaics: Research and Applications 21,
297 – 307. Available at: http: / / www. scopus. com / inward / record.url?eid=2-s2.0-
84876670694&partnerID=40&md5=0ced5c8b1b981a40d233b22f1a4ad6ec.
Van Dingenen R�, F� J� Dentener, F� Raes, M� C� Krol, L� Emberson, and J� Cofala
(2009)� The global impact of ozone on agricultural crop yields under current
and future air quality legislation. Atmospheric Environment 43, 604 – 618. doi:
10.1016 / j.atmosenv.2008.10.033, ISSN: 1352-2310.
DiPietro P�, and P� Balash (2012)� A Note on Sources of CO
2
Supply for Enhanced-
Oil-Recovery Opperations. SPE Economics & Management 4, 69 – 74.
Don A�, B� Osborne, A� Hastings, U� Skiba, M� Carter, J� Drewer, H� Flessa, A�
Freibauer, N� Hyvönen, M� Jones, G� Lanigan, Ü� Mander, A� Monti, S�
Nijakou Djomo, J� Valentine, K� Walter, W� Zegada-Lizarazu, and T� Zenone
(2012)� Land-use change to bioenergy production in Europe: implications for
the greenhouse gas balance and soil carbon. GCB Bioenergy 4, 372 – 391.
Dones R�, C� Bauer, R� Bolliger, B� Burger, M� Faist, Emmenegger, R� Frisch-
knecht, T� Heck, N� Jungbluth, and A� Röder (2007)� Life Cycle Inventories
of Energy Systems: Results for Current Systems in Switzerland and Other UCTE
Countries. Swiss Centre for Life Cycle Inventories, Dübendorf, CH.
Dones R�, T� Heck, M� F� Emmenegger, and N� Jungbluth (2005)� Life cycle inven-
tories for the nuclear and natural gas energy systems, and examples of uncer-
tainty analysis. International Journal of Life Cycle Assessment 10, 10 – 23. Avail-
able at: : / / 000226379900003.
Doney S� C� (2010)� The Growing Human Footprint on Coastal and Open-Ocean Bio-
geochemistry. Science 328, 1512 – 1516. doi: 10.1126 / science.1185198, ISSN:
0036-8075, 1095 – 9203.
Dooley J� J� (2013)� Estimating the supply and demand for deep geologic CO
2
stor-
age capacity over the course of the 21st Century: A meta analysis of the litera-
ture. Energy Procedia 37, 5141 – 5150.
Dooley J�, R� Dahowski, and C� Davidson (2011)� CO
2
-driven Enhanced Oil
Recovery as a Stepping Stone to What? An MIT Energy Initiative and Bureau
of Economic Geology at UT Austin Symposium. In: Role of Enhanced Oil Recov-
ery in Accelerating the Deployment of Carbon Capture and Storage. E. J. Moniz,
S. W. Tinker, (eds.), MIT Press, Cambridge, MA, pp. 196.
Dooley J�, C� Trabucchi, and L� Patton (2010)� Design considerations for financ-
ing a national trust to advance the deployment of geologic CO
2
storage and
motivate best practices. International Journal of Greenhouse Gas Control 4,
381 – 387. doi: 10.1016 / j.ijggc.2009.09.009, ISSN: 1750-5836.
Dung E�, S� Leonardo, and T� Agusomu (2008)� The effect of gas flaring on crops
in the Niger Delta, Nigeria. GeoJournal 73, 297 – 305.
Dunn B�, H� Kamath, and J� Tarascon (2011)� Electrical energy storage for the
grid: A battery of choices. Science 334, 928 – 935.
Eckle P�, and P� Burgherr (2013)� Bayesian Data Analysis of Severe Fatal Accident
Risk in the Oil Chain. Risk Analysis 33, 146 – 160. Available at: http: / / www.
scopus. com / inward / record.url?eid=2-s2.0-84872415471&partnerID=40&md5
=6589ab7e0beb90ef0f27a497eea47f1b.
Edenhofer O�, L� Hirth, B� Knopf, M� Pahle, S� Schloemer, E� Schmid, and F�
Ueckerdt (2013)� On the economics of renewable energy sources. Energy Eco-
nomics 40, 12 – 23.
Edmonds J� A�, P� W� Luckow, K� V� Calvin, M� A� Wise, J� J� Dooley, G� P� Kyle, S� H�
Kim, P� L� Patel, and L� E� Clarke (2013)� Can radiative forcing be limited to
2.6 W
m-2
without negative emissions from bioenergy AND CO
2
capture and stor-
age? Climate Change 118, 29 – 43. doi: 10.1007 / s10584-012-0678-z.
Edmonds J�, T� Wilson, M� Wise, and J� Weyant (2006)� Electrification of the Econ-
omy and CO
2
Emissions Mitigation. Journal of Environmental Economics and
Policy Studies 7, 175 – 203.
EIA (2011)� Retrospective Review: Annual Energy Outlook 2010. US Department of
Energy, Energy Information Administration, Washington, DC.
EIA (2012)� Annual Energy Outlook 2012. With Projections to 2035. U. S.
Energy Information Administration, Office of Integrated and International
Energy Analysis, Washington, DC. Available at: http: / / www. eia. gov / fore-
casts / archive / aeo12 / index.cfm.
Eiken O�, P� Ringrose, C� Hermanrud, B� Nazarian, T� A� Torp, and L� Høier
(2011)� Lessons learned from 14 years of CCS operations: Sleipner, In Salah and
Snohvit. Energy Procedia 4, 5541 – 5548. doi: 10.1016 / j.egypro.2011.02.541,
ISSN: 1876-6102.
Einsiedel E� F�, A� D� Boyd, J� Medlock, and P� Ashworth (2013)� Assessing socio-
technical mindsets: Public deliberations on carbon capture and storage in the
context of energy sources and climate change. Energy Policy 53, 149 – 158.
Ellerman A� D�, F� J� Convery, and C� de Perthuis (2010)� Pricing Carbon: The Euro-
pean Union Emissions Trading Scheme. Cambridge University Press, Cambridge.
Elliot T�, and M� Celia (2012)� Potential restrictions for CO
2
sequestration sites due
to shale and tight gas production. Environmental Science and Technology 46,
1 – 16. doi: 10.1021 / es2040015.
Elliott Campbell J�, J� F� Fox, and P� M� Acton (2012)� Terrestrial carbon losses from
mountaintop coal mining offset regional forest carbon sequestration in the 21st
century. Environmental Research Letters 7. Available at: http: / / www. scopus.
com / record / display.url?eid=2-s2.0-84871840367&origin=inward&txGid=E22C
3BA38F75A3546366A9F10ECCACB6.N5T5nM1aaTEF8rE6yKCR3A%3a2.
Elliston B�, M� Diesendorf, and I� MacGill (2012)� Simulations of scenarios with
100 % renewable electricity in the Australian National Electricity Market. Energy
Policy 45, 606 – 613. doi: 10.1016 / j.enpol.2012.03.011, ISSN: 0301-4215.
Den Elzen M�, A� Hof, and M� Roelfsema (2011)� The emissions gap between
the Copenhagen pledges and the 2 8C climate goal: Options for closing and
risks that could widen the gap. Global Environmental Change 21, 733 – 743.
doi: 10.1016 / j.gloenvcha.2011.01.006.
Emberson L�, K� He, J� Rockström, M� Amann, J� Barron, R� Corell, S� Feresu, R�
Haeuber, K� Hicks, F� X� Johnson, A� Karlqvist, Z� Klimont, I� Mylvakanam,
W� W� Song, H� Vallack, and Z� Qiang (2012)� Chapter 3 — Energy and Envi-
ronment. In: Global Energy Assessment — Toward a Sustainable Future.Cam-
bridge University Press, Cambridge, UK and New York, NY, USA and the Interna-
tional Institute for Applied Systems Analysis, Laxenburg, Austria, pp. 191 – 254.
ISBN: 9781 10700 5198 hardback 9780 52118 2935 paperback.
Enerdata (2013)� Global Energy Statistical Yearbook. 2013. Enerdata, Grenoble,
France. Available at: http: / / www. enerdata. net / enerdatauk / press-and-publica-
tion / publications / world-energy-statistics-supply-and-demand.php.
Engemann K� M�, and M� T� Owyang (2010)� Unconventional Oil Stuck in a
Rock and a Hard Place. The Regional Economist July, 14 – 15. Available at:
http: / / www. stlouisfed. org / publications / pub_assets / pdf / re / 2010 / c / oil.pdf.

577577
Energy Systems
7
Chapter 7
Eom J�, J� Edmonds, V� Krey, N� Johnson, K� Riahi, and D� van Vuuren (2013)�
The Impact of Near-term Climate Policy Choices on Technology and Emissions
Transition Pathways. Technological Forecasting & Social Change. doi: http: / / dx.
doi.org / 10.1016 / j.techfore.2013.09.017.
EPRI (2003)� High Temperature Gas-Cooled Reactors for the Production of Hydro-
gen: An Assessment in Support of the Hydrogen Economy. Electric Power
Research Institute (EPRI), Palo Alto, California.
Epstein P� R�, J� J� Buonocore, K� Eckerle, M� Hendryx, B� M� Stout III, R� Hein-
berg, R� W� Clapp, B� May, N� L� Reinhart, M� M� Ahern, S� K� Doshi, and L�
Glustrom (2010)� Full cost accounting for the life cycle of coal. Ann. N. Y. Acad.
Sci. 1219, 73 – 98.
Esposito A�, and S� M� Benson (2012)� Evaluation and development of options for
remediation of CO
2
leakage into groundwater aquifers from geologic carbon
storage. International Journal of Greenhouse Gas Control 7, 62 – 73.
EU Commission (2012)� COMMUNICATION FROM THE COMMISSION, Guidelines
on Certain State Aid Measures in the Context of the Greenhouse Gas Emission
Allowance Trading Scheme Post-2012. EU Commission, Brussels, Belgium.
European Copper Institute (1999)� The Scope for Energy Saving in the EU through
the Use of Energy-Efficient Electricity Distribution Transformers. European Cop-
per Institute and European Commission Directorate-General for Energy DGXVII,
Brussels, Belgium. Available at: http: / / www. seai. ie / Archive1 / Files_Misc / REP-
009THERMIEFinalreport.pdf.
Fairlie I�, and A� Körblein (2010)� Review of epidemiology studies of child-
hood leukaemia near nuclear facilities: Commentary on Laurier etal. Radia-
tion Protection Dosimetry 138, 194 – 195. Available at: http: / / www. scopus.
com / inward / record.url?eid=2-s2.0-77950199313&partnerID=40&md5=ac277
57a0c9916dcc674bb04633f9ce8.
Fankhauser S�, F� Sehlleier, and N� Stern (2008)� Climate change, innovation and
jobs. Climate Policy 8, 421 – 429.
FAO (2010)� What Woodfuels Can Do to Mitigate Climate Change. Food and Agricul-
ture Organization of the United Nations, Rome, Italy, ISBN: 978-92-5-106653-9.
FAO (2011)� Highlights on Wood Charcoal: 2004 – 2009. Food and Agriculture Orga-
nization of the United Nations. Available at: http: / / faostat.fao.org / Portals / _fao-
stat / documents / pdf / wood%20charcoal.pdf.
Farina M� (2011)� Recent Global Trends and Policy Considerations. GE Energy.
Available at: http: / / www. genewscenter. com / ImageLibrary / DownloadMedia.
ashx?MediaDetailsID=3691.
Figueroa J� D�, T� Fout, S� Plasynski, H� McIlvried, and R� D� Srivastava (2008)�
Advances in CO
2
capture technology. International Journal of Greenhouse Gas
Control 2, 9 – 20.
Fingerman K� R�, G� Berndes, S� Orr, B� D� Richter, and P� Vugteveen (2011)�
Impact assessment at the bioenergy-water nexus. Biofuels, Bioproducts and
Biorefining 5, 375 – 386. doi: 10.1002 / bbb.294, ISSN: 1932104X.
Finley-Brook M�, and C� Thomas (2010)� From malignant neglect to extreme
intervention: treatment of displaced indigenous populations in two large hydro
projects in Panama. Water Altern. 3, 269 – 290.
Fischedick M�, R� Schaeffer, A� Adedoyin, M� Akai, T� Bruckner, L� Clarke, V�
Krey, I� Savolainen, S� Teske, D� Ürge-Vorsatz, and R� Wright (2011)�
Mitigation Potential and Costs. In: IPCC Special Report on Renewable Energy
Sources and Climate Change Mitigation. Prepared by Working Group III of the
Intergovernmental Panel on Climate Change [O. Edenhofer, R. Pichs-Madruga, Y.
Sokona, K. Seyboth, P. Matschoss, S. Kadner, T. Zwickel, P. Eickemeier, G. Hansen,
S. Schlömer, C. von Stechow (eds.)]. Cambridge University Press, Cambridge,
United Kingdom and New York, NY, USA.
Fleishman L� A�, W� B� De Bruin, and M� G� Morgan (2010)� Informed Public Pref-
erences for Electricity Portfolios with CCS and Other Low-Carbon Technologies.
Risk Analysis 30, 1399 – 1410. doi: 10.1111 / j.1539-6924.2010.01436.x, ISSN:
1539-6924.
Forster P�, V� Ramaswamy, P� Artaxo, T� Berntsen, R� Betts, D� W� Fahey, J� Hay-
wood, J� Lean, D� C� Lowe, G� Myhre, J� Nganga, R� Prinn, G� Raga, M�
Schulz, and R� V� Dorland (2007)� Changes in Atmospheric Constituents and
in Radiative Forcing. In: Climate Change 2007 — The Physical Science Basis.
Contribution of Working Group I to the Fourth Assessment Report of the Inter-
governmental Panel on Climate Change [S. Solomon, D. Qin, M. Manning, M.
Marquis, K. Averyt, M. M. Tignor, H. L. Miller (eds.)]. Cambridge University Press,
New York, NY Available at: file: / / localhost / Users / rjp / literature / i / IPCC%20
AR4 / ar4-wg1-chapter2.pdf.
Frankhauser S�, F� Sehlleier, and N� Stern (2008)� Climate change, innovation
and jobs. Climate Policy 8, 421 – 429.
Fripp M� (2011)� Greenhouse Gas Emissions from Operating Reserves Used to
Backup Large-Scale Wind Power. Environmental Science & Technology 45,
9405 – 9412. doi: 10.1021 / es200417b.
Frondel M�, N� Ritter, C� M� Schmidt, and C� Vance (2010)� Economic impacts
from the promotion of renewable energy technologies: The German experience.
Energy Policy 38, 4048 – 4056.
Fthenakis V�, and A� Anctil (2013)� Direct te mining: Resource availability and
impact on cumulative energy demand of CdTe PV life cycles. IEEE Journal of Pho-
tovoltaics 3, 433 – 438. Available at: http: / / www. scopus. com / inward / record.
url?eid=2-s2.0-84871746775&partnerID=40&md5=bc385e07cc93b1ea40204
2635e9491c1.
Fthenakis V�, and H� C� Kim (2010)� Life-cycle uses of water in U. S. electricity
generation. Renewable and Sustainable Energy Reviews 14, 2039 – 2048. doi:
10.1016 / j.rser.2010.03.008, ISSN: 1364-0321.
Fthenakis V� M�, H� C� Kim, and E� Alsema (2008)� Emissions from Photovol-
taic Life Cycles. Environmental Science & Technology 42, 2168 – 2174. doi:
10.1021 / es071763q, ISSN: 0013-936X, 1520 – 5851.
Furchtgott-Roth D� (2012)� The elusive and expensive green job. Energy Econom-
ics 34, 43 – 52.
Gagnon, Luc, Hall, Charles A� S�, and Brinker, Lysle (2009)� A Preliminary Inves-
tigation of Energy Return on Energy Investment for Global Oil and Gas Produc-
tion. Energies 2, 490 – 503. doi: 10.3390 / en20300490.
Gahleitner G� (2013)� Hydrogen from renewable electricity: An international review
of power-to-gas pilot plants for stationary applications. International Journal of
Hydrogen Energy 38, 2039 – 2061. doi: 10.1016 / j.ijhydene.2012.12.010, ISSN:
0360-3199.
Gale J�, and J� Davison (2004)� Transmission of CO
2
safety and economic consider-
ations. Energy 29, 1319 – 1328. doi: 10.1016 / j.energy.2004.03.090, ISSN: 0360-
5442.

578578
Energy Systems
7
Chapter 7
Galloway J� N�, A� R� Townsend, J� W� Erisman, M� Bekunda, Z� Cai, J� R� Freney,
L� A� Martinelli, S� P� Seitzinger, and M� A� Sutton (2008)� Transformation of
the Nitrogen Cycle: Recent Trends, Questions, and Potential Solutions. Science
320, 889 – 892. doi: 10.1126 / science.1136674, ISSN: 0036-8075, 1095 – 9203.
Garvin J� C�, C� S� Jennelle, D� Drake, and S� M� Grodsky (2011)� Response of
raptors to a windfarm. Journal of Applied Ecology 48, 199 – 209. Available at:
http: / / www. scopus. com / inward / record.url?eid=2-s2.0-78650947882&partnerI
D=40&md5=19b7713a1d723460adeb4a0800a9b3e9.
Gaus I� (2010)� Role and impact of CO
2
– rock interactions during CO
2
storage in
sedimentary rocks. International Journal of Greenhouse Gas Control 4, 73 – 89.
doi: http: / / dx.doi.org / 10.1016 / j.ijggc.2009.09.015.
GEA (2012)� Global Energy Assessment (Rogner, R. F. Aguilera, C. L. Archer, R. Ber-
tani, S. C. Bhattacharya, M. B. Dusseault, L. Gagnon, and V. Yakushev, Eds.). Cam-
bridge University Press and International Institute for Applied Systems Analysis,
Cambridge, UK & New York, NY, Vienna, Austria.
Gelfand I�, R� Sahajpal, X� Zhang, R� C� Izaurralde, K� Gross, and G� P� Robert-
son (2013)� Sustainable bioenergy production from marginal lands in the US
Midwest. Nature 493, 514 – 517.
Geras’kin S�, T� Evseeva, and A� Oudalova (2013)� Effects of long-term chronic
exposure to radionuclides in plant populations. Journal of Environmental Radio-
activity 121, 22 – 32. Available at: http: / / www. scopus. com / inward / record.
url?eid=2-s2.0-84876735275&partnerID=40&md5=750da9a24481103c23f3e
7ab9a43491b.
GGFR, and World Bank (2011)� Improving Energy Efficiency and Mitigating
Impact on Climate Change. Global Gas Flaring Reduction Partnership and the
World Bank, Washington, DC.
GIF (2002)� A Technology Roadmap for Generation IV Nuclear Energy Systems. US
DOE Nuclear Energy Research Advisory Committee and the Generation IV Inter-
national Forum.
GIF (2009)� GIF R&D Outlook for Generation IV Nuclear Energy Systems. OECD
Nuclear Energy Agency, Paris, France.
Gilfillan S� M� V�, B� S� Lollar, G� Holland, D� Blagburn, S� Stevens, M� Schoell,
M� Cassidy, Z� Ding, Z� Zhou, G� Lacrampe-Couloume, and C� J� Ballentine
(2009)� Solubility trapping in formation water as dominant CO
2
sink in natural
gas fields. Nature 458, 614 – 618. doi: 10.1038 / nature07852, ISSN: 0028-0836.
Giroux J� (2008)� Turmoil in the Delta: trends and implications. Perspectives on Ter-
rorism 2, 11 – 22.
Global CCS Institute (2011)� The Global Status of CCS: 2011. Global CCS Insti-
tute, Canberra, Australia, 156 pp. Available at: www. globalccsinstitute.
com / resources / publications / global-status-ccs-2011.
GNESD (2010)� Achieving Energy Security in Developing Countries. Global Network
on Energy for Sustainable Development, Roskilde, Denmark.
Goedbloed J� (2011)� Snapping emissions. Hydrocarbon Engineering 16,
39 – 42. Available at: http: / / www. scopus. com / inward / record.url?eid=2-s2.0-
80053340973&partnerID=40&md5=7d24c832f4441ecbcdef020480b05cb5.
Van Goethem T� M� W� J�, L� B� Azevedo, R� van Zelm, F� Hayes, M� R� Ashmore,
and M� A� J� Huijbregts (2013)� Plant Species Sensitivity Distributions for
ozone exposure. Environmental Pollution 178, 1 – 6. Available at: http: / / www.
scopus. com / inward / record.url?eid=2-s2.0-84875208139&partnerID=40&md5
=6d40e84c48fb09ad14a2a8c218f6025f.
Gohlke J�, R� Thomas, A� Woodward, D� Campbell-Lendrum, A� Prüss-Üstün, S�
Hales, and C� Portier (2011)� Estimating the Global Public Health Implications
of Electricity and Coal Consumption. Environmental Health Perspectives 119,
821 – 826. doi: 10.1289 / ehp.1002241.
Goldberg S�, and R� Rosner (2011)� Nuclear Reactors: Generation to Generation.
American Academy of Arts & Sciences, Cambridge, MA.
Goldemberg J�, S� T� Coelho, and P� Guardabassi (2008)� The sustainability of eth-
anol production from sugarcane. Energy Policy 36, 2086 – 2097. doi: 10.1016 / j.
enpol.2008.02.028, ISSN: 0301-4215.
Goldstein B�, G� Hiriart, R� Bertani, C� Bromley, L� Guitiérrez-Negrín, E�
Huenges, and H� Muraoka (2011)� Geothermal Energy. In: IPCC Special
Report on Renewable Energy Sources and Climate Change Mitigation. Prepared
by Working Group III of the Intergovernmental Panel on Climate Change [O.
Edenhofer, R. Pichs-Madruga, Y. Sokona, K. Seyboth, P. Matschoss, S. Kadner,
T. Zwickel, P. Eickemeier, G. Hansen, S. Schlömer, C. von Stechow (eds.)]. Cam-
bridge University Press, Cambridge, United Kingdom and New York, NY, USA.
Goodman A�, A� Hakala, G� Bromhal, D� Deel, T� Rodosta, S� Frailey, M� Small,
D� Allen, V� Romanov, J� Fazio, N� Huerta, D� McIntyre, B� Kutchko, and
G� Guthrie (2011)� U. S. DOE methodology for the development of geologic
storage potential for carbon dioxide at the national and regional scale. Inter-
national Journal of Greenhouse Gas Control 5, 952 – 965. doi: 10.1016 / j.
ijggc.2011.03.010, ISSN: 1750-5836.
Graedel T� E� (2011)� On the Future Availability of the Energy Metals. Annual
Review of Materials Research 41, 323 – 335.
Grainger C� A�, and C� D� Kolstad (2010)� Who Pays a Price on Carbon? Environ-
mental and Resource Economics 46, 359 – 376. Available at: http: / / link.springer.
com / article / 10.1007 / s10640-010-9345-x#page-1.
Green R�, and N� Vasilakos (2011)� The Long-Term Impact of Wind Power on Elec-
tricity Prices and Generating Power. SSRN Scholarly Paper ID 1851311. Avail-
able at: http: / / papers.ssrn.com / abstract=1851311.
Greenberg M� (2013a)� Nuclear Waste Management, Nuclear Power, and Energy
Choices. Public Preferences, Perceptions, and Trust. Springer, London; New York.
ISBN: 9781447142317 1447142314.
Greenberg M� (Ed.) (2013b)� Managing the Nuclear Legacies. Lecture Notes in
Energy. In: Nuclear Waste Management, Nuclear Power, and Energy Choices:
Public Preferences, Perceptions, and Trust. Springer, Berlin, pp. 1 – 14. ISBN:
978 – 1-4471 – 4231 – 7.
Greenblatt J�, J� Long, and B� Hannegan (2012)� California’s Energy
Future — Electricity from Renewable Energy and Fossil Fuels with Carbon Cap-
ture and Sequestration. California Council of Science and Technology. Available
at: http: / / ccst.us / publications / 2012 / 2012ccs.pdf.
Van Grinsven H� J� M�, M� Holland, B� H� Jacobsen, Z� Klimont, M� A� Sutton,
and W� Jaap Willems (2013)� Costs and benefits of nitrogen for europe
and implications for mitigation. Environmental Science and Technology 47,
3571 – 3579. Available at: http: / / www. scopus. com / inward / record.url?eid=2-
s2.0-84876235709&partnerID=40&md5=0354bd4b11466e40b60ab65d7ab
78a00.
Grodsky S� M�, M� J� Behr, A� Gendler A�, D� Drake, B� D� Dieterle, R� J� Rudd, and
N� L� Walrath (2011)� Investigating the causes of death for wind turbine-asso-
ciated bat fatalities. Journal of Mammalogy 92, 917 – 925.
Grubb M�, R� Betz, and K� Neuhoff (Eds.) (2006)� National Allocation Plans in the
EU Emissions Trading Scheme: Lessons and Implications for Phase II. Earthscan,
London.

579579
Energy Systems
7
Chapter 7
Grubb M�, K� Neuhoff, and J� Hourcade (2013)� Planetary Economics: The Three
Domains of Sustainable Energy Development. Earthscan / Taylor & Francis, Lon-
don.
Guilford M� C�, C� A� S� Hall, P� O’Connor, and C� Cleveland A new long term
assessment of energy return on investment (EROI) for U. S. oil and gas discovery
and production. Sustainability 3, 1866 – 1887.
Guivarch C�, and S� Hallegatte (2011)� Existing infrastructure and the 2 °C target.
Climatic Change 109, 801 – 805. doi: 10.1007 / s10584-011-0268-5, ISSN: 0165-
0009 1573 – 1480.
Guruswamy L� (2011)� Energy poverty. Annual Review of Environment and
Resources 36, 139 – 161. doi: 10.1146 / annurev-environ-040610-090118.
Hagen M�, E� Polman, A� Myken, J� Jensen, O� Jönsson, A� Biomil, and
A� Dahl (2001)� Adding Gas from Biomass to the Gas Grid: Contract
No: XVII / 4.1030 / Z / 99 – 412. Available at: http: / / gasunie.eldoc.ub.rug.
nl / root / 2001 / 2044668 / .
Haller M�, S� Ludig, and N� Bauer (2012)� Decarbonization scenarios for the
EU and MENA power system: Considering spatial distribution and short term
dynamics of renewable generation. Energy Policy 47, 282 – 290. doi: 10.1016 / j.
enpol.2012.04.069, ISSN: 0301-4215.
Halsnæs K�, A� Garg, J� Christensen, H� Ystanes Føyn, M� Karavai, E� La Rov-
ere, M� Bramley, X� Zhu, C� Mitchell, J� Roy, K� Tanaka, H� Katayama, C�
Mena, I� Obioh, I� Bashmakov, S� Mwakasonda, M�-K� Lee, M� Vinluan,
Y� J� Huang, and L� Segafredo (2012)� Climate change mitigation policy para-
digms — national objectives and alignments. Mitigation and Adaptation Strate-
gies for Global Change. doi: 10.1007 / s11027-012-9426-y.
Halsnæs K�, P� Shukla, D� Ahuja, G� Akumu, R� Beale, J� Edmonds, C� Gollier, A�
Grubler, M� Ha Duong, A� Markandya, M� McFarland, T� Sugiyama, and
A� Villavicencio (2007)� Framing Issues. In: Climate Change 2007: Mitigation.
Contribution of Working Group III to the Fourth Assessment Report of the Inter-
governmental Panel on Climate change [B. Metz, O. R. Davidson, P. R. Bosch, R.
Dave, L. A. Meyer (eds)]. Cambridge University Press, Cambridge, United King-
dom and New York, NY, USA.
Hanafiah M� M�, M� A� Xenopoulos, S� Pfister, R� S� E� W� Leuven, and M� A� J� Hui-
jbregts (2011)� Characterization Factors for Water Consumption and Green-
house Gas Emissions Based on Freshwater Fish Species Extinction. Environ-
mental Science & Technology 45, 5272 – 5278. doi: 10.1021 / es1039634, ISSN:
0013-936X.
Hasan M� M� F�, I� A� Karimi, and C� M� Avison (2011)� Preliminary synthesis of fuel
gas networks to conserve energy and preserve the environment. Industrial and
Engineering Chemistry Research 50, 7414 – 7427. Available at: http: / / www.
scopus. com / inward / record.url?eid=2-s2.0-79958791351&partnerID=40&md
5=94863df106afcb12e3bcef728dea9ded. Hashmi M�, S� Hänninen, and K�
Mäki (2013)� Developing smart grid concepts, architectures and technological
demonstrations worldwide — A literature survey. International Review of Elec-
trical Engineering 8, 236 – 252.
Hassan A�, and R� Kouhy (2013)� Gas flaring in Nigeria: Analysis of changes and
its consequent carbon emission and reporting. Accounting Forum 37, 124 – 134.
Heinävaara S�, S� Toikkanen, K� Pasanen, P� K� Verkasalo, P� Kurttio, and A�
Auvinen (2010)� Cancer incidence in the vicinity of Finnish nuclear power
plants: An emphasis on childhood leukemia. Cancer Causes and Control 21,
587 – 595. Available at: http: / / www. scopus. com / inward / record.url?eid=2-s2.0-
77953291916&partnerID=40&md5=d5acd53679a23cc72fe40b01ca4b962d.
Held H�, and O� Edenhofer (2009)� CCS-Bonds as a superior instrument to incen-
tivize secure carbon sequestration. Energy Procedia 1, 4559 – 4566.
Heptonstall (2007)� A Review of Electricity Unit Cost Estimates. UK Energy
Research Centre, London, UK.
Hernández J� C�, A� Medina, and F� Jurado (2008)� Impact comparison of PV sys-
tem integration into rural and urban feeders. Energy Conversion and Manage-
ment 49, 1747 – 1765. doi: 10.1016 / j.enconman.2007.10.020, ISSN: 0196-8904.
Hertwich E� G� (2013)� Addressing Biogenic Greenhouse Gas Emissions from
Hydropower in LCA. Environmental Science & Technology 47, 9604 – 9611. doi:
10.1021 / es401820p, ISSN: 0013-936X.
Hertwich E� G�, M� Aaberg, B� Singh, and A� H� Stromman (2008)� Life-cycle
assessment of carbon dioxide capture for enhanced oil recovery. Chinese Jour-
nal of Chemical Engineering 16, 343 – 353. ISSN: 1004-9541.
Hertwich E� G�, E� van der Voet, M� Huijbregts, S� Sangwon, A� Tukker, P�
Kazmierczyk, M� Lenzen, J� McNeely, and Y� Moriguchi (2010)� Environ-
mental Impacts of Consumption and Production: Priority Products and Materi-
als. UNEP, Paris, France.
Herzog H� (2011)� Scaling up carbon dioxide capture and storage: From megatons
to gigatons. Energy Economics 33, 597 – 604. doi: 10.1016 / j.eneco.2010.11.004,
ISSN: 0140-9883.
Herzog H�, K� Smekens, P� Dadhich, J� Dooley, Y� Fujii, O� Hohmeyer, and K�
Riahi (2005)� Cost and economic potential. In: IPCC Special Report on Carbon
Dioxide Capture and Storage. Prepared by Working Group III of the Intergov-
ernmental Panel on Climate Change [Metz, B., O. Davidson, H. C. de Coninck,
M. Loos, and L. A. Meyer (eds.)].Cambridge, UK and New York, NY, USA, pp.
442. Available at: http: / / www. ipcc. ch / publications_and_data / _reports_car-
bon_dioxide.htm.
Von Hippel F�, M� Bunn, A� Diakov, M� Ding, R� Goldston, T� Katsuta, M� V�
Ramana, T� Suzuki, and Y� Suyuan (2012)� Chapter 14 — Nuclear Energy. In:
Global Energy Assessment — Toward a Sustainable Future. Cambridge Univer-
sity Press, Cambridge, pp. 1069 – 1130.
Von Hippel D�, P� Hayes, J� Kang, and T� Katsuta (2011)� Future regional nuclear
fuel cycle cooperation in East Asia: Energy security costs and benefits. Energy
Policy 39, 6867 – 6881. Available at: http: / / www. scopus. com / inward / record.
url?eid=2-s2.0-80054866834&partnerID=40&md5=c1b5a17e2ca785182cd2b
80a2b72a62c.
Hirschberg S�, P� Burgherr, G� Spiekerman, and R� Dones (2004)� Severe acci-
dents in the energy sector: comparative perspective. Journal of Hazardous
Materials 111, 57 – 65.
Hirschberg S�, G� Spiekerman, and R� Dones (1998)� Severe Accidents in the
Energy Sector. Paul Scherrer Institut, Villingen, Switzerland.
Hirth L� (2013)� The Market Value of Variable Renewables: The Effect of Solar-Wind
Power Variability on their Relative Price. Energy Economics 38, 218 – 236. doi:
10.1016 / j.eneco.2013.02.004.
Hiyama A�, C� Nohara, W� Taira, S� Kinjo, M� Iwata, and J� M� Otaki (2013)�
The Fukushima nuclear accident and the pale grass blue butterfly: Evaluating
biological effects of long-term low-dose exposures. BMC Evolutionary Biol-
ogy 13. Available at: http: / / www. scopus. com / record / display.url?eid=2-s2.0-
84881286117&origin=inward&txGid=E22C3BA38F75A3546366A9F10ECC
ACB6.N5T5nM1aaTEF8rE6yKCR3A%3a43.

580580
Energy Systems
7
Chapter 7
Hoenderdaal S�, L� Tercero Espinoza, F� Marscheider-Weidemann, and W�
Graus (2013)� Can a dysprosium shortage threaten green energy technologies?
Energy 49, 344 – 355. Available at: http: / / www. scopus. com / inward / record.
url?eid=2-s2.0-84871722979&partnerID=40&md5=c44b160f41640e6498255
5d578f5ce79.
Hoke A�, and P� Komor (2012)� Maximizing the Benefits of Distributed Photovol-
taics. The Electricity Journal 25, 55 – 67. doi: 10.1016 / j.tej.2012.03.005, ISSN:
1040-6190.
Holttinen H�, P� Meibom, A� Orths, B� Lange, M� O’Malley, J� O� Tande, A�
Estanqueiro, E� Gomez, L� Söder, G� Strbac, J� C� Smith, and F� van Hulle
(2011)� Impacts of large amounts of wind power on design and operation of
power systems, results of IEA collaboration. Wind Energy 14, 179 – 192. doi:
10.1002 / we.410, ISSN: 1099-1824.
Honnery D�, and P� Moriarty (2009)� Estimating global hydrogen production from
wind. International Journal of Hydrogen Energy 34, 727 – 736. doi: 10.1016 / j.
ijhydene.2008.11.001, ISSN: 0360-3199.
Hood C� (2011)� Electricity Market Design for Decarbonisation. IEA / OECD, Paris,
France, 15 – 20 pp.
Hoogwijk M�, D� van Vuuren, B� de Vries, and W� Turkenburg (2007)� Exploring
the impact on cost and electricity production of high penetration levels of inter-
mittent electricity in OECD Europe and the USA, results for wind energy. Energy
32, 1381 – 1402. doi: 16 / j.energy.2006.09.004, ISSN: 0360-5442.
Höök M�, R� Hirsch, and K� Aleklett (2009)� Giant oil field decline rates and their
influence on world oil production. Energy Policy 37, 2262 – 2272. doi: 10.1016 / j.
enpol.2009.02.020, ISSN: 0301-4215.
Hotelling H� (1931)� The Economics of Exhaustible Resources. Journal of Political
Economy 39, 137 – 175.
Hourcade J� C�, D� Demailly, K� Neuhoff, and S� Sato (2007)� Differentiation and
Dynamics of EU ETS Industrial Competitiveness, Climate Strategies. Climate
Strategies Report. Climate Strategies, London, UK. Available at: http: / / www.
climatestrategies. org / component / reports / category / 17 / 37.html.
Hovorka S� D�, S� M� Benson, C� Doughty, B� M� Freifeld, S� Sakurai, T� M� Daley,
Y� K� Kharaka, M� H� Holtz, R� C� Trautz, H� S� Nance, L� R� Myer, and K� G�
Knauss (2006)� Measuring permanence of CO
2
storage in saline forma-
tions: the Frio experiment. Environmental Geosciences 13, 105 – 121. doi:
10.1306 / eg.11210505011.
Howarth R�, R� Santoro, and A� Ingraffea (2011)� Methane and the Greenhouse-
gas Footprint of Natural Gas from Shale Formations. Climate Change 106,
679 – 690. doi: 10.1007 / s10584-011-0061-5.
Hsu D�, P� O’Donoughue, V� Fthenakis, G� Heath, H�-C� Kim, P� Sawyer, J�-K�
Choi, and D� Turney (2012)� Life Cycle Greenhouse Gas Emissions of Crys-
talline Silicon Photovoltaic Electricity Generation. Journal of Industrial Ecology
Special Issue: Meta-Analysis of Life Cycle Assessments, S122 – S135.
Huh D�-G�, Y�-C� Park, D�-G� Yoo, and S�-H� Hwang (2011)� CO
2
Geological storage
potential in Korea. Energy Procedia 4, 4881 – 4888.
Hultman N�, S� Pulver, L� Guimaraes, R� Deshmukh, and J� Kane (2012)� Car-
bon market risks and rewards: Firm perceptions of CDM investment decisions in
Brazil and India. Energy Policy 40, 90 – 102.
Hutton G�, E� Rehfuess, and F� Tediosi (2007)� Evaluation of the Costs and Ben-
efits of Interventions to Reduce Indoor Air Pollution. Energy for Sustainable
Development 11, 34 – 43.
Huva R�, R� Dargaville, and S� Caine (2012)� Prototype large-scale renewable
energy system optimisation for Victoria, Australia. Energy 41, 326 – 334. doi:
10.1016 / j.energy.2012.03.009, ISSN: 0360-5442.
Hwang S�, Y� Cao, and J� Xi (2011)� The short-term impact of involuntary migration
in China’s Three Gorges: a prospective study. Soc. Indc. Res. 101, 73 – 92.
IAEA (2004)� Status of Advanced Light Water Reactor Designs. International
Atomic Energy Agency, Vienna, Austria. Available at: http: / / www-pub. iaea.
org / MTCD / publications / PDF / te_1391_web.pdf.
IAEA (2005a)� Innovative Small and Medium Sized Reactors: Design Features,
Safety Approaches and R&D Trends. International Atomic Energy Agency,
Vienna, Austria.
IAEA (2005b)� Thorium Fuel Cycle — Potential Benefits and Challenges. Interna-
tional Atomic Energy Agency, Vienna, Austria.
IAEA (2006)� Advanced Nuclear Plant Design Options to Cope with External Events.
International Atomic Energy Agency (IAEA), Vienna, Austria.
IAEA (2008a)� Spent Fuel Reprocessing Options. International Atomic Energy
Agency, Vienna, Austria.
IAEA (2008b)� Financing of New Nuclear Power Plants. Technical Report. IAEA,
Vienna, Austria.
IAEA (2009)� Classification of Radioactive Waste — General Safety Guide. Interna-
tional Atomic Energy Agency, Vienna, Austria.
IAEA (2012a)� Nuclear Power Reactors in the World 2012 Edition. International
Atomic Energy Agency (IAEA), Vienna, Austria.
IAEA (2012b)� Climate Change and Nuclear Power 2012. International Atomic
Energy Agency, Vienna, Austria.
IAEA (2013a)� The Power Reactor Information System (PRIS) and Its Extension
to Non-Electrical Applications, Decommissioning and Delayed Projects Infor-
mation. International Atomic Energy Agency, Vienna, Austria. Available at:
http: / / www. iaea. org / PRIS / WorldStatistics / OperationalReactorsByCountry.
aspx.
IAEA (2013b)� Energy, Electricity and Nuclear Power Estimate for the Period up to
2050. International Atomic Energy Agency, Vienna, Austria.
IEA (2003a)� World Energy Investment Outlook 2003. International Energy
Agency. OECD, Paris, France. Available at: http: / / www. worldenergyoutlook.
org / media / weowebsite / 2008-1994 / weo2003.pdf.
IEA (2003b)� The Power to Choose. Demand Response in Liberalised Electricity Mar-
kets. International Energy Agency, Paris, France.
IEA (2005)� Projected Costs of Generating Electricity. International Energy Agency.
OECD, Paris, France.
IEA (2006)� Hydrogen Production and Storage: R&D Priorities and Gaps. Inter-
national Energy Agency, Paris. Available at: http: / / www. iea. org / publica-
tions / freepublications / publication / hydrogen.pdf.
IEA (2007)� Renewables in Global Energy Supply: An IEA Fact Sheet. International
Energy Agency. OECD, Paris, France.
IEA (2008a)� World Energy Outlook 2008. International Energy Agency, Paris,
France.
IEA (2008b)� Deploying Renewable Energies: Principles for Effective Policies. Inter-
national Energy Agency. OECD, Paris, France.
IEA (2008c)� Energy Technology Perspectives 2008: Scenarios and Strategies to
2050. International Energy Agency, Paris, France.
IEA (2009a)� Coal Mine Methane in Russia — Capturing the Safety and Environ-
mental Benefits. International Energy Agency, Paris, France.

581581
Energy Systems
7
Chapter 7
IEA (2009b)� Prospects for Large-Scale Energy Storage in Decarbonised Power
Grids. IEA, Paris, France.
IEA (2009c)� World Energy Outlook 2009. International Energy Agency. OECD, Paris,
France.
IEA (2010a)� Energy Balances of Non-OECD Countries. International Energy Agency,
Paris, France, 554 pp.
IEA (2010b)� Projected Costs of Generating Electricity — 2010 Edition. International
Energy Agency, Paris, France.
IEA (2010c)� Energy Technology Perspectives 2010: Scenarios and Strategies to
2050. International Energy Agency, Paris, France.
IEA (2010d)� Technology Roadmap Solar Photovoltaic Energy. International Energy
Agency, Paris, France.
IEA (2010e)� World Energy Outlook 2010. International Energy Agency, Paris,
France. Available at: http: / / www. worldenergyoutlook. org / media / weo2010.pdf.
IEA (2010f)� Reviewing Existing and Proposed Emissions Trading Systems.
IEA / OECD, Paris, France.
IEA (2010g)� Carbon Capture and Storage Legal and Regulatory Review: Edition 1.
International Energy Agency, Paris, France, 66 pp.
IEA (2011a)� World Energy Outlook 2011. International Energy Agency, Paris,
France.
IEA (2011b)� Deploying Renewables 2011: Best and Future Policy Practice.
OECD / IEA, Paris, France.
IEA (2011c)� Combining Bioenergy with CCS. Reporting and Accounting for Nega-
tive Emissions under UNFCCC and the Kyoto Protocol. OECD / IEA, Paris, France.
IEA (2011d)� Harnessing Variable Renewables: A Guide to the Balancing Challenge.
International Energy Agency, Paris, France.
IEA (2011e)� Technology Roadmap. Smart Grids. International Energy Agency, Paris,
France.
IEA (2011f)� Summing up the Parts. Combining Policy Instruments for Least-Cost
Climate Mitigation Strategies. IEA, OECD, Paris, France.
IEA (2011g)� Energy Technology Perspectives 2010. Scenarios & Strategies to 2050.
IEA / OECD, Paris, France.
IEA (2012a)� Energy Balances of Non-OECD Countries. International Energy Agency,
Paris, France, 538 pp.
IEA (2012b)� World Energy Outlook 2012. IEA / OECD, Paris, France.
IEA (2012c)� A Policy Strategy for Carbon Capture and Storage. IEA / OECD, Paris,
France.
IEA (2012d)� Renewables Information 2012. IEA / OECD, Paris, France.
IEA (2012e)� Electricity Information 2012. IEA / OECD, Paris, France.
IEA (2012f)� CO
2
Emission from Fuel Combustion. International Energy Agency.
OECD, Paris, France.
IEA (2012g)� CO
2
Emissions from Fuel Combustion. Beyond 2020 Online Database.
IEA, Paris, France. Available at: http: / / data.iea.org.
IEA (2012h)� Energy Technology Perspectives 2012: Pathways to a Clean Energy
Systems. International Energy Agency, Paris, France.
IEA (2012i)� Golden Rules for a Golden Age of Gas. International Energy Agency,
Paris, France,
IEA (2012j)� Tracking Clean Energy Progress. Energy Technology Perspectives 2012
Excerpt as IEA Input to the Clean Energy Ministerial. Paris, France.
IEA (2013a)� CO
2
Emissions from Fuel Combustion. Organisation for Economic Co-
operation and Development / International Energy Agency, Paris, France, 546 pp.
ISBN: 978-92-64-17475-7.
IEA (2013b)� World Energy Outlook. OECD / IEA, Paris, France.
IEA (2013c)� Redrawing the Energy-Climate Map. International Energy Agency,
Paris, France. Available at: http: / / www. iea. org / publications / freepublica-
tions / publication / RedrawingEnergyClimateMap_2506.pdf.
IEA Bioenergy (2006)� Biogas Upgrading to Vehicle Fuel Standards and Grid
Injection. IEA Bioenergy Task 37. Available at: http: / / www. iea-biogas.
net / files / daten-redaktion / download / publi-task37 / upgrading_report_final.pdf.
IEA Bioenergy (2009)� Biogas Upgrading Technologies-Developments and
Innovations. IEA Bioenergy Task 37. Available at: http: / / www. iea-biogas.
net / files / daten-redaktion / download / publi-task37 / upgrading_rz_low_final.pdf.
IEA Bioenergy (2011)� IEA Biogas Task 37 Country Reports and Plant Lists. IEA Bio-
energy Task 37. Available at: http: / / www. iea-biogas. net / country-reports.html.
IEAGHG (2010)� Environmental Evaluation of CCS Using Life Cycle Assessment
(LCA). IEA Greenhouse Gas R&D Programme, Cheltenham, UK.
IEAGHG (2011)� Potentials for Biomass and Carbon Dioxide Capture and Stor-
age. IEA Greenhouse Gas R&D Programme, Cheltenham, UK. Available at:
http: / / www. eenews. net / assets / 2011 / 08 / 04 / document_cw_01.pdf.
ILO and EU (2011)� Skills and Occupational Needs in Renewable Energy (2011).
International Labor Organization and European Union, Geneva.
IMF (2013)� Energy Subsidy Reform: Lessons and Implications. IMF, International
Monetary Fund, Washington DC.
IPCC (2005)� IPCC Special Report on Carbon Dioxide Capture and Storage. Prepared
by Working Group III of the Intergovernmental Panel on Climate Change [Metz,
B., O. Davidson, H. C. de Coninck, M. Loos, and L. A. Meyer (eds.)].Cambridge, UK
and New York, NY, USA, pp. 442.
IPCC (2007)� Climate Change 2007: Mitigation of Climate Change. Contribution
of Working Group III to the Fourth Assessment Report of the Intergovern-
mental Panel on Climate Change [B. Metz, O. R. Davidson, P. R. Bosch, R. Dave,
L. A. Meyer (eds)]. Cambridge University Press, Cambridge, UK, 851 pp. ISBN:
9780521880114.
IPCC (2008)� Climate Change and Water Technical Paper of the Intergovernmental
Panel on Climate Change [Bates B. C., Z. W. Kundewicz, S. Wu, and J. P. Palutikof
(eds.)]. IPCC Secretariat, Geneva, Switzerland, 210 pp.
IPCC (2011a)� IPCC Special Report on Renewable Energy Sources and Climate
Change Mitigation. Prepared by Working Group III of the Intergovernmen-
tal Panel on Climate Change [O. Edenhofer, R. Pichs-Madruga, Y. Sokona,
K. Seyboth, P. Matschoss, S. Kadner, T. Zwickel, P. Eickemeier, G. Hansen, S.
Schlömer, C. von Stechow (eds.)]. Cambridge University Press, Cambridge,
United Kingdom and New York, NY, USA, 1075 pp.
IPCC (2011b)� Summary for Policymakers. In: IPCC Special Report on Renewable
Energy Sources and Climate Change Mitigation. Prepared by Working Group
III of the Intergovernmental Panel on Climate Change [O. Edenhofer, R. Pichs-
Madruga, Y. Sokona, K. Seyboth, P. Matschoss, S. Kadner, T. Zwickel, P. Eick-
emeier, G. Hansen, S. Schlömer, C. von Stechow (eds.)]. Cambridge University
Press, Cambridge, United Kingdom and New York, NY, USA.
IPIECA, and API (2007)� Oil and Natural Gas Industry Guidelines for Greenhouse
Gas Reduction Projects. Part II: Carbon Capture and Geological Storage Emis-
sions Reduction Family. International Petroleum Industry Environmental Con-
servation Association and American Petroleum Institute, Washington, DC.
IPIECA, and API (2009)� Oil and Natural Gas Industry Guidelines for Greenhouse
Gas Reduction Projects. Part III: Flare Reduction Project Family. International
Petroleum Industry Environmental Conservation Association and American
Petroleum Institute, Washington, DC.

582582
Energy Systems
7
Chapter 7
IRENA (2012a)� Financial Mechanisms and Investment Frameworks for Renew-
ables in Developing Countries. International Renewable Energy Agency, Abu
Dhabi. Available at: http: / / www. irena. org / DocumentDownloads / Publica-
tions / IRENA%20report%20-%20Financial%20Mechanisms%20for%20Devel-
oping%20Countries.pdf.
IRENA (2012b)� IRENA Handbook on Renewable Energy Nationally Appropriate
Mitigation Actions (NAMAs) for Policy Makers and Project Developers. Inter-
national Renewable Energy Agency, Abu Dhabi. Available at: http: / / www. irena.
org / DocumentDownloads / Publications / Handbook_RE_NAMAs.pdf.
IRENA (2012c)� Renewable Energy Jobs & Access. International Renewable Energy
Agency. Available at: http: / / www. irena. org / DocumentDownloads / Publica-
tions / Renewable_Energy_Jobs_and_Access.pdf.
IRENA (2012d)� Capacity Building Strategic Framework for IRENA (2012- 2015).
International Renewable Energy Agency, Abu Dhabi.
IRENA (2013)� Renewable Power Generation Costs in 2012: An Overview. Interna-
tional Renewable Energy Agency, Abu Dhabi. Available at: https: / / www. irena.
org / DocumentDownloads / Publications / Overview_Renewable%20Power%20
Generation%20Costs%20in%202012.pdf.
Isaac M�, and D� van Vuuren (2009)� Modeling global residential sector energy
demand for heating and air conditioning in the context of climate change.
Energy Policy 37, 507 – 521.
Ito K�, S� De Leon, and M� Lippmann (2005)� Associations between ozone and
daily mortality: analysis and meta-analysis. Epidemiology 16, 446 – 457.
Jaccard M�, and N� Rivers (2007)� Heterogeneous capital stocks and the optimal
timing for CO
2
abatement. Resource and Energy Economics 29, 1 – 16. doi:
10.1016 / j.reseneeco.2006.03.002, ISSN: 09287655.
Jackson R� B�, A� Vengosh, T� H� Darrah, N� R� Warner, A� Down, R� J� Poreda, S� G�
Osborn, K� Zhao, and J� D� Karr (2013)� Increased stray gas abundance in a
subset of drinking water wells near Marcellus shale gas extraction. Proceed-
ings of the National Academy of Sciences of the United States of America 110,
11250 – 11255. Available at: http: / / www. scopus. com / inward / record.url?eid=2-
s2.0-84879916912&partnerID=40&md5=a5154dc6ba25d9463acf06c3f9b65
c9b.
Jacobsen H� K�, and S� T� Schröder (2012)� Curtailment of renewable generation:
Economic optimality and incentives. Energy Policy 49, 663 – 675.
Jacobson M� Z�, and C� L� Archer (2012)� Saturation wind power potential and
its implications for wind energy. Proceedings of the National Academy of Sci-
ences 109, 15679 – 15684. doi: 10.1073 / pnas.1208993109, ISSN: 0027-8424,
1091 – 6490.
Jacobson M� Z�, and M� A� Delucchi (2011)� Providing all global energy with wind,
water, and solar power, Part I: Technologies, energy resources, quantities and
areas of infrastructure, and materials. Energy Policy 39, 1154 – 1169. doi: 16 / j.
enpol.2010.11.040, ISSN: 0301-4215.
Jagger N�, T� Foxon, and A� Gouldson (2013)� Skills constraints and the low car-
bon transition. Climate Policy 13. doi: 10.1080 / 14693062.2012.709079.
Jain G� (2010)� Energy security issues at household level in India. Energy Policy 38,
2835 – 2845.
Jain A� A�, R� R� Koford, A� W� Hancock, and G� G� Zenner (2011)� Bat mortality
and activity at a Northern Iowa wind resource area. American Midland Natural-
ist 165, 185 – 200.
Jakob M�, and J� C� Steckel (2013)� Why mitigation could harm developing coun-
tries. WIREs Climate Change.
Jaramillo P�, W� M� Griffin, and H� S� Matthews (2007)� Comparative Life-Cycle
Air Emissions of Coal, Domestic Natural Gas, LNG, and SNG for Electricity Gen-
eration. Environmental Science and Technology 42.
Jernelöv A� (2010)� The threats from oil spills: Now, then, and in the future. Ambio
39, 353 – 266.
Jerrett M�, R� T� Burnett, C� A� Pope, K� Ito, G� Thurston, D� Krewski, Y� Shi, E�
Calle, and M� Thun (2009)� Long-Term Ozone Exposure and Mortality. New
England Journal of Medicine 360, 1085 – 1095. doi: 10.1056 / NEJMoa0803894,
ISSN: 0028-4793.
Jewell J� (2011a)� Ready for Nuclear Energy? an Assessment of Capacities and
Motivations for Launching New National Nuclear Power Programs. Energy Pol-
icy 39, 1041 – 1055. doi: 10.1016 / j.enpol.2010.10.041.
Jewell J� (2011b)� The IEA Model of Short-Term Energy Security (MOSES).
OECD / IEA, Paris, France.
Jewell J�, A� Cherp, and K� Riahi (2014)� Energy security under de-carbonization
scenarios: An assessment framework and evaluation under different technology
and policy choices. Energy Policy 65, 743 – 760.
Ji M�, D� S� Cohan, and M� L� Bell (2011)� Meta-analysis of the association between
short-term exposure to ambient ozone and respiratory hospital admissions.
Environmental Research Letters 6, 21779304.
Johnson M� R�, and A� R� Coderre (2011)� An analysis of flaring and venting activ-
ity in the Alberta upstream oil and gas industry. Journal of the Air and Waste
Management Association 61, 190 – 200. Available at: http: / / www. scopus.
com / inward / record.url?eid=2-s2.0-79952923425&partnerID=40&md5=15740
cb2aa7c50701a34c94363c7bb42.
Johnson T� L�, and D� W� Keith (2004)� Fossil Electricity and CO
2
Sequestration: How
Natural Gas Prices, Initial Conditions and Retrofits Determine the Cost of Con-
trolling CO
2
Emissions. Energy Policy 32, 367 – 382.
Johnson N�, and J� Ogden (2011)� Detailed spatial modeling of carbon capture
and storage (CCS) infrastructure deployment in the southwestern United States.
Energy Procedia 4, 2693 – 2699. doi: 10.1016 / j.egypro.2011.02.170, ISSN:
1876-6102.
Jordaan S� M� (2012)� Land and water impacts of oil sands production in
Alberta. Environmental Science and Technology 46, 3611 – 3617. Available at:
http: / / www. scopus. com / inward / record.url?eid=2-s2.0-84859363548&partnerI
D=40&md5=e1afa2d7969972e3d1b0da443abac80f.
Jordaan S� M�, D� W� Keith, and B� Stelfox (2009)� Quantifying land use of oil
sands production: a life cycle perspective. Environmental Research Letters 4,
024004.
Jordan P�, and S� Benson (2009)� Well blowout rates and consequences in Cali-
fornia Oil and Gas District 4 from 1991 to 2005: implications for geologi-
cal storage of carbon dioxide. Environmental Geology 57, 1103 – 1123. doi:
10.1007 / s00254-008-1403-0, ISSN: 0943-0105.
Joskow P� L� (2011)� Comparing the Costs of Intermittent and Dispatchable Electric-
ity Generating Technologies. American Economic Review: Papers & Proceedings
100, 238 – 241.
Joskow P�, and E� Parsons (2012)� The Future of Nuclear Power After Fukushima.
Economics of Energy & Environmental Policy 1, 99 – 113.
Joung M�, and J� Kim (2013)� Assessing demand response and smart metering
impacts on long-term electricity market prices and system reliability. Applied
Energy 101, 441 – 448.

583583
Energy Systems
7
Chapter 7
JRC / PBL (2013)� Emission Database for Global Atmospheric Research (EDGAR),
Release Version 4.2 FT2010. European Commission, Joint Research Cen-
tre (JRC) / PBL Netherlands Environmental Assessment Agency. Available at:
http: / / edgar.jrc.ec.europa.eu.
Juanes R�, B� H� Hager, and H� J� Herzog (2012)� No geologic evidence that seis-
micity causes fault leakage that would render large-scale carbon capture and
storage unsuccessful. Proceedings of the National Academy of Sciences 109.
doi: 1073 / pnas.1215026109.
Juanes R�, C� MacMinn, and M� Szulczewski (2010)� The Footprint of the CO
2
Plume during Carbon Dioxide Storage in Saline Aquifers: Storage Efficiency for
Capillary Trapping at the Basin Scale. Transport in Porous Media 82, 19 – 30. doi:
10.1007 / s11242-009-9420-3, ISSN: 0169-3913.
Junginger M�, A� Faaij, and W� Turkenburg (2005)� Globale xperience curves for
wind farms. Energy Policy 33, 133 – 150.
Junginger M�, W� van Sark, and A� Faaij (Eds.) (2010)� Technological Learning
in the Energy Sector — Lessons for Policy, Industry and Science. Edward Elgar,
Cheltenham, UK.
Kaatsch P�, C� Spix, R� Schulze-Rath, S� Schmiedel, and M� Blettner (2008)�
Leukaemia in young children living in the vicinity of German nuclear power
plants. International Journal of Cancer 122, 721 – 726. Available at: http: / / www.
scopus. com / inward / record.url?eid=2-s2.0-38349023141&partnerID=40&md5
=04cff46a59fa295b31a181027e55f7db.
Kahrl F�, J� Williams, D� Jianhua, and H� Junfeng (2011)� Challenges to China’s
transition to a low carbon electricity system. Energy Policy 39, 4032 – 4041.
Kainuma M�, K� Miwa, T� Ehara, O� Akashi, and Y� Asayama (2013)� A low carbon
society: global visions, pathways, and challenges. Climate Policy 13, 5 – 21. doi:
http: / / dx.doi.org / 10.1080 / 14693062.2012.738016.
Kaiser M� J�, Y� Yu, and C� J� J� Jablonowski (2009)� Modeling lost production
from destroyed platforms in the 2004 – 2005 Gulf of Mexico hurricane seasons.
Energy 34, 1156 – 1171.
Kalkuhl M�, and O� Edenhofer (2013)� Managing the climate rent: How can regu-
lators implement intertemporally efficient mitigation policies? Natural Resource
Modelling Early View. doi: dx.doi.org / 10.1111 / nrm.12018.
Kalkuhl M�, O� Edenhofer, and K� Lessman (2013)� Renewable Energy Subsidies:
Second-best Policy or Fatal Aberration for Mitigation? Resource and Energy
Economics 35, 217 – 234. doi: dx.doi.org / 10.1016 / j.reseneeco.2013.01.002.
Kalkuhl M�, O� Edenhofer, and K� Lessmann (2012)� Learning or Lock-in: Optimal
Technology Policies to Support Mitigation. Resource and Energy Economics 34,
1 – 23. doi: dx.doi.org / 10.1016 / j.reseneeco.2011.08.001.
Kanagawa M�, and T� Nakata (2008)� Assessment of Access to Electricity and the
Socio-Economic Impacts in Rural Areas of Developing Countries. Energy Policy
36, 2016 – 2029. doi: 10.1016 / j.enpol.2008.01.041.
Kanakasabapathy P� (2013)� Economic impact of pumped storage power plant on
social welfare of electricity market. International Journal of Electric Power &
Energy Systems 45, 187 – 193.
Karacan C� Ö�, F� A� Ruiz, M� Cotè, and S� Phipps (2011)� Coal mine methane:
A review of capture and utilization practices with benefits to mining safety
and to greenhouse gas reduction. International Journal of Coal Geology 86,
121 – 156. Available at: http: / / www. scopus. com / inward / record.url?eid=2-s2.0-
79954570672&partnerID=40&md5=c0284b08d84df709d09a301b303458d1.
Karakurt I�, G� Aydin, and K� Aydiner (2011)� Mine ventilation air methane as
a sustainable energy source. Renewable and Sustainable Energy Reviews 15,
1042 – 1049. Available at: http: / / www. scopus. com / inward / record.url?eid=2-
s2.0-78649965532&partnerID=40&md5=ce8c461e22c6740d2b968a9
c6e720126.
Kargbo D� M�, R� G� Wilhelm, and D� J� Campbell (2010)� Natural gas plays in the
Marcellus Shale: challenges and potential opportunities. Environmental Science
& Technology 44, 5679 – 5684.
Karl T�, J� Melillo, and T� Peterson (Eds.) (2009)� Global Climate Change Impacts
in the United States. Cambridge University Press, Cambridge, UK, 188 pp.
Keane A�, M� Milligan, C� J� Dent, B� Hasche, C� D’Annunzio, K� Dragoon,
H� Holttinen, N� Samaan, L� Soder, and M� O’Malley (2011)� Capacity
Value of Wind Power. IEEE Transactions on Power Systems 26, 564 – 572. doi:
10.1109 / TPWRS.2010.2062543, ISSN: 0885-8950.
Keats K�, and K� Neuhoff (2005)� Allocation of carbon emissions certificates in the
power sector: How generators profit from grandfathered rights. Climate Policy
5, 61 – 78.
Kelly K� A�, M� C� McManus, and G� P� Hammond (2012)� An energy and carbon
life cycle assessment of tidal power case study: The proposed Cardiff-Weston
severn barrage scheme. Energy 44, 692 – 701. Available at: http: / / www. scopus.
com / inward / record.url?eid=2-s2.0-84864373242&partnerID=40&md5=87f55
0eefe7f8c19c75440d5fec8d54b.
Kemenes A�, B� R� Forsberg, and J� M� Melack (2007)� Methane release below
a tropical hydroelectric dam. Geophysical Research Letters 34, L12809. doi:
10.1029 / 2007GL029479.
Kemenes A�, B� R� Forsberg, and J� M� Melack (2011)� CO
2
emissions from a tropi-
cal hydroelectric reservoir (Balbina, Brazil). Journal of Geophysical Research
116. doi: 10.1029 / 2010JG001465.
Kenley C� R�, R� D� Klingler, C� M� Plowman, R� Soto, R� J� Turk, and R� L� Baker
(2009)� Job creation due to nuclear power resurgence in the United States.
Energy Policy 37, 4894 – 4900.
Keppler J� H�, and M� Cruciani (2010)� Rents in the European power sector due to
carbon trading. Energy Policy 38, 4280 – 4290.
Kesicki F�, and P� Ekins (2011)� Marginal abatement cost curves: a call for caution.
Climate Policy, 1 – 18. doi: 10.1080 / 14693062.2011.582347, ISSN: 1469-3062.
Kessides I� (2012)� The future of the nuclear industry reconsidered: Risks, uncer-
tainties, and continued promise. Energy Policy 48, 185 – 208. doi: http: / / dx.doi.
org / 10.1016 / j.enpol.2012.05.008.
Kettner C�, A� Köppl, S� Schleicher, and G� Thenius (2008)� Stringency and dis-
tribution in the EU Emissions Trading Scheme: First Evidence. Climate Policy 8,
41 – 61.
Ketzer J� M�, R� Iglesias, and S� Einloft (2011)� Reducing greenhouse gas emis-
sions with CO
2
capture and geological storage. In: Handbook of Climate Change
Mitigation. C. Wei-Yin, J. Seiner, T. Suzuki, M. Lackner, (eds.).
Khennas S� (2012)� Understanding the Political Economy and Key drivers of Energy
Access in Addressing National Energy access Priorities and Policies: African Per-
spective. Energy Policy 47, 21 – 26.
Kheshgi H�, S� J� Smith, and J� Edmonds (2005)� Emissions and Atmospheric CO
2
Stabilization: Long-term Limits and Paths,” Mitigation and Adaptation Strate-
gies for Global Change. Climate Change and Environmental Policy 10, 213 – 220.
Kim H�-G� (2009)� The Design Characteristics of Advanced Power Reactor 1400.
International Atomic Energy Agency, Vienna, Austria.

584584
Energy Systems
7
Chapter 7
Kim H� C�, V� Fthenakis, J�-K� Choi, and D� E� Turney (2012)� Life Cycle Green-
house Gas Emissions of Thin-film Photovoltaic Electricity Generation. Journal
of Industrial Ecology 16, S110 – S121. doi: 10.1111 / j.1530-9290.2011.00423.x,
ISSN: 1530-9290.
Kim Y�, M� Kim, and W� Kim (2013)� Effect of the Fukushima nuclear disaster on
global public acceptance of nuclear energy. Energy Policy 61, 822 – 828.
Kleijn R�, and E� van der Voet (2010)� Resource constraints in a hydrogen econ-
omy based on renewable energy sources: An exploration. Renewable and Sus-
tainable Energy Reviews 14, 2784 – 2795.
Kleijn R�, E� van der Voet, G� J� Kramer, L� van Oers, and C� van der Giesen
(2011)� Metal requirements of low-carbon power generation. Energy 36,
5640 – 5648. Available at: http: / / www. scopus. com / inward / record.url?eid=2-
s2.0-80052101512&partnerID=40&md5=bdafd633a6bf530fc0e3826269e6c
7bc.
Klessmann C�, M� Rathmann, D� de Jager, A� Gazzo, G� Resch, S� Busch, and M�
Ragwitz (2013)� Policy options for reducing the costs of reaching the Euro-
pean renewables target. Renewable Energy 57, 390 – 403.
Knapp S� R� (1969)� Pumped storage: the handmaiden of nuclear power. IEEE Spec-
trum 6, 46 – 52.
Koerblein A�, and I� Fairlie (2012)� French geocap study confirms increased leuke-
mia risks in young children near nuclear power plants. International Journal of
Cancer 131, 2970 – 2971. Available at: http: / / www. scopus. com / inward / record.
url?eid=2-s2.0-84867870370&partnerID=40&md5=a725f442c15d4bc59da22
03f3b029cea.
Kontovas C� A�, H� N� Psaraftis, and N� P� Ventikos (2010)� An empirical analysis
of IOPCF oil spill cost data. Marine Pollution Bulletin 60, 1455 – 1466.
Koornneef J�, T� van Keulen, A� Faaij, and W� Turkenburg (2008)� Life cycle
assessment of a pulverized coal power plant with post-combustion capture,
transport and storage of CO
2
. International Journal of Greenhouse Gas Control
2, 448 – 467.
Koornneef J�, A� Ramirez, Turkenburg W�, and A� Faaij (2011)� The environmen-
tal impact and risk assessment of CO
2
capture, transport and storage.An evalu-
ation of the knowledge base. Progress in Energy and Combustion Science. doi:
10.1016 / j.pecs.2011.05.002.
Koornneef J�, M� Spruijt, M� Molag, A� Ramirez, W� Turkenburg, and A� Faaij
(2010)� Quantitative risk assessment of CO
2
transport by pipelines; a review
of uncertainties and their impacts. Journal of Hazardous Materials 177, 12 – 27.
doi: 10.1016 / j.jhazmat.2009.11.068, ISSN: 0304-3894.
Kopp A�, H� Class, and R� Helmig (2009)� Investigations on CO
2
storage capac-
ity in saline aquifers—Part 2: Estimation of storage capacity coefficients.
International Journal of Greenhouse Gas Control 3, 277 – 287. doi: 10.1016 / j.
ijggc.2008.10.001, ISSN: 1750-5836.
Kopytko N�, and J� Perkins (2011)� Climate change, nuclear power, and the
adaptation-mitigation dilemma. Energy Policy 39, 318 – 333. doi: 10.1016 / j.
enpol.2010.09.046, ISSN: 0301-4215.
Korre A�, Z� Nie, and S� Durucan (2010)� Life cycle modelling of fossil fuel power
generation with post-combustion CO
2
capture. International Journal of Green-
house Gas Control 4, 289 – 300. doi: 10.1016 / j.ijggc.2009.08.005, ISSN: 1750-
5836.
Krevor S� C� M�, R� Pini, L� Zuo, and S� M� Benson (2012)� Relative permeability
and trapping of CO
2
and water in sandstone rocks at reservoir conditions. Water
Resources 48. doi: 10.1029 / 2011WR010859.
Krey V�, and K� Riahi (2009)� Implications of delayed participation and technology
failure for the feasibility, costs, and likelihood of staying below temperature
targets-greenhouse gas mitigation scenarios for the 21st century. Energy Eco-
nomics 31, 94 – 106. doi: 10.1016 / j.eneco.2009.10.013, ISSN: 0140-9883.
Kriegler E�, M� Tavoni, T� Aboumahboub, G� Luderer, K� Calvin, G� DeMaere, V�
Krey, K� Riahi, H� Rosler, M� Schaeffer, and D� van Vuuren (2013)� Can we
still meet 2 °C with global climate action? The LIMITS study on implications of
Durban Action Platform scenarios. Climate Change Economics.
Kruyt B�, D� P� van Vuuren, H� J� M� de Vries, and H� Groenenberg (2009)� Indica-
tors for energy security. Energy Policy 37, 2166 – 2181.
Kudryavtsev V�, N� Spooner, J� Gluyas, C� Fung, and M� Coleman (2012)� Moni-
toring subsurface CO
2
emplacement and security of storage using muon tomog-
raphy. International Journal of Greenhouse Gas Control 11, 21 – 24. Available
at: http: / / www. sciencedirect. com / science / article / pii / S1750583612001806.
Kuik O� J�, M� Bastos-Lima, and J� Gupta (2011)� Energy Security in a Developing
World. Climate Change 2, 627 – 634. doi: 10.1002 / wcc.118.
Kumar A�, T� Schei, A� Ahenkorah, R� Caceras Rodriguez, J�-M� Devernay, M�
Freitas, and D� Hall (2011)� Hydropower. In: IPCC Special Report on Renew-
able Energy Sources and Climate Change Mitigation. Prepared by Working
Group III of the Intergovernmental Panel on Climate Change [O. Edenhofer, R.
Pichs-Madruga, Y. Sokona, K. Seyboth, P. Matschoss, S. Kadner, T. Zwickel, P. Eick-
emeier, G. Hansen, S. Schlömer, C. von Stechow (eds.)]. Cambridge University
Press, Cambridge, United Kingdom and New York, NY, USA, 1075 pp.
Kunz M� J�, A� Wüest, B� Wehrli, J� Landert, and D� B� Senn (2011)� Impact of a
large tropical reservoir on riverine transport of sediment, carbon, and nutri-
ents to downstream wetlands. Water Resources Research 47. Available at:
http: / / www. scopus. com / record / display.url?eid=2-s2.0-84855396744&ori
gin=inward&txGid=E22C3BA38F75A3546366A9F10ECCACB6.
N5T5nM1aaTEF8rE6yKCR3A%3a57.
Laleman R�, J� Albrecht, and J� Dewulf (2011)� Life Cycle Analysis to estimate the
environmental impact of residential photovoltaic systems in regions with a low
solar irradiation. Renewable and Sustainable Energy Reviews 15, 267 – 281. doi:
10.1016 / j.rser.2010.09.025, ISSN: 13640321.
Lambrou Y�, and G� Piana (2006)� Gender: The Missing Component of the
Response to Climate Change. Food and Agriculture Organization of the United
Nations. Available at: http: / / www. fao. org / sd / dim_pe1 / docs / pe1_051001d1_
en.pdf.
Lamont A� (2008)� Assessing the Long-term System Value of Intermittent Electric
Generation Technologies. Energy Economics 30, 1208 – 1231. doi: 10.1016 / j.
eneco.2007.02.007.
De Lary L�, A� Loschetter, O� Bouc, J� Rohmer, and C� M� Oldenburg (2012)�
Assessing health impacts of CO
2
leakage from a geological storage site into
buildings: Role of attenuation in the unsaturated zone and building foundation.
International Journal of Greenhouse Gas Control 9, 322 – 333.
Laurier D�, S� Jacob, M� O� Bernier, K� Leuraud, C� Metz, E� Samson, and P� Laloi
(2008)� Epidemiological studies of leukaemia in children and young adults
around nuclear facilities: a critical review. Radiation Protection Dosimetry 132,
182 – 190. doi: 10.1093 / rpd / ncn262.
Laurier D�, S� Jacob, and P� Laloi (2010)� Review of epidemiology studies of child-
hood leukaemia near nuclear facilities: Answer to the commentary from fair-
lie and Korblein. Radiation Protection Dosimetry 138, 195 – 197. Available at:
http: / / www. scopus. com / inward / record.url?eid=2-s2.0-77950321286&partnerI
D=40&md5=80ade34822121fe503a9270958d8de6b.

585585
Energy Systems
7
Chapter 7
Lechtenböhmer S�, and C� Dienst (2010)� Future development of the upstream
greenhouse gas emissions from natural gas industry, focussing on Russian gas
fields and export pipelines. Journal of Integrative Environmental Sciences 7,
39 – 48.
Lehr U�, C� Lutz, and D� Edler (2012)� Green jobs? Economic impacts of renewable
energy in Germany. Energy Policy 47, 358 – 364.
Lester S�, and K� Neuhoff (2009)� Understanding the roles of policy targets in
national and international governance. Climate Policy 9, 464 – 480.
Levi M� A� (2012)� Comment on “hydrocarbon emissions characterization in the
Colorado Front Range: A pilot study” by Gabrielle Pétron et al. Journal of
Geophysical Research D: Atmospheres 117. Available at: http: / / www. scopus.
com / record / display.url?eid=2-s2.0-84868676788&origin=inward&txGid=E22C
3BA38F75A3546366A9F10ECCACB6.N5T5nM1aaTEF8rE6yKCR3A%3a66.
Levi M� (2013)� Climate changes of natural gas as a bridge fuel. Climate Change
118, 609 – 623.
Lewis W� B� (1972)� Energy in the Future: the Role of Nuclear Fission and Fusion.
Proceedings of the Royal Society of Edinburgh. Section A: Mathematical and
Physical Sciences 70, 219 – 223.
Lewis, S� Estefen, J� Huckerby, W� Musial, T� Pontes, and J� Torres-Martinez
(2011)� Ocean Energy. In: IPCC Special Report on Renewable Energy Sources
and Climate Change Mitigation. Prepared by Working Group III of the Inter-
governmental Panel on Climate Change [O. Edenhofer, R. Pichs-Madruga, Y.
Sokona, K. Seyboth, P. Matschoss, S. Kadner, T. Zwickel, P. Eickemeier, G. Hansen,
S. Schlömer, C. von Stechow (eds.)]. Cambridge University Press, Cambridge,
United Kingdom and New York, NY, USA.
Lim S� S�, T� Vos, A� D� Flaxman, G� Danaei, K� Shibuya, H� Adair-Rohani, M�
Amann, H� R� Anderson, K� G� Andrews, M� Aryee, C� Atkinson, L� J� Bac-
chus, A� N� Bahalim, K� Balakrishnan, J� Balmes, S� Barker-Collo, A� Baxter,
M� L� Bell, J� D� Blore, F� Blyth, C� Bonner, G� Borges, R� Bourne, M� Bouss-
inesq, M� Brauer, P� Brooks, N� G� Bruce, B� Brunekreef, C� Bryan-Hancock,
C� Bucello, R� Buchbinder, F� Bull, R� T� Burnett, T� E� Byers, B� Calabria, J�
Carapetis, E� Carnahan, Z� Chafe, F� Charlson, H� Chen, J� S� Chen, A� T�-A�
Cheng, J� C� Child, A� Cohen, K� E� Colson, B� C� Cowie, S� Darby, S� Dar-
ling, A� Davis, L� Degenhardt, F� Dentener, D� C� Des Jarlais, K� Devries,
M� Dherani, E� L� Ding, E� R� Dorsey, T� Driscoll, K� Edmond, S� E� Ali, R� E�
Engell, P� J� Erwin, S� Fahimi, G� Falder, F� Farzadfar, A� Ferrari, M� M� Finu-
cane, S� Flaxman, F� G� R� Fowkes, G� Freedman, M� K� Freeman, E� Gaki-
dou, S� Ghosh, E� Giovannucci, G� Gmel, K� Graham, R� Grainger, B� Grant,
D� Gunnell, H� R� Gutierrez, W� Hall, H� W� Hoek, A� Hogan, H� D� Hosgood, D�
Hoy, H� Hu, B� J� Hubbell, S� J� Hutchings, S� E� Ibeanusi, G� L� Jacklyn, R� Jas-
rasaria, J� B� Jonas, H� Kan, J� A� Kanis, N� Kassebaum, N� Kawakami, Y�-H�
Khang, S� Khatibzadeh, J�-P� Khoo, C� Kok, and F� Laden (2012)� A compara-
tive risk assessment of burden of disease and injury attributable to 67 risk fac-
tors and risk factor clusters in 21 regions, 1990 – 2010: a systematic analysis for
the Global Burden of Disease Study 2010. The Lancet 380, 2224 – 2260. ISSN:
0140-6736.
Lin C�-C�, and Y�-W� Chen (2011)� Performance of a cross-flow rotating packed
bed in removing carbon dioxide from gaseous streams by chemical absorption.
International Journal of Greenhouse Gas Control 5, 668 – 675. doi: 10.1016 / j.
ijggc.2011.02.002, ISSN: 1750-5836.
Lin B�, and X� Li (2011)� The effect of carbon tax on per capita CO
2
emissions.
Energy Policy 39, 5137 – 5146.
Linares P�, and A� Conchado (2013)� The economics of new nuclear power plants
in liberalized electricity markets. Energy Economics 40, 119 – 125.
Lohwasser R�, and R� Madlener (2011)� Economics of CCS for Coal Plants: Impact
of Investment Costs and Efficiency on Market Diffusion in Europe. Energy Eco-
nomics 34, 850 – 863.
Loisel R�, A� Mercier, C� Gatzen, N� Elms, and H� Petric (2010)� Valuation frame-
work for large scale electricity storage in case with wind curtailment. Energy
Policy 38, 7323 – 7337.
Lovich J� E�, and J� R� Ennen (2013)� Assessing the state of knowledge of util-
ity-scale wind energy development and operation on non-volant terres-
trial and marine wildlife. Applied Energy 103, 52 – 60. doi: 10.1016 / j.apen-
ergy.2012.10.001, ISSN: 0306-2619.
De Lucas M�, M� Ferrer, M� J� Bechard, and A� R� Muñoz (2012)� Griffon vulture
mortality at wind farms in southern Spain: Distribution of fatalities and active
mitigation measures. Biological Conservation 147, 184 – 189.
De Lucena A� F� P�, A� S� Szklo, and R� Schaeffer (2009)� Renewable energy in an
unpredictable and changing climate. Energy Review 1, 22 – 25.
Luckow P�, M� A� Wise, J� J� Dooley, and S� H� Kim (2010)� Large-scale utiliza-
tion of biomass energy and carbon dioxide capture and storage in the trans-
port and electricity sectors under stringent CO
2
concentration limit scenarios.
International Journal of Greenhouse Gas Control 4, 865 – 877. doi: 10.1016 / j.
ijggc.2010.06.002, ISSN: 1750-5836.
Luderer G�, C� Bertram, K� Calvin, E� De Cian, and E� Kriegler (2013)� Impli-
cations of weak near-term climate policies on long-term mitigation pathways.
Climate Change.
Luderer G�, R� Pietzcker, K� Kriegler, M� Haller, and N� Bauer (2012)� Asia’s role
in mitigating climate change: A technology and sector specific analysis with
ReMIND-R. Energy Economics 34, 378 – 390.
Ludig S�, M� Haller, and N� Bauer (2011)� Tackling long-term climate change
together: The case of flexible CCS and fluctuating renewable energy. Energy
Procedia 4, 2580 – 2587.
Lund H�, and A� N� Andersen (2005)� Optimal designs of small CHP plants in a
market with fluctuating electricity prices. Energy Conversion and Management
46, 893 – 904. doi: 10.1016 / j.enconman.2004.06.007, ISSN: 0196-8904.
Madaeni S� H�, R� Sioshansi, and P� Denholm (2011)� How Thermal Energy Stor-
age Enhances the Economic Viability of Concentrating Solar Power. Proceedings
of the IEEE pp, 1 – 13. doi: 10.1109 / JPROC.2011.2144950, ISSN: 0018-9219.
Maeck A�, T� DelSontro, D� F� McGinnis, H� Fischer, S� Flury, M� Schmidt,
P� Fietzek, and A� Lorke (2013)� Sediment Trapping by Dams Creates
Methane Emission Hot Spots. Environmental Science & Technology. doi:
10.1021 / es4003907, ISSN: 0013-936X.
Magnani N�, and A� Vaona (2013)� Regional spill-over effects of renewable energy
generation in Italy. Energy Policy 56, 663 – 671.
Mahboob S� (2013)� Environmental pollution of heavy metals as a cause of oxi-
dative stress in fish: A review. Life Science Journal 10, 336 – 347. Available at:
http: / / www. scopus. com / inward / record.url?eid=2-s2.0-84885096944&partnerI
D=40&md5=415db58a08f81e835361c22b1a18324b.
Malone E� L�, J� J� Dooley, and J� A� Bradbury (2010)� Moving from misinforma-
tion derived from public attitude surveys on carbon dioxide capture and storage
towards realistic stakeholder involvement. International Journal of Greenhouse
Gas Control 4, 419 – 425. doi: 10.1016 / j.ijggc.2009.09.004, ISSN: 1750-5836.

586586
Energy Systems
7
Chapter 7
Markusson N�, S� Shackley, and B� Evar (2012)� The Social Dynamics of Carbon
Capture and Storage Understanding CCS Representations, Governance and
Innovation. Taylor & Francis, Hoboken, ISBN: 9780203118726 0203118723.
Marra J�, and R� Palmer (2011)� Radioactive Waste Management. In: Waste — A
Handbook for Management. T. Letcher, D. Vallero, (eds.). Elsevier, Amsterdam,
pp. 101 – 108.
Mason I� G�, S� C� Page, and A� G� Williamson (2010)� A 100 % renewable elec-
tricity generation system for New Zealand utilising hydro, wind, geother-
mal and biomass resources. Energy Policy 38, 3973 – 3984. doi: 10.1016 / j.
enpol.2010.03.022, ISSN: 0301-4215.
Mason J� E�, and K� Zweibel (2007)� Baseline model of a centralized pv electrolytic
hydrogen system. International Journal of Hydrogen Energy 32, 2743 – 2763.
doi: 10.1016 / j.ijhydene.2006.12.019, ISSN: 0360-3199.
Mathieson A�, J� Midgley, K� Dodds, I� Wright, P� Ringrose, and N� Saoul
(2010)� CO
2
sequestration monitoring and verification technologies applied at
Krechba, Algeria. The Leading Edge 29, 216 – 222. doi: 10.1190 / 1.3304827.
Matteo E� N�, and G� W� Scherer (2012)� Experimental study of the diffusion-con-
trolled acid degradation of Class H Portland cement. International Journal of
Greenhouse Gas Control. doi: 10.1016 / j.ijggc.2011.07.012, ISSN: 1750-5836.
Maugeri L� (2012)� “Oil: The Next Revolution” The Unprecedented Upsurge of Oil
Production Capacity and What It Means for the World. Harvard University, Belfer
Center for Science and International Affairs, 86 pp. Available at: http: / / belfer-
center.ksg.harvard.edu / files / Oil-%20The%20Next%20Revolution.pdf.
Mazzoldi A�, T� Hill, and J� J� Colls (2011)� Assessing the risk for CO
2
transportation
within CCS projects, CFD modelling. International Journal of Greenhouse Gas
Control 5, 816 – 825. doi: 10.1016 / j.ijggc.2011.01.001, ISSN: 1750-5836.
Mazzoldi A�, A� P� Rinaldi, A� Borgia, and J� Rutqvist (2012)� Induced seismicity
within geological carbon sequestration projects: Maximum earthquake mag-
nitude and leakage potential from undetected faults. International Journal of
Greenhouse Gas Control 10, 434 – 442.
McCollum D� L�, V� Krey, K� Riahi, P� Kolp, A� Grubler, M� Makowski, and N�
Nakicenovic (2013a)� Climate policies can help resolve energy security and air
pollution challenges. Climate Change 119, 479 – 494.
McCollum D�, Y� Nagai, K� Riahi, G� Marangoni, K� Calvin, R� Pietzcker, J� Van
Vliet, and B� Van der Zwaan (2014)� Energy investments under climate pol-
icy: a comparison of global models. Accepted for Publication in Climate Change
Economics.
McCollum D� L�, Y� Nagai, K� Riahi, G� Marangoni, K� Calvin, R� Pietzscker, J�
van Vliet, and B� van der Zwaan (2013b)� Energy investments under climate
policy: a comparison of global models. Climate Change Economics.
McCoy S� T�, and E� S� Rubin (2008)� An engineering-economic model of pipeline
transport of CO
2
with application to carbon capture and storage. Interna-
tional Journal of Greenhouse Gas Control 2, 219 – 229. doi: 10.1016 / s1750-
5836(07)00119-3, ISSN: 1750-5836.
McDonald-Wilmsen B�, and M� Webber (2010)� Dams and displacement: raising
the standards and broadening the research agenda. Water Altern. 3, 142 – 161.
McMillen S�, N� Prakash, A� DeJonge, and D� Shannon (2011)� The Economic
Impact of Nuclear Power Generation in Connecticut. Connecticut Academy of
Science and Engineering, Rocky Hill, CT.
Meibom P�, J� Kiviluoma, R� Barth, H� Brand, C� Weber, and Larsen H� V� (2007)�
Value of electric heat boilers and heat pumps for wind power integration. Wind
Energy 10, 321 – 337. doi: 10.1002 / we.224.
Meinshausen M�, N� Meinshausen, W� Hare, S� C� Raper, K� Frieler, R� Knutti,
D� J� Frame, and M� R� Allen (2009)� Greenhouse-Gas Emission Targets for
Limiting Global Warming to 2 °C. Nature 458, 1158 – 62.
Mekonnen M� M�, and A� Y� Hoekstra (2012)� The blue water footprint of electricity
from hydropower. Hydrology and Earth System Sciences 16, 179 – 187. Available
at: http: / / www. scopus. com / inward / record.url?eid=2-s2.0-84874198727&part
nerID=40&md5=555bc09e521a427c29c816b94a26a825.
Meldrum J�, S� Nettles-Anderson, G� Heath, and J� Macknick (2013)� Life cycle
water use for electricity generation: A review and harmonization of literature
estimates. Environmental Research Letters 8. Available at: http: / / www. scopus.
com / record / display.url?eid=2-s2.0-84876172832&origin=inward&txGid=E22C
3BA38F75A3546366A9F10ECCACB6.N5T5nM1aaTEF8rE6yKCR3A%3a74.
Méndez Quezada V�, J� Rivier Abbad, and T� Gómez San Román (2006)� Assess-
ment of energy distribution losses for increasing penetration of distributed
generation. IEEE Transactions on Power Systems 21, 533 – 540. Available at:
http: / / www. ecs. csun. edu / ~bruno / IEEEpapers / 01626356.pdf.
Mendez V� H�, J� Rivier, J� I� de la Fuente, T� Gomez, J� Arceluz, J� Mari n, and
A� Madurga (2006)� Impact of distributed generation on distribution invest-
ment deferral. International Journal of Electrical Power & Energy Systems 28,
244 – 252. doi: 10.1016 / j.ijepes.2005.11.016, ISSN: 0142-0615.
Meshakti N� (2007)� The safety and reliability of complex energy processing sys-
tems. Energy Sources Part B — Economics Planning and Policy 2, 141 – 154.
Meyer J� (2007)� Summary of Carbon Dioxide Enhanced Oil Recovery (CO
2
-EOR)
Injection Well Technology. American Petroleum Institute, Washington, DC. Avail-
able at: http: / / www. api. org / environment-health-and-safety / environmental-
performance / ~ / media / d68de1954b8e4905a961572b3d7a967a.ashx.
Michaelowa A�, M� Krey, and S� Butzengeiger (2006)� Clean Development
Mechanism and Joint Implementation: New Instruments for Financing Renew-
able Energy Technologies. In: Renewable energy. D. Assmann, U. Laumanns, D.
Uh, (eds.), Earthscan, London, pp. 196 – 216.
Mideksa T� K�, and S� Kallbekken (2010)� The impact of climate change on the
electricity market: a review. Energy Policy 38, 3579 – 3585.
Miller E�, L� M� Bell, and L� Buys (2007)� Public understanding of carbon seques-
tration in Australia: Socio-demographic predictors of knowledge, engagement
and trust. International Journal of Emerging Technologies and Society 5, 15 – 33.
Mills A�, A� Phadke, and R� Wiser (2011)� Exploration of resource and transmis-
sion expansion decisions in the Western Renewable Energy Zone initiative.
Energy Policy 39, 1732 – 1745. doi: 10.1016 / j.enpol.2011.01.002, ISSN: 0301-
4215.
MIT (2011)� The Future of Natural Gas. Massachusetts Institute of Technology,
Cambridge, MA, USA.
MIT (2013)� CCS Project Database. Massachusetts Institute of Technology, Cam-
bridge, MA, USA.
Mitchell C�, J� Sawin, G� R� Pokharel, D� M� Kammen, Z� Wang, S� Fifita, M�
Jaccard, O� Langniss, H� Lucas, A� Nadai, R� Trujillo Blanco, E� Usher, A�
Verbruggen, R� Wüstenhagen, and K� Yamaguchi (2011)� Policy, Financ-
ing and Implementation. In: IPCC Special Report on Renewable Energy Sources
and Climate Change Mitigation. Prepared by Working Group III of the Inter-
governmental Panel on Climate Change [O. Edenhofer, R. Pichs-Madruga, Y.
Sokona, K. Seyboth, P. Matschoss, S. Kadner, T. Zwickel, P. Eickemeier, G. Hansen,
S. Schlömer, C. von Stechow (eds.)]. Cambridge University Press, Cambridge,
United Kingdom and New York, NY, USA.

587587
Energy Systems
7
Chapter 7
Møller A�, F� Barnier, and T� Mousseau (2012)� Ecosystems effects 25 years after
Chernobyl: pollinators, fruit set and recruitment. Oecologia 170, 1155 – 1165.
doi: 10.1007 / s00442-012-2374-0, ISSN: 0029-8549.
Møller A� P�, A� Bonisoli-Alquati, G� Rudolfsen, and T� A� Mousseau (2011)� Cher-
nobyl birds have smaller brains. Plos One 6. Available at: http: / / www. scopus.
com / record / display.url?eid=2-s2.0-79951663714&origin=inward&txGid=E22C
3BA38F75A3546366A9F10ECCACB6.N5T5nM1aaTEF8rE6yKCR3A%3a82.
Møller A� P�, and T� A� Mousseau (2011)� Conservation consequences of Chernobyl
and other nuclear accidents. Biological Conservation 144, 2787 – 2798.
Moomaw W�, P� Burgherr, G� Heath, M� Lenzen, J� Nyboer, and A� Verbruggen
(2011a)� Annex II: Methodology. In: IPCC Special Report on Renewable Energy
Sources and Climate Change Mitigation. Prepared by Working Group III of the
Intergovernmental Panel on Climate Change [O. Edenhofer, R. Pichs-Madruga, Y.
Sokona, K. Seyboth, P. Matschoss, S. Kadner, T. Zwickel, P. Eickemeier, G. Hansen,
S. Schlömer, C. von Stechow (eds.)]. Cambridge University Press, Cambridge,
United Kingdom and New York, NY, USA.
Moomaw W�, F� Yamba, M� Kamimoto, L� Maurice, J� Nyboer, K� Urama, and T�
Weir (2011b)� Introduction: Renewable Energy and Climate Change. In: IPCC
Special Report on Renewable Energy Sources and Climate Change Mitigation.
Prepared by Working Group III of the Intergovernmental Panel on Climate
Change [O. Edenhofer, R. Pichs-Madruga, Y. Sokona, K. Seyboth, P. Matschoss, S.
Kadner, T. Zwickel, P. Eickemeier, G. Hansen, S. Schlömer, C. von Stechow (eds.)].
Cambridge University Press, Cambridge, United Kingdom and New York, NY,
USA.
Moore T� A� (2012)� Coalbed methane: A review. International Journal of Coal
Geology 101, 36 – 81. Available at: http: / / www. scopus. com / inward / record.
url?eid=2-s2.0-84865049192&partnerID=40&md5=ebf4c6be74a60be8c40e77
3fa6fe62dc.
Moore D�, J� Dore, and D� Gyawali (2010)� The World Commission on Dams + 10:
Revisiting the large dam controversy. Water Alternatives 3, 3 – 13.
Moreno R�, L� Jover, C� Diez, F� Sardà, and C� Sanpera (2013)� Ten Years after
the Prestige Oil Spill: Seabird Trophic Ecology as Indicator of Long-Term Effects
on the Coastal Marine Ecosystem. Plos One 8. Available at: http: / / www. scopus.
com / inward / record.url?eid=2-s2.0-84885110890&partnerID=40&md5=1c7f16
a3f0860cc598ef580cdc4ae34e.
Moriarty P�, and D� Honnery (2007)� Intermittent renewable energy: The only
future source of hydrogen? International Journal of Hydrogen Energy 32,
1616 – 1624. doi: 10.1016 / j.ijhydene.2006.12.008, ISSN: 0360-3199.
Moriarty P�, and D� Honnery (2012)� What is the global potential for renew-
able energy? Renewable and Sustainable Energy Reviews 16, 244 – 252. doi:
10.1016 / j.rser.2011.07.151, ISSN: 1364-0321.
Morris J� P�, R� L� Detwiler, S� J� Friedmann, O� Y� Vorobiev, and Y� Hao (2011)� The
large-scale geomechanical and hydrogeological effects of multiple CO
2
injec-
tion sites on formation stability. International Journal of Greenhouse Gas Con-
trol 5, 69 – 74. doi: 10.1016 / j.ijggc.2010.07.006, ISSN: 1750-5836.
Mousseau T� A�, and A� P� Møller (2013)� Elevated Frequency of Cataracts in
Birds from Chernobyl. Plos One 8, e66939. Available at: http: / / www. scopus.
com / record / display.url?eid=2-s2.0-84880831984&origin=inward&txGid=E22C
3BA38F75A3546366A9F10ECCACB6.N5T5nM1aaTEF8rE6yKCR3A%3a91.
Myung S�, H� Choi, C� Jeong, K� Song, J� Lee, G� Park, H� Kim, W� Ko, J� Park, K�
Kim, H� Lee, and J� Park (2006)� The Status and Prospect of DUPIC Fuel Tech-
nology. Nuclear Engineering and Technology 38.
Nagajyoti P� C�, K� D� Lee, and T� V� M� Sreekanth (2010)� Heavy metals, occurrence
and toxicity for plants: A review. Environmental Chemistry Letters 8, 199 – 216.
doi: 10.1007 / s10311-010-0297-8, ISSN: 1610-3653, 1610 – 3661.
Narula K�, Y� Nagai, and S� Pachauri (2012)� The role of Decentralized Distributed
Generation in achieving universal rural electrification in South Asia by 2030.
Energy Policy 47, 345 – 357.
NAS (2013a)� Induced Seismicity Potential in Energy Technologies. National Acad-
emy of Sciences. Available at: http: / / dels.nas.edu / Report / Induced-Seismicity-
Potential-Energy-Technologies / 13355.
NAS (2013b)� Emerging Workforce Trends in the U. S. Energy and Mining Industries:
A Call to Action. National Academy of Sciences, The National Academies Press,
Washington DC, USA.
Naturalhy (2004)� Preparing for the Hydrogen Economy by Using the Existing Natu-
ral Gas System as a Catalyst. Available at: http: / / www. naturalhy. net / docs / Stra-
tegic_justification_NATURALHY.pdf.
Nauclér T�, and P� A� Enkvist (2009)� Pathways to a Low-Carbon Economy — Ver-
sion 2 of the Global Greenhouse Gas Abatement Cost Curve. McKinsey & Com-
pany, New York, USA.
NEA (2006)� Forty Years of Uranium Resources, Production and Demand in Perspec-
tive — The Red Book Perspective. OECD Nuclear Energy Agency, Paris, France.
NEA (2008)� Nuclear Energy Outlook 2008. Nuclear Energy Agency (NEA) of the
Organisation for Economic Co-Operation and Development (OECD), Paris,
France.
NEA (2010)� The Security of Energy Supply and the Contribution of Nuclear Energy.
OECD, Paris, France.
NEA (2011a)� Technical and Economic Aspects of Load Following with Nuclear
Power Plants. Nuclear Energy Agency, OECD, Paris, France.
NEA (2011b)� Carbon Princing, Power Markets and the Competitiveness of Nuclear
Power. Nuclear Energy Agency, OECD, Paris. Available at: http: / / www. oecd-nea.
org / ndd / reports / 2011 / carbon-pricing-exec-sum-2011.pdf.
NEA (2012)� Nuclear Energy and Renewables. System Effects in Low-Carbon Elec-
tricity Systems. Nuclear Energy Agency, OECD, Paris, France.
NEA (2013)� Nuclear Energy Today. Nuclear Energy Agency (NEA) and International
Energy Agency (IEA) of the OECD, Paris, France.
NEA, and IAEA (2012)� Uranium 2011: Resources, Production and Demand. OECD
Nuclear Energy Agency and the International Atomic Energy Agency, Paris,
France.
NETL (2012)� Carbon Sequestration Atlas of the United States and Canada.
Fourth Edition. US Department of Energy, National Energy Technology
Laboratory, Pittsburgh, PA. Available at: http: / / www. netl. doe. gov / File%20
Library / Research / Coal / carbon-storage / natcarb / Atlas-IV-2012.pdf.
Neuhoff K�, M� Ahman, R� Betz, J� Cludius, F� Ferrario, K� Holmgren, G� Pal, M�
Grubb, F� Matthes, K� Rogge, M� Sato, J� Schleich, A� Tuerk, C� Kettner,
and N� Walker (2006)� Implications of announced Phase 2 National Allocation
Plans for the EU ETS. Climate Policy 6, 411 – 422.
Nguyen K� (2007)� Alternatives to Grid Extension for Rural Electrification:
Decentralized Renewable Energy Technologies in Vietnam. Energy Policy 35,
2579 – 2589.
Nicholson M�, T� Biegler, and B� Brook (2011)� How carbon pricing changes the
relative competitiveness of low-carbon base load generating technologies.
Energy 36, 305 – 313.

588588
Energy Systems
7
Chapter 7
Nicot J�-P� (2008)� Evaluation of large-scale CO
2
storage on fresh-water Sections of
aquifers: An example from the Texas Gulf Coast Basin. International Journal of
Greenhouse Gas Control 2, 582 – 593. doi: 10.1016 / j.ijggc.2008.03.004, ISSN:
1750-5836.
Nord L� O�, R� Anantharaman, and O� Bolland (2009)� Design and off-design anal-
yses of a pre-combustion CO
2
capture process in a natural gas combined cycle
power plant. International Journal of Greenhouse Gas Control 3, 385 – 392. doi:
10.1016 / j.ijggc.2009.02.001, ISSN: 1750-5836.
Norgate T� E�, S� Jahanshahi, and W� J� Rankin (2007)� Assessing the environmen-
tal impact of metal production processes. Journal of Cleaner Production 15,
838 – 848. doi: 10.1016 / j.jclepro.2006.06.018, ISSN: 0959-6526.
NRC (1996)� Nuclear Wastes: Technologies for Separation and Transmutation.
National Research Council, National Academy Press, Washington, DC.
Nuytten T�, B� Claessens, K� Paredis, J� van Bael, and D� Six (2013)� Flexibility
of a combined heat and power system with thermal energy storage for district
heating. Applied Energy 104, 583 – 591.
O’Neill B�, K� Riahi, and I� Keppo (2010)� Mitigation implications of midcentury
targets that preserve long-term climate policy options. PNAS 107, 1011 – 1016.
doi: 10.1073 / pnas.0903797106.
O’Sullivan F�, and S� Paltsev (2012)� Shale gas production: potential versus
actual greenhouse gas emissions. Environmental Research Letters 7. doi:
10.1088 / 1748-9326 / 7 / 4 / 044030.
Oda J�, and K� Akimoto (2011)� An analysis of CCS investment under uncertainty.
Energy Procardia 4, 1997 – 2004.
OECD (2009)� The Economics of Climate Change Mitigation — Policies and Options
for Global Action beyond 2012. OECD, Paris, France. Available at: www. oecd.
org / env / cc / econ / beyond2012.
OECD, and NEA (2007)� Management of Recyclable Fissile and Fertile Materials.
OECD Nuclear Energy Agency, Paris, France.
Ogawa T�, S� Nakanishi, T� Shidahara, T� Okumura, and E� Hayashi (2011)�
Saline-aquifer CO
2
sequestration in Japan-methodology of storage capacity
assessment. International Journal of Greenhouse Gas Control 5, 318 – 326. doi:
10.1016 / j.ijggc.2010.09.009, ISSN: 1750-5836.
Oosterkamp A�, and J� Ramsen (2008)� State-of-the-Art Overview of CO
2
Pipeline
Transport with Relevance to Offshore Pipelines. Norway, 87 pp.
Oparoacha S�, and S� Dutta (2011)� Gender and Energy for Sustainable Develop-
ment. Current Opinion in Environmental Sustainability 3, 265 – 271.
ORNL (2012)� Categorization of Used Nuclear Fuel Inventory in Support of a Com-
prehensive National Nuclear Fuel Cycle Strategy. Oak Ridge National Labora-
tory (ORNL), Oak Ridge, Tenn., USA.
Orr F� M� (2009)� Onshore Geologic Storage of CO
2
. Science 325, 1656 – 1658. doi:
10.1126 / science.1175677.
Oruganti Y�, and S� L� Bryant (2009)� Pressure build-up during CO
2
storage in
partially confined aquifers. Energy Procedia 1, 3315 – 3322. doi: 10.1016 / j.egy-
pro.2009.02.118, ISSN: 1876-6102.
Owen N� A�, O� R� Inderwildi, and D� A� King (2010)� The status of conventional
world oil reserves — Hype or cause for concern? Energy Policy 38, 4743 – 4749.
doi: 10.1016 / j.enpol.2010.02.026, ISSN: 0301-4215.
Owen M�, R� van der Plas, and S� Sepp (2013)� Can there be energy policy in
Sub-Saharan Africa without biomass? Energy for Sustainable Development 17,
146 – 152.
Ozaki M�, and T� Ohsumi (2011)� CCS from multiple sources to offshore storage
site complex via ship transport. Energy Procedia 4, 2992 – 2999. doi: 10.1016 / j.
egypro.2011.02.209, ISSN: 1876-6102.
Pachauri S�, A� Brew-Hammond, D� F� Barnes, D� H� Bouille, D� H� Gitonga, V�
Modi, G� Prasad, A� Rath, and H� Zerriffi (2012)� Energy Access for Develop-
ment. In: Global Energy Assessment: Toward a Sustainable Future. L. Gomez-
Echeverri, T. B. Johansson, N. Nakicenovic, A. Patwardhan, (eds.), International
Institute for Applied Systems Analysis and Cambridge University Press, Laxen-
burg, Austria; Cambridge, UK, and New York, USA.
Pachauri S�, B� van Ruijven, Y� Nagai, K� Riahi, D� van Vuuren, A� Brew-Ham-
mond, and N� Nakicenovic (2013)� Pathways to achieve universal household
access to modern energy by 2030. Environmental Research Letters 8, 024015.
doi: 10.1088 / 1748-9326 / 8 / 2 / 024015.
Pacyna E� G�, J� M� Pacyna, J� Fudala, E� Strzelecka-Jastrzab, S� Hlawiczka, D�
Panasiuk, S� Nitter, T� Pregger, H� Pfeiffer, and R� Friedrich (2007)� Current
and future emissions of selected heavy metals to the atmosphere from anthro-
pogenic sources in Europe. Atmospheric Environment 41, 8557 – 8566.
Padurean A�, C�-C� Cormos, A�-M� Cormos, and P�-S� Agachi (2011)� Multicrite-
rial analysis of post-combustion carbon dioxide capture using alkanolamines.
International Journal of Greenhouse Gas Control 5, 676 – 685. doi: 10.1016 / j.
ijggc.2011.02.001, ISSN: 1750-5836.
Pahle M�, L� Fan, and W� P� Schill (2011)� How emission certificate allocations dis-
tort fossil investments: The German example. Energy Policy 39, 1975 – 1987.
Palmer M� A�, E� S� Bernhardt, W� H� Schlesinger, K� N� Eshleman, E� Foufoula-
Georgiou, M� S� Hendryx, A� D� Lemly, G� E� Likens, O� L� Loucks, M� E�
Power, P� S� White, and P� R� Wilcock (2010)� Mountaintop Mining Conse-
quences. Policy Forum. Science and Regulation. Available at: http: / / www. dep.
state. fl. us / water / mines / docs / prbmac / mining-science-2010.pdf.
Parry I� (2004)� Are Emission Permits Regressive. Journal of Environmental Econom-
ics and Management 47, 264 – 387.
Patel S� (2011)� Climate Finance: Engaging the Private Sector. International Finance
Corporation, Washington, DC. Available at: http: / / www1. ifc. org / wps / wcm / con-
nect / 5d659a804b28afee9978f908d0338960 / ClimateFinance_G20Report.
pdf?MOD=AJPERES.
Paul J� H�, D� Hollander, P� Coble, K� L� Daly, S� Murasko, D� English, J� Basso,
J� Delaney, L� McDaniel, and C� W� Kovach (2013)� Toxicity and Mutagenic-
ity of Gulf of Mexico Waters During and After the Deepwater Horizon Oil Spill.
Environmental Science & Technology 47, 9651 – 9659. doi: 10.1021 / es401761h,
ISSN: 0013-936X, 1520 – 5851.
Peck S� C�, and Y� S� Wan (1996)� Analytic Solutions of Simple Greenhouse Gas
Emission Models. In: Economics of Atmospheric Pollution. E. C. Van Ierland, K.
Gorka, (eds.). Spinger Verlag, Berlin.
Pehnt M� (2008)� Environmental impacts of distributed energy systems-The case of
micro cogeneration. Environmental Science and Policy 11, 25 – 37. Available at:
http: / / www. scopus. com / inward / record.url?eid=2-s2.0-38649089809&partnerI
D=40&md5=99154cbe4e8de5bc6f53b979ea707f54.
Pehnt M�, M� Oeser, and D� J� Swider (2008)� Consequential environmental sys-
tem analysis of expected offshore wind electricity production in Germany.
Energy 33, 747 – 759. doi: 10.1016 / j.energy.2008.01.007, ISSN: 0360-5442.
Perez-Arriaga I� J�, and C� Batlle (2012)� Impacts of Intermittent Renewables on
Electricity Generation System Operation. Economics of Energy & Environmental
Policy 1. doi: 10.5547 / 2160-5890.1.2.1, ISSN: 21605882.

589589
Energy Systems
7
Chapter 7
Peterson C� H�, S� S� Anderson, G� N� Cherr, R� F� Ambrose, S� Anghera, S� Bay, M�
Blum, R� Condon, T� A� Dean, M� Graham, M� Guzy, S� Hampton, S� Joye, J�
Lambrinos, B� Mate, D� Meffert, S� P� Powers, P� Somasundaran, R� B� Spies,
C� M� Taylor, R� Tjeerdema, and E� Eric Adams (2012)� A tale of two spills:
Novel science and policy implications of an emerging new oil spill model. Bio-
Science 62, 461 – 469.
PetroMin Pipeliner (2010)� Flow Assurance — Solutions for Oil and Gas Pipeline
Problems. PetroMin Pipeliner, 45 – 49 pp.
Petron G�, G� Frost, B� R� Miller, A� I� Hirsch, S� A� Montzka, A� Karion, M� Trainer,
C� Sweeney, A� E� Andrews, L� Miller, J� Kofler, A� Bar-Ilan, E� J� Dlugo-
kencky, L� Patrick, C� T� Moore, T� B� Ryerson, C� Siso, W� Kolodzey, P� M�
Lang, T� Conway, P� Novelli, K� Masarie, B� Hall, D� Guenther, D� Kitzis, J�
Miller, D� Welsh, D� Wolfe, W� Neff, and P� Tans (2012)� Hydrocarbon emis-
sions characterization in the Colorado Front Range: A pilot study. J. Geophys.
Res. 117, D04304. doi: 10.1029 / 2011JD016360, ISSN: 0148-0227.
Pfister S�, D� Saner, and A� Koehler (2011)� The environmental relevance of
freshwater consumption in global power production. International Journal
of Life Cycle Assessment 16, 580 – 591. Available at: http: / / www. scopus.
com / inward / record.url?eid=2-s2.0-79960570841&partnerID=40&md5=ffb2bd
28105d0706b8d9a61b789d1389.
Philibert C� (2008)� Price Caps and Price Floors in Climate Policy. A Quantitative
Assessment. IEA / OECD, Paris, France.
Philibert C�, and J� Pershing (2002)� Beyond Kyoto, Energy Dynamics and Climate
Stabilisation. International Energy Agency, Paris, France. Available at: http: / / phi-
libert.cedric.free.fr / Downloads / Beyond%20Kyoto_NS.pdf.
Pickard W� F�, N� J� Hansing, and A� Q� Shen (2009a)� Can large-scale advanced-
adiabatic compressed air energy storage be justified economically in an age
of sustainable energy? Journal of Renewable and Sustainable Energy 1. doi:
http: / / dx.doi.org / 10.1063 / 1.3139449.
Pickard W� F�, A� Q� Shen, and N� J� Hansing (2009b)� Parking the power: Strate-
gies and physical limitations for bulk energy storage in supply-demand match-
ing on a grid whose input power is provided by intermittent sources. Renew-
able & Sustainable Energy Reviews 13, 1934 – 1945.
Pihl E�, D� Kushnir, B� Sandén, and F� Johnsson (2012)� Material constraints
for concentrating solar thermal power. Energy 44, 944 – 954. Available at:
http: / / www. scopus. com / inward / record.url?eid=2-s2.0-84864377217&partnerI
D=40&md5=e7d6d283cc083b599f3ecf89d539eedc.
Pilli-Sihvola K�, P� Aatola, M� Ollikainen, and H� Tuomenvirt (2010)� Climate
change and electricity consumption — Witnessing increasing or decreasing use
and costs? Energy Policy 38, 2409 – 2419.
Pizer W� A� (2002)� Combining price and quantity controls to mitigate global cli-
mate change. Journal of Public Economics 85, 409 – 434.
Pope C� A�, M� Ezzati, and D� W� Dockery (2009)� Fine-Particulate Air Pollution and
Life Expectancy in the United States. New England Journal of Medicine 360,
376 – 386.
Porter J� R�, and L� Xie (2014)� Chapter 7. Food Security and Food Production Sys-
tems. In: Climate Change 2013: Impacts, Adaptation, and Vulnerability. Fifth
Assessment Report of Working Group II. Cambridge University Press, Cam-
bridge, UK.
Posiva Oy (2011)� Nuclear Waste Management of the Olkiluoto and Loviisa Nuclear
Power Plants. Posiva Oy, Olkiluoto, Finland.
Posiva Oy (2012)� Annual Report 2012. Posiva Oy, Okiluoto, Finland.
Pouret L�, N� Buttery, and W� Nuttall (2009)� Is Nuclear Power Flexible? Nuclear
Future 5, 333 – 341.
Procter R� (2013)� Integrating Time-Differentiated Rates, Demand Response, and
Smart Grid to Manage Power System Costs. The Electricity Journal 26, 50 – 60.
Pudjianto D�, C� Ramsay, and G� Strbac (2007)� Virtual power plant and system
integration of distributed energy resources. IET Renewable Power Generation
1, 10 – 16.
Purohit P�, and A� Michaelowa (2007)� CDM potential of bagasse cogeneration in
India. Energy Policy 35, 4779 – 4798.
Raaschou-Nielsen O�, C� E� Andersen, H� P� Andersen, P� Gravesen, M� Lind,
J� Schüz, and K� Ulbak (2008)� Domestic radon and childhood cancer in
Denmark. Epidemiology 19, 536 – 543. Available at: http: / / www. scopus.
com / inward / record.url?eid=2-s2.0-49849085205&partnerID=40&md5=cd45e
e7576a7c7c2132eb1775e9fb489.
Ragwitz M�, and S� Steinhilber (2013)� Effectiveness and efficiency of support
schemes for electricity from renewable energy sources. Wiley Interdisciplinary
Reviews: Energy and Environment. doi: 10.1002 / wene.85.
Ramos F� M�, L� A� W� Bambace, I� B� T� Lima, R� R� Rosa, E� A� Mazzi, and P� M�
Fearnside (2009)� Methane stocks in tropical hydropower reservoirs as a
potential energy source. Climate Change 93, 1 – 13.
Rao N� D� (2013)� Distributional impacts of climate change mitigation in Indian
electricity: The influence of governance. Energy Policy 61, 1344 – 1356. Available
at: http: / / www. sciencedirect. com / science / article / pii / S0301421513004588.
Rao P� S� C�, J� Miller, D� W� Young, and J� Byrne (2009)� Energy-microfinance
intervention for below poverty line households in India. Energy Policy 37,
1694 – 1712.
Rao S�, S� Pachauri, F� Dentener, P� Kinney, Z� Klimont, K� Riahi, and W�
Schoepp (2013)� Better air for better health: Forging synergies in policies
for energy access, climate change and air pollution. Global Environmental
Change. Available at: http: / / www. scopus. com / inward / record.url?eid=2-s2.0-
84879479992&partnerID=40&md5=bfd3a5077f5fa19dec1f2d8d10dc1c39.
Rasmussen M� G�, G� B� Andresen, and M� Greiner (2012)� Storage and balancing
synergies in a fully or highly renewable pan-European power system. Energy
Policy 51, 642 – 651. doi: 10.1016 / j.enpol.2012.09.009, ISSN: 0301-4215.
Ravikumar D�, and D� Malghan (2013)� Material constraints for indigenous pro-
duction of CdTe PV: Evidence from a Monte Carlo experiment using India’s
National Solar Mission Benchmarks. Renewable and Sustainable Energy
Reviews 25, 393 – 403. Available at: http: / / www. scopus. com / inward / record.
url?eid=2-s2.0-84878625693&partnerID=40&md5=3bc338e8612be9d510eaa
4a82ecbddb7.
Reddy A� K� N�, W� Annecke, K� Blok, D� Bloom, B� Boardman, A� Eberhard, J�
Ramakrishna, Q� Wodon, and A� K� M� Zaidi (2000)� Energy and social
issues. In: World Energy Assessment: Energy and the Challenge of Sustain-
ability. United Nations Development Programme, UN Department of Economic
and Social Affairs and the World Energy Council, New York, N. Y., pp. 40 – 60.
Available at: http: / / www. undp. org / content / undp / en / home / librarypage / envi-
ronment-energy / sustainable_energy / world_energy_assessmentenergyan-
dthechallengeofsustainability.html.
Reiche K�, B� Tenenbaum, and C� Torres de Mästle (2006)� Electrification and
Regulation: Principles and a Model Law. The World Bank Group, Washington
DC.

590590
Energy Systems
7
Chapter 7
Reiner D� M�, and W� J� Nuttall (2011)� Public Acceptance of Geological Disposal of
Carbon Dioxide and Radioactive Waste: Similarities and Differences. In: Geolog-
ical Disposal of Carbon Dioxide and Radioactive Waste: A Comparative Assess-
ment. F. L. Toth, (ed.). Springer Netherlands, Dordrecht, pp. 295 – 315. ISBN: 978-
90-481-8711-9, 978 – 90 – 481 – 8712 – 6.
REN21 (2013)� Renewables 2013 Global Status Report. Renewable Energy Policy
Network for the 21st Century, Paris, France.
Restuti D�, and A� Michaelowa (2007)� The economic potential of bagasse cogen-
eration as CDM projects in Indonesia. Energy Policy 35, 3952 – 3966.
Réveillère A�, J� Rohmer, and J�-C� Manceau (2012)� Hydraulic barrier design and
applicability for managing the risk of CO
2
leakage from deep saline aquifiers.
International Journal of Greenhouse Gas Control 9, 62 – 71.
Riahi A�, F� Dentener, D� Gielen, A� Grubler, J� Jewell, Z� Klimont, V� Krey, D�
McCollum, S� Pachauri, B� Rao, B� van Ruijven, D� P� van Vuuren, and C� Wil-
son (2012)� Energy Pathways for Sustainable Development. In: Global Energy
Assessment: Toward a Sustainable Future. L. Gomez-Echeverri, T. B. Johansson,
N. Nakicenovic, A. Patwardhan, (eds.). International Institute for Applied Sys-
tems Analysis and Cambridge University Press, Laxenburg, Austria; Cambridge,
UK & New York, USA.
Riahi K�, E� Kriegler, N� Johnson, C� Bertram, M� den Elzen, E� Jiyong, M�
Schaeffer, J� Edmonds, M� Isaac, V� Krey, T� Longden, G� Luderer, A�
Méjean, D� McCollum, S� Mima, H� Turton, D� van Vuuren, K� Wada, V�
Bosetti, P� Capros, P� Criqui, and M� Kainuma (2013)� Locked into Copenha-
gen Pledges — Implications of short-term emission targets for the cost and fea-
sibility of long-term climate goals. Technological Forecasting & Social Change.
doi: http: / / dx.doi.org / 10.1016 / j.techfore.2013.09.016.
Roberts B� P�, and C� Sandberg (2011)� The Role of Energy Storage in Devel-
opment of Smart Grids. Proceedings of the IEEE 99, 1139 – 1144. doi:
10.1109 / JPROC.2011.2116752, ISSN: 0018-9219.
Roberts J� J�, R� A� Wood, and R� S� Haszeldine (2011)� Assessing the health risks
of natural CO
2
seeps in Italy. Proceedings of the National Academy of Sciences
108, 16545 – 16548. doi: 10.1073 / pnas.1018590108.
Rockstrom J�, W� Steffen, K� Noone, A� Persson, F� S� Chapin, E� Lambin, T� M�
Lenton, M� Scheffer, C� Folke, H� J� Schellnhuber, B� Nykvist, C� A� de Wit, T�
Hughes, S� van der Leeuw, H� Rodhe, S� Sorlin, P� K� Snyder, R� Costanza,
U� Svedin, M� Falkenmark, L� Karlberg, R� W� Corell, V� J� Fabry, J� Hansen, B�
Walker, D� Liverman, K� Richardson, P� Crutzen, and J� Foley (2009)� Plan-
etary Boundaries: Exploring the Safe Operating Space for Humanity. Ecology
and Society 14. ISSN: 1708-3087.
Rogelj J�, D� McCollum, B� O’Neill, and K� Riahi (2013)� 2020 emissions levels
required to limit warming to below 2 °C. Nature Climate Change 3, 405 – 412.
doi: 10.1038 / nclimate1758.
Rogge K� S�, M� Schneider, and V� H� Hoffmann (2011)� The innovation impact of
the EU Emission Trading System — Findings of company case studies in the Ger-
man Power Sector. Ecological Economics 70, 513 – 523.
Rogner H�-H� (2010)� Nuclear power and sustainable development. Journal of
International Affairs 64, 137 – 163.
Rogner H�-H� (2012a)� The economics of nuclearpower: Past, present and future
aspects. Woodhead Publishing Series in Energy. In: Infrastructure and method-
ologies for the justification of nuclear power programmes. A. Alonson, (ed.),
Woodhead Publishing, Cambridge, UK, pp. 502 – 548.
Rogner H�-H� (2012b)� Green Growth and Nuclear Energy. Ifo Institute, Munich,
Germany.
Rogner H� (2013)� World outlook for nuclear power. Energy Strategy Reviews 1,
291 – 295.
Rogner H�, R� F� Aguilera, C� L� Archer, Bertani, R�, Bhattacharya, S� C�, Dus-
seault, M� B�, Gagnon, L�, and Yakushev, V� (2012)� Chapter 7: Energy
Resources and Potentials; Global Energy Assessment — Toward a Sustainable
Future. Global Energy Assessment. In: Global Energy Assessment — Toward a
Sustainable Future. GEA, (ed.), Cambridge University Press, Cambridge UK and
New York, NY, USA and the International Institute for Applied Systems Analysis,
Laxenburg, Austri, ISBN: 9781 10700 5198.
Rogowska J�, and J� Namiesnik (2010)� Environmental implications of oil spills
from shipping accidents. Reviews of Environmental Contamination and Toxicol-
ogy 206, 95 – 114.
Romanak K� D�, R� C� Smyth, C� Yang, S� D� Hovorka, M� Rearick, and J� Lu
(2012)� Sensitivity of groundwater systems to CO
2
: Application of a site-specific
analysis of carbonate monitoring parameters at the SACROC CO
2
-enhanced
oil field. International Journal of Greenhouse Gas Control 6, 142 – 152. doi:
http: / / dx.doi.org / 10.1016 / j.ijggc.2011.10.011.
Rooney R� C�, S� E� Bayley, and D� W� Schindler (2012)� Oil sands mining and
reclamation cause massive loss of peatland and stored carbon. Proceedings
of the National Academy of Sciences of the United States of America 109,
4933 – 4937. Available at: http: / / www. scopus. com / inward / record.url?eid=2-
s2.0-84859467402&partnerID=40&md5=c81a6a9b0ed4cdf9705e33017
2bd1364.
Rose S�, P� Jaramillo, M� J� Small, I� Grossmann, and J� Apt (2012)� Quantifying
the hurricane risk to offshore wind turbines. Proceedings of the National Acad-
emy of Sciences. doi: 10.1073 / pnas.1111769109, ISSN: 0027-8424, 1091 – 6490.
Rosner R�, and S� Goldberg (2011)� Small Modular Reactors — Key to Future
Nuclear Power Generation in the U. S. The University of Chicago Press, Chicago,
Illinois.
Roxburgh C�, S� Lund, and J� Piotrowski (2011)� Mapping Global Capital Mar-
kets. McKinsey Global Institute, Chicago. Available at: http: / / www. mckinsey.
com / insights / global_capital_markets / mapping_global_capital_markets_2011.
Rübbelke D�, and S� Vögele (2011)� Impacts of climate change on European criti-
cal infrastructures: The case of the power sector. Environmental Science & Policy
14, 53 – 63. doi: 10.1016 / j.envsci.2010.10.007, ISSN: 1462-9011.
Rubin E� S� (2012)� Understanding the pitfalls of CCS cost estimates. International
Journal of Greenhouse Gas Control 10, 181 – 190.
Rubin E�, S� Yeh, M� Antes, M� Berkenpas, and J� Davison (2007)� Use of experi-
ence curves to estimate the future cost of power plants with CO
2
capture. Inter-
national Journal of Greenhouse Gas Control 1, 188 – 197. doi: 10.1016 / s1750-
5836(07)00016-3, ISSN: 1750-5836.
Rückerl R�, A� Schneider, S� Breitner, J� Cyrys, and A� Peters (2011)� Health
effects of particulate air pollution: A review of epidemiological evidence. Inha-
lation Toxicology 23, 555 – 592.
Ruiz-Romero S�, A� Colmenar-Santos, and M� Castro Gil (2012)� EU plans for
renewable energy. An Application to the Spanish case. Renewable Energy 43,
322 – 330.

591591
Energy Systems
7
Chapter 7
Ryerson T� B�, A� E� Andrews, W� M� Angevine, T� S� Bates, C� A� Brock, B� Cairns,
R� C� Cohen, O� R� Cooper, J� A� De Gouw, F� C� Fehsenfeld, R� A� Ferrare,
M� L� Fischer, R� C� Flagan, A� H� Goldstein, J� W� Hair, R� M� Hardesty, C� A�
Hostetler, J� L� Jimenez, A� O� Langford, E� McCauley, S� A� McKeen, L� T�
Molina, A� Nenes, S� J� Oltmans, D� D� Parrish, J� R� Pederson, R� B� Pierce,
K� Prather, P� K� Quinn, J� H� Seinfeld, C� J� Senff, A� Sorooshian, J� Stutz,
J� D� Surratt, M� Trainer, R� Volkamer, E� J� Williams, and S� C� Wofsy (2013)�
The 2010 California Research at the Nexus of Air Quality and Climate Change
(CalNex) field study. Journal of Geophysical Research D: Atmospheres 118,
5830 – 5866. Available at: http: / / www. scopus. com / inward / record.url?eid=2-
s2.0-84875876234&partnerID=40&md5=b34bc6d3bacb2dfc1a4e327cf
e9a6620.
Sáenz de Miera G�, P� del Río González, and I� Vizcaíno (2008)� Analysing the
Impact of Renewable Electricity Support Schemes on Power Prices: The Case of
Wind Electricity in Spain. Energy Policy 36, 3345 – 3359.
Sagan S� D� (2011)� The causes of nuclear weapons proliferation. Annual
Review of Political Science 14, 225 – 244. Available at: http: / / www. scopus.
com / inward / record.url?eid=2-s2.0-79955949040&partnerID=40&md5=a53c9f
e0cb5f3e6b2a071b3afd868b06.
Saghafi A� (2012)� A Tier 3 method to estimate fugitive gas emissions from surface
coal mining. International Journal of Coal Geology 100, 14 – 25. doi: 10.1016 / j.
coal.2012.05.008, ISSN: 0166-5162.
Sathaye J� A�, L� L� Dale, P� H� Larsen, G� A� Fitts, K� Koy, S� M� Lewis, and A� F� P�
de Lucena (2013)� Estimating impacts of warming temperatures on Cali-
fornia’s electricity system. Global Environmental Change 23, 499 – 511. doi:
10.1016 / j.gloenvcha.2012.12.005, ISSN: 0959-3780.
Sathaye J�, O� Lucon, A� Rahman, J� Christensen, F� Denton, J� Fujino, G� Heath,
S� Kadner, M� Mirza, H� Rudnick, A� Schlaepfer, and A� Shmakin (2011)�
Renewable Energy in the Context of Sustainable Development. In: IPCC Special
Report on Renewable Energy Sources and Climate Change Mitigation. Prepared
by Working Group III of the Intergovernmental Panel on Climate Change [O.
Edenhofer, R. Pichs-Madruga, Y. Sokona, K. Seyboth, P. Matschoss, S. Kadner,
T. Zwickel, P. Eickemeier, G. Hansen, S. Schlömer, C. von Stechow (eds.)]. Cam-
bridge University Press, Cambridge, United Kingdom and New York, NY, USA.
Sathre R�, M� Chester, J� Cain, and E� Masanet (2012)� A framework for environ-
mental assessment of CO
2
capture and storage systems. Energy 37, 540 – 548.
Sato K�, S� Mito, T� Horie, H� Ohkuma, H� Saito, and J� Watanabe (2011)� Moni-
toring and simulation studies for assessing macro- and meso-scale migration
of CO
2
sequestered in an onshore aquifer: Experiences from the Nagaoka pilot
site, Japan. International Journal of Greenhouse Gas Control 5, 125 – 137.
Sauer U�, C� Schütze, C� Leven, S� Schlömer, and P� Dietrich (2013)� An inte-
grative hierarchical monitoring approach applied at a natural analogue site to
monitor CO
2
degassing areas. Acta Geotechnica, 1 – 7. Available at: http: / / link.
springer.com / article / 10.1007 / s11440-013-0224-9.
Schaeffer R�, A� S� Szklo, A� F� Pereira de Lucena, B� S� Moreira Cesar Borba, L� P�
Pupo Nogueira, F� P� Fleming, A� Troccoli, M� Harrison, and M� S� Boula-
hya (2012)� Energy sector vulnerability to climate change: A review. Energy 38,
1 – 12. doi: 10.1016 / j.energy.2011.11.056, ISSN: 0360-5442.
Scheffknecht G�, L� Al-Makhadmeh, U� Schnell, and J� Maier (2011)� Oxy-fuel
coal combustion--A review of the current state-of-the-art. International Journal
of Greenhouse Gas Control 5, 16 – 35. doi: 10.1016 / j.ijggc.2011.05.020, ISSN:
1750-5836.
Schenk C� J� (2012)� An Estimate of Undiscovered Conventional Oil and Gas
Resources of the World, 2012. United States Geological Survey. Available at:
http: / / pubs.usgs.gov / fs / 2012 / 3042 / fs2012-3042.pdf.
Schloemer S�, M� Furche, I� Dumke, J� Poggenburg, A� Bahr, C� Seeger, A� Vidal,
and E� Faber (2013)� A review of continuous soil gas monitoring related to
CCS — Technical advances and lessons learned. Applied Geochemistry 30,
148 – 160.
Schneider E�, and Sailor (2008)� Long-Term Uranium Supply Estimates. Nuclear
Technology 162.
Schnelzer M�, G� P� Hammer, M� Kreuzer, A� Tschense, and B� Grosche (2010)�
Accounting for smoking in the radon-related lung cancer risk among German
uranium miners: Results of a nested case-control study. Health Physics 98,
20 – 28. Available at: http: / / www. scopus. com / inward / record.url?eid=2-s2.0-
73449122707&partnerID=40&md5=7a80dce700bab4dadbda8d0a0e1a105a.
Scholes R�, and J� Settele (2014)� Terrestial and inland water systems. In: Climate
Change 2013: Impacts, Adaptation, and Vulnerability. Contribution of Working
Group II to the Fifth Assessment Report of the Intergovernmental Panel on Cli-
mate Change. Cambridge University Press, Cambridge, UK, and New York, NY,
USA.
Schwenk-Ferrero A� (2013a)� German Spent Nuclear Fuel Legacy: Characteristics
and High-Level Waste Management Issues. Science and Technology of Nuclear
Installations 2013. doi: http: / / dx.doi.org / 10.1155 / 2013 / 293792.
Schwenk-Ferrero A� (2013b)� German spent nuclear fuel legacy: Characteris-
tics and high-level waste management issues. Science and Technology of
Nuclear Installations 2013. Available at: http: / / www. hindawi. com / jour-
nals / stni / 2013 / 293792 / .
Scott V�, S� Gilfillan, N� Markusson, H� Chalmers, and R� S� Haszeldine (2013)�
Last chance for carbon capture and storage. Nature Climate Change 3,
105 – 111.
Scudder T� (2005)� The Future of Large Dams — Dealing with Social, Environmental,
Institutional and Political Costs. Earthscan, London, ISBN: 1-84407-155-3.
Sensfuß F�, M� Ragwitz, and M� Genoese (2008)� The merit-order effect: A
detailed analysis of the price effect of renewable electricity generation on spot
market prices in Germany. Energy Policy 36, 3086 – 3094.
Sermage-Faure C�, D� Laurier, S� Goujon-Bellec, M� Chartier, A� Guyot-
Goubin, J� Rudant, D� Hémon, and J� Clavel (2012)� Childhood leukemia
around French nuclear power plants — The Geocap study, 2002 – 2007. Inter-
national Journal of Cancer 131, E769 – E780. Available at: http: / / www. scopus.
com / inward / record.url?eid=2-s2.0-84863199908&partnerID=40&md5=e8137
46ff34206a2dbb238a633d73d32.
Sevcikova M�, H� Modra, A� Slaninova, and Z� Svobodova (2011)� Met-
als as a cause of oxidative stress in fish: A review. Veterinarni Medicina 56,
537 – 546. Available at: http: / / www. scopus. com / inward / record.url?eid=2-s2.0-
84855743358&partnerID=40&md5=4c1592f3ff802462b4d086c807c1bc79.
Shackley S�, D� Reiner, P� Upham, H� de Coninck, G� Sigurthorsson, and J�
Anderson (2009)� The acceptability of CO
2
capture and storage (CCS) in
Europe: An assessment of the key determining factors: Part 2. The social accept-
ability of CCS and the wider impacts and repercussions of its implementation.
International Journal of Greenhouse Gas Control 3, 344 – 356. doi: 10.1016 / j.
ijggc.2008.09.004, ISSN: 1750-5836.

592592
Energy Systems
7
Chapter 7
Shackley S�, and M� Thompson (2012)� Lost in the mix: Will the technologies of
carbon dioxide capture and storage provide us with a breathing space as we
strive to make the transition from fossil fuels to renewables? Climatic Change
110, 101 – 121.
Shindell D�, J� C� I� Kuylenstierna, E� Vignati, R� van Dingenen, M� Amann, Z�
Klimont, S� C� Anenberg, N� Muller, G� Janssens-Maenhout, F� Raes, J�
Schwartz, G� Faluvegi, L� Pozzoli, K� Kupiainen, L� Höglund-Isaksson, L�
Emberson, D� Streets, V� Ramanathan, K� Hicks, N� T� K� Oanh, G� Milly,
M� Williams, V� Demkine, and D� Fowler (2012)� Simultaneously Mitigating
Near-Term Climate Change and Improving Human Health and Food Security.
Science 335, 183 – 189. doi: 10.1126 / science.1210026.
Shrestha R� M�, and S� Pradhan (2010)� Co-benefits of CO
2
emission reduction in a
developing country. Energy Policy 38, 2586 – 2597.
Siirila E� R�, A� K� Navarre-Sitchler, R� M� Maxwell, and J� E� McCray (2012)�
A quantitative methodology to assess the risks to human health from CO
2
leakage into groundwater. Advances in Water Resources 36, 146 – 164. doi:
10.1016 / j.advwatres.2010.11.005, ISSN: 03091708.
De Silva P� N� K�, P� G� Ranjith, and S� K� Choi (2012)� A study of methodologies
for CO
2
storage capacity estimation of coal. Fuel 92, 1 – 15. doi: 10.1016 / j.
fuel.2011.07.010, ISSN: 0016-2361.
Simons A�, and C� Bauer (2012)� Life cycle assessment of the European pressur-
ized reactor and the influence of different fuel cycle strategies. Proceedings of
the Institution of Mechanical Engineers, Part A: Journal of Power and Energy
226, 427 – 444.
Sims R�, P� Mercado, W� Krewitt, G� Bhuyan, D� Flynn, H� Holttinen, G� Jan-
nuzzi, S� Khennas, Y� Liu, M� O’Malley, L� J� Nilsson, J� Ogden, K� Ogimoto,
H� Outhred, � Ulleberg, and F� van Hulle (2011)� Integration of Renewable
Energy into Present and Future Energy Systems. In: Special Report on Renew-
able Energy Sources and Climate Change Mitigation [O. Edenhofer, R. Pichs-
Madruga, Y. Sokona, K. Seyboth, P. Matschoss, S. Kadner, T. Zwickel, P. Eickemeier,
G. Hansen, S. Schlömer, C. von Stechow (eds.)]. Cambridge University Press,
Cambridge, UK and New York, NY, USA, pp. 1076. ISBN: 978 – 1-107 – 60710 – 1.
Sims R�, R� Schock, A� Adegbululgbe, J� Fenhann, I� Konstantinaviciute, W�
Moomaw, H� Nimir, B� Schlamadinger, J� Torres-Martínez, C� Turner, Y�
Uchiyama, S� Vuori, N� Wamukonya, and X� Zhang (2007)� Energy Supply.
In: Climate Change 2007: Mitigation. Contribution of Working Group III to the
Fourth Assessment Report of the Intergovernmental Panel on Climate Change
[B. Metz, O. R. Davidson, P. R. Bosch, R. Dave, L. A. Meyer (eds.)].Cambridge, UK
and New York, NY, USA.
Singh B�, A� H� Stromman, and E� G� Hertwich (2012)� Environmental Damage
Assessment of Carbon Capture and Storage. Journal of Industrial Ecology 16,
407 – 419.
Singh B�, A� H� Strømman, and E� G� Hertwich (2011)� Comparative life cycle
environmental assessment of CCS technologies. International Journal of Green-
house Gas Control 5, 911 – 921.
Sjoberg L�, and B� M� Drottz-Sjoberg (2009)� Public risk perception of nuclear
waste. International Journal of Risk Assessment and Management 11, 248 – 280.
SKB (2011)� Long-Term Safety for the Final Repository for Spent Nuclear Fuel at
Forsmark. Swedish Nuclear Fuel and Waste Management Co, Stockholm, Swe-
den.
Skipperud L�, and G� Strømman (2013)� Environmental impact assessment of
radionuclide and metal contamination at the former U sites Taboshar and Dig-
mai, Tajikistan. Journal of Environmental Radioactivity 123, 50 – 62.
Skipperud L�, G� Strømman, M� Yunusov, P� Stegnar, B� Uralbekov, H� Tilloboev,
G� Zjazjev, L� S� Heier, B� O� Rosseland, and B� Salbu (2013)� Environmental
impact assessment of radionuclide and metal contamination at the former U
sites Taboshar and Digmai, Tajikistan. Journal of Environmental Radioactivity
123, 50 – 62. Available at: http: / / www. scopus. com / inward / record.url?eid=2-
s2.0-84878630268&partnerID=40&md5=089624d2ccb2064227287b34
7da76619.
Smith K�, K� Balakrishnan, C� Butler, Z� Chafe, I� Fairlie, P� Kinney, T� Kjellstrom,
D� L� Mauzerall, T� McKone, A� McMichael, and M� Schneider (2012a)�
Chapter 4 — Energy and Health. In: Global Energy Assessment — Toward a Sus-
tainable Future. Cambridge University Press, Cambridge, pp. 255 – 324.
Smith, and etal� (2013)� How much land based greenhouse gas mitigation can be
achieved without compromising food security and environmental goals? Global
Change Biology. doi: 10.1111 / gcb.12160.
Smith K�, and E� Haigler (2008)� Co-benefits of climate mitigation and health
protection in energy systems: Scoping methods. Annual Review of Public
Health 29, 11 – 25. Available at: http: / / ehs.sph.berkeley.edu / krsmith / publica-
tions / 2008 %20pubs / Smith-Haigler%20ARPH%2008.pdf.
Smith K�, A� R� Mosier, P� J� Crutzen, and W� Winiwarter (2012b)� The role of N
2
O
derived from crop-based biofuels, and from agriculture in general, in Earth’s
climate. Philosophical Transactions of the Royal Society B: Biological Sciences
367, 1169 – 1174. doi: 10.1098 / rstb.2011.0313.
Sokona, Y�, Y� Mulugetta, and H� Gujba (2012)� Widening energy access in Africa:
Towards energy transition. Energy Policy 47, 3 – 10. doi: dx.doi.org / 10.1016 / j.
enpol.2012.03.040.
Solli C�, A� Stromman, and E� Hertwich (2006)� Fission or fossil: Life cycle assess-
ment of hydrogen production. Proceedings of the IEEE 94, 1785 – 1794.
Song Y�, and S� Liu (2012)� Coalbed methane genesis, occurrence and accumula-
tion in China. Petroleum Science 9.
Sorrell S�, J� Speirs, R� Bentley, R� Miller, and E� Thompson (2012)� Shaping
the global oil peak: A review of the evidence on field sizes, reserve growth,
decline rates and depletion rates. Energy 37, 709 – 724. doi: 10.1016 / j.
energy.2011.10.010, ISSN: 0360-5442.
Sovacool B� K� (2009)� Rejecting Renewables: The Socio-technical Impediments to
Renewable Electricity in the United States. Energy Policy 37, 4500 – 4513. doi:
http: / / dx.doi.org / 10.1016 / j.enpol.2009.05.073.
Spalding-Fecher R�, A� N� Achanta, P� Erickson, E� Haites, M� Lazarus, N� Pahuja,
N� Pandey, S� Seres, and R� Tewari (2012)� Assessing the Impact of the Clean
Development Mechanism. CDM Policy Dialogue, Luxembourg,
Spiecker S�, V� Eickholt, and C� Weber (2011)� The relevance of CCS for the future
power market. In: 2011 IEEE Power and Energy Society General Meeting. IEEE.
1 – 8 pp. doi: 10.1109 / PES.2011.6039754, ISBN: 978 – 1-4577 – 1000 – 1.
Spycher B� D�, M� Feller, M� Zwahlen, M� Röösli, N� X� von der Weid, H� Hen-
gartner, M� Egger, and C� E� Kuehni (2011)� Childhood cancer and nuclear
power plants in Switzerland: A census-based cohort study. International
Journal of Epidemiology 40, 1247 – 1260. Available at: http: / / www. scopus.
com / inward / record.url?eid=2-s2.0-80053295088&partnerID=40&md5=3d313
55810ce87b1b83f4142d803017e.
Von Stechow C�, J� Watson, and B� Praetorius (2011)� Policy Incentives for Car-
bon Capture and Storage Technologies in Europe: A Qualitative Multi-criteria
Analysis. Global Environmental Change: Human and Policy Dimensions 21,
346 – 357.

593593
Energy Systems
7
Chapter 7
Steinberg L� J�, H� Sengul, and A� M� Cruz (2008)� Natech risk and management:
an assessment of the state of the art. Natural Hazards 46, 143 – 152.
Steinke F�, P� Wolfrum, and C� Hoffmann (2013)� Grid vs. storage in a 100 %
renewable Europe. Renewable Energy 50, 826 – 832. doi: 10.1016 / j.
renene.2012.07.044, ISSN: 0960-1481.
Stephenson T�, J� E� Valle, and X� Riera-Palou (2011)� Modeling the relative
GHG emissions of conventional and shale gas production. Environmental Sci-
ence and Technology 45, 10757 – 10764. Available at: http: / / www. scopus.
com / inward / record.url?eid=2-s2.0-83455262435&partnerID=40&md5=2da1d
9a87db84d74c487e5ea0d51550d.
Sterner M� (2009)� Bioenergy and Renewable Power Methane in Integrated 100 %
Renewable Energy Systems — Limiting Global Warming by Transforming Energy
Systems. University of Kassel, Kassel, Germany.
Stolaroff J� K�, S� Bhattacharyya, C� A� Smith, W� L� Bourcier, P� J� Cameron-
Smith, and R� D� Aines (2012)� Review of Methane Mitigation Technologies
with Application to Rapid Release of Methane from the Arctic. Environmental
Science & Technology 46, 6455 – 6469. doi: 10.1021 / es204686w, ISSN: 0013-
936X.
Strachan N�, R� Hoefnagels, A� Ramirez, M� van den Broek, A� Fidje, K� Espe-
gren, P� Seljom, M� Blesl, T� Kober, and P� E� Grohnheit (2011)� CCS in the
North Sea region: A comparison on the cost-effectiveness of storing CO
2
in
the Utsira formation at regional and national scales. International Journal of
Greenhouse Gas Control 5, 1517 – 1532. doi: 10.1016 / j.ijggc.2011.08.009, ISSN:
1750-5836.
Strietska-Ilina O�, C� Hofmann, M� Durán Haro, and S� Jeon (2011)� Skills for
Green Jobs: A Global View: Synthesis Report Based on 21 Country Studies.
International Labour Office, Skills and Employability Department, Job Creation
and Enterprise Development Department, Geneva. Available at: http: / / www.
ilo. org / wcmsp5 / groups / public / @ed_emp / @ifp_skills / documents / publica-
tion / wcms_156220.pdf.
Su S�, J� Han, J� Wu, H� Li, R� Worrall, H� Guo, X� Sun, and W� Liu (2011)� Fugitive
coal mine methane emissions at five mining areas in China. Atmospheric Envi-
ronment 45, 2220 – 2232. Available at: http: / / www. scopus. com / inward / record.
url?eid=2-s2.0-79953048040&partnerID=40&md5=189ca78d7a8c50776fcbd6
0bb4927737.
Sudhakara Reddy B�, P� Balachandra, and H� Salk Kristle Nathan (2009)� Uni-
versalization of access to modern energy services in Indian households — Eco-
nomic and policy analysis. Energy Policy 37, 4645 – 4657.
Sudo T� (2013)� Integration of low carbon development strategies into develop-
ment cooperation. Global Environmental Research 17, 71 – 78.
Sullivan E� J�, S� Chu, P� H� Stauffer, R� S� Middleton, and R� J� Pawar (2013)� A
method and cost model for treatment of water extracted during geologic CO
2
storage. International Journal of Greenhouse Gas Control 12, 372 – 381.
Sumner J�, L� Bird, and H� Smith (2009)� Carbon Taxes: A Review of Experience
and Policy Design Considerations. National Renewable Energy Laboratory,
Svensson R�, M� Odenberger, F� Johnsson, and L� Strömberg (2004)�
Transportation systems for CO
2
application to carbon capture and storage.
Energy Conversion and Management 45, 2343 – 2353. doi: 10.1016 / j.encon-
man.2003.11.022, ISSN: 0196-8904.
Swart R�, M� Berk, Janssen, E� Kreileman, and R� Leemans (1998)� The safe
landing approach: Risks and trade-offs in climate change. In: Global change
scenarios of the 21st century — Results from the IMAGE 2.1. Model. J. Alcamo,
R. Leemans, E. Kreileman, (eds.), Pergamon / Elsevier, Oxford, pp. 193 – 218.
Tabkhi F�, C� Azzaro-Pantel, L� Pibouleau, and S� Domenech (2008)� A Math-
ematical Framework for Modelling and Evaluating Natural Gas Pipeline Net-
works Under Hydrogen Injection. International Journal of Hydrogen Energy 33,
6222 – 6231.
Tanaka K� (2011)� Review of policies and measures for energy efficiency in industry
sector. Energy Policy 39, 6532 – 6550.
Tavoni M�, E� Kriegler, T� Aboumahboub, K� Calvin, G� De Maere, J� Jewell, T�
Kober, P� Lucas, G� Luderer, D� McCollum, G� Marangoni, K� Riahi, and D�
van Vuuren (2014)� The distribution of the major economies’ effort in the Dur-
ban platform scenarios. Climate Change Economics.
Tchounwou P�, C� Yedjou, A� Patlolla, and D� Sutton (2012)� Heavy Metal Toxic-
ity and the Environment. Experientia Supplementum. In: Molecular, Clinical and
Environmental Toxicology. A. Luch, (ed.), Springer Basel, pp. 133 – 164. ISBN:
978 – 3-7643 – 8339 – 8.
Ten Hoeve J� E�, and M� Z� Jacobson (2012)� Worldwide health effects of the
Fukushima Daiichi nuclear accident. Energy and Environmental Science 5,
8743 – 8757. Available at: http: / / www. scopus. com / inward / record.url?eid=2-
s2.0-84865242434&partnerID=40&md5=79f0208a97352d07bc4345b5e3b
88a69.
Ter Mors E�, M� W� H� Weenig, N� Ellemers, and D� D� L� Daamen (2010)� Effec-
tive communication about complex environmental issues: Perceived quality of
information about carbon dioxide capture and storage (CCS) depends on stake-
holder collaboration. Journal of Environmental Psychology 30, 347 – 357. doi:
10.1016 / j.jenvp.2010.06.001, ISSN: 0272-4944.
Terwel B� W�, F� Harinck, N� Ellemers, and D� D� L� Daamen (2010)� Going beyond
the properties of CO
2
capture and storage (CCS) technology: How trust in stake-
holders affects public acceptance of CCS. International Journal of Greenhouse
Gas Control 5, 181 – 188. doi: http: / / dx.doi.org / 10.1016 / j.ijggc.2010.10.001.
Thomson M�, and D� Infield (2007)� Impact of widespread photovoltaics genera-
tion on distribution systems. IET Renewable Power Generation 1, 33 – 40. doi:
10.1049 / iet-rpg:20060009, ISSN: 1752-1416.
Tirmarche M�, J� Harrison, D� Laurier, E� Blanchardon, F� Paquet, and J� Marsh
(2012)� Risk of lung cancer from radon exposure: Contribution of recently pub-
lished studies of uranium miners. Annals of the ICRP 41, 368 – 377. Available at:
http: / / www. scopus. com / inward / record.url?eid=2-s2.0-84867756884&partnerI
D=40&md5=703c014e489f18d336df49cfc836a46e.
Torvanger A�, A� Grimstad, E� Lindeberg, N� Rive, K� Rypdal, R� Skeie, J�
Fuglestvedt, and P� Tollefsen (2012)� Quality of geological CO
2
storage to
avoid jeopardizing climate targets. Climate Change 114, 245 – 260.
Traber T�, and C� Kemfert (2011)� Gone with the Wind? Electricity Market Prices
and Incentives to Invest in Thermal Power Plants under Increasing Wind Energy
Supply. Energy Economics 33, 249 – 256. doi: 10.1016 / j.eneco.2010.07.002.
Tremblay A�, L� Varfalvy, C� Roehm, and M� Garneau (2005)� Synthesis Green-
house Gas Emissions — Fluxes and Processes. Environmental Science and
Engineering, 637 – 659.
Tubiana M�, E� Feinendegen, C� Yang, and J� M� Kaminski (2009)� The Linear No-
Threshold Relationship Is Inconsistent with Radiation Biologic and Experimen-
tal Data1. Radiology 251, 13 – 22. doi: 10.1148 / radiol.2511080671.
Turton H�, and L� Barreto (2006)� Long-term security of energy supply and climate
change. Energy Policy 34, 2232 – 2250.

594594
Energy Systems
7
Chapter 7
Tyler A�, P� Dale, D� Copplestone, S� Bradley, H� Ewen, C� McGuire, and E� Scott
(2013a)� The radium legacy: Contaminated land and the committed effective
dose from the ingestion of radium contaminated materials. Environment Inter-
national 59, 449 – 455.
Tyler A�, P� Dale, D� Copplestone, S� Bradley, H� Ewen, C� McGuire, and E� M�
Scott (2013b)� The radium legacy: Contaminated land and the commit-
ted effective dose from the ingestion of radium contaminated materials.
Environment International 59, 449 – 455. Available at: http: / / www. scopus.
com / inward / record.url?eid=2-s2.0-84882276659&partnerID=40&md5=23acd
c1ac6369732df4ff7859e8f05fa.
UN Habitat, and GENUS (2009)� Promoting Energy Access for the Urban Poor in
Africa: Approaches and Challenges in Slum Electrification. UN Habitat & Global
Network for Urban Settlements, Nairobi, Kenya.
UNECE (2010a)� United Nations International Framework Classification for Fossil
Energy and Mineral Reserves and Resources 2009. United Nations Economic
Commission for Europe (UNECE), Geneva, Switzerland. Available at: http: / / live.
unece.org / fileadmin / DAM / energy / se / pdfs / UNFC / unfc2009 / UNFC2009_
ES39_e.pdf.
UNECE (2010b)� Best Practice Guidance for Effective Methane Drainage and Use
in Coal Mines. United Nations Economic Commission for Europe, Geneva and
New York, USA.
UNEP (2011)� Towards a Green Economy. Pathways to Sustainable Development
and Poverty Eradication. United Nations Environment Programme, Nairobi,
Kenya, 632 pp. Available at: http: / / www. unep. org / greeneconomy.
UNES (2011)� 2008 Energy Statistics Yearbook. United Nations Department of Eco-
nomic and Social Affairs. Statistics Division, New York, USA.
United Nations (2010)� Report of the Secretary-General’s High-Level Advisory
Group on Climate Change Financing. United Nations, New York. Available at:
http: / / www. un. org / wcm / content / site / climatechange / pages / financeadviso-
rygroup / pid / 13300.
Unruh G� (2002)� Escaping Carbon Lock-in. Energy Policy 30, 317 – 325.
US DOE (2012)� International Energy Outlook 2011. U. S. Energy Information
Administration. Office of Integrated Analysis and Forecasting. U. S. Department
of Energy, Washington, DC.
US DOE (2013a)� International Energy Outlook 2013. U. S. Energy Information
Administration. Office of Integrated Analysis and Forecasting. U. S. Department
of Energy, Washington, DC.
US DOE (2013b)� U. S. Energy Sector Vulnerabilities to Climate Change and
Extreme Weather. U. S. Department of Energy, Washington DC, USA. Available
at: http: / / energy.gov / sites / prod / files / 2013 / 07 / f2 / 20130716-Energy%20Sec-
tor%20Vulnerabilities%20Report.pdf.
US EPA (2006)� Global Mitigation of Non- CO2 Greenhouse Gases. Office of Atmo-
spheric Programs, United States Environmental Protection Agency, Washington,
DC.
US EPA (2008)� Effects of Climate Change on Energy Production and Use in the
United States. U. S. Climate Change Science Program, Washington DC. Available
at: http: / / science.energy.gov / ~ / media / ber / pdf / Sap_4_5_final_all.pdf.
US EPA (2011)� Draft Plan to Study the Potential Impacts of Hydraulic Fracturing on
Drinking Water Resources. US Environmental Protection Agency, 140 pp. Avail-
able at: http: / / www2. epa. gov / hfstudy / draft-plan-study-potential-impacts-
hydraulic-fracturing-drinking-water-resources-february-7.
Vasco D� W�, A� Rucci, A� Ferretti, F� Novali, R� C� Bissell, P� S� Ringrose, A� S�
Mathieson, and I� W� Wright (2010)� Satellite-based measurements of sur-
face deformation reveal fluid flow associated with the geological storage of
carbon dioxide. Geophys. Res. Lett. 37, L03303. doi: 10.1029 / 2009gl041544,
ISSN: 0094-8276.
Veltman K�, B� Singh, and E� Hertwich (2010)� Human and environmental impact
assessment of postcombustion CO
2
capture focusing on emissions from amine-
based scrubbing solvents to air. Environmental Science & Technology 44,
1496 – 1502.
Verbruggen A�, M� Fischedick, W� Moomaw, T� Weir, A� Nadai, L� J� Nils-
son, J� Nyboer, and J� Sathaye (2010)� Renewable energy costs, poten-
tials, barriers: Conceptual issues. Energy Policy 38, 850 – 861. doi: 10.1016 / j.
enpol.2009.10.036, ISSN: 0301-4215.
Verbruggen A�, W� Moomaw, and J� Nyboer (2011)� Annex I: Glossary, Acronyms,
Chemical Symbols and Prefixes. In: IPCC Special Report on Renewable Energy
Sources and Climate Change Mitigation. Prepared by Working Group III of the
Intergovernmental Panel on Climate Change [O. Edenhofer, R. Pichs-Madruga, Y.
Sokona, K. Seyboth, P. Matschoss, S. Kadner, T. Zwickel, P. Eickemeier, G. Hansen,
S. Schlömer, C. von Stechow (eds.)]. Cambridge University Press, Cambridge,
United Kingdom and New York, NY, USA.
Vergragt P� J�, N� Markusson, and H� Karlsson (2011)� Carbon capture and stor-
age, bio-energy with carbon capture and storage, and the escape from the
fossil-fuel lock-in. Global Environmental Change 21, 282 – 292. doi: 10.1016 / j.
gloenvcha.2011.01.020, ISSN: 0959-3780.
Verones F�, S� Pfister, and S� Hellweg (2013)� Quantifying area changes of inter-
nationally important wetlands due to water consumption in LCA. Environmen-
tal Science and Technology 47, 9799 – 9807. Available at: http: / / www. scopus.
com / inward / record.url?eid=2-s2.0-84883499193&partnerID=40&md5=ecb50
351308b2bec11fa0a5c1906c862.
Versteeg P�, and E� S� Rubin (2011)� A technical and economic assessment of
ammonia-based post-combustion CO
2
capture at coal-fired power plants. Inter-
national Journal of Greenhouse Gas Control 5, 1596 – 1605.
Visschers V�, and M� Siegrist (2012)� Fair play in energy policy decisions: Pro-
cedural fairness, outcome fairness and acceptance of the decision to rebuild
nuclear power plants. Energy Policy 46, 292 – 300.
Van der Vleuten F�, N� Stam, and R� J� van der Plas (2013)� Putting rural energy
access projects into perspective: What lessons are relevant? Energy Policy 61,
1071 – 1078. Available at: http: / / www. scopus. com / inward / record.url?eid=2-
s2.0-84881665681&partnerID=40&md5=b5f3d5406c5bff78f42a213789d
f2e71.
Van der Voet E�, R� Salminen, M� Eckelman, T� Norgate, G� Mudd, R� Hischier, J�
Spijker, M� Vijver, O� Selinus, L� Posthuma, D� de Zwart, D� van de Meent,
M� Reuter, L� Tikana, S� Valdivia, P� Wäger, M� Hauschild, and A� de Koning
(2012)� Environmental Challenges of Anthropogenic Metals Flows and Cycles.
United Nations Environment Programme, Nairobi, Kenya, and Paris, France.
De Vos K�, J� Morbee, J� Driesen, and R� Belmans (2013)� Impact of wind power
on sizing and allocation of reserve requirements. IET Renewable Power Genera-
tion 7, 1 – 9. doi: 10.1049 / iet-rpg.2012.0085.
De Vries B�, D� P� van Vuuren, and M� M� Hoogwijk (2007)� Renewable energy
sources: Their global potential for the first-half of the 21st century at a global
level: An integrated approach. Energy Policy 35, 2590 – 2610. doi: 10.1016 / j.
enpol.2006.09.002, ISSN: 0301-4215.

595595
Energy Systems
7
Chapter 7
Vujic J�, R� M� Bergmann, R� Skoda, and M� Miletic (2012)� Small modular reac-
tors: Simpler, safer, cheaper? Energy 45, 288 – 295.
Van Vuuren D� P�, B� de Vries, B� Eickhout, and T� Kram (2004)� Responses to
technology and taxes in a simulated world. Energy Economics 26, 579 – 601.
doi: 10.1016 / j.eneco.2004.04.027, ISSN: 0140-9883.
Walker S�, and R� Howell (2011)� Life cycle comparison of a wave and tidal energy
device. Proceedings of the Institution of Mechanical Engineers Part M: Journal
of Engineering for the Maritime Environment 225, 325 – 327.
Wall T�, R� Stanger, and S� Santos (2011)� Demonstrations of coal-fired oxy-fuel
technology for carbon capture and storage and issues with commercial deploy-
ment. International Journal of Greenhouse Gas Control 5, Supplement 1,
5 – 15. doi: 10.1016 / j.ijggc.2011.03.014, ISSN: 1750-5836.
Wallquist L�, V� H� M� Visschers, and M� Siegrist (2009)� Lay concepts on CCS
deployment in Switzerland based on qualitative interviews. International Jour-
nal of Greenhouse Gas Control 3, 652 – 657. doi: 10.1016 / j.ijggc.2009.03.005,
ISSN: 1750-5836.
Wallquist L�, V� H� M� Visschers, and M� Siegrist (2010)� Impact of Knowledge
and Misconceptions on Benefit and Risk Perception of CCS. Environmental Sci-
ence & Technology 44, 6557 – 6562. doi: 10.1021 / es1005412.
Walter A�, P� Dolzan, O� Quilodrán, J� G� de Oliveira, C� da Silva, F� Piacente,
and A� Segerstedt (2011)� Sustainability assessment of bio-ethanol produc-
tion in Brazil considering land use change, GHG emissions and socio-economic
aspects. Energy Policy 39, 5703 – 5716. doi: 10.1016 / j.enpol.2010.07.043, ISSN:
0301-4215.
Wan K� K� W�, D� H� W� Li, D� Liu, and J� C� Lam (2011)� Future trends of building
heating and cooling loads and energy consumption in different climates. Build-
ing and Environment 46, 223 – 234.
Wang S�, and P� R� Jaffe (2004)� Dissolution of a mineral phase in potable aquifers
due to CO
2
releases from deep formations; Effect of dissolution kinetics. Energy
Conversion and Management 45, 2833 – 2848. Available at: http: / / www.
scopus. com / inward / record.url?eid=2-s2.0-3142563032&partnerID=40&md5=
6eb9231df90192f957834136c0026482.
Wang D� T�-C�, L� F� Ochoa, and G� P� Harrison (2010)� DG Impact on Investment
Deferral: Network Planning and Security of Supply. IEEE Transactions on Power
Systems 25, 1134 – 1141. doi: 10.1109 / TPWRS.2009.2036361, ISSN: 0885-8950.
Wang F�, T� Ren, S� Tu, F� Hungerford, and N� Aziz (2012)� Implementation of
underground longhole directional drilling technology for greenhouse gas miti-
gation in Chinese coal mines. International Journal of Greenhouse Gas Control
11, 290 – 303. Available at: http: / / www. scopus. com / inward / record.url?eid=2-
s2.0-84867236911&partnerID=40&md5=c7f1563dcc6deab70a395f4cf7d10
97d.
Wang J�, D� Ryan, and E� J� Anthony (2011)� Reducing the Greenhouse Gas Foot-
print of Shale Gas. Energy Policy 39, 8196 – 8199.
Warner E� S�, and G� A� Heath (2012)� Life Cycle Greenhouse Gas Emissions of
Nuclear Electricity Generation. Journal of Industrial Ecology 16, S73 – S92. doi:
10.1111 / j.1530-9290.2012.00472.x, ISSN: 1530-9290.
WCD (2000)� Dams and Development. A New Framework for Decision-Making.
Earthscan, London and Sterling, UK.
Weber C� L�, and C� Clavin (2012)� Life cycle carbon footprint of shale gas: Review
of evidence and implications. Environmental Science and Technology 46,
5688 – 5695. Available at: http: / / www. scopus. com / inward / record.url?eid=2-
s2.0-84861883168&partnerID=40&md5=718bf3d9ab5534fb3ab2a738e0881
c1b.
WEC (2008)� Energy Efficiency Policies around the World: Review and Evalu-
ation. Executive Summary. World Energy Council, London. Available at:
http: / / 89.206.150.89 / documents / energy_efficiency_es_final_online.pdf.
Wei M�, S� Patadia, and D� M� Kammen (2010)� Putting Renewables and Energy
Efficiency to Work: How Many Jobs Can the Clean Energy Industry Generate in
the US? Energy Policy 38, 919 – 931.
Weitzman M� L� (1974)� Prices versus Quantities. Review of Economic Studies 41,
477 – 491.
Weitzman M� L� (2007)� A Review of The Stern Review on the Economics of Climate
Change. Journal of Economic Literature 45, 703 – 724.
Whitaker M� B�, G� A� Heath, J� J� Burkhardt, and C� S� Turchi (2013)� Life Cycle
Assessment of a Power Tower Concentrating Solar Plant and the Impacts of Key
Design Alternatives. Environmental Science & Technology 47, 5896 – 5903. doi:
10.1021 / es400821x, ISSN: 0013-936X.
Whittaker S�, B� Rostron, C� Hawkes, C� Gardner, D� White, J� Johnson, R� Chala-
turnyk, and D� Seeburger (2011)� A decade of CO
2
injection into depleting oil
fields: Monitoring and research activities of the IEA GHG Weyburn-Midale CO
2
Monitoring and Storage Project. Energy Procedia 4, 6069 – 6076. doi: 10.1016 / j.
egypro.2011.02.612, ISSN: 1876-6102.
WHO (2013)� Health Risk Assessment from the Nuclear Accident after the 2011
Great East Japan Earthquake and Tsunami, Based on a Preliminary Dose Estima-
tion. World Health Organization, Geneva, Switzerland, ISBN: 9789241505130
9241505133.
WHO, and UNDP (2009)� The Energy Access in Situation in Developing Countries.
UNDP, New York, USA.
Wigeland R�, T� Bauer, T� Fanning, and E� Morris (2006)� Separations and Trans-
mutation Criteria to Improve Utilization of a Geologic Repository. Nuclear Tech-
nology 154.
Wilkinson R� (2011)� Eastern Australian coalbed methane supply rivals western off-
shore conventional resource. Oil and Gas Journal 109, 56 – 64.
Williams J� H�, A� DeBenedictis, R� Ghanadan, A� Mahone, J� Moore, W� R� Mor-
row Iii, S� Price, and M� S� Torn (2012)� The technology path to deep green-
house gas emissions cuts by 2050: The pivotal role of electricity. Science 335,
53 – 59. doi: 10.1126 / science.1208365, ISSN: 00368075.
Wilson C�, A� Grubler, V� Krey, and K� Riahi (2013)� Future capacity growth of
energy technologies: Are scenarios consistent with historical evidence? Climatic
Change 118, 381 – 395.
Wilwerding J� (2011)� Fugitive emissions from valves: Update: “Leak-free”
involves monitoring and new equipment technology. Hydrocarbon Process-
ing 90. Available at: http: / / www. scopus. com / record / display.url?eid=2-s2.0-
79958199088&origin=inward&txGid=E22C3BA38F75A3546366A9F10ECC
ACB6.N5T5nM1aaTEF8rE6yKCR3A%3a138.
Winzer C� (2012)� Conceptualizing Energy Security. Energy Policy 46, 36 – 48. doi:
10.1016 / j.enpol.2012.02.067.
Wise M�, G� Kyle, J� Dooley, and S� Kim (2010)� The impact of electric passen-
ger transport technology under an economy-wide climate policy in the United
States: Carbon dioxide emissions, coal use, and carbon dioxide capture and
storage. International Journal of Greenhouse Gas Control 4 4, 301 – 308. doi:
10.1016 / j.ijggc.2009.09.003.

596596
Energy Systems
7
Chapter 7
Wiser R�, Z� Yang, M� Hand, O� Hohmeyer, D� Infield, P� H� Jensen, V� Nikolaev,
M� O’Malley, G� Sinden, and A� Zervos (2011)� Wind Energy. In: IPCC Special
Report on Renewable Energy Sources and Climate Change Mitigation. Prepared
by Working Group III of the Intergovernmental Panel on Climate Change [O.
Edenhofer, R. Pichs-Madruga, Y. Sokona, K. Seyboth, P. Matschoss, S. Kadner,
T. Zwickel, P. Eickemeier, G. Hansen, S. Schlömer, C. von Stechow (eds.)]. Cam-
bridge University Press, Cambridge, United Kingdom and New York, NY, USA.
Wissner M� (2011)� The Smart Grid — A saucerful of secrets? Applied Energy 88,
2509 – 2518.
Wong-Parodi G�, and I� Ray (2009)� Community perceptions of carbon sequestra-
tion: insights from California. Environmental Research Letters 4, 034002. doi:
10.1088 / 1748-9326 / 4 / 3 / 034002, ISSN: 1748-9326.
Woo C� K�, J� Horowitz, J� Moore, and A� Pacheco (2011)� The impact of wind
generation on the electricity spot-market price level and variance: The Texas
experience. Energy Policy 39, 3939 – 3944. doi: 16 / j.enpol.2011.03.084.
World Bank (2011a)� Climate Change Impacts on Energy Systems: Key Issues for
Energy Sector Adaptation. Energy Sector Management Assistance Program; The
World Bank Group, Washington, DC, USA, 224 pp.
World Bank (2011b)� Mobilizing Climate Finance. Paper Prepared at the Request of
G20 Finance Ministers. World Bank, Washington DC. Available at: http: / / climat-
echange.worldbank.org / content / mobilizing-climate-finance.
World Economic Forum 2011 (2011)� Scaling Up Low-Carbon Infrastructure
Investments in Developing Countries. World Economic Forum, Geneva, Swit-
zerland. Available at: The Critical Mass Initiative Working Report as of January
2011.
World Nuclear Association (2013)� Mixed Oxide (MOX) Fuel. Available at:
http: / / www. world-nuclear. org / info / inf29.html.
Würzburg K�, X� Labandeira, and P� Linares (2013)� Renewable generation and
electricity prices: Taking stock and new evidence for Germany and Austria.
Energy Economics. doi:10.1016 / j.eneco.2013.09.011.
WWF-UK (2011)� Green Game-Changers. Insights for Mainstreaming Business
Innovation. WWF and Verdantix, London. Available at: http: / / assets.wwf.org.
uk / downloads / 1121_1_wwf_greengamechange_aw_web__2_.pdf.
Yamaguchi M� (2012)� Climate Change Mitigation. A Balanced Approach to
Climate Change. Spinger, London, Heidelberg, New York, Dordrecht. ISBN:
978 – 1-4471 – 4227 – 0.
Yang C�, and J� Ogden (2007)� Determining the Lowest-cost Hydrogen Delivery
Mode. International Journal of Hydrogen Energy 32, 268 – 286.
Yeh S�, S� Jordaan, A� Brandt, M� Turetsky, S� Spatari, and D� Keith (2010)� Land
use greenhouse gas emissions from conventional oil production and oil sands.
Environmental Science and Technology 44, 8766 – 8772.
Yeh S�, and E� Rubin (2010)� Uncertainties in technology experience curves for
energy-economic models. The National Academies, Washington, DC.
Yim M� S�, and J� Li (2013)� Examining relationship between nuclear prolifera-
tion and civilian nuclear power development. Progress in Nuclear Energy 66,
108 – 114. Available at: http: / / www. scopus. com / inward / record.url?eid=2-s2.0-
84876759547&partnerID=40&md5=a2cfa5adb27ef81d99253980074f24d1.
Yoo B�-Y�, S�-G� Lee, K� Rhee, H�-S� Na, and J�-M� Park (2011)� New CCS sys-
tem integration with CO
2
carrier and liquefaction process. Energy Procedia 4,
2308 – 2314. doi: 10.1016 / j.egypro.2011.02.121, ISSN: 1876-6102.
York R� (2012)� Do alternative energy sources displace fossil fuels? Nature Climate
Change 2, 441 – 443.
Young P� S�, J� J� Cech Jr, and L� C� Thompson (2011)� Hydropower-related pulsed-
flow impacts on stream fishes: A brief review, conceptual model, knowl-
edge gaps, and research needs. Reviews in Fish Biology and Fisheries 21,
713 – 731. Available at: http: / / www. scopus. com / inward / record.url?eid=2-s2.0-
81255149424&partnerID=40&md5=f9ed60b9bd82ee62f1b6470614b738f5.
Yuan J� H�, and T� P� Lyon (2012)� Promoting global CSS RDD&D by stronger
U. S.-China collaboration. Renewable and Sustainable Energy Reviews 16,
6746 – 6769.
Zafirakis D�, K� Chalvatzis, G� Baiocchi, and G� Daskalakis (2013)� Modeling of
financial incentives for investments in energy storage systems that promote the
large-scale integration of wind energy. Applied Energy 105, 138 – 154.
Zavodov K� (2012)� Renewable energy investment and the clean development
mechanism. Energy Policy 40, 81 – 89.
ZEP (2011a)� The Cost of CO
2
Transport. Zero Emissions Platform, Brussels, Belgium,
53 pp.
ZEP (2011b)� The Costs of CO
2
Capture, Transport and Storage. European Technol-
ogy Platform for Zero Emission Fossil Fuel Power Plants. Available at: www.
zeroemissionsplatform. eu / library / publication / 165-zep-cost-report-summary.
html.
Zhai H�, Rubin, E� S�, and P� L� Versteeg (2011)� Water use at pulverized coal
power plants with postcombustion carbon capture and storage. Environmental
Science & Technology 45, 2479 – 2485. doi: 10.1021 / es1034443.
Zhang M�, and S� Bachu (2011)� Review of integrity of existing wells in relation
to CO
2
geological storage: What do we know? International Journal of Green-
house Gas Control 5, 826 – 840. doi: 10.1016 / j.ijggc.2010.11.006, ISSN: 1750-
5836.
Zhang X� L�, E� Martinot, and S� Y� Chang (2012)� Renewable energy in China: An
integrated technology and policy perspective. Energy Policy 51, 1 – 6.
Zhang Y�, G� Wei, Z� Zhang, T� Jia, and D� Yang (2013)� Study of hydraulic slotting
technology for rapid excavation of coal seams with severe coal and gas out-
burst potentials. Journal of Applied Sciences 13, 3483 – 3489.
Zhang Z�, Z� Wu, D� Wang, Y� Xu, Y� Sun, F� Li, and Y� Dong (2009)� Current sta-
tus and technical description of Chinese 2x250 MWth HTR-PM demonstration
plant. Nuclear Engineering and Design 239, 1212 – 1219.
Zheng L�, J� Apps, N� Spycher, J� Birkholzer, Y� Kharaka, J� Thordsen, S� Beers,
W� Herkelrath, E� Kakouros, and R� Trautz (2012)� Geochemical modeling
of changes in shallow groundwater chemistry observed during the MSU-ZERT
CO
2
injection experiment. International Journal of Greenhouse Gas Control 7,
202 – 217.
Ziv G�, E� Baran, I� Rodríguez-Iturbe, and S� A� Levin (2012)� Trading-off fish bio-
diversity, food security, and hydropower in the Mekong River Basin. Proceed-
ings of the National Academy of Sciences of the United States of America 109,
5609 – 5614.
Al-Zoughool M�, and D� Krewski (2009)� Health effects of radon: a review of the
literature. International Journal of Radiation Biology 85, 57 – 69.
Zuser A�, and H� Rechberger (2011)� Considerations of resource availability in
technology development strategies: The case study of photovoltaics. Resources,
Conservation and Recycling 56, 56 – 65. Available at: http: / / www. scopus.
com / inward / record.url?eid=2-s2.0-80053549460&partnerID=40&md5=1a215
9a879459e86fb86c93f638f5245.

597597
Energy Systems
7
Chapter 7
Zvinavashe E�, H� Elbersen, M� Slingerland, S� Kolijn, and J� Sanders (2011)�
Cassava for food and energy: exploring potential benefits of processing of cas-
sava into cassava flour and bioenergy at farmstead and community levels in
rural Mozambique. Biofuels, Bioproducts and Biorefining 5, 151 – 164.
Van der Zwaan B�, L� Carmona, and T� Kober (2013)� Potential for renewable
energy jobs in the Middle East. Energy Policy 60, 296 – 304.
