
169
Point of Departure
Coordinating Lead Authors:
Virginia R. Burkett (USA), Avelino G. Suarez (Cuba)
Lead Authors:
Marco Bindi (Italy), Cecilia Conde (Mexico), Rupa Mukerji (India), Michael J. Prather (USA),
Asuncion Lera St. Clair (Norway), Gary W. Yohe (USA)
Contributing Authors:
Sarah Cornell (Sweden), Katharine J. Mach (USA), Michael D. Mastrandrea (USA), Jan Minx
(Germany), Riccardo Pravettoni (Norway), Kristin Seyboth (USA), Christoph von Stechow
(Germany)
Review Editors:
Hervé Le Treut (France), Jean Palutikof (Australia)
Volunteer Chapter Scientist:
Emmanuel Nyambod (Cameroon)
This chapter should be cited as:
Burkett
, V.R., A.G. Suarez, M. Bindi, C. Conde, R. Mukerji, M.J. Prather, A.L. St. Clair, and G.W. Yohe, 2014: Point
of departure. In: Climate Change 2014: Impacts, Adaptation, and Vulnerability. Part A: Global and Sectoral
Aspects. Contribution of Working Group II to the Fifth Assessment Report of the Intergovernmental Panel
on Climate Change [Field, C.B., V.R. Barros, D.J. Dokken, K.J. Mach, M.D. Mastrandrea, T.E. Bilir,
M. Chatterjee, K.L. Ebi, Y.O. Estrada, R.C. Genova, B. Girma, E.S. Kissel, A.N. Levy, S. MacCracken,
P.R. Mastrandrea, and L.L. White (eds.)]. Cambridge University Press, Cambridge, United Kingdom and New
York, NY, USA, pp. 169-194.
1

1
170
Executive Summary............................................................................................................................................................ 171
1.1. The Setting ............................................................................................................................................................. 172
1.1.1. Development of the Science Basis for the Assessment ..................................................................................................................... 172
1.1.2. Evolution of the Working Group II Assessment Reports and Treatment of Uncertainty ..................................................................... 174
1.1.2.1.Framing and Outlines of Working Group II Assessment Reports ........................................................................................... 174
1.1.2.2.Treatment of Uncertainties in IPCC Assessment Reports: A Brief History and Terms Used in the Fifth Assessment Report ... 176
1.1.3. Scenarios Used as Inputs to Working Group II Assessments ............................................................................................................. 176
Box 1-1. Communication of Uncertainty in the Working Group II Fifth Assessment ........................................................ 177
1.1.3.1.Comparison of RCP and SRES Scenarios .............................................................................................................................. 178
1.1.3.2.Shared Socioeconomic Pathways ......................................................................................................................................... 178
1.1.4. Evolution of Understanding the Interaction between Climate Change Impacts, Adaptation, and Vulnerability
with Human and Sustainable Development ...................................................................................................................................... 179
1.1.4.1.Vulnerability and Multiple Stressors ..................................................................................................................................... 179
1.1.4.2.Adaptation, Mitigation, and Development ........................................................................................................................... 180
Box 1-2. Country Development Terminology ................................................................................................................... 181
1.1.4.3.Transformation and Climate-Resilient Pathways .................................................................................................................. 181
1.1.4.4.The Opportunity Space for Decision Making ........................................................................................................................ 181
1.2. Major Conclusions of the Working Group II Fourth Assessment Report ................................................................. 182
1.2.1. Observed Impacts ............................................................................................................................................................................. 183
1.2.2. Key Vulnerabilities, Risks, and Reasons for Concern .......................................................................................................................... 183
1.2.3. Interaction of Adaptation and Mitigation in a Policy Portfolio .......................................................................................................... 184
1.3. Major Conclusions of More Recent IPCC Reports ................................................................................................... 184
1.3.1. Special Report on Renewable Energy Sources and Climate Change Mitigation ................................................................................ 186
1.3.2. Special Report on Managing the Risks of Extreme Events and Disasters to Advance Climate Change Adaptation ........................... 187
1.3.2.1.Themes and Findings of Special Report on Managing the Risks of Extreme Events and Disasters
to Advance Climate Change Adaptation ............................................................................................................................... 187
1.3.2.2.Advances in Conceptualizing Climate Change Vulnerability, Adaptation, and Risk Management
in the Context of Human Development ................................................................................................................................ 188
1.3.3. Relevant Findings from IPCC Working Group I Fifth Assessment Report ........................................................................................... 188
1.3.4. Relevant Findings from IPCC Working Group III Fifth Assessment Report ......................................................................................... 191
References ........................................................................................................................................................................ 192
Frequently Asked Questions
1.1: On what information is the new assessment based, and how has that information changed since the last report,
the IPCC Fourth Assessment Report in 2007? ................................................................................................................................... 174
1.2: How is the state of scientific understanding and uncertainty communicated in this assessment? ................................................... 176
1.3: How has our understanding of the interface between human, natural, and climate systems expanded
since the 2007 IPCC Assessment? .................................................................................................................................................... 180
Table of Contents

1
Point of Departure Chapter 1
171
Executive Summary
The evolution of the IPCC assessments of impacts, adaptation, and vulnerability indicates an increasing emphasis on human
beings, their role in managing resources and natural systems, and the societal impacts of climate change. The expanded focus on
societal impacts and responses is evident in the composition of the IPCC author teams, the literature assessed, and the content of the IPCC
assessment reports. Characteristics in the evolution of the Working Group II assessment reports are an increasing attention to (1) adaptation
l
imits and transformation in social and natural systems; (2) synergies between multiple variables and factors that affect sustainable development;
(3) risk management; and (4) institutional, social, cultural, and value-related issues. {1.1, 1.2}
The literature available for assessing climate change impacts, adaptation, and vulnerability more than doubled between 2005
and 2010, allowing for a more robust assessment that supports policymaking (high confidence).
The diversity of the topics and
regions covered by the literature has similarly expanded, as has the geographic distribution of authors contributing to the knowledge base for
climate change assessments. Authorship of literature from developing countries has increased, although still representing a small fraction of
the total. This unequal distribution of literature presents a challenge to the production of a comprehensive and balanced global assessment.
{1.1.1, Figure 1-1}
Rapidly advancing climate science provides policy-relevant information that creates opportunities for decision making that can
lead to climate-resilient development pathways (robust evidence, medium agreement). Climate change is just one of many stressors
that influence resilience. The decisions that societies make within this opportunity space, also informed by observation, experience, and other
factors, affect outcomes in human and natural systems. {1.1.1, 1.1.4, Figure 1-5}
Adaptation has emerged as a central area of climate change research, in country level planning, and in the implementation of
climate change strategies (high confidence). The body of literature, including government and private sector reports, shows an increased
focus on adaptation opportunities and the interrelations between adaptation, mitigation, and alternative sustainable pathways. The literature
shows an emergence of studies on transformative processes that take advantage of synergies between adaptation planning, development
strategies, social protection, and disaster risk reduction and management. {1.1.4}
As a core feature and innovation of IPCC assessment, major findings are presented with defined, calibrated language that
communicates the strength of scientific understanding, including uncertainties and areas of disagreement. Each finding is supported
by a traceable account of the evaluation of evidence and agreement. {1.1.2.2, Box 1-1}
Impacts assessed in this report are based on climate model projections using both the IPCC Special Report on Emission Scenarios
(SRES) and the new Representative Concentration Pathway (RCP) scenarios.
The RCPs span the range of SRES scenarios for long-lived
greenhouse gases, but they have a narrower range in terms of emissions of ozone and aerosol precursors and related pollutants. The SRES
scenarios were used in the Third Assessment Report (TAR) and the Fourth Assessment Report (AR4). With AR5, the RCP scenarios present both
emissions and greenhouse gas concentration pathways, and corresponding Shared Socioeconomic Pathways (SSPs) have been developed. The
four RCPs describe different levels of mitigation leading to 21st century radiative forcing levels of about 2.6, 4.5, 6.0, and 8.5 W m
–2
), whereas
the SRES scenarios are policy-independent. {1.1.3, 1.3.3, 19.6.3.1, Boxes 21-1, 21.5.4, 24.3.3; see also WGI AR5 Chapters 1, 8, 11, 12}

1
Chapter 1 Point of Departure
172
1.1. The Setting
This chapter describes the information basis for the Fifth Assessment
Report (AR5) of IPCC Working Group II (WGII) and the rationale for its
structure. As the starting point of WGII AR5, the chapter begins with
an analysis of how the literature for the assessment has developed
through time and proceeds with an overview of how the framing and
content of the WGII reports have changed since the first IPCC report
was published in 1990. The future climate scenarios used in AR5 are
a marked change from those used in the Third (TAR, 2001) and Fourth
(AR4, 2007) Assessment Reports; this shift is described here, along
with the new AR5 guidance for communicating scientific uncertainty.
The chapter provides a summary of the most relevant key findings
from the IPCC Special Report on Renewable Energy Sources and
Climate Change Mitigation (IPCC, 2011), the IPCC Special Report
on Managing the Risks of Extreme Events and Disasters to Advance
Climate Change Adaptation (IPCC, 2012), and the AR5 Working
Group I (The Physical Science Basis) and AR5 Working Group III
(Mitigation of Climate Change). Collectively these recent reports, new
scenarios, and other advancements in climate change science set the
stage for an assessment of impacts, adaptation, and vulnerability that
could potentially overcome many of the limitations identified in the
IPCC WGII AR4, particularly with respect to the human dimensions
of climate change.
The critical review and synthesis of the scientific literature published
since October 2006 (effective cutoff date for AR4) has required an
expanded multidisciplinary approach that, in general, has focused
more heavily on societal impacts and responses. This includes an
assessment of impacts associated with coupled socio-ecological
systems and the rapid emergence of research on adaptation and
vulnerability.
WGII AR5 differs from the prior assessments primarily in the
expanded outline and diversity of content that stems directly from the
growth of the scientific basis for the assessment. WGII AR5 is
published in two volumes (Part A: Global and Sectoral Aspects; Part B:
Regional Aspects), permitting the presentation of more detailed
regional analyses and an expanded coverage of the human dimensions
such as adaptation. WGI AR5 was completed approximately 6 months
in advance of WGII AR5, allowing the WGII authors more time to
evaluate and include where possible the WGI findings; WGIII AR5 was
developed almost in parallel with the WGII report.
The point of departure in the title alludes to the availability of new
information concerning the interactions between climate change and
other biophysical and societal stressors. Societal stressors include
poverty and inequality, low levels of human development, and
psychological, institutional, and cultural factors. Even in the presence
of these multiple stressors, policy relevant information from scientific
research, direct experience, and observation provides an opportunity
space to choose and design climate-resilient development pathways
(see Sections 1.1.4, 13.1.1, 14.2, 14.3; Figure 1-5).
1.1.1. Development of the Science Basis for the Assessment
The volume of literature available for assessing Climate Change Impacts,
Adaptation, and Vulnerability (CCIAV) has grown significantly over the
past 2 decades (Figure 1-1). A bibliometric analysis of reports produced
w
ith two bibliographic search tools (Scopus
1
a
nd ISI Web of Science
2
)
indicates that fewer than 1000 articles in journals, books, and conference
proceedings were published in English on the topic of “climate change”
between 1970 and 1990. By the end of 2012 the total number of such
articles was reported as 102,573 (Scopus) and 62,155 (Web of Science).
The current doubling rate of “climate change” publications remains
short, less than 5 years: Scopus database lists 32,943 articles published
between 1970 and 2005, and 76,130 published between 1970 and 2010.
The number of publications per year on the topic of climate change
impacts between 2005 and 2010 and on the topic of climate change
adaptation between 2008 and 2010 has roughly doubled (Figure 1-1c).
Thus, the total number of publications more than doubled from 2005
to 2010.
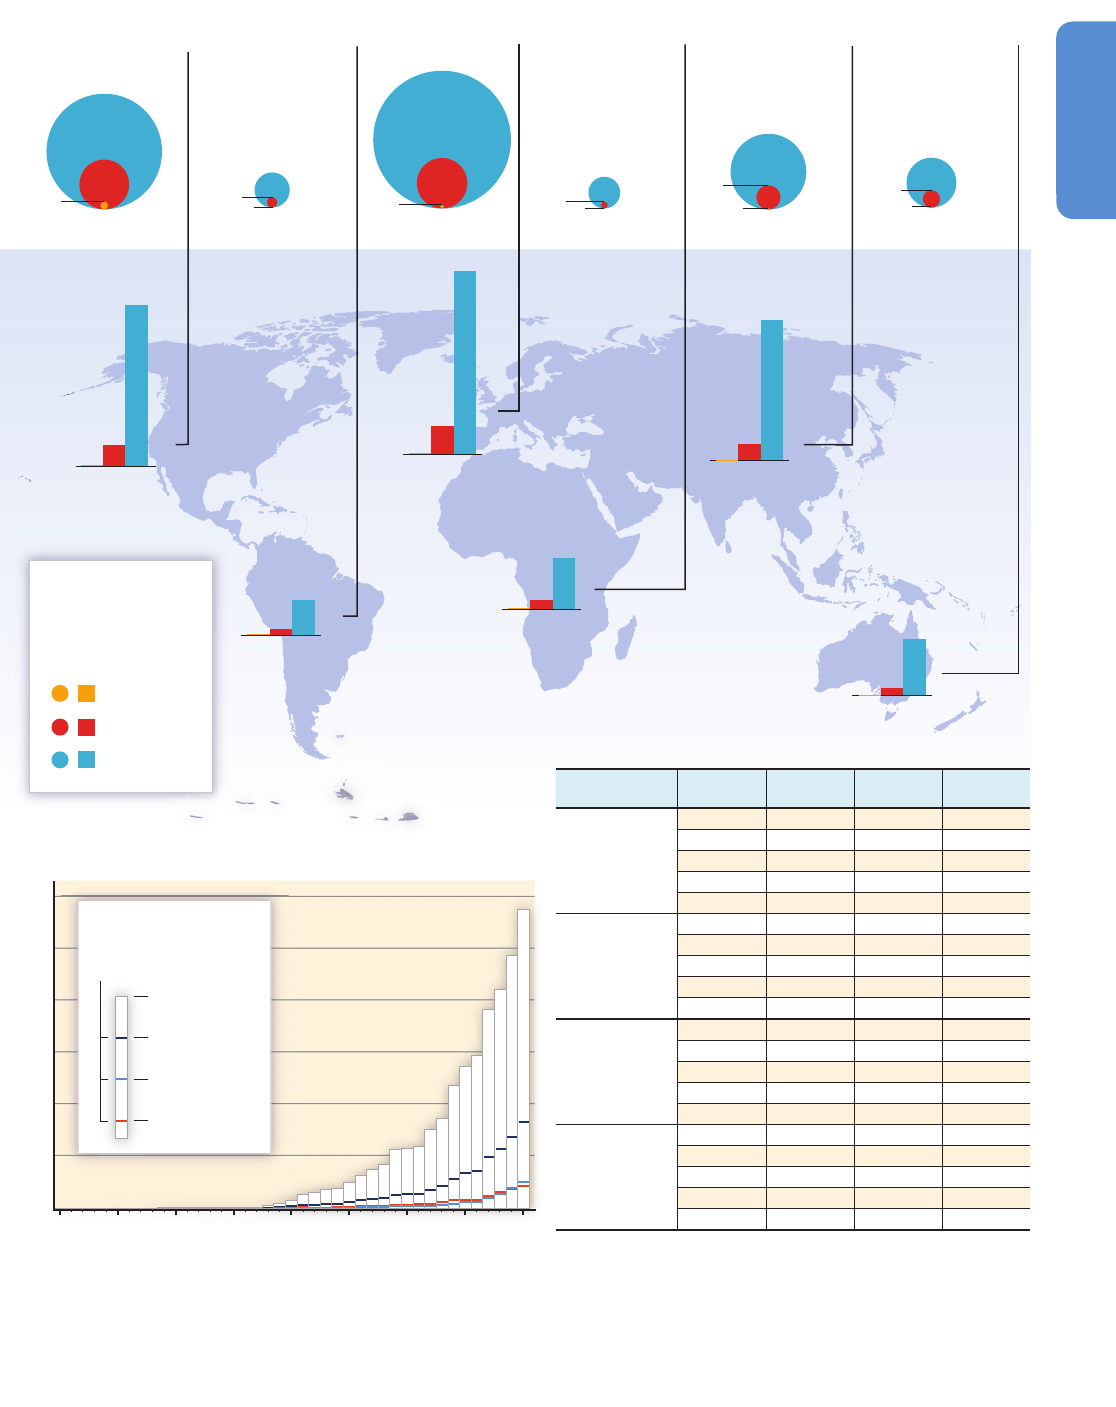
Since 1990 the geographic distribution of authors contributing to the
climate change literature has expanded from Europe and North America
to include a large fraction from Asia and Australasia. Literature from
scientists affiliated with institutions in Africa and Central and South
America, however, comprised approximately 5% of the total during
2001–2010 (Figure 1-1a). The proportion of literature focusing on
individual countries within IPCC regions has also broadened over the
past 3 decades, particularly for Asia (Figure 1-1b).
3
This brief chronicle
neither differentiates across the various “subcategories” of the climate
literature nor claims to be comprehensive in terms of literature produced
in languages other than English.
Recent growth in the total volume of literature about climate change,
and in particular that devoted to impacts and adaptation, has influenced
the depth and scope of assessment reports produced by WGII, and it
has enabled substantial advances in the assessment of the full range
of impacts, adaptation, and vulnerability (Figure 1-1c). The unequal
distribution of literature (Figure 1-1a,b,d) presents a challenge to the
development of a comprehensive and balanced assessment of the
global impacts of climate change. The geographical and topical
distribution of literature is influenced by factors such as the availability
of funding for scientific research, level of capacity building, regional
experience with climate-related disasters, and the availability of long-
term observational records.
Literature published on the topic of “climate change” during 1970–1990
focused primarily on changes in the physical climate system and how
these changes affected other aspects of the Earth’s physical environment.
1
Scopus is a bibliographic database owned by Elsevier that contains abstracts and citations for peer-reviewed literature in the scientific, medical, and social sciences (including
arts and humanities). Scopus has more than 50 million bibliographic records (about 29 million from 1995 forward and about 21 million from 1823 to 1996), as of September
2013.
2
Web of Science, owned by Thompson Reuters, is a bibliographic database of journals and conference proceedings for the sciences, social sciences, arts, and humanities. Web of
Science includes records from over 12,000 journals and 148,000 conference proceedings dating from 1985 to present, as of September 2013.
3
Russia, Greenland, and Iceland are included with Europe; Mexico is included with North America.
1
Point of Departure Chapter 1
173
B. Climate change literature by IPCC regionB. Climate change literature by IPCC region
Total : 76,173 Total : 6459 Total : 5324 Total : 30,302 Total : 13,394Total : 103,171
5
8
9
329
1228
6
1987
315
42
3255
446
3
4
10,544
1595
44
2982
5
36
3
3
8101
9
40
1981–1990
1991–2000
2001–2010
and
or
or
"climate change"
"impact"
"adaptation"
"cost"
0
2000
4000
6000
8000
10,000
12,000
1970 1975 1980 1985 1990 1995 2000 2005 2010
290
63,985
1
1,898
7
1
9
0,844
1
2,256
4
815
5
09
9
2
7,472
2
821
7
1
1,944
1
443
2
5915
5
42
EUROPE ASIA AUSTRALASIAAFRICANORTH AMERICA SOUTH AMERICA
(a) Author affiliation
(c) Climate change literature in English, total and for selected topics
(1970–2010)
(d) Number of publications in five languages that include selected key
words during the three time periods
N
umber of climate change
publications (a) by country
affiliation of authors and
(b) by region
y-value of each line indicates
the total # of publications
found using the following key
words:
Publication period
(b) Climate change literature by region
0
Search words
(translated)
Language 1981–1990 1991–2000 2001–2010
"Climate change"
English 990 12,686 61,485
Chinese 1454 6353 22,008
French 1 108 815
Russian 67 210 1443
Spanish 3 82 1381
"Climate change”
and "impacts"
English 232 3001 16,218
Chinese 133 515 1780
French 0 1 95
Russian 0 72 403
Spanish 0 7 103
"Climate change"
and "adaptation"
English 14 373 3661
Chinese 6 58 321
French 0 7 110
Russian 0 7 44
Spanish 0 5 103
"Climate change"
and "cost"
English 24 699 4099
Chinese 1 22 162
French 0 7 36
Russian 0 1 24
Spanish 0 2 11
Figure 1-1 | Number of climate-change publications listed in the Scopus bibliographic database and results of literature searches conducted in four other languages. (a) Number of
publications in English (as of July, 2011) summed by country affiliation of all authors of climate change publications and binned into IPCC regions. Each publication can be counted multiple
times (i.e., the number of different countries in the author affiliation list). (b) Number of climate change publications in English with individual countries mentioned in title, abstract, or key
words (as of July, 2011) binned into IPCC regions for the decades 1981–1990, 1991–2000, and 2001–2010. Each publication can be counted multiple times if more than one country is
listed. (c) Annual global number of publications in English on climate change and related topics: impacts, adaptation, and costs for the years 1970–2010, as of September 2013. (d) Number
of publications in five languages that include the words "climate change" and "climate change" plus "adaptation," "impact," and "cost" (translated) in the title, abstract, or key words
during the three decades ending in 2010. The following individuals conducted these literature searches during January, 2012–March, 2013: Valentin Przyluski (French), Huang Huanping
(Chinese), Peter Zavialov and Vasily Kokorev (Russian), and Saúl Armendáriz Sánchez (Spanish).

1
Chapter 1 Point of Departure
174
The proportion of climate-change literature in engineering journals
has not changed appreciably over the past 4 decades, but there was a
significant increase in the proportion of literature published in biological
and agricultural science journals. The proportion of the literature on the
topic of “climate change” published in social science journals increased
from 6% (1970s–1980s) to 9% (1990s–2000s). The themes covered by
the literature on vulnerability to climate change have also expanded to
issues of ethics, equity, and sustainable development. From the Scopus
database, publications on the topic of climate change “impacts” crossed
the threshold of 100 per year in 1991. Publications on climate change
“adaptation” and societal “cost” reached this level in 2003.
Although authors continue to publish primarily in English, climate-change
literature in other languages has also expanded. Literature searches in
Chinese, French, Russian, and Spanish revealed a roughly fourfold or
greater increase in literature published on the topic of “climate change”
in each language during the past 2 decades (Figure 1-1d). Scientists
from many countries tend to publish their work in English, as indicated
by comparing the regional analysis and country affiliation of authors
in Figure 1-1b with the results of the literature searches in the five
languages. This process of “scientific internationalism,” by which
English becomes the primary language of scientific communication, has
been described as a growing trend among Russian (Kirchik et al., 2012),
Spanish (Alcaide et al., 2012), and French (Gingras and Mosbah-Natanson,
2010) researchers.
1.1.2. Evolution of the Working Group II Assessment
Reports and Treatment of Uncertainty
1.1.2.1. Framing and Outlines of Working Group II
Assessment Reports
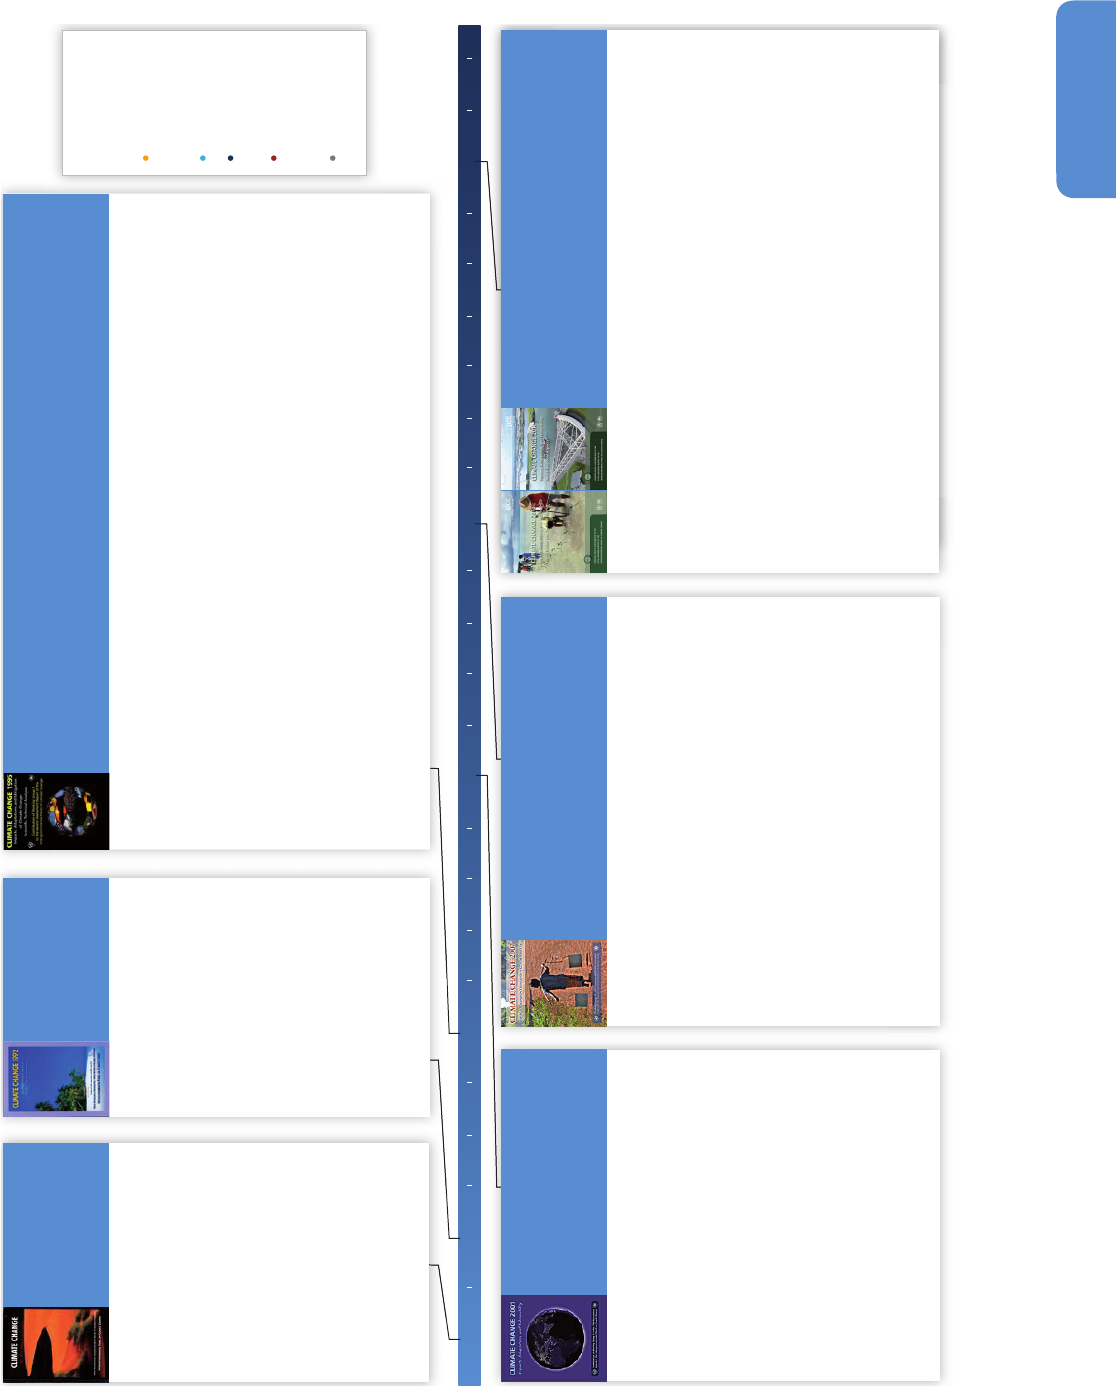
The framing and contents of the IPCC WGII reports have evolved since
the First Assessment Report (FAR; IPCC, 1990) as summarized in Figure
1-2. Four characteristics of this evolution are an increasing attention to
(1) adaptation limits and transformation in societal and natural
systems; (2) synergies between multiple variables and factors that affect
sustainable development; (3) risk management; and (4) institutional, social,
cultural, and value-related issues. WGII now focuses on understanding
the interactions between the natural climate system, ecosystems,
human beings, and societies, this being on top of the long-standing
emphasis on the biogeophysical impacts of climate change on sectors
and regions.
The WGII FAR (296 pages) was organized into six major sectors:
agriculture and forestry; terrestrial ecosystems; water resources; human
settlements; oceans and coastal zones; and snow, ice, and permafrost.
The report focused on the anticipated climate changes for a doubling
of carbon dioxide (CO
2
). The FAR Summary for Policymakers (SPM)
highlighted the coupling of anthropogenic non-climate stresses with
climate variability and greenhouse gas (GHG) driven climate change.
Given the state of the science in 1990, the FAR has understandably low
confidence on some high-vulnerability topics (e.g., global agricultural
potential may either increase or decrease), but is more quantitative on
large-scale climate impacts (e.g., climatic zones shift poleward by
hundreds of kilometers). Health impacts were vague, emphasizing
ozone depletion and ultraviolet-B (UV-B) damage. The IPCC WGII 1992
Supplementary Report followed with four assigned topics (regional
climate change; energy; agriculture and forestry; sea level rise) and was
primarily a strategy report, for example, urging that studies of change
in tropical cyclones are of highest priority (IPCC, 1992).
For the IPCC SAR (IPCC, 1996) WGII reviewed climate change impacts,
vulnerability, and adaptation plus mitigation options for GHGs. There
were two introductory primers, 18 chapters on impacts and adaptation
(e.g., forests, rangelands, deserts, human settlements, agriculture,
fisheries, financial services, human health), and seven chapters on
sectoral mitigation (e.g., energy, industry, forests) but with cost analysis
left to WGIII. The SAR made use of the new IPCC 1992 scenarios (IS92).
Projections of 2100 sea level rise (15 to 95 cm) and temperature
increase (1.0°C to 3.5°C) were similar to the FAR’s doubled-CO
2
scenario.
Frequently Asked Questions
FAQ 1.1 | On what information is the new assessment based, and how has that information
changed since the last report, the IPCC Fourth Assessment Report in 2007?
Thousands of scientists from around the world contribute voluntarily to the work of the IPCC, which was established
by the United Nations Environment Programme (UNEP) and the World Meteorological Organization (WMO) in
1988 to provide the world with a clear scientific assessment of the current scientific literature about climate change
and its potential human and environmental impacts. Those scientists critically assess the latest scientific, technical,
and socioeconomic information about climate change from many sources. Priority is given to peer-reviewed scientific,
technical, and social-economic literature, but other sources such as reports from government and industry can be
crucial for IPCC assessments.
The body of scientific information about climate change from a wide range of fields has grown substantially since
2007, so the new assessment reflects the large amount that has been learned in the past 6 years. To give a sense of
how that body of knowledge has grown, between 2005 and 2010 the total number of publications just on climate
change impacts, the focus of Working Group II, more than doubled. There has also been a tremendous growth in
the proportion of that literature devoted to particular countries or regions.
1
Point of Departure Chapter 1
175
Scenarios and
predicted/observed
impacts
Sectoral analyses
Region-specific
analyses
Chapters mainly
focused on
adaptation
Mitigation
Climate Change:
The IPCC Impacts
Assessment (FAR)
Different aspects of
the WGII
assessments
Climate Change 1992:
The Supplementary
Report to the IPCC
Impacts Assessment
1. Scenarios used in the report •
2. Agriculture and forestry •
3. Natural terrestrial ecosystems •
4. Hydrology and water resources •
5. Human settlement; the energy,
transport, and industrial sectors; human
health; air quality and changes in UV-B
radiation
•
6. World oceans and coastal zones •
7. Seasonal snow cover, ice, and
permafrost
•
Summary for Policymakers
Technical Summary
A. Prediction of the regional distribution of
climate change and associated impact
studies, including model validation
studies
•
B. Energy- and industry-related issues •
C. Agriculture- and forestry-related issues •
D. Vulnerability to sea level rise •
Appendices
Climate Change 1995:
Impacts, Adaptations and Mitigation of Climate Change: Scientific-Technical Analyses (SAR)
Climate Change 2001:
Impacts, Adaptation, and Vulnerability
(TAR)
Climate Change 2007:
Impacts, Adaptation, and Vulnerability (AR4)
Climate Change 2014:
Impacts, Adaptation, and Vulnerability (AR5)
Summary for Policymakers
Technical Summary
Summary for Policymakers
Technical Summary
1. Overview of impacts,
adaptation, and
vulnerability to climate
change
2. Methods and tools
3. Developing and applying
scenarios
•
4. Hydrology and water
resources
•
5. Ecosystems and their
goods and services
•
6. Coastal zones and marine
ecosystems
•
7. Human settlements,
energy, and industry
•
8. Insurance and other
financial services
•
9. Human health •
PART A — GLOBAL AND SECTORAL ASPECTS
Context for the AR5
1. Point of departure
2. Foundations for decisionmaking
Natural and Managed Resources and Systems and
Their Uses
3. Freshwater resources
•
4. Terrestrial and inland water systems •
5. Coastal systems and low-lying areas •
6. Ocean systems •
7. Food security and food production systems •
Human Settlements, Industry, and Infrastructure
8. Urban areas
•
9. Rural areas •
10. Key economic sectors and services •
Human Health, Well-Being, and Security
11. Human health: impacts, adaptation, and co-benefits
•
12. Human security •
13. Livelihoods and poverty •
Adaptation
14. Adaptation needs and options
•
1. Assessment of observed changes and
responses in natural and managed
systems •
2. New assessment methods and the
characterisation of future conditions
•
3. Freshwater resources and their
management
•
4. Ecosystems, their properties, goods,
and services
•
5. Food, fiber, and forest products •
6. Coastal systems and low-lying areas •
7. Industry, settlement, and society •
8. Human health •
Summary for Policymakers
Technical Summary
PART I — INTRODUCTORY MATERIALS
A. Ecophysiological, ecological, and soil processes in terrestrial ecosystems:
a primer on general concepts and relationships
B. Energy primer
PART II — ASSESSMENT OF IMPACTS AND ADAPTATION OPTIONS
1. Climate change impacts on forests
•
2. Rangelands in a changing climate: impacts, adaptations, and mitigation •
3. Deserts in a changing climate: impacts •
4. Land degradation and desertification •
5. Impacts of climate change on mountain regions •
6. Non-tidal wetlands •
7. The cryosphere: changes and their impacts •
8. Oceans •
9. Coastal zones and small islands •
10. Hydrology and freshwater ecology •
11. Industry, energy, and transportation: impacts and adaptation •
12. Human settlements in a changing climate: impacts and adaptation •
13. Agriculture in a changing climate: impacts and adaptation •
14. Water resources management •
15. Wood production under changing climate and land use •
16. Fisheries •
17. Financial services •
18. Human population health •
PART III — ASSESSMENT OF MITIGATION OPTIONS
19. Energy supply mitigation options
•
20. Industry •
21. Mitigation options in the transportation sector
•
22. Mitigation options for human settlements •
23. Agricultural options for mitigation of greenhouse
gas emissions
•
24. Management of forests for mitigation of
greenhouse gas emissions
•
25. Mitigation: cross-sectoral and other issues •
PART IV — TECHNICAL APPENDICES
26. Technical guidelines for assessing climate change
impacts and adaptations
•
27. Methods for assessment of mitigation options •
28. Inventory of technologies, methods, and practices
Appendices
9. Africa
•
10. Asia •
11. Australia and New Zealand •
12. Europe •
13. Latin America •
14. North America •
15. Polar Regions (Arctic and Antarctic) •
16. Small Islands •
17. Assessment of adaptation practices,
options, constraints, and capacity
•
18. Inter-relationships between
adaptation and mitigation
•
19. Assessing key vulnerabilities and the
risk from climate change
•
20. Perspectives on climate change and
sustainability
•
Appendices
10. Africa
•
11. Asia •
12. Australia and New
Zealand
•
13. Europe •
14. Latin America
•
15. North America •
16. Polar regions (Arctic and
Antarctic)
•
17. Small Island states •
18. Adaptation to climate
change in the context of
sustainable development
and equity
•
19. Vulnerability to climate
change and reasons for
concern: a synthesis
•
Annexes
15. Adaptation planning and implementation
•
16. Adaptation opportunities, constraints, and limits •
17. Economics of adaptation •
Multi-Sector Impacts, Risks, Vulnerabilities, and
Opportunities
18. Detection and attribution of observed impacts
•
19. Emergent risks and key vulnerabilities •
20. Climate-resilient pathways: adaptation,
mitigation, and sustainable development
•
PART B — REGIONAL ASPECTS
21. Regional context
•
22. Africa •
23. Europe •
24. Asia •
25. Australasia •
26. North America •
27. Central and South America •
28. Polar Regions •
29. Small Islands •
30. The Ocean •
Appendices
Executive Summary Policymakers' Summary
1990 1992 1996 2001 2007 2014
Figure 1-2 | Tables of Contents for the Working Group II contributions to the IPCC Assessments since 1990. The First Assessment Report (FAR; IPCC, 1990) of IPCC Working Group II (WGII) focused on the impacts of climate change. For the
Second Assessment Report (SAR; IPCC, 1996) the WGII contribution included mitigation and adaptation with the impacts assessment. With the Third Assessment Report (TAR; IPCC, 2001) and Fourth Assessment Report (AR4; IPCC, 2007)
climate change mitigation reverted to WGIII, and WGII remained focused on impacts, adaptation, and vulnerability with an expanded effort on the regional scale.

1
Chapter 1 Point of Departure
176
The SAR notes “Impacts are difficult to quantify, and existing studies
are limited in scope; detection [of climate-induced changes] will be
difficult,” but some specifics are given (e.g., the number of people at
risk of flooding from storm surges from sea level rise; the increase in
malaria incidence). Vegetation models are used to map out projected
changes in major biomes (see WGII SAR SPM Figure 2) – the first
prediction figure in a WGII SPM.
WGII TAR (IPCC, 2001b) retained impacts, adaptation, and vulnerability,
l
eaving the topic of mitigation to WGIII. It included five sectoral chapters
(water resources, ecosystems, coastal and marine, human settlements
and energy, and financial services), eight regional chapters, plus
chapters on (1) adaptation, sustainable development, and equity, and
(2) vulnerability and reasons for concern. The TAR made the first strong
conclusion on attributing impacts: “recent regional climate changes,
particularly temperature increases, have already affected many physical
and biological systems.” Recent increases in floods and droughts, while
affecting some human systems, could not be tied to GHG-driven climate
change. The TAR introduced the “burning embers” diagram (SPM
Figure 2, discussed in Chapters 18 and 19 of this report) as a way to
represent “reasons for concern.” The adaptive capacity, vulnerability,
and key concerns for each region were laid out in detail (SPM, Table 2).
WGII AR4 (IPCC, 2007b,c) retained the basic structure of the TAR with
chapters on sectors and regions. The first chapter of AR4, drawing from
the expanded literature, provided an “Assessment of Observed Changes
in Natural and Human Systems.” AR4 incorporated several cross-chapter
themes with case studies (such as impacts on deltas) as a unifying
construct. Two graphics in the AR4 SPM (SPM Figure 1-2 and Table 1-1)
give many examples of projected impacts of climate change, but the
state of the science—both of WGI climate projections and WGII
impacts—remained too uncertain at the time to give more quantitative
estimates of the impacts or necessary adaptation.
This WGII fifth assessment continues and expands the sectoral and
regional parts. The AR5 considers a wide and complex range of multiple
stresses that influence the sustainability of human and ecological
systems. The focus on climate change and related stressors, and the
resulting vulnerability and risk, continues throughout this report,
including the expanded “reasons for concern” (Chapters 2 and 19; see
also Section 1.2.3).
1.1.2.2. Treatment of Uncertainties in IPCC Assessment Reports:
A
Brief History and Terms Used in the Fifth Assessment
Report
A
n integral feature of IPCC reports is communication of the strength of
and uncertainties in scientific understanding underlying assessment
findings. Treatment of uncertainties and corresponding use of calibrated
uncertainty language in IPCC reports have evolved across IPCC assessment
cycles (Swart et al., 2009; Mastrandrea and Mach, 2011). In WGII, the
use of calibrated language began in the SAR (1996), in which most
chapters used qualitative levels of confidence in Executive Summary
findings. With the TAR (2001), formal guidance across the Working
Groups was developed (Moss and Schneider, 2000) recognizing that
“guidelines such as these will never truly be completed,” and an iterative
process of learning and improvement of guidance has ensued, informed
by experience in each assessment cycle (IPCC, 2005; Mastrandrea et al.,
2010). Each subsequent guidance paper has presented related but
distinct approaches for evaluating and communicating the degree of
certainty in findings of the assessment process.
The AR5 Guidance Note (summarized in Box 1-1) continues to emphasize
an overriding theme of clearly linking each key finding and corresponding
assignment of calibrated uncertainty language to associated chapter
text, as part of the traceable account of the author team’s evaluation
of evidence and agreement supporting that finding.
1.1.3. Scenarios Used as Inputs
to Working Group II Assessments
A scenario is a storyline or image that describes a potential future,
developed to inform decision making under uncertainty (Parson et al.,
2007). Scenarios have been part of IPCC future climate projections since
Frequently Asked Questions
FAQ 1.2 | How is the state of scientific understanding and uncertainty communicated
in this assessment?
While the body of scientific knowledge about climate change and its impacts has grown tremendously, future
conditions cannot be predicted with absolute certainty. Future climate change impacts will depend on past
and future socioeconomic development, which influences emissions of heat-trapping gases, the exposure and
vulnerability of society and ecosystems, and societal capacity to respond.
Ultimately, anticipating, preparing for, and responding to climate change is a process of risk management informed
by scientific understanding and the values of stakeholders and society. The Working Group II assessment provides
information to decision makers about the full range of possible consequences and associated probabilities, as well
as the implications of potential responses. To clearly communicate well-established knowledge, uncertainties, and
areas of disagreement, the scientists developing this assessment report use specific terms, methods, and guidance
to characterize their degree of certainty in assessment conclusions.

1
Point of Departure Chapter 1
177
Box 1-1 | Communication of Uncertainty in the Working Group II Fifth Assessment
Based on the ‘Guidance Note for Lead Authors of the IPCC Fifth Assessment Report on Consistent Treatment of Uncertainties’
(Mastrandrea et al., 2010), the WGII AR5 relies on two metrics for communicating the degree of certainty in key findings:
•
Confidence in the validity of a finding, based on the type, amount, quality, and consistency of evidence (e.g., mechanistic
understanding, theory, data, models, expert judgment) and the degree of agreement. Confidence is expressed qualitatively.
• Quantified measures of uncertainty in a finding expressed probabilistically (based on statistical analysis of observations, model
results, or expert judgment).
Each finding has its foundation in an author team’s evaluation of associated evidence and agreement. The type and amount of
evidence available vary for different topics, and that evidence can vary in quality. The consistency of different lines of evidence can
also vary. Beyond consistency of evidence, the degree of agreement indicates the consensus within the scientific community on a
topic and the degree to which established, competing, or speculative scientific explanations exist.
The Guidance Note provides summary terms to describe the available evidence: limited, medium, or robust; and the degree of
agreement: low, medium, or high. These terms are presented with some key findings. In many cases, author teams in addition evaluate
their confidence about the validity of a finding, providing a synthesis of the evaluation of evidence and agreement. Levels of confidence
include five qualifiers: very low, low, medium, high, and very high. Figure 1-3 illustrates the relationship between the summary terms
for evidence and agreement and the confidence metric. There is flexibility in this relationship; increasing confidence is associated
with increasing evidence and agreement, but different levels of confidence can be assigned for a given evidence and agreement
statement. The degree of certainty in findings based on qualitative evidence is expressed using levels of confidence and summary
terms.
In some cases, available evidence incorporates quantitative analyses, based on which uncertainties can be expressed probabilistically.
In such cases, a finding can include calibrated likelihood language or a more precise presentation of probability. The likelihood terms
and their corresponding probability ranges are presented below. Use of likelihood is not an alternative to use of confidence: an
author team will have a level of confidence about the validity of a probabilistic finding. Unless otherwise indicated, findings assigned
a likelihood term are associated with high or very high confidence. When authors evaluate the likelihood of some well-defined outcome
having occurred or occurring in the future, the terms and
associated meanings are:
Term* Likelihood of the outcome
Virtually certain 99–100% probability
Very likely 90–100% probability
Likely 66–100% probability
About as likely as not 33–66% probability
Unlikely 0–33% probability
Very unlikely 0–10% probability
Exceptionally unlikely 0–1% probability
* Additional terms used more occasionally are extremely likely:
95–100% probability, more likely than not: >50–100% probability,
and extremely unlikely: 0–5% probability.
High agreement
Limited evidence
High agreement
Medium evidence
High agreement
Robust evidence
Medium agreement
Robust evidence
Medium agreement
Medium evidence
Medium agreement
Limited evidence
Low agreement
Limited evidence
Low agreement
Medium evidence
Low agreement
Robust evidence
Evidence (type, amount, quality, consistency)
Agreement
Confidence
Scale
Figure 1-3 | Evidence and agreement statements and their relationship to confidence.
The coloring increasing toward the top-right corner indicates increasing confidence.
Generally, evidence is most robust when there are multiple, consistent independent
lines of high-quality evidence.

1
Chapter 1 Point of Departure
178
the FAR (IPCC, 1990), where WGIII generated four scenarios (Bau =
business-as-usual, B, C, and D) used by WGI to project climate change.
The IPCC Supplementary Report (IPCC, 1992), a joint effort of WGI and
WGIII, defined six new scenarios (IS92a–f) used in the SAR (1996). For
the TAR (2001), the IPCC Special Report on Emissions Scenarios (SRES;
Nakicenkovic et al., 2000) created many scenarios from four Integrated
Assessment Models (IAMs), out of which a representative range of
marker scenarios were selected (A1B, A1T, A1FI, A2, B1, B2). In the SRES,
scenarios had had socioeconomic storylines but climate-mitigation
o
ptions were not included. The SRES scenarios carried over into the AR4
(2007a,b) and formed the basis for the large number of ensemble climate
simulations (Coupled Model Intercomparison Project Phase 3 (CMIP3)),
which are still in use for climate-change studies relevant to WGII AR5.
4
With AR5, the development of scenarios fundamentally changed from
the IPCC-led SRES process. An ad hoc group of experts, anticipating AR5,
built a new structure for scenarios called Representative Concentration
Pathways (RCPs) (Moss et al., 2010; van Vuuren et al., 2011) using
updated IAMs and intended to provide a flexible, interactive, and
iterative approach to climate change scenarios. The four RCPs are keyed
to a range of trajectories of GHG concentrations and climate forcing.
They are labeled by their approximate radiative forcing (RF, W m
–
2
) that
is reached during or near the end of the 21st century (RCP2.6, RCP4.5,
RCP6.0, RCP8.5). The quantitative link between the socioeconomic
pathway, human activities, and GHG emissions, and subsequently RF, is
weaker or nonexistent with current RCP than with SRES scenarios. For
example, the RCPs rely on a single parametric model (Meinshausen et
al., 2011) to map from emissions to RF, whereas IPCC WGI traditionally
assesses this critical linkage using the current state of scientific knowledge
(see AR5 WGI Chapters 6, 11, 12, Annex II). In addition, socioeconomic
scenarios, emissions, and subsequent radiative forcing pathways were
not linked one-to-one in the initial RCPs; however, efforts to derive
socioeconomic pathways consistent with each RCP are discussed in
Chapter 20.
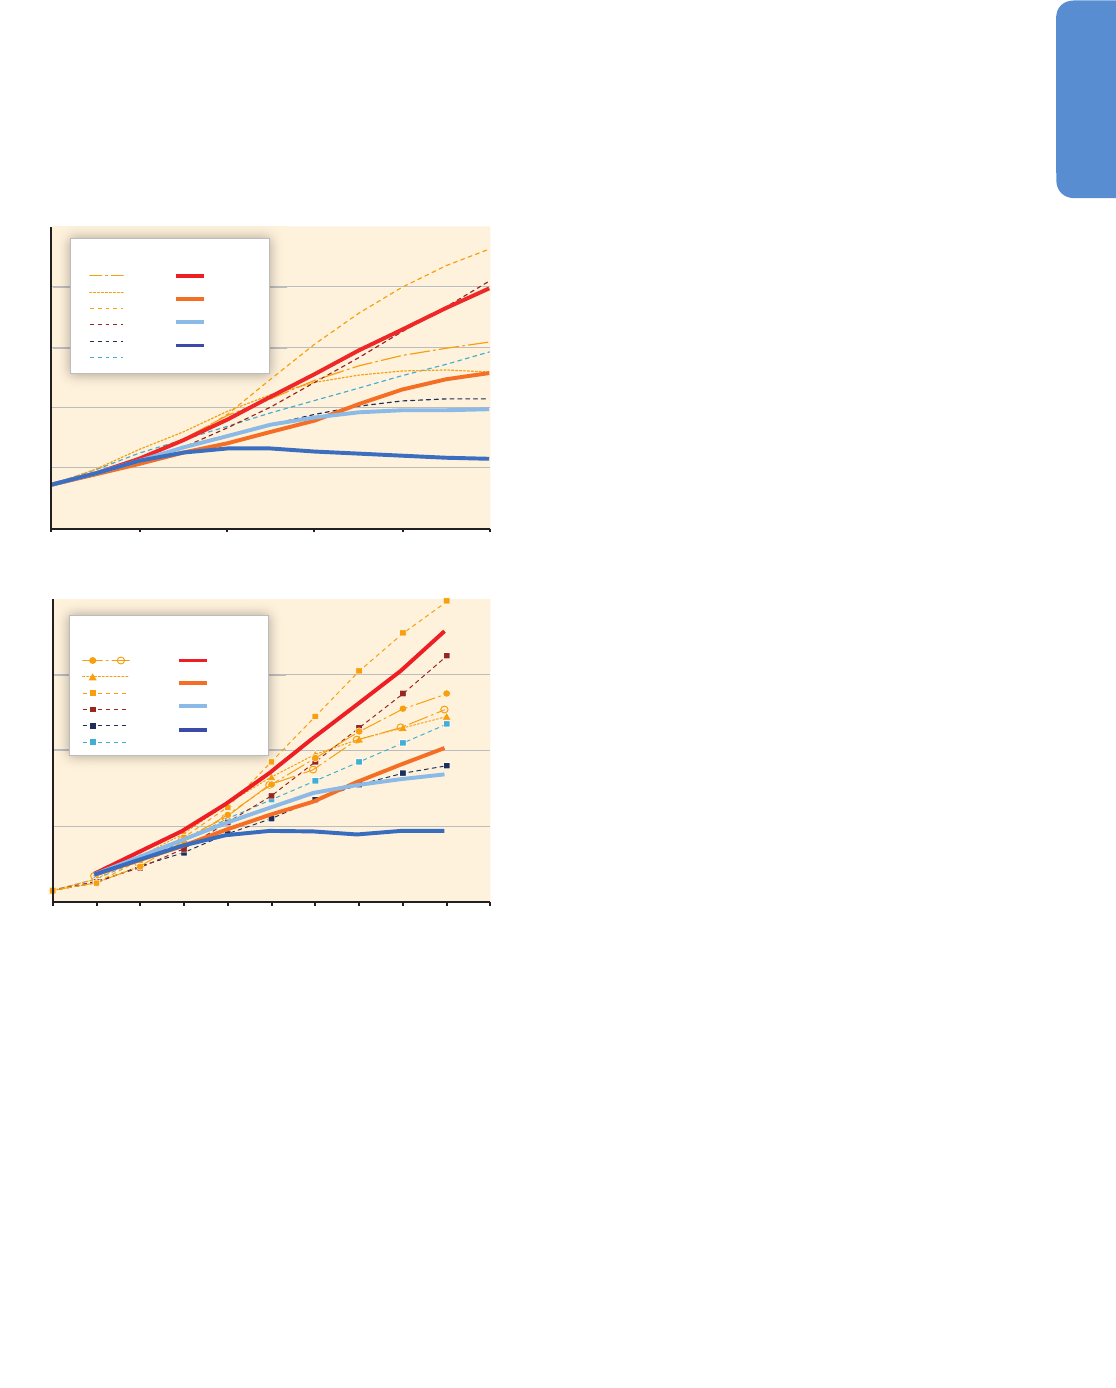
1.1.3.1. Comparison of RCP and SRES Scenarios
Whereas WGI AR5 is based primarily on results from the RCP CMIP5,
the WGII AR5 also uses results from the SRES CMIP3, and thus identifies
similar or parallel scenarios from each set. The radiative forcing from
the SRES and RCP scenarios is compared in Figure 1-4a. For the latter
half of the 21st century, SRES A1FI lies above all RCP and other SRES;
SRES A2 has a similar trajectory to RCP8.5 with both reaching about
8 W m
–2
by 2100; and SRES B1 approximately matches RCP4.5 with
both leveling off at about 4 W m
–2
. RCP6.0 starts similarly to both
RCP4.5 and SRES B1, but after 2060 it increases to about 5 W m
–2
.
RCP2.6, a strong mitigation scenario with net CO
2
removal by 2100,
falls well outside the SRES range B1 to A2, peaking at about 2.6 W m
–2
in 2040 and dropping thereafter (WGI AR5 Figure 1-15, Tables AII.6.1
to AII.6.10).
Total RF does not adequately describe the differences in climate change
between SRES and RCP scenarios. All RCPs adopted stringent air
pollution mitigation policies and thus have much lower tropospheric
ozone and aerosol abundances than the SRES scenarios, which ignored
the role of air quality regulations (WGI AR5 Tables AII.2.16 to AII.2.22).
In terms of ozone and particulate matter precursor emissions, there is
almost no overlap between SRES and RCP scenarios (WGI AR5 Tables
AII.2.16 to AII.2.22). In terms of surface ozone at the continental scale,
after 2060 the RCPs are similar to low-end SRES B1 (WGI AR5 Tables
A
II.7.1 and AII.7.2).
Global mean surface temperature change for these scenarios is shown
in Figure 1-4b, based on WGI AR5 (Chapters 11, 12; Tables AII.7.5 and
AII.7.6) and WGI AR4 (Figure 10.26). For purposes here, that is, of
understanding differences in impact studies using different scenarios,
only model CMIP5 ensemble means are shown for the RCPs. If the
standard deviation of the models were plotted, all RCPs would touch
or overlap through the century (WGI AR5 Table AII.7.5), but even this
range underestimates the uncertainties in temperature change for those
scenarios (see WGI AR5 Chapter 12). The AR5 RCP data are taken
directly from the CMIP5 runs, whereas the AR4 data are based on a
simple model, parameterized to match the different CMIP3 models (see
Figure 1-4 caption). In terms of temperature change, RCP8.5 is close to
SRES A2, but below SRES A1FI. RCP4.5 follows SRES B2 up to 2060, but
then drops to track SRES B1. RCP6.0 has lower temperature change to
start, following SRES B1, but then increases toward SRES B2 by 2100.
In general, scenarios SRES A1B, A1T, and B2 lie in the large gap between
RCP8.5 and RCP4.5/6.0. The RCP2.6 temperature change stabilizes at
about 1°C above the reference period (1986–2005). The other RCPS and
all SRES scenarios span the range 1.8°C to 4.1°C for the 2090s. The
CMIP5 reference period is about 0.6°C above earliest observing period
1850–1900 (WGI AR5 Chapter 2).
1.1.3.2. Shared Socioeconomic Pathways
Shared Socioeconomic Pathways (SSPs) are being generated (Arnell et
al., 2011; Kriegler et al., 2012) to form more complete scenarios that
link each RCP’s climate path to a range of human development pathways.
The SSPs include three elements: (1) storylines, which are descriptions
of the state of the world; (2) IAM quantitative variables (such as
population, gross domestic product (GDP), technology availability); and
(3) other variables, not included in the IAMs, such as ecosystem
productivity and sensitivity or governance index. With these elements
a goal of the SSP effort is to characterize a global socioeconomic future
for the 21st century as a reference for climate change analysis (O’Neill
et al., 2012). Combined SSP–RCP scenarios are needed to support
synthesis across all IPCC Working Groups and, particularly for WGII,
to facilitate the use of new climate modeling results with impacts,
adaptation, and vulnerability (IAV) research. Five basic SSPs have been
proposed, representing a wide range of possible development pathways,
4
The Coupled Model Intercomparison Project is an activity of the World Climate Research Programme’s Working Group on Coupled Modelling. Climate model output from
simulations of the past, present, and future climate archived mainly in 2005–2006 constituted Phase 3 of the Coupled Model Intercomparison Project (CMIP3). Similar climate
simulations by an expanded set of models with a close off date of March 2013 are being used in AR5 and constitute Phase 5 of the project (CMIP5). CMIP3 used the SRES
scenarios, and CMIP5 used the Reference Concentration Pathway (RCP) scenarios.
1
Point of Departure Chapter 1
179
primarily at global or large regional scales. For each RCP it is expected
that one or more SSP could lead to that climate path. Several chapters
of this report refer to the SSPs in their discussion of analyses of future
impacts and vulnerability. Chapter 20 (Section 20.6.1) describes SSPs
in more detail, and Chapter 21 (Section 21.2.2) notes how the time lags
in producing SSPs has limited the use of CMIP5–RCP scenarios in AR5.
1.1.4. Evolution of Understanding the Interaction
between Climate Change Impacts, Adaptation,
and Vulnerability with Human and Sustainable
D
evelopment
The continuing increase in GHG emissions has highlighted the commitment
t
o climate change and its varied impacts and has contributed to an
increasing emphasis on vulnerability, adaptation, and sustainability. The
possible range of socioeconomic trajectories in countries with low,
medium, high, and very high human development is among the largest
sources of uncertainty in scenario building and climate projections. A
deeper understanding of development patterns, adaptation limits, and
maladaptation, as well as options for more climate resilient pathways,
has helped identify a larger range of potential climate change impacts
and the risks they pose to society.
The first three WGII reports focused primarily on characterizing the
biophysical impacts of climate change, with a progressively more
elaborated understanding of economic and social impacts. The literature
of the last decade indicates a more integrated understanding of the
physical and social impacts of climate change. The extent and structure
of WGII AR5 shows such advancements. The AR4 Synthesis Report
asserted that “climate change impacts depend on the characteristics of
natural and human systems, their development pathways and their
specific locations” (IPCC, 2007d, p. 64). WGII AR4 Chapter 20 offered a
catalog of multiple stresses jointly impacting people and communities
and also highlighted questions of justice and equity in shaping
development pathways in the context of climate change.
1.1.4.1. Vulnerability and Multiple Stressors
Climate-related risks interact with other biophysical and social stressors.
Vulnerability is defined in the WGII TAR Glossary in terms of susceptibility
and as a “function of the character, magnitude, and rate of climate
variation to which a system is exposed, its sensitivity, and its adaptive
capacity.” Since then, the understanding of vulnerability has acquired
increased complexity as a multidimensional concept, with more attention
to the relation with structural conditions of poverty and inequality. WGII
AR5 defines vulnerability simply as the propensity or predisposition to
be adversely affected, and many chapters identify such vulnerabilities
through societal risks, particularly in low-income economies. Recent
studies suggest that climate impacts could slow down or reverse past
development achievements; hinder global efforts on poverty reduction;
and lead to human and environmental insecurity, displacement and
conflict, maladaptation, and negative synergies (Jerneck and Olsson,
2008; Boyd and Juhola, 2009; Barnett and O’Neill, 2010; Ogallo, 2010;
see also Sections 3.5.1, 8.2.4, 12.2.1, 12.4.1, 12.5.1, 13.2.1, 14.7).
The concept of resilience emerged from ecological sciences and has
been increasingly used by social sciences. In climate change literature
it describes the ability of a system to respond to disturbances, self-
organize, learn, and adapt (Turner, 2010; Brown, 2013; WGII AR5
Glossary). Vulnerability, adaptation, and resilience are determined by
multiple stressors, a combination of biophysical and social factors that
jointly determine the propensity and predisposition to be adversely
affected. For example, adaptive capacity in many urban centers in less
2000
A
1B
A1T
A1FI
A2
B1
B2
R
CP8.5
RCP6.0
RCP4.5
RCP2.6
2020 2040 2060 2080 2100
2000s
4
10
8
6
4
2
0
3
2
1
0
2020s
2040s 2060s 2080s 2100s
Mean surface temperature change (°C)
0°C = 1986–2005
Radiative forcing relative to pre-industrial (W m
–2
)
S
RES (TAR) RCP (AR5)
(a)
(b)
A1B
A1T
A1FI
A2
B1
B2
RCP8.5
RCP6.0
RCP4.5
RCP2.6
SRES CMIP3 RCP CMIP5
AR4 AR5
Figure 1-4 | (a) Projected radiative forcing (RF, W m
–2
) and (b) global mean surface
temperature change (°C) over the 21st century using the Special Report on Emissions
Scenarios (SRES) and Representative Concentration Pathway (RCP) scenarios. RF for
the RCPs are taken from their published CO
2
-equivalent (Meinshausen et al., 2011),
and RF for SRES are from the Third Assessment Report Appendix II (Table II.3.11). For
RF derived from the Coupled Model Intercomparison Project Phase 5 (CMIP5) models,
see WGI (Section 12.3; Tables AII.6.9, 6.10). The ensemble total effective RF at 2100
for CMIP5 concentration-driven projections are 2.2, 3.8, 4.8, and 7.6 W m
–2
for
RCP2.6, RCP4.5, RCP6.0, and RCP8.5, respectively. The SRES RF are shifted upward by
0.12 W m
–2
to match the RCPs at year 2000 because the climate change over the 21st
century is driven primarily by the changes in RF and the offset is due primarily to
improvements in model physics including the aerosol RF. For more details and
comparison with pre-SRES scenarios, see WGI AR5 Chapter 1 (Figure 1-15).
Temperature changes are decadal averages (e.g., 2020s = 2016–2025) based on the
model ensemble mean CMIP5 data for the RCPs (colored lines). The same analysis is
applied to CMIP3 SRES A1B (yellow circles). See WGI AR5 Chapters 11, 12; Table
AII.7.5. The colored squares show the temperature change for all six SRES scenarios
based on a simple climate model tuned to the CMIP3 models (WGI AR4 Figure 10.26).
The difference between the yellow circles and yellow squares reflects differences
between the simple model and analysis of the CMIP3 model ensemble in parallel with
the CMIP5 data. For an assessment of uncertainties and likely ranges of temperature
change, see WGI AR5 Figures 11.24, 11.25, 12.4, 12.5, 12.40.

1
Chapter 1 Point of Departure
180
developed countries is constrained by poverty, unemployment, quality
of housing, or lack of access to potable water, sanitation, health care,
and education interacting with land degradation, water stress, or
biodiversity loss (Sections 8.2.4, 11.6.2, 22.4.4). Adaptation options and
limits for high-end warming scenarios are often contextualized in
relation to socioeconomic vulnerabilities and other stressors (Gupta et
al., 2010; New et al., 2010; Stafford Smith et al., 2011; Brown, 2012;
World Bank, 2012; see also Section 16.4.2.4).
1.1.4.2. Adaptation, Mitigation, and Development
Impacts of climate change will vary across regions and populations,
through space and time, dependent on myriad factors including non-
climate stressors and the extent of mitigation and adaptation. Changes
in both climate and development are key drivers of the core components
of risk (exposure, vulnerability, and physical hazards). The relations with
development are complex and contested. There is disagreement about
fundamental issues, such as the compatibility of development goals and
climate change mitigation, the prioritization of responses (reducing
consumption versus investment in sustainable technologies), and the
stage of development at which countries should take action (see Box
1-2 for terms used to characterize stages of development) (Schipper,
2007; Grist, 2008; Brooks et al., 2009). The literature points to how
inequalities, trade imbalances, intellectual property rights, gender injustice,
or agricultural systems, inter alia, cannot be addressed with development
focusing solely on increasing economic growth (Pogge, 2008; McMichael,
2009; Alston, 2011; UNDP, 2007, 2011; Büscher et al., 2012; OECD, 2013).
The recent literature shows increasing attention to questions of ethics,
justice, and responsibilities relating to climate change (Timmons and
Parks, 2007; O’Brien et al., 2010; Pelling, 2010; Arnold, 2011; Gardiner,
2011; Caney, 2012; Marino and Ribot, 2012). As basic resources such
as energy, land, food, or water become threatened, inequalities and
unfairness may deepen, leading to maladaptation and new forms of
vulnerability. Responses to climate change may have consequences and
outcomes that favor certain populations or regions. For example, there
are increasing cases of land-grabbing and large acquisitions of land or
water rights for industrial agriculture, mitigation projects, or biofuels that
have negative consequences on local and marginalized communities
(Borras et al., 2011; see also Section 14.7). Ethical perspectives are also
important in relation to adaptation constraints and limits (see Section
16.7) and mitigation (see Section 1.3.4 and WGIII AR5).
Climate change impacts have become a central issue in the work of
developmental organizations such as the United Nations specialized
agencies, bilateral donor institutions, and non-governmental organizations
(NGOs) that link adaptation concerns with ongoing development efforts.
The increase in adaptation literature and experience, however, has led to
the development of adaptation policies in many parts of the world, as
reflected in four chapters here devoted to adaptation (14 to 17) and all of
the regional chapters of this report. At the policy level, individual country
National Adaptation Programmes of Action and National Communication
reports to the United Nations Framework Convention on Climate
Change (UNFCCC) had in the past focused primarily on physical climate
change drivers and impacts. An analysis of National Communications
documents submitted through 2004 by many of the Annex 1 countries,
for example, showed that climate change impacts and adaptation receive
very limited attention relative to the discussion of GHG emissions and
mitigation policies (Gagnon-Lebrun and Agrawala, 2006). However,
concern and actual progress toward adaptation is evident in Latin America
(Gutierrez and Espinosa, 2010) and in recent National Communications
of some non-Annex 1 countries, such as India (2012) and Iran (2010),
which devoted a substantive part of their recent reports to the topic of
adaptation.
Some researchers and institutions have sought to identify a continuum
between development, adaptation strategies, and financing, including
increasing attention to co-benefits with mitigation (USAID, 2008; Heltberg
et al., 2009; Mearns and Norton, 2010; World Bank, 2010; Richardson
et al., 2011; OECD, 2013). “Greener” development and market-based
mechanisms are being explored as instruments to achieve synergies
Frequently Asked Questions
FAQ 1.3 | How has our understanding of the interface between human, natural, and
climate systems expanded since the 2007 IPCC Assessment?
Advances in scientific methods that integrate physical climate science with knowledge about impacts on human
and natural systems have allowed the new assessment to offer a more comprehensive and finer-scaled view of the
impacts of climate change, vulnerabilities to those impacts, and adaptation options, at a regional scale. That’s
important because many of the impacts of climate change on people, societies, infrastructure, industry, and ecosystems
are the result of interactions between humans, nature, and specifically climate and weather, at the regional scale.
In addition, this new assessment from Working Group II greatly expands the use of the large body of evidence from
the social sciences about human behavior and the human dimensions of climate change. It also reflects improved
integration of what is known about physical climate science, which is the focus of Working Group I of the IPCC,
and what is known about options for mitigating greenhouse gas emissions, the focus of Working Group III. Together
this coordination and expanded knowledge inform a more advanced and finer-scaled, regionally detailed assessment
of interactions between human and natural systems, allowing more detailed consideration of sectors of interest to
Working Group II such as water resources, ecosystems, food, forests, coastal systems, industry, and human health.

1
Point of Departure Chapter 1
181
between mitigation and adaptation efforts, development financing, and
planning, and links to energy needs are some of the instruments explored.
Large concerns remain, however, about the preconditions needed for
market mechanisms to work as intended, the problems of carbon leakage,
and the potential negative effects of some mitigation strategies (Liverman,
2010; see also Section 13.1.3 and WGIII AR5 Chapter 15).
1.1.4.3. Transformation and Climate-Resilient Pathways
Transformation—a change in the fundamental attributes of a system
including altered goals or values—has emerged as a key concept in
describing the dimensions, types, and rates of societal response to
climate change. In the context of adaptation, we can distinguish
between incremental and transformative adaptation, the latter referring
to changes in the fundamental attributes of a system in response to
climate change and its effects (WGII AR5 Glossary; Park et al., 2012).
The Special Report on Managing the Risks of Extreme Events and
Disasters to Advance Climate Change Adaptation (SREX) recognized
transformation in technological, financial, regulatory, legislative, and
administrative systems (IPCC, 2012; see Sections 1.3.1, 20.5). Recent
literature points to changes in values, norms, belief systems, culture,
and conceptions of progress and well-being as either facilitating or
preventing transformation (Pelling, 2010; Stafford Smith et al., 2011;
Kates et al., 2012; O’Brien, 2013). Transformation of this nature requires
a particular understanding of risks, adaptive management, learning,
innovation, and leadership, and may lead to climate resilient development
pathways (see Section 1.2.3 and Chapter 20). Transformational change
is not called for in all circumstances (Pelling, 2010) and in some cases
may lead to negative consequences for some locations or social groups,
contributing to social inequities (O’Brien, 2013). Climate resilient
pathways include actions, strategies, and choices that reduce climate
change impacts while assuring that risk management and adaptation
can be implemented and sustained.
1.1.4.4. The Opportunity Space for Decision Making
Recognizing the need for policy-relevant science, much scientific activity
tends to be coordinated through international programs that focus on,
for example, biodiversity, desertification, food security, impacts on social
practices and institutions, and monitoring sea level rise. The trend in
Box 1-2 | Country Development Terminology
There are diverse approaches for categorizing countries on the basis of their level of development and for defining terms such as
industrialized, developed, or developing. Table 1-1 presents selected categorizations used in this report. In the United Nations system,
t
here is no established convention
for the designation of developed
and developing countries or areas
(UN DESA, 2012). The United
Nations Statistics Division specifies
developed and developing regions
based on “common practice.” In
addition, specific countries are
designated as least developed
countries, landlocked developing
countries, small island developing
states, and transition economies.
Many countries appear in more than
one of these categories. The World
Bank uses income as the main
criterion for classifying countries
(World Bank, 2013). The UNDP
aggregates indicators for life
expectancy, educational attainment,
and income into a single composite
Human Development Index (HDI)
(UNDP, 2013).
Categorization
app roach
Categories Criteria Reference
United Nations
•
D
eveloping regions
•
D
eveloped regions
C
ommon practice UN DESA (2012)
Least developed countries
• Gross National Income (GNI) per capita
•
H
uman assets
• Economic vulnerability to external shocks
UN DESA (2008)
L
andlocked developing
countries
•
L
ack of territorial access to the sea
•
R
emoteness and isolation from world markets
• High transit costs
U
N (2003)
S
mall island developing
states
L
ow-lying coastal countries sharing
similar socioeconomic and environmental
v
ulnerabilities
U
N (1993)
Economies in
transition / transition
e
conomies
Countries changing from central planning to
free markets
UN DESA (2013)
World Bank
• Low income
• Lower middle income
• Upper middle income
• High income
GNI per capita World Bank (2013)
UNDP
• Low human
development
• Medium human
development
• High human
development
• Very high human
development
• GNI per capita
• Life expectancy at birth
• Mean years of schooling
• Expected years of schooling
UNDP (2013)
Table 1-1 | Selected country development categorizations used in this report.
1
Chapter 1 Point of Departure
182
research is to create synergies across the sciences by including social and
human sciences perspectives and transdisciplinarity. The production of
information with non-scientific sources such as indigenous knowledge
or stakeholder views is also enriching climate change research. This trend
has led to the merging of relevant global programs of the international
councils for science and for social science (ICSU and ISSC) under the
umbrella “Future Earth” (see also ISSC and UNESCO, 2013). This
expanded scientific focus combined with increased practice and
experience with adaptation creates a new opportunity space for
e
valuating policy options and their risks in the search for climate
resilient development pathways (Figure 1-5) (Sections 2.1, 2.4.3, 20.2,
20.3.3). Human and social-ecological systems can build resilience
through adaptation, mitigation, and sustainable development.
Over the next few decades, global temperatures are projected to
increase along broadly similar pathways, whether or not mitigation of
GHGs occurs (Section 1.3.3). During this near-term era of committed
climate change, risks will evolve as socioeconomic trends interact with
the changing climate and societal responses, including adaptation, will
influence near-term outcomes. In the second half of the 21st century
and beyond, global temperature increases diverge across emissions
scenarios. During this longer term era of climate options, near-term and
ongoing mitigation efforts as well as development trajectories will
determine the risks associated with climate change.
1.2. Major Conclusions of the Working Group II
Fourth Assessment Report
This section presents highlights of the IPCC Fourth Assessment Report
that are particularly relevant to AR5 as a point of departure. These
highlights are drawn from the AR4 Synthesis Report, the WGII AR4
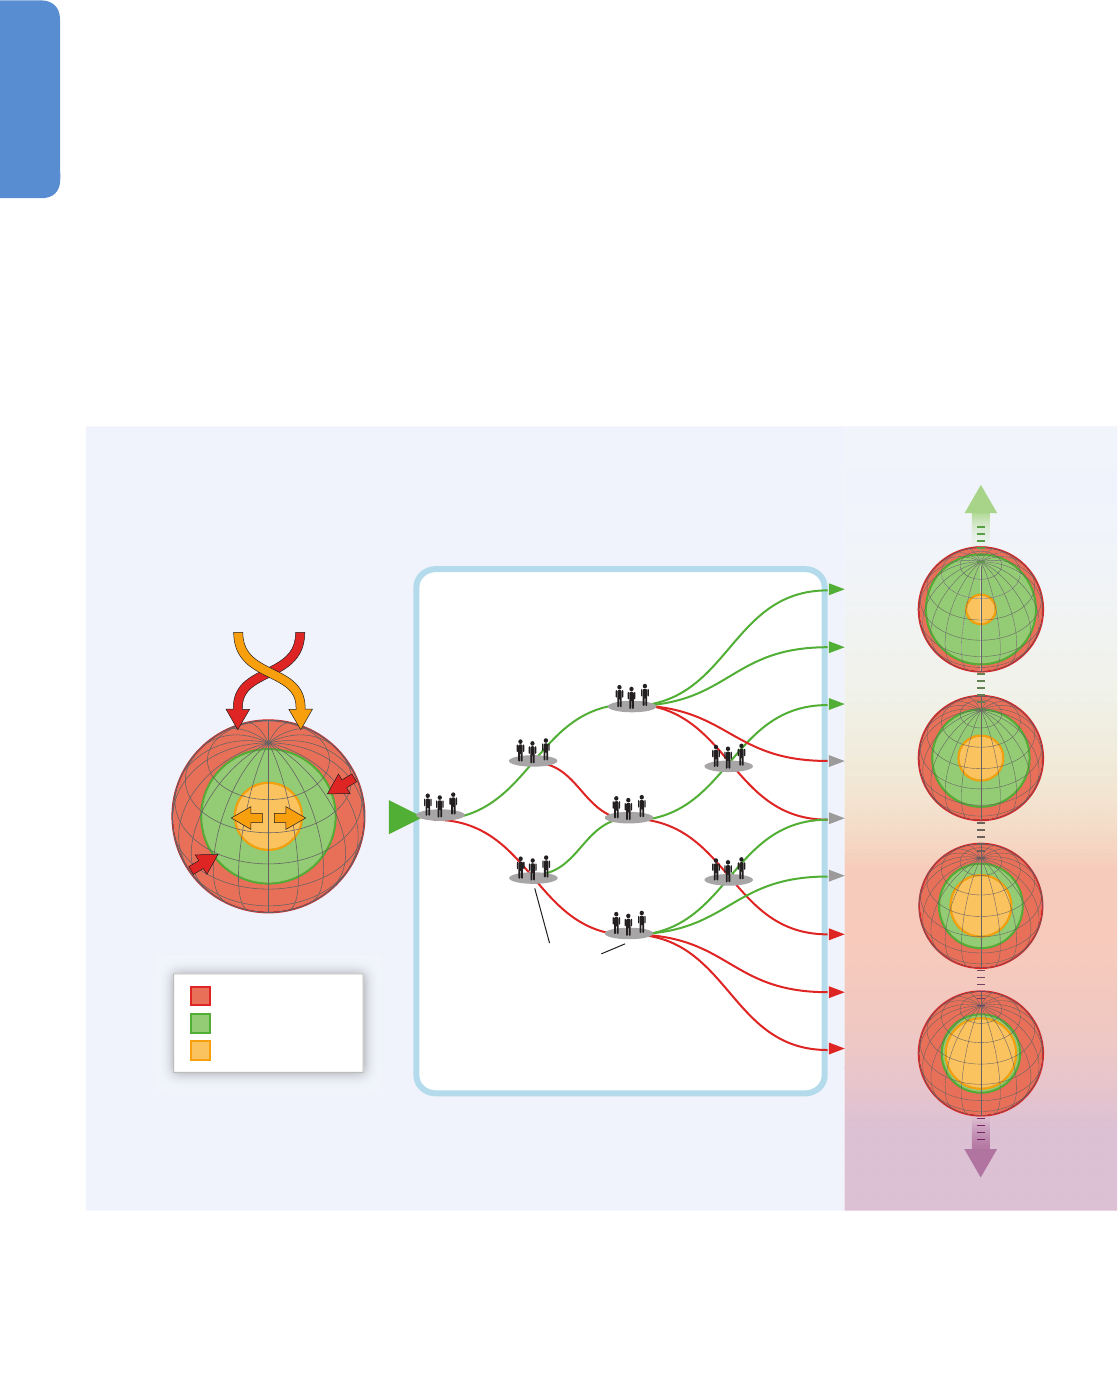
Low risk High resilience
(D) Decision points
(E) Climate-resilient pathways
Low resilience High risk
(B) Opportunity space
(F) Pathways that lower resilience
(C) Possible futures
Resilience space
Multiple stressors
including
climate change
(A) Our world
Social stressors
Biophysical stressors
Figure 1-5 | Opportunity space and climate-resilient pathways. (a) Our world is threatened by multiple stressors that impinge on resilience from many directions, represented here simply as
biophysical and social stressors. Stressors include climate change, climate variability, land-use change, degradation of ecosystems, poverty and inequality, and cultural factors. (b) Opportunity
space refers to decision points and pathways that lead to a range of (c) possible futures with differing levels of resilience and risk. (d) Decision points result in actions or failures-to-act
throughout the opportunity space, and together they constitute the process of managing or failing to manage risks related to climate change. (e) Climate-resilient pathways (in green) within
the opportunity space lead to a more resilient world through adaptive learning, increasing scientific knowledge, effective adaptation and mitigation measures, and other choices that reduce
risks. (f) Pathways that lower resilience (in red) can involve insufficient mitigation, maladaptation, failure to learn and use knowledge, and other actions that lower resilience; and they can be
irreversible in terms of possible futures.

1
Point of Departure Chapter 1
183
Summary for Policymakers (SPM), and the WGII AR4 chapter Executive
Summaries.
1
.2.1. Observed Impacts
Evidence presented in WGII AR4 Chapter 1 indicated that physical and
b
iological systems on all continents and in most oceans were being
affected by recent climate changes, particularly regional temperature
increases (Rosenzweig et al., 2007, p. 81). In terrestrial ecosystems,
warming trends were consistent with observed change in the timing of
spring events and poleward and upward shifts in plant and animal
ranges. The authors found that the geographical locations of observed
changes during the period 1970–2004 are consistent with spatial patterns
of atmospheric warming. The types of hydrologic changes reported
included effects on snow, ice, and frozen ground; the number and size
of glacial lakes; increased runoff and earlier spring peak discharge in
many glacier- and snow-fed rivers; thermal structure and water quality
of rivers and lakes; and more intense drought and heavy rains in some
regions. The authors concluded from a synthesis of studies “that the
spatial agreement between regions of significant warming and the
locations of significant observed changes is very unlikely to be due
solely to natural variability of temperatures or natural variability of the
systems” (IPCC, 2007c, p. 9).
Observed regional impacts to human systems were less obviously
attributed to anthropogenic climate change. AR4 authors concluded
that “There is medium confidence that other effects of regional
climate change on natural and human environments are emerging,
although many are difficult to discern due to adaptation and
non-climatic drivers” (IPCC, 2007d, p. 3). They presented evidence
on the effects of temperature increases on agricultural and forest
management at Northern Hemisphere (NH) higher latitudes (e.g., earlier
spring planting of crops, alterations in disturbance regimes of forests
due to fires and pests); on some aspects of human health (e.g., heat-
related mortality in Europe, changes in infectious disease vectors in
some areas, and allergenic pollen in NH high and mid-latitudes); and
some human activities in the Arctic (e.g., hunting and travel over snow
and ice) and in lower-elevation alpine areas (such as mountain sports).
The authors of AR4 concluded that “Recent climate changes and climate
variations are beginning to have effects on many other natural and
human systems. However, based on published literature, the impacts
have not yet become established trends” (IPCC, 2007c, p. 9). Three
examples were cited: in mountain regions melting glaciers enhanced risk
of glacier lake outburst floods on settlements; in the Sahelian region of
Africa warmer and drier conditions had detrimental effects on some crops;
and in coastal areas sea level rise and human development contributed
to losses of coastal wetlands and mangroves and to increases in damage
from coastal flooding.
1.2.2. Key Vulnerabilities, Risks, and Reasons for Concern
In an effort to provide some insights into the seriousness of the impacts
of climate change WGII TAR (Chapter 19) identified five ‘‘Reasons for
Concern’’ (RFC) focusing on (1) unique and threatened systems, (2)
extreme climate events, (3) distribution of impacts, (4) aggregate impacts,
and (5) large-scale discontinuities (see Figure SPM-2 in IPCC, 2001b).
Considering new evidence of observed changes on every continent,
coupled with more thorough understanding of the concept of vulnerability,
the AR4 concluded that the five “reasons for concern identified in the
TAR remained a viable framework to consider key vulnerabilities” (IPCC,
2007d, p. 19).
The AR4 Synthesis Report SPM concluded with the following key
m
essage: Responding to climate change involves an iterative risk
management process that includes both adaptation and mitigation
and takes into account climate change damages, co-benefits,
sustainability, equity and attitudes to risk (IPCC, 2007d, p. 22). The
concept of risk (the confluence of likelihood and consequence) is the
focus of this AR5 Report. All chapters, especially 2, 18, and 19, now
focus on climate change, related stressors, resulting vulnerabilities, and
associated risks. Correlating the risk-based framing of the RFC in WGII
AR5 with the conclusions reported in the AR4 SPM is straightforward
(italics indicate new terms that have been added to the RFC definitions
from the IPCC, 2007d, p. 19):
• Risks to Unique and Threatened Systems: “There is new and stronger
evidence of observed impacts of climate change on unique and
vulnerable systems (such as polar and high mountain communities
and ecosystems), with increasing levels of adverse impacts as
temperatures increase.”
• Risks Associated with Extreme Weather Events: “Responses to some
recent extreme events reveal higher levels of vulnerability than the
TAR. There is now higher confidence in the projected increases in
droughts, heat waves, and floods, as well as their adverse impacts.”
• Risks Associated with the Distribution of Impacts: “There are sharp
differences across regions and those in the weakest economic
position are often the most vulnerable to climate change. There is
increasing evidence of greater vulnerability of specific groups such
as the poor and elderly not only in developing but also in developed
countries. Moreover, there is increased evidence that low-latitude
and less developed areas generally face greater risk, for example,
in dry areas and megadeltas.”
• Risks Associated with Aggregate Impacts: “Compared to the TAR,
initial net market-based benefits from climate change are projected
to peak at a lower magnitude of warming, while damages would
be higher for larger magnitudes of warming.”
• Risks Associated with Large-Scale Discontinuities: “There is high
confidence that global warming over many centuries would lead
to a sea level rise contribution from thermal expansion alone that
is projected to be much larger than observed over the 20th century,
with loss of coastal area and associated impacts. There is better
understanding than in the TAR that the risk of additional contributions
to sea level rise from both the Greenland and possibly Antarctic ice
sheets may be larger than projected by ice sheet models and could
occur on century time scales.”
WGII AR5 Chapters 18 and 19 recognize new evidence about the RFC
in the context of risk. Chapter 18 expands our understanding of how
observed and attributed impacts, vulnerabilities, and associated risks
support the identification of the dependence of the RFC on temperature
“up to the present.” Chapter 19 extends this analysis to future
temperatures. Both chapters demonstrate how accounting for both

1
Chapter 1 Point of Departure
184
components of risk in assessing the RFC permits a clearer understanding
of “key vulnerabilities.”
1.2.3. Interaction of Adaptation and Mitigation
in a Policy Portfolio
A conclusion of AR4 is that coping with risks of climate change will
involve a portfolio of initiatives that will evolve iteratively over time as
n
ew information about the workings of the climate system and new
insights into how various responses are actually working and penetrating
the global socioeconomic structure. The WGII AR4 concluded that (1)
neither adaptation nor mitigation alone can avoid all climate change
impacts, though together they can significantly reduce the risks of
climate change; (2) adaptation is necessary in the short and longer term
to address impacts, even for the lowest stabilization scenarios assessed,
but there are barriers, limits, and costs, though these are not fully
understood; (3) unmitigated climate change would likely exceed the
adaptive capacity of natural, managed, and human systems in the long
term; and (4) while many impacts can be reduced, delayed, or avoided
by mitigation, delayed emission reductions “significantly constrain the
opportunities to achieve lower stabilization levels and increase the risk
of more severe climate change impacts.” (IPCC, 2007d, p. 19).
WGII AR5 devotes considerable attention to the interface of adaptation
and mitigation and the mechanisms for iterating decisions as described
in a collection of chapters (16, 17, 19, and 20) designed explicitly for
this purpose. These chapters build substantially upon key messages from
the AR4 chapter entitled “Inter-relationships between adaptation and
mitigation” (IPCC, 2007b, p. 747), including:
• Even the most stringent mitigation efforts cannot avoid further
impacts of climate change in the next few decades, which makes
adaptation unavoidable.
• Without mitigation, a magnitude of climate change is likely to be
reached that makes adaptation impossible for some natural systems,
while for most human systems it would involve very high social and
economic costs.
• “Creating synergies between adaptation and mitigation can
increase the cost-effectiveness of actions and make them
more attractive to stakeholders, including potential funding
agencies (medium confidence).” Such synergies, however, provide
no guarantee that resources are used in the most efficient manner
and opportunities for synergies are greater in some sectors (e.g.,
agriculture and forestry) than others (e.g., energy, health, and
coastal systems).
• “It is not yet possible to answer the question as to whether or
not investment in adaptation would buy time for mitigation
(high confidence).” Barriers to understanding the trade-offs of
the immediate benefits of localized adaptation and the longer term
global benefits of mitigation, coupled with the limitation of models
to simulate the intricacies of the interactions of the two, present a
c
hallenge to designing and implementing an “optimal mix” of
response strategies.
• “People’s capacities to adapt and mitigate are driven by
similar sets of factors (high confidence). These factors represent
a generalized response capacity that can be mobilized for both
adaptation and mitigation.” The authors noted that even societies
with high adaptive capacity can be vulnerable to climate change,
variability, and extremes.
1.3. Major Conclusions
of More Recent IPCC Reports
Since publication of the AR4 in 2007, the IPCC has produced two Special
Reports: the Special Report on Renewable Energy Sources and Climate
Change Mitigation, produced by Working Group III and published in
2011; and the Special Report on Managing the Risks of Extreme Events
and Disasters to Advance Climate Change Adaptation, produced jointly
by WGI and WGII and published in 2012. In addition, the AR5 cycle has
staggered the assessment work for its three working groups. WGI AR5
was released in September 2013, and WGIII AR5 will be published after
WGII AR5 in 2014. In this section we summarize the major conclusions
of the SREX, the SRREN, WGI AR5, and preliminary findings from WGIII
AR5. We focus on the key findings, framings, and conceptual innovations
these reports bring to WGII AR5.
One common theme that cuts across the Working Groups is the
connection of three basic elements of climate change: (1) detection of
climate change or its impacts; (ii) attribution of that observed climate
change to the increases in GHGs (i.e., human cause, WGI) or attribution
of local impacts to the observed climate change in that region; and (3)
projection of these impacts and climate change into the 21st century.
Table 1-2 gives a summary of phenomena for which such detection,
Increasing overall
Decreasing overall
More regions increasing
than decreasing
More regions decreasing
than increasing
Regionally varies or no
clear trend
Trend Confidence assessment
Likelihood assessment
HC
MC
LC
X
–
High or Very High confidence
Medium confidence
Low confidence
Very low confidence or
No formal confidence level given
No explicit assessment made
****
***
**
*
Virtually certain 99–100%
Likely 66–100%
Very likely 90–100%
Extremely likely 95–100%
Findings assigned a likelihood term are
associated with high or very high confidence.
Attributable
to observed
climate
change
Attributable
to human
influence
Occurs in
21st century
Attribution
Projected
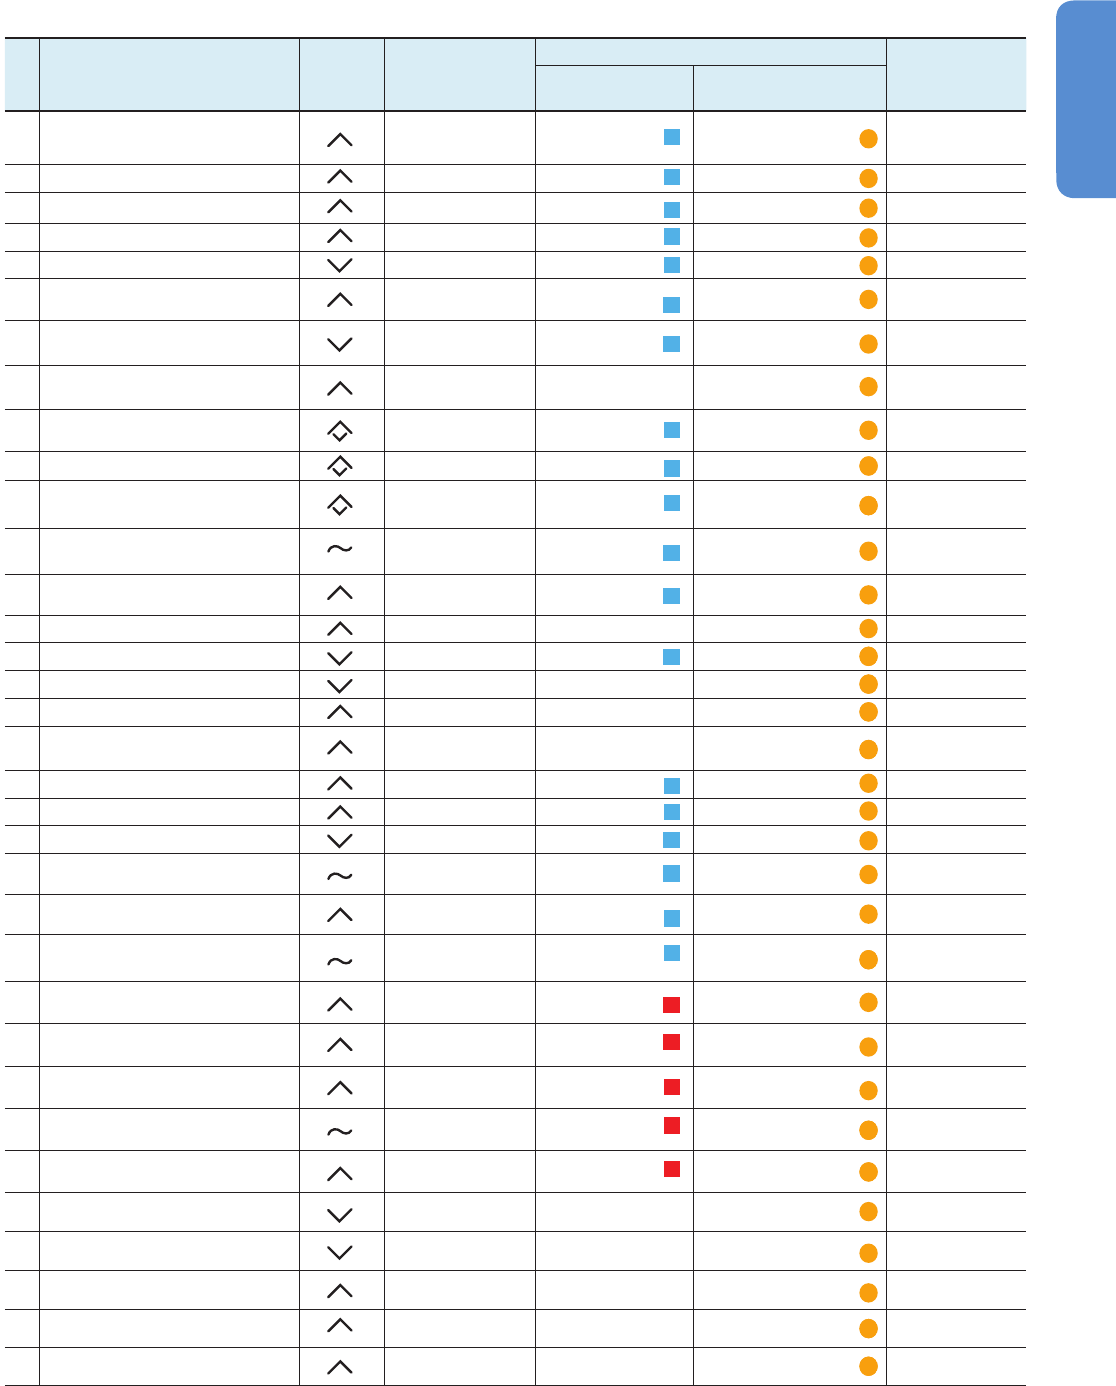
1
Point of Departure Chapter 1
185
P
henomenon Change
Observed to 2010
(
X-axis, Figure 1-6)
Y-axis, Figure 1-6
S
ource
Attribution
P
rojected
2050-2100
1 Greenhouse gases: CO
2
, CH
4
, N
2
O
**** ****
*
***
(RCPs: CO
2
,N
2
O)
AR5 I-2, I-10, I-11, I-12
2 Global Mean Surface Air Temperature (GMST)
**** *** ****
AR5 I-2, I-10, I-11, I-12
3
GMST over all continents except Antarctica
**** * ****
A
R5 I-2, I-10, I-11, I-12
4 Global mean sea level
*
*** ** ****
AR5 I-3, I-10, I-13
5Arctic sea ice cover
**** ** **
AR5 I-4, I-10, I-11, I-12
6Hot days and nights over land
(warmth, frequency)
** ** ****
AR5 SPM-1
7Cold days and nights over land
(warmth, frequency)
** ** ****
AR5 SPM-1
8 Extreme high sea level
(incidence, magnitude)
* (since 1970) X **
AR5 SPM-1
9Heat waves and warm spells over land
(frequency, duration)
MC * **
AR5 SPM-1
10 Heavy precipitation events
* MC **
AR5 I-2, I-10, I-12
11 Drought
(intensity, duration)
MC
(some regions)
LC *
AR5 SPM-1, SREX-4
12 Tropical cyclones
(
intensity, frequency, some basins)
LC LC
MC (intensity increase,
some basins)
AR5 SPM-1
13 Global mean precipitation
LC LC ****
AR5 I-2, I-10, I-11, I-12
14 Contrast between wet and dry regions
X X HC
AR5 I-12
15 Snow cover (Northern Hemisphere, extent)
HC HC HC
AR5 I-4, I-10, I-12
16 Permafrost regions (degrade)
MC X MC
AR5 I-4, I-12
17 Storm tracks (shift poleward)
* X *
AR5 I-2, I-12
18 Wave heights (different oceans)
MC (N. Atlantic) X
** *
(Arctic a) (Southern b)
AR5 I-3, I-13
19 Upper ocean (warming)
**** *** ***
AR5 I-3, I-10, I-11, I-12
20 Ocean acidifi cation
**** *** ****
AR5 I-3, I-10, I-6
21 Oceanic oxygen
MC MC **
AR5 I-3, I-10, I-6
22 Floods (magnitude, frequency)
LC LC LC
SREX-3
23 Mountain phenomena (slope instabilities,
mass movement, glacial lake outbursts)
HC HC HC
SREX-3, AR4 SyR
24 Monsoons
LC LC LC
SREX-3
25 Plant and animal species
(move poleward or up in altitude)
HC HC HC
AR4 II-SPM, AR4-SyR
26 Mountain phenomena (slope instabilities,
mass movement, glacial lake outbursts)
HC HC HC
SREX-3, AR4 SyR
27 Timing of spring events (earlier leafi ng,
greening, planting, bird migration, etc.)
HC HC HC
AR4 SyR
28 Marine/freshwater biological systems (shifts in
algal, plankton, and fi sh ranges)
HC HC HC
AR4 SyR
29 Human health (heat-related mortality,
infectious disease vectors)
MC MC X
AR4 SyR
30 Water resources
X X HC (many regions)
AR4 SyR-SPM
31 Mountain glaciers
HC X HC
AR4 II-SPM
32 Coral degradation, bleaching
HC – HC
AR4 II-SPM, SyR-SPM
33 Economic losses from weather- and climate-
related disasters
HC X HC
SREX-4
34 Annual costs of climate change
X X **
AR4 SyR-SPM
T
able 1-2 |
C
onfi dence in the observation, attribution, and projection of changes in climate system phenomena.
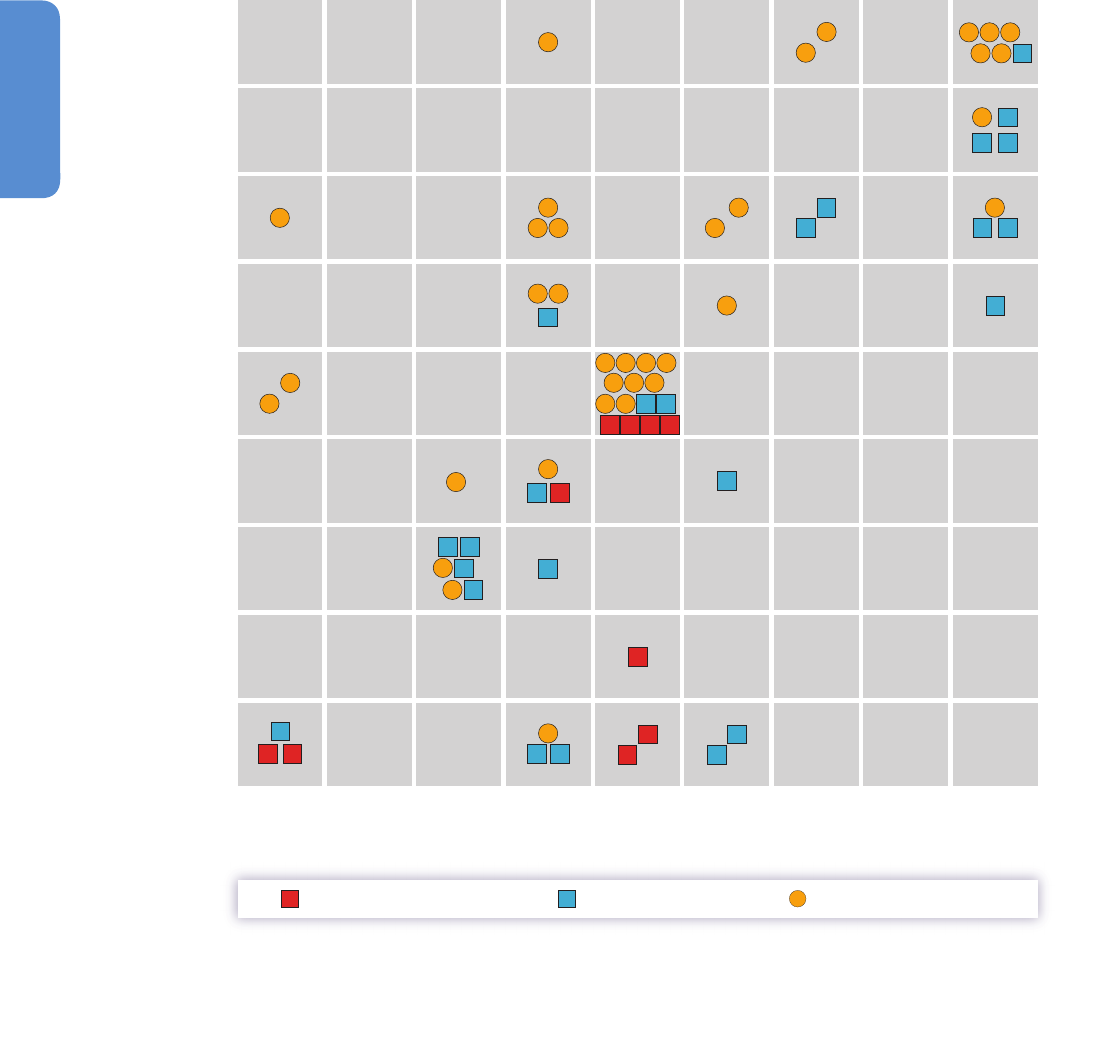
1
Chapter 1 Point of Departure
186
attribution, or projection has been made across the Working Groups.
A schematic presentation of this detection–attribution–projection
sequence from preceding reports is given in Figure 1-6. For WGII AR5
attributions, see Chapter 18; and for projections, see the other chapters.
1.3.1. Special Report on Renewable Energy Sources and
Climate Change Mitigation
SRREN (IPCC, 2011) assesses literature on the challenges of integrating
renewable energy sources into existing energy sources to meet the
goals of climate change mitigation and sustainable development. More
specifically, it examines six renewable energy sources (bioenergy, direct
solar energy, geothermal energy, hydropower, ocean energy, and wind
energy) in terms of available technologies, technological potential, and
associated costs. SRREN found that the deployment of renewable energy
technologies has increased rapidly in recent years, often associated with
cost reductions that are expected to continue with advancing technology.
Despite the small contribution of renewable energy to current energy
supplies, SRREN shows the global potential of renewable energy to be
substantially higher than the global energy demand. It is therefore not
the technological potential of renewable energy that constrains its
development, but rather economic factors, system integration,
infrastructure constraints, public acceptance, and sustainability concerns
Low
confidence
Medium
confidence
Not
assessed
Very low /
No confidence
Likely
High
confidence
Very likely
Extremely
likely
Virtually
certain
Low
confidence
Medium
confidence
Not
assessed
Very low /
No confidence
Likely
High
confidence
Very likely
Extremely
likely
Virtually
certain
Assessment of the detection of phenomenon
Assessment of attribution or projection
Attributed to human influenceAttributed to observed climate change
Projected to occur in 21st century
112
5
4
5
34
7
6
8
10
8
17
3316
14
1830 34
2929
21 29
12 13
22 22
24 24
1
6
21 18
a
9
13
34
1
4
30
12
11
1
5 23 25
27 28 31
32 33 15 23
25 26 27 28
2
6
18
b
9
31
32
11
17
7
6
2
19
20
20
19
3
10
Figure 1-6 | Confidence in the attributed (squares) and projected 21st century (yellow circles) changes in climate system phenomena plotted as a function of confidence in their
detection to date. Phenomena and sources (AR4, SREX, WGI AR5) are given in Table 1-2. Strength of confidence is sorted into the nine bins as noted on the axes (no assessment
was made; a statement was made and assigned no formal confidence level or very low confidence; low confidence; medium confidence; high confidence (no quantification); or
likely; very likely; extremely likely; virtually certain). Attribution is to either human influence (blue squares, as used by WGI) or observed local/regional climate change (red squares,
as used by WGII). Projections assume global warming exceeding 2°C. For AR5 WGII results see, inter alia, Chapters 18 and 19.
1
Point of Departure Chapter 1
187
(IPCC, 2011). Several SRREN findings have clear linkages with this
assessment of climate change impacts, adaptation, and vulnerability,
as summarized in Table 1-3.
1.3.2. Special Report on Managing the Risks of Extreme
Events and Disasters to Advance Climate Change
Adaptation
SREX (IPCC, 2012) is the first IPCC Special Report produced jointly by
Working Groups I and II and is the first IPCC report focused specifically
on risk management. The report integrates perspectives from historically
distinct research communities studying climate science, climate impacts,
extreme events and impacts, climate adaptation, and disaster risk
management. It assesses relationships between climate change and the
characteristics of extreme weather and climate events. SREX provides
information on existing societal exposure and vulnerability to climate-
related extreme events and disasters; observed trends in weather- and
climate-related disasters, disaster losses, and in disaster risk management;
projected changes in weather and climate extremes during the 21st
century; approaches for managing the increasing risks of climate extremes
and disasters; and implications for sustainable development. SREX
Chapter 9 is devoted to 14 case studies that illustrate the impacts of
extreme climate-related events and options for risk management and
adaptation, such as early-warning systems, new forms of insurance
coverage, and expansion of social safety nets.
1.3.2.1. Themes and Findings of Special Report on Managing
the Risks of Extreme Events and Disasters to Advance
Climate Change Adaptation
The most relevant results of the SREX assessment follow. They are
synthesized along these major themes: changing weather and climate-
related extreme events, trends in disaster losses,and managingthe risks
of extreme events and disasters. Other examples of findings presented
in SREX concerning the type, magnitude, and frequency of extreme
weather and climate events are presented in Table 1-2 of this chapter.
• Based on observations since 1950 there is evidence of changes in
some climate-related extremes. It is very likely that there has been
an overall decrease in the number of cold days and nights, and
increase in the number of warm days and nights, at the global scale
(SREX SPM, Section 3.3.1, Table 3-2). It is likely that there has been
an increase in extreme coastal high water events related to
increases in mean sea level (SREX SPM, 3.5.3). It is likely that
anthropogenic influences have led to warming of extreme daily
minimum and maximum temperatures at the global scale (SREX
SPM, Sections 3.2.2, 3.3.1, 3.3.2, 3.4.4, 3.5.3, Table 3-1).
• The models project substantial warming in temperature extremes
by the end of the 21st century. It is virtually certain that increases in
the frequency and magnitude of warm daily temperature extremes
and decreases in cold extremes will occur in the 21st century at the
global scale. It is very likely that the length, frequency, and/or
intensity of warm spells or heat waves will increase over most land
areas (SREX SPM, Sections 3.3.2, 3.3.4, Table 3-3, Figure 3-5).
• It is likely that the frequency of heavy precipitation will increase in
the 21st century over many areas of the globe (SREX SPM, Sections
3.3.2, 3.4.4, Table 3-3, Figure 3-7).
• Economic losses from weather- and climate-related disasters have
increased, but with large spatial and interannual variability (high
confidence, based on high agreement, medium evidence) (SREX
SPM, Sections 4.5.1, 4.5.3, 4.5.4). Trends in losses have been heavily
influenced by increasing exposure of people and economic assets
(high confidence) (SREX SPM, Section 4.5.3).
• Economic, including insured, disaster losses associated with weather,
climate-related events, and geophysical events are higher in
developed countries. Fatality rates and economic losses expressed
as a proportion of GDP are higher in developing countries (high
confidence). Deaths from natural disasters occur much more in
developing countries. From 1970 to 2008, for example, more than
95% of deaths from natural disasters were in developing countries
(SREX SPM, Sections 4.5.2, 4.5.4).
• Development practice, policy, and outcomes contribute to shaping
disaster risks (high confidence): skewed development that may lead
to environmental degradation, unplanned urbanization, failure of
governance, or reduction of livelihood options result in increased
SRREN fi ndings WGII AR5 fi ndings
W
ater
resources
Water availability limits the development of water cooled thermal power and
hydropower. Environmental issues will continue to affect hydropower opportunities.
(
5.1, 5.6, 9.3)
Climate change is predicted to affect surface and groundwater supplies.
Development of water-dependent energy resources can also affect freshwater
e
cosystems. (4.4, 19.3)
Ocean
systems
M
ost ocean energy technologies are at the conceptual phase. Potential technologies
include submarine turbines for tidal currents, ocean thermal energy conversion, and
devices that harness energy of waves and salinity gradients. (6.2, 6.3, 6.5)
O
ffshore renewable energy introduces additional drivers of change for near- and
offshore coastal and marine ecosystems and species. Ocean geoengineering
approaches may have large environmental footprints. (5.5, 6.4)
Land cover
changes
The sustainability of bioenergy (i.e., lifecycle GHG emissions) is infl uenced by land
and biomass resource management practices. (2.2, 2,8, 9.3)
Land cover change associated with biofuel production has food security implications;
related land use change can alter ecosystems, species, and carbon storage. (19.3,
1
9.4, 27.2)
Resilient
pathways
Higher energy prices associated with transitions from fossil fuels to biofuels and
other renewable energy sources may have adverse effects on socioeconomic
development. (9.4, 10.5)
The challenge is to identify and implement mixes of technological options that
reduce net carbon emissions and support sustained economic and social growth.
(20.3)
Regional
effects
Latin America is second to Africa for technical potential in producing bioenergy from
rain-fed lignocellulosic feedstocks on unprotected grassland and woodlands. (2.2)
Bioenergy production requires large areas with risk of environmental degradation
and may involve strong economic teleconnections (e.g., Latin America). (27.2, 27.3)
The quantity of water resources availability in Central and South America is the
largest in the world. The region has the largest proportion of electricity generated
through hydropower facilities. (5.2)
Hydropower, the main source of renewable energy available in Central and South
America, is prone to serious effects of climate change. Altered river fl ows affect
development in this region and use of land for biofuel production. (27.3, 27.6, 27.8)
T
able 1-3 |
E
xamples of linkages between the Special Report on Renewable Energy Sources and Climate Change Mitigation (SRREN) and the AR5 WGII with chapter references
in parentheses.

1
Chapter 1 Point of Departure
188
exposure and vulnerability to disasters (SREX SPM, Sections 1.1.2,
1.1.3, 2.2.2, 2.5).
• Post-disaster recovery and reconstruction provide an opportunity
for reducing the risks posed by future weather- and climate-related
disasters (robust evidence, high agreement) (SREX SPM, Sections
5.2.3, 8.4.1, 8.5.2).
• Socioeconomic, demographic, health-related differences, access to
livelihoods, good governance, and entitlements are some of the
factors that lead to inequalities between people and countries.
I
nequalities influence local coping and adaptive capacity and pose
challenges for risk management systems from local to national
levels (high agreement, robust evidence) (SREX SPM, Sections 5.5.1,
6.2, 6.3.2, 6.6).
• The incorporation of climate change adaptation and disaster risk
management into local, national, and international development
practices and policies could bring benefits (medium evidence, high
agreement) (SREX SPM, Sections 5.4, 5.5, 5.6, 6.3.1, 6.3.2, 6.4.2,
6.6, 7.4).
• Combining local knowledge with scientific and technical expertise
helps communities reduce their risk and adapt to climate change
(robust evidence, high agreement). Risk management works best
when tailored to local circumstances (SREX SPM, Section 5.4.4).
• Many measures for managing current and future risks have additional
benefits, such as improving peoples’ livelihoods, conserving
biodiversity, and improving human well-being (medium evidence,
high agreement) (SREX SPM, Section 6.3.1, Table 6-1).
• Many measures, when implemented effectively, make sense under
a range of future climates. These “low regrets” measures include
systems that warn people of impending disasters; changes in land use
planning; sustainable land management; ecosystem management;
improvements in health surveillance, water supplies, and drainage
systems; development and enforcement of building codes; and
better education and awareness (SREX SPM, Sections 5.3,1, 5.3.4.3,
6.3.1, 6.5.1, 6.5.2, 7.4.3, Case Studies 9.2.11,9.2.14).
• An iterative process involving monitoring, research, evaluation,
learning, and innovation can promote adaptive management and
reduce disaster risk in the context of climate extremes (robust
evidence, high agreement) (SREX SPM, Sections 8.6.3, 8.7).
• Actions ranging from incremental improvements in governance and
technology to more transformational changes are essential for
reducing risk from climate extremes (robust evidence, high
agreement) (SREX SPM, Sections 8.6, 8.6.3, 8.7).
1.3.2.2. Advances in Conceptualizing Climate Change
Vulnerability, Adaptation, and Risk Management in the
Context of Human Development
SREX conceptual framing reflects the diversity of expert communities
involved in the assessment. It links exposure and vulnerability with
socioeconomic development pathways as determinants of impacts and
disaster risk for both human society and natural ecosystems. It is
important to note that SREX acknowledges the fundamental role that
values and aspirations play in people’s perception of risk, of change and
causality, and of imagining present and future situations. This value-
based approach is put to work as a tool for managing the risks of extreme
events and disasters enabling the recognition that socioeconomic
systems are in constant flux, and that there are many conflicting and
contradictory values in play. The conceptual framing of the problem
s
pace offered by SREX (SREX Figure SPM 1-1) serves as a point of
departure for many WGII AR5 chapters. Equally important is the
conceptualization of a feasible solution space offered in SREX. The
solution space is further refined in the WGII AR5 through emphasis on
co-benefits of adaptation and mitigation and the further development
of transformational change to enable climate resilient development.
1.3.3. Relevant Findings from IPCC Working Group I
Fifth Assessment Report
This section is a WGII synthesis of the WGI AR5 report that focuses on
topics relevant to WGII science.
5
The relevant WGI AR5 chapters and
sections are denoted in parentheses. Where statements have high
confidence or likely or better quantification, these qualifiers are dropped
for readability. Likewise, many phrases are exact quotations but are not
presented in quotes. An overall assessment of climate change over the
last several decades from WGI is: Warming of the climate system is
unequivocal, and since the 1950s, many of the observed changes are
unprecedented over decades to millennia. Human influence on the climate
system is clear; it has been detected in warming of the atmosphere and
the ocean, in changes in the global water cycle, in reductions in snow
and ice, in global mean sea level rise, and in changes in some climate
extremes (SPM).
Greenhouse gases and climate forcing. Human activities are the dominant
cause of the observed increase in well mixed GHGs since 1750 and of
the consequent increase in climate forcing. The GHGs and their forcing
continued to increase since AR4 (2, 6, 8). Ozone and stratospheric water
vapor also contribute to this forcing (8). Aerosols partially offset this
forcing and dominate the uncertainty in determining total anthropogenic
forcing of climate change (8). Total anthropogenic climate forcing is
positive and has increased more rapidly since 1970 than during prior
decades (8). Present-day (2011) abundances of carbon dioxide (CO
2
),
methane (CH
4
), and nitrous oxide (N
2
O) exceed the range over the past
800,000 years found in ice cores (5, 6). Annual emission of CO
2
from
fossil fuels and cement production was 9.5 GtC in 2011, 54% above
the 1990 level (SPM). More than 20% of added CO
2
will remain in the
atmosphere for longer than 1000 years (6). Anthropogenic land use
change has increased the land surface albedo (a negative forcing) and
has also affected climate through the hydrologic cycle, but these effects
5
This narrative is taken primarily from the executive summaries of the WGI Final Draft chapters and reflects the WGI SPM approved on 27 September 2013 in Stockholm. For the
most part, WGI findings summarized here have high confidence or a likely or better quantification, and hence the confidence and likelihood statements have been dropped for
readability. All quantitative ranges are likely (66% confidence) or very likely (90% confidence) or the modeled range (where noted). In a few instances, assessments with low
confidence are included and so noted. This WGII narrative is intended to be accurate, but for the purpose here the exact WGI language has been edited and concatenated where
possible (e.g., 1950 is substituted for “the middle of the 20th century”). Although quotation marks are not used, there remain long phrases that are direct quotes from the WGI
AR5 chapters. All numerical values are verbatim. For the level of uncertainty and the precise wording of the WGI assessment refer directly to the WGI approved SPM and the
accepted chapters.

1
Point of Departure Chapter 1
189
are more uncertain and difficult to quantify (8.3.5). Spatial gradients in
forcing (i.e., aerosols, ozone, land use change) affect regional temperature
responses (8). Cumulative CO
2
emissions from 1750 to 2011 are 365
GtC (fossil fuel and cement) plus 180 GtC (deforestation and other land
use change) (SPM). This 545 GtC represents about half of the 1000 GtC
total that can be emitted and still keep global warming under 2°C
relative to the reference period 1861–1880 (SPM).
Air quality on continental scales. Future surface ozone (air pollution)
decreases over most continents for RCP2.6, RCP4.5, and RCP6.0; but it
increases for RCP8.5 due to rising CH
4
(11). Changes in air quality for
the RCPs are driven primarily by pollutant emissions and secondarily
by climate change (11). Air pollution is less under RCP scenarios than
under SRES scenarios (11).
Surface Temperatures. Global mean surface temperature increased by
0.85°C (0.65°C to 1.06°C) over the period 1880–2012 (linear trend)
(SPM) and by 0.72°C over the period 1951–2012 (2). Each of the last 3
decades (from 1983 to 2012) has been successively warmer than any
preceding decade since 1850 (SPM). The decade 2003–2012 has been
the warmest over the instrumental record, even though the rate of
warming over 1998–2012 is smaller than the average rate since 1951
(0.05°C vs. 0.12°C per decade) (2). For the NH, the period 1983–2012
was the warmest of the last 1.400 kyr (5). The slower surface warming
trend over the period 1998–2012 vs. 1951–2012 is due in roughly equal
measure to a reduced trend in radiative forcing and a cooling contribution
from internal, possibly oceanic variability (SPM). Models reproduce the
overall 1951–2012 warming trend, but not the smaller trend for 1998–
2012 (9). More than half of the 1951–2010 temperature increase is due
to the observed anthropogenic increase in GHGs (10). The projected
near term (2016–2035) mean surface temperature increase is 0.9°C to
1.3°C (11), and the long term (2081–2100) ranges from 0.9°C to 2.3°C
(RCP2.6) to 3.2°C to 5.4°C (RCP8.5) (values are relative to 1850–1900,
the earliest period for which global mean surface temperatures have
been measured, and include the 0.6°C offset from that period to the
model reference period 1986–2005) (SPM, 2, 12).
Global temperatures during the last interglacial period (about 120,000
years ago) were never more than 2°C higher than preindustrial levels
(5). By 2050 the global warming range is 1.5°C to 2.3°C above the
1850–1900 period based on the range across all RCPs and models
(11.3.6). Near the end of the century (2081–2100) warming above 4°C
is typical of RCP8.5, while that of RCP2.6 remains below 2°C (12).
Orbital forcing will not trigger widespread glaciation during the next
1000 years (5).
Climate models reproduce observed continental-scale mean surface
temperature patterns; on sub-continental and smaller scales model
capability is reduced, but is better than in AR4 (9). Regional downscaling
provides climate information at the smaller scales needed for impact
studies and adds value in regions with highly variable topography and
for various small-scale phenomena (9). Anthropogenic warming in the
21st century will proceed more rapidly over land areas than over oceans,
and the Arctic region is projected to warm the most (11, 12).
Precipitation. Observed trends in global land-average precipitation have
low confidence prior to 1950 and medium confidence thereafter (2).
Simulation of large-scale precipitation patterns has improved somewhat
since AR4, but precipitation at regional scales is not well simulated (9).
Precipitation (global annual averages) will increase as temperatures
increase, and the contrast between dry and wet regions and that
between wet and dry seasons will increase over most of the globe (12).
By 2100 under RCP8.5, high latitudes will experience more precipitation;
many moist mid latitude regions will also experience more; while many
mid-latitude and subtropical arid and semi-arid regions will experience
less (12). These patterns are also typical of near-term climate change
(
11). Trends will not be apparent in all regions, especially in the near
term, because of natural variability and possible influences of aerosols
and land use change (11).
Extreme temperatures and precipitation. Since 1950, the numbers of
cold days/nights have decreased and the numbers of warm days/nights
have increased globally (2); and model simulation of these extreme
events has improved since AR4 (9). Since 1950, anthropogenic forcing
has contributed to the observed changes in daily temperature extremes
on the global scale (10). In most regions the frequency of warm
days/nights will increase in the next decades, while that of cold
days/nights will decrease (11). Increases in the frequency, duration, and
magnitude of hot extremes along with heat stress are expected;
however, occasional cold winter extremes will occur (12). Extreme high
temperatures (20-year return values) are projected to increase at a rate
similar to or greater than the rate of increase of summer mean
temperatures in most regions (12). There is a no confidence level
assigned to projected near-term increases in the duration, intensity, and
spatial extent of heat waves and warm spells (11), but in the long term
heat waves will occur at higher frequency and longer duration in
response to increased seasonal mean temperatures (12.4.3). Since 1950,
the frequency or intensity of heavy precipitation events has increased
in North America and Europe (2, SPM). Trends in small-scale severe
weather events (e.g., hail, thunderstorms) have low confidence (2).
With global warming, the frequency and intensity of heavy/extreme
precipitation events will increase over most mid-latitude land and over
wet tropical regions (12), and extreme daily precipitation rates will
increase faster than the mean time average (7). Most models
underestimate the sensitivity of extreme precipitation to temperature
variability/trends, and thus projections may underestimate these
extremes (9).
Floods and droughts. In many regions, historical droughts (last 1000
years) and historical floods (last 500 years) have been more severe than
those observed since 1900 (5). Global-scale trends in drought or dryness
since 1950 have low confidence due to lack of direct observations,
methodological uncertainties, and geographical inconsistencies; hence
confidence levels in global drought trends since the 1970s as reported
in AR4 are overstated (2). Regional trends are found: the frequency and
intensity of drought has increased in the Mediterranean and West Africa,
and it has decreased in central North America and northwest Australia
since 1950 (2, 2.6.2.2). There is low confidence in attributing drought
changes to human influence (10). Projected changes in soil moisture
and surface runoff have low confidence in the near term (11), but by
2100 under RCP8.5, annual runoff will decrease in parts of southern
Europe, Middle East, and southern Africa, and increase in high northern
latitudes (12). Decreases in soil moisture with increased risk of
agricultural drought are projected in presently dry regions (12).

1
Chapter 1 Point of Departure
190
Tropical cyclones, storms, and wave heights. Observed changes in
tropical cyclone activity on a centennial scale as well as attribution to
human influence have low confidence (2, 10); however, the frequency
and intensity of the strongest tropical cyclones in the North Atlantic
have increased since the 1970s (2). In a few studies, high-resolution
atmospheric models have reproduced the year-to-year variability of
Atlantic hurricane counts (9). Future changes in intensity and frequency
of tropical cyclones will vary by region, but basin-specific projections have
low confidence (11, 14). The maximum wind speed and precipitation
r
ates of tropical cyclones will increase (14).
Atmospheric circulation features have moved poleward since the 1970s,
including a poleward shift of storm tracks and jet streams (2), and
model simulation of these patterns has improved since AR4 (9). Large-
scale trends in storminess over the last century have low confidence (2,
2.6.4). Projections of the position and strength of NH storm tracks,
especially for the North Atlantic basin, have low confidence (11, 12, 14).
With global warming, a shift to more intense individual storms and
fewer weak storms is projected (12).
Mean significant wave height has increased over much of the Atlantic
Ocean north of 45°N since 1950, with winter season trends of up to 20
cm per decade (medium confidence) (3, 3.4.5). Wave heights and the
duration of the wave season will increase in the Arctic Ocean as a result
of reduced sea ice extent (13). Wave heights will increase in the Southern
Ocean as a result of enhanced wind speeds (13).
Ocean warming, stratification, and circulation. Overall, the ocean has
warmed throughout most of its depth over some periods since 1950,
and this warming accounts for about 93% of the increase in the Earth’s
energy inventory between 1971 and 2010 (3). The upper ocean above
700 m has warmed from 1971 to 2010, and the thermal stratification has
increased by about 4% above 200 m depth (3). Anthropogenic forcings
have made a substantial contribution this upper ocean warming (10).
Measurement errors in the temperature data sets have been corrected
since the AR4 (10). The global ocean continues to warm in all RCP
scenarios (11, 12). To date there is no observational evidence of a long-
term trend in Atlantic Meridional Overturning Circulation (3); and over
the 21st century it is projected to weaken but not undergo an abrupt
transition or collapse (12).
Ocean acidification and low oxygen. Oceanic uptake of anthropogenic
CO
2
results in gradual acidification of the ocean (3). Since 1750 the pH
of seawater has decreased by 0.1 (a 26% increase in hydrogen ion
concentration) (3). Increased storage of carbon by the oceans over the
21st century will increase acidification, decreasing pH further by 0.065
for RCP2.6 and 0.31 for RCP8.5 (6). Aragonite under-saturation becomes
widespread in parts of the Arctic and Southern Oceans and in some
coastal upwelling systems at atmospheric CO
2
levels of 500 to 600 ppm
(6). Oxygen concentrations have decreased since the 1960s in the open
ocean thermocline of many regions (medium confidence) (3). By 2100,
the oxygen content of the ocean will decrease by a few percent (6).
There is no consensus on projection of the very low oxygen (hypoxic or
suboxic) waters in the open ocean (6).
Sea ice. Continuing the trends reported in AR4, the annual Arctic sea
ice extent decreased at rate of 3.5 to 4.1% per decade between 1979 and
2012 (4). Over the past 3 decades, Arctic summer sea ice retreat was
unprecedented and Arctic sea surface temperatures were anomalously
high, compared with the last 1450 years (SPM). The Arctic average
winter sea ice thickness decreased between 1980 and 2008 (4). Current
climate models reproduce the seasonal cycle and downward trend of
Arctic sea ice extent (9). Anthropogenic forcings have contributed to
Arctic sea ice loss since 1979 (10). With global warming, further shrinking
and thinning of Arctic sea ice cover is projected, and the Arctic Ocean
will be nearly ice free in September before 2050 for the high-warming
s
cenarios like RCP8.5 (11, 12). There is little evidence in climate models
of an Arctic Ocean tipping point, that is, the transition from a perennially
ice covered to a seasonally ice-free expanse beyond which further sea
ice loss is unstoppable and irreversible (12). Annual Antarctic sea ice
extent increased by 1.2 to 1.8% per decade between 1979 and 2012
(4). The scientific understanding of this observed increase has low
confidence (10). With global warming, Antarctic sea ice extent and
volume is expected to decrease (low confidence) (12).
Ice sheets, glaciers, snow cover, and permafrost. During periods over
the past few million years that were globally warmer than present, the
Greenland and West Antarctic ice sheets were smaller (5). The Antarctic
and Greenland ice sheets have on average lost ice during the last 2
decades, and the rate of loss has increased over the most recent decade
to a sea level rise equivalent of 0.6 mm yr
–1
for Greenland and 0.4 mm
yr
–1
for Antarctica (4). Anthropogenic influences have contributed to
Greenland ice loss since 1990 and to the retreat of glaciers since the
1960s, but there is low confidence in attributing the causes of Antarctic
ice loss (10). With global warming, model studies agree that the
Greenland ice sheet will significantly decrease in area and volume, while
the Antarctic ice sheet increases in most projections (confidence not
assessed) (12, 13.4.4). Global warming above a certain threshold (e.g.,
2°C to 4°C above the 1850–1900 period) would lead to the near-
complete loss of the Greenland Ice Sheet over a millennium or more
(confidence not assessed) (13). There is low confidence and little
consensus on the likelihood of abrupt or nonlinear changes in
components of the climate system over the 21st century (12).
Multiple lines of evidence support very substantial Arctic warming since
the mid-20th century (SPM). Almost all glaciers world-wide have
continued to shrink since AR4 (4). Over the last decade, most ice was
lost from glaciers in the Canadian Arctic, Greenland ice sheet periphery,
Southern Andes, Asian Mountains, and Alaska (4). Current glacier extents
are out of balance with current climate, and glaciers will continue to
shrink even without further warming (4). Snow cover extent has
decreased in the NH, particularly in spring (4); and reductions since 1970
have an anthropogenic component (10). Permafrost temperatures have
increased in most regions since the early 1980s: observed warming was
up to 3°C in parts of Northern Alaska and 2°C in parts of the Russian
European North (4, SPM). With global warming, NH snow cover extent
and permafrost extent will decrease further (11, 12). By 2100 the
decrease in near-surface permafrost area ranges from 37% (RCP2.6) to
81% (RCP8.5) (medium confidence) (12).
Sea level rise. During the last interglacial period, when global mean
temperatures were no more than 2°C above pre-industrial values
(medium confidence), maximum global mean sea level was, for several
thousand years, 5 m to 10 m higher than present (SPM, 5, 5.3.4, 5.6.1,

1
Point of Departure Chapter 1
191
5.6.2, 13, 13.2.1) with substantial contributions from Greenland and
Antarctic Ice Sheets (5, 13). The rate of sea level rise since the mid-19th
century has been larger than the mean rate during the previous 2
millennia (SPM). Global mean sea level has risen at an average rate of
1.7 mm yr
–1
from 1901 to 2010 and at a faster rate, 3.2 mm yr
–1
, from
1993 to 2010 (3). There is a substantial anthropogenic contribution to
the global mean sea level rise since the 1970s (10). The rate of global
m
ean sea level rise during the 21st century will exceed that observed
during 1971–2010 for all RCP scenarios (13). For the period 2081–2100
compared to 1986–2005, process-based models project a global mean
sea level rise ranging from 0.26 to 0.55 m (RCP2.6) up to 0.45 to
0.82 m (RCP8.5) (13). By 2100 for RCP8.5, this rise is 0.52 to 0.98 m,
with a rate of rise reaching 8 to 16 mm yr
–
1
(SPM, 13). Only collapse of
marine-based sectors of the Antarctic ice sheet could cause global mean
sea level to rise substantially above these projections, probably not
exceeding several tenths of a meter (medium confidence) by 2100 (13).
Semi-empirical projections of 2100 sea level rise have a wide spread
across models, some overlapping with the process-based models and
some twice as large; however, there is low confidence in these projections
(13, 13.5.2, 13.5.3). If global warming exceeds a certain threshold
resulting in near-complete loss of the Greenland Ice Sheet over a
millennium or more (confidence not assessed), global mean sea level
would rise about 7 m (13). Future sea level change will vary regionally,
but about 70% of the global coastlines are projected to experience a
sea level change within 20% of the global mean (13).
The magnitude of extreme high sea level events has increased since
1970 (3). Future sea level extremes will become more frequent beyond
2050, primarily as a result of increasing mean sea level (13). By 2100
the frequency of current sea level extremes will increase by large factors
in some regions (13, 13.7.2). Region-specific projections of storminess
and associated storm surges have low confidence (13).
Climate patterns. The El Niño-Southern Oscillation (ENSO) system has
remained highly variable throughout the past 7000 years with no
discernible evidence of orbital modulation (5). The observed variability
of the ENSO in the tropical Pacific is now reproduced in most climate
models (9). Models project an eastward shift in the ENSO teleconnection
patterns of temperature and precipitation variations over the North
Pacific and North America (14). ENSO remains the dominant mode of
interannual climate variability in the future, and the ENSO precipitation
anomalies will intensify due to increased moisture (14). Aggregated
over all monsoon systems and over the 21st century, the monsoon will
increase in area and intensity while its circulation weakens (14). Monsoon
onset dates become earlier or do not change and monsoon retreat dates
delay, lengthening the monsoon season (14). Reduced warming and
decreased precipitation is projected in the eastern tropical Indian Ocean,
with increased warming and precipitation in the western, influencing
East Africa and Southeast Asia precipitation (14).
1.3.4. Relevant Findings from IPCC Working Group III
Fifth Assessment Report
The WGIII report assesses scientific research related to the mitigation
of climate change. Because mitigation lowers the effects of climate
change as well as the risks of extreme impacts, it is part of a broader
policy strategy that includes adaptation to climate impacts. Both
mitigation (WGIII) and adaptation (WGII) involve risk management in
the context of many prevailing uncertainties. Uncertainties arise not
only in the natural but also in human and social systems, including
responses of these to policy interventions. It is possible that extreme
climate impacts could play a central role in determining the level of
mitigation, adaptation, and other policy responses to climate change
(WGIII AR5 Chapter 2).
O
ver the last two WGIII assessment reports, one of the most important
shifts in the scientific literature reflects underlying changes in the structure
of the world economy: the underlying determinants of emissions—such
as technologies, investment patterns, resource use, lifestyles, and
development pathways in general—have not substantially shifted
toward a low-GHG pattern despite the adoption of the UNFCCC and
the Kyoto Protocol. In 2010, GHG emissions surpassed 50 Gt CO
2
-eq
(13.6 GtC), higher than in any previous year since 1750. Most of the
emission growth between 2000 and 2010 came from fossil-fuel use in
the energy and industry sectors, and took place in emerging economies.
This emission growth was not met by significant GHG emission cuts in
the industrialized country group, which continued to dominate historical
long-term contributions to global CO
2
emissions. In 2010, median per
capita GHG emissions in high-income countries were roughly 10 times
higher than in low-income countries (WGIII AR5 Chapters 1, 5).
One of the central messages of WGIII AR5 is that technological and
behavioral options exist that would allow the world’s economies to follow
pathways to much lower future emissions of GHGs. Since AR4 a
substantial scenario literature has emerged on the technological, economic,
and institutional conditions needed to achieve different long-term
pathways leading to a stabilization of atmospheric GHG concentrations
in 2100. A continuation of current trends of technological change in the
absence of explicit climate change mitigation policies is not sufficient to
bring about stabilization of GHGs. Scenarios that are more likely than
not to limit temperature increase to 2°C are becoming increasingly
challenging, and most of these include a temporary overshoot of this
concentration goal requiring net negative CO
2
emissions after 2050 and
thus large-scale application of carbon dioxide removal (CDR) technologies
(WGIII AR5 Chapter 6). CDR methods are not mature and have
biogeochemical and technological limitations to their potential on a global
scale and carry side effects and long-term consequences on a global scale
(WGI AR5 SPM; WGIII AR5 Chapter 6). The increasing dependence of
pathways on CDR options reduces the ability of policymakers to hedge
risks freely across the mitigation technology portfolio (WGIII AR5 Chapter
6). The literature highlights the importance of a systemic, cross-sectoral
approach to mitigation. Approaches that emphasize only a subset of
sectors or a subset of actions may miss synergies between sectors, raise
the costs of mitigation, cause unexpected consequences, and prove
insufficient to meet long-term mitigation goals (WGIII AR5 Chapters 6 to
11). The costs of mitigation grow over-proportionally with the stringency
of the stabilization target. Delays in mitigation and the unavailability
of individual mitigation technologies increase the cost of mitigation and
negatively affect the probability of meeting ambitious long-term
atmospheric stabilization goals (WGIII AR5 Chapter 6).
Mitigation policies involve multiple actors and institutions at the
international, regional, national, and sub-national scales—from global

1
Chapter 1 Point of Departure
192
treaties to firms and individual households. Since AR4 a body of literature
has been emerging to explain how this multiplicity of actors and levels,
focused on a multiplicity of interacting goals, affects the design and
evolution of mitigation policy (WGIII AR5 Chapters 13, 14, 15).
Approaches to international cooperation in climate policies have
increased and become more diverse ranging from strong multi-lateralism
to harmonized national and regional policies (WGIII AR5 Chapter 13).
Linkages among regional, national, and sub-national programs may
complement international cooperation. Carbon markets have been the
f
ocus of regional policy due, in part, to the greater opportunities for trade
as carbon markets expand (WGIII AR5 Chapters 13, 14). A combination
of policies that address providing a price signal, removing barriers, and
promoting long-term investments could be most effective. If there is no
coordination within an integrated perspective then results in one area
may be counteracted by results in another area, for instance through
leakage and rebound effects (WGIII AR5 Chapter 15).
While mitigation efforts generate costs and trade-offs, they also offer
possible synergies because many of the policies that can mitigate GHGs
also help address other policy goals, such as managing air pollution,
water scarcity, or energy security. Since AR4 a substantial literature has
emerged on this topic, underscoring the link of mitigation to a wide
range of societal goals, often designated as sustainable development
(WGIII AR5 Chapters 3, 4, 15).
References
Alcaide, G.G., J.C.V. Zurián, and R.A. Benavent, 2012: Análisis del proceso de
internacionalización de la investigación española en ciencia y tecnología (1980-
2007). Revista Espanola de Documentacion Cientifica, 35, 94-118.
Alston, M., 2011: Gender and climate change in Australia. Journal of Sociology,
47(1), 53-70.
Arnell, N., T. Kram, T.R. Carter, K.L. Ebi, J.A. Edmonds, S. Hallegatte, E. Kriegler, R. Mathur,
B. O’Neill, K. Riahi, H. Winkler, D.P. van Vuuren, and T. Zwickel, 2011: A Framework
for a New Generation of Socioeconomic Scenarios for Climate Change Impact,
Adaptation, Vulnerability and Mitigation Research. Primary background document
for the workshop, “The Nature and Use of New Socioeconomic Pathways for
Climate Change Research,” Nov. 2-4, 2011, hosted by the Integrated Science
Program, National Center for Atmospheric Research (NCAR), Mesa Laboratory,
Boulder, CO, USA, 42 pp., www.isp.ucar.edu/sites/default/files/Scenario_
FrameworkPaper_15aug11_1.pdf.
Arnold, D.G. (ed.), 2011: The Ethics of Global Climate Change. Cambridge University
Press, Cambridge, UK and New York, NY, USA, 354 pp.
Barnett, J. and S. O’Neill, 2010: Maladaptation. Global Environmental Change, 20(2),
211-213.
Borras, S.M., P. McMichael, and I. Scoones (eds.), 2011: The Politics of Biofuels, Land
and Agrarian Change. Routledge, London, UK, 408 pp.
Boyd, E. and S. Juhola, 2009: Stepping up to the climate change: opportunities in
re-conceptualising development futures. Journal of International Development,
21(6), 792-804.
Brooks, N., N. Grist, and K. Brown, 2009: Development futures in the context of climate
change: challenging the present and learning from the past. Development
Policy Review, 27(6), 741-765.
Brown, A., 2012: Atmospheric science: global implications for Africa. Nature Climate
Change, 2, 769, doi:10.1038/nclimate1736.
Büscher, B., S. Sian, K. Neves, J. Igoe, and D. Brockington, 2012: Towards a synthesized
critique of neoliberal biodiversity conservation. Capitalism Nature Socialism,
23(1), 4-30.
Caney, S., 2012: Just emissions. Philosophy & Public Affairs, 40, 255-300.
Gagnon-Lebrun, F. and S. Agrawala, 2006: Progress on Adaptation to Climate Change
in Developed Countries: An Analysis of Broad Trends. ENV/EPOC/GSP(2006)1/
FINAL, The Organisation for Economic Co-operation and Development (OECD),
Paris, France, 63 pp.
Gardiner, S.M. (ed.), 2011: A Perfect Moral Storm: The Ethical Tragedy of Climate
Change. Oxford University Press, Inc., New York, NY, USA, 512 pp.
Gingras, Y. and S. Mosbah-Natanson, 2010: Les sciences sociales françaises entre
ancrage local et visibilité international. European Journal of Sociology, 51, 305-321.
Grist, N., 2008: Positioning climate change in sustainable development discourse.
Journal of International Development, 20(6), 783-803.
Gupta, J., C. Termeer, J. Klostermann, S. Meijerink, M. van den Brink, P. Jong, S.
Nooteboom, and E. Bergsma, 2010: The adaptive capacity wheel: a method to
assess the inherent characteristics of institutions to enable the adaptive
capacity of society. Environmental Science & Policy, 13(6), 459-471.
Gutiérrez, M.E. and T. Espinosa, 2010: Vulnerabilidad yAdaptación al Cambio
Climático:Diagnóstico Inicial, Avances,Vacíos y Potenciales Líneas deAcción
en Mesoamérica. Notas Técnicas No. IDB-TN-144, Banco Interamericano de
Desarrollo, Washington, DC, USA, 84 pp.
Heltberg, R., P.B. Siegel, and S.L. Jorgensen, 2009: Addressing human vulnerability
to climate change: toward a ‘no-regrets’ approach. Global Environmental
Change, 19(1), 89-99.
IPCC, 1990: Climate Change: The IPCC Scientific Assessment. Report Prepared for
IPCC by Working Group I [Houghton, J.T., G.J. Jenkins, and J.J. Ephraums (eds.)].
Cambridge University Press, Cambridge, UK, New York, NY, USA, and
Melbourne, Australia, 410 pp.
IPCC, 1992: Climate Change 1992: The Supplementary Report to the IPCC Scientific
Assessment. Report Prepared for Intergovernmental Panel on Climate Change
by Working Group I combined with Supporting Scientific Material [Houghton,
J.T., B.A. Calandar, and S.K. Varney (eds.)]. Cambridge University Press,
Cambridge, UK, New York, NY, USA, and Victoria, Australia, 200 pp.
IPCC, 1996: Climate Change 1995: Impacts, Adaptations and Mitigation of Climate
Change: Scientific-Technical Analyses. Contribution of Working Group II to the
Second Assessment Report of the Intergovernmental Panel on Climate Change
[Watson, R.T., M.C. Zinyowera, and R.H. Moss (eds.)]. Cambridge University
Press, Cambridge, UK, New York, NY, USA, and Melbourne, Australia, 889 pp.
IPCC, 2001a: Climate Change 2001: The Scientific Basis. Contribution of Working
Group I to the Third Assessment Report of the Intergovernmental Panel on
Climate Change [Houghton, J.T., Y. Ding, D.J. Griggs, M. Noguer, P.J. van der Lin-
den, X. Dai, K. Maskell, and C.A. Johnson (eds.)]. Cambridge University Press,
Cambridge, UK and New York, NY, USA, 881pp.
IPCC, 2001b: Climate Change 2001: Impacts, Adaptation, and Vulnerability.
Contribution of Working Group II to the Third Assessment Report of the
Intergovernmental Panel on Climate Change [McCarthy, J.J., O.F. Canziani, N.A.
Leary, D.J. Dokken, and K.S. White (eds.)]. Cambridge University Press,
Cambridge, UK and New York, NY, USA, 1042 pp.
IPCC, 2005: Guidance Notes for Lead Authors of the IPCC Fourth Assessment Report
on Addressing Uncertainties. Intergovernmental Panel on Climate Change
(IPCC), Geneva, Switzerland, 4 pp.
IPCC, 2007a: Climate Change 2007: The Physical Science Basis. Contribution of Working
Group I to the Fourth Assessment Report of the Intergovernmental Panel on
Climate Change [Solomon, S., D. Qin, M. Manning, Z. Chen, M.C. Marquis, K.B.
Averyt, M. Tignor, and H.L. Miller (eds.)]. Cambridge University Press,
Cambridge, UK and New York, NY, USA, 1008 pp.
IPCC, 2007b: Climate Change 2007: Impacts, Adaptation and Vulnerability.
Contribution of Working Group II to the Fourth Assessment Report of the
Intergovernmental Panel on Climate Change [Parry, M.L., O.F. Canziani, J.P.
Palutikof, P.J. van der Linden, and C.E. Hanson (eds.)]. Cambridge University
Press, Cambridge, UK and New York, NY, USA, 992 pp.
IPCC, 2007c: Summary for policymakers. In: Climate Change 2007: Impacts, Adaptation
and Vulnerability. Contribution of Working Group II to the Fourth Assessment
Report of the Intergovernmental Panel on Climate Change [Parry, M.L., O.F.
Canziani, J.P. Palutikof, P.J. van der Linden, and C.E. Hanson (eds.)]. Cambridge
University Press, Cambridge, UK and New York, NY, USA, pp. 7-22.
IPCC, 2007d: Climate Change 2007: Synthesis Report. Contribution of Working
Groups I, II and III to the Fourth Assessment Report of the Intergovernmental
Panel on Climate Change. [Core Writing Team, Pachauri, R.K. and A. Reisinger
(eds.)]. IPCC, Geneva, Switzerland, 104 pp.
IPCC, 2011: IPCC Special Report on Renewable Energy Sources and Climate Change
Mitigation.Prepared by Working Group III of the Intergovernmental Panel on
Climate Change [Edenhofer, O., R. Pichs-Madruga, Y. Sokona, K. Seyboth, P.
Matschoss, S. Kadner, T. Zwickel, P. Eickemeier, G. Hansen, S. Schlömer, and C.
von Stechow (eds.)]. Cambridge University Press, Cambridge, UK and New York,
NY, USA, 1075 pp.

1
Point of Departure Chapter 1
193
IPCC, 2012: Managing the Risks of Extreme Events and Disasters to Advance Climate
Change Adaptation. A Special Report of Working Groups I and II of the
Intergovernmental Panel on Climate Change [Field, C.B., V. Barros, T.F. Stocker,
D. Qin, D.J. Dokken, K.L. Ebi, M.D. Mastrandrea, K.J. Mach, G.-K. Plattner, S.K.
Allen, M. Tignor, and P.M. Midgley (eds.)]. Cambridge University Press,
Cambridge, UK and New York, NY, USA, 582 pp.
ISSC and UNESCO, 2013: World Social Science Report 2013: Changing Global
Environments. International Social Science Council (ISSC) and the United
Nations Educational, Scientific and Cultural Organization (UNESCO), OECD
Publishing and UNESCO Publishing, Paris, France, 612 pp.
Jerneck, A. and L. Olsson, 2008: Adaptation and the poor: development, resilience
and transition. Climate Policy, 8(2), 170-182.
Kates, R.W., W.R. Travis, and T.J. Wilbanks, 2012: Transformational adaptation when
incremental adaptations to climate change are insufficient. Proceedings of the
National Academy of Sciences of the United States of America, 109(19), 7156-
7161.
Kirchik, O., Y. Gingras, and V. Larivière, 2012: Changes in publication languages and
citation practices and their effect on the scientific impact of Russian science
(1993-2010). Journal of the American Society for Information Science and
Technology, 63(7), 1411-1419.
Kriegler, E., B.C. O’Neill, S. Hallegatte, T. Kram, R.J. Lempert, R.H. Moss, and T.
Wilbanks, 2012: The need for and use of socio-economic scenarios for climate
change analysis: a new approach based on shared socio-economic pathways.
Global Environmental Change, 24(4), 807-822.
Liverman, D.M., 2010: Carbon offsets, the CDM and sustainable development. In:
Global Sustainability – A Nobel Cause [Schellnhuber, H.J., M. Molina, N. Stern,
V. Huber, and S. Kadner (eds.)]. Cambridge University Press, Cambridge, UK and
New York, NY, USA, pp. 129-141.
Marino, E. and J. Ribot, 2012: Special issue introduction: adding insult to injury:
climate change, social stratification, and the inequities of intervention. Global
Environmental Change, 22(2), 323-328.
Mastrandrea, M.D. and K.J. Mach, 2011: Treatment of uncertainties in IPCC Assessment
Reports: past approaches and considerations for the Fifth Assessment Report.
Climatic Change, 108(4), 659-673.
Mastrandrea, M.D., C.B. Field, T.F. Stocker, O. Edenhofer, K.L. Ebi, D.J. Frame, H. Held,
E. Kriegler, K.J. Mach, P.R. Matschoss, G.-. Plattner, G.W. Yohe, and F.W. Zwiers,
2010: Guidance Note for Lead Authors of the IPCC Fifth Assessment Report on
Consistent Treatment of Uncertainties. Intergovernmental Panel on Climate
Change (IPCC), Geneva, Switzerland, 5 pp.
McMichael, P., 2009: Contemporary contradictions of the Global Development Project:
geopolitics, global ecology and the ‘development climate’. Third World
Quarterly, 30(1), 247-262.
Mearns, R. and A. Norton (eds.), 2010: Social Dimensions of Climate Change: Equity
and Vulnerability in a Warming World. New Frontiers of Social Policy 52097,
The World Bank, Washington DC, USA, 348 pp.
Meinshausen, M., S.J. Smith, K. Calvin, J.S. Daniel, M.L.T. Kainuma, J. Lamarque, K.
Matsumoto, S.A. Montzka, S.C.B. Raper, K. Riahi, A. Thomson, G.J.M. Velders,
and D.P.P. van Vuuren, 2011: The RCP greenhouse gas concentrations and their
extensions from 1765 to 2300. Climatic Change, 109(1), 213-241.
Moss, R.H. and S.H. Schneider, 2000: Uncertainties in the IPCC TAR: recommendations
to lead authors for more consistent assessment and reporting. In: Guidance
Papers on the Cross Cutting Issues of the Third Assessment Report of the IPCC
[Pachauri, R., T. Taniguchi, and K. Tanaka (eds.)]. IPCC, Geneva, Switzerland, pp.
33-51.
Moss, R.H., J.A. Edmonds, K.A. Hibbard, M.R. Manning, S.K. Rose, D.P. van Vuuren,
T.R. Carter, S. Emori, M. Kainuma, T. Kram, G.A. Meehl, J.F.B. Mitchell, N.
Nakicenovic, K. Riahi, S.J. Smith, R.J. Stouffer, A.M. Thomson, J.P. Weyant, and
T.J. Wilbanks, 2010: A new paradigm for the next generation of climate change
scenarios. Nature, 463, 747-756.
Nakicenovic, N., J. Alcamo, G. Davis, B. de Vries, J. Fenhann, S. Gaffin, K. Gregory, A.
Grubler, T.Y. Jung, T. Kram, E.L. La Rovere, L. Michaelis, S. Mori, T. Morita, W.
Pepper, H.M. Pitcher, L. Price, K. Riahi, A. Roehrl, H. Rogner, A. Sankovski, M.
Schlesinger, P. Shukla, S.J. Smith, R. Swart, S. van Rooijen, N. Victor, and Z. Dadi,
2000: Emissions Scenarios: A Special Report of the Intergovernmental Panel on
Climate Change [Nakicenovic, N. and R. Swart (eds.)]. Cambridge University
Press, UK, 570 pp.
New, M., D. Liverman, H. Schroeder, and K. Anderson, 2010: Four degrees and beyond:
the potential for a global temperature increase of four degrees and its
implications. Philosophical Transactions of the Royal Society A, 369, 6-19.
O’Brien, K., 2013: Global environmental change III: closing the gap between knowledge
and action. Progress in Human Geography, 37(4), 587-596.
O’Brien, K., A.L. St. Clair, and B. Kristoffersen (eds.), 2010: Climate Change, Ethics
and Human Security. Cambridge University Press, Cambridge, UK, 246 pp.
O’Neill, B.C., T.R. Carter, K.L. Ebi, J. Edmonds, S. Hallegatte, E. Kemp-Benedict, E.
Kriegler, L. Mearns, R. Moss, K. Riahi, B. van Ruijven, , and D. van Vuuren, 2012:
Meeting Report of the Workshop on the Nature and Use of New Socioeconomic
Pathways for Climate Change Research. Workshop hosted by the Integrated
Science Program, National Center for Atmospheric Research (NCAR), Mesa
Laboratory, Nov. 2-4, 2011, Boulder, CO, USA, www.isp.ucar.edu/sites/default/
files/Boulder%20Workshop%20Report_0.pdf.
OECD, 2013: OECD Policy Guidance on Integrating Climate Change Adaptation into
Development Co-Operation. Organization for Economic Co-operation and
Development (OECD), Paris, France.
Ogallo, L., 2010: The mainstreaming of climate change and variability information
into planning and policy development for Africa. Procedia Environmental
Sciences, 1, 405-410.
Park, S., M. Howden, and S. Crimp, 2012: Informing regional level policy development
and actions for increased adaptive capacity in rural livelihoods. Environmental
Science & Policy, 15(1), 23-37.
Parson, E., V. Burkett, K. Fisher-Vanden, D. Keith, L. Mearns, H. Pitcher, C. Rosenzweig,
and M. Webster, 2007: Global Change Scenarios: Their Development and Use.
Synthesis and Assessment Product 2.1B of the U.S. Climate Change Science
Program and the Subcommittee on Global Change Research, US Department
of Energy Publications, Paper 7, Washington, DC, USA, 106 pp.
Pelling, M., 2010: Adaptation to Climate Change: From Resilience to Transformation.
Routledge, Oxford, UK, 224 pp.
Pogge, T., 2008: World Poverty and Human Rights: Cosmopolitan Responsibilities
and Reforms. 2
nd
edn., Polity Publishing, Malden, MA, USA, 352 pp.
Richardson, K., W. Steffen, and D. Liverman, 2011: Climate Change: Global Risks,
Challenges and Decisions. Cambridge University Press, Cambridge, UK, 524 pp.
Rosenzweig, C., G. Casassa, D.J. Karoly, A. Imeson, C. Liu, A. Menzel, S. Rawlins, T.L.
Root, B. Seguin, and P. Tryjanowski, 2007: Assessment of observed changes and
responses in natural and managed systems. In: Climate Change 2007: Impacts,
Adaptation and Vulnerability. Contribution of Working Group II to the Fourth
Assessment Report of the Intergovernmental Panel on Climate Change [Parry,
M.L., O.F. Canziani, J.P. Palutikof, P.J. van der Linden, and C.E. Hanson (eds.)].
Cambridge University Press, Cambridge, UK and New York, NY, USA, pp. 79-131.
Schipper, E.L.F., 2007: Climate Change Adaptation and Development: Exploring the
Linkages. Tyndall Centre for Climate Change Research Working Paper No.107,
20 pp., www.preventionweb.net/files/7782_twp107.pdf.
Stafford Smith, M., L. Horrocks, A. Harvey, and C. Hamilton, 2011: Rethinking
adaptation for a 4°C world. Philosophical Transactions of the Royal Society A,
369, 196-216.
Swart, R., L. Bernstein, M. Ha-Duong, and A. Petersen, 2009: Agreeing to disagree:
uncertainty management in assessing climate change, impacts and responses
by the IPCC. Climatic Change, 92(1-2), 1-29.
Timmons, R.J. and B.C. Parks (eds.), 2007: A Climate of Injustice: Global Inequality,
North-South Politics, and Climate Policy. MIT Press, Cambridge, MA, USA, 418 pp.
Turner, B.L., 2010: Vulnerability and resilience: coalescing or paralleling approaches
for sustainability science? Global Environmental Change, 20, 570-576.
UN, 1993: Agenda 21: Earth Summit – The United Nations Programme of Action from
Rio. United Nations, Department of Public Information, New York, NY, USA,
300 pp.
UN, 2003: Report of the International Ministerial Conference of Landlocked and
Transit Developing Countries and Donor Countries and International Financial
and Development Institutions on Transit Transport Cooperation. A/CONF.202/,
United Nations Publications, New York, NY, USA, 27 pp., unctad.org/en/docs/
aconf202d3_en.pdf.
UN DESA, 2008: Handbook on the Least Developed Country Category: Inclusion, and
Graduation and Special Support Measures. United Nations Publications, New
York, NY, USA, 98 pp.
UN DESA, 2012: Statistical Yearbook 2010: Fifty-fifth Issue. United Nations Publications,
New York, NY, USA, 650 pp.
UN DESA, 2013: World Economic Situation and Prospects 2013. United Nations
Publications, New York, NY, USA, 206 pp.
UNDP, 2007: Human Development Report 2007/2008. Fighting Climate Change:
Human Solidarity in a Divided World. United Nations Development Programme
(UNDP), Palgrave Macmillan, New York, NY, USA, 384 pp.

1
Chapter 1 Point of Departure
194
UNDP, 2011: Human Development Report 2011. Sustainability and Equity: A Better
Future for All. United Nations Development Programme (UNDP), Palgrave
Macmillan, New York, NY, USA, 185 pp.
UNDP, 2013: Human Development Report 2013. The Rise of the South: Human
Progress in a Diverse World. United Nations Development Programme (UNDP),
New York, NY, USA, 202 pp.
USAID, 2008: Integrating Climate Change into Development. US Agency for
International Development (USAID), Washington, DC, USA, 12 pp.
van Vuuren, D.P., J.A. Edmonds, M. Kainuma, K. Riahi, and J. Weyant, 2011: A special
issue on the RCPs. Climatic Change, 109(1), 1-4.
World Bank, 2010: World Development Report 2010: Development and Climate
Change. The International Bank for Reconstruction and Development / The
World Bank, Washington DC, USA, 439 pp.
World Bank, 2012: Turn Down the Heat. Why a 4°C Warmer World Must Be Avoided. A
Report for the World Bank by the Potsdam Institute for Climate Impact Research
and Climate Analytics, The International Bank for Reconstruction and
Development / The World Bank, Washington, DC, USA, 106 pp.
World Bank, 2013: World Development Indicators 2013. The International Bank
for Reconstruction and Development / The World Bank, Washington, DC, USA,
123 pp.
