
1217
14
This chapter should be cited as:
Christensen, J.H., K. Krishna Kumar, E. Aldrian, S.-I. An, I.F.A. Cavalcanti, M. de Castro, W. Dong, P. Goswami, A.
Hall, J.K. Kanyanga, A. Kitoh, J. Kossin, N.-C. Lau, J. Renwick, D.B. Stephenson, S.-P. Xie and T. Zhou, 2013: Climate
Phenomena and their Relevance for Future Regional Climate Change. In: Climate Change 2013: The Physical Sci-
ence Basis. Contribution of Working Group I to the Fifth Assessment Report of the Intergovernmental Panel on
Climate Change [Stocker, T.F., D. Qin, G.-K. Plattner, M. Tignor, S.K. Allen, J. Boschung, A. Nauels, Y. Xia, V. Bex and
P.M. Midgley (eds.)]. Cambridge University Press, Cambridge, United Kingdom and New York, NY, USA.
Coordinating Lead Authors:
Jens Hesselbjerg Christensen (Denmark), Krishna Kumar Kanikicharla (India)
Lead Authors:
Edvin Aldrian (Indonesia), Soon-Il An (Republic of Korea), Iracema Fonseca Albuquerque
Cavalcanti (Brazil), Manuel de Castro (Spain), Wenjie Dong (China), Prashant Goswami (India),
Alex Hall (USA), Joseph Katongo Kanyanga (Zambia), Akio Kitoh (Japan), James Kossin (USA),
Ngar-Cheung Lau (USA), James Renwick (New Zealand), David B. Stephenson (UK), Shang-Ping
Xie (USA), Tianjun Zhou (China)
Contributing Authors:
Libu Abraham (Qatar), Tércio Ambrizzi (Brazil), Bruce Anderson (USA), Osamu Arakawa (Japan),
Raymond Arritt (USA), Mark Baldwin (UK), Mathew Barlow (USA), David Barriopedro (Spain),
Michela Biasutti (USA), Sébastien Biner (Canada), David Bromwich (USA), Josephine Brown
(Australia), Wenju Cai (Australia), Leila V. Carvalho (USA/Brazil), Ping Chang (USA), Xiaolong
Chen (China), Jung Choi (Republic of Korea), Ole Bøssing Christensen (Denmark), Clara Deser
(USA), Kerry Emanuel (USA), Hirokazu Endo (Japan), David B. Enfield (USA), Amato Evan
(USA), Alessandra Giannini (USA), Nathan Gillett (Canada), Annamalai Hariharasubramanian
(USA), Ping Huang (China), Julie Jones (UK), Ashok Karumuri (India), Jack Katzfey (Australia),
Erik Kjellström (Sweden), Jeff Knight (UK), Thomas Knutson (USA), Ashwini Kulkarni (India),
Koteswara Rao Kundeti (India), William K. Lau (USA), Geert Lenderink (Netherlands), Chris
Lennard (South Africa), Lai-yung Ruby Leung (USA), Renping Lin (China), Teresa Losada (Spain),
Neil C. Mackellar (South Africa), Victor Magaña (Mexico), Gareth Marshall (UK), Linda Mearns
(USA), Gerald Meehl (USA), Claudio Menéndez (Argentina), Hiroyuki Murakami (USA/Japan),
Mary Jo Nath (USA), J. David Neelin (USA), Geert Jan van Oldenborgh (Netherlands), Martin
Olesen (Denmark), Jan Polcher (France), Yun Qian (USA), Suchanda Ray (India), Katharine
Davis Reich (USA), Belén Rodriguez de Fonseca (Spain), Paolo Ruti (Italy), James Screen (UK),
Jan Sedláček (Switzerland) Silvina Solman (Argentina), Martin Stendel (Denmark), Samantha
Stevenson (USA), Izuru Takayabu (Japan), John Turner (UK), Caroline Ummenhofer (USA), Kevin
Walsh (Australia), Bin Wang (USA), Chunzai Wang (USA), Ian Watterson (Australia), Matthew
Widlansky (USA), Andrew Wittenberg (USA), Tim Woollings (UK), Sang-Wook Yeh (Republic of
Korea), Chidong Zhang (USA), Lixia Zhang (China), Xiaotong Zheng (China), Liwei Zou (China)
Review Editors:
John Fyfe (Canada), Won-Tae Kwon (Republic of Korea), Kevin Trenberth (USA), David Wratt
(New Zealand)
Climate Phenomena and
their Relevance for Future
Regional Climate Change

1218
14
Table of Contents
Executive Summary ................................................................... 1219
14.1 Introduction .................................................................... 1222
14.1.1 Monsoons and Tropical Convergence Zones ........... 1222
14.1.2 Modes of Climate Variability ................................... 1222
14.1.3 Tropical and Extratropical Cyclones ......................... 1223
14.1.4 Summary of Climate Phenomena and their Impact
on Regional Climate ................................................ 1223
Box 14.1: Conceptual Definitions and Impacts of Modes
of Climate Variability .............................................................. 1223
14.2 Monsoon Systems ......................................................... 1225
14.2.1 Global Overview ..................................................... 1225
14.2.2 Asian-Australian Monsoon ..................................... 1227
14.2.3 American Monsoons ............................................... 1232
14.2.4 African Monsoon .................................................... 1234
14.2.5 Assessment Summary ............................................. 1234
14.3 Tropical Phenomena ..................................................... 1235
14.3.1 Convergence Zones ................................................. 1235
14.3.2 Madden–Julian Oscillation ...................................... 1237
14.3.3 Indian Ocean Modes ............................................... 1237
14.3.4 Atlantic Ocean Modes ............................................. 1239
14.3.5 Assessment Summary ............................................. 1240
14.4 El Niño-Southern Oscillation ..................................... 1240
14.4.1 Tropical Pacific Mean State ..................................... 1240
14.4.2 El Niño Changes over Recent Decades and
in the Future ........................................................... 1240
14.4.3 Teleconnections....................................................... 1243
14.4.4 Assessment Summary ............................................. 1243
14.5 Annular and Dipolar Modes ....................................... 1243
14.5.1 Northern Modes ...................................................... 1244
14.5.2 Southern Annular Mode .......................................... 1245
14.5.3 Assessment Summary ............................................. 1246
Box 14.2: Blocking ................................................................... 1246
14.6 Large-scale Storm Systems ........................................ 1248
14.6.1 Tropical Cyclones .................................................... 1248
14.6.2 Extratropical Cyclones ............................................ 1251
14.6.3 Assessment Summary ............................................. 1252
14.7 Additional Phenomena of Relevance ...................... 1253
14.7.1 Pacific–South American Pattern .............................. 1253
14.7.2 Pacific–North American Pattern .............................. 1253
14.7.3 Pacific Decadal Oscillation/Inter-decadal
Pacific Oscillation .................................................... 1253
14.7.4 Tropospheric Biennial Oscillation ............................ 1253
14.7.5 Quasi-Biennial Oscillation ....................................... 1254
14.7.6 Atlantic Multi-decadal Oscillation ........................... 1254
14.7.7 Assessment Summary ............................................. 1255
14.8 Future Regional Climate Change .............................. 1255
14.8.1 Overview ................................................................. 1255
14.8.2 Arctic....................................................................... 1257
14.8.3 North America ......................................................... 1258
14.8.4 Central America and Caribbean .............................. 1260
14.8.5 South America ......................................................... 1261
14.8.6 Europe and Mediterranean ..................................... 1264
14.8.7 Africa ...................................................................... 1266
14.8.8 Central and North Asia ............................................ 1268
14.8.9 East Asia ................................................................. 1269
14.8.10 West Asia ................................................................ 1271
14.8.11 South Asia ............................................................... 1272
14.8.12 Southeast Asia ........................................................ 1273
14.8.13 Australia and New Zealand ..................................... 1273
14.8.14 Pacific Islands Region .............................................. 1275
14.8.15 Antarctica ............................................................... 1276
References ................................................................................ 1290
Frequently Asked Questions
FAQ 14.1 How Is Climate Change
Affecting Monsoons? ........................................... 1228
FAQ 14.2 How Are Future Projections in Regional
Climate Related to Projections of Global
Means? .................................................................. 1256
Supplementary Material
Supplementary Material is available in online versions of the report.

1219
Climate Phenomena and their Relevance for Future Regional Climate Change Chapter 14
14
1
In this Report, the following terms have been used to indicate the assessed likelihood of an outcome or a result: Virtually certain 99–100% probability, Very likely 90–100%,
Likely 66–100%, About as likely as not 33–66%, Unlikely 0–33%, Very unlikely 0–10%, Exceptionally unlikely 0–1%. Additional terms (Extremely likely: 95–100%, More likely
than not >50–100%, and Extremely unlikely 0–5%) may also be used when appropriate. Assessed likelihood is typeset in italics, e.g., very likely (see Section 1.4 and Box TS.1
for more details).
2
In this Report, the following summary terms are used to describe the available evidence: limited, medium, or robust; and for the degree of agreement: low, medium, or high.
A level of confidence is expressed using five qualifiers: very low, low, medium, high, and very high, and typeset in italics, e.g., medium confidence. For a given evidence and
agreement statement, different confidence levels can be assigned, but increasing levels of evidence and degrees of agreement are correlated with increasing confidence (see
Section 1.4 and Box TS.1 for more details).
Executive Summary
This chapter assesses the scientific literature on projected changes in
major climate phenomena and more specifically their relevance for
future change in regional climates, contingent on global mean temper-
atures continue to rise.
Regional climates are the complex result of processes that vary strong-
ly with location and so respond differently to changes in global-scale
influences. The following large-scale climate phenomena are increas-
ingly well simulated by climate models and so provide a scientific
basis for understanding and developing credibility in future regional
climate change. A phenomenon is considered relevant to regional cli-
mate change if there is confidence
that it has influence on the regional
climate and there is confidence that the phenomenon will change, par-
ticularly under the Representative Concentration Pathway 4.5 (RCP4.5)
or higher end scenarios. {Table 14.3}
Monsoon Systems
There is growing evidence of improved skill of climate models
in reproducing climatological features of the global mon-
soon. Taken together with identified model agreement on
future changes, the global monsoon, aggregated over all mon-
soon systems, is likely
1
to strengthen in the 21st century with
increases in its area and intensity, while the monsoon circula-
tion weakens. Monsoon onset dates are likely to become earlier
or not to change much and monsoon retreat dates are likely to
delay, resulting in lengthening of the monsoon season in many
regions. {14.2.1}
Future increase in precipitation extremes related to the monsoon is
very likely in South America, Africa, East Asia, South Asia, Southeast
Asia and Australia. Lesser model agreement results in medium confi-
dence
2
that monsoon-related interannual precipitation variability will
increase in the future. {14.2.1, 14.8.5, 14.8.7, 14.8.9, 14.8.11, 14.8.12,
14.8.13}
Model skill in representing regional monsoons is lower compared to
the global monsoon and varies across different monsoon systems.
There is medium confidence that overall precipitation associated with
the Asian-Australian monsoon will increase but with a north–south
asymmetry: Indian and East Asian monsoon precipitation is projected
to increase, while projected changes in Australian summer monsoon
precipitation are small. There is medium confidence that the Indian
summer monsoon circulation will weaken, but this is compensated by
increased atmospheric moisture content, leading to more precipitation.
For the East Asian summer monsoon, both monsoon circulation and
precipitation are projected to increase. There is medium confidence that
the increase of the Indian summer monsoon rainfall and its extremes
throughout the 21st century will be the largest among all monsoons.
{14.2.2, 14.8.9, 14.8.11, 14.8.13}
There is low confidence in projections of changes in precipita-
tionamounts for the North American and South American monsoons,
but medium confidence that the North American monsoon will arrive
and persist later in the annual cycle, and high confidence in expansion
of the South American monsoon area. {14.2.3, 14.8.3, 14.8.4, 14.8.5}
There is low confidence in projections of a small delay in the devel-
opment of the West African rainy season and an intensification of
late-season rains. Model limitations in representing central features
of the West African monsoon result in low confidence in future projec-
tions. {14.2.4, 14.8.7}
Tropical Phenomena
Based on models’ ability to reproduce general features of the
Indian Ocean Dipole and agreement on future projections, the
tropical Indian Ocean is likely to feature a zonal (east–west)
pattern of change in the future with reduced warming and
decreased precipitation in the east, and increased warming and
increased precipitation in the west, directly influencing East
Africa and Southeast Asia precipitation. {14.3, 14.8.7, 14.8.12}
A newly identified robust feature in model simulations of trop-
ical precipitation over oceans gives medium confidence that
annual precipitation change follows a ‘warmer-get-wetter’
pattern, increasing where warming of sea surface temperature
exceeds the tropical mean and vice versa. There is medium con-
fidence in projections showing an increase in seasonal mean precipi-
tation on the equatorial flank of the Inter-Tropical Convergence Zone
(ITCZ) affecting parts of Central America, the Caribbean, South Ameri-
ca, Africa and West Asia despite shortcomings in many models in simu-
lating the ITCZ. There is medium confidence that the frequency of zon-
ally oriented South Pacific Convergence Zone events will increase, with
the South Pacific Convergence Zone (SPCZ) lying well to the northeast
of its average position, a feature commonly reproduced in models that
simulate the SPCZ realistically, resulting in reduced precipitation over
many South Pacific island nations. Similarly there is medium confi-
dence that the South Atlantic Convergence Zone will shift southwards,
leading to an increase in precipitation over southeastern South Amer-
ica and a reduction immediately north thereof. {14.3, 14.8.4, 14.8.5,
14.8.7, 14.8.11, 14.8.14}

1220
Chapter 14 Climate Phenomena and their Relevance for Future Regional Climate Change
14
There is low confidence in projections of future changes in the
Madden–Julian Oscillation owing to poor ability of the models to
simulate it and its sensitivity to ocean warming patterns. The implica-
tions for future projections of regional climate extremes in West Asia,
South Asia, Southeast Asia and Australia are therefore highly uncertain
when associated with the Madden–Julian Oscillation. {14.3, 14.8.10,
14.8.11, 14.8.12, 14.8.13}
There is low confidence in the projections of future changes for the
tropical Atlantic, both for the mean and interannual modes, because
of systematic errors in model simulations of current climate. The impli-
cations for future changes in Atlantic hurricanes and tropical South
American and West African precipitation are therefore uncertain. {14.3,
14.6.1, 14.8.5, 14.8.7 }
The realism of the representation of El Niño-Southern Oscilla-
tion (ENSO) in climate models is increasing and models simulate
ongoing ENSO variability in the future. Therefore there is high
confidence that ENSO very likely remains as the dominant mode
of interannual variability in the future and due to increased
moisture availability, the associated precipitation variability on
regional scales likely intensifies. An eastward shift in the patterns
of temperature and precipitation variations in the North Pacific and
North America related to El Niño and La Niña (teleconnections), a fea-
ture consistently simulated by models, is projected for the future, but
with medium confidence, while other regional implications including
those in Central and South America, the Caribbean, Africa, most of
Asia, Australia and most Pacific Islands are more uncertain. However,
natural modulations of the variance and spatial pattern of ENSO are
so large in models that confidence in any specific projected change in
its variability in the 21st century remains low. {14.4, 14.8.3, 14.8.4,
14.8.5, 14.8.7, 14.8.9, 14.8.11, 14.8.12, 14.8.13, 14.8.14}
Cyclones
Based on process understanding and agreement in 21st century
projections, it is likely that the global frequency of occurrence
of tropical cyclones will either decrease or remain essentially
unchanged, concurrent with a likely increase in both global
mean tropical cyclone maximum wind speed and precipitation
rates. The future influence of climate change on tropical cyclones
is likely to vary by region, but the specific characteristics of the
changes are not yet well quantified and there is low confidence
in region-specific projections of frequency and intensity. How-
ever, better process understanding and model agreement in specific
regions provide medium confidence that precipitation will be more
extreme near the centres of tropical cyclones making landfall in North
and Central America; East Africa; West, East, South and Southeast
Asia as well as in Australia and many Pacific islands. Improvements in
model resolution and downscaling techniques increase confidence in
projections of intense storms, and the frequency of the most intense
storms will more likely than not increase substantially in some basins.
{14.6, 14.8.3, 14.8.4, 14.8.7, 14.8.9, 14.8.10, 14.8.11, 14.8.12, 14.8.13,
14.8.14}
Despite systematic biases in simulating storm tracks, most
models and studies are in agreement on the future changes in
the number of extratropical cyclones (ETCs). The global number
of ETCs is unlikely to decrease by more than a few percent. A
small poleward shift is likely in the Southern Hemisphere (SH)
storm track. It is more likely than not, based on projections with
medium confidence, that the North Pacific storm track will shift pole-
ward. However, it is unlikely that the response of the North Atlantic
storm track is a simple poleward shift. There is low confidence in the
magnitude of regional storm track changes, and the impact of such
changes on regional surface climate. It is very likely that increases in
Arctic, Northern European, North American and SH winter precipitation
by the end of the 21st century (2081–2100) will result from more pre-
cipitation in ETCs associated with enhanced extremes of storm-related
precipitation. {14.6, 14.8.2, 14.8.3, 14.8.5, 14.8.6, 14.8.13, 14.8.15}
Blocking
Increased ability in simulating blocking in models and higher
agreement on projections indicate that there is medium confi-
dence that the frequency of Northern and Southern Hemisphere
blocking will not increase, while trends in blocking intensity and
persistence remain uncertain. The implications for blocking-related
regional changes in North America, Europe and Mediterranean and
Central and North Asia are therefore also uncertain. {14.8.3, 14.8.6,
14.8.8, Box 14.2}
Annular and Dipolar Modes of Variability
Models are generally able to simulate gross features of annular
and dipolar modes. Model agreement in projections indicates
that future boreal wintertime North Atlantic Oscillation is very
likely to exhibit large natural variations and trend of similar
magnitude to that observed in the past and is likely to become
slightly more positive on average, with some, but not well doc-
umented, implications for winter conditions in the Arctic, North
America and Eurasia. The austral summer/autumn positive trend
in Southern Annular Mode is likely to weaken considerably as
stratospheric ozone recovers through the mid-21st century with
some, but not well documented, implications for South Ameri-
ca, Africa, Australia, New Zealand and Antarctica. {14.5.1, 14.5.2,
14.8.2, 14.8.3, 14.8.5, 14.8.6, 14.8.7, 14.8.8, 14.8.13, 14.8.15}
Atlantic Multi-decadal Oscillation
Multiple lines of evidence from paleo reconstructions and model
simulations indicate that the Atlantic Multi-decadal Oscillation
(AMO) is unlikely to change its behaviour in the future as the
mean climate changes. However, natural fluctuations in the AMO
over the coming few decades are likely to influence regional climates
at least as strongly as will human-induced changes, with implications
for Atlantic major hurricane frequency, the West African wet season,
North American and European summer conditions. {14.7.6, 14.2.4,
14.6.1, 14.8.3, 14.8.6}

1221
Climate Phenomena and their Relevance for Future Regional Climate Change Chapter 14
14
Pacific South American Pattern
Understanding of underlying physical mechanisms and the pro-
jected sea surface temperatures in the equatorial Indo-Pacific
regions gives medium confidence that future changes in the
mean atmospheric circulation for austral summer will project
on this pattern, thereby influencing the South American Conver-
gence Zone and precipitation over southeastern South America.
{14.7.2, 14.8.5}

1222
Chapter 14 Climate Phenomena and their Relevance for Future Regional Climate Change
14
14.1 Introduction
Regional climates are the complex outcome of local physical processes
and the non-local responses to large-scale phenomena such as the El
Niño-Southern Oscillation (ENSO) and other dominant modes of cli-
mate variability. The dynamics of regional climates are determined by
local weather systems that control the net transport of heat, moisture
and momentum into a region. Regional climate is interpreted in the
widest sense to mean the whole joint probability distribution of cli-
mate variables for a region including the time mean state, the variance
and co-variance and the extremes.
This chapter assesses the physical basis of future regional climate
change in the context of changes in the following types of phenom-
ena: monsoons and tropical convergence zones, large-scale modes of
climate variability and tropical and extratropical cyclones. Assessment
of future changes in these phenomena is based on climate model
projections (e.g., the Coupled Model Intercomparison Project Phase
3 (CMIP3) and CMIP5 multi-model ensembles described in Chapter
12) and an understanding of how well such models represent the key
processes in these phenomena. More generic processes relevant to
regional climate change, such as thermodynamic processes and land–
atmosphere feedback processes, are assessed in Chapter 12. Local pro-
cesses such as snow–albedo feedback, moisture feedbacks due to local
vegetation, effects of steep complex terrain etc. can be important for
changes but are in general beyond the scope of this chapter. The main
focus here is on large-scale atmospheric phenomena rather than more
local feedback processes or impacts such as floods and droughts.
Sections 14.1.1 to 14.1.3 introduce the three main classes of phenom-
ena addressed in this Assessment and then Section 14.1.4 summarizes
their main impacts on precipitation and surface temperature. Specif-
ic climate phenomena are then addressed in Sections 14.2 to 14.7,
which build on key findings from the Fourth Assessment Report, AR4
(IPCC, 2007a), and provide an assessment of process understanding
and how well models simulate the phenomenon and an assessment of
future projections for the phenomena. In Section 14.8, future regional
climate changes are assessed, and where possible, interpreted in terms
of future changes in phenomena. In particular, the relevance of the var-
ious phenomena addressed in this chapter for future climate change in
the regions covered in Annex I are emphasized. The regions are those
defined in previous regional climate change assessments (IPCC, 2007a,
2007b, 2012). Regional Climate Models (RCMs) and other downscaling
tools required for local impact assessments are assessed in Section 9.6
and results from these studies are used where such supporting infor-
mation adds additional relevant details to the assessment.
14.1.1 Monsoons and Tropical Convergence Zones
The major monsoon systems are associated with the seasonal move-
ment of convergence zones over land, leading to profound season-
al changes in local hydrological cycles. Section 14.2 assesses current
understanding of monsoonal behaviour in the present and future cli-
mate, how monsoon characteristics are influenced by the large-scale
tropical modes of variability and their potential changes and how the
monsoons in turn affect regional extremes. Convergence zones over
the tropical oceans not only play a fundamental role in determining
regional climates but also influence the global atmospheric circula-
tion. Section 14.3 presents an assessment of these and other important
tropical phenomena.
14.1.2 Modes of Climate Variability
Regional climates are strongly influenced by modes of climate variabil-
ity (see Box 14.1 for definitions of mode, regime and teleconnection).
This chapter assesses major modes such as El Niño-Southern Oscil-
lation (ENSO, Section 14.4), the North Atlantic Oscillation/Northern
Annular Mode (NAO/NAM) and Southern Annular Mode (SAM) in the
extratropics (Section 14.5) and various other well-known modes such
as the Pacific North American (PNA) pattern, Pacific Decadal Oscillation
(PDO), Atlantic Multi-decadal Oscillation (AMO), etc. (Section 14.7).
Many of these modes are described in previous IPCC reports (e.g., Sec-
tion 3.6 of AR4 WG1). Chapter 2 gives operational definitions of mode
indices (Box 2.5, Table 1) and an assessment of observed historical
behaviour (Section 2.7.8). Climate models are generally able to sim-
ulate the gross features of many of the modes of variability (Section
9.5), and so provide useful tools for understanding how modes might
change in the future (Müller and Roeckner, 2008; Handorf and Dethloff,
2009).
Modes and regimes provide a simplified description of variations in
the climate system. In the simplest paradigm, variations in climate var-
iables are described by linear projection onto a set of mode indices
(Baldwin et al., 2009; Baldwin and Thompson, 2009; Hurrell and Deser,
2009). For example, a large fraction of interannual variance in Northern
Hemisphere (NH) sea level pressure is accounted for by linear combi-
nations of the NAM and the PNA modes (Quadrelli and Wallace, 2004).
Alternatively, the nonlinear regime paradigm considers the probability
distribution of local climate variables to be a multi-modal mixture of
distributions related to a discrete set of regimes/types (Palmer, 1999;
Cassou and Terray, 2001; Monahan et al., 2001).
There is ongoing debate on the relevance of the different paradigms
(Stephenson et al., 2004; Christiansen, 2005; Ambaum, 2008; Fereday
et al., 2008), and care is required when interpreting these constructs
(Monahan et al., 2009; Takahashi et al., 2011).
Modes of climate variability may respond to climate change in one or
more of the following ways:
• No change—the modes will continue to behave as they have done
in the recent past.
• Index changes—the probability distributions of the mode indices
may change (e.g., shifts in the mean and/or variance, or more com-
plex changes in shape such as changes in local probability density,
e.g., frequency of regimes).
• Spatial changes—the climate patterns associated with the modes
may change spatially (e.g., new flavours of ENSO; see Section
14.4 and Supplementary Material) or the local amplitudes of the
climate patterns may change (e.g., enhanced precipitation for a
given change in index (Bulic and Kucharski, 2012)).

1223
Climate Phenomena and their Relevance for Future Regional Climate Change Chapter 14
14
• Structural changes—the types and number of modes and their
mutual dependencies may change; completely new modes could
in principle emerge.
An assessment of changes in modes of variability can be problematic
for several reasons. First, interpretation depends on how one separates
modes of variability from forced changes in the time mean or variations
in the annual cycle (Pezzulli et al., 2005; Compo and Sardeshmukh,
2010). Modes of variability are generally defined using indices based
on either detrended anomalies (Deser et al., 2010b) or anomalies
obtained by removing the time mean over a historical reference period
(see Box 2.5). The mode index in the latter approach will include
changes in the mean, whereas by definition there is no trend in a mode
index when it is based on detrended anomalies. Second, it can be diffi-
cult to separate natural variations from forced responses, for example,
warming trends in the N. Atlantic during the 20th century that may be
due to trends in aerosol and other forcings rather than natural internal
variability (see Sections 14.6.2 and 14.7.1). Finally, modes of climate
variability are nonlinearly related to one another (Hsieh et al., 2006)
and this relationship can change in time (e.g., trends in correlation
between ENSO and NAO indices).
Even when the change in a mode of variability index does not con-
tribute greatly to mean regional climate change, a climate mode may
still play an important role in regional climate variability and extremes.
Natural variations, such as those due to modes of variability, are a
major source of uncertainty in future projections of mean regional
climate (Deser et al., 2012). Furthermore, changes in the extremes of
regional climate are likely to be sensitive to small changes in variance
or shape of the distribution of the mode indices or the mode spatial
patterns (Coppola et al., 2005; Scaife et al., 2008).
14.1.3 Tropical and Extratropical Cyclones
Tropical and extratropical cyclones (TCs and ETCs) are important
weather phenomena intimately linked to regional climate phenomena
and modes of climate variability. Both types of cyclone can produce
extreme wind speeds and precipitation (see Section 3.4, IPCC Spe-
cial Report on Managing the Risks of Extreme Events and Disasters
to Advance Climate Change Adaptation (SREX; IPCC, 2012)). Sections
14.6.1 and 14.6.2 assess the recent progress in scientific understand-
ing of how these important weather systems are likely to change in
the future.
14.1.4 Summary of Climate Phenomena and their Impact
on Regional Climate
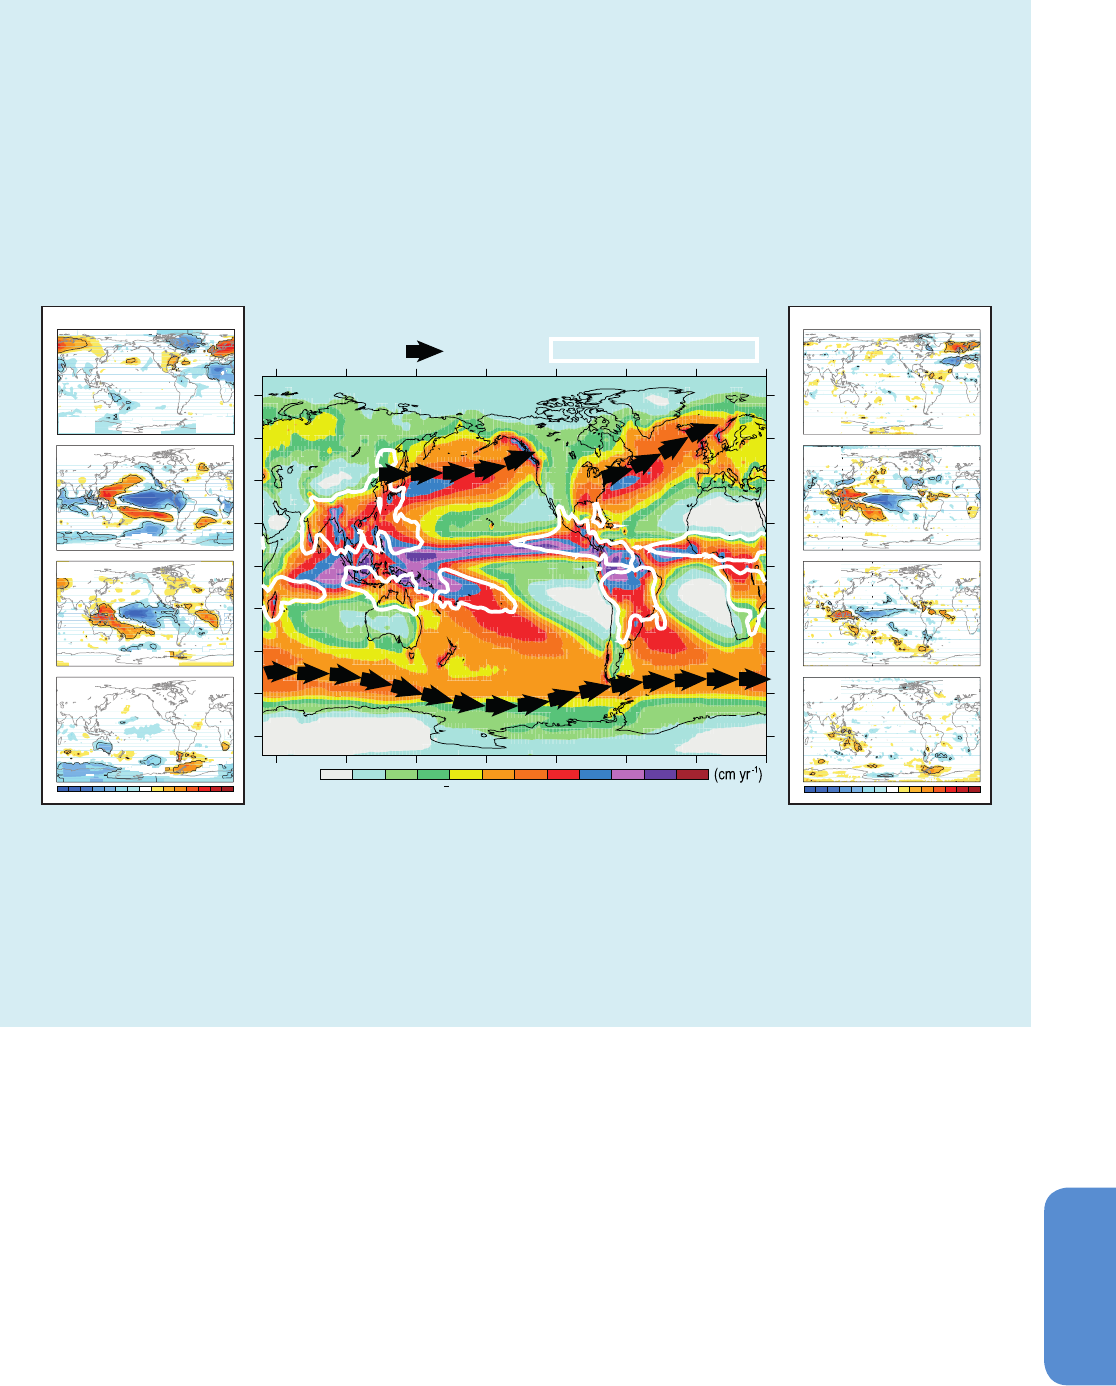
Box 14.1, Figure 1 illustrates the large-scale climate phenomena
assessed in this chapter. Many of the climate phenomena are evident
in the map of annual mean rainfall (central panel). The most abundant
annual rainfall occurs in the tropical convergence zones: Inter-Tropical
Convergence Zone (ITCZ) over the Pacific, Atlantic and African equato-
rial belt (see Section 14.3.1.1), South Pacific Convergence Zone (SPCZ)
over central South Pacific (see Section 14.3.1.2) and South Atlantic
Convergence Zone (SACZ) over Southern South America and Southern
Atlantic (see Section 14.3.1.3). In the global monsoon domain (white
contours on the map), large amounts of precipitation occur but only
in certain seasons (see Section 14.2.1). Local maxima in precipitation
are also apparent over the major storm track regions in mid-latitudes
(see Section 14.7.2). Box 14.1 Figure 1 also illustrates surface air tem-
perature (left panels) and precipitation (right panels) teleconnection
patterns for ENSO (in December to February and June to August; see
Section 14.4), NAO (in December to February; see Section 14.5.1) and
SAM (in September to November; see Section 14.5.2). The telecon-
nection patterns were obtained by taking the correlation between
monthly gridded temperature and precipitation anomalies and indi-
ces for the modes (see Box 14.1 definitions). It can be seen that all
three modes have far-reaching effects on temperature and precipita-
tion in many parts of the world. Box 14.1, Table 1 briefly summarizes
the main regional impacts of different well-known modes of climate
variability.
Box 14.1 | Conceptual Definitions and Impacts of Modes of Climate Variability
This box briefly defines key concepts used to interpret modes of variability (below) and summarizes regional impacts associated with
well-known modes (Box 14.1, Table 1 and Box 14.1, Figure 1). The terms below are used to describe variations in time series variables
reported at a set of geographically fixed spatial locations, for example, a set of observing stations or model grid points (based on the
more complete statistical and dynamical interpretation in Stephenson et al. (2004)).
Climate indices
Time series constructed from climate variables that provides an aggregate summary of the state of the climate system. For example,
the difference between sea level pressure in Iceland and the Azores provides a simple yet useful historical NAO index (see Section 14.5
and Box 2.5 for definitions of this and other well-known observational indices). Because of their maximum variance properties, climate
indices are often defined using principal components.
Principal component
A linear combination of a set of time series variables that has maximum variance subject to certain normalization constraints. Principal
components are widely used to define optimal climate indices from gridded datasets (e.g., the Arctic Oscillation (AO) index, defined as
the leading principal component of NH sea level pressure; Section 14.5). (continued on next page)

1224
Chapter 14 Climate Phenomena and their Relevance for Future Regional Climate Change
14
Box 14.1 (continued)
Climate pattern
A set of coefficients obtained by ‘projection’ (regression) of climate variables at different spatial locations onto a climate index time series.
Empirical Orthogonal Function
The climate pattern obtained if the climate index is a principal component. It is an eigenvector of the covariance matrix of gridded
climate data.
Teleconnection
A statistical association between climate variables at widely separated, geographically fixed spatial locations. Teleconnections are
caused by large spatial structures such as basin-wide coupled modes of ocean–atmosphere variability, Rossby wave-trains, mid-latitude
jets and storm-tracks, etc.
Teleconnection pattern
A correlation map obtained by calculating the correlation between variables at different spatial locations and a climate index. It is the
special case of a climate pattern obtained for standardized variables and a standardized climate index, that is, the variables and index
are each centred and scaled to have zero mean and unit variance. One-point teleconnection maps are made by choosing a variable at
one of the locations to be the climate index. (continued on next page)
Mode Regional Climate Impacts
ENSO
Global impact on interannual variability in global mean temperature. Influences severe weather and tropical cyclone activity worldwide. The diverse El Niño
flavours present different teleconnection patterns that induce large impacts in numerous regions from polar to tropical latitudes (Section 14.4).
PDO
Influences surface air temperature and precipitation over the entire North American continent and extratropical North Pacific. Modulates ENSO rainfall
teleconnections, e.g., Australian climate (Section 14.7.3).
IPO
Modulates decadal variability in Australian rainfall, and ENSO teleconnections to rainfall, surface temperature, river flow and flood risk over Australia,
New Zealand and the SPCZ (Section 14.7.3).
NAO
Influences the N. Atlantic jet stream, storm tracks and blocking and thereby affects winter climate in over the N. Atlantic and surrounding landmasses.
The summer NAO (SNAO) influences Western Europe and Mediterranean basin climates in the season (Section 14.5.1).
NAM
Modulates the intensity of mid-latitude storms throughout the Northern Hemisphere and thereby influences North America and Eurasia climates as well as
sea ice distribution across the Arctic sea (Section 14.5.1).
NPO
Influences winter air temperature and precipitation over much of western North America as well as Arctic sea ice in the Pacific sector (Section 14.5.1).
SAM
Influences temperature over Antarctica, Australia, Argentina, Tasmania and the south of New Zealand and precipitation over southern South America,
New Zealand, Tasmania, Australia and South Africa (Section 14.5.2).
PNA
Influences the jet stream and storm tracks over the Pacific and North American sectors, exerting notable influences on the temperature and precipitation in
these regions on intraseasonal and interannual time scales (Section 14.7.2).
PSA
Influences atmospheric circulation over South America and thereby has impacts on precipitation over the continent (Section 14.7.1).
AMO
Influences air temperatures and rainfall over much of the Northern Hemisphere, in particular, North America and Europe. It is associated with multidecadal
variations in Indian, East Asian and West African monsoons, the North African Sahel and northeast Brazil rainfall, the frequency of North American droughts
and Atlantic hurricanes (Section 14.7.6).
AMM
Influences seasonal hurricane activity in the tropical Atlantic on both decadal and interannual time scales. Its variability is influenced by other modes,
particularly ENSO and NAO (Section 14.3.4).
AN
Affects the West African Monsoon, the oceanic forcing of Sahel rainfall on both decadal and interannual time-scales and the spatial extension of drought
in South Africa (Section 14.3.4).
IOB
Associated with the intensity of Northwest Pacific monsoon, the tropical cyclone activity over the Northwest Pacific and anomalous rainfall over East Asia
(Section 14.3.3).
IOD
Associated with droughts in Indonesia, reduced rainfall over Australia, intensified Indian summer monsoon, floods in East Africa, hot summers over Japan, and
anomalous climate in the extratropical Southern Hemisphere (Section 14.3.3).
TBO
Modulates the strength of the Indian and West Pacific monsoons. Affects droughts and floods over large areas of south Asia and Australia (Section 14.7.4).
MJO
Modulates the intensity of monsoon systems around the globe and tropical cyclone activity in the Indian, Pacific and Atlantic Oceans. Associated with enhanced
rainfall in Western North America, northeast Brazil, Southeast Africa and Indonesia during boreal winter and Central America/Mexico and Southeast Asia
during boreal summer (Section 14.3.2).
QBO
Strongly affects the strength of the northern stratospheric polar vortex as well as the extratropical troposphere circulation, occurring preferentially
in boreal winter (Section 14.7.5).
BLC
Associated with cold air outbreaks, heat-waves, floods and droughts in middle and high latitudes of both hemispheres (Box 14.2).
Box 14.1, Table 1 | Regional climate impacts of fundamental modes of variability.
Notes:
AMM: Atlantic Meridional Mode
AMO: Atlantic Multi-decadal Oscillation
AN: Atlantic Niño pattern
BLC: Blocking events
ENSO: El Niño-Southern Oscillation
IOB: Indian Ocean Basin pattern
IOD: Indian Ocean Dipole pattern
IPO: Interdecadal Pacific Oscillation
MJO: Madden-Julian Oscillation
NAM: Northern Annular Mode
NAO: North Atlantic Oscillation
NPO: North Pacific Oscillation
PDO: Pacific Decadal Oscillation
PNA: Pacific North America pattern
PSA: Pacific South America pattern
QBO: Quasi-Biennial Oscillation
SAM: Southern Annular Mode
TBO: Tropospheric Biennial Oscillation
1225
Climate Phenomena and their Relevance for Future Regional Climate Change Chapter 14
14
Box 14.1 (continued)
Mode of climate variability
Underlying space–time structure with preferred spatial pattern and temporal variation that helps account for the gross features in vari-
ance and for teleconnections. A mode of variability is often considered to be the product of a spatial climate pattern and an associated
climate index time series.
Climate regime
A set of similar states of the climate system that occur more frequently than nearby states due to either more persistence or more
often recurrence. In other words, a cluster in climate state space associated with a local maximum in the probability density function.
Annual precipitation
Winter storm-tracks Monsoon precipitation domains
Temperature
-0.8 -0.6 -0.4 -0.2 0.20.4 0.60.8
Precipitation
NAO
DJF
SOI
DJF
SOI
JJA
SON
SAM
NAO
DJF
SOI
DJF
SOI
JJA
SON
SAM
-0.8 -0.6 -0.4 -0.2 0.20.4 0.60.8
01030507090 120 150 200 250 300 400
Box 14.1, Figure 1 | Global distribution of average annual rainfall (in cm/year) from 1979–2010 Global Precipitation Climatology Project (GPCP) database, monsoon
precipitation domain (white contours) as defined in Section 14.2.1, and winter storm-tracks in both hemispheres (black arrows). In left (right) column seasonal cor-
relation maps of North Atlantic Oscillation (NAO), Southern Oscillation Index (SOI, the atmospheric component of El Niño-Southern Oscillation (ENSO)) and Southern
Annular Mode (SAM) mode indexes vs. monthly temperature (precipitation) anomalies in boreal winter (December, January and February (DJF)), austral winter (June, July
and August (JJA)) and austral spring (September, October and November (SON)). Black contours indicate a 99% significance level. The mode indices were taken from
National Oceanic and Atmospheric Administration (NOAA, http://www.esrl.noaa.gov/psd/data/climateindices/list/), global temperatures from NASA Goddard Institute
of Space Studies Surface Temperature Analysis (GISTEMP, http://data.giss.nasa.gov/gistemp/) and global precipitations from GPCP (http://www.esrl.noaa.gov/psd/data/
gridded/data.gpcp.html).
14.2 Monsoon Systems
Monsoons are a seasonal phenomenon responsible for producing the
majority of wet season rainfall within the tropics. The precipitation
characteristics over the Asian-Australian, American and African mon-
soons can be viewed as an integrated global monsoon system, asso-
ciated with a global-scale atmospheric overturning circulation (Tren-
berth et al., 2000). In Section 14.2.1, changes in precipitation of the
global monsoon system are assessed. Changes in regional monsoons
are assessed in Sections 14.2.2 to 14.2.4.
14.2.1 Global Overview
The global land monsoon precipitation displays a decreasing trend
over the last half-century, with primary contributions from the weak-
ened summer monsoon systems in the NH (Wang and Ding, 2006).
The combined global ocean–land monsoon precipitation has inten-
sified during 1979–2008, mainly due to an upward trend in the NH
summer oceanic monsoon precipitation (Zhou et al., 2008b; Hsu et al.,
2011; Wang et al., 2012b). Because the fractional increase in monsoon
area is greater than that in total precipitation, the ratio of the latter
to the former (a measure of the global monsoon intensity) exhibits a
1226
Chapter 14 Climate Phenomena and their Relevance for Future Regional Climate Change
14
decreasing trend (Hsu et al., 2011). CMIP5 models generally reproduce
the observed global monsoon domain, but the disparity between the
best and poorest models is large (Section 9.5.2.4).
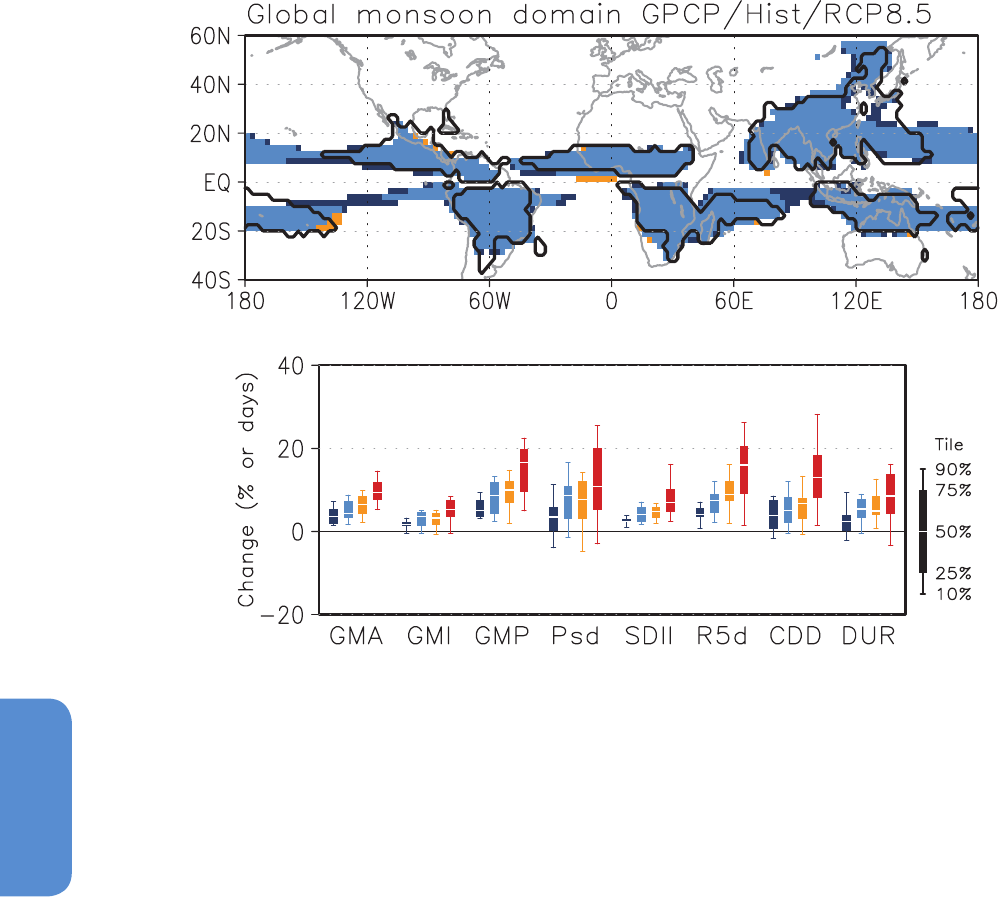
In the CMIP5 models the global monsoon area (GMA), the global
monsoon total precipitation (GMP) and the global monsoon precipi-
tation intensity (GMI) are projected to increase by the end of the 21st
century (2081–2100, Hsu et al., 2013; Kitoh et al., 2013; Figure 14.1).
See Supplementary Material Section 14.SM.1.2 for the definitions of
GMA, GMP and GMI. The CMIP5 model projections show an expan-
sion of GMA mainly over the central to eastern tropical Pacific, the
southern Indian Ocean and eastern Asia. In all RCP scenarios, GMA is
very likely to increase, and GMI is likely to increase, resulting in a very
likely increase in GMP, by the end of the 21st century (2081–2100). The
100-year median changes in GMP are +5%, +8%, +10%, and +16%
in RCP2.6, RCP4.5, RCP6.0, and RCP8.5 scenarios, respectively. Indices
of precipitation extremes such as simple daily precipitation intensity
index (SDII), defined as the total precipitation divided by the number
of days with precipitation greater than or equal to 1 mm, annual max-
Figure 14.1 | (Upper) Observed (thick contour) and simulated (shading) global monsoon domain, based on the definition of Wang et al. (2011). The observations are based
on GPCP v2.2 data (Huffman et al., 2009), and the simulations are based on 26 CMIP5 multi-model mean precipitation with a common 2.5 by 2.5 degree grid in the present
day (1986–2005) and the future (2080–2099; RCP8.5 scenario). Orange (dark blue) shading shows monsoon domain only in the present day (future). Light blue shading shows
monsoon domain in both periods. (Lower) Projected changes for the future (2080–2099) relative to the present day (1986-2005) in the global monsoon area (GMA) and global
monsoon intensity (GMI), global monsoon total precipitation (GMP), standard deviation of interannual variability in seasonal average precipitation (Psd), simple daily precipitation
intensity index (SDII), seasonal maximum 5-day precipitation total (R5d), seasonal maximum consecutive dry days (CDD) and monsoon season duration (DUR), under the RCP2.6
(dark blue; 18 models), RCP4.5 (light blue; 24 models), RCP6.0 (orange; 14 models) and RCP8.5 scenarios (red; 26 models). Units are % except for DUR (days). Box-and-whisker
plots show the 10th, 25th, 50th, 75th and 90th percentiles. All of the indices are calculated for the summer season (May to September in the Northern Hemisphere; November to
March in the Southern Hemisphere). The indices of Psd, SDII, R5d and CDD calculated for each model’s original grid, and then averaged over the monsoon domains determined by
each model at the present-day. The indices of DUR are calculated for seven regional monsoon domains based on the criteria proposed by Wang and LinHo (2002) using regionally
averaged climatological cycles of precipitation, and then their changes are averaged with weighting based on their area at the present day.
imum 5-day precipitation total (R5d) and consecutive dry days (CDD)
all indicate that intense precipitation will increase at larger rates than
those of mean precipitation (Figure 14.1). The standard deviation of
interannual variability in seasonal average precipitation (Psd) is pro-
jected to increase by many models but some models show a decrease
in Psd. This is related to uncertainties in projections of future chang-
es in tropical sea surface temperature (SST). Regarding seasonality,
CMIP5 models project that monsoon onset dates will come earlier or
not change much while monsoon retreat dates will delay, resulting in a
lengthening of the monsoon season in many regions.
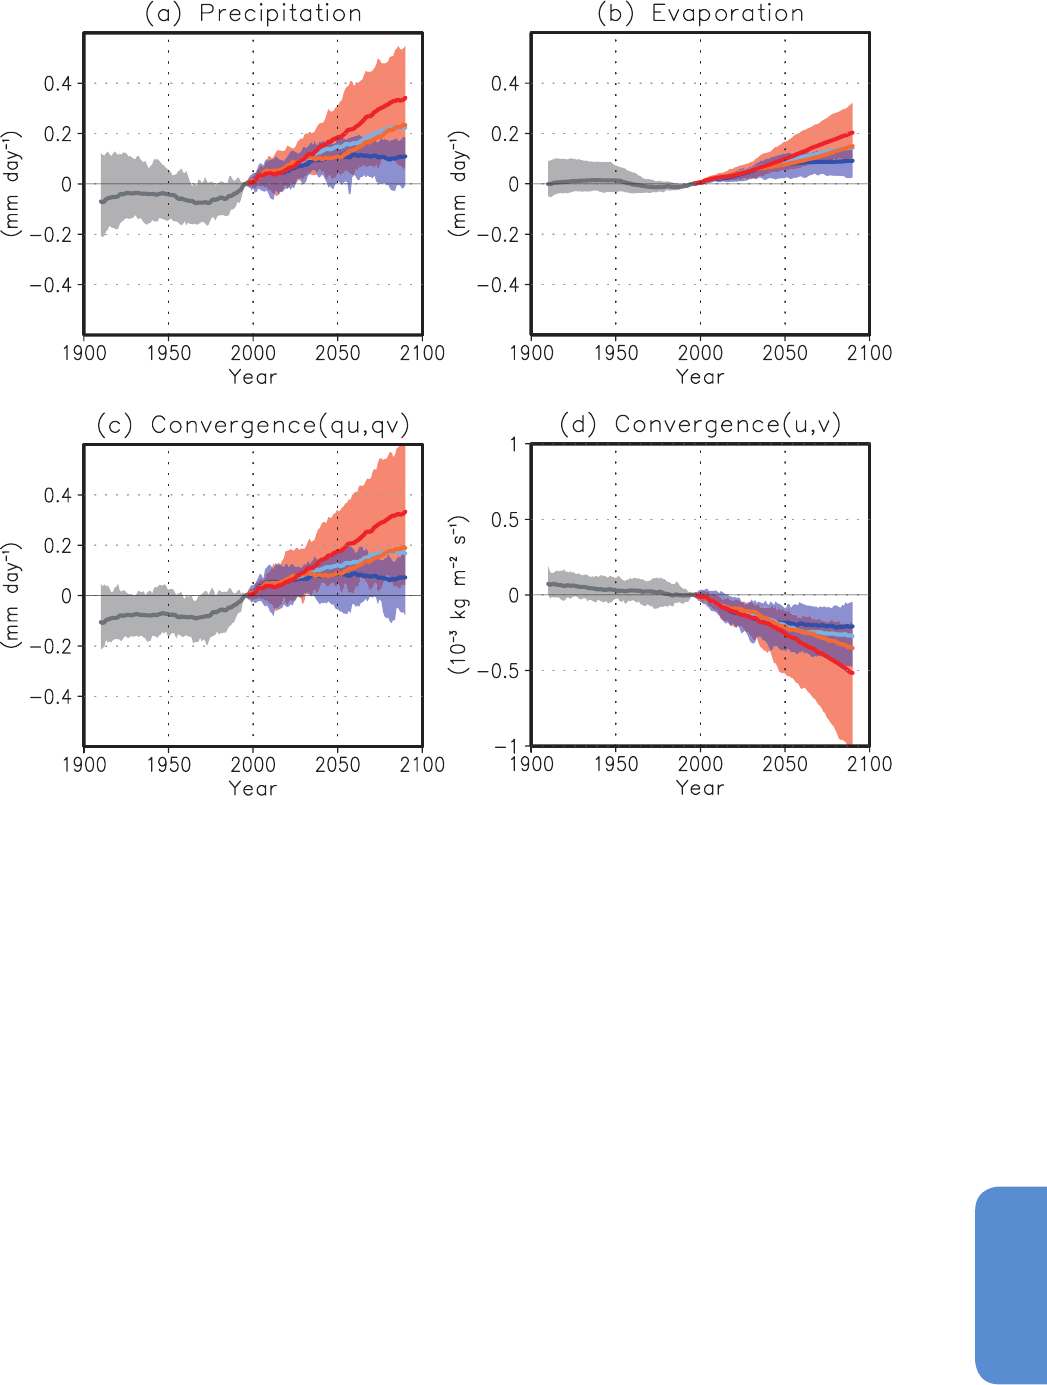
CMIP5 models show a decreasing trend of lower-troposphere wind
convergence (dynamical factor) throughout the 20th and 21st centu-
ries (Figure 14.2d). With increased moisture (see also Section 12.4),
the moisture flux convergence shows an increasing trend from 1980
through the 21st century (Figure 14.2c). Surface evaporation shows
a similar trend (Figure 14.2b) associated with warmer SSTs. There-
fore, the global monsoon precipitation increases (Figure 14.2a) due to
increases in moisture flux convergence and surface evaporation despite
1227
Climate Phenomena and their Relevance for Future Regional Climate Change Chapter 14
14
Figure 14.2 | Time series of simulated anomalies, smoothed with a 20-year running mean over the global land monsoon domain for (a) precipitation (mm day
–1
), (b) evaporation
(mm day
–1
), (c) water vapour flux convergence in the lower (below 500 hPa) troposphere (mm day
–1
), and (d) wind convergence in the lower troposphere (10
–3
kg m
–2
s
–1
), relative
to the present-day (1986–2005), based on CMIP5 multi-model monthly outputs. Historical (grey; 29 models), RCP2.6 (dark blue; 20 models), RCP4.5 (light blue; 24 models), RCP6.0
(orange; 16 models), and RCP8.5 (red; 24 models) simulations are shown in the 10th and 90th percentile (shading), and in all model averages (thick lines).
a weakened monsoon circulation. Besides greenhouse gases (GHGs),
monsoons are affected by changes in aerosol loadings (Ramanathan
et al., 2005). The aerosol direct forcing may heat the atmosphere but
cools the surface, altering atmospheric stability and inducing horizon-
tal pressure gradients that modulate the large-scale circulation and
hence monsoon rainfall (Lau et al., 2008). However, the representation
of aerosol forcing differs among models, and remains an important
source of uncertainty (Chapter 7 and Section 12.2.2), particularly in
some regional monsoon systems.
14.2.2 Asian-Australian Monsoon
The seasonal variation in the thermal contrast between the large Eur-
asian landmass and the Pacific-Indian Oceans drives the powerful
Asian-Australian monsoon (AAM) system (Figure 14.3), which consists
of five major subsystems: Indian (also known as South Asian), East
Asian, Maritime Continent, Australian, and Western North Pacific mon-
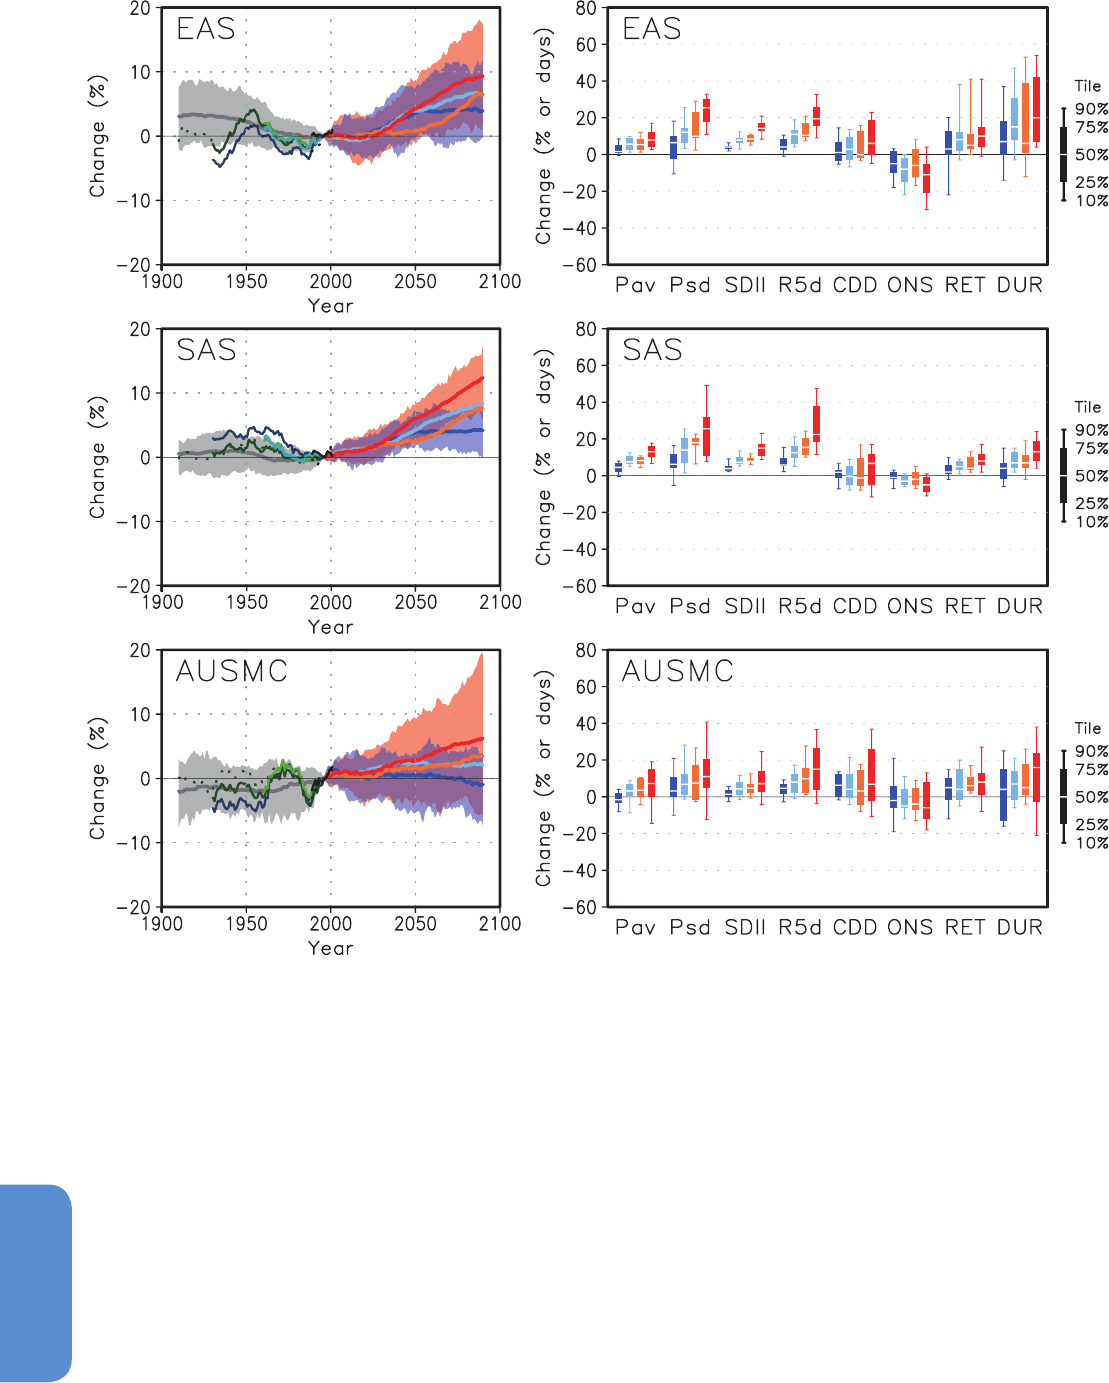
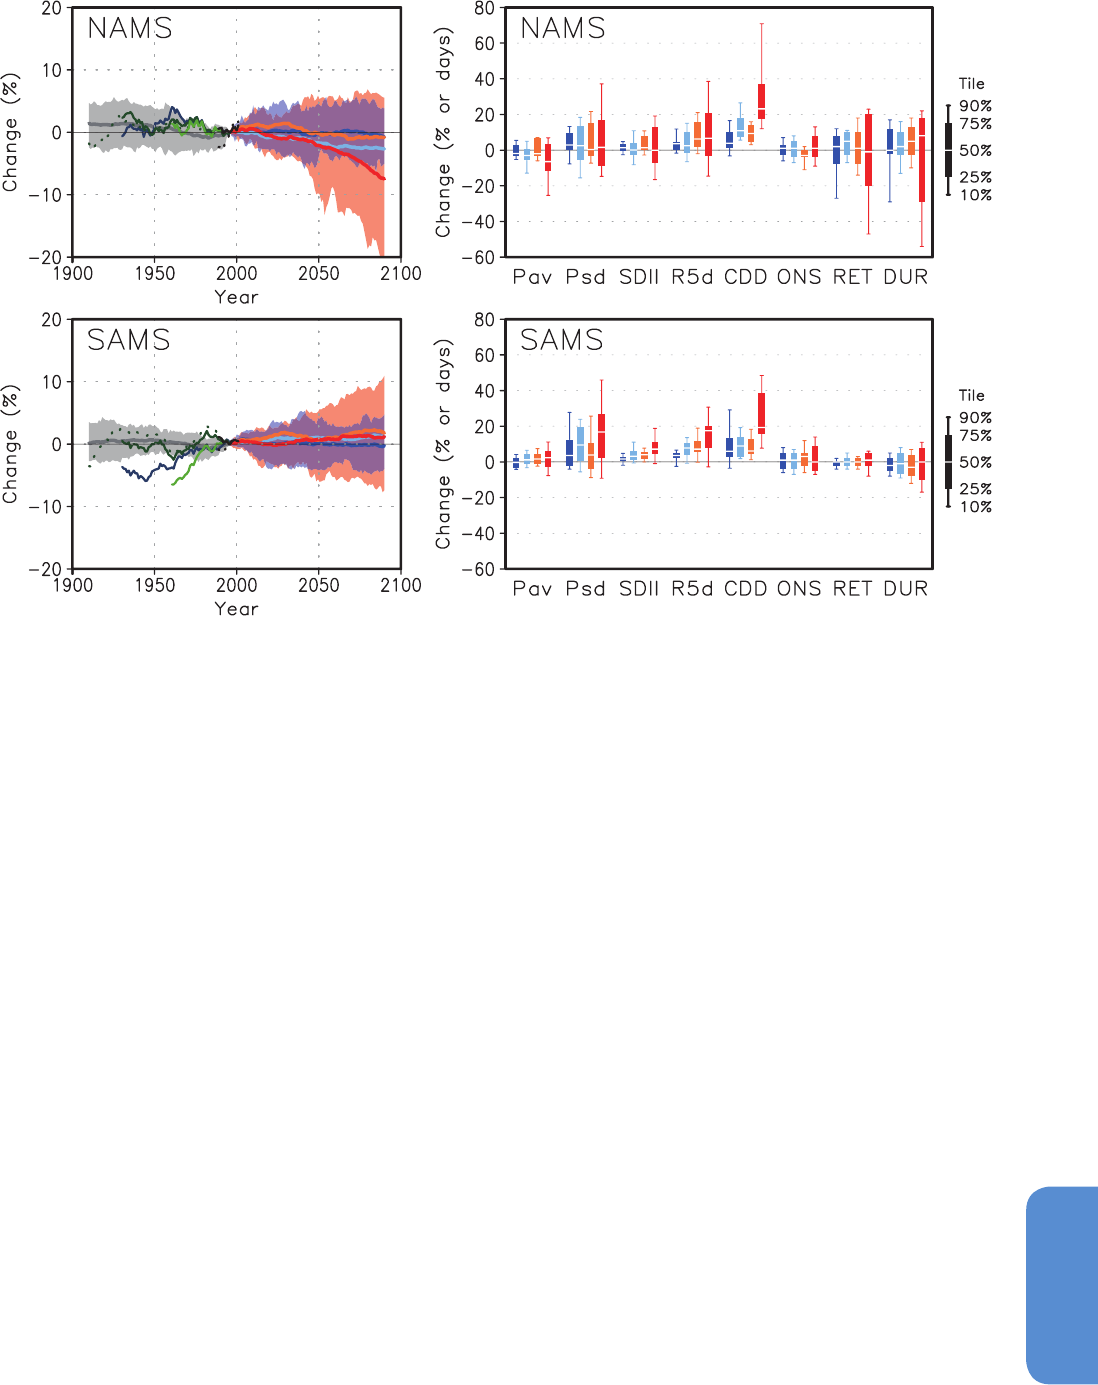
soons. More than 85% of CMIP5 models show an increase in mean
precipitation of the East Asian summer (EAS) monsoon, while more
than 95% of models project an increase in heavy precipitation events
(Figure 14.4). All models and all scenarios project an increase in both
the mean and extreme precipitation in the Indian summer monsoon
(referred to as SAS in Figures 14.3 and 14.4) . In these two regions,
the interannual standard deviation of seasonal mean precipitation
also increases. Over the Australian-Maritime Continent (AUSMC)
monsoon region, agreement among models is low. Figure 14.5 shows
the time-series of circulation indices representing EAS, Indian (IND),
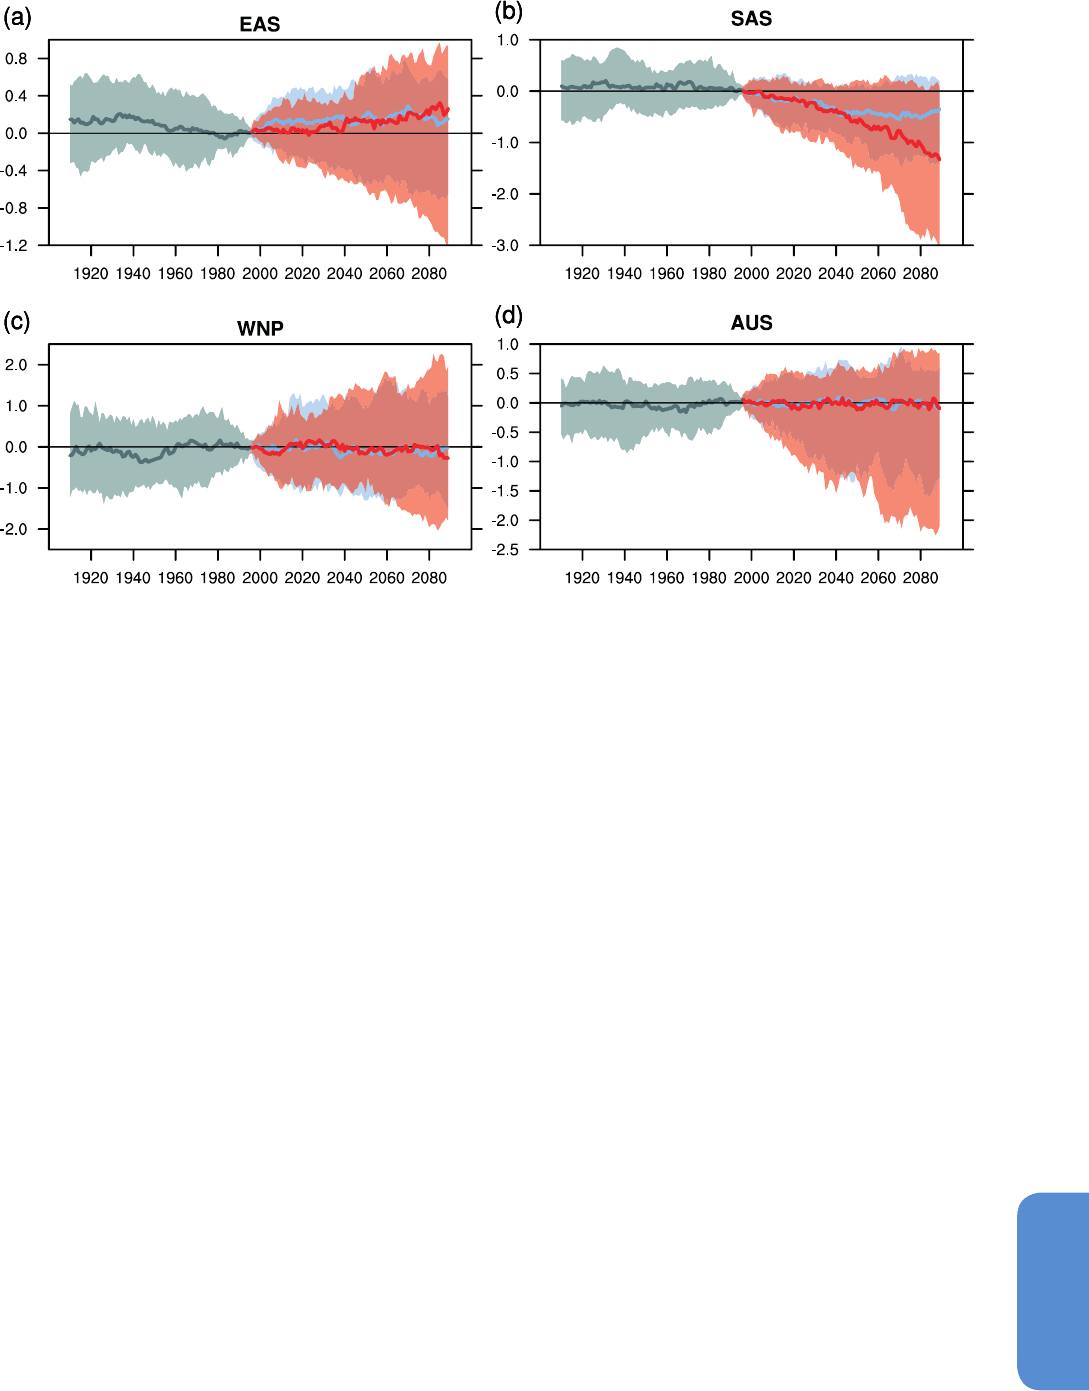
Western North Pacific (WNP) and Australian (AUS) summer monsoon
systems. The Indian monsoon circulation index is likely to decrease in
the 21st century, while a slight increase in the East Asian monsoon
circulation is projected. Scatter among models is large for the western
North Pacific and Australian monsoon circulation change.
Factors that limit the confidence in quantitative assessment of mon-
soon changes include sensitivity to model resolution (Cherchi and
Navarra, 2007; Klingaman et al., 2011), model biases (Levine and
1228
Chapter 14 Climate Phenomena and their Relevance for Future Regional Climate Change
14
Frequently Asked Questions
FAQ 14.1 | How is Climate Change Affecting Monsoons?
Monsoons are the most important mode of seasonal climate variation in the tropics, and are responsible for a large
fraction of the annual rainfall in many regions. Their strength and timing is related to atmospheric moisture con-
tent, land–sea temperature contrast, land cover and use, atmospheric aerosol loadings and other factors. Overall,
monsoonal rainfall is projected to become more intense in future, and to affect larger areas, because atmospheric
moisture content increases with temperature. However, the localized effects of climate change on regional mon-
soon strength and variability are complex and more uncertain.
Monsoon rains fall over all tropical continents: Asia, Australia, the Americas and Africa. The monsoon circulation is
driven by the difference in temperature between land and sea, which varies seasonally with the distribution of solar
heating. The duration and amount of rainfall depends on the moisture content of the air, and on the configuration
and strength of the atmospheric circulation. The regional distribution of land and ocean also plays a role, as does
topography. For example, the Tibetan Plateau—through variations in its snow cover and surface heating—modu-
lates the strength of the complex Asian monsoon systems. Where moist on-shore winds rise over mountains, as they
do in southwest India, monsoon rainfall is intensified. On the lee side of such mountains, it lessens.
Since the late 1970s, the East Asian summer monsoon has been weakening and not extending as far north as it used
to in earlier times , as a result of changes in the atmospheric circulation. That in turn has led to increasing drought
in northern China, but floods in the Yangtze River Valley farther south. In contrast, the Indo-Australian and West-
ern Pacific monsoon systems show no coherent trends since the mid-20th century, but are strongly modulated by
the El Niño-Southern Oscillation (ENSO). Similarly, changes observed in the South American monsoon system over
the last few decades are strongly related to ENSO variability. Evidence of trends in the North American monsoon
system is limited, but a tendency towards heavier rainfalls on the northern side of the main monsoon region has
been observed. No systematic long-term trends have been observed in the behaviour of the Indian or the African
monsoons.
The land surface warms more rapidly than the ocean surface, so that surface temperature contrast is increasing in
most regions. The tropical atmospheric overturning circulation, however, slows down on average as the climate
warms due to energy balance constraints in the tropical atmosphere. These changes in the atmospheric circulation
lead to regional changes in monsoon intensity, area and timing. There are a number of other effects as to how
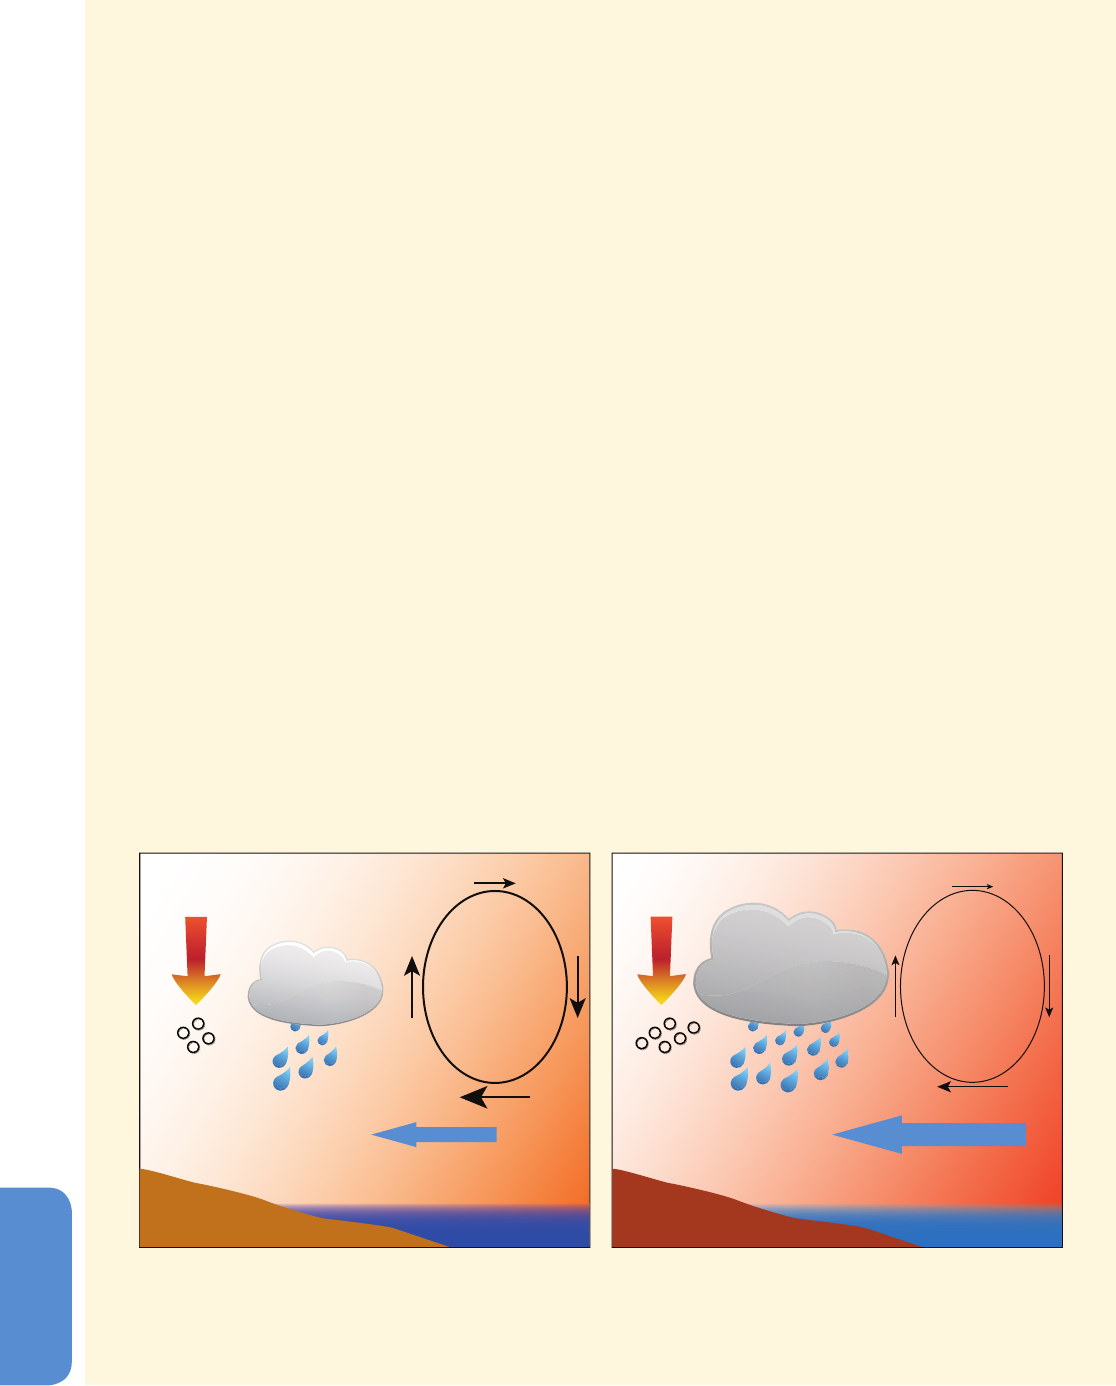
FAQ 14.1, Figure 1 | Schematic diagram illustrating the main ways that human activity influences monsoon rainfall. As the climate warms, increasing water vapour
transport from the ocean into land increases because warmer air contains more water vapour. This also increases the potential for heavy rainfalls. Warming-related
changes in large-scale circulation influence the strength and extent of the overall monsoon circulation. Land use change and atmospheric aerosol loading can also affect
the amount of solar radiation that is absorbed in the atmosphere and land, potentially moderating the land–sea temperature difference.
(a) present
solar radiation solar radiation
aerosols
changes
in aerosols
more rain
enhanced moisture moisture
weaker
circulation
land use land use
warm cool
(b) future
warmer warm
(continued on next page)
1229
Climate Phenomena and their Relevance for Future Regional Climate Change Chapter 14
14
FAQ 14.1 (continued)
climate change can influence monsoons. Surface heating varies with the intensity of solar radiation absorption,
which is itself affected by any land use changes that alter the reflectivity (albedo) of the land surface. Also, chang-
ing atmospheric aerosol loadings, such as air pollution, affect how much solar radiation reaches the ground, which
can change the monsoon circulation by altering summer solar heating of the land surface. Absorption of solar
radiation by aerosols, on the other hand, warms the atmosphere, changing the atmospheric heating distribution.
The strongest effect of climate change on the monsoons is the increase in atmospheric moisture associated with
warming of the atmosphere, resulting in an increase in total monsoon rainfall even if the strength of the monsoon
circulation weakens or does not change.
Climate model projections through the 21st century show an increase in total monsoon rainfall, largely due to
increasing atmospheric moisture content. The total surface area affected by the monsoons is projected to increase,
along with the general poleward expansion of the tropical regions. Climate models project from 5% to an approxi-
mately 15% increase of global monsoon rainfall depending on scenarios. Though total tropical monsoon rainfall
increases, some areas will receive less monsoon rainfall, due to weakening tropical wind circulations. Monsoon
onset dates are likely to be early or not to change much and the monsoon retreat dates are likely to delay, resulting
in lengthening of the monsoon season.
Future regional trends in monsoon intensity and timing remain uncertain in many parts of the world. Year-to-year
variations in the monsoons in many tropical regions are affected by ENSO. How ENSO will change in future—and
how its effects on monsoon will change—also remain uncertain. However, the projected overall increase in mon-
soon rainfall indicates a corresponding increase in the risk of extreme rain events in most regions.
Turner, 2012; Bollasina and Ming, 2013), poor skill in simulating the
Madden–Julian Oscillation (MJO; Section 9.1.3.3) and uncertainties in
projected ENSO changes (Collins et al., 2010; Section 14.4) and in the
representation of aerosol effects (Section 9.4.6).
14.2.2.1 Indian Monsoon
The Indian summer monsoon is known to have undergone abrupt
shifts in the past millennium, giving rise to prolonged and intense
droughts (Meehl and Hu, 2006; Sinha et al., 2011; see also Chapter
2). The observed recent weakening tendency in seasonal rainfall and
the regional re-distribution has been partially attributed to factors
such as changes in black carbon and/or sulphate aerosols (Chung and
Ramanathan, 2006; Lau et al., 2008; Bollasina et al., 2011), land use
(Niyogi et al., 2010; see also Chapter 10) and SSTs (Annamalai et al.,
2013). An increase in extreme rainfall events occurred at the expense
of weaker rainfall events (Goswami et al., 2006) over the central Indian
region, and in many other areas (Krishnamurthy et al., 2009). With a
declining number of monsoon depressions (Krishnamurthy and Ajay-
amohan, 2010), the upward trend in extreme rainfall events may be
due to enhanced moisture content (Goswami et al., 2006) or warmer
SSTs in the tropical Indian Ocean (Rajeevan et al., 2008).
CMIP3 projections show suppressed rainfall over the equatorial Indian
Ocean (Cai et al., 2011e; Turner and Annamalai, 2012), and an increase
in seasonal mean rainfall over India (Ueda et al., 2006; Annamalai
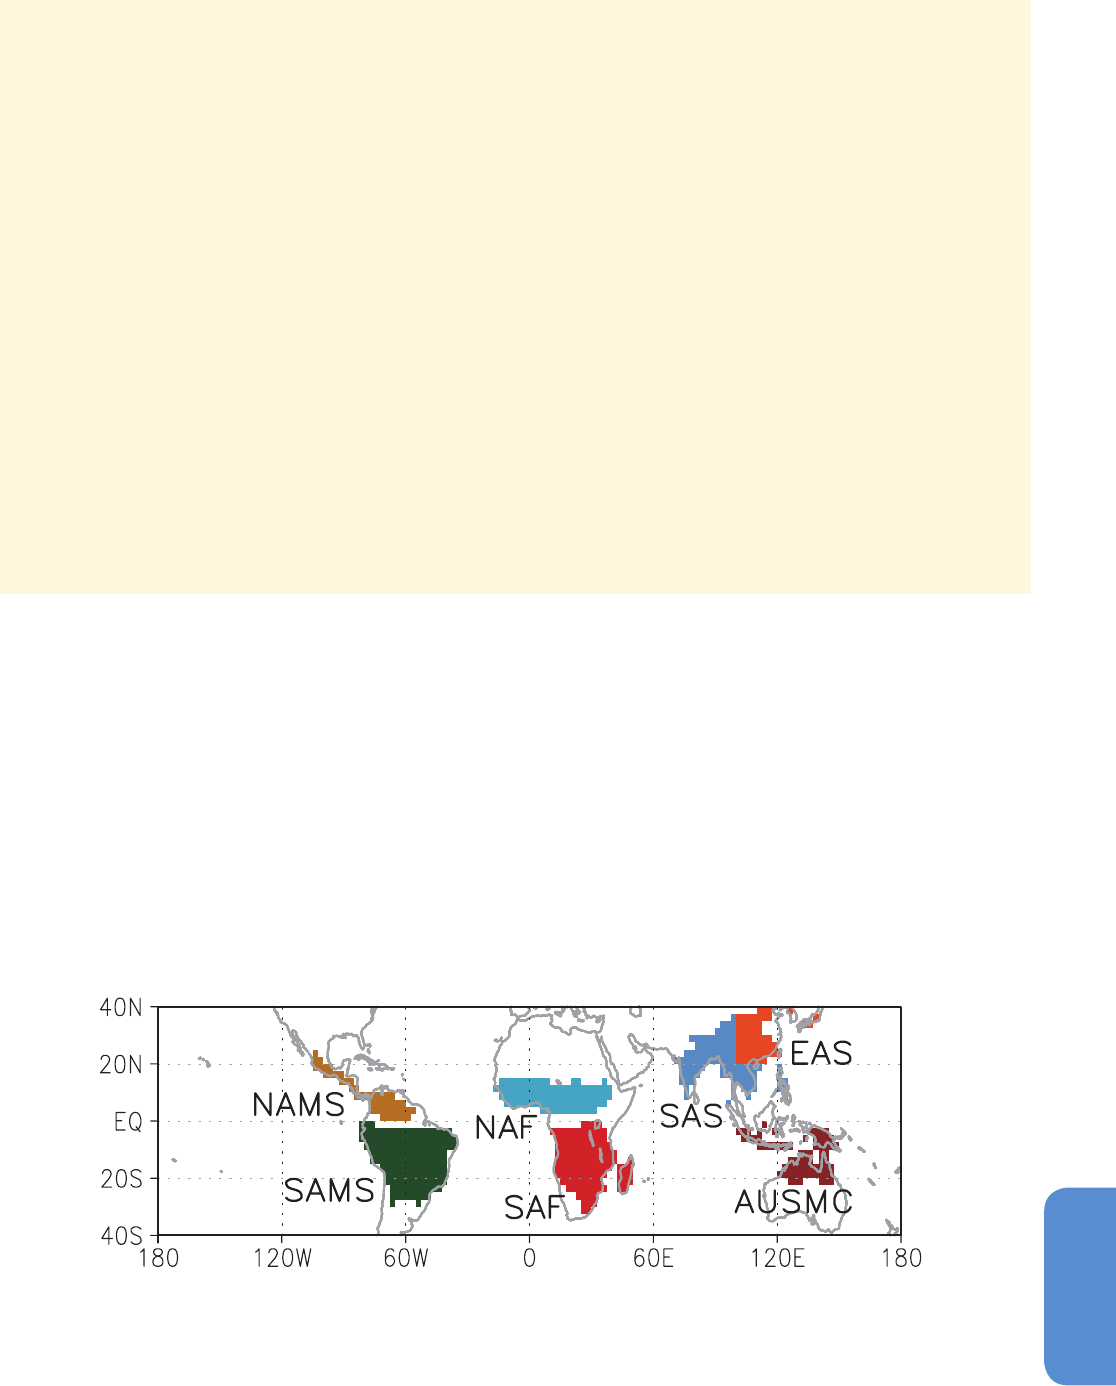
Figure 14.3 | Regional land monsoon domain based on 26 CMIP5 multi-model mean precipitation with a common 2.5° × 2.5° grid in the present-day (1986–2005). For regional
divisions, the equator separates the northern monsoon domains (North America Monsoon System (NAMS), North Africa (NAF), Southern Asia (SAS) and East Asian summer (EAS))
from the southern monsoon domains (South America Monsoon System (SAMS), South Africa (SAF), and Australian-Maritime Continent (AUSMC)), 60°E separates NAF from SAS,
and 20°N and 100°E separates SAS from EAS. All the regional domains are within 40°S to 40°N.
1230
Chapter 14 Climate Phenomena and their Relevance for Future Regional Climate Change
14
Figure 14.4 | Changes in precipitation indices over the regional land monsoon domains of (upper) East Asian summer (EAS), (middle) Southern Asia (SAS), and (lower) Australian-
Maritime Continent (AUSMC) based on CMIP5 multi-models. (Left) Time series of observed and model-simulated summer precipitation anomalies (%) relative to the present-day
average. All the time series are smoothed with a 20-year running mean. For the time series of simulations, all model averages are shown by thick lines for the historical (grey; 40
models), RCP2.6 (dark blue; 24 models), RCP4.5 (light blue; 34 models), RCP6.0 (orange; 20 models), and RCP8.5 scenarios (red; 32 models). Their intervals between 10th and
90th percentiles are shown by shading for RCP2.6 and RCP8.5 scenarios. For the time series of observations, Climate Research Unit (CRU) TS3.2 (update from Mitchell and Jones,
2005; dark blue), Global Precipitation Climatology Centre (GPCC) v6 (Becker et al., 2013; deep green), GPCC Variability Analysis of Surface Climate Observations (VASClimO; Beck
et al., 2005; light green), Highly Resolved Observational Data Integration Towards the Evaluation of Water Resources (APHRODITE) v1101 (Yatagai et al., 2012; only for EAS and
SAS regions; light blue), Global Precipitation Climatology Project (GPCP) v2.2 (updated from Huffman et al., 2009; black), and Climate Prediction Center (NOAA) Merged Analysis of
Precipitation (CMAP) v1201 (updated from Xie and Arkin, 1997; black with dots) are shown. GPCC v6 with dot line, GPCC VASClimO, GPCP v2.2 and CMAP v1201 are calculated
using all grids for the period of 1901–2010, 1951–2000, 1979–2010, 1979–2010, respectively. CRU TS3.2, GPCC v6 with solid line, and APHRODITE v1101, are calculated using
only grid boxes (2.5° in longitude/latitude) where at least one observation site exists for more than 80% of the period of 1921–2005, 1921–2005, and 1951–2005, respectively.
(Right) Projected changes for the future (2080-2099) relative to the present-day average in averaged precipitation (Pav), standard deviation of interannual variability in seasonal
average precipitation (Psd), simple precipitation daily intensity index (SDII), seasonal maximum 5-day precipitation total (R5d), seasonal maximum consecutive dry days (CDD),
monsoon onset date (ONS), retreat date (RET), and duration (DUR), under the RCP2.6 (18 models), RCP4.5 (24 models), RCP6.0 (14 models) and RCP8.5 scenarios (26 models).
Units are % in Pav, Psd, SDII, R5d, and CDD; days in ONS, RET, and DUR. Box-whisker plots show the 10th, 25th, 50th, 75th and 90th percentiles. All of the indices are calculated
for the summer season (May to September in the Northern Hemisphere; November to March in the Southern Hemisphere). The indices of Pav, Psd, SDII, R5d and CDD are calculated
for each model’s original grid, and then averaged over the monsoon domains determined by each model at the present day. The indices of ONS, RET and DUR are calculated based
on the criteria proposed by Wang and LinHo (2002) using regionally averaged climatological cycles of precipitation.
1231
Climate Phenomena and their Relevance for Future Regional Climate Change Chapter 14
14
Figure 14.5 | Time series of summer monsoon indices (21-year running mean) relative to the base period average (1986–2005). Historical (gray), RCP4.5 (light blue) and RCP8.5
(red) simulations by 39 CMIP5 model ensembles are shown in 10th and 90th (shading), and 50th (thick line) percentiles. (a) East Asian summer monsoon (defined as June, July and
August (JJA) sea level pressure difference between 160°E and 110°E from 10°N to 50°N), (b) Indian summer monsoon (defined as meridional differences of the JJA 850 hPa zonal
winds averaged over 5°N to 15°N, 40°E to 80°E and 20°N to 30°N, 60°E to 90°E), (c) western North Pacific summer monsoon (defined as meridional differences of the JJA 850
hPa zonal winds averaged over 5°N to 15°N, 100°E to 130°E and 20°N to 30°N, 110°E to 140°E), (d) Australian summer monsoon (defined as December, January and February
(DJF) 850 hPa zonal wind anomalies averaged over 10°S to 0°, 120°E to 150°E). (See Wang et al. (2004) and Zhou et al. (2009c) for indices definitions.)
et al., 2007; Turner et al., 2007a; Kumar et al., 2011b; Sabade et al.,
2011). These results are generally confirmed by CMIP5 projections
(Chaturvedi et al., 2012). The projected changes in Indian monsoon
rainfall increase with the anthropogenic forcing among RCPs (May,
2011; see Figure 14.4; SAS).
In a suite of models that realistically simulate ENSO–monsoon rela-
tionships, normal monsoon years are likely to become less frequent
in the future, but there is no clear consensus about the occurrence of
extrememonsoon years (Turner and Annamalai, 2012). CMIP3 models
indicate ENSO–monsoon relationships to persist in the future (Kumar
et al., 2011b), but there is low confidence in the projection of ENSO
variability (Section 14.4). Sub-seasonal scale monsoon variability is
linked to the MJO but again the confidence in the future projection of
MJO remains low (Section 14.3.2).
CMIP5 models project an increase in mean precipitation as well as
its interannual variability and extremes (Figure 14.4; SAS). All models
project an increase in heavy precipitation events but disagree on CDD
changes. Regarding seasonality, model agreement is high on an earlier
onset and later retreat, and hence longer duration. The monsoon cir-
culation weakens in the future (Figure 14.5; IND) but the precipitation
increases. Like the global monsoon (Section 14.2.1), the precipitation
increase is largely due to the increased moisture flux from ocean to
land.
14.2.2.2 East Asian Monsoon
The East Asian monsoon is characterized by a wet season and
southerly flow in summer and by dry cold northerly flow in winter.
The East Asian summer (EAS) monsoon circulation has experienced
an inter-decadal weakening from the 1960s to the 1980s (Hori et
al., 2007; Li et al., 2010a), associated with deficient rainfall in North
China and excessive rainfall in central East China along 30°N (Hu,
1997; Wang, 2001; Gong and Ho, 2002; Yu et al., 2004). The summer
monsoon circulation has begun to recover in recent decades (Liu et
al., 2012a; Zhu et al., 2012). The summer rainfall amount over East
Asia shows no clear trend during the 20th century (Zhang and Zhou,
2011), although significant trends may be found in local station
records (Wang et al., 2006). The winter monsoon circulation weakened
significantly after the 1980s (Wang et al., 2009a; Wang and Chen,
2010). See Supplementary Material Sections 14.SM.1.3 to 14.SM.1.7
for additional discussions of natural variability.
CMIP3 models show reasonable skill in simulating large-scale circula-
tion of the EAS monsoon (Boo et al., 2011), but their performance is
poor in reproducing the monsoon rainband (Lin et al., 2008a; Li and
Zhou, 2011). Only a few CMIP3 models reproduce the Baiu rainband
(Ninomiya, 2012) and high-resolution models (Kitoh and Kusunoki,
2008) show better performance than low resolution CMIP3 type
models in simulating the monsoon rainband (Kitoh and Kusunoki,

1232
Chapter 14 Climate Phenomena and their Relevance for Future Regional Climate Change
14
2008). CMIP3 models show large uncertainties in projections of mon-
soon precipitation and circulation (Ding et al., 2007; Kripalani et al.,
2007a) but the simulation of interannual variability of the EAS mon-
soon circulation has improved from CMIP3 to CMIP5 (Sperber et al.,
2012). Climate change may bring a change in the position of the mon-
soon rain band (Li et al., 2010a).
CMIP5 projections indicate a likely increase in both the circulation
(Figure 14.5) and rainfall of the EAS monsoon (Figure 14.4) throughout
the 21st century. This is different from other Asian-Australian mon-
soon subsystems, where the increase in precipitation (Figure 14.4)
is generally associated with weakening monsoon circulation (Figure
14.5). Interannual variability of seasonal mean rainfall is very likely to
increase except for RCP2.6 (Figure 14.4). Heavy precipitation events
(SDII and R5d) are also very likely to increase. CMIP5 models project
an earlier monsoon onset and longer duration but the spread among
models is large (Figure 14.4).
14.2.2.3 Maritime Continent Monsoon
Interaction between land and water characterizes the Maritime Con-
tinent region located between the Asian continent and Australia. It
provides a land bridge along which maximum convection marches
from the Asian summer monsoon regime (generally peaking in June,
July and August) to the Australian summer monsoon system (generally
peaking in December, January and February).
Phenomena such as the MJO (Tangang et al., 2008; Section 14.3.2;
Hidayat and Kizu, 2010; Salahuddin and Curtis, 2011), and ENSO (Aldri-
an and Djamil, 2008; Moron et al., 2010; Section 14.4) influence Mari-
time Continent Monsoon variability. Rainfall extremes in the Maritime
Continent are strongly influenced by diurnal rainfall variability (Qian,
2008; Qian et al., 2010a; Robertson et al., 2011; Ward et al., 2011) as
well as the MJO. There have been no obvious trends in extreme rainfall
indices in Indonesia, except evidence of a decrease in some areas in
annual rainfall and an increase in the ratio of the wet to dry season
rainfall (Aldrian and Djamil, 2008).
Modelling the Maritime Continent monsoon is a challenge because
of the coarse resolution of contemporary large-scale coupled climate
models (Aldrian and Djamil, 2008; Qian, 2008). Most CMIP3 models
tend to simulate increasing precipitation in the tropical central Pacific
but declining trends over the Maritime Continent for June to August
(Ose and Arakawa, 2011), consistent with a decreasing zonal SST gra-
dient across the equatorial Pacific and a weakening Walker Circulation
(Collins et al., 2010). Projections of CMIP5 models are consistent with
those of CMIP3 models, with decreasing precipitation during boreal
summer and increasing precipitation during boreal winter, but model
agreement is not high (Figures AI.66-67; Figure 12.22, but see also
Figure 14.27).
14.2.2.4 Australian Monsoon
Some indices of the Australian summer monsoon (Wang et al., 2004; Li
et al., 2012a) show a clear post-1980 reduction, but another index by
Kajikawa et al. (2010) does not fully exhibit this change. Over north-
west Australia, summer rainfall has increased by more than 50% (Rot-
stayn et al., 2007; Shi et al., 2008b; Smith et al., 2008), whereas over
northeast Australia, summer rainfall has decreased markedly since
around 1980 (Li et al., 2012a).
Models in general show skill in representing the gross spatial char-
acteristics of Australian monsoon summer precipitation (Moise et al.,
2005). Further, atmospheric General Circulation Models (GCMs) forced
by SST anomalies can skilfully reproduce monsoon-related zonal wind
variability over recent decades (Zhou et al., 2009a). Recent analysis of
the skill of a suite of CMIP3 models showed a good representation in
the ensemble mean, but a very large range of biases across individu-
al models (more than a factor of 6; Colman et al., 2011). Most CMIP
models have biases in monsoon seasonality, but CMIP5 models gener-
ally perform better than CMIP3 (Jourdain et al., 2013).
In climate change projections, overall changes in tropical Australian
rainfall are small, with substantial uncertainties (Figure 14.4; Moise et
al., 2012; see also Figure 14.27). Using a group of CMIP5 models that
exhibit a realistic present-day climatology, most projections using the
RCP8.5 scenario produced 5% to 20% more monsoon rainfall by the
late 21st century compared to the pre-industrial period (Jourdain et
al., 2013). Most CMIP3 model projections suggest delayed monsoon
onset and reduced monsoon duration over northern Australia. Weaker
model agreement is seen over the interior of the Australian continent,
where ensembles show an approximate 7-day delay of both the onset
and retreat with little change in duration (Zhang et al., 2013a). CMIP5
model agreement in changes of monsoon precipitation seasonality is
low (Figure 14.4).
14.2.2.5 Western North Pacific Monsoon
The western North Pacific summer monsoon (WNPSM) occupies a
broad oceanic region of the South China and Philippine Seas, featuring
a monsoon trough and a subtropical anticyclonic ridge to the north
(Zhang and Wang, 2008).
The western North Pacific monsoon does not show any trend during
1950–1999. Since the late 1970s, the correlation has strengthened
between interannual variability in the western North Pacific monsoon
and ENSO (Section 14.4), a change mediated by Indian Ocean SST
(Huang et al., 2010; Xie et al., 2010a). This occurred despite a weaken-
ing of the Indian monsoon–ENSO correlation in this period (Wang et
al., 2008a).
CMIP5 models project little change in western North Pacific monsoon
circulation (Figure 14.5) but enhanced precipitation (Figures AI.66-67;
Figure 12.22; but see also Figure 14.24) due to increased moisture con-
vergence (Chapter 12).
14.2.3 American Monsoons
The American monsoons, the North America Monsoon System (NAMS)
and the SouthAmerica Monsoon System (SAMS), are associated with
large inter-seasonal differences in precipitation, humidity and atmos-
pheric circulation (Vera et al., 2006; Marengo et al., 2010a). NAMS
and SAMS indices areoften, though not always, defined in terms of
precipitation characteristics (Wang and LinHo, 2002).
1233
Climate Phenomena and their Relevance for Future Regional Climate Change Chapter 14
14
14.2.3.1 North America Monsoon System
The warm season precipitation in northern Mexico and the southwest-
ern USA is strongly influenced by the NAMS. It has been difficult to
simulate many important NAMS-related phenomenon in global cli-
mate models (Castro et al., 2007; Lin et al., 2008b; Cerezo-Mota et al.,
2011), though the models capture gross-scale features associated with
the NAMSseasonal cycle (Liang et al., 2008b; Gutzler, 2009). See Sup-
plementary Material Section 14.SM.1.8 for a more detailed discussion
of NAMS dynamics.
In the NAMS core region, no distinct precipitation trends have been
seen over the last half of the 20th century (Anderson et al., 2010;
Arriaga-Ramirez and Cavazos, 2010), due to countervailing trends in
increasing intensity and decreasing frequency of events, as well as
the decreasing length of the monsoon season itself (Englehart and
Douglas, 2006). However, monsoonal stream flow in western Mexico
has been decreasing, possibly as a result of changing precipitation
characteristics or antecedent hydrological conditions rather than over-
all precipitation amounts (Gochis et al., 2007). There has also been
a systematic delay in monsoon onset, peak and termination (Grantz
et al., 2007) as well as an increase in extreme precipitation events
associated with land-falling hurricanes (Cavazos et al., 2008). Finally,
positive trends in NAMS precipitation amounts have been detected
in the northern fringes of the core area, that is, Arizona and western
NewMexico (Anderson et al., 2010), consistent with northward NAMS
expansion during relatively warm periods in the Holocene (Petersen,
Figure 14.6 | As in Figure 14.4, except for (upper) North America Monsoon System (NAMS) and (lower) South America Monsoon System (SAMS).
1994; Mock and Brunelle-Daines, 1999; Harrison et al., 2003; Poore et
al., 2005; Metcalfe et al., 2010).
Over the coming century, CMIP5 simulations generally project a precip-
itation reduction in the core zone of the monsoon (Figures AI.27 and
Figure 14.6), but this signal is not particularly consistent across models,
even under the RCP8.5 scenario (Cook and Seager, 2013). Thus con-
fidence in projections of monsoon precipitation changes is currently
low. CMIP5 models have no consensus on future changes ofmonsoon
timing (Figure 14.6). Temperature increases are consistently project-
ed in all models (Annex I). This will likely increase the frequency of
extreme summer temperatures (Diffenbaugh and Ashfaq, 2010; Ander-
son, 2011; Duffy and Tebaldi, 2012), together with projected increase
in consecutive dry days (Figure 14.6).
14.2.3.2 South America Monsoon System
The SAMS mainly influences precipitation in the South American trop-
ics and subtropics (Figure 14.1). The main characteristics of SAMS
onset are increased humidity flux from the Atlantic Ocean over north-
ern South America, an eastward shift of the subtropical high, strong
northwesterly moisture flux east of the tropical Andes, and establish-
ment of the Bolivian High (Raia and Cavalcanti, 2008; Marengo et al.,
2010a; Silva and Kousky, 2012). Recent SAMS indices have been cal-
culated based on different variables, such as a large scale index (Silva
and Carvalho, 2007), moisture flux (Raia and Cavalcanti, 2008), and
wind (Gan et al., 2006), in addition to precipitation (Nieto-Ferreira and

1234
Chapter 14 Climate Phenomena and their Relevance for Future Regional Climate Change
14
Rickenbach, 2010; Seth et al., 2010; Kitoh et al., 2013). As seen below,
conclusions regarding SAMS changes can depend on the index chosen.
SAMS duration and amplitude obtained from the observed large-scale
index have both increased in the last 32 years (Jones and Carvalho,
2013). Increase of extreme precipitation and consecutive dry days have
been observed in the SAMS region from 1969 to 2009 (Skansi et al.,
2013). The overall annual cycle of precipitation in the SAMS region,
including SAMS onset and demise, is generally well represented by
models (Bombardi and Carvalho, 2009; Seth et al., 2010; Kitoh et al.,
2013). Extreme precipitation indices in SAMS region are also well sim-
ulated by CMIP5 models (Kitoh et al., 2013). CMIP5 models subjected
to historical forcing show increases in SAMS amplitude, earlier onset
and later demise during the 1951–2005 period (Jones and Carvalho,
2013). Using a precipitation based index, precipitation increases in
austral summer but decreases in austral spring, indicating delayed
SAMS onset in the CMIP3 projections (Seth et al., 2011). CMIP5 projec-
tions based on the global precipitation index (Section 14.2.1) consist-
ently show small precipitation increases and little change in onset and
retreat (Kitoh et al., 2013; Figure 14.6). On the other hand, when using
a different index, earlier onsets and later demises and thus, longer
duration of the SAMS by the end of the 21st century (2081–2100) has
been found (Jones and Carvalho, 2013). Thus there is medium con-
fidence that SAMS overall precipitation will remain unchanged. The
different estimates of changes in timing underscores potential uncer-
tainties related to SAMS timing due todifferences in SAMS indices. The
models do show significant and robust increases in extreme precipi-
tation indices in the SAMS region, such as seasonal maximum 5-day
precipitation total and number of consecutive dry days (Figure 14.6),
leading to medium confidence in projections of these characteristics.
14.2.4 African Monsoon
In Africa, monsoon circulation affects precipitation in West Africa
where notable upper air flow reversals are observed. East and south
African precipitation is generally described by variations in the tropi-
cal convergence zone rather than as a monsoon feature. This section
covers the West African monsoon, and Section 14.8.7 also covers the
latter two regions.
The West African monsoon develops during northern spring and
summer, with a rapid northward jump of the rainfall belt from along
the Gulf of Guinea at 5°N in May to June to the Sahel at 10°N in July
to August. Factors influencing the West African monsoon include inter-
annual to decadal variations, land processes and the direct response to
radiative forcing. Cross-equatorial tropical Atlantic SST patterns influ-
ence the monsoon flow and moistening of the boundary layer, so that
a colder northern tropical Atlantic induces negative rainfall anomalies
(Biasutti et al., 2008; Giannini et al., 2008; Xue et al., 2010; Rowell,
2011).
In CMIP3 simulations, rainfall is projected to decrease in the early part
but increase towards the end of the rainy season, implying a small
delay in the monsoon season and an intensification of late-season rains
(Biasutti and Sobel, 2009; Biasutti et al., 2009; Seth et al., 2010). CMIP5
models, on the other hand, simulate the variability of tropical Atlantic
SST patterns with little credibility (Section 9.4.2.5.2) and model resolu-
tion is known to limit the ability to capture the mesoscale ‘squall line’
systems that form a central element in the maintenance of the rainy
season (Ruti and Dell’Aquila, 2010; see also Section 14.8.7). Therefore,
projections of the West African monsoon rainfall appear to be uncer-
tain, reflected by considerable model deficiencies and spread in the
projections (Figure 14.7). Note that this figure is based on a somewhat
eastward extended area for the West African monsoon (NAF in Figure
14.3), seen as a component of the global monsoon system (Section
14.2.1). The limitations of model simulations in the region arising from
the lack of convective organization (Kohler et al., 2010) leading to the
underestimation of interannual variability (Scaife et al., 2009) imply
that confidence in projections of the African monsoon is low.
The limited information that could be deduced from CMIP3 has not
improved much in CMIP5. Figure 14.7 largely confirms the findings
based on CMIP3. The CMIP5 model ensemble projects a modest
change in the onset date (depending on the scenario) and a small
delay in the retreat date, leading to a small increase in the duration
of the rainy season. The delay in the monsoon retreat is larger in the
high-end emission scenarios. The interannual variance and the 5-day
rain intensity show a robust increase, while a small increase in dry day
periods is less significant.
14.2.5 Assessment Summary
It is projected that global monsoon precipitation will likely strengthen
in the 21st century with increase in its area and intensity while the
monsoon circulation weakens. Precipitation extremes including pre-
cipitation intensity and consecutive dry days are likely to increase at
higher rates than those of mean precipitation. Overall, CMIP5 models
project that the monsoon onset will be earlier or not change much
and the monsoon retreat dates will delay, resulting in a lengthening
of the monsoon season. Such features are likely to occur in most of
Asian-Australian Monsoon regions.
There is medium confidence that overall precipitation associated with
the Asian-Australian monsoon will increase but with a north-south
asymmetry: Indian and East Asian monsoon precipitation is projected
to increase, while projected changes in Australian summer monsoon
precipitation are small. There is medium confidence that the Indian
summer monsoon circulation will weaken, but this is compensated by
increased atmospheric moisture content, leading to more precipita-
tion. For the East Asian summer monsoon, both monsoon circulation
and precipitation are projected to increase. There is low confidence
that over the Maritime Continent boreal summer rainfall will decrease
and boreal winter rainfall will increase. There is low confidence that
changes in the tropical Australian monsoon rainfall are small. There
is low confidence that Western North Pacific summer monsoon circu-
lation changes are small, but with increased rainfall due to enhanced
moisture. There is medium confidence in an increase of Indian summer
monsoon rainfall and its extremes throughout the 21st century under
all RCP scenarios. Their percentage change ratios are the largest and
model agreement is highest among all monsoon regions.
There is low confidence in projections of American monsoon precipi-
tationchanges but there is high confidence in increases of precipita-
tion extremes, of wet days and consecutive dry days. There is medium
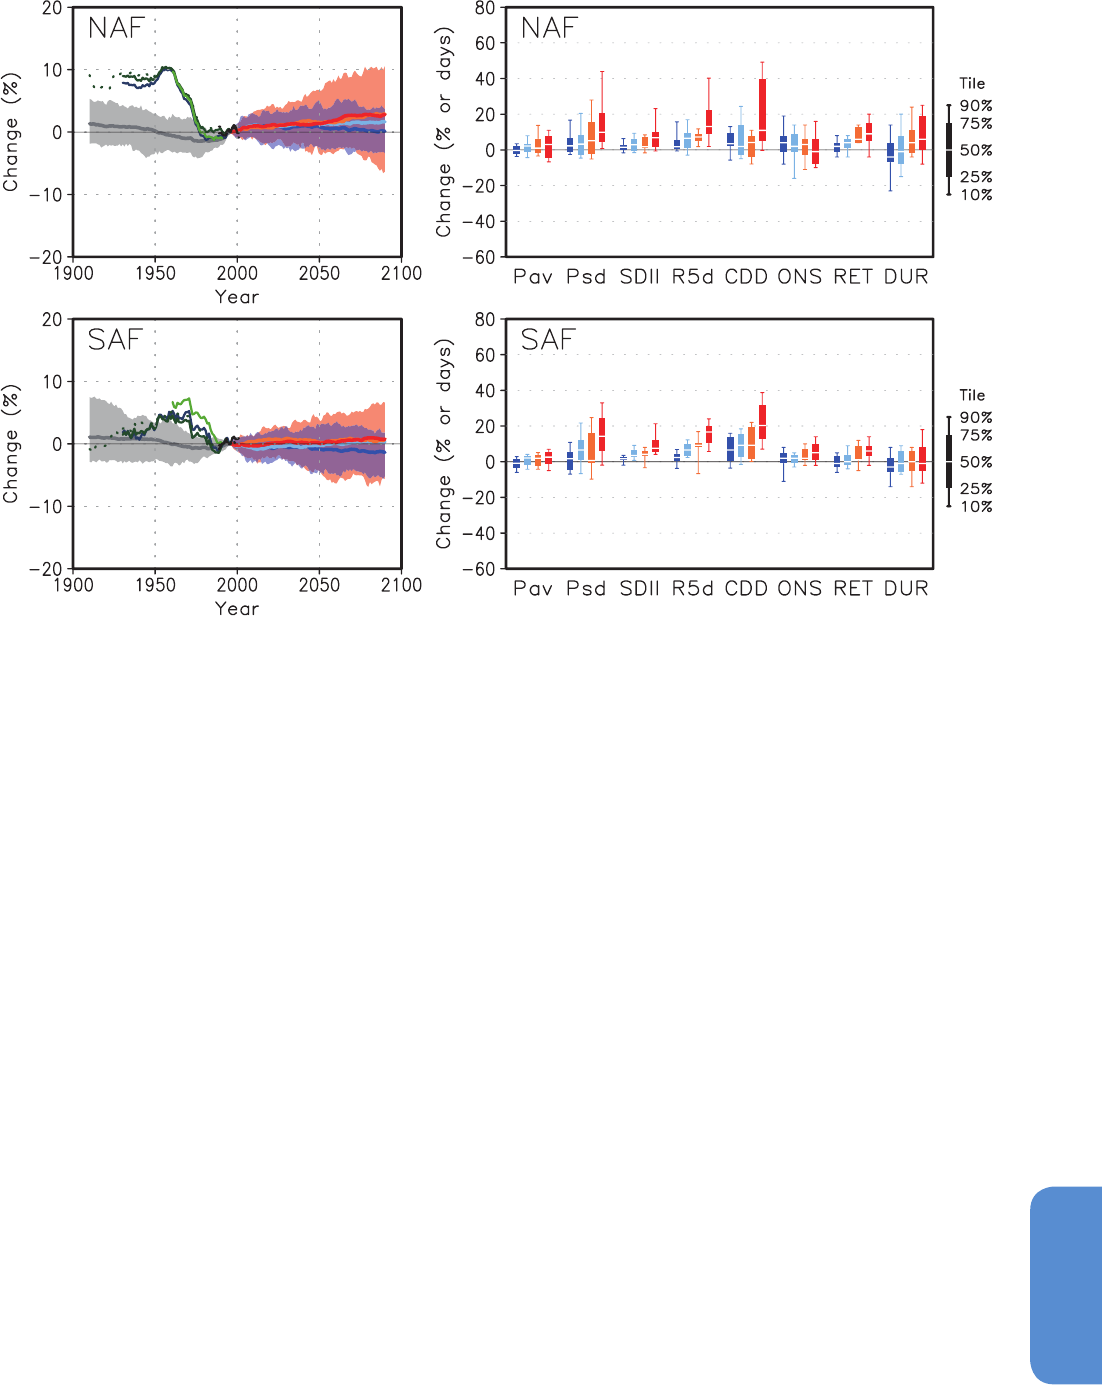
1235
Climate Phenomena and their Relevance for Future Regional Climate Change Chapter 14
14
Figure 14.7 | As in Figure 14.4, except for (upper) North Africa (NAF) and (lower) South Africa (SAF).
confidence in precipitation associated with the NAMSwill arrive later
in the annual cycle, and persist longer. Projections of changes in the
timing and duration of the SAMS remain uncertain. There is high confi-
dence in the expansion of SAMS, resulting from increased temperature
and humidity.
Based on how models represent known drivers of the West African
monsoon, there is low confidence in projections of its future develop-
ment based on CMIP5. Confidence is low in projections of a small delay
in the onset of the West African rainy season with an intensification of
late-season rains.
14.3 Tropical Phenomena
14.3.1 Convergence Zones
Section 7.6 presents a radiative perspective of changes in convection
(including the differences between GHG and aerosol forcings), and Sec-
tion 12.4.5.2 discusses patterns of precipitation change on the global
scale. The emphasis here is on regional aspects of tropical changes.
Tropical convection over the oceans, averaged for a month or longer,
is organized into long and narrow convergence zones, often anchored
by SST structures. Latent heat release in convection drives atmospher-
ic circulation and affects global climate. In model experiments where
spatially uniform SST warming is imposed, precipitation increases in
these tropical convergence zones (Xie et al., 2010b), following the
‘wet-get-wetter’ paradigm (Held and Soden, 2006). On the flanks of
a convergence zone, rainfall may decrease because of the increased
horizontal gradient in specific humidity and the resultant increase in
dry advection into the convergence zone (Neelin et al., 2003).
Although these arguments based on moist atmospheric dynamics call
for changes in tropical convection to be organized around the clima-
tological rain band, studies since AR4 show that such changes in a
warmer climate also depend on the spatial pattern of SST warming.
As a result of the SST pattern effect, rainfall change does not generally
project onto the climatological convergence zones, especially for the
annual mean. In CMIP3/5 model projections, annual rainfall change
over tropical oceans follows a ‘warmer-get-wetter’ pattern, increas-
ing where the SST warming exceeds the tropical mean and vice versa
(Figure 14.8, Xie et al., 2010b; Sobel and Camargo, 2011; Chadwick et
al., 2013). Differences among models in the SST warming pattern are
an important source of uncertainty in rainfall projections, accounting
for a third of inter-model variability in annual precipitation change in
the tropics (Ma and Xie, 2013).
Figure 14.8 presents selected indices for several robust patterns of SST
warming for RCP8.5. They include greater warming in the NH than in
the Southern Hemisphere (SH), a pattern favouring rainfall increase at
locations north of the equator and decreases to the south (Friedman et
al., 2013); enhanced equatorial warming (Liu et al., 2005) that anchors
a pronounced rainfall increase in the equatorial Pacific; reduced warm-
ing in the subtropical Southeast Pacific that weakens convection there;
decreased zonal SST gradient across the equatorial Pacific (see Sec-
tion 14.4) and increased westward SST gradient across the equatorial
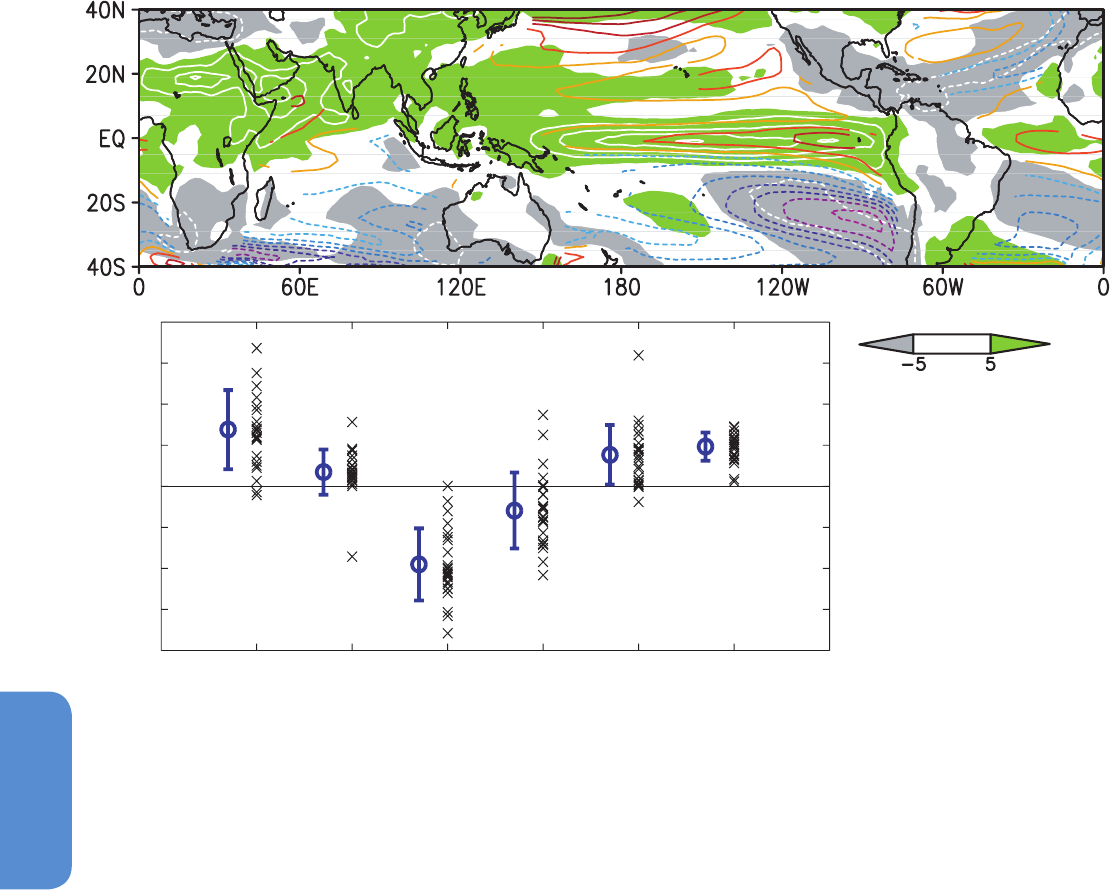
1236
Chapter 14 Climate Phenomena and their Relevance for Future Regional Climate Change
14
Indian Ocean (see Section 14.3.3) that together contribute to the
weakened Walker cells.
Changes in tropical convection affect the pattern of SST change
(Chou et al., 2005) and such atmospheric and oceanic perturbations
are inherently coupled. The SST pattern effect dominates the annual
rainfall change while the wet-get-wetter effect becomes important for
seasonal mean rainfall in the summer hemisphere (Huang et al., 2013).
This is equivalent to an increase in the annual range of precipitation
in a warmer climate (Chou et al., 2013). Given uncertainties in SST
warming pattern, the confidence is generally higher for seasonal than
annual mean changes in tropical rainfall.
14.3.1.1 Inter-Tropical Convergence Zone
The Inter-Tropical Convergence Zone (ITCZ) is a zonal band of persis-
tent low-level convergence, atmospheric convection, and heavy rainfall.
Over the Atlantic and eastern half of the Pacific, the ITCZ is displaced
north of the equator due to ocean–atmosphere interaction (Xie et al.,
NH−SH EQ SE PAC IO r(T,Precip)
−2
−1.5
−1
−0.5
0
0.5
1
1.5
2
Zonal
PAC
PAC
Zonal
Temperature ( C)
o
(%)
Figure 14.8 | (Upper panel) Annual mean precipitation percentage change (dP/P in green/gray shade and white contours at 20% intervals), and relative SST change (colour
contours at intervals of 0.2°C; negative dashed) to the tropical (20°S to 20°N) mean warming in RCP8.5 projections, shown as 23 CMIP5 model ensemble mean. (Lower panel) Sea
surface temperature (SST) warming pattern indices in the 23-model RCP8.5 ensemble, shown as the 2081–2100 minus 1986–2005 difference. From left: Northern (EQ to 60°N)
minus Southern (60°S to EQ) Hemisphere; equatorial (120°E to 60°W, 5°S to 5°N) and Southeast (130°W to 70°W, 30°S to 15°S) Pacific relative to the tropical mean warming;
zonal SST gradient in the equatorial Pacific (120°E to 180°E minus 150°W to 90°W, 5°S to 5°N) and Indian (50°E to 70°E, 10°S to 10°N minus 90°E to 110°S, 10°S to EQ) Oceans.
(Rightmost) Spatial correlation (r) between relative SST change and precipitation percentage change (dP/P) in the tropics (20°S to 20°N) in each model. (The spatial correlation for
the multi-model ensemble mean fields in the upper panel is 0.63). The circle and error bar indicate the ensemble mean and ±1 standard deviation, respectively. The upper panel is
a CMIP5 update of Ma and Xie (2013), and see text for indices in the lower panel.
2007) and extratropical influences (Kang et al., 2008; Fučkar et al.,
2013). Many models show an unrealistic double-ITCZ pattern over the
tropical Pacific and Atlantic, with excessive rainfall south of the equa-
tor (Section 9.4.2.5.1). This bias needs to be kept in mind in assessing
ITCZ changes in model projections, especially for boreal spring when
the model biases are largest.
The global zonal mean ITCZ migrates back and forth across the equator
following the sun. In CMIP5, seasonal mean rainfall is projected to
increase on the equatorward flank of the ITCZ (Figure 14.9). The co-mi-
gration of rainfall increase with the ITCZ is due to the wet-get-wetter
effect while the equatorward displacement is due to the SST pattern
effect (Huang et al., 2013).
14.3.1.2 South Pacific Convergence Zone
The South Pacific Convergence Zone (SPCZ, Widlansky et al., 2011)
extends southeastward from the tropical western Pacific to French Pol-
ynesia and the SH mid-latitudes, contributing most of the yearly rainfall
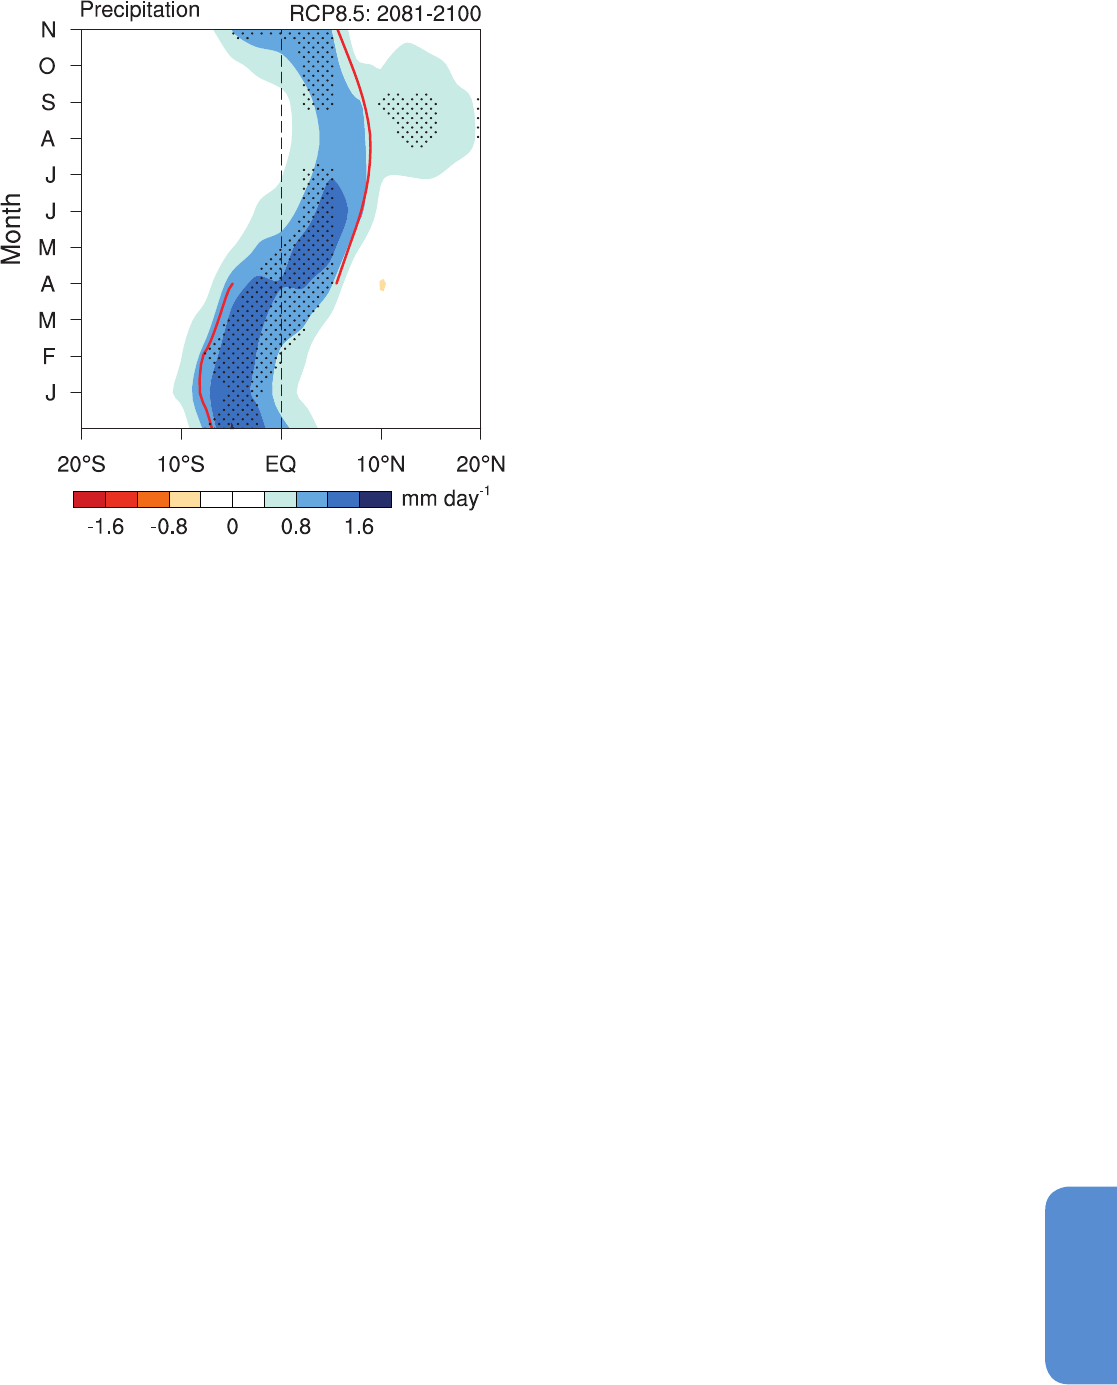
1237
Climate Phenomena and their Relevance for Future Regional Climate Change Chapter 14
14
to the many South Pacific island nations under its influence. The SPCZ
is most pronounced during austral summer (December, January and
February (DJF)).
Zonal and meridional SST gradients, trade wind strength, and sub-
sidence over the eastern Pacific are important mechanisms for SPCZ
orientation and variability (Takahashi and Battisti, 2007; Lintner and
Neelin, 2008; Vincent et al., 2011; Widlansky et al., 2011). Many GCMs
simulate the SPCZ as lying east–west, giving a ‘double-ITCZ’ structure
and missing the southeastward orientation (Brown et al., 2012a).
The majority of CMIP models simulate increased austral summer mean
precipitation in the SPCZ, with decreased precipitation at the eastern
edge of the SPCZ (Brown et al., 2012a; Brown et al., 2012b). The posi-
tion of the SPCZ varies on interannual to decadal time scales, shifting
northeast in response to El Niño (Folland et al., 2002; Vincent et al.,
2011). Strong El Niño events induce a zonally oriented SPCZ locat-
ed well northeast of its average position, while more moderate ENSO
(Section 14.4) events are associated with movement of the SPCZ to the
northeast or southwest, without a change in its orientation.
Models from both CMIP3 and CMIP5 that simulate the SPCZ well show
a consistent tendency towards much more frequent zonally oriented
SPCZ events in future (Cai et al., 2012b). The mechanism appears to be
associated with a reduction in near-equatorial meridional SST gradient,
a robust feature of modelled SST response to anthropogenic forcing
(Widlansky et al., 2013). An increased frequency of zonally oriented
Figure 14.9 | Seasonal cycle of zonal mean tropical precipitation change (2081–2100
in RCP8.5 minus 1986–2005) in CMIP5 multi-model ensemble (MME) mean. Eighteen
CMIP5 models were used. Stippling indicates that more than 90% models agree on the
sign of MME change. The red curve represents the meridional maximum of the climato-
logical rainfall. (Adapted from Huang et al., 2013.)
( )
SPCZ events would have major implications for regional climate, possi-
bly leading to longer dry spells in the southwest Pacific.
14.3.1.3 South Atlantic Convergence Zone
The South Atlantic Convergence Zone (SACZ) extends from the Amazon
region through southeastern Brazil towards the Atlantic Ocean during
austral summer (Cunningham and Cavalcanti, 2006; Carvalho et al.,
2011; de Oliveira Vieira et al., 2013). Floods or dry conditions in south-
eastern Brazil are often related to SACZ variability (Muza et al., 2009;
Lima et al., 2010; Vasconcellos and Cavalcanti, 2010). A subset of CMIP
models simulate the SACZ (Vera and Silvestri, 2009; Seth et al., 2010;
Yin et al., 2012) and its variability as a dipolar structure (Junquas et al.,
2012; Cavalcanti and Shimizu, 2012).
A southward displacement of SACZ and intensification of the southern
centre of the precipitation dipole are suggested in projections of CMIP3
and CMIP5 models (Seth et al., 2010; Junquas et al., 2012; Cavalcanti
and Shimizu, 2012). This displacement is consistent with the increased
precipitation over southeastern South America, south of 25°S, project-
ed for the second half of the 21st century, in CMIP3, CMIP5 and region-
al models (Figure AI.34, Figure 14.21). It is also consistent with the
southward displacement of the Atlantic subtropical high (Seth et al.,
2010) related to the southward expansion of the Hadley Cell (Lu et al.,
2007). Pacific SST warming and the strengthening of the Pacific–South
American (PSA)-like wave train (Section 14.6.2) are potential mech-
anisms for changes in the dipolar pattern resulting in SACZ change
(Junquas et al., 2012). This change is also supported by the intensifica-
tion and increased frequency of the low level jet over South America in
future projections (Soares and Marengo, 2009; Seth et al., 2010).
14.3.2 Madden–Julian Oscillation
The MJO is the dominant mode of tropical intraseasonal (20 to 100
days) variability (Zhang, 2005). The MJO modulates tropical cyclone
activity (Frank and Roundy, 2006), contributes to intraseasonal fluctu-
ations of the monsoons (Maloney and Shaman, 2008), and excites tel-
econnection patterns outside the tropics (L’Heureux and Higgins, 2008;
Lin et al., 2009). Simulation of the MJO by GCMs remains challenging,
but with some improvements made in recent years (Section 9.5.2.3).
Possible changes in the MJO in a future warmer climate have just
begun to be explored with models that simulate the phenomenon. In
the Max Planck Institute Earth System Model, MJO variance increas-
es appreciably with increasing warming (Schubert et al., 2013). The
change in MJO variance is highly sensitive to the spatial pattern of SST
warming (Maloney and Xie, 2013). In light of the low skill in simulating
MJO, and its sensitive to SST warming pattern, which in itself is subject
to large uncertainties, it is currently not possible to assess how the
MJO will change in a warmer climate.
14.3.3 Indian Ocean Modes
The tropical Indian Ocean SST exhibits two modes of interannual vari-
ability (Schott et al., 2009; Deser et al., 2010b): the Indian Ocean Basin
(IOB) mode featuring a basin-wide structure of the same sign, and the
Indian Ocean Dipole (IOD) mode with largest amplitude in the eastern
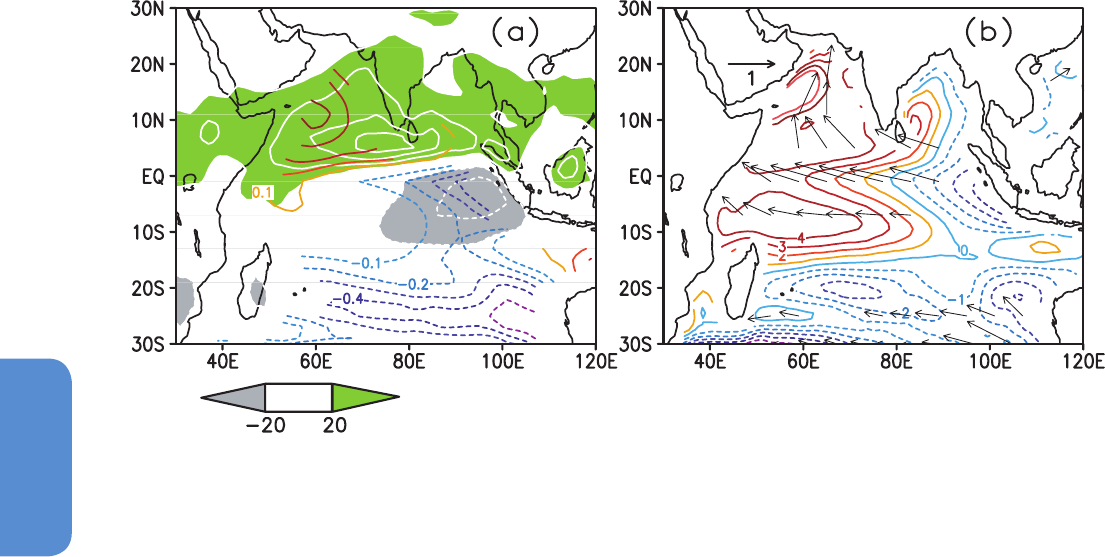
1238
Chapter 14 Climate Phenomena and their Relevance for Future Regional Climate Change
14
Indian Ocean off Indonesia, and weaker anomalies of the opposite
polarity over the rest of the basin (Box 2.5). Both modes are statisti-
cally significantly correlated with ENSO (Section 14.4). CMIP models
simulate both modes well (Section 9.5.3.4.2).
The formation of IOB is linked to ENSO via an atmospheric bridge and
surface heat flux adjustment (Klein et al., 1999; Alexander et al., 2002).
Ocean–atmosphere interactions within the Indian Ocean are impor-
tant for the long persistence of this mode (Izumo et al., 2008; Wu et
al., 2008; Du et al., 2009). The basin mode affects the termination of
ENSO events (Kug and Kang, 2006), it induces coherent atmospheric
anomalies in the summer following El Niño (Xie et al., 2009), including
supressed convection (Wang et al., 2003) and reduced tropical cyclone
activity (Du et al., 2011) over the Northwest Pacific and anomalous
rainfall over East Asia (Huang et al., 2004).
IOD develops in July to November and involves Bjerknes feedback
between zonal SST gradient, zonal wind and thermocline tilt along the
equator (Saji et al., 1999; Webster et al., 1999). A positive IOD event
(with negative SST anomalies off Sumatra) is associated with droughts
in Indonesia, reduced rainfall over Australia, intensified Indian summer
monsoon, increased precipitation in East Africa and anomalous con-
ditions in the extratropical SH (Yamagata et al., 2004). Most CMIP3
models are able to reproduce the general features of the IOD, including
its phase lock onto the July to November season, while detailed analy-
sis of CMIP5 simulations are not yet available (Section 9.5.3.4.2)
Basin-mean SST has risen steadily for much of the 20th century, a trend
captured by CMIP3 20th century simulations (Alory et al., 2007). The
SST increase over the North Indian Ocean since about 1930 is notice-
ably weaker than for the rest of the basin. This spatial pattern is sug-
gestive of the effects of reduced surface solar radiation due to Asian
brown clouds (Chung and Ramanathan, 2006) and it affects Arabian
Latitude
Longitude
(mm per month)
Sea cyclones (Evan et al., 2011b). In the equatorial Indian Ocean, coral
isotope records off Indonesia indicate a reduced SST warming and/or
increased salinity during the 20th century (Abram et al., 2008). From
ship-borne surface measurements, an easterly wind change especially
during July to October has been observed over the past six decades, a
result consistent with a reduction of marine cloudiness in the east and
a decreasing precipitation trend over the maritime continent (Tokinaga
et al., 2012). Atmospheric reanalysis products have difficulty represent-
ing these changes (Han et al., 2010).
The projected changes over the equatorial Indian Ocean include east-
erly wind anomalies, a shoaling thermocline (Vecchi and Soden, 2007a;
Du and Xie, 2008) and reduced SST warming in the east (Stowasser et
al., 2009), a result confirmed by CMIP5 multi-model analysis (Zheng
et al., 2013; Figure 14.10). The change in zonal SST gradient, in turn,
reinforces the easterly wind change, indicative of a positive feedback
between them as envisioned by Bjerknes (1969). This coupled pattern
is most pronounced during July to November, and is broadly consistent
with the observed changes in the equatorial Indian Ocean.
In one CMIP3 model, the IOB mode and its capacitor effect persist
longer, through summer into early fall towards the end of the century
(2081–2100, Zheng et al., 2011). This increased persistence intensifies
ENSO’s influence on the Northwest Pacific summer monsoon. The con-
fidence level of this relationship is low due to the lack of multi-model
studies.
The IOD variability in SST remains nearly unchanged in future projec-
tions of CMIP3 and CMIP5 (Ihara et al., 2009; Figure 14.11a) despite
the easterly wind change that lifts the thermocline (Figure 14.10b)
and intensifies thermocline feedback on SST in the eastern equatorial
Indian Ocean. The global increase in atmospheric dry static stability
weakens the atmospheric response to zonal SST gradient changes,
Figure 14.10 | September to November changes in a 22-model CMIP5 ensemble (2081–2100 in RCP8.5 minus 1986–2005 in historical run). (a) Sea surface temperature (SST,
colour contours at 0.1°C intervals) relative to the tropical mean (20°S to 20°N), and precipitation (shading and white contours at 20 mm per month intervals). (b) Surface wind velocity
(m s
–1
), and sea surface height deviation from the global mean (contours, centimetres). Over the equatorial Indian Ocean, ocean–atmospheric changes form Bjerknes feedback, with
the reduced SST warming and suppressed convection in the east. (Updated with CMIP5 from Xie et al., 2010b.)
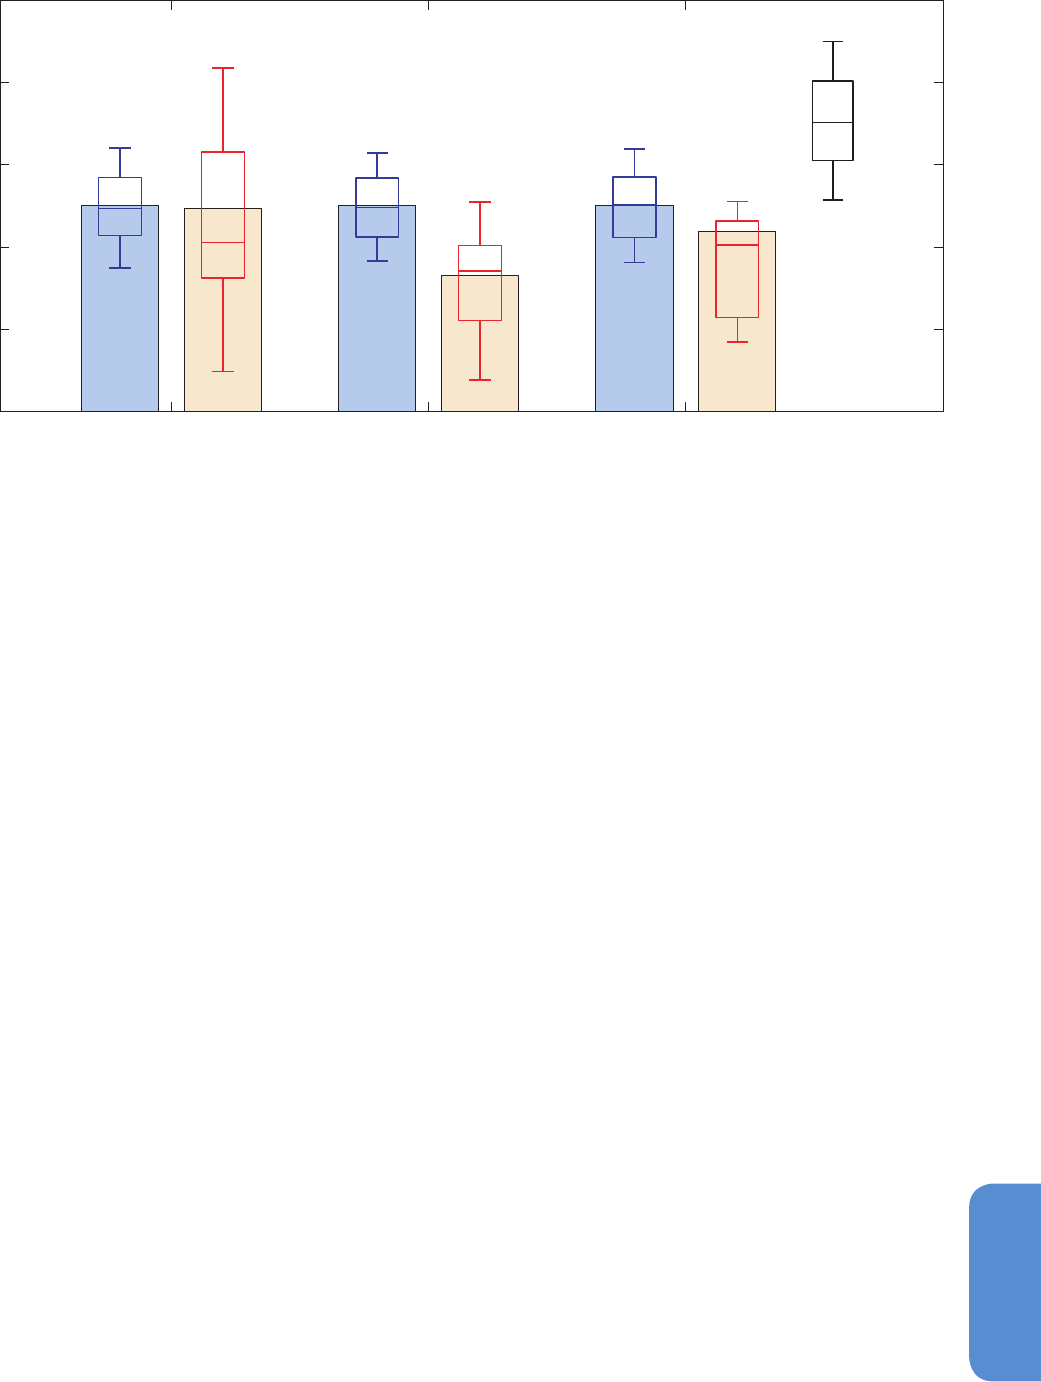
1239
Climate Phenomena and their Relevance for Future Regional Climate Change Chapter 14
14
Figure 14.11 | CMIP5 multi-model ensemble mean standard deviations of interannual variability for September to November in pre-industrial (PiControl; blue bars) and RCP8.5
(red) runs: (a) the Indian Ocean dipole index defined as the western (50°E to 70°E, 10°S to 10°N) minus eastern (90°E to 110°E, 10°S to 0°) SST difference; (b) zonal wind in the
central equatorial Indian Ocean (70°E to 90°E, 5°S to 5°N); and (c) sea surface height in the eastern equatorial Indian Ocean (90°E to 110°E, 10°S to 0°). The standard deviation
is normalized by the pre-industrial (PiControl) value for each model before ensemble average. Blue box-and-whisker plots show the 10th, 25th, 50th, 75th and 90th percentiles of
51-year windows for PiControl, representing natural variability. Red box-and-whisker plots represent inter-model variability for RCP8.5, based on the nearest rank. (Adapted from
Zheng et al., 2013.)
(a) IOD Variance (b) Zonal Wind Variance (c) SSH Variance
0.5
0.7
0.9
1.1
Standard deviation
1.3
1.51.5
90%
75%
25%
50%
10%
countering the enhanced thermocline feedback (Zheng et al., 2010).
The weakened atmospheric feedback is reflected in a decrease in IOD
variance in both zonal wind and the thermocline depth (Zheng et al.,
2013; Figure 14.11b, c ).
14.3.4 Atlantic Ocean Modes
The Atlantic features a northward-displaced ITCZ (Section 14.3.1.1),
and a cold tongue that develops in boreal summer. Climate models
generally fail to simulate these characteristics of tropical Atlantic cli-
mate (Section 9.5.3.3). The biases severely limit model skill in simu-
lating modes of Atlantic climate variability and in projecting future
climate change in the Atlantic sector. In-depth analysis of the CMIP5
projections of Atlantic Ocean Modes has not yet been fully explored,
but see Section 12.4.3.
The inter-hemispheric SST gradient displays pronounced interannual to
decadal variability (Box 2.5, Figure 2), referred to as the Atlantic merid-
ional mode (AMM; Servain et al., 1999; Chiang and Vimont, 2004; Xie
and Carton, 2004). A thermodynamic feedback between surface winds,
evaporation and SST (WES; Xie and Philander, 1994) is fundamental to
the AMM (Chang et al., 2006). This mode affects precipitation in north-
eastern Brazil by displacing the ITCZ (Servain et al., 1999; Chiang and
Vimont, 2004; Xie and Carton, 2004), and Atlantic hurricane activity
(Vimont and Kossin, 2007; Smirnov and Vimont, 2011).
The Atlantic Niño mode represents interannual variability in the equa-
torial cold tongue, akin to ENSO (Box 2.5, Figure 2). Bjerknes feedback
is considered important for energizing the mode (Zebiak, 1993; Carton
and Huang, 1994; Keenlyside and Latif, 2007). This mode affects the
West Africa Monsoon (Vizy and Cook, 2002; Giannini et al., 2003).
Over the past century, the Atlantic has experienced a pronounced
and persistent warming trend. The warming has brought detectable
changes in atmospheric circulation and rainfall patterns in the region.
In particular, the ITCZ has shifted southward and land precipitation
has increased over the equatorial Amazon, equatorial West Africa, and
along the Guinea coast, while it has decreased over the Sahel (Deser
et al., 2010a; Tokinaga and Xie, 2011; see also Sections 2.5 and 2.7 ).
Atlantic Niño variability has weakened by 40% in amplitude from 1960
to 1999, associated with a weakening of the equatorial cold tongue
(Tokinaga and Xie, 2011).
The CMIP3 20th century climate simulations generally capture the
warming trend of the basin-averaged SST over the tropical Atlantic. A
majority of the models also seem to capture the secular trend in the
tropical Atlantic SST inter-hemispheric gradient and, as a result, the
southward shift of the Atlantic ITCZ over the past century (Chang et
al., 2011).
Many CMIP3 model simulations with the A1B emission scenario show
only minor changes in the SST variance associated with the AMM.
However, the few models that give the best AMM simulation over the
20th century project a weakening in future AMM activity (Breugem et
al., 2006), possibly due to the northward shift of the ITCZ (Breugem
et al., 2007). At present, model projections of future change in AMM
activity is considered highly uncertain because of the poorly simulat-
ed Atlantic ITCZ. In fact, uncertainty in projected changes in Atlantic
meridional SST gradient limits the confidence in regional climate pro-
jections surrounding the tropical Atlantic Ocean (Good et al., 2008).
A majority of CMIP3 models forced with the A1B emission scenario
project no major change in Atlantic Niño activity in the 21st century,

1240
Chapter 14 Climate Phenomena and their Relevance for Future Regional Climate Change
14
while a few models project a sizable decrease in future activity (Breu-
gem et al., 2006).
CMIP5 projections show an accelerated SST warming over much of the
tropical Atlantic (Figure 12.11). RCP8.5 projections of the inter-hemi-
spheric SST gradient change within the basin, however, are not consist-
ent among CMIP5 models as future GHG increase dominates over the
anthropogenic aerosol effect.
14.3.5 Assessment Summary
There is medium confidence that annual rainfall changes over tropi-
cal oceans follow a ‘warmer-get-wetter’ pattern, increasing where the
SST warming exceeds the tropical mean and vice versa. One third of
inter-model differences in precipitation projection are due to those in
SST pattern. The SST pattern effect on precipitation change is a new
finding since AR4.
The wet-get-wetter effect is more obvious in the seasonal than annual
rainfall change in the tropics. Confidence is generally higher in sea-
sonal than in annual mean changes in tropical precipitation. There is
medium confidence that seasonal rainfall will increase on the equator-
ward flank of the current ITCZ; that the frequency of zonally oriented
SPCZ events will increase, with the SPCZ lying well to the northeast
of its average position during those events; and that the SACZ shifts
southwards, in conjunction with the southward displacement of the
South Atlantic subtropical high, leading to an increase in precipitation
over southeastern South America.
Owing to models’ ability to reproduce general features of IOD and
agreement on future projections, it is likely that the tropical Indian
Ocean will feature a zonal pattern with reduced (enhanced) warm-
ing and decreased (increased) rainfall in the east (west), a pattern
especially pronounced during August to November. The Indian Ocean
dipole mode will very likely remain active, with interannual variability
unchanged in SST but decreasing in thermocline depth. There is low
confidence in changes in the summer persistence of the Indian Ocean
SST response to ENSO and in ENSO’s influence on summer climate over
the Northwest Pacific and East Asia.
The observed SST warming in the tropical Atlantic represents a reduc-
tion in spatial variation in climatology: the warming is weaker north
than south of the equator; and the equatorial cold tongue weakens
both in the mean and interannual variability. There is low confidence
in projected changes over the tropical Atlantic, both for the mean and
interannual modes, because of large errors in model simulations of
current climate.
There is low confidence in how MJO will change in the future due to
the poor skill of models in simulating MJO and the sensitivity of its
change to SST warming patterns that are themselves subject to large
uncertainties in the projections.
14.4 El Niño-Southern Oscillation
The ENSO is a coupled ocean–atmosphere phenomenon naturally
occurring at the interannual time scale over the tropical Pacific (see
Box 2.5, Supplementary Material Section 14.SM.2, and Figure 14.12).
14.4.1 Tropical Pacific Mean State
SST in the western tropical Pacific has increased by up to 1.5°C per cen-
tury, and the warm pool has expanded (Liu and Huang, 2000; Huang
and Liu, 2001; Cravatte et al., 2009). Studies disagree on how the east–
west SST gradient along the equator has changed, some showing a
strengthening (Cane et al., 1997; Hansen et al., 2006; Karnauskas et al.,
2009; An et al., 2011) and others showing a weakening (Deser et al.,
2010a; Tokinaga et al., 2012), because of observational uncertainties
associated with limited data sampling, changing measurement tech-
niques, and analysis procedures. Most CMIP3 and CMIP5 models also
disagree on the response of zonal SST gradient across the equatorial
Pacific (Yeh et al., 2012).
The Pacific Ocean warms more near the equator than in the subtropics
in CMIP3 and CMIP5 projections (Liu et al., 2005; Gastineau and Soden,
2009; Widlansky et al., 2013; Figure 14.12) because of the difference
in evaporative damping (Xie et al., 2010b). Other oceanic changes
include a basin-wide thermocline shoaling (Vecchi and Soden, 2007a;
DiNezio et al., 2009; Collins et al., 2010; Figure 14.12), a weakening of
surface currents, and a slight upward shift and strengthening of the
equatorial undercurrent (Luo and Rothstein, 2011; Sen Gupta et al.,
2012). A weakening of tropical atmosphere circulation during the 20th
century was documented in observations and reanalyses (Vecchi et al.,
2006; Zhang and Song, 2006; Vecchi and Soden, 2007a; Bunge and
Clarke, 2009; Karnauskas et al., 2009; Yu and Zwiers, 2010; Tokinaga
et al., 2012) and in CMIP models (Vecchi and Soden, 2007a; Gastineau
and Soden, 2009). The Pacific Walker Circulation, however, intensified
during the most recent two decades (Mitas and Clement, 2005; Liu and
Curry, 2006; Mitas and Clement, 2006; Sohn and Park, 2010; Li and
Ren, 2012; Zahn and Allan, 2011; Zhang et al., 2011a), illustrating the
effects of natural variability.
14.4.2 El Niño Changes over Recent Decades and
in the Future
The amplitude modulation of ENSO at longer time scales has been
observed in reconstructed instrumental records (Gu and Philander,
1995; Wang, 1995; Mitchell and Wallace, 1996; Wang and Wang, 1996;
Power et al., 1999; An and Wang, 2000; Yeh and Kirtman, 2005; Power
and Smith, 2007; Section 5.4.1), in proxy records (Cobb et al., 2003;
Braganza et al., 2009; Li et al., 2011c; Yan et al., 2011), and is also
simulated by coupled GCMs (Lau et al., 2008; Wittenberg, 2009). Some
studies have suggested that the modulation was due to changes in
mean climate conditions in the tropical Pacific (An and Wang, 2000;
Fedorov and Philander, 2000; Wang and An, 2001, 2002; Li et al.,
2011c), as observed since the 1980s (An and Jin, 2000; An and Wang,
2000; Fedorov and Philander, 2000; Kim and An, 2011). With three
events during 2000-2010, which meets intensity in Nino4 being larger
than in Nino3, two events during 1990-2000 and only two events are
found for 1950-1990 the maximum SST warming during El Niño now
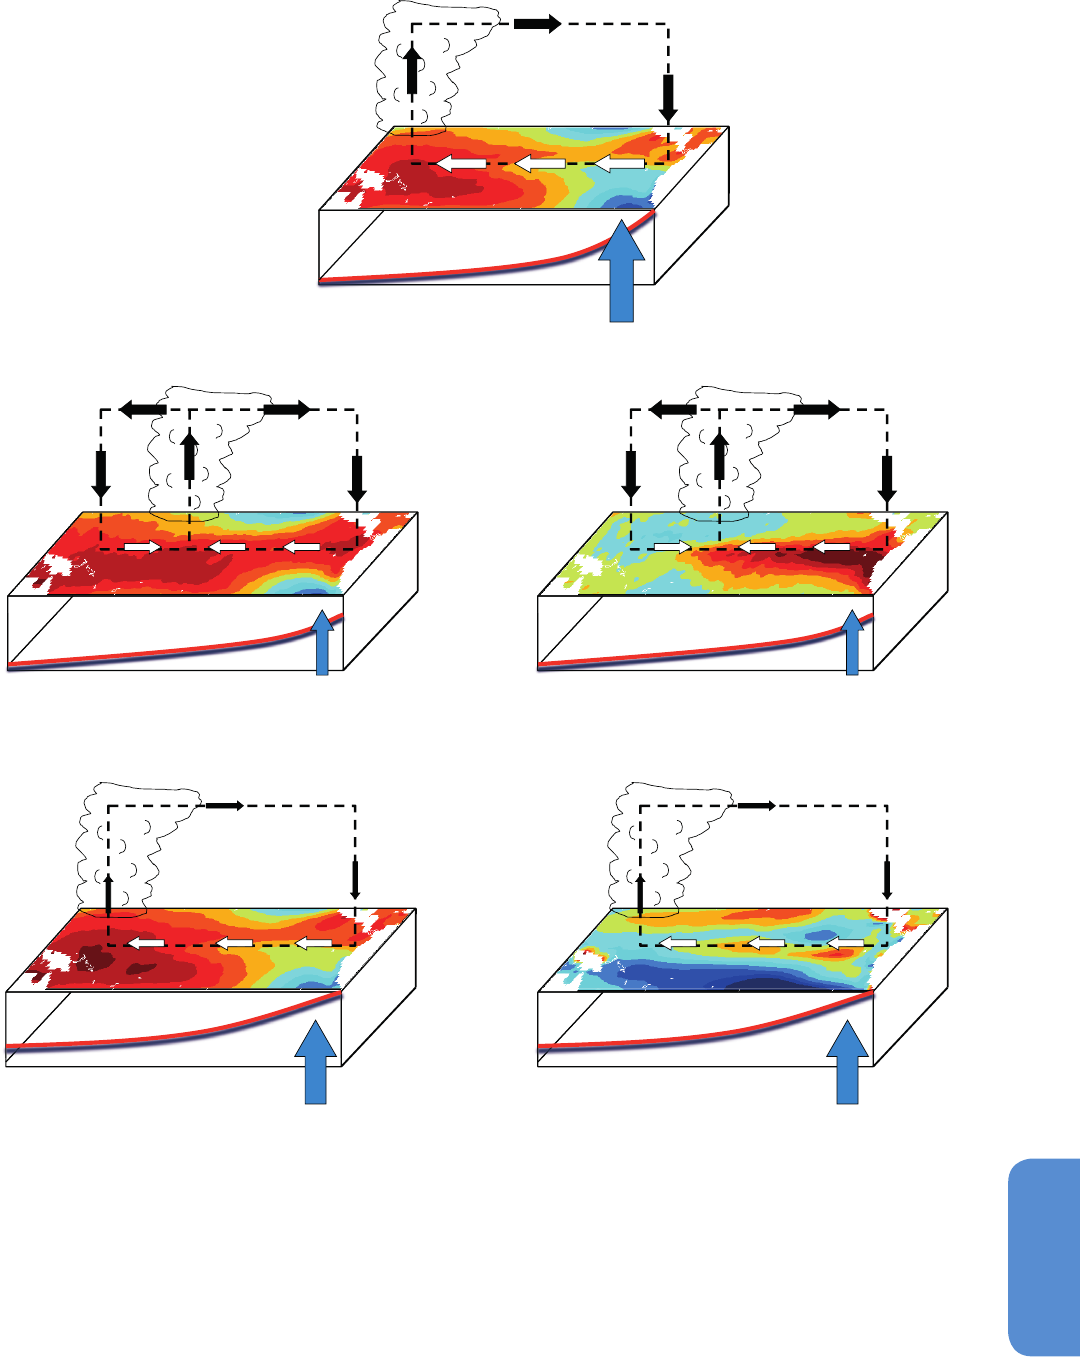
1241
Climate Phenomena and their Relevance for Future Regional Climate Change Chapter 14
14
Figure 14.12 | Idealized schematic showing atmospheric and oceanic conditions of the tropical Pacific region and their interactions during normal conditions, El Niño condi-
tions, and in a warmer world. (a) Mean climate conditions in the tropical Pacific, indicating sea surface temperatures (SSTs), surface wind stress and associated Walker Circulation,
the mean position of convection and the mean upwelling and position of the thermocline. (b) Typical conditions during an El Niño event. SSTs are anomalously warm in the east;
convection moves into the central Pacific; the trade winds weaken in the east and the Walker Circulation is disrupted; the thermocline flattens and the upwelling is reduced. (c) The
likely mean conditions under climate change derived from observations, theory and coupled General Circulation Models (GCMs). The trade winds weaken; the thermocline flattens
and shoals; the upwelling is reduced although the mean vertical temperature gradient is increased; and SSTs (shown as anomalies with respect to the mean tropical-wide warm-
ing) increase more on the equator than off. Diagrams with absolute SST fields are shown on the left, diagrams with SST anomalies are shown on the right. For the climate change
fields, anomalies are expressed with respect to the basin average temperature change so that blue colours indicate a warming smaller than the basin mean, not a cooling (Collins
et al., 2010).
Thermocline
Upwelling
Walker circulaon
Warm pool Cold tongue
Thermocline
Upwelling
Thermocline
Thermocline
Upwelling
Thermocline
Thermocline
The
rmocline
Upwelling
Thermocline
The
rmocline
Upwelling
Normal conditions
El Niño conditions
El Niño Conditions
(SST anomalies)
Climate change
Climate change
(SST anomalies)
(a)
(b)
(c)
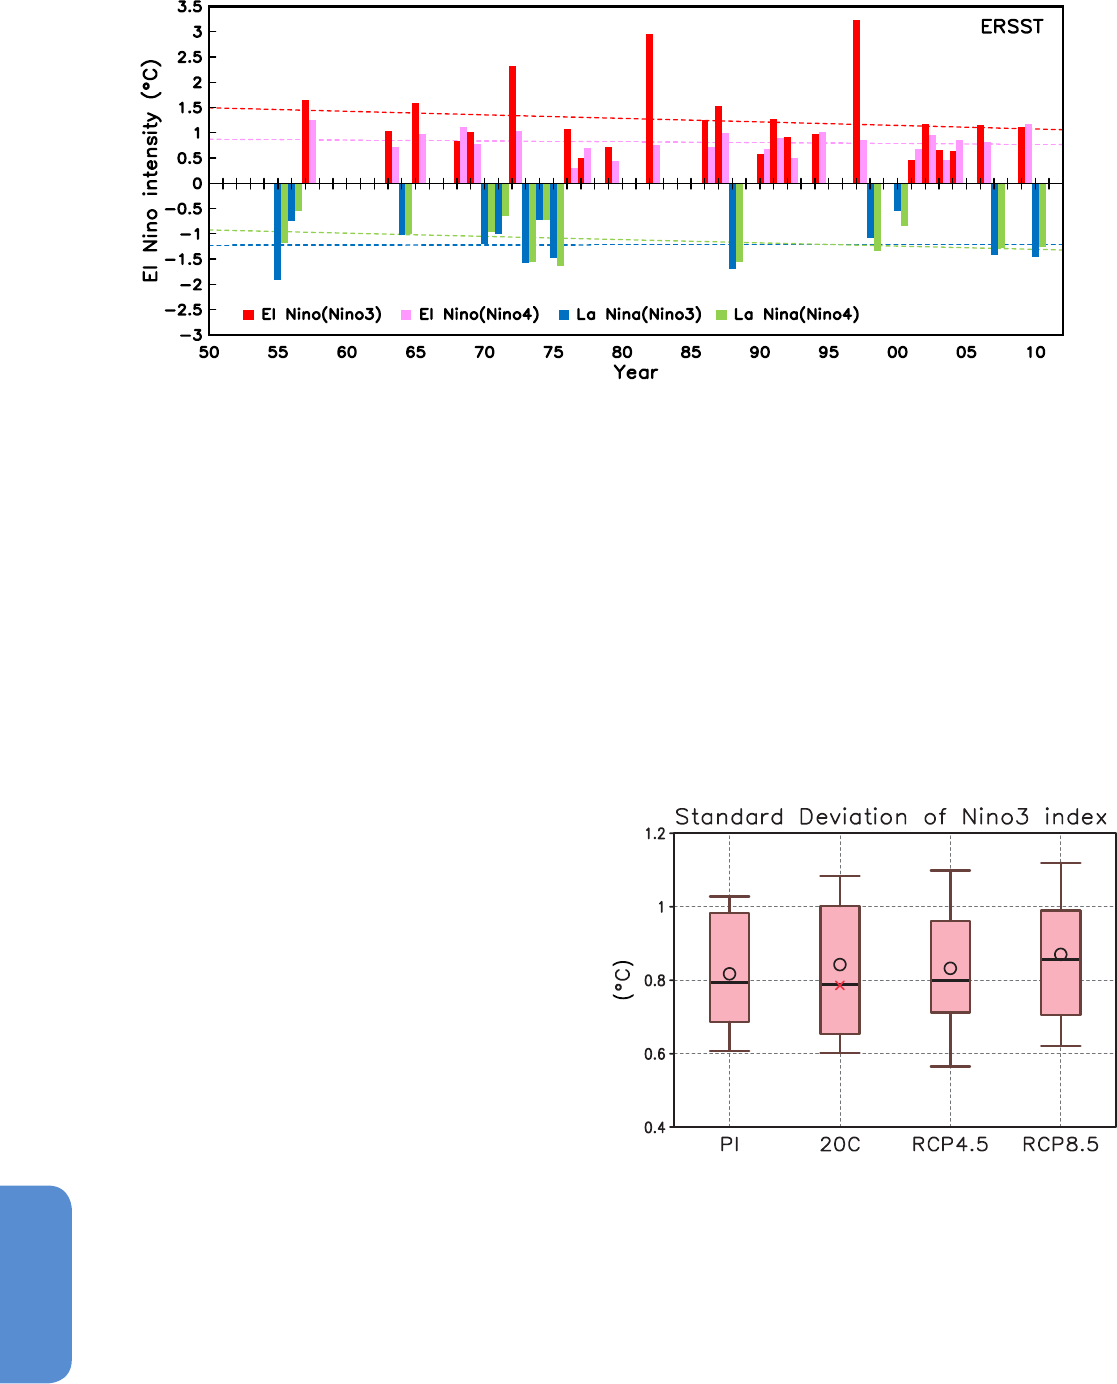
1242
Chapter 14 Climate Phenomena and their Relevance for Future Regional Climate Change
14
appears to occur more often in the central Pacific (Figure 14.13; Ashok
et al., 2007; Kao and Yu, 2009; Kug et al., 2009; Section 9.5.3.4.1 and
Supplementary Material Section 14.SM.2; Yeh et al., 2009), with global
impacts that are distinct from ‘standard’ El Niño events where the
maximum warming is over the eastern Pacific (Kumar et al., 2006a;
Ashok et al., 2007; Kao and Yu, 2009; Hu et al., 2012b). During the past
century, an increasing trend in ENSO amplitude was also observed (Li
et al., 2011c; Vance et al., 2012), possibly caused by a warming climate
(Zhang et al., 2008; Kim and An, 2011) although other reconstructions
in this data-sparse region dispute this trend (Giese and Ray, 2011).
Long coupled GCM simulations show that decadal-to-centennial mod-
ulations of ENSO can be generated without any change in external
forcing (Wittenberg, 2009; Yeh et al., 2011), with multi-decadal epochs
of anomalous ENSO behaviour. The modulations result from nonlinear
processes in the tropical climate system (Timmermann et al., 2003), the
interaction with the mean climate state (Ye and Hsieh, 2008; Choi et al.,
2009, 2011, 2012), or from random changes in ENSO activity triggered
by chaotic atmospheric variability (Power and Colman, 2006; Power et
al., 2006). There is little consensus as to whether the decadal modula-
tions of ENSO properties (amplitude and spatial pattern) during recent
decades are due to anthropogenic effects or natural variability. Instru-
mental SST records are available back to the 1850s, but good observa-
tions of the coupled air–sea feedbacks that control ENSO behaviour—
including subsurface temperature and current fluctuations, and air–sea
exchanges of heat, momentum and water—are available only after the
late 1970s, making observed historical variations in ENSO feedbacks
highly uncertain (Chen, 2003; Wittenberg, 2004).
CMIP5 models show some improvement compared to CMIP3, espe-
cially in ENSO amplitude (Section 9.5.3.4.1). Selected CMIP5 models
that simulate well strong El Niño events show a gradual increase of El
Niño intensity, especially over the central Pacific (Kim and Yu, 2012).
CMIP3 models suggested a westward shift of SST variability in future
projections (Boer, 2009; Yeh et al., 2009). Generally, however, future
changes in El Niño intensity in CMIP5 models are model dependent
(Guilyardi et al., 2012; Kim and Yu, 2012; Stevenson et al., 2012), and
Figure 14.13 | Intensities of El Niño and La Niña events for the last 60 years in the eastern equatorial Pacific (Niño3 region) and in the central equatorial Pacific (Niño4 region),
and the estimated linear trends, obtained from Extended Reconstructed Sea Surface Temperature v3 (ERSSTv3).
Figure 14.14 | Standard deviation in CMIP5 multi-model ensembles of sea surface
temperature variability over the eastern equatorial Pacific Ocean (Nino3 region: 5°S-
5°N, 150°W-90°W), a measure of El Nino amplitude, for the pre-industrial (PI) control
and 20th century (20C) simulations, and 21st century projections using RCP4.5 and
RCP8.5. Thirty-one models are used for the ensemble average. Open circles indicate
multi-model ensemble means, and the red cross symbol is the observed standard devia-
tion for January 1870 – December 2011 obtained from HadISSTv1. The linear trend and
climatological mean of seasonal cycle have been removed. Box-whisker plots show the
16th, 25th, 50th, 75th, and 84th percentiles.
not significantly distinguished from natural modulations (Stevenson,
2012; Figure 14.14). Because the change in tropical mean conditions
(especially the zonal gradient) in a warming climate is model depend-
ent (Section 14.4.1), changes in ENSO intensity for the 21st century
(Solomon and Newman, 2011; Hu et al., 2012a) are uncertain (Figure
14.14). Future changes in ENSO depend on competing changes in cou-
pled ocean–atmospheric feedback (Philip and Van Oldenborgh, 2006;
Collins et al., 2010; Vecchi and Wittenberg, 2010), and on the dynami-
cal regime a given model is in. There is high confidence, however, that
ENSO will remain the dominant mode of natural climate variability in
the 21st century (Collins et al., 2010; Guilyardi et al. 2012; Kim and Yu
2012; Stevenson 2012).
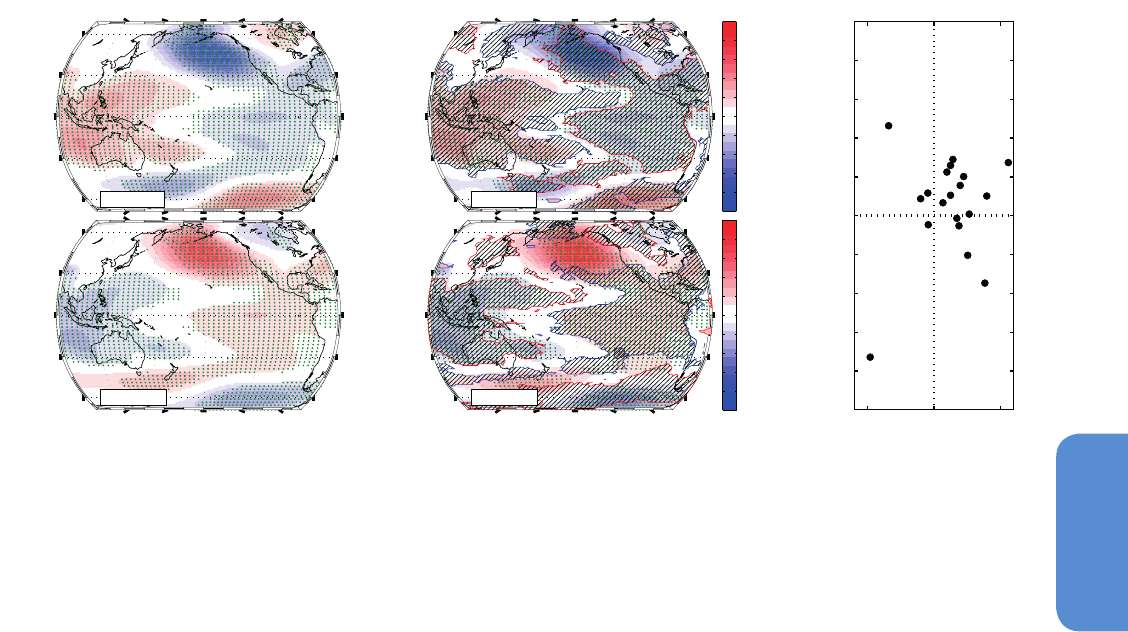
1243
Climate Phenomena and their Relevance for Future Regional Climate Change Chapter 14
14
14.4.3 Teleconnections
There is little improvement in the CMIP5 ensemble relative to CMIP3
in the amplitude and spatial correlation metrics of precipitation tele-
connections in response to ENSO, in particular within regions of strong
observed precipitation teleconnections (equatorial South America, the
western equatorial Pacific and a southern section of North America;
Langenbrunner and Neelin, 2013). Scenario projections in CMIP3 and
CMIP5 showed a systematic eastward shift in both El Niño- and La
Niña-induced teleconnection patterns over the extratropical NH
(Meehl and Teng, 2007; Stevenson et al., 2012; Figure 14.15), which
might be due to the eastward migration of tropical convection centres
associated with the expansion of the warm pool in a warm climate
(Muller and Roeckner, 2006; Müller and Roeckner, 2008; Cravatte et
al., 2009; Kug et al., 2010), or changes in the mid-latitude mean cir-
culation (Meehl and Teng, 2007). Some models produced an intensi-
fied ENSO teleconnection pattern over the North Atlantic region in a
warmer climate (Müller and Roeckner, 2008; Bulic et al., 2012) and a
weakened teleconnection pattern over the North Pacific (Stevenson,
2012). It is unclear whether the eastward shift of tropical convection is
related to longitudinal shifts in El Niño maximum SST anomalies (see
Supplementary Material Section 14.SM.2) or to changes in the mean
state in the tropical Pacific. Some coupled GCMs, which do not show
an increase in the central Pacific warming during El Nino in response
to a warming climate, do not produce a substantial change in the lon-
gitudinal location of tropical convection (Müller and Roeckner, 2008;
Yeh et al., 2009).
In a warmer climate, the increase in atmospheric moisture intensifies
temporal variability of precipitation even if atmospheric circulation
60
o
S
30
o
S
0
o
30
o
N
60
o
N
El Nino DJF
20th century (historical)
Lat
120
o
E
160
o
E
160
o
W
120
o
W
80
o
W
60
o
S
30
o
S
0
o
30
o
N
60
o
N
La Nina DJF
Lon
Lat
60
o
S
30
o
S
0
o
30
o
N
60
o
N
El Nino DJF
21st century (RCP 4.5)
SLP (hPa)
−4
−3
−2
−1
0
1
2
3
4
120
o
E
160
o
E
160
o
W
120
o
W
80
o
W
60
o
S
30
o
S
0
o
30
o
N
60
o
N
Lon
La Nina DJF
SLP (hPa)
−4
−3
−2
−1
0
1
2
3
4
−10 0 10
−4
−3
−2
−1
0
1
2
3
4
Δ Lon (°E)
Δ Lat (
°
N)
El Nino Aleutian Low shift: RCP 4.5
Northeast Northwest
Southwest
Southeast
(c)
(e)
(a)
(b) (d)
Figure 14.15 | Changes to sea level pressure (SLP) teleconnections during December, January and February (DJF) in the CMIP5 models. (a) SLP anomalies for El Niño during the
20th century. (b) SLP anomalies for La Nina during the 20th century. (c) SLP anomalies for El Niño during RCP4.5. (d) SLP anomalies for La Niña during RCP4.5. Maps in (a)–(d) are
stippled where more than two thirds of models agree on the sign of the SLP anomaly ((a),( b): 18 models; (c),(d): 12 models), and hatched where differences between the RCP4.5
multi-model mean SLP anomaly exceed the 60th percentile (red-bordered regions) or are less than the 40th percentile (blue-bordered regions) of the distribution of 20th century
ensemble means. In all panels, El Niño (La Niña) periods are defined as years having DJF Nino3.4 SST above (below) one standard deviation relative to the mean of the detrended
time series. For ensemble mean calculations, all SLP anomalies have been normalized to the standard deviation of the ensemblemember detrended Nino3.4 SST. (e) Change in the
‘centre of mass’ of the Aleutian Low SLP anomaly, RCP4.5–20th century. The Aleutian Low SLP centre of mass is a vector with two elements (lat, lon), and is defined as the sum of
(lat, lon) weighted by the SLP anomaly, over all points in the region 180°E to 120°E, 40°N to 60°N having a negative SLP anomaly during El Niño.
variability remains the same (Trenberth 2011; Section 12.4.5). This
applies to ENSO-induced precipitation variability but the possibility of
changes in ENSO teleconnections complicates this general conclusion,
making it somewhat regional-dependent (Seager et al. 2012)
14.4.4 Assessment Summary
ENSO shows considerable inter-decadal modulations in amplitude
and spatial pattern within the instrumental record. Models without
changes in external forcing display similar modulations, and there is
little consensus on whether the observed changes in ENSO are due to
external forcing or natural variability (see also Section 10.3.3 for an
attribution discussion).
There is high confidence that ENSO will remain the dominant mode of
interannual variability with global influences in the 21st century, and
due to changes in moisture availability ENSO-induced rainfall variabil-
ity on regional scales will intensify. There is medium confidence that
ENSO-induced teleconnection patterns will shift eastward over the
North Pacific and North America. There is low confidence in changes in
the intensity and spatial pattern of El Niño in a warmer climate.
14.5 Annular and Dipolar Modes
The North Atlantic Oscillation (NAO), the North Pacific Oscillation (NPO)
and the Northern and Southern Annular Modes (NAM and SAM) are
dominant modes of variability in the extratropics. These modes are the
focus of much research attention, especially in impact studies, where
they are often used as aggregate descriptors of past regional
climate

1244
Chapter 14 Climate Phenomena and their Relevance for Future Regional Climate Change
14
trends and variations over many parts of the world. For example, since
IPCC (2007a) more than 2000 scientific articles have been published,
which include NAO, AO, or NAM in either the title or abstract. This
assessment focusses on recent research on these modes that is most
relevant for future regional climate change. Past behaviour of these
modes inferred from observations is assessed in Section 2.7.8.
14.5.1 Northern Modes
The NAO is a well-established dipolar mode of climate variability
having opposite variations in sea level pressure between the Atlan-
tic subtropical high and the Iceland/Arctic low (Wanner et al., 2001;
Hurrell et al., 2003; Budikova, 2009). It is strongly associated with the
tropospheric jet, storms (see Section 14.6.2), and blocking that deter-
mine the weather and climate over the North Atlantic and surround-
ing continents (Hurrell and Deser, 2009; Box 14.2). The NAO exists in
boreal summer as well as in boreal winter, albeit with different physical
characteristics (Sun et al., 2008; Folland et al., 2009).
Over the North Pacific, there is a similar wintertime dipolar mode
known as the NPO associated with north–south displacements of the
Asian-Pacific jet stream and the Pacific storm track. The NPO influences
winter air temperature and precipitation over much of western North
America as well as sea ice over the Pacific sector of the Arctic, more so
than either ENSO (Section 14.4) or the PNA (Linkin and Nigam, 2008).
These dipolar modes have been interpreted as the regional manifes-
tation of an annular mode in sea level pressure known as the Arctic
Oscillation (AO; Thompson and Wallace, 1998) or the Northern Annular
Mode (NAM; Thompson and Wallace, 2000). The AO (NAM at 1000 hPa)
index and the NAO index (see Box 2.5, Table 1) are strongly correlated
but the AO spatial pattern is more zonally symmetric and so differs
from the NAO over the N. Pacific (Ambaum et al., 2001; Feldstein and
Franzke, 2006). Hereafter, the term NAO is used to denote NAO, AO and
NAM in boreal winter unless further distinction is required.
Climate models are generally able to simulate the gross features of NAO
and NPO (see Section 9.5.3.2). It has been argued that these modes
may be a preferred pattern of response to climate change (Gerber et
al., 2008). However, this is not supported by a detailed examination
of the vertical structure of the simulated global warming response
(Woollings, 2008). Hori et al. (2007) noted that NAO variability did not
change substantially in the Special Report on Emission Scenarios (SRE-
S)-A1B and 20th century scenarios and so concluded that the trend in
the NAO index (defined relative to a historical mean state) is a result
of an anthropogenic trend in the basic mean state rather than due
to changes in NAO variability. However, other research indicates that
there is a coherent two-way interaction between the trend in the mean
state and the NAO-like modes of variability—the mode and/or regime
structure change due to changes in the mean state (Branstator and
Selten, 2009 ; Barnes and Polvani, 2013). Section 14.6.2 assesses the
jet and storm track changes associated with the projected responses.
Model simulations have underestimated the magnitude of the large
positive trend from 1960-2000 in winter NAO observations, which
now appears to be more likely due to natural variability rather than
anthropogenic influences (see Section 10.3.3.2). Some studies have
even considered NAO to be a source of natural variability that needs to
be removed before detection and attribution of anthropogenic chang-
es (Zhang et al., 2006). Detection of regional surface air temperature
response to anthropogenic forcing has been found to be robust to the
exclusion of model-simulated AO and PNA changes (Wu and Karoly,
2007). Model projections of wintertime European precipitation have
been shown to become more consistent with observed trends after
removal of trends due to NAO (Bhend and von Storch, 2008). Underes-
timation of trends in NAO can lead to biases in projections of regional
climate, for example, Arctic sea ice (Koldunov et al., 2010).
Underestimation of NAO long-term variability may be due to missing
or poorly represented processes in climate models. Recent observation-
al and modelling studies have helped to confirm that the lower strat-
osphere plays an important role in explaining recent more negative
NAO winters and long-term trends in NAO (Scaife et al., 2005; Dong
et al., 2011; Ouzeau et al., 2011; Schimanke et al., 2011). This is sup-
ported by evidence that seasonal forecasts of NAO can be improved
by inclusion of the stratospheric Quasi-Biennial Oscillation (QBO; Boer
and Hamilton, 2008; Marshall and Scaife, 2010). Other studies have
found that observed changes in stratospheric water vapour changes
from 1965–1995 led to an impact on NAO simulated by a model, and
have suggested that changes in stratospheric water vapour may be
another possible pathway for communicating tropical forcing to the
extratropics (Joshi et al., 2006; Bell et al., 2009). There is growing evi-
dence that future NAO projections are sensitive to how climate models
resolve stratospheric processes and troposphere–stratosphere interac-
tions (Sigmond and Scinocca, 2010; Scaife et al., 2011a; Karpechko and
Manzini, 2012).
Several recent studies of historical data have found a positive associa-
tion between solar activity and NAO (Haigh and Roscoe, 2006; Kodera
et al., 2008; Lockwood et al., 2010), while other studies have found
little imprint of solar and volcanic forcing on NAO (Casty et al., 2007).
Positive associations between NAO and solar forcing have been repro-
duced in recent modelling studies (Lee et al., 2008; Ineson et al., 2011)
but no significant changes were found in CMIP5 projections of NAO
due to changes in solar irradiance or aerosol forcing.
Observational studies have noted weakening of NAO during periods of
reduced Arctic sea ice (Strong et al., 2009; Wu and Zhang, 2010). Sev-
eral modelling studies have also shown a negative NAO response to
the partial removal of sea ice in the Arctic or high latitudes (Kvamsto et
al., 2004; Magnusdottir et al., 2004; Seierstad and Bader, 2009; Deser
et al., 2010c; Screen et al., 2012). However, the strength and timing of
the response to sea ice loss varies considerably between studies, and
can be hard to separate from common responses to warming of the
troposphere and from natural climate variability. The impact of sea ice
loss in individual years on NAO is small and hard to detect (Bluthgen
et al., 2012). Reviews of the emerging literature on this topic can be
found in Budikova (2009) and Bader et al. (2011).
The NPO contributes to the excitation of ENSO events via the ‘Seasonal
Footprinting Mechanism’ (SFM; Anderson, 2003; Vimont et al., 2009;
Alexander et al., 2010). Some studies indicate that warm events in the
central tropical Pacific Ocean may in turn excite the NPO (Di Lorenzo
et al., 2009).
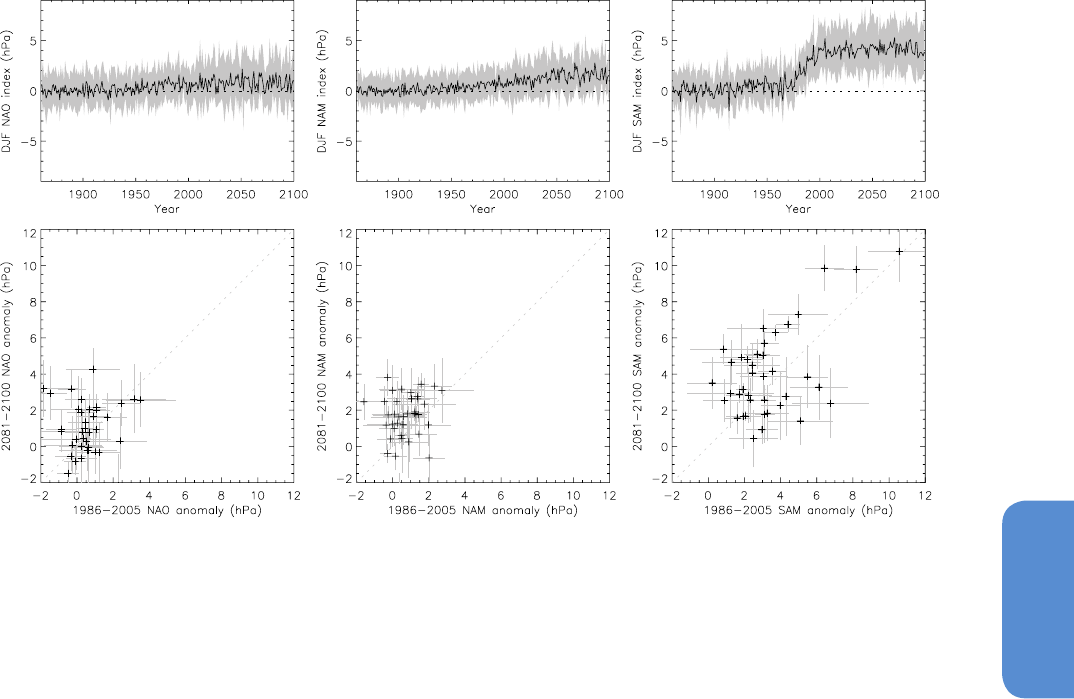
1245
Climate Phenomena and their Relevance for Future Regional Climate Change Chapter 14
14
(a) NAO (b) NAM (c) SAM
(e) (f)(d)
Recent multi-model studies of NAO (Hori et al., 2007; Karpechko, 2010;
Zhu and Wang, 2010; Gillett and Fyfe, 2013) reconfirm the small pos-
itive response of boreal winter NAO indices to GHG forcing noted in
earlier studies reported in AR4 (Kuzmina et al., 2005; Miller et al., 2006;
Stephenson et al., 2006). Projected trends in wintertime NAO indices are
generally found to have small amplitude compared to natural internal
variations (Deser et al., 2012). Furthermore, there is substantial vari-
ation in NAO projections from different climate models. For example,
one study found no significant NAO trends in two simulations with the
ECHAM4/OPYC3 model (Fischer-Bruns et al., 2009), whereas another
study found a strong positive trend in NAO in the ECHAM5/MPI-OM
SRES A1B simulations (Müller and Roeckner, 2008). The model depend-
ence of the response is an important source of uncertainty in the region-
al climate change response (Karpechko, 2010). A multi-model study of
24 climate model projections suggests that there are no major changes
in the NPO due to greenhouse warming (Furtado et al., 2011).
Figures 14.16a, b summarize the wintertime NAO and NAM indices
simulated by models participating in the CMIP5 experiment (Gillett
and Fyfe, 2013). The multi-model mean of the NAO and NAM indices
are similar and exhibit small linear trends in agreement with those
shown for the NAM index in AR4 (AR4, Figure 10.17a). The multi-model
mean projected increase of around 1 to 2 hPa from 1850 to 2100 is
smaller than the spread of around 2 to 4 hPa between model simula-
tions (Figure 14.16).
Some differences in model projections can be accounted for by chang-
es in the NAO spatial pattern, for example, northeastward shifts in
NAO centres of action have been found to be important for estimating
the trend in the NAO index (Ulbrich and Christoph, 1999; Hu and Wu,
2004). Individual model simulations have shown the spatial extent of
NAO influence decreases with GHG forcing (Fischer-Bruns et al., 2009),
a positive feedback between jet and storm tracks that enhances a
poleward shift in the NAO pattern (Choi et al., 2010), and changes in
the NAO pattern but with no changes in the propagation conditions for
Rossby waves (Brandefelt, 2006). One modelling study found a trend
in the correlation between NAO and ENSO during the 21st century
(Muller and Roeckner, 2006). Such changes in the structure of NAO
and/or its interaction with other modes of variability would could lead
to important regional climate impacts.
14.5.2 Southern Annular Mode
The Southern Annular Mode (SAM, also known as Antarctic Oscillation,
AAO), is the leading mode of climate variability in the SH extratropics,
describing fluctuations in the latitudinal position and strength of the
mid-latitude eddy-driven westerly jet (see Box 2.5; Section 9.5.3.2).
SAM variability has a major influence on the climate of Antarctica,
Australasia, southern South America and South Africa (Watterson,
2009; Thompson et al., 2011 and references therein).
Figure 14.16 | Summary of multi-model ensemble simulations of wintertime (December to February) mean North Atlantic Oscillation (NAO), Northern Annular Mode (NAM) and
Southern Annular Mode (SAM) sea level pressure (SLP) indices for historical and RCP4.5 scenarios produced by 39 climate models participating in CMIP5. Panels (a)–(c) show time
series of the ensemble mean (black line) and inter-quartile range (grey shading) of the mean index for each model. Panels (d)–(f) show scatter plots of individual model 2081–2100
time means versus 1986–2005 time means (black crosses) together with (–2,+2) standard error bars. The NAO index is defined here as the difference of regional averages: (90°W
to 60°E, 20°N to 55°N) minus (90°W to 60°E, 55°N to 90°N) (see Stephenson et al., 2006). The NAM and SAM are defined as zonal indices: NAM as the difference in zonal mean
SLP at 35°N and 65°N (Li and Wang, 2003) and SAM as the difference in zonal mean SLP at 40°S and 65°S (Gong and Wang, 1999). All indices have been centred to have zero
time mean from 1861–1900. Comparison of simulated and observed trends from 1961–2011 is shown in Figure 10.13.

1246
Chapter 14 Climate Phenomena and their Relevance for Future Regional Climate Change
14
The physical mechanisms of the SAM are well understood, and the
SAM is well represented in climate models, although the detailed spa-
tial and temporal characteristics vary between models (Raphael and
Holland, 2006). In the past few decades the SAM index has exhibited
a positive trend in austral summer and autumn (Figure 14.16, Mar-
shall, 2007; Jones et al., 2009b), a change attributed to the effects of
ozone depletion and, to a lesser extent, the increase in GHGs (Thomp-
son et al., 2011, see also Section 10.3.3.3). It is likely that these two
factors will continue to be the principal drivers into the future, but
as the ozone hole recovers they will be competing to push the SAM
in opposite directions (Arblaster et al., 2011; Thompson et al., 2011;
Bracegirdle et al., 2013), at least during late austral spring and summer,
when ozone depletion has had its greatest impact on the SAM. The
SAM is also influenced by teleconnections to the tropics, primarily
associated with ENSO (Carvalho et al., 2005; L’Heureux and Thompson,
2006). Changes to the tropical circulation, and to such teleconnections,
as the climate warms could further affect SAM variability (Karpechko
et al., 2010). See Supplementary Material Section 14.SM.3.1 for further
details on the observed variability of SAM.
The CMIP3 models projected a continuing positive trend in the SAM in
both summer and winter (Miller et al., 2006). However, those models
generally had poor simulations of stratospheric ozone, and tended to
underestimate natural variability and to misrepresent observed trends
in the SAM, indicating that care should be taken in interpretation of
their future SAM projections (Fogt et al., 2009). Arblaster et al. (2011)
showed that there can be large differences in the sensitivity of these
models to CO
2
increases, which affects their projected trends in the
SAM.
Since the AR4 a number of chemistry–climate models (CCMs) have
been run that have fully interactive stratospheric chemistry, although
unlike coupled atmosphere ocean models they are usually not coupled
to the oceans (see also Sections 9.1.3.2.8 and 9.4.6.2). The majority
of CCMs and coupled models, which generally compare well to rea-
nalyses (Gerber et al., 2010) although many exhibit biases in their
placement of the SH eddy-driven jet (Wilcox et al., 2012; Bracegirdle
et al., 2013), indicate that through to at least the mid-21st century
the current observed SAM changes are neutralized or reversed during
austral summer (Perlwitz et al., 2008; Son et al., 2010; Polvani et al.,
2011; Bracegirdle et al., 2013). Figure 14.16 shows the projected
ensemble-mean future SAM index evolution during DJF from a suite of
CMIP5 models, suggesting that the recent positive trend will weaken
considerably as stratospheric ozone concentrations recover over south-
ern high latitudes.
Projected 21st century changes in the SAM, and the closely associated
SH eddy-driven jet position, vary by season (Gillett and Fyfe, 2013),
and are sensitive to the rate of ozone recovery (Son et al., 2010; Eyring
et al., 2013) and to GHG emissions scenario (Swart and Fyfe, 2012;
Eyring et al., 2013). In the RCP2.6 scenario, with small increases in
GHGs, ozone recovery may dominate in austral summer giving a small
projected equatorward jet shift (Eyring et al., 2013) with little change
in the annual mean jet position (Swart and Fyfe, 2012). In RCP8.5 large
GHG increases are expected to dominate, giving an ongoing poleward
shift of the SH jet in all seasons (Swart and Fyfe, 2012; Eyring et al.,
2013). In RCP4.5 the influences of ozone recovery and GHG increas-
es are expected to approximately balance in austral summer, with an
ongoing poleward jet shift projected in the other seasons (Swart and
Fyfe, 2012; Eyring et al., 2013; Gillett and Fyfe, 2013).
14.5.3 Assessment Summary
Future boreal wintertime NAO is very likely to exhibit large natural var-
iations and trend of similar magnitude to that observed in the past; is
very likely to be differ quantitatively from individual climate model pro-
jections; is likely to become slightly more positive (on average) due to
increases in GHGs. The austral summer/autumn positive trend in SAM
is likely to weaken considerably as ozone depletion recovers through to
the mid-21st century. There is medium confidence from recent studies
that projected changes in NAO and SAM are sensitive to boundary
processes, which are not yet well represented in many climate models
currently used for projections, for example, stratosphere-troposphere
interaction, ozone chemistry, solar forcing and atmospheric response
to Arctic sea ice loss. There is low confidence in projections of other
modes such as the NPO due to the small number of modelling studies.
Box 14.2 | Blocking
Atmospheric blocking is associated with persistent, slow-moving high-pressure systems that interrupt the prevailing westerly winds of
middle and high latitudes and the normal eastward progress of extratropical storm systems. Overall, blocking activity is more frequent
at the exit zones of the jet stream and shows appreciable seasonal variability in both hemispheres, reaching a maximum in winter–
spring and a minimum in summer–autumn (e.g., Wiedenmann et al., 2002). In the Northern Hemisphere (NH), the preferred locations
for winter blocking are the North Atlantic and North Pacific, whereas continental blocks are relatively more frequent in summer (Tyrlis
and Hoskins, 2008; Barriopedro et al., 2010). Southern Hemisphere (SH) blocking is less frequent than in the NH, and it tends to be
concentrated over the Southeast Pacific and the Indian Ocean (Berrisford et al., 2007).
Blocking is a complex phenomenon that involves large- and small-scale components of the atmospheric circulation, and their mutual
interactions. Although there is not a widely accepted blocking theory, transient eddy activity is considered to play an important role in
blocking occurrence and maintenance through feedbacks between the large-scale flow and synoptic eddies (e.g., Yamazaki and Itoh,
2009). (continued on next page)

1247
Climate Phenomena and their Relevance for Future Regional Climate Change Chapter 14
14
Box 14.2 (continued)
Blocking is an important component of intraseasonal variability in the extratropics and causes climate anomalies over large areas of
Europe (Trigo et al., 2004; Masato et al., 2012), North America (Carrera et al., 2004), East Asia (e.g., Wang et al., 2010; Cheung et al.,
2012), high-latitude regions of the SH (Mendes et al., 2008) and Antarctica (Massom et al., 2004; Scarchilli et al., 2011). Blocking can
also be responsible for extreme events (e.g., Buehler et al., 2011; Pfahl and Wernli, 2012), such as cold spells in winter (e.g., 2008 in
China, Zhou et al., 2009d; or 2010 in Europe, Cattiaux, 2010) and summer heat waves in the NH (e.g., 2010 in Russia, Matsueda, 2011;
Lupo et al., 2012) and in southern Australia (Pezza et al., 2008).
At interannual time scales, there are statistically significant relationships between blocking activity and several dominant modes of
atmospheric variability, such as the NAO (Section 14.5.1) and wintertime blocking in the Euro-Atlantic sector (Croci-Maspoli et al.,
2007a; Luo et al., 2010), the winter PNA (Section 14.7.1) and blocking frequency in the North Pacific (Croci-Maspoli et al., 2007a), or
the SAM (Section 14.5.2) and winter blocking activity near the New Zealand sector (Berrisford et al., 2007). Multi-decadal variability in
winter blocking over the North Atlantic and the North Pacific seem to be related, respectively, with the Atlantic Meridional Overturning
Circulation (AMOC; Häkkinen et al., 2011; Section 14.7.6) and the Pacific Decadal Oscillation (PDO; Chen and Yoon, 2002; Section
14.7.3), although this remains an open question.
Other important scientific issues related to the blocking phenomenon include the mechanisms of blocking onset and maintenance, two-
way interactions between blocking and stratospheric processes (e.g., Martius et al., 2009; Woollings et al., 2010), influence on blocking
of slowly varying components of the climate system (sea surface temperature (SST), sea ice, etc., Liu et al., 2012b), and external forcings.
The most consistent long-term observed trends in blocking for the second half of the 20th century are the reduced winter activity
over the North Atlantic (e.g., Croci-Maspoli et al., 2007b), which is consistent with the observed increasing North Atlantic Oscillation
(NAO) trend from the 1960s to the mid-1990s (Section 2.7.8), as well as an eastward shift of intense winter blocking over the Atlantic
and Pacific Oceans (Davini et al., 2012). The apparent decreasing trend in SH blocking activity (e.g., Dong et al., 2008) seems to be in
agreement with the upward trend in the SAM.
The AR4 (Section 8.4.5) reported a tendency for General Circulation Models (GCMs) to underestimate NH blocking frequency and per-
sistence, although most models were able to capture the preferred locations for blocking occurrence and their seasonal distributions.
Several intercomparison studies based on a set of CMIP3 models (Scaife et al., 2010; Vial and Osborn, 2012) revealed some progress
in the simulation of NH blocking activity, mainly in the North Pacific, but only modest improvements in the North Atlantic. In the SH,
blocking frequency and duration was also underestimated, particularly over the Australia–New Zealand sector (Matsueda et al., 2010).
CMIP5 models still show a general blocking frequency underestimation over the Euro-Atlantic sector, and some tendency to overesti-
mate North Pacific blocking (Section 9.5.2.2), with considerable inter-model spread (Box 14.2, Figure 1).
Model biases in the mean flow, rather than in variability, can explain a large part of the blocking underestimation and they are usually
evidenced as excessive zonality of the flow or systematic shifts in the latitude of the jet stream (Matsueda et al., 2010; Scaife et al.,
2011b; Barnes and Hartmann, 2012; Vial and Osborn, 2012; Anstey et al., 2013; Dunn-Sigouin and Son, 2013). Increasing the horizontal
resolution in atmospheric GCMs with prescribed SSTs has been shown to significantly reduce blocking biases, particularly in the Euro-At-
lantic sector and Australasian sectors (e.g., Matsueda et al., 2010; Jung et al., 2011; Dawson et al., 2012; Berckmans et al., 2013), while
North Pacific blocking could be more sensitive to systematic errors in tropical SSTs (Hinton et al., 2009). Also blocking biases are smaller
in those CMIP5 models with higher horizontal and vertical resolution (Anstey et al., 2013). However, the improvement of blocking sim-
ulation with increasing horizontal resolution is less clear in coupled models than in atmospheric GCMs with prescribed SSTs, indicating
that both SSTs and the relative coarse resolution in OGCM (Scaife et al., 2011b) are important causes of blocking biases.
Most CMIP3 models projected significant reductions in NH annual blocking frequency (Barnes et al., 2012), particularly during winter,
but CMIP5 models seem to indicate weaker decreases in the future (Dunn-Sigouin and Son, 2013) and a more complex response than
that reported for CMIP3 models, including possible regional increases of blocking frequency in summer (Cattiaux et al., 2013; Masato
et al., 2013). There is high agreement that winter blocking frequency over the North Atlantic and North Pacific will not increase under
enhanced GHG concentrations (Barnes et al., 2012; Dunn-Sigouin and Son, 2013). Future strengthening of the zonal wind and merid-
ional jet displacements may partially account for some of the projected changes in blocking frequency over the ocean basins of both
hemispheres (Matsueda et al., 2010; Barnes and Hartmann, 2012; Dunn-Sigouin and Son, 2013). Future trends in blocking intensity and
persistence are even more uncertain, with no clear signs of significant changes. How the location and frequency of blocking events will
evolve in future are both critically important for understanding regional climate change in particular with respect to extreme conditions
(e.g., Sillmann et al., 2011; de Vries et al., 2013). (continued on next page)
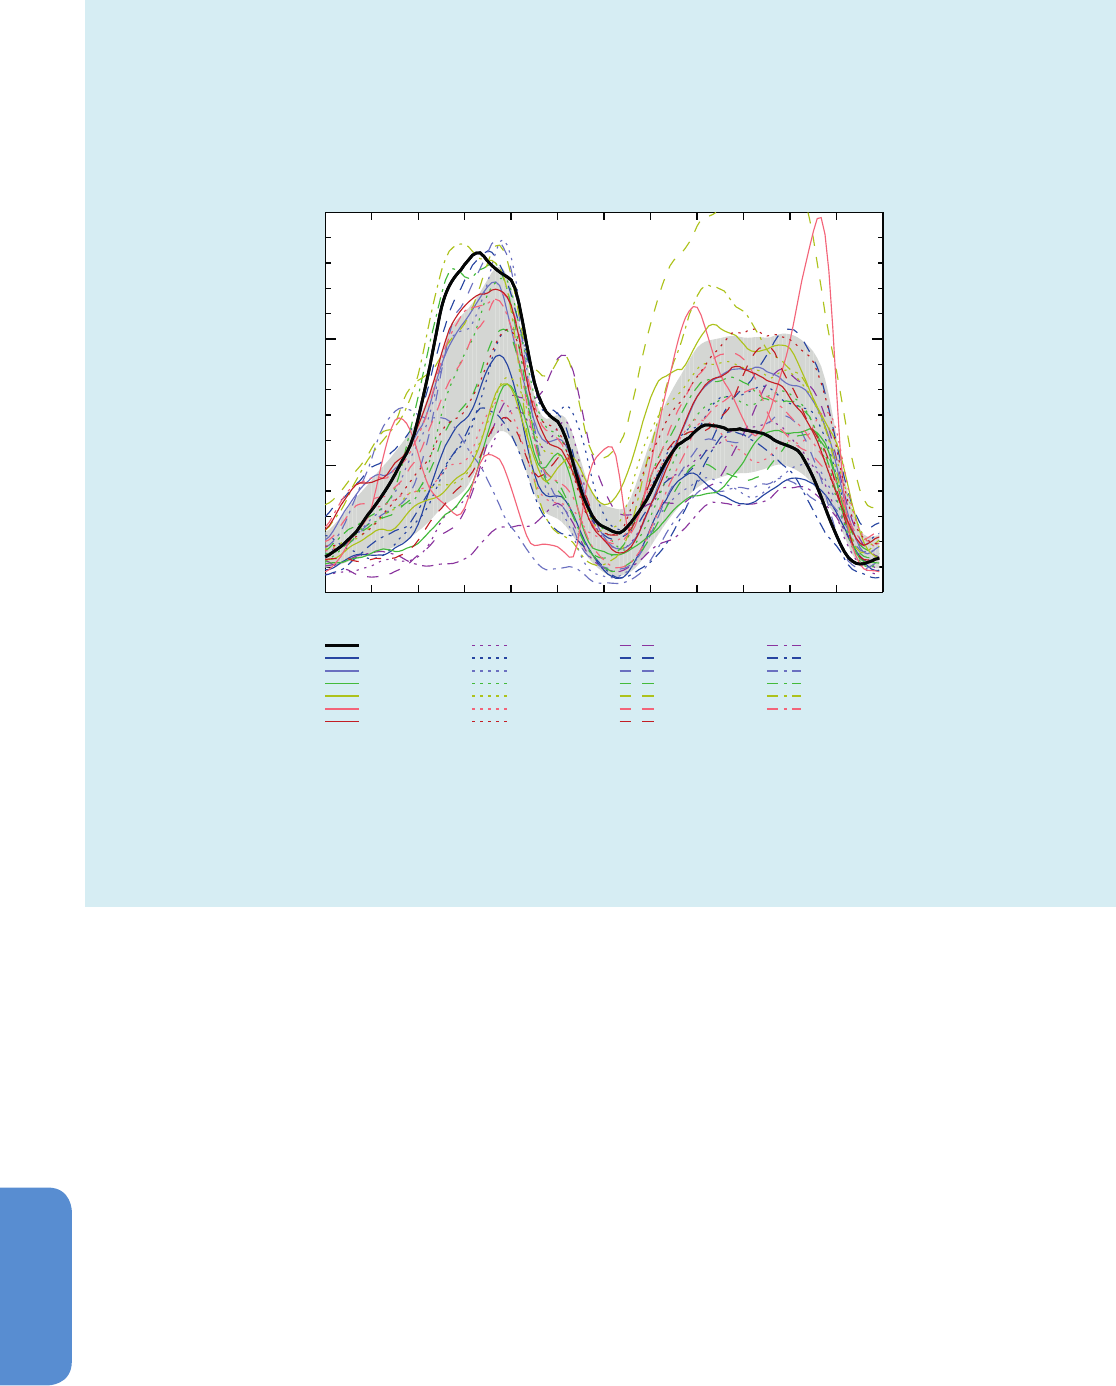
1248
Chapter 14 Climate Phenomena and their Relevance for Future Regional Climate Change
14
Box 14.2 (continued)
In summary, the increased ability in simulating blocking in some models indicate that there is medium confidence that the frequency of
NH and SH blocking will not increase, while trends in blocking intensity and persistence remain uncertain. The implications for blocking
related regional changes in North America, Europe and Mediterranean and Central and North Asia are therefore also uncertain [Box
14.2 and 14.8.3, 14.8.6, 14.8.8]
Box 14.2, Figure 1 | Annual mean blocking frequency in the NH (expressed in % of time, that is, 1% means about 4 days per year) as simulated by a set of CMIP5
models (colour lines) for the 1961–1990 period of one run of the historical simulation. Grey shading shows the mean model result plus/minus one standard deviation.
Black thick line indicates the observed blocking frequency derived from the National Centers for Environmental Prediction/National Center for Atmospheric Research
(NCEP/NCAR) reanalysis. Only CMIP5 models with available 500 hPa geopotential height daily data at http://pcmdi3.llnl.gov/esgcet/home.htm have been used. Block-
ing is defined as in Barriopedro et al. (2006), which uses a modified version of the(Tibaldi and Molteni, 1990) index. Daily data was interpolated to a common regular
2.5° × 2.5° longitude–latitude grid before detecting blocking.
CMIP5 models 1961-1990
-90 -60 -30 0 30 60 90 120 150 180 210 240 270
Longitude
0
5
10
15
Blocking frequency (%)
BCC-CSM1-1 BCC-CSM1-1-M BNU-ESM
CanESM2 CCSM4 CMCC-CM CMCC-CESM
CMCC-CMS CNRM-CM5 EC-EARTH FGOALS-g2
FGOALS-s2 GFDL-CM3 GFDL-ESM2M HadGEM2-CC
IPSL-CM5A-LR IPSL-CM5A-MR IPSL-CM5B-LR MIROC5
MIROC-ESM MIROC-ESM-CHEM MPI-ESM-MR MPI-ESM-LR
MPI-ESM-P MRI-CGCM3 NorESM1-M
REANALYSIS
14.6 Large-scale Storm Systems
14.6.1 Tropical Cyclones
The potential for regional changes in future tropical cyclone frequency,
track and intensity is of great interest, not just because of the associat-
ed negative effects, but also because tropical cyclones can play a major
role in maintaining regional water resources (Jiang and Zipser, 2010;
Lam et al., 2012; Prat and Nelson, 2012). Past and projected increases
in human exposure to tropical cyclones in many regions (Peduzzi et al.,
2012) heightens the interest further.
14.6.1.1 Understanding the Causes of Past and Projected
Regional Changes
Detection of past trends in measures of tropical cyclone activi-
ty is constrained by the quality of historical records and uncertain
quantification of natural variability in these measures (Knutson et al.,
2010; Lee et al., 2012; Seneviratne et al., 2012). Observed regional cli-
mate variability generally represents a complex convolution of natural
and anthropogenic factors, and the response of tropical cyclones to
each factor is not yet well understood (see also Section10.6.1.5 and
Supplementary Material Section 14.SM.4.1.2). For example, the steady
long-term increase in tropical Atlantic SST due to increasing GHGs can
be dominated by shorter-term decadal variability forced by both exter-
nal and internal factors (Mann and Emanuel, 2006; Baines and Folland,
2007; Evan et al., 2009, 2011a; Ting et al., 2009; Zhang and Delworth,
2009; Chang et al., 2011; Solomon and Newman, 2011; Booth et al.,
2012; Camargo et al., 2012; Villarini and Vecchi, 2012). Similarly, tropi-
cal upper-tropospheric temperatures, which modulate tropical cyclone
potential intensity (Emanuel, 2010), can be forced by slowly evolving
changes in the stratospheric circulation of ozone (Brewer–Dobson
circulation) due to climate change with occasional large amplitude
and persistent changes forced by volcanic eruptions (Thompson and

1249
Climate Phenomena and their Relevance for Future Regional Climate Change Chapter 14
14
Solomon, 2009; Evan, 2012). This convolution of anthropogenic and
natural factors, as represented in a climate model, has also been shown
to be useful in prediction of Atlantic tropical storm frequency out to a
few years (Smith et al., 2010).
In addition to greenhouse warming scenarios, tropical cyclones can
also respond to anthropogenic forcing via different and possibly unex-
pected pathways. For example, increasing anthropogenic emissions of
black carbon and other aerosols in South Asia has been linked to a
reduction of SST gradients in the Northern Indian Ocean (Chung and
Ramanathan, 2006; Meehl et al., 2008), which has in turn been linked
to a weakening of the vertical wind shear in the region. Evan et al.
(2011b) linked the reduced wind shear to the observed increase in the
number of very intense storms in the Arabian Sea, including five very
severe cyclones that have occurred since 1998, but the fundamental
cause of this proposed linkage is not yet certain (Evan et al., 2012;
Wang et al., 2012a). Furthermore, it is possible that a substantial part
of the multi-decadal variability of North Atlantic SST is radiatively
forced, via the cloud albedo effect, by what are essentially pollution
aerosols emitted from North America and Europe (Baines and Folland,
2007; Booth et al., 2012), although the relative contribution of this
forcing to the observed variability has been questioned (Zhang et al.,
2013b). Note that in the North Atlantic, the evidence suggests that the
reduction of pollution aerosols is linked to tropical SST increases, while
in the northern Indian Ocean, increases in aerosol pollution have been
linked to reduced vertical wind shear. Both of these effects (increasing
SST and reduced shear) have been observed to be related to increased
tropical cyclone activity.
Finally, in addition to interannual-to-multi-decadal forcing of tropi-
cal Atlantic SST via radiative dimming (Evan et al., 2009; Evan et al.,
2011a), dust aerosols have a large and more immediate in situ effect
on the regional thermodynamic and kinematic environment (Dunion
and Marron, 2008; Dunion, 2011), and Saharan dust storms—whose
frequency has been linked to atmospheric CO
2
concentration (Mahow-
ald, 2007)—have also been linked to reduced strengthening of tropical
cyclones (Dunion and Velden, 2004; Wu, 2007). Direct in situ relation-
ships have also been identified between aerosol pollution concentra-
tions and tropical cyclone structure and intensity (Khain et al., 2008,
2010; Rosenfeld et al., 2011). Thus, when assessing changes in tropical
cyclone activity, it is clear that detection and attribution aimed simply
at long-term linear trends forced by increasing well-mixed GHGs is not
adequate to provide a complete picture of the potential anthropogenic
contributions to the changes in tropical cyclone activity that have been
observed (Section 10.6).
14.6.1.2 Regional Numerical Projections
Similar to observational analyses, confidence in numerical simulations
of tropical cyclone activity (Supplementary Material Tables 14.SM.1
to 14.SM.4) is reduced when model spatial domain is reduced from
global to region-specific (IPCC SREX Box 3.2; see also Section 9.5.4.3).
The assessment provided by Knutson et al. (2010) of projections based
on the SRES A1B scenario concluded that it is likely that the global
frequency of tropical cyclones will either decrease or remain essential-
ly unchanged while mean intensity (as measured by maximum wind
speed) increases by +2 to +11% and tropical cyclone rainfall rates
increase by about 20% within 100 km of the cyclone centre. However,
inter-model differences in regional projections lead to lower confidence
in basin-specific projections, and confidence is particularly low for pro-
jections of frequency within individual basins. For example, a recent
study by Ying et al. (2012) showed that numerical projections of 21st
century changes in tropical cyclone frequency in the western North
Pacific range broadly from –70% to +60%, while there is better model
agreement in measures of mean intensity and precipitation, which are
projected to change in the region by –3% to +18% and +5% to +30%,
respectively. The available modelling studies that are capable of pro-
ducing very strong cyclones typically project substantial increases in
the frequency of the most intense cyclones and it is more likely than
not that this increase will be larger than 10% in some basins (Emanuel
et al., 2008; Bender et al., 2010; Knutson et al., 2010, 2013; Yamada
et al., 2010; Murakami et al., 2012). It should be emphasized that this
metric is generally more important to physical and societal impacts
than overall frequency or mean intensity.
As seen in Tables 14.SM.1 to 14.SM.4 of the Supplementary Material,
as well as the previous assessments noted above, model projections
often vary in the details of the models and the experiments performed,
and it is difficult to objectively assess their combined results to form a
consensus, particularly by region. It is useful to do this after normaliz-
ing the model output using a combination of objective and subjective
expert judgements. The results of this are shown in Figure14.17, and
are based on a subjective normalization of the model output to four
common metrics under a common future scenario projected through
the 21st century. The global assessment is essentially the same as
Knutson et al. (2010) and the assessment of projections in the west-
ern North Pacific is essentially unchanged from Ying et al. (2012). The
annual frequency of tropical cyclones is generally projected to decrease
or remain essentially unchanged in the next century in most regions
although as noted above, the confidence in the projections is lower
in specified regions than global projections. The decrease in storm
frequency is apparently related to a projected decrease of upward
deep convective mass flux and increase in the saturation deficit of
the middle troposphere in the tropics associated with global warming
(Bengtsson et al., 2007; Emanuel et al., 2008, 2012; Zhao et al., 2009;
Held and Zhao, 2011; Murakami et al., 2012; Sugi et al., 2012; Sugi and
Yoshimura, 2012).
A number of experiments that are able to simulate intense tropical
cyclones project increases in the frequency of these storms in some
regions, although there are presently only limited studies to assess and
there is insufficient data to draw from in most regions to make a con-
fident assessment (Figure 14.17). Confidence is somewhat better in
the North Atlantic and western North Pacific basins where an increase
in the frequency of the strongest storms is more likely than not. The
models generally project an increase in mean lifetime-maximum inten-
sity of simulated storms (Supplementary Material Table 14.SM.3),
which is consistent with a projected increase in the frequency in the
more intense storms (Elsner et al., 2008). The projected increase in
intensity concurrent with a projected decrease in frequency can be
argued to result from a difference in scaling between projected chang-
es in surface enthalpy fluxes and the Clausius–Clapeyron relationship
associated with the moist static energy of the middle troposphere
(Emanuel et al., 2008). The increase in rainfall rates associated with
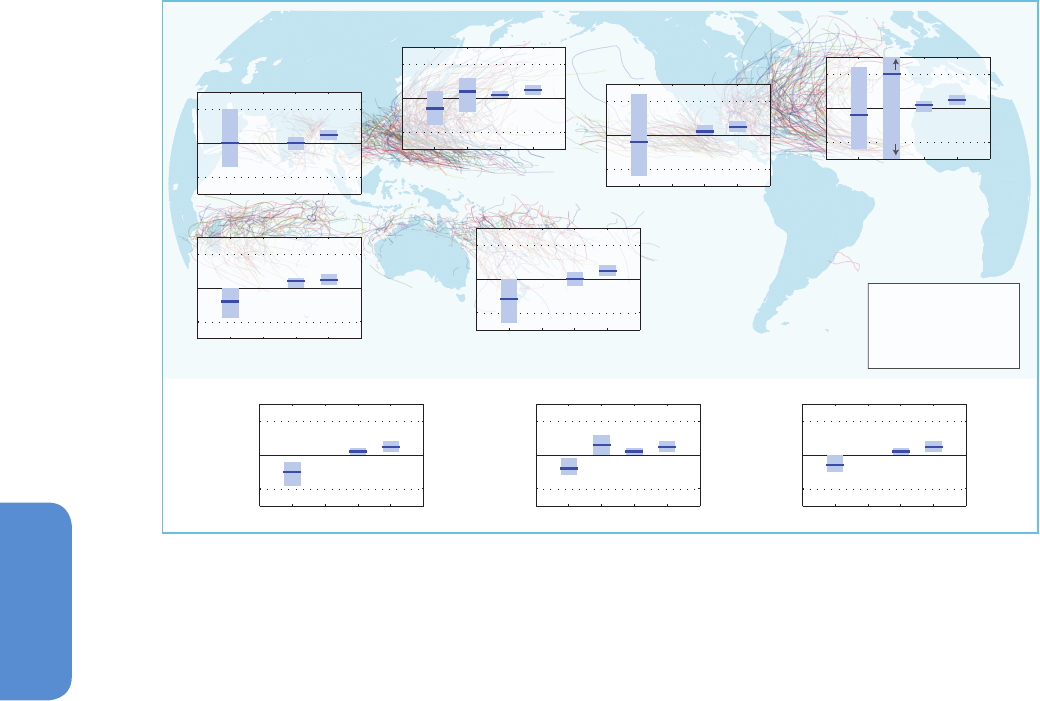
1250
Chapter 14 Climate Phenomena and their Relevance for Future Regional Climate Change
14
tropical cyclones is a consistent feature of the numerical models under
greenhouse warming as atmospheric moisture content in the tropics
and tropical cyclone moisture convergence is projected to increase
(Trenberth et al., 2005, 2007a; Allan and Soden, 2008; Knutson et al.,
2010, 2013). Although no broad-scale, detectable long-term changes in
tropical cyclone rainfall rates have been reported, preliminary evidence
for a detectable anthropogenic increase in atmospheric moisture con-
tent over ocean regions has been reported by Santer et al. (2007).
A number of studies since the AR4 have attempted to project future
changes in tropical cyclone tracks and genesis at inter- or intra-ba-
sin scale (Leslie et al., 2007; Vecchi and Soden, 2007b; Emanuel et al.,
2008; Yokoi and Takayabu, 2009; Zhao et al., 2009; Li et al., 2010b;
Murakami and Wang, 2010; Lavender and Walsh, 2011; Murakami
et al., 2011a, 2013). These studies suggest that projected changes in
tropical cyclone activity are strongly correlated with projected changes
in the spatial pattern of tropical SST (Sugi et al., 2009; Chauvin and
Royer, 2010; Murakami et al., 2011b; Zhao and Held, 2012) and asso-
ciated weakening of the Pacific Walker Circulation (Vecchi and Soden,
2007a), indicating that reliable projections of regional tropical cyclone
activity depend critically on the reliability of the projected pattern of
SST changes. However, assessing changes in regional tropical cyclone
frequency is still limited because confidence in projections critically
depend on the performance of control simulations (Murakami and
Sugi, 2010), and current climate models still fail to simulate observed
temporal and spatial variations in tropical cyclone frequency (Walsh et
al., 2012). As noted above, tropical cyclone genesis and track variability
is modulated in most regions by known modes of atmosphere–ocean
variability. The details of the relationships vary by region (e.g., El Niño
events tend to cause track shifts in western North Pacific typhoons and
tend to suppress Atlantic storm genesis and development). Similarly,
it has been demonstrated that accurate modelling of tropical cyclone
activity fundamentally depends on the model’s ability to reproduce
these modes of variability (e.g., Yokoi and Takayabu, 2009). Reliable
projections of future tropical cyclone activity, both global and region-
al, will then depend critically on reliable projections of the behaviour
of these modes of variability (e.g., ENSO) under global warming, as
well as an adequate understanding of their physical links with tropical
cyclones. At present there is still uncertainty in their projected behav-
iours (e.g., Section 14.4).
The reduction in signal-to-noise ratio that accompanies changing focus
from global to regional scales also lengthens the emergence time
scale (i.e., the time required for a trend signal to rise above the nat-
ural variability in a statistically significant way). Based on changes in
tropical cyclone intensity predicted by idealized numerical simulations
with carbon dioxide (CO
2
)-induced tropical SST warming, Knutson and
Tuleya (2004) suggested that clearly detectable increases may not be
manifest for decades to come. The more recent high-resolution dynam-
ical downscaling study of Bender et al. (2010) supports this argument
and suggests that the predicted increases in the frequency of the
strongest Atlantic storms may not emerge as a statistically significant
signal until the latter half of the 21st century under the SRES A1B emis-
sionscenario. However, regional forcing by agents other than GHGs,
Tropical Cyclone (TC) Metrics:
I All TC frequency
II Category 4-5 TC frequency
III Lifetime Maximum Intensity
IV Precipitation rate
insf. d.insf. d.
I II IIII IV
−50
0
50
% Change
North Indian
insf. d.
I II IIII IV
−50
0
50
% Change
Eastern North Pacific
insf. d.
I II IIII IV
−50
0
50
% Change
South Indian
insf. d.
I II IIII IV
−50
0
50
% Change
Western North Pacific
I II IIII IV
−50
0
50
% Change
South Pacific
insf. d.
I II IIII IV
−50
0
50
% Change
North Atlantic
200 %
-100 %
I II IIII IV
−50
0
50
% Change
GLOBAL
I II IIII IV
−50
0
50
% Change
SOUTHERN HEMISPHERE
insf. d.
I II IIII IV
−50
0
50
% Change
NORTHERN HEMISPHERE
insf. d.
Figure 14.17 | General consensus assessment of the numerical experiments described in Supplementary Material Tables 14.SM.1 to 14.SM.4. All values represent expected percent
change in the average over period 2081–2100 relative to 2000–2019, under an A1B-like scenario, based on expert judgement after subjective normalization of the model projections.
Four metrics were considered: the percent change in (I) the total annual frequency of tropical storms, (II) the annual frequency of Category 4 and 5 storms, (III) the mean Lifetime
Maximum Intensity (LMI; the maximum intensity achieved during a storm’s lifetime) and (IV) the precipitation rate within 200 km of storm centre at the time of LMI. For each metric
plotted, the solid blue line is the best guess of the expected percent change, and the coloured bar provides the 67% (likely) confidence interval for this value (note that this interval
ranges across –100% to +200% for the annual frequency of Category 4 and 5 storms in the North Atlantic). Where a metric is not plotted, there are insufficient data (denoted ‘insf.
d.’) available to complete an assessment. A randomly drawn (and coloured) selection of historical storm tracks are underlain to identify regions of tropical cyclone activity.

1251
Climate Phenomena and their Relevance for Future Regional Climate Change Chapter 14
14
such as anthropogenic aerosols, is known to affect the regional climat-
ic conditions differently (e.g., Zhang and Delworth, 2009), and there
is evidence that tropical cyclone activity may have changed in some
regions because of effects from anthropogenic aerosol pollution. The
fidelity of the emergence time scales projected under A1B warming
thus depends on the fidelity of A1B aerosol projections, which are
known to be uncertain (Forster et al., 2007; Haerter et al., 2009).
14.6.2 Extratropical Cyclones
Some agreement on the response of storm tracks to anthropogenic
forcing started to emerge in the climate model projections from CMIP3,
with many models projecting a poleward shift of the storm tracks (Yin,
2005) and an expansion of the tropics (Lu et al., 2007). As stated in AR4
(Meehl et al., 2007) this response is particularly clear in the SH, but less
clear in the NH. Although clearer in zonal mean responses (Yin, 2005),
regional responses at different longitudes differ widely from this in
many models (Ulbrich et al., 2008). There is a strong two-way coupling
between storm tracks and the large-scale circulation (Lorenz and Hart-
mann, 2003; Robinson, 2006; Gerber and Vallis, 2007), which results in
associated shifts in storm tracks and westerly jet streams (Raible, 2007;
Athanasiadis et al., 2010).
14.6.2.1 Process Understanding of Future Changes
Future storm track change is the result of several different competing
dynamical influences (Held, 1993; O’Gorman, 2010; Woollings, 2010).
It is becoming apparent that the relatively modest storm track response
in many models reflects the partial cancelling of opposing tendencies
(Son and Lee, 2005; Lim and Simmonds, 2009; Butler et al., 2010).
One of the most important factors is the change in the meridional
temperature gradient from which ETCs draw most of their energy.
This gradient is projected to increase in the upper troposphere due to
tropical amplification and decrease in the lower troposphere due to
polar amplification, and it is still unclear whether this will lead to an
overall increase or decrease in ETC activity. The projected response can
involve an increase in eddy activity at upper levels and a decrease at
lower levels (Hernandez-Deckers and von Storch, 2010), although in
other models changes in low level eddy activity are more in line with
the upper level wind changes (Mizuta et al., 2011; Wu et al., 2011;
Mizuta, 2012). The projected warming pattern also changes vertical
temperature gradients leading to increased stability at low latitudes
and decreased stability at higher latitudes, and there is some modelling
evidence that this may be a strong factor in the response (Lu et al.,
2008, 2010; Kodama and Iwasaki, 2009; Lim and Simmonds, 2009).
Increasing depth of the troposphere might also be important for future
changes (Lorenz and DeWeaver, 2007).
Uncertainties in the projections of large-scale warming contribute to
uncertainty in the storm track response (Rind, 2008). Several mecha-
nisms have been proposed to explain how the storm tracks respond to
the large-scale changes, including changes in eddy phase speed (Chen
et al., 2007, 2008; Lu et al., 2008), eddy source regions (Lu et al., 2010)
and eddy length scales (Kidston et al., 2011) with a subsequent effect
on wave-breaking characteristics (Riviere, 2011). Furthermore, changes
in the large-scale warming might also be partly due to changes in the
storm tracks due to the two-way coupling between storm tracks and
the large-scale flow. However, there is evidence that the amplitude of
the tropical and polar warming are largely determined by atmospheric
poleward heat fluxes set by local processes (Hwang and Frierson, 2010).
Local processes could prove important for the storm track response
in certain regions, for example, sea ice loss (Kvamsto et al., 2004; Sei-
erstad and Bader, 2009; Deser et al., 2010c; Bader et al., 2011) and
spatial changes in SSTs (Graff and LaCasce, 2012). Local land–sea con-
trast in warming also has a local influence on baroclinicity along the
eastern continental coastlines (Long et al., 2009; McDonald, 2011). It is
not clear how the storm track responds to multiple forcings with some
studies suggesting a linear response (Lim and Simmonds, 2009) while
others suggest more complex interaction (Butler et al., 2010).
The projected increase in moisture content in a warmer atmosphere is
also likely to have competing effects. Latent heating has been shown
to play a role in invigorating individual ETCs, especially in the down-
stream development over eastern ocean (Dacre and Gray, 2009; Fink
et al., 2009, 2012). However, there is evidence that the overall effect of
moistening is to weaken ETCs by improving the efficiency of poleward
heat transport and hence reducing the dry baroclinicity (Frierson et al.,
2007; O’Gorman and Schneider, 2008; Schneider et al., 2010; Lucarini
and Ragone, 2011). Consistent with this, studies have shown that pre-
cipitation is projected to increase in ETCs despite no increase in wind
speed intensity of ETCs (Bengtsson et al., 2009; Zappa et al., 2013b).
14.6.2.2 Regional Projections
Large-scale projections of ETCs are assessed in Section 12.4.4.3. This
section complements this by presenting a more detailed assessment of
regional changes.
Individual model projections of regional storm track changes are often
comparable with the magnitude of interannual natural variability and
so the changes are expected to be relevant for regional climate. How-
ever, the magnitude of the response is model dependent at any given
location, especially over land (Harvey et al., 2012). There is also disa-
greement between different cyclone/storm track identification meth-
ods, even when applied to the same data (Raible et al., 2008; Ulbrich
et al., 2009), although in the response to anthropogenic forcing, these
differences appear mainly in the statistics of weak cyclones (Ulbrich et
al., 2013). Conversely, when the same method is applied to different
models the spread between the model responses is often larger than
the ensemble mean response, especially in the NH (Ulbrich et al., 2008;
Laine et al., 2009).
The poleward shift of the SH storm track remains one of the most
reproducible projections, yet even here there is considerable quan-
titative uncertainty. This is partly associated with the varied model
biases in jet latitude (Kidston and Gerber, 2010) although factors such
as the varied cloud response may play a role (Trenberth and Fasullo,
2010). Many models project a similar poleward shift in the North
Pacific (Bengtsson et al., 2006; Ulbrich et al., 2008; Catto et al., 2011),
although this is often weaker compared to natural variability and often
varies considerably between ensemble members (Pinto et al., 2007;
McDonald, 2011). Poleward shifts are generally less clear at the surface
than in the upper troposphere (Yin, 2005; McDonald, 2011; Chang et

1252
Chapter 14 Climate Phenomena and their Relevance for Future Regional Climate Change
14
al., 2012), which reduces their relevance for regional impacts. However,
a shift in extreme surface winds is still detectable in the zonal mean,
especially in the subtropics and the southern high latitudes (Gastineau
and Soden, 2009). A weakening of the Mediterranean storm track is a
particularly robust response (Pinto et al., 2007; Loeptien et al., 2008;
Ulbrich et al., 2009; Donat et al., 2011) for which increasing static
stability is important (Raible et al., 2010). In general, the storm track
response in summer is weaker than in winter with less consistency
between models (Lang and Waugh, 2011).
The response of the North Atlantic storm track is more complex than a
poleward shift in many models, with an increase in storm activity and a
downstream extension of the storm track into Europe (Bengtsson et al.,
2006; Pinto et al., 2007; Ulbrich et al., 2008; Catto et al., 2011; McDon-
ald, 2011). In some models this regional response is important (Ulbrich
et al., 2009), with storm activity over Western Europe increasing by
50% (McDonald, 2011) or by an amount comparable to the natural
variability (Pinto et al., 2007; Woollings et al., 2012). The return periods
of intense cyclones are shortened (Della-Marta and Pinto, 2009) with
impact on potential wind damage (Leckebusch et al., 2007; Donat et
al., 2011) and economic losses (Pinto et al., 2012). This response is
related to the local minimum in warming in the North Atlantic ocean,
which serves to increase the meridional temperature gradient on its
southern side (Laine et al., 2009; Catto et al., 2011). The minimum in
warming arises due to the weakening of northward ocean heat trans-
ports by the Atlantic Meridional Overturning Circulation (AMOC),
and the varying AMOC responses of the models can account for a
large fraction of the variance in the Atlantic storm track projections
(Woollings et al., 2012). CMIP5 models show a similar, albeit weaker
extension of the storm track towards Europe, flanked by reductions in
cyclone activity on both the northern and southern sides (Harvey et al.,
2012; Zappa et al., 2013b). Despite large biases in the mean state, the
model responses were found to agree with one another within sam-
pling variation caused by natural variability (Sansom et al., 2013). Colle
et al. (2013) noted similar reductions but also found that the higher
resolution CMIP5 models gave more realistic ETC performance in the
historical period. The best 7 models were found to give projections of
increased 10 to 20% increase in cyclone track density over the eastern
USA, including 10 to 40% more intense (<980 hPa) cyclones.
There is general agreement that there will be a small global reduction
in ETC numbers (Ulbrich et al., 2009). In individual regions there can
be much larger changes which are comparable to natural variations,
but these changes are not reproduced by the majority of the models
(e.g., Donat et al., 2011). ETC intensities are particularly sensitive to the
method and quantity used to define them, so there is little consensus
on changes in intensity (Ulbrich et al., 2009). While there are indica-
tions that the absolute values of pressure minima deepen in future
scenario simulations (Lambert and Fyfe, 2006), this is often associated
with large-scale pressure changes rather than changes in the pres-
sure gradients or winds associated with ETCs (Bengtsson et al., 2009;
Ulbrich et al., 2009; McDonald, 2011). The CMIP5 model projections
show little evidence of change in the intensity of winds associated with
ETCs (Zappa et al., 2013b).
There are systematic storm track biases common to many models,
which might have some influence on the projected storm track
response to forcing (Chang et al., 2012). Some models with improved
representation of the stratosphere have shown a markedly different
circulation response in the NH, with consequences for Atlantic/Euro-
pean storm activity in particular (Scaife et al., 2011a). Concerns over
the skill of many models in representing both the stratosphere and the
ocean mean that confidence in NH storm track projections remains
low. Higher horizontal resolution can improve ETC representation, yet
there are still relatively few high-resolution global models which have
been used for storm track projections (Geng and Sugi, 2003; Bengtsson
et al., 2009; Catto et al., 2011; Colle et al., 2013; Zappa et al., 2013a).
Several studies have used RCMs to simulate storms at high resolu-
tion in particular regions. In multi-model experiments over Europe, the
ETC response is more sensitive to the choice of driving GCM than the
choice of RCM (Leckebusch et al., 2006; Donat et al., 2011), highlight-
ing the importance of large-scale circulation uncertainties. There has
been little work on potential changes to mesoscale storm systems,
although it has been suggested that polar lows may reduce in frequen-
cy due to an increase in static stability (Zahn and von Storch, 2010).
Higher resolution runs of one climate model also suggest an increase
in intensity of autumn ETCs due to increased transitioning of Atlantic
hurricanes (Haarsma et al., 2013).
14.6.3 Assessment Summary
The influence of past and future climate change on tropical cyclones is
likely to vary by region, but the specific characteristics of the changes
are not yet well understood, and the substantial influence of ENSO
and other known climate modes on global and regional tropical
cyclone activity emphasizes the need for more reliable assessments of
future changes in the characteristics of these modes. Recent advanc-
es in understanding and phenomenological evidence for shorter-term
effects on tropical cyclones from aerosol forcing are providing increas-
ingly greater confidence that anthropogenic forcing has had a measur-
able effect on tropical cyclone activity in certain regions. Shorter term
increases such as those observed in the Atlantic over the past 30 to 40
years appear to be robust and have been hypothesized to be related, in
part, to regional external forcing by GHGs and aerosols, but the more
steady century-scale trends that may be expected from CO
2
forcing
alone are much more difficult to assess given the data uncertainty in
the available tropical cyclone records.
Although projections under 21st century greenhouse warming indicate
that it is likely that the global frequency of tropical cyclones will either
decrease or remain essentially unchanged, concurrent with a likely
increase in both global mean tropical cyclone maximum wind speed
and rainfall rates, there is low confidence in region-specific projections
of frequency and intensity. Still, based on high-resolution modelling
studies, the frequency of the most intense storms, which are associ-
ated with particularly extensive physical effects, will more likely than
not increase substantially in some basins under projected 21st century
warming and there is medium confidence that tropical cyclone rainfall
rates will increase in every affected region.
The global number of ETCs is unlikely to decrease by more than a few
percent due to anthropogenic change. A small poleward shift is likely
in the SH storm track, but the magnitude is model dependent. There
is only medium confidence in projections of storm track shifts in the

1253
Climate Phenomena and their Relevance for Future Regional Climate Change Chapter 14
14
Northern Hemisphere. Nevertheless, model results suggests that it is
more likely than not that the N. Pacific storm track will shift poleward,
and that it is unlikely that the N. Atlantic storm track will respond with
a simple poleward shift. There is low confidence in the magnitude
of regional storm track changes, and the impact of such changes on
regional surface climate.
14.7 Additional Phenomena of Relevance
14.7.1 Pacific–South American Pattern
The PSA pattern is a teleconnection from the tropics to SH extratrop-
ics through Rossby wave trains (Box 2.5). This pattern induces atmos-
pheric circulation anomalies over South America, affecting extreme
precipitation (Drumond and Ambrizzi, 2005; Cunningham and Cav-
alcanti, 2006; Muza et al., 2009; Vasconcellos and Cavalcanti, 2010).
PSA trends for recent decades depend on the choice of indices and are
hence uncertain (Section 2.7.8). The PSA pattern is reproduced in many
model simulations (Solman and Le Treut, 2006; Vera and Silvestri, 2009;
Bates, 2010; Rodrigues et al., 2011; Cavalcanti and Shimizu, 2012).
The intensification and westward displacement of the PSA wave pat-
tern in projections of CMIP3 may be related to the increase in frequen-
cy and intensity of positive SST anomalies in the tropical Pacific by the
end of the 21st century (2081–2100, Junquas et al., 2012). These per-
turbations of the PSA characteristics are linked with changes in SACZ
dipole precipitation and affect South America precipitation (Section
14.3.1.3). The PSA pattern occurrence and implications for precipita-
tion increase in the southeastern South America have been associated
with the zonally asymmetric part of the global SST change in the equa-
torial Indian–western Pacific Oceans (Junquas et al., 2013).
Process understanding of the formation of the PSA gives medium con-
fidence that future changes in the mean atmospheric circulation for
austral summer will project on the PSA pattern thereby influencing the
SACZ and precipitation over southeastern South America. However, the
literature is not sufficient to assess more general changes in PSA, and
confidence is low in its future projections.
14.7.2 Pacific–North American Pattern
The PNA pattern, as defined in Box 2.5, Table 1 and portrayed in Box
2.5, Figure 2 is a prominent mode of atmospheric variability over the
North Pacific and the North American land mass. This phenomenon
exerts notable influences on the temperature and precipitation varia-
bility in these regions (e.g., Nigam, 2003). The PNA pattern is related to
ENSO events in the tropical Pacific (see Section 14.4), and also serves
as a bridge linking ENSO and NAO variability (see Li and Lau, 2012).
The data records indicate a significant positive trend in the wintertime
PNA index over the past 60 years (see Table 2.14 and Box 2.5, Figure 1).
Stoner et al. (2009) have assessed the capability of 22 CMIP3 GCMs
in replicating the essential aspects of the observed PNA pattern. Their
results indicate that a majority of the models overestimate the fraction
of variance explained by the PNA pattern, and that the spatial charac-
teristics of PNA patterns simulated in 14 of the 22 models are in good
agreement with the observations. The model-projected future evolu-
tion of the PNA pattern has not yet been fully assessed and therefore
confidence in its future development is low.
14.7.3 Pacific Decadal Oscillation/Inter-decadal
Pacific Oscillation
The Pacific Decadal Oscillation (PDO, Box 2.5) refers to the leading
Empirical Orthogonal Function (EOF) of monthly SST anomalies over
the North Pacific (north of 20°N) from which the globally averaged
SST anomalies have been subtracted (Mantua et al., 1997). It exhibits
anomalies of one sign along the west coast of North America and of
opposite sign in the western and central North Pacific (see also Sec-
tion 9.5.3.6 and Chapter 11). The PDO is closely linked to fluctuations
in the strength of the wintertime Aleutian Low Pressure System. The
time scale of the PDO is around 20 to 30 years, with changes of sign
between positive and negative polarities in the 1920s, the late 1940s,
the late 1970s and around 2000.
The extension of the PDO to the whole Pacific basin is known as the
Inter-decadal Pacific Oscillation (IPO, Power et al., 1999). The IPO is
nearly identical in form to the PDO in the NH but is defined globally, as
a leading EOF (principal component) of 13-year lowpass-filtered global
SST anomalies (Parker et al., 2007) and has substantial amplitude in
the tropical and southern Pacific. The time series of the PDO and IPO
correlate highly on an annual basis. The PDO/IPO pattern is considered
to be the result of internal climate variability (Schneider and Cornuelle,
2005; Alexander, 2010) and has not been observed to exhibit a long-
term trend. The PDO/IPO is associated with ENSO modulations, with
more El Niño activity during the positive PDO/IPO and more La Niña
activity during the negative PDO/IPO.
At the time of the AR4, little had been published on modelling of the
PDO/IPO or of its evolution in future. In a recent study, Furtado et al.
(2011) found that the PDO/IPO did not exhibit major changes in spa-
tial or temporal characteristics under GHG warming in most of the 24
CMIP3 models used, although some models indicated a weak shift
toward more occurrences of the negative phase of the PDO/IPO by
the end of the 21st century (2081–2100, Lapp et al., 2012). However,
given that the models strongly underestimate the PDO/IPO connection
with tropical Indo-Pacific SST variations (Furtado et al., 2011; Lienert et
al., 2011), the credibility of the projections remains uncertain. Further-
more, internal variability is so high that it is hard to detect any forced
changes in the Aleutian Low for the next half a century (Deser et al.,
2012; Oshima et al., 2012). Therefore confidence is low in projections
of future changes in PDO/IPO.
14.7.4 Tropospheric Biennial Oscillation
The Tropospheric Biennial Oscillation (TBO; Meehl, 1997) is a proposed
mechanism for the biennial tendency in large-scale drought and floods
of south Asia and Australia. Multiple studies imply that TBO involves
the Asian-Australian monsoon, the IOD and ENSO (Sections 14.2.2,
14.3.3 and 14.4; see also Supplementary Material Section 14.SM.5.2).
The IPO (Section 14.7.3) affects the decade-to-decade strength of the
TBO. A major contributor to recent change in the TBO comes from

1254
Chapter 14 Climate Phenomena and their Relevance for Future Regional Climate Change
14
increase of SST in the Indian Ocean that contributes to stronger trade
winds in the Pacific, one of the processes previously identified with
strengthening the TBO (Meehl and Arblaster, 2012). Thus, prediction of
decadal variability assessed in Chapter 11 that can be associated, for
example, with the IPO (e.g., Meehl et al., 2010) can influence the accu-
racy of shorter-term predictions of the TBO across the entire Indo-Pacif-
ic region (Turner et al., 2011), but the relevance for longer time scales
is uncertain.
Since AR4, little work has been done to document the ability of climate
models to simulate the TBO. However, Li et al. (2012b) showed that
there is an overall improvement in the seasonality of monsoons rainfall
related to changes in the TBO from CMIP3 to CMIP5, with most CMIP5
models better simulating both the monsoon timing and the very low
rainfall rates outside of the monsoon season (see also Section 14.2.2).
In addition they concluded that the India-Australia link seems to be
robust in all models.
With regard to possible future behaviour of the TBO, no analysis
using multiple GCMs has been made since the AR4. In models that
more accurately simulate the TBO in the present-day climate, the TBO
strengthens in a future warmer climate (Nanjundiah et al., 2005). How-
ever, as with ENSO (Section 14.4) and IOD (Section 14.3.3), internally
generated decadal variability complicates the interpretation of such
future changes. Therefore, it remains unclear how future changes in the
TBO will emerge and how this may influence regional climate in the
future. Confidence in the projected future changes in TBO remains low.
14.7.5 Quasi-Biennial Oscillation
The QBO is a near-periodic, large-amplitude, downward propagating
oscillation in zonal winds in the equatorial stratosphere (Baldwin et
al., 2001). It is driven by vertically propagating internal waves that
are generated in the tropical troposphere (Plumb, 1977). The QBO has
substantial effects on the global stratospheric circulation, in particular
the strength of the northern stratospheric polar vortex as well as the
extratropical troposphere (Boer, 2009; Marshall and Scaife, 2009; Gar-
finkel and Hartmann, 2011). These extratropical effects occur primarily
in winter when the stratosphere and troposphere are strongly coupled
(Anstey and Shepherd, 2008; Garfinkel and Hartmann, 2011).
It has been unclear how the QBO will respond to future climate change
related to GHG increase and recovery of stratospheric ozone. Climate
models assessed in the AR4 did not simulate the QBO as they lacked
the necessary vertical resolution (Kawatani et al., 2011). Recent model
studies without using gravity wave parameterization (Kawatani et al.,
2011; Kawatani et al., 2012) showed that the QBO period and ampli-
tude may become longer and weaker, and the downward penetration
into the lowermost stratosphere may be more curtailed in a warmer
climate. This finding is attributed to the effect of increased equatorial
upwelling (stronger Brewer–Dobson circulation; Butchart et al., 2006;
Garcia and Randel, 2008; McLandress and Shepherd, 2009; Okamoto
et al., 2011) dominating the effect of increased wave forcing (more
convective activity). Two studies with gravity wave parameterization,
however, gave conflicting results depending on the simulated changes
in the intensity of the Brewer–Dobson circulation (Watanabe and
Kawatani, 2012).
There are limited published results on the future behaviour of the QBO,
using CMIP5 models. On the basis of the recent literature, it is uncer-
tain how the period or amplitude of the QBO may change in future and
confidence in the projections remains low.
14.7.6 Atlantic Multi-decadal Oscillation
The AMO (Box 2.5; see also Section 9.5.3.3.2) is a fluctuation seen in
the instrumental SST record throughout the North Atlantic Ocean and
is related to variability in the thermohaline circulation (Knight et al.,
2005). Area-mean North Atlantic SST shows variations with a range of
about 0.4°C (see Box 2.5) and a warming of a similar magnitude since
1870. The AMO has a quasi-periodicity of about 70 years, although the
approximately 150-year instrumental record possesses only a few dis-
tinct phases—warm during approximately 1930–1965 and after 1995,
and cool between 1900–1930 and 1965–1995. The phenomenon has
also been referred to as ‘Atlantic Multidecadal Variability’ to avoid the
implication of temporal regularity. Along with secular trends and Pacif-
ic variability, the AMO is one of the principal features of multidecadal
variability in the instrumental climate record.
The AR4 highlighted a number of important links between the AMO
and regional climates. Subsequent research using observational and
paleoclimate records, and climate models, has confirmed and expand-
ed upon these connections, such as West African monsoon and Sahel
rainfall (Mohino et al., 2011; Section 14.2.4), summer climate in North
America (Seager et al., 2008; Section 14.8.3; Feng et al., 2011) and
Europe (Folland et al., 2009; Ionita et al., 2012; Section 14.8.6), the
Arctic (Chylek et al., 2009; Mahajan et al., 2011), and Atlantic major
hurricane frequency (Chylek and Lesins, 2008; Zhang and Delworth,
2009; Section 14.6.1). Further, the list of AMO influences around the
globe has been extended to include decadal variations in many other
regions (e.g., Zhang and Delworth, 2006; Kucharski et al., 2009a,
2009b; Huss et al., 2010; Marullo et al., 2011; Wang et al., 2011).
Paleo reconstructions of Atlantic temperatures show AMO-like variabili-
ty well before the instrumental era, as noted in the AR4 (Chapter 6; see
also Section 5.4.2). Recent analyses confirm this, and suggest potential
for intermittency in AMO variability (Saenger et al., 2009; Zanchettin et
al., 2010; Chylek et al., 2012). Control simulations of climate models run
for hundreds or thousands of years also show long-lived Atlantic mul-
ti-decadal variability (Menary et al., 2012). These lines of evidence sug-
gest that AMO variability will continue into the future. No fundamental
changes in the characteristics of North Atlantic multi-decadal variability
in the 21st century are seen in CMIP3 models (Ting et al., 2011).
Many studies have diagnosed a trend towards a warm North Atlantic
in recent decades additional to that implied by global climate forcings
(Knight, 2009; Polyakov et al., 2010). It is unclear exactly when the
current warm phase of the AMO will terminate, but may occur within
the next few decades, leading to a cooling influence in the North Atlan-
tic and offsetting some of the effects characterizing global warming
(Keenlyside et al., 2008; see also Section 11.3.3.3).
Some similarity in the shape of the instrumental time series of global
and NH mean surface temperatures and the AMO has long been noted.
By removing an estimate of the effect of interannual variability phe-

1255
Climate Phenomena and their Relevance for Future Regional Climate Change Chapter 14
14
nomena like ENSO (Section 14.4), AMO transitions have been shown to
have the potential to produce large and abrupt changes in hemispheric
temperatures (Thompson et al., 2010). Estimates of the AMO’s contri-
bution to recent climate change are uncertain, however, as attribution
of the observed AMO requires a model (physical or conceptual) whose
assumptions are nearly always difficult to verify (Knight, 2009).
14.7.7 Assessment Summary
Literature is generally insufficient to assess future changes in behav-
iour of the PNA, PSA, TBO, QBO and PDO/IPO. Confidence in the pro-
jections of changes in these modes is therefore low. However, process
understanding of the formation of the PSA gives medium confidence
that future changes in the mean atmospheric circulation for austral
summer will project on the PSA pattern thereby influencing the SACZ
and precipitation over Southeastern South America.
Paleoclimate reconstructions and long model simulations indicate that
the AMO is unlikely to change its behaviour in the future as the mean
climate changes. However, natural fluctuations in the AMO over the
coming few decades are likely to influence regional climates at least as
strongly as will human-induced changes.
14.8 Future Regional Climate Change
14.8.1 Overview
The following sections assess future climate projections for several
regions, and relate them, where possible, to projected changes in the
major climate phenomena assessed in Sections 14.2 to 14.7. The region-
al climate change assessments are mainly of mean surface air temper-
ature and mean precipitation based primarily on multi-model ensemble
projections from general circulation models. Reference is made to the
appropriate projection maps from CMIP5 (Taylor et al., 2011c) present-
ed in Annex I: Atlas of Global and Regional Climate Projections. Annex
I uses smaller sub-regions similar to those introduced by SREX (Sen-
eviratne et al., 2012). Table 14.1 presents a quantitative summary of
the regional area averages over three projection periods (2016–2035,
2046–2065 and 2081–2100 with respect to the reference period 1986–
2005, representing near future, middle century and end of century) for
the RCP4.5 scenario. The 26 land regions assessed here are presented in
Seneviratne et al., 2012, page 12 and the coordinates can be found from
their online Appendix 3.A. Added to this are six additional regions con-
taining the two polar regions, the Caribbean, Indian Ocean and Pacific
Island States (see Annex I for further details). Table 14.1 identifies the
smaller sub-domains grouped within the somewhat large regions that
are discussed in Sections 14.8.2 to 14.8.15. Tables for RCP2.6, RCP6.0
and RCP8.5 scenarios are presented in Supplementary Material Tables
14.SM.1a to 14.SM.1c. For continental-scale regions, projected chang-
es in mean precipitation between (2081–2100) and (1986–2005) are
compared in two generations of models forced under two comparable
emission scenarios: RCP4.5 in CMIP5 versus A1B in CMIP3. In contrast
to the Annex, the seasons here are chosen differently for each region
so as to best capture the regional features such as monsoons. Down-
scaling issues are illustrated in panels showing results from an ensem-
ble of high-resolution time-slice experiments with the Meteorological
Research Institute (MRI) model (Endo et al., 2012; Mizuta et al., 2012).
To facilitate a direct comparison across the scenarios, the precipitation
changes are normalized by the global annual mean surface air temper-
ature changes in each scenario. Published results using other downscal-
ing methods are also assessed when found essential to illustrate issues
related to regional climate change.
Regional climate projections are generally more uncertain than pro-
jections of global mean temperature but the sources of uncertainty
are similar (see Chapters 8, 11, and 12) yet differ in relative impor-
tance. For example, natural variability (Deser et al., 2012), aerosol
forcing (Chapter 7) and land use/cover changes (DeFries et al., 2002;
Moss et al., 2010) all become more important sources of uncertain-
ty on a regional scale. Regional climate assessments incur additional
uncertainty due to the cascade of uncertainty through the hierarchy
of models needed to generate local information (cf. downscaling in
Section 9.6). Calibration (bias correction) of model output to match
local observations is an additional important source of uncertainty in
regional climate projections (e.g., Ho et al., 2012), which should be
considered when interpreting the regional projections. Therefore, the
model spread shown in Annex 1 should not be interpreted as the final
uncertainty in the observable regional climate change response.
Table 14.2 summarizes the assessed confidence in the ability of CMIP5
models to represent regional scale present-day climate (temperature
and precipitation, based on Chapter 9), the main controlling phenom-
ena for weather and climate in that region and the assessed result-
ing confidence in the future projections. There is generally less confi-
dence in projections of precipitation than of temperature. For example,
in Annex I, the temperature projections for 2081–2100 are almost
always above the model estimates of natural variability, whereas the
precipitation projections less frequently rise above natural variability.
Although some projections are robust for reasons that are well under-
stood (e.g., the projected increase in precipitation at high latitudes),
many other regions have precipitation projections that vary in sign and
magnitude across the models. These issues are further discussed in Sec-
tion 12.4.5.2. Details on how the confidence table is constructed are
found in the Supplementary Material.
Credibility in regional climate change projections is increased if it
is possible to find key drivers of the change that are known to be
well-simulated and well-projected by climate models. Table 14.3
summarizes the assessment of how major climate phenomena might
be relevant for future regional climate change. For each entry in the
table, the relevance is based on an assessment of confidence in future
change in the phenomenon and the confidence in how the phenome-
non influences regional climate. For example, NAO is assigned high rel-
evance (red) for the Arctic region because NAO is known to influence
the Arctic and there is high confidence that the NAO index will increase
in response to anthropogenic forcing. If there is low confidence in how
a phenomenon might change (e.g., ENSO) but high confidence that
it has a strong regional impact, then the cell in the table is assigned
medium relevance (yellow). It can be seen from the table that there are
many cases where major phenomena are assessed to have high (red)
or medium (yellow) relevance for future regional climate change. See
Supplementary Material Section 14.SM.6.1 for more details on how
this relevance table was constructed.
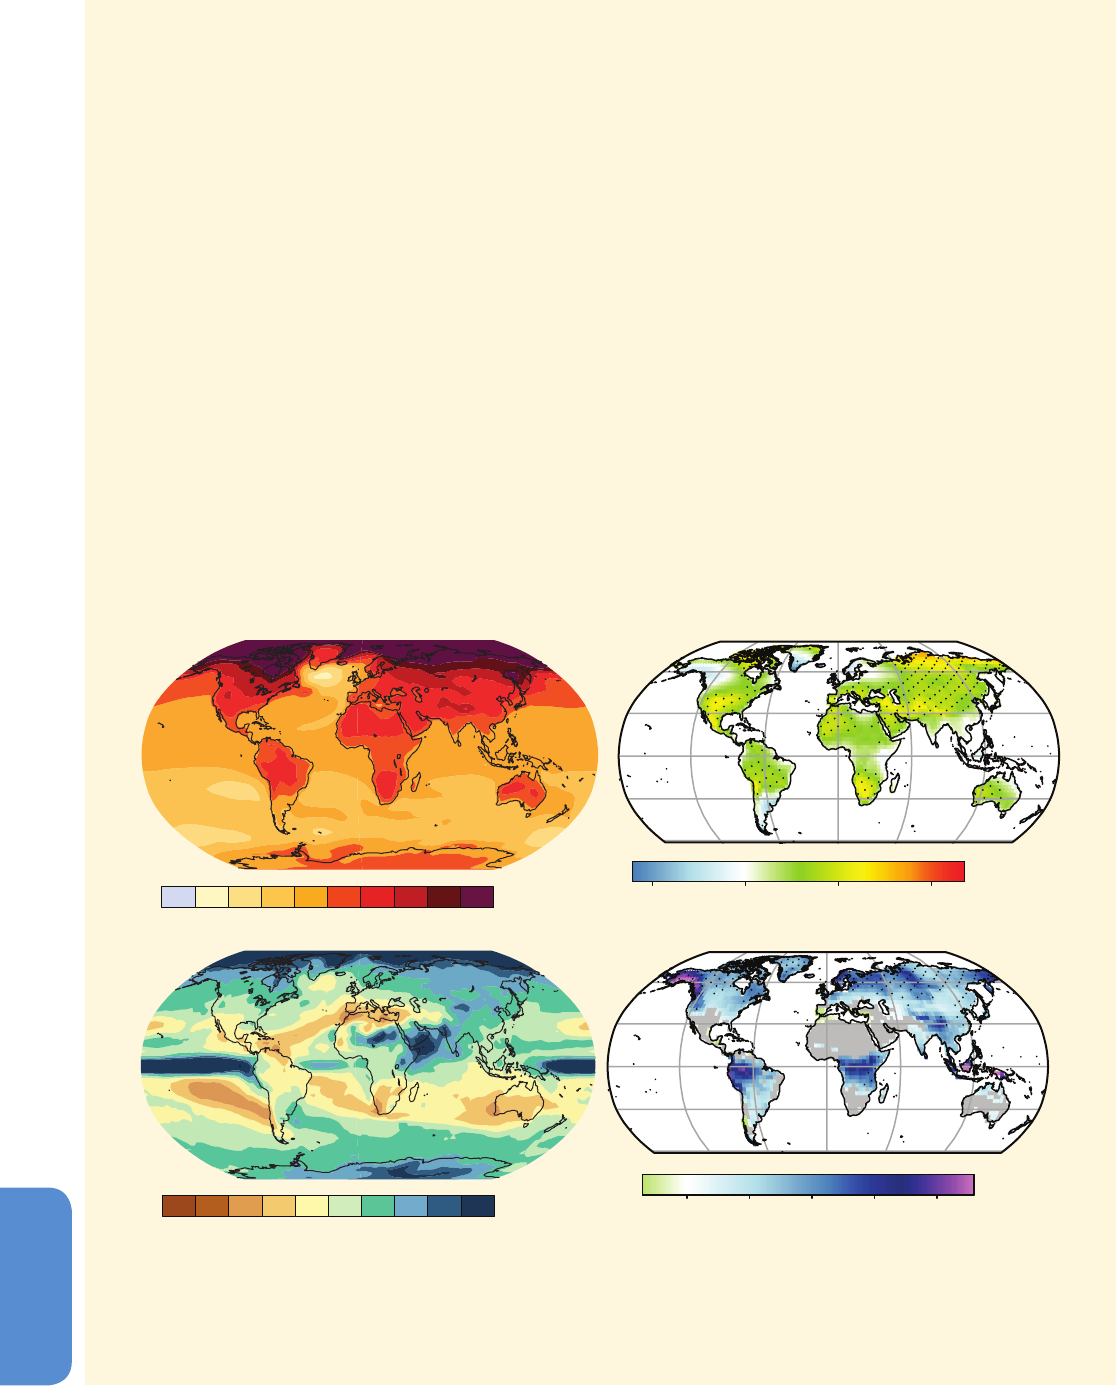
1256
Chapter 14 Climate Phenomena and their Relevance for Future Regional Climate Change
14
Frequently Asked Questions
FAQ 14.2 | How Are Future Projections in Regional Climate Related to Projections of
Global Means?
The relationship between regional climate change and global mean change is complex. Regional climates vary
strongly with location and so respond differently to changes in global-scale influences. The global mean change is,
in effect, a convenient summary of many diverse regional climate responses.
Heat and moisture, and changes in them, are not evenly distributed across the globe for several reasons:
• External forcings vary spatially (e.g., solar radiation depends on latitude, aerosol emissions have local sources,
land use changes regionally, etc.).
• Surface conditions vary spatially, for example, land/sea contrast, topography, sea surface temperatures, soil mois-
ture content.
• Weather systems and ocean currents redistribute heat and moisture from one region to another.
Weather systems are associated with regionally important climate phenomena such as monsoons, tropical conver-
gence zones, storm tracks and important modes of climate variability (e.g., El Niño-Southern Oscillation (ENSO),
North Atlantic Oscillation (NAO), Southern Annular Mode (SAM), etc.). In addition to modulating regional warm-
ing, some climate phenomena are also projected to change in the future, which can lead to further impacts on
regional climates (see Table 14.3).
Projections of change in surface temperature and precipitation show large regional variations (FAQ 14.2, Figure 1).
Enhanced surface warming is projected to occur over the high-latitude continental regions and the Arctic ocean,
FAQ 14.2, Figure 1 | Projected 21st century changes in annual mean and annual extremes (over land) of surface air temperature and precipitation: (a) mean surface
temperature per °C of global mean change, (b) 90th percentile of daily maximum temperature per °C of global average maximum temperature, (c) mean precipitation (in
% per °C of global mean temperature change), and (d) fraction of days with precipitation exceeding the 95th percentile. Sources: Panels (a) and (c) projected changes
in means between 1986–2005 and 2081–2100 from CMIP5 simulations under RCP4.5 scenario (see Chapter 12, Figure 12.41); Panels (b) and (d) projected changes
in extremes over land between 1980–1999 and 2081–2100 (adapted from Figures 7 and 12 of Orlowsky and Seneviratne, 2012).
0.51 1.52
(%)
00.5 11.5 2
(a)(b)
(c) (d)
(°C per °C)
(°C per °C)
(% per °C)
0.500.25 0.75 11.25 1.51.752
-6-12-9-3036912
(continued on next page)

1257
Climate Phenomena and their Relevance for Future Regional Climate Change Chapter 14
14
14.8.2 Arctic
This section is concerned with temperature and precipitation dimen-
sions of Arctic climate change, and their links to climate phenomena.
The reader is referred elsewhere for information on sea ice loss (Sec-
tions 4.2.2, 5.5.2 and Chapter 10), and projections of sea ice change
(Sections 9.4.3, 9.8.3 and Chapters 11 and 12).
Arctic climate is affected by three modes of variability: NAO (Section
14.5.1), PDO (Section 14.7.3) and AMO (Section 14.7.6). The NAO
index correlates positively with temperatures in the northeastern Eur-
asian sector, and correlates negatively with temperatures in the Baffin
Bay and Canadian Archipelago, but exhibits little relationship with
central Arctic temperatures (Polyakov et al., 2003). The PDO plays a
role in temperature variability of Alaska and the Yukon (Hartmann and
Wendler, 2005). The AMO is positively associated with SST throughout
the Arctic (Chylek et al., 2009; Levitus et al., 2009; Chylek et al., 2010)
(Mahajan et al., 2011). ETCs are also mainly responsible for winter
precipitation in the region (see Table 14.3).
The surface and lower troposphere in the Arctic and surrounding land
areas show regional warming over the past three decades of about 1°C
per decade—significantly greater than the global mean trend (Figures
2.22 and 2.25). According to temperature reconstructions, this signal
is highly unusual: Temperatures averaged over the Arctic over the past
few decades are significantly higher than any seen over the past 2000
years (Kaufman et al., 2009). Temperatures 11 ka were greater than the
20th century mean, but this is probably a strongly forced signal, since
summer solar radiation was 9% greater than present (Miller et al.,
FAQ 14.2 (continued)
while over other oceans and lower latitudes changes are closer to the global mean (FAQ 14.2, Figure 1a). For
example, warming near the Great Lakes area of North America is projected to be about 50% greater than that
of the global mean warming. Similar large regional variations are also seen in the projected changes of more
extreme temperatures (FAQ 14.2, Figure 1b). Projected changes in precipitation are even more regionally variable
than changes in temperature (FAQ 14.2, Figure 1c, d), caused by modulation from climate phenomena such as the
monsoons and tropical convergence zones. Near-equatorial latitudes are projected to have increased mean precipi-
tation, while regions on the poleward edges of the subtropics are projected to have reduced mean precipitation.
Higher latitude regions are projected to have increased mean precipitation and in particular more extreme precipi-
tation from extratropical cyclones.
Polar regions illustrate the complexity of processes involved in regional climate change. Arctic warming is projected
to increase more than the global mean, mostly because the melting of ice and snow produces a regional feedback
by allowing more heat from the Sun to be absorbed. This gives rise to further warming, which encourages more
melting of ice and snow. However, the projected warming over the Antarctic continent and surrounding oceans is
less marked in part due to a stronger positive trend in the Southern Annular Mode. Westerly winds over the mid-
latitude southern oceans have increased over recent decades, driven by the combined effect of loss of stratospheric
ozone over Antarctica, and changes in the atmosphere’s temperature structure related to increased greenhouse
gas concentrations. This change in the Southern Annular Mode is well captured by climate models and has the
effect of reducing atmospheric heat transport to the Antarctic continent. Nevertheless, the Antarctic Peninsula is
still warming rapidly, because it extends far enough northwards to be influenced by the warm air masses of the
westerly wind belt.
2010). Finally, warmer temperatures have been sustained in pan-Arctic
land areas where a declining NAO over the past decade ought to have
caused cooling (Semenov, 2007; Turner et al., 2007b). Since AR4, evi-
dence has also emerged that precipitation has trended upward in most
pan-Arctic land areas over the past few decades (e.g., Pavelsky and
Smith, 2006; Rawlins et al., 2010), though the evidence remains mixed
(e.g., Dai et al., 2009). Increasing ETC activity over the Canadian Arctic
has also been observed (Section 2.6.4).
Since AR4, there has been progress in adapting RCMs for polar appli-
cations (Wilson et al., 2012). These models have been evaluated with
regard to their ability to simulate Arctic clouds, surface heat fluxes, and
boundary layer processes (Tjernstrom et al., 2004; Inoue et al., 2006;
Rinke et al., 2006). They have been used to improve simulations of
Arctic-specific climate processes, such as glacial mass balance (Zhang
et al., 2007). A few regional models have been used for Arctic climate
change projections (e.g., Zahn and von Storch, 2010; Koenigk et al.,
2011; Döscher and Koenigk, 2012). For information on GCM quality in
the Arctic, see Chapter 9 and the brief summary of assessed confidence
in the CMIP5 models in Table 14.2.
The CMIP5 model simulations exhibit an ensemble-mean polar ampli-
fied warming, especially in winter, similar to CMIP3 model simulations
(Bracegirdle and Stephenson, 2012; see also Box 5.1). For RCP4.5,
ensemble-mean winter warming rises to 5.0°C over pan-Arctic land
areas by the end of the 21st century (2081–2100), and about 7.0°C
over the Arctic Sea (Table14.1). Throughout the century, the warming
exceeds simulated estimates of internal variability (Figure AI.8). The
RCP4.5 ensemble-mean warming is more modest in JJA (Table 14.1),

1258
Chapter 14 Climate Phenomena and their Relevance for Future Regional Climate Change
14
reaching about 2.2°C by century’s end over pan-Arctic land areas, and
1.5°C over the Arctic Sea. The summer warming exceeds variability
estimates by about mid-century (Figure AI.9). These simulated anthro-
pogenic seasonal warming patterns match qualitatively the observed
warming patterns over the past six decades (AMAP, 2011), and the
observed warming patterns are likely to be at least partly anthropo-
genic in origin (Section 10.3.1.1.4). Given the magnitude of future
projected changes relative to variability, and the presence of anthro-
pogenic signals already, it is likely future Arctic surface temperature
changes will continue to be strongly influenced by the anthropogenic
forcing over the coming decades.
The CMIP5 models robustly project precipitation increases in the
pan-Arctic (both land and sea) region over the 21st century, as did
their CMIP3 counterparts (Kattsov et al., 2007; Rawlins et al., 2010).
Under the RCP4.5 scenario, the cold season, ensemble mean precip-
itation increases about 25% by the century’s end (Table 14.1), due
to enhanced precipitation in ETCs (Table 14.3). However, this signal
does not rise consistently above the noise of simulated variability
until mid 21
st
century (Figure AI.10). During the warm season, precip-
itation increases are smaller, about 15% (Table 14.1), though these
signals also rise above variability by mid 21
st
century (Figure AI.11). The
inter-model spread in the precipitation increase is generally as large as
the ensemble mean signal itself (similar to CMIP3 model behaviour,
Holland and Webster, 2007), so the magnitude of the future increase
is uncertain. However, since nearly all models project a large precipi-
tation increase rising above the variability year-round, it is likely the
pan-Arctic region will experience a statistically significant increase in
precipitation by mid-century (see also Table 14.2). The small projected
increase in the NAO is likely to affect Arctic precipitation (and tem-
perature) patterns in the coming century (Section 14.5.1; Table 14.3),
though the importance of these signals relative to anthropogenic sig-
nals described here is unclear.
In summary: It is likely Arctic surface temperature changes will be
strongly influenced by anthropogenic forcing over the coming decades
dominating natural variability such as induced by NAO. It is likely the
pan-Arctic region will experience a significant increase in precipitation
by mid-century due mostly to enhanced precipitation in ETCs.
14.8.3 North America
The climate of North America (NA) is affected by the following phenom-
ena: NAO (Section 14.5.1), ENSO (Section 14.4), PNA (Section 14.7.2),
PDO (Section 14.7.3), NAMS (Section 14.2.3), TCs and ETCs (Section
14.6). The NAO affects temperature and precipitation over Eastern NA
during winter (Hurrell et al., 2003). Positive PNA brings warmer tem-
peratures to northern Western NA and Alaska in winter, cooler tem-
peratures to the southern part of Eastern NA, and dry conditions to
much of Eastern NA (Nigam, 2003). The PNA can also be excited by
ENSO-related SST anomalies (Horel and Wallace, 1981; Nigam, 2003).
The PDO is linked to decadal climate anomalies resembling those of
the PNA. The NAMS brings excess summer rainfall to Central America
and Mexico and the southern portion of Western NA (Gutzler, 2004).
TCs also impact the Gulf Coast and Eastern NA (see Section 14.6.1).
The AMM and AMO may affect their frequency and intensity (Landsea
et al., 1999; Goldenberg et al., 2001; Cassou et al., 2007; Emanuel,
2007; Vimont and Kossin, 2007; Smirnov and Vimont, 2011). ETCs are
also mainly responsible for winter precipitation, especially in the north-
ern half of NA. See Table 14.3 for a summary of this information.
A general surface warming over NA has been documented over the
last century (see Section 2.4). It is particularly large over Alaska and
northern Western NA during winter and spring and the northern part
of Eastern NA during summer (Zhang et al., 2011b). There is also a
cooling tendency over Central and Eastern NA (i.e., the ‘warming hole’
discussed in Section 2.4.1) during spring, though it is absent in lower
tropospheric temperature (cf. Figure 2.25). The warming has coincided
with a general decline in NA snow extent and depth (Brown and Mote,
2009; McCabe and Wolock, 2010; Kapnick and Hall, 2012). Consistent
with surface temperature trends, temperature extremes also exhibit
secular changes. Cold days and nights have decreased in the last half
century, while warm days and nights have increased (see Chapter 2).
These changes are especially apparent for nightly extremes (Vincent
et al., 2007). It is unclear whether there have been mean precipita-
tion trends over the last 50 years (Section 2.5.1; Zhang et al., 2011b).
However, precipitation extremes increased, especially over Central and
Eastern NA (see Section 2.6.2 and Seneviratne et al., 2012).
Table 14.2 provides an assessment of GCM quality for simulations
of temperature, precipitation, and main phenomena in NA’s regions.
Regarding regional modelling experiments since AR4, biases have
decreased somewhat as resolutions increase. The North American
Regional Climate Change Assessment Program created a simulation
suite for NA at 50-km resolution. When forced by reanalyses, this suite
generally reproduces climate variability within observational error
(Leung and Qian, 2009; Wang et al., 2009b; Gutowski, 2010; Mearns
et al., 2012).Other regional modelling experiments covering parts or
all of NA have shown improvements as resolution increases (Liang et
al., 2008a; Lim et al., 2011; Yeung et al., 2011), including for extremes
(Kawazoe and Gutowski, 2013). Bias reductions are large for snowpack
in topographically complex Western NA, as revealed by 2- to 20-km res-
olution regional simulations (Qian et al., 2010b; Salathe Jr. et al., 2010;
Pavelsky et al., 2011; Rasmussen et al., 2011). Thus there has been
substantial progress since AR4 in understanding the value of regional
modelling in simulating NA climate. The added value of using regional
models to simulate climate change is discussed in Section 9.6.6.
NA warming patterns in RCP4.5 CMIP5 projections are generally sim-
ilar to those of CMIP3 (Figures AI.4 and AI.5, Table 14.1). In winter,
warming is greatest in Alaska, Canada, and Greenland (Figures AI.12
and AI.16), while in summer, maximum warming shifts south, to West-
ern, Central, and Eastern NA. Examining near-term (2016–2035) CMIP5
projections of the less sensitive models (25th percentile, i.e., upper
left maps in Figures AI.12, AI.13, AI.16, AI.17, AI.20 AI.21, AI.24 and
AI.25), the warming generally exceeds natural variability estimates.
Exceptions are Alaska, parts of Western, Central, and Eastern NA, and
Canada and Greenland during winter, when natural variability linked
to wintertime storms is particularly large. By 2046–2065, warming in
all regions exceeds the natural variability estimate for all models. Thus
it is very likely the warming signal will be large compared to natural
variability in all NA regions throughout the year by mid-century. This
warming generally leads to a two- to four fold increase in simulated
heat wave frequency over the 21st century (e.g., Lau and Nath, 2012).
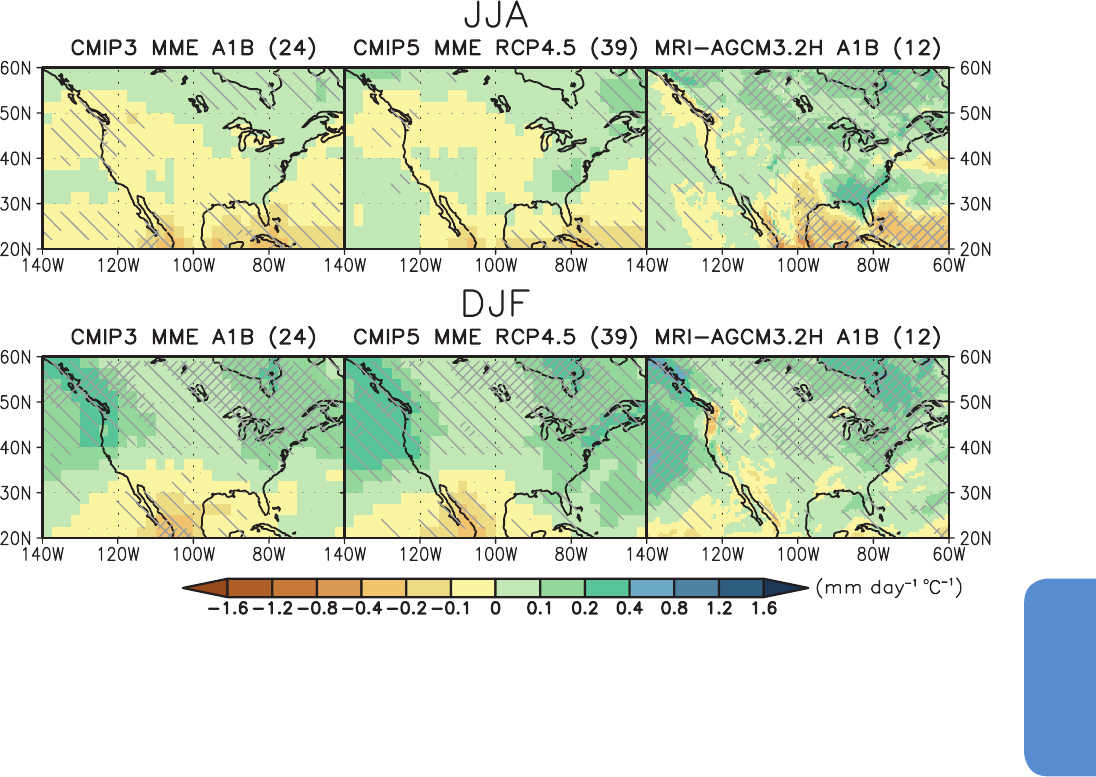
1259
Climate Phenomena and their Relevance for Future Regional Climate Change Chapter 14
14
Anthropogenic climate change may also bring systematic cold-season
precipitation changes. As with previous models, CMIP5 projections
generally agree in projecting a winter precipitation increase over the
northern half of NA (Figure 14.18 and AI.19). This is associated with
increased atmospheric moisture, increased moisture convergence, and
a poleward shift in ETC activity (Section 14.6.2 and Table 14.3). The
change is consistent with CMIP3 model projections of positive NAO
trends (Table 14.3; Hori et al., 2007; Karpechko, 2010; Zhu and Wang,
2010). Winter precipitation increases extend southward into the USA
(northern portions of SREX regions 3 to 5; Neelin et al., 2013) but
with decreasing strength relative to natural variability. This behaviour
is qualitatively reproduced in higher resolution simulations (Figure
14.18).
Warm-season precipitation also exhibits significant increases in
Alaska, northern Canada, and Eastern NA by century’s end (Figures
14.18, AI.19, AI.22). However, CMIP5 models disagree on the sign
of the precipitation change over the rest of NA (Figures AI.26 and
AI.27), consistent with CMIP3 results (Figure 14.18; Neelin et al., 2006;
Rauscher et al., 2008; Seth et al., 2010). One set of high resolution
simulatons (Endo et al., 2012) shows a tendency towards more precipi-
tation than either CMIP3 or CMIP5 models (Figure 14.18), suggesting
the simulated warm-season precipitation change in the region may be
resolution-dependent. Future precipitation changes associated with
the NAMS are likewise uncertain, though there is medium confidence
the phenomenon will move to later in the annual cycle (Section 14.2.3,
Table 14.3). As there is medium confidence tropical cyclones will be
associated with greater rainfall rates, the Gulf and East coasts of NA
may be impacted by greater precipitation when tropical cyclones occur
(Table 14.3).
CMIP3 models showed a 21st century precipitation decrease across
much of southwestern NA, accompanied by a robust evaporation
increase characteristic of mid-latitude continental warming (Seager
et al., 2007; Seager and Vecchi, 2010) and an increase in drought fre-
quency (Sheffield and Wood, 2008; Gutzler and Robbins, 2011). When
downscaled, CMIP3 models showed less drying in the region (Gao
et al., 2012c) and an extreme precipitation increase, despite overall
drying (Dominguez et al., 2012). CMIP5 models do not consistently
show such a precipitation decrease in this region (Neelin et al., 2013).
This is one of the few emerging differences between the two ensem-
bles in climate projections over NA. However, the CMIP5 models
still show a strong decrease in soil moisture here (Dai, 2013), due to
increasing evaporation.
In summary, it is very likely that by mid-century the anthropogenic
warming signal will be large compared to natural variability such as
that stemming from the NAO, ENSO, PNA, PDO, and the NAMS in all
Figure 14.18 | Maps of precipitation changes for North America in 2080–2099 with respect to 1986–2005 in June, July and August (above) and December to February (below)
in the SRES A1B scenario with 24 CMIP3 models (left), and in the RCP4.5 scenario with 39 CMIP5 models (middle). Right figures are the precipitation changes in 2075–2099 with
respect to 1979–2003 in the SRES A1B scenario with the 12 member 60 km mesh Meteorological Research Institute (MRI)-Atmospheric General Circulation Model 3.2 (AGCM3.2)
multi-physics, multi-SST ensembles (Endo et al., 2012). Precipitation changes are normalized by the global annual mean surface air temperature changes in each scenario. Light
hatching denotes where more than 66% of models (or members) have the same sign with the ensemble mean changes, while dense hatching denotes where more than 90% of
models (or members) have the same sign with the ensemble mean changes.
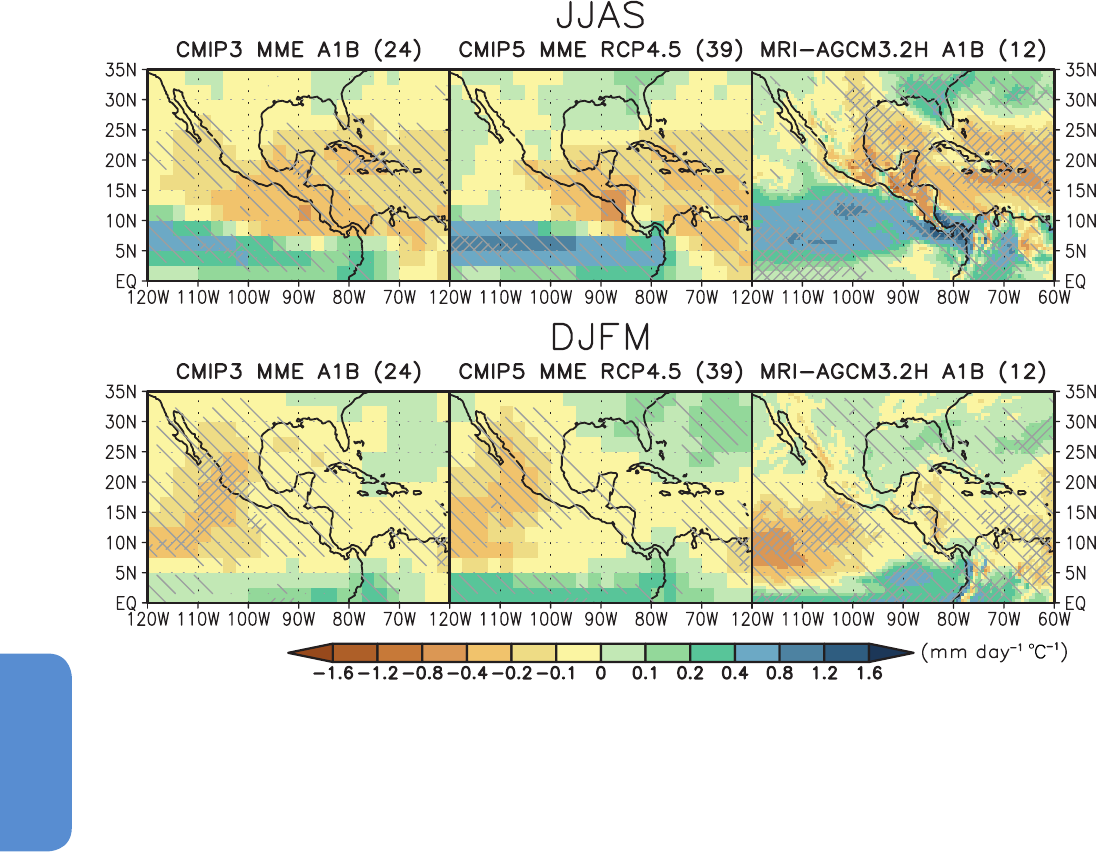
1260
Chapter 14 Climate Phenomena and their Relevance for Future Regional Climate Change
14
NA regions throughout the year. It is likely that the northern half of NA
will experience an increase in precipitation over the 21st century, due
in large part to a precipitation increase within ETCs.
14.8.4 Central America and Caribbean
The Central America and the Caribbean (CAC) region is affected by
several phenomena, including the ITCZ (Section 14.3.1.1), NAMS (Sec-
tion 14.2.3.1), ENSO (Section 14.4) and TCs (Section 14.6.1; Table 14.3;
also Gamble and Curtis, 2008). The annual cycle results from air–sea
interactions over the Western Hemisphere warm pool in the tropical
eastern north Pacific and the Intra Americas Seas (Amador et al., 2006;
Wang et al., 2007). The Caribbean Low Level Jet is a key element of the
region’s summer climate (Cook and Vizy, 2010) and is controlled by
the size and intensity of the Western Hemisphere warm pool (Wang et
al., 2008b). It is also modulated by SST gradients between the eastern
equatorial Pacific and tropical Atlantic (Taylor et al., 2011d). ENSO is
the main driver of climate variability, with El Niño being associated
with dry conditions and La Niña with wet conditions (Karmalkar et
al., 2011). Other teleconnection patterns, such as the NAO (Section
14.5.1) and the strength of boreal winter convection over the Amazon,
influence trade winds over the Tropical North Atlantic and can combine
with ENSO to modulate the summer Western Hemisphere warm pool
(e.g., Enfield et al., 2006). Table 14.3 summarizes the main phenomena
and their relevance to climate change over the CAC.
Because inter-decadal climate variations can be large in the CAC
region, precipitation trends must beinterpreted carefully. From 1950
to 2003, negative trends were seen in several data sets in the Carib-
bean region and parts of Central America (Neelin et al., 2006). How-
ever, regarding secular trends (1901–2005), this signal was identified
only in the Caribbean region (Trenberth et al., 2007b). Prolonged dry
or wet periods are related to decadal variability of the adjacent Pacific
and Atlantic (Mendoza et al., 2007; Seager et al., 2009; Mendez and
Magaña, 2010), and the intensity of easterlies over the region. For
instance, increased easterly surface winds over Puerto Rico from 1950
to 2000 disrupted a pattern of inland moisture convergence, leading to
a dramatic precipitation decrease (Comarazamy and Gonzalez, 2011).
Table 14.2 provides an overall assessment of GCM quality for simula-
tions of temperature, precipitation and main phenomena in the CAC
sub-regions. Annual cycles of temperature and precipitation are well
Figure 14.19 | Maps of precipitation changes for Central America and Caribbean in 2080–2099 with respect to 1986–2005 in June to September (above) and December to
March (below) in the SRES A1B scenario with 24 CMIP3 models (left), and in the RCP4.5 scenario with 39 CMIP5 models (middle). Right figures are the precipitation changes in
2075–2099 with respect to 1979–2003 in the SRES A1B scenario with the 12 member 60 km mesh Meteorological Research Institute (MRI)-Atmospheric General Circulation Model
3.2 (AGCM3.2) multi-physics, multi-SST ensembles (Endo et al., 2012). Precipitation changes are normalized by the global annual mean surface air temperature changes in each
scenario. Light hatching denotes where more than 66% of models (or members) have the same sign with the ensemble mean changes, while dense hatching denotes where more
than 90% of models (or members) have the same sign with the ensemble mean changes.

1261
Climate Phenomena and their Relevance for Future Regional Climate Change Chapter 14
14
simulated by CMIP5 models, though precipitation from June to Octo-
ber is underestimated (Figure 9.38). Regional models also simulate
temperature and precipitation climatologies, and the magnitude and
annual cycle of the Caribbean Low-Level Jet reasonably well (Campbell
et al., 2010; Taylor et al., 2013).
CMIP3 models generally projected a precipitation reduction over much
of the Caribbean region, consistent with the observed negative trend
since 1950 (Neelin et al., 2006; Rauscher et al., 2008). The subtropics
are generally expected to dry as global climate warms (Held and Soden,
2006), but in both CMIP3 and CMIP5 models the CAC region shows the
greatest drying. Future drying may also be related to strengthening
of the Caribbean Low-Level Jet (Taylor et al., 2013) and subsidence
over the Caribbean region associated with warmer SSTs in the tropical
Pacific than Atlantic (Taylor et al., 2011d). A high-resolution regional
Ocean GCM using a CMIP3 ensemble for boundary conditions confirms
that the Intra American Seas circulation weakens by similar rate as the
reduction in Atlantic Meridional Overturning (Liu et al., 2012c). This
weakening causes the Gulf of Mexico to warm less than other oceans.
Downscaling experiments for the region have shown a mid-21st centu-
ry warming between 2°C and 3°C (Vergara et al., 2007; Rauscher et al.,
2008; Karmalkar et al., 2011). Precipitation decreases over most of the
CAC region, similar to the signal in driving global models (Campbell et
al., 2010; Hall et al., 2012). However, only a few downscaling studies
took into account key elements of the region’s climate, such as east-
erly wave activity, TCs, or interannual variability mechanisms linked to
ENSO (Karmalkar et al., 2011).
By century’s end, CMIP5 models project greatest warming in the CAC
region in JJA. Warming is projected to be larger over Central America
than the Caribbean in summer and winter (Figures AI.24, AI.2, Table
14.1). From October to March, ensemble mean projections indicate pre-
cipitation decrease in northern Central America, including Mexico. In the
Caribbean precipitation is projected to decrease in the south (consistent
with the observed trends) but to increase in the north (Figure AI.26).
From April to September, the projected zone of precipitation reduction
expands over the entire CAC region, and this signal is generally larger
than the models’ estimates of natural variability (Figure AI.27). Precipi-
tation changes projected by CMIP3, CMIP5 and a high-resolution model
show a similar reduction in parts of Mexico and the southern Caribbe-
an in DJFM, and in Central America and the Caribbean in JJAS (Figure
14.19). The CMIP5 ensemble shows greater agreement in the DJFM pre-
cipitation increase in the northern Caribbean sector than CMIP3. These
projected changes are also reflected in Table 14.1. Figures AI.26, AI.27
and Figure 14.19 suggest an intensification and southward displace-
ment of the East Pacific ITCZ, which can contribute to drying in southern
Central America (Karmalkar et al., 2011).
ENSO will continue to influence CAC climate, but changes in ENSO
frequency or intensity remain uncertain (Section 14.4). Projected drier
conditions may also be related to decreased frequency of TCs, though
the associated rainfall rate of these systems are higher in future pro-
jections (Section 14.6.1).
In summary, owing to model agreement on projections and the
degree of consistency with observed trends, it is likely warm-season
precipitation will decrease in the Caribbean region, over the coming
century. However, there is only medium confidencethat CentralAmer-
icawill experience a decrease in precipitation.
14.8.5 South America
South America (SA) is affected by several climate phenomena. ENSO
(Section 14.4) and Atlantic Ocean modes (Section14.3.4) have a role
in interannual variability of many regions. The SAMS (Section 14.2.3.2)
is responsible for rainfall over large areas, while the SACZ (Section
14.3.1.3) and Atlantic ITCZ (Section 14.3.1.1) also affect precipitation.
Teleconnections such as the PSA (Section 14.7.1), the SAM (Section
14.5.2) with related ETCs (Section 14.6.2)and the IOD (Section 14.3.3)
also influence climate variability. Table 14.3 summarizes the main phe-
nomena and their assessed relevance to climate change over SA.
Positive minimum temperature trends have been observed in SA
(Alexander et al., 2006; Marengo and Camargo, 2008; Rusticucci and
Renom, 2008; Marengo et al., 2009; Seneviratne et al., 2012; Skansi et
al., 2013). Glacial retreat in the tropical Andes was observed in the last
three decades (Vuille et al., 2008; Rabatel et al., 2013). In contrast to
the warming over the continental interior, a prominent but localized
coastal cooling was detected during the past 30 to 50 years, extending
from central Peru (Gutiérrez et al., 2011) to northern (Schulz et al.,
2012) and central Chile (Falvey and Garreaud, 2009). Observed pre-
cipitation changes include a significant increase in precipitation during
the 20th century over the southern sector of southeastern SA, a nega-
tive trend in SACZ continental area (Section 2.5.1; Barros et al., 2008),
a negative trend in mean precipitation and precipitation extremes in
central-southern Chile, and a positive trend in southern Chile (Haylock
et al., 2006; Quintana and Aceituno, 2012). Other detected changes
include positive extreme precipitation trends in southeastern SA, cen-
tral-northern Argentina and northwestern Peru and Ecuador (Section
2.6.2; Haylock et al., 2006; Dufek et al., 2008; Marengo et al., 2009; Re
and Barros, 2009; Skansi et al., 2013).
Table 14.2 provides an overall assessment of GCM quality for simula-
tions of temperature, precipitation and main phenomena in the sub-re-
gions of SA. In general, GCM results are consistent with observed tem-
perature tendencies (e.g., Haylock et al., 2006). Trends toward warmer
nights in CMIP3 models (Marengo et al., 2010b; Rusticucci et al., 2010)
are consistent with observed trends. CMIP3 models, however, do not
simulate the cooling ocean and warming land trends observed in the
last 30 years along subtropical western SA noted above. The number of
warm nights in SA is well represented in CMIP5 simulations (Sillmann
et al., 2013). CMIP5 models reproduce the annual cycle of precipitation
over SA, though the multi-model mean underestimates rainfall over
some areas (Figure 9.38). In tropical SA, rainy season precipitation is
better reproduced in the CMIP5 ensemble than CMIP3 (Figure 9.39).
CMIP3 models were able to simulate extreme precipitation indices
over SA (Rusticucci et al., 2010), but CMIP5 models improved them
globally (Sillmann et al., 2013). CMIP5 also improved simulations
of precipitation indices in the SAMS region (Kitoh et al., 2013; Sec-
tion 14.2.3.2). The main precipitation features are well represented
by regional models in several areas of SA (Solman et al., 2008; Alves
and Marengo, 2010; Chou et al., 2012; Solman et al., 2013). However,
regional models underestimate daily precipitation intensity in the La
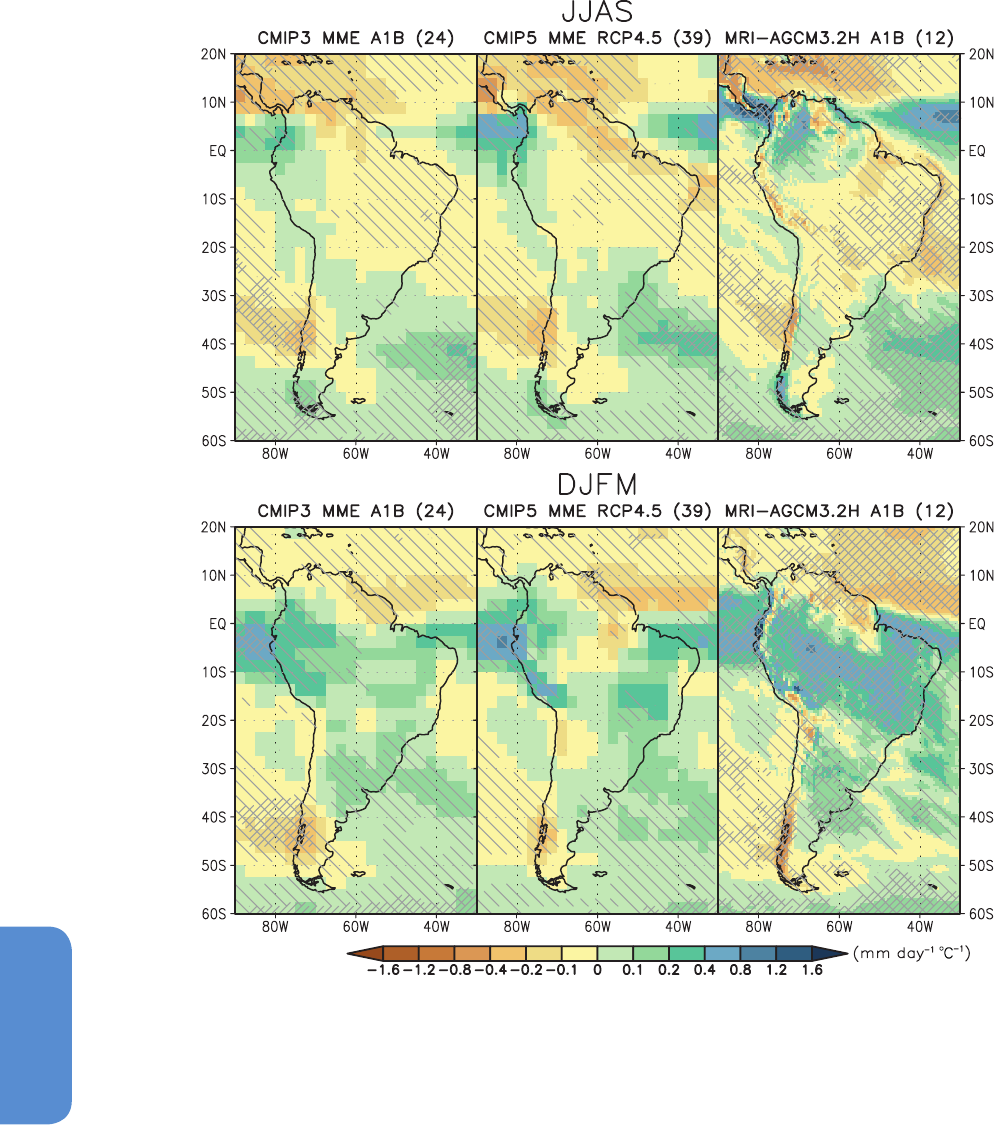
1262
Chapter 14 Climate Phenomena and their Relevance for Future Regional Climate Change
14
Plata Basin and in eastern Northeastern SA in DJF and almost over the
whole continent in JJA (Carril et al., 2012).
Regarding future projections, CMIP5 models indicate higher temper-
atures over all of SA, with the largest changes in southeastern Ama-
zonia by century’s end. (Figures AI.28, AI.29, Table 14.1). Temperature
changes projected by RCMs forced by a suite of CMIP3 models agree
thatthe largest warming occurs over the southern Amazon during aus-
tral winter. Regional models project a greater frequency of warm nights
over SA, except in parts of Argentina, and a reduction of cold nights
over the whole continent (Marengo et al., 2009). CMIP5 projections
confirm the results of CMIP3 in AR4 and SREX (see Section 12.4.9).
CMIP5 results confirm precipitation changes projected by CMIP3
models in the majority of SA regions, with increased confidence, as
more models agree in the changes (AI.30, AI.34, AI31, AI35). Inter-mod-
el spread in precipitation also decreased in some SA regions from
CMIP3 to CMIP5 (Blázquez and Nuñez, 2012). CMIP5 precipitation
Figure 14.20 | Maps of precipitation changes for South America in 2080–2099 with respect to 1986–2005 in June to September (above) and December to March (below) in the
SRES A1B scenario with 24 CMIP3 models (left), and in the RCP4.5 scenario with 39 CMIP5 models (middle). Right figures are the precipitation changes in 2075–2099 with respect
to 1979–2003 in the SRES A1B scenario with the 12-member 60-km mesh Meteorological Research Institute (MRI)- Atmospheric General Circulation Model 3.2 (AGCM3.2) multi-
physics, multi-SST ensembles (Endo et al., 2012). Precipitation changes are normalized by the global annual mean surface air temperature changes in each scenario. Light hatching
denotes where more than 66% of models (or members) have the same sign with the ensemble mean changes, while dense hatching denotes where more than 90% of models (or
members) have the same sign with the ensemble mean changes.
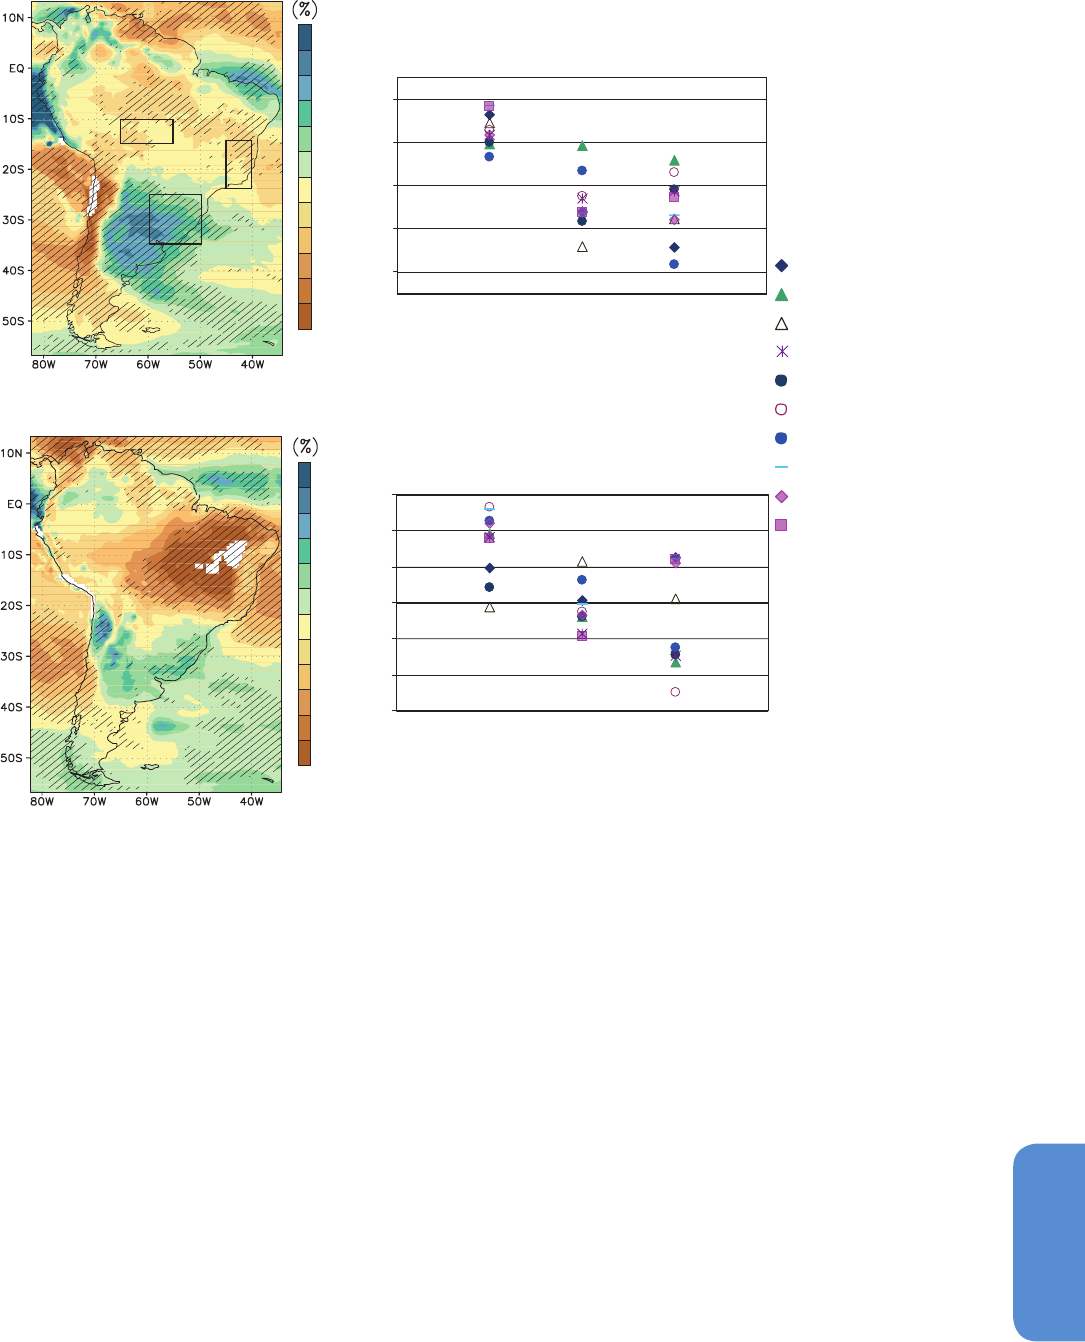
1263
Climate Phenomena and their Relevance for Future Regional Climate Change Chapter 14
14
projections for the end of the twenty-first century (2081–2100) show a
precipitation increase from October to March over the southern part of
Southeast Brazil and the La Plata Basin, the extreme south of Chile, the
northwest coast of SA, and the Atlantic ITCZ, extending to a small area
of the northeastern Brazil coast (Figures AI.30 and AI.34). Reduced
October to March rainfall isprojected in the extreme northern region
of SA, eastern Brazil, and central Chile. In eastern Amazonia and north-
eastern Brazil, CMIP5 models show both drying and moistening. This
uncertainty can also be seen in Table 14.1.
Figure 14.20 confirms that changes in northwestern, southwestern and
southeastern SA are consistent among CMIP3 and CMIP5 ensembles
and a high-resolution model ensemble, which gives more confidence in
these results. However, in eastern Amazonia and northeast and eastern
Brazil, there is less agreement. Results from high-resolution or regional
models forced by CMIP3 models provides further indication the pro-
jected changes are robust. A high-resolution regional model ensem-
ble projects precipitation increases during austral summer over the La
Plata Basin region, northwestern SA and southernmost Chile, and a
decrease over northern SA, eastern Amazonia, eastern Brazil, central
Chile and the Altiplano (Figure 14.21). Other regional models also pro-
ject a precipitation increase over the Peruvian coast and Ecuador and
a reduction in the Amazon Basin (Marengo et al., 2010b; Marengo et
al., 2012).
From April to September, the CMIP5 ensemble projects precipitation
increases over the La Plata Basin and northwestern SA near the coast
(Figures AI31, AI35). In contrast, a reduction is projected for northeast
-40
-20
0
20
40
-80
-60
-40
-20
0
20
40
ETA HADCM3
LMDZ IPSL
REMO ECHAM5
PROMES HADCM3
REGCM3 ECHAM5
RECGM3 HADCM3
RCA ECHAM5 1
RCA ECHAM5 2
RCA ECHAM5 3
LMDZ ECHAM5
Precipitation change A1B JJA
Precipitation change A1B DJF
-50
-40
-30
-20
-10
0
10
20
30
40
50
-50
-40
-30
-20
-10
0
10
20
30
40
50
(a)
(b)
(c)
(d)
SESA SACZ S-Amazonia
SESA SACZ S-Amazonia
Figure 14.21 | (a) December, January and February (DJF) and (b) June, July and August (JJA) relative precipitation change in 2071–2100 with respect to 1961–1990 in the A1B
scenario from an ensemble of 10 Regional Climate Models (RCMs) participating in the Europe–South America Network for Climate Change Assessment and Impact Studies-La
Plata Basin (CLARIS-LPB) Project. Hatching denotes areas where 8 out of 10 RCMs agree in the sign of the relative change. (c) DJF and (d) JJA dispersion among regional model
projections of precipitation changes averaged over land grid points in Southeastern South America (SESA, 35°S to 25°S, 60°W to 50°W), South Atlantic Convergence Zone (SACZ,
25°S to 15°S, 45°W to 40°W) and southern Amazonia (15°S to 10°S, 65°W to 55°W), indicated by the boxes in (a).

1264
Chapter 14 Climate Phenomena and their Relevance for Future Regional Climate Change
14
Brazil and eastern Amazonia. Precipitation is projected to decrease in
Central Chile, but to increase over extreme southern areas. In CMIP3
models, a precipitation reduction in the central Andes resulted from a
moisture transport decrease from the continental interior to the Alti-
plano(Minvielle and Garreaud, 2011). CMIP3 and CMIP5 models are
consistent in projecting drier conditions in eastern Amazonia during
the dry season and wetter conditions in western Amazonia (Malhi et
al., 2008; Cook et al., 2011). The Amazon forest’s future is discussed in
Section 12.5.5.6.1. Areas of maximum change in CMIP5 are consistent
with those of CMIP3 in JJA, agreeing also with a high-resolution model
ensemble (Figure 14.20). Increased precipitation in southeastern SA
is projected by a high-resolution model ensemble in all four seasons
(Blázquez et al., 2012). The austral winter precipitation increase over
the La Plata Basin and southern Chile, and the reduction in eastern
Amazonia and northeast Brazil, are also projected by RCMs (Figure
14.21) as in CMIP5 models. A relevant result from a RCM is the pre-
cipitation decrease over most of SA north of 20°S in austral spring,
suggesting a longer dry season (Sörensson et al., 2010; see also Section
14.2.3.2). Note that average CMIP5 spatial values in Table 14.1 are
consistent with changes seen in the maps, unless for the west coast of
SA, where there are spatial variations within the area and the values
do not reflect the changes.
Regional model projections and a high-resolution model ensemble
indicate an increase in the number of consecutive dry days in north-
eastern SA (Marengo et al., 2009; Kitoh et al., 2011). An increase in
heavy precipitation events over almost the entire continent, especially
Amazonia, southern Brazil and northern Argentina, is projected by a
high-resolution model ensemble (Kitoh et al., 2011) and in subtropical
areas of South America by regional models (Marengo et al., 2009).
Seneviratne et al. (2012) indicated low to medium confidence in CMIP3
SA precipitation trends. However, the increased ability of CMIP5 models
to represent extremes (Kitoh et al., 2013) provides higher confidence in
the signals discussed above (Section 14.2.3.2), consistent with global
changes in land areas (Section 12.4.5).
Precipitation changes projected over SA are consistent with El Niño
influences,for example, rainfall increase over southeastern and north-
western SA and decrease over eastern Amazonia. However, CMIP3
models could not represent certain features of ENSO well (Roxy et al.,
2013) and there is no consensus about future ENSO behaviour (Coelho
and Goddard, 2009; Collins et al., 2010) even with CMIP5 results (Sec-
tion 14.4). As the various types of ENSO produce different impacts on
SA (Ashok et al., 2007; Hill et al., 2011; Tedeschi et al., 2013), future
ENSO effects remain uncertain. It is very likely that ENSO remains the
dominant mode of interannual variability in the future (Section 14.4.2).
Therefore, regions in SA currently influenced by Pacific SST will contin-
ue to experience ENSO effects on precipitation and temperature.
Projected precipitation increases in the southern sector of south-
eastern SA are consistent with changes in the SACZ dipole (Section
14.3.1.3) and PSA (Section 14.7.1). Increased precipitation in this
region may also have a contribution from a more frequent and intense
Low Level Jet(Nuñez et al., 2009; Soares and Marengo, 2009). CMIP3
model analyses show little impact on extreme precipitation from SAM
changes toward century’s end, except in Patagonia (Menendez and
Carril, 2010). However, the southward shift of stormtracks associated
with the SAM’s projected positive trend (Reboita et al., 2009; Sec-
tion 14.5.2) impacts zones of cyclogenesis off the southeast SA coast
(Kruger et al., 2011; Section 12.4.4 ).
In summary, it is very likely temperatures will increase over the whole
continent, with greatest warming projected in southern Amazonia. It is
likely there will be an increase (reduction) in frequency of warm (cold)
nights in most regions. It is very likely precipitation willincrease in the
southern sector of southeastern and northwestern SA, and decrease
in Central Chile and extreme north of the continent. It is very likely
that less rainfall will occur in eastern Amazonia, northeast and east-
ern Brazil during the dry season. However, in the rainy season there
is medium confidence in the precipitation changes over these regions.
There is high confidence in an increase of precipitation extremes.
14.8.6 Europe and Mediterranean
This section assesses regional climate change in Europe and the North
African and West Asian rims of the Mediterranean basin. Area-average
summaries are presented for the three sub-regions of Northern Europe
(NEU), Central Europe (CEU) and Mediterranean (MED) (cf. Tables 14.1
to 14.2).
The most relevant climate phenomena for this region are NAO (Section
14.5.1), ETCs (Section 14.6.2) and blocking (Box 14.2, Folland et al.,
2009; Feliks et al., 2010; Dole et al., 2011; Mariotti and Dell’Aquila,
2012). These phenomena also interact with longer time-scale North
Atlantic ocean-atmosphere phenomena such as the AMO (Section
14.7.6, Mariotti and Dell’Aquila, 2012; Sutton and Dong, 2012). Other
phenomena have minor influence in limited sectors of the region (see
Supplementary Material Section 14.SM.6.3).
Recent 1981-2012 trends in annual mean temperature in each sub-
region exceed the global mean land trend as can be inferred from
Figure 2.22. Consistent with previous AR4 conclusions (Section 11.3),
recent studies of extreme events (Section 2.6.1) point to a very likely
increase of the number of warm days and nights, and decrease of the
number of cold days and nights, since 1950 in Europe. Heat waves
can be amplified by drier soil conditions resulting from warming (Vau-
tard et al., 2007; Seneviratne et al., 2010; Hirschi et al., 2011). Several
studies (Section 2.6.2.1) also indicate general increases in the intensity
and frequency of extreme precipitation especially in winter during the
last four decades however there are inconsistencies between studies,
regions and seasons.
The ability of climate models to simulate the climate in this region
has improved in many important aspects since AR4 (see Figure 9.38).
Particularly relevant for this region are increased model resolution and
a better representation of the land surface processes in many of the
models that participated in the recent CMIP5 experiment. Table 14.2
provides an assessment of the CMIP5 quality for simulations of tem-
perature, precipitation, and main phenomena in the region. The CMIP5
projections reveal warming in all seasons for the three sub-regions,
while precipitation projections are more variable across sub-regions
and seasons. In the winter half year (October to March), NEU and CEU
are projected to have increased mean precipitation associated with
increased atmospheric moisture, increased moisture convergence and
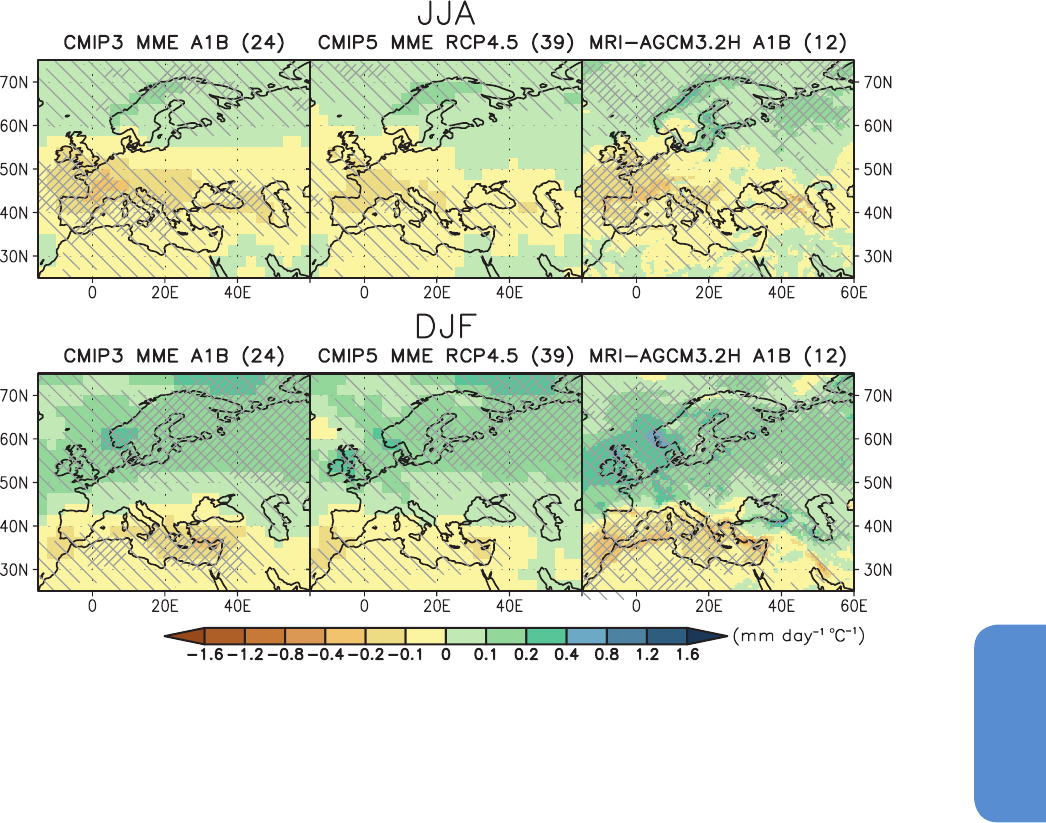
1265
Climate Phenomena and their Relevance for Future Regional Climate Change Chapter 14
14
intensification in ETC activity (Section 14.6.2 and Table 14.3) and no
change or a moderate reduction in the MED. In the summer half year
(April to September) , NEU and CEU mean precipitation are projected
to have only small changes whereas there is a notable reduction in
MED (see Table 14.1, Figures AI.36 to AI.37 and AI.42-AI.43). Figure
14.22 illustrates that the precipitation changes are broadly consistent
with the findings CMIP3.
High-resolution projections from the Japanese high-resolution model
ensemble also agree with these findings and are consistent with
downscaling results from coordinated multi-model GCM/RCM exper-
iments (e.g., ENSEMBLES, Déqué et al., 2012). In general, regional cli-
mate change amplitudes for temperature and precipitation follow the
global warming amplitude although modulated both by changes in the
large-scale circulation and by regional feedback processes (Kjellstrom
et al., 2011), which confirms assessments in AR4 (Christensen et al.,
2007).
Some new investigations have focussed on the uncertainties associat-
ed with model projections. A large ensemble of RCM-GCM shows that
the temperature response is robust in spite of a considerable uncer-
tainty related to choice of model combination (GCM/RCM) and sam-
pling (natural variability), even for the 2021–2050 time frame (Déqué
et al., 2012). Other studies based on CMIP3 projections suggest that
GHG-forced changes in the MED are likely to become distinguisha-
ble from the ‘noise’ created by internal decadal variations in decades
beyond 2020–2030 (Giorgi and Bi, 2009). It has been also shown using
an ensemble of RCM simulations that the removal of NAO-related var-
iability leads to an earlier emergence of change in seasonal mean tem-
peratures for some regions in Europe (Kjellström et al., 2013). Hence, in
the near term, decadal predictability is likely to be critically dependent
on the regional impacts of modes of variability ‘internal’ to the climate
system (Section 11.3). However, it has been shown that NAO trends do
not account for a large fraction of the long-term future change in mean
temperature or precipitation (Stephenson et al., 2006) and that large-
scale atmospheric circulation changes in CMIP5 models are not the
main driver of the warming projected in Europe by the end of the cen-
tury (2081–2100; Cattiaux et al., 2013). Therefore, changes in climate
phenomena contribute to the uncertainty in the near-term projections
rather than long-term changes in this region (Table 14.3), further sup-
porting the credibility in model projection (Table 14.2).
Recent studies have clearly identified a possible amplification of tem-
perature extremes by changes in soil moisture (Jaeger and Seneviratne,
Figure 14.22 | Maps of precipitation changes for Europe and Mediterranean in 2080–2099 with respect to 1986–2005 in June to August (above) and December to Febru-
ary (below) in the SRES A1B scenario with 24 CMIP3 models (left), and in the RCP4.5 scenario with 39 CMIP5 models (middle). Right figures are the precipitation changes in
2075–2099 with respect to 1979–2003 in the SRES A1B scenario with the 12 member 60 km mesh Meteorological Research Institute (MRI)-Atmospheric General Circulation
Model 3.2 (AGCM3.2) multi-physics, multi-sea surface temperature (SST) ensembles (Endo et al., 2012). Precipitation changes are normalized by the global annual mean surface air
temperature changes in each scenario. Light hatching denotes where more than 66% of models (or members) have the same sign with the ensemble mean changes, while dense
hatching denotes where more than 90% of models (or members) have the same sign with the ensemble mean changes.

1266
Chapter 14 Climate Phenomena and their Relevance for Future Regional Climate Change
14
2010; Hirschi et al., 2011), acting as a mechanism that further mag-
nifies the intensity and frequency of heat waves given the projected
enhance of summer drying conditions. This is in line with the assessed
results presented in SREX (Seneviratne et al., 2012). At the other end
of the spectrum, studies indicate that European winter variability may
be related to sea ice reductions in the Barents-Kara Sea (Petoukhov
and Semenov, 2010) and CMIP5 models in projections for the future in
general exhibit a similar relation until the summer sea ice has almost
disappeared (Yang and Christensen, 2012). Although the mechanism
behind this relation remains unclear this suggests that cold winters
in Europe will continue to occur in coming decades, despite an overall
warming.
Although climate models have improved fidelity in simulating aspects
of regional climates over Europe and the Mediterranean, the spread in
projections is still substantial, partly due to large amounts of natural
variability in this region (particularly NAO and AMO), besides the inher-
ent model deficiencies .
In summary, there is high confidence in model projections of mean
temperature in this region. It is very likely that temperatures will con-
tinue to increase throughout the 21st century over all of Europe and
the Mediterranean region. It is likely that winter mean temperature
will rise more in NEU than in CEU or MED, whereas summer warming
will likely be more intense in MED and CEU than in NEU. The length,
frequency, and/or intensity of warm spells or heat waves are assessed
to be very likely to increase throughout the whole region. There is
medium confidence in an annual mean precipitation increase in NEU
and CEU, while a decrease is likely in MED summer mean precipitation.
14.8.7 Africa
The African continent encompasses a variety of climatic zones. Here
the continent is divided into four major sub-regions: Sahara (SAH),
Western Africa (WAF), Eastern Africa (EAF) and Southern Africa (SAF).
A fifth Mediterranean region to the north of Sahara is discussed in
Section 14.8.6. In tropical latitudes, rainfall follows insolation (this sim-
plified picture is modified by the presence of orography, especially in
the Great Horn of Africa, the geography of the coastline, and by the
oceans). The most relevant phenomena affecting climate variability are
the monsoons (Section 14.2.4), ENSO (Section 14.4), Indian and Atlan-
tic Ocean SSTs (IOD, Section 14.3.3; AMM Section 14.3.4; AMO Section
14.7.6) and the atmospheric Walker Circulation (Section 2.7.5). Tropical
cyclones impact East African and Madagascan coastal regions (Section
14.6.1) and ETCs clearly impact southern Africa (Section 14.6.2).
Sub-Saharan Sahelian climate is dominated by the monsoonal system
that brings rainfall to the region during only one season (Polcher et al.,
2011). Most of the rain between May/June and September comes from
mesoscale ‘squall line’ systems that travel short distances in their life-
time (~1000 to 2000 km), and whose distribution is somewhat modi-
fied by the synoptic scale African Easterly Wave (Ruti and Dell’Aquila,
2010). The onset of the rainy season in West Africa is a key parame-
ter triggering changes in the vegetation and surface properties, that
implies feedbacks to the local atmospheric heat and moisture cycle.
The length and frequency of dry spells as well as the length or cumu-
lated rainfall of the season also affect this. All are affected by a large
interannual variability (Janicot et al., 2011). When evaluating models
their ability to reproduce such characteristics of the African monsoon
is essential. A large effect of natural multi-decadal SST and warming of
the oceans on Sahel rainfall is very likely (Hoerling et al., 2006; Ting et
al., 2009, 2011; Mohino et al., 2011; Rodriguez-Fonseca et al., 2011).
East Africa experiences a semi-annual rainfall cycle, driven by the ITCZ
movement across the equator. Direct links between the region’s rainfall
and ENSO have been demonstrated (Giannini et al., 2008) and refer-
ences therein), but variations in Indian Ocean SST (phases of the IOD)
are recognized as the dominant driver of east African rainfall variability
(Marchant et al., 2007). This feature acts to enhance rainfall through
either anomalous low-level easterly flow of moist air into the continent
(Shongwe et al., 2011), or a weakening of the low-level westerly flow
over the northern Indian Ocean that transports moisture away from
the continent (Black et al., 2003). Although the effect of the IOD is
evident in the short rainy season, Shongwe et al. (2011) do not find a
similar relationship for the long rains. Williams and Funk (2011), how-
ever, argue for a reduction in the long rains over Kenya and Ethiopia in
response to warmer Indian Ocean SSTs.
Variability in southern Africa’s climate is strongly influenced by its adja-
cent oceans (Rouault et al., 2003; Hansingo and Reason, 2008, 2009;
Hermes and Reason, 2009) as well as by ENSO (Vigaud et al., 2009;
Pohl et al., 2010). Although it is generally observed that El Niño events
correspond to conditions of below-average rainfall over much of south-
ern Africa (Mason, 2001; Giannini et al., 2008; Manatsa et al., 2008) the
ENSO teleconnection is not linear, but rather has complex influence in
which a number of regimes of local rainfall response can be identified
(Fauchereau et al., 2009). The extreme southwestern parts of southern
Africa receive rainfall in austral winter brought by mid-latitude frontal
systems mostly associated with passing ETCs, but the majority of the
region experiences a single summer rainfall season occurring between
November and April. A semi-permanent zone of sub-tropical conver-
gence is a major contributor to summer rainfall in sub-tropical southern
Africa (Fauchereau et al., 2009; Vigaud et al., 2012).
Because of its exceptional magnitude and its clear link to global SST,
20th century decadal rainfall variability in the Sahel is a test of GCMs
ability to produce realistic long-term changes in tropical precipitation.
Despite biases in the region (Cook and Vizy, 2006) the CMIP3 coupled
models overall can capture the observed correlation between Sahel
rainfall and basin-wide area averaged SST variability (Biasutti et al.,
2008) even though individual models may fail, especially at interan-
nual time scales (Lau et al., 2006; Joly et al., 2007). Recently, Ackerley
et al. (2011) used a perturbed physics ensemble and reached a similar
result for the role of atmospheric sulphate, confirming previous results
(Rotstayn and Lohmann, 2002; Held et al., 2005). Since AR4, only lim-
ited information about improved performance has been documented
and only in WAF have major efforts been focussing on relating model
behaviour with ability to simulate local climate processes in such
details. However, in a comparative study of the ability of CMIP3 and
CMIP5 to simulate multiple SST–Africa teleconnections, Rowell (2013)
found varying degrees of success in simulating these. In particular, no
clear indication of an improvement in the CMIP5 models vs. the CMI3
models was identified.
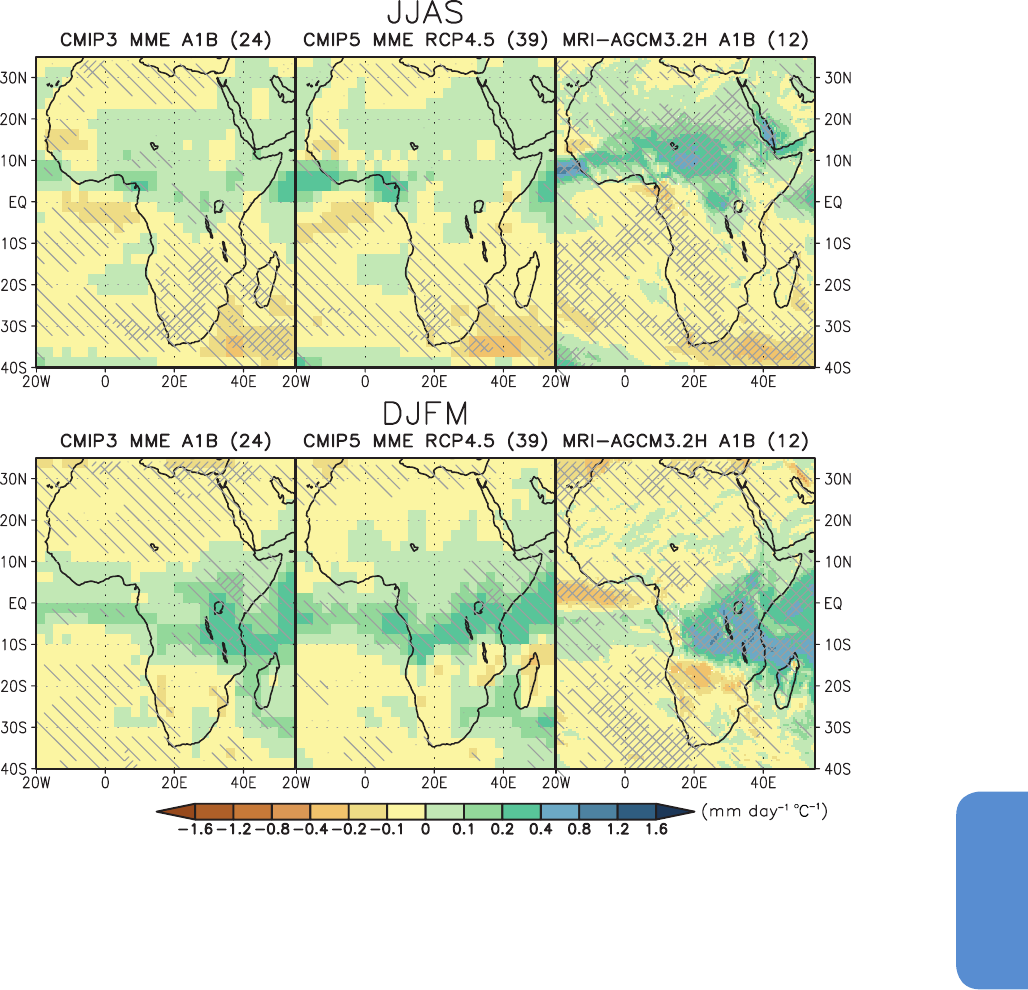
1267
Climate Phenomena and their Relevance for Future Regional Climate Change Chapter 14
14
In projections of the 21st century, the CMIP3 models produced both
significant drying and significant moistening (Held et al., 2005; Biasutti
and Giannini, 2006; Cook and Vizy, 2006; Lau et al., 2006), and the
mechanisms by which a model dries or wets the Sahel are not fully
understood (Cook, 2008). At least qualitatively, the CMIP3 ensem-
ble simulates a more robust response during the pre-onset and the
demise portion of the rainy season (Biasutti and Sobel, 2009; Seth et
al., 2011). Rainfall is projected to decrease in the early phase of the
seasons—implying a small delay in the main rainy season, but is pro-
jected to increase at the end of the season—implying an intensifica-
tion of late-season rains (d’Orgeval et al., 2006), although this appears
to be less robust in the CMIP5 models (Section 14.2.4). Projections of a
change in the timing of the rains is common to other monsoon regions
(Li et al., 2006; Biasutti and Sobel, 2009; Seth et al., 2011), including
southern Africa.
The relevance of a local effect is supported by several lines of evidence.
There is observational evidence that local soil moisture gradients can
trigger convective systems and that these surface contrasts are as
important as topography for generating these systems, which bring
most of the rain to the region (Taylor et al., 2011a, 2011b). Additional
evidence comes from simulations of future rainfall changes in West
Africa by RCMs subject to coupled model-derived boundary conditions
(Patricola and Cook, 2010), documenting a wetting response of the
Sahel to increased GHG in the absence of other forcings. But the rela-
tive importance of this effect versus the response to SST trends is not
well quantified, mostly due to the limitation of using a single RCM.
An evaluation of six GCMs over East Africa by Conway et al. (2007)
reveals no clear multi-model trend in mean annual rainfall by the
2080s, but some indications of increased SON and decreased March,
Figure 14.23 | Maps of precipitation changes for Africa in 2080–2099 with respect to 1986–2005 in June to September (above) and December to March (below) in the SRES
A1B scenario with 24 CMIP3 models (left), and in the RCP4.5 scenario with 39 CMIP5 models (middle). Right figures are the precipitation changes in 2075–2099 with respect
to 1979–2003 in the SRES A1B scenario with the 12-member 60-km mesh Meteorological Research Institute (MRI)-Atmospheric Generl Circulation Model 3.2 (AGCM3.2) multi-
physics, multi-sea surface temperature (SST) ensembles (Endo et al., 2012). Precipitation changes are normalized by the global annual mean surface air temperature changes in
each scenario. Light hatching denotes where more than 66% of models (or members) have the same sign with the ensemble mean changes, while dense hatching denotes where
more than 90% of models (or members) have the same sign with the ensemble mean changes.

1268
Chapter 14 Climate Phenomena and their Relevance for Future Regional Climate Change
14
April and May (MAM) rainfall are noted. They found inconsisten-
cy in how the models represent changes in the IOB and consequent
changes in rainfall over East Africa. Shongwe et al. (2011) analysed an
ensemble of 12 CMIP3 GCMs (forced with A1B emissions). They found
widespread increases in short season (OND) rainfall including extreme
precipitation across the region, with statistically significant ensemble
mean increases. For the long rains (MAM), similar changes in the sign
and magnitude of mean and extreme seasonal rainfall were seen, but
model skill in simulating the MAM season is relatively poor. The chang-
es shown for the short rains are consistent with a differential warming
of 21st century Indian Ocean SSTs, which leads to a positive IOD-like
state (see Section 14.3.3). The atmospheric consequence of this is a
weakening of the descending branch of the East African Walker Cell
and enhancement of low-level moisture convergence over east Africa
(Vecchi and Soden, 2007a; Shongwe et al., 2011).
In an assessment of 19 CMIP3 models run with the A1B emissions
forcing, Giannini et al. (2008) note a tendency toward a persistent El
Niño-like pattern (see Section 14.4) in the equatorial Pacific along with
a decrease in rainfall over southern Africa. Dynamical downscaling
of a single GCM by Engelbrecht et al. (2011) shows—for the austral
winter—an intensification of the southern edge of the subtropical high
pressure belt resulting in southward displacement of the mid-latitude
systems that bring frontal rain to the south western parts of the con-
tinent, thus resulting in decrease in rainfall. The decrease in summer
rainfall is consistent with high-resolution (18 km) RCM simulations
done by Haensler et al. (2011) which indicate widespread reductions in
rainfall over southern Africa under the A1B scenario.
Shongwe et al. (2009) identified reduction in spring (SON) rainfall
throughout the eastern parts of southern Africa. There is good consen-
sus amongst the models used, with the spring anomalies indicating a
trend toward later onset of the summer rainy season. Autumn (MAM)
reductions are shown for most of southern Africa while eastern South
Africa experiences no change and eastern parts of southern Africa
show a small increase.
Table 14.2 provides an overall assessment of CMIP5 quality for simula-
tions of temperature, precipitation, and main phenomena in the differ-
ent sub-regions of Africa. Overall, confidence in the projected precipi-
tation changes is at best medium. This is owing to the overall modest
ability of models to capture the most important phenomena having a
strong control on African climates (Table 14.3).
The ability of climate models to simulate historical climate, its change,
and its variability, has improved in many aspects since the AR4 (see
Section 9.6.1). But for Africa there is no clear evidence that the modest
increase in resolution and a better representation of the land surface
processes in many CMIP5 models have resulted in marked improve-
ments (e.g., Figure 9.39). The CMIP5 models projection for this century
is further warming in all seasons in the considered four sub-regions,
while precipitation show some distinct sub-regional and seasonally
dependent changes. In the October to March half year all four regions
are projected to receive practically unaltered precipitation amounts by
2081–2100, although somewhat elevated in RCP8.5. In the April to
September half year SAH, WAF and EAF will experience little change
but a quite notable reduction in SAF is projected (see Table 14.1,
Figures AI.40 to AI.51). This is consistent with the results from CMIP3
as depicted in Figure 14.23 in the West African monsoon wet season
and austral summer. High resolution information provided by the Japa-
nese high-resolution model ensemble also matches this finding.
In summary, given models’ ability to capture local processes, large
scale climate evolution and their linkages, it is very likely that all of
Africa will continue to warm during the 21st century. The overall qual-
ity of the CMIP5 models imply, that SAH already very dry is very likely
to remain very dry. But there is low confidence in projection statements
about drying or wetting of WAF. Owing to models’ ability to capture
the overall monsoonal behaviour, there is medium confidence in pro-
jections of a small delay in the rainy season with an increase at the
end of the season. There is medium confidence in projections showing
little change in mean precipitation in EAF and reduced precipitation in
the Austral winter in SAF, as models tend to represent Indian Ocean
SST developments with credibility. Likewise, increasing rainfall in EAF
is likely for the short rainy season, but low confidence exists in projec-
tions regarding drying or wetting in the long rainy season.
14.8.8 Central and North Asia
This area mostly covering the interior of a large continent extending
from the Tibetan plateau to the Arctic is mainly influenced by weath-
er systems coming from the west or south, giving some dependency
on the AAM (Section 14.2.2) on the one hand and NAO/NAM (Sec-
tion 14.5.1) on the other, with associated atmospheric blocking as an
additional phenomenon of influence related to the latter (Box 14.2). In
particular, the variability and long-term change of the climate system
in central Asia and northern Asia are closely related to variations of
the NAO and NAM (Takaya and Nakamura, 2005; Knutson et al., 2006;
Popova and Shmakin, 2010; Sung et al., 2010; Table 14.3).
As a part of the polar amplification, large warming trends in recent
decades are observed in the northern Asian sector (e.g., Figure 2.22).
The warming trend was particularly strong in the cold season (Novem-
ber to March), with an increase of 2.4°C per 50 years in the mid-lat-
itude semi-arid area of Asia, where the annual rainfall is within the
range of 200 to 600 mm over the period of 1901–2009 (Huang et
al., 2012). The observations indicate some increasing trends of heavy
precipitation events in northern Asia, but no spatially coherent trends
in central Asia (Seneviratne et al., 2012).
The CMIP5 models generally have difficulties in representing the mean
climate expressed as the climatological means of both temperature
and precipitation (Table 14.2) for the sub-regions represented in this
area, which is partly related to the poor resolution unable to resolve
the complex mountainous terrain dominating this region. But the
scarceness of observational data and issues related to how these best
can be compared with coarse resolution models adds to the uncertain-
ty regarding model quality.
The model projections presented in AR4 (Section 11.4) indicated strong
warming in northern Asia during winter and in central Asia during
summer. Precipitation was projected to increase throughout the year
in northern Asia with the largest fractional increase during winter. For
central Asia, a majority of the CMIP3 models projected decreasing
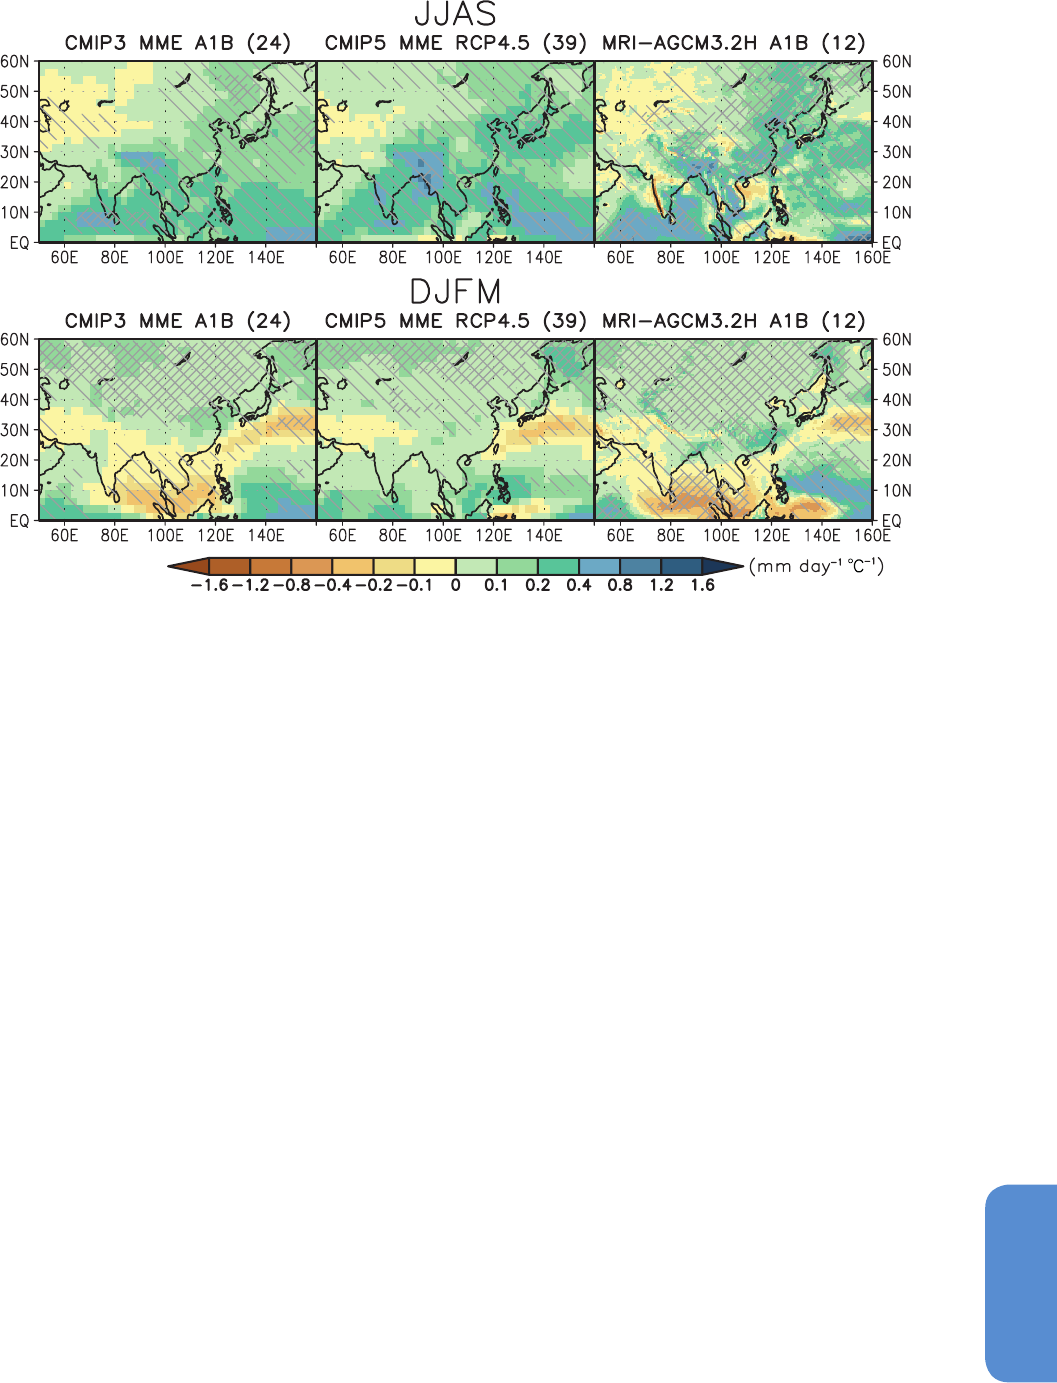
1269
Climate Phenomena and their Relevance for Future Regional Climate Change Chapter 14
14
Figure 14.24 | Maps of precipitation changes for Central, North, East and South Asia in 2080–2099 with respect to 1986–2005 in June to September (above) and December
to March (below) in the SRES A1B scenario with 24 CMIP3 models (left), and in the RCP4.5 scenario with 39 CMIP5 models (middle). Right figures are the precipitation changes
in 2075–2099 with respect to 1979–2003 in the SRES A1B scenario with the 12-member 60-km mesh Meteorological Research Institute (MRI)-Atmospheric General Circulation
Model 3.2 (AGCM3.2) multi-physics, multi-sea surface temperature (SST) ensembles (Endo et al., 2012). Precipitation changes are normalized by the global annual mean surface air
temperature changes in each scenario. Light hatching denotes where more than 66% of models (or members) have the same sign with the ensemble mean changes, while dense
hatching denotes where more than 90% of models (or members) have the same sign with the ensemble mean changes.
precipitation during spring and summer. Seneviratne et al. (2012) indi-
cate increases in all precipitation extreme indices for northern Asia and
in the 20-year return value of annual maximum daily precipitation for
central Asia. These projections are supported by output from CMIP5
models subject to various RCP scenarios (see Annex I). CMIP5 project-
ed temperature increase in Central Asia of comparable magnitude in
both JJA and in DJF. In North Asia, temperatures rise more in DJF than
in JJA, while less annual variation is found over Central Asia and the
Tibetan Plateau (Table 14.1, Figures AI.12 to AI.13, AI.52 to AI.55 and
AI.56 to AI.57).
With an RCM Sato et al. (2007) projected precipitation decreases over
northern Mongolia and increases over southern Mongolia in July. Soil
moisture over Mongolia decreases in July as a result of the combined
effect of decreased precipitation and increased potential evaporation
due to rising surface temperature. In North Asia, all CMIP5 models pro-
jects an increase in precipitation in the winter half year, and summer
half year precipitation is also projected to increase (Table 14.1; Figures
AI.14 to AI.15). In Central Asia and the Tibetan Plateau, model agree-
ment is lower on changes both for winter and summer precipitation
(Figure 14.24; Table 14.1; Figures AI.54 to AI.55 and AI.58 to AI.59). The
ability of these CMIP5 models to simulate precipitation over this region
varies (Table 14.3). The reasonable level of agreement in projections of
precipitation to be positive and significantly above the 20-year natural
variability (Table 14.2), and therefore suggests that confidence in the
sign of the projected change in future precipitation is medium.
In summary, all the areas are projected to warm, a stronger than global
mean warming trend is projected for northern Asia during winter.
For central Asia, warming magnitude is similar between winter and
summer. Precipitation in northern Asia will very likely increase, where-
as the precipitation over central Asia is likely to increase. Extreme pre-
cipitation events will likely increase in both regions.
14.8.9 East Asia
Summer is the rainy season for East Asia. The Meiyu-Changma-Baiu
rain band is the defining feature of East Asian summer climate, extend-
ing from eastern China through central Japan (Ding and Chan, 2005;
Zhou et al., 2009b). The summer rain band is anchored by the sub-
tropical westerly jet (Sampe and Xie, 2010), and located on the north-
western flank of the western North Pacific subtropical high (Zhou and
Yu, 2005). The wintertime circulation is characterized by monsoonal
northerlies between the Siberian High and the Aleutian Low.
Both the East Asian summer and winter monsoon circulations have
experienced an inter-decadal scale weakening after the 1970s due to
natural variability of the coupled climate system, leading to enhanced
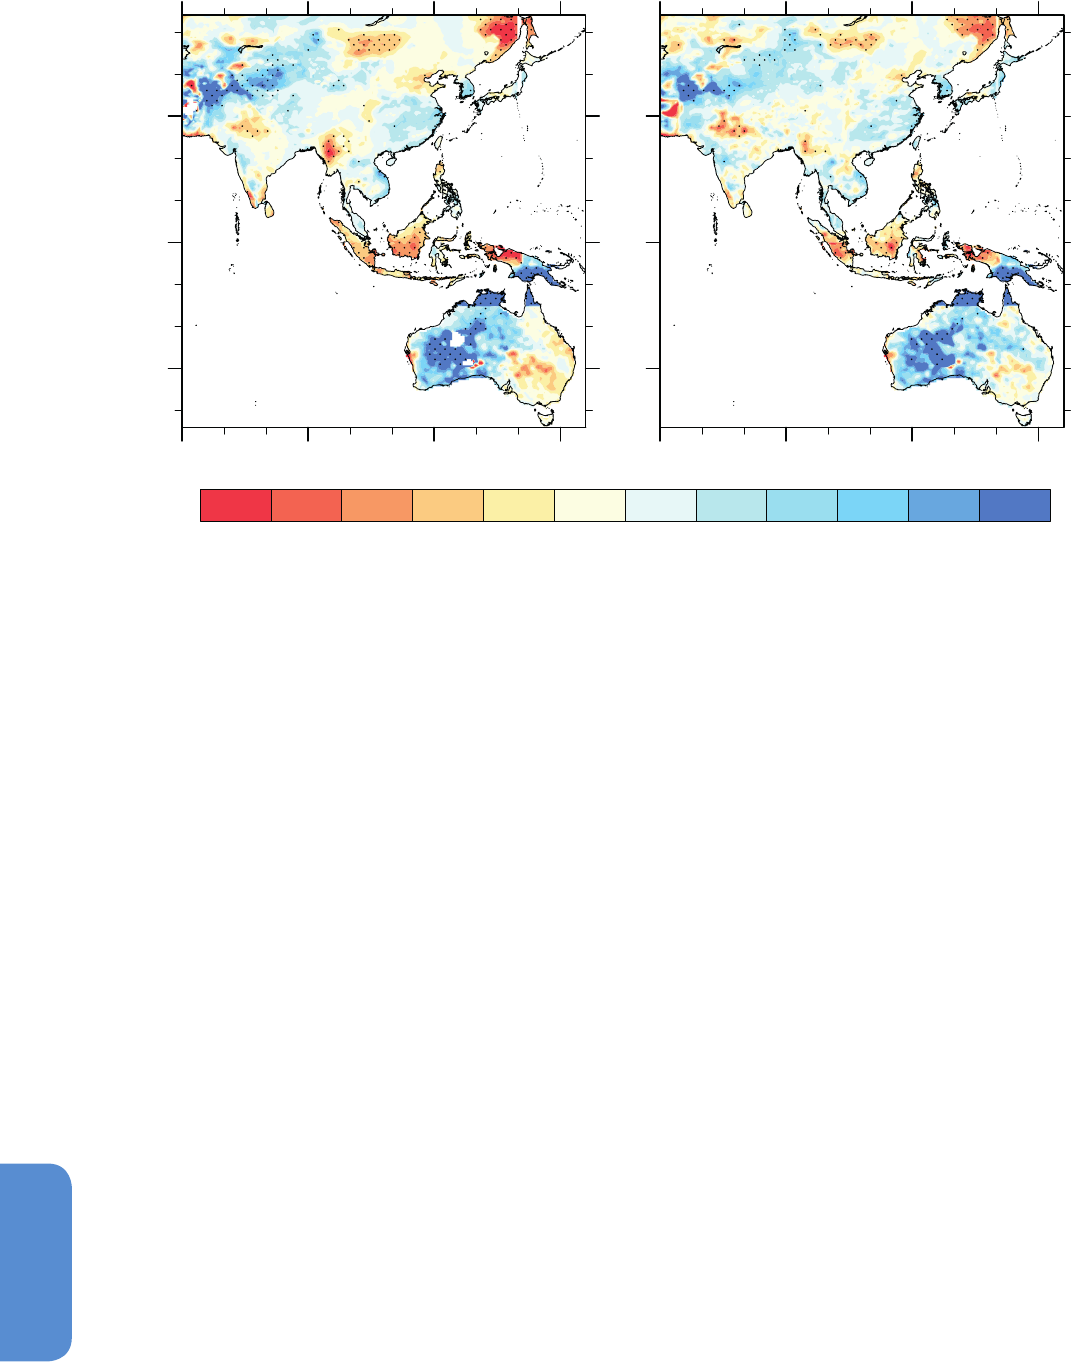
1270
Chapter 14 Climate Phenomena and their Relevance for Future Regional Climate Change
14
mean and extreme precipitation along the Yangtze River Valley (30°N)
but deficient mean precipitation in North China in summer (Figure
14.25), and a warmer climate in winter. The observed monsoon circu-
lation changes are partly reproduced by GCMs driven by PDO-related
SST patterns but the quality of precipitation simulation is poor (Zhou
et al., 2008a; Li et al., 2010a; Zhou and Zou, 2010).
In AR4, the regional warming is projected to be above the global
mean in East Asia (Christensen et al., 2007). “It is very likely that heat
waves/hot spells in summer will be of longer duration, more intense
and more frequent, but very cold days are very likely to decrease in
frequency. The precipitation is likely to increase in both boreal winter
and summer, while the frequency of intense precipitation events is very
likely to increase. Extreme rainfall and winds associated with tropical
cyclones are likely to increase”. CMIP5 results support many of these
assessments.
More recent analysis suggested that CMIP3 models projected
increased summer precipitation in amount and intensity over East
Asia (Figure 14.24 for SRES A1B scenario) due to enhanced mois-
ture convergence in a warmer climate (Ding et al., 2007; Sun and
Ding, 2010; Chen et al., 2011; Kusunoki and Arakawa, 2012), along
with an increase in interannual variability (Lu and Fu, 2010). CMIP5
projections for RCP4.5 support those from AR4 for summer (Figure
14.24), with 90% of the models projecting a precipitation increase
(% per 50 yr)
(a) PRCTOC
30 N
0
30 S
30 N
0
30 S
(c) R95
60 E
- 80 -48 -16 16 48 80
90 E 180 E 150 E 60 E 90 E 180 E 150 E
Figure 14.25 | Linear trend for local summer (a) total precipitation and (b) R95 (summer total precipitation when PR >95th percentile) during 1961–2006. The unit is % per
50-years. The trends statistically significant at the 5% level are dotted. The daily precipitation data over Australia and China are produced by the Australian Water Availability Project
(AWAP, Jones et al., 2009a) and National Climate Centre China of China Meteorological Administration (Wu and Gao, 2013), respectively, while that over the other area is compiled
by the Highly Resolved Observational Data Integration Towards the Evaluation of Water Resources (APHRODITE) project (Yatagai et al., 2012). The resolution of precipitation data
set is 0.5° × 0.5°. Local summer is defined as June, July and August in the Northern Hemisphere, and December, January and February in the Southern Hemisphere.
in the winter half year (see Table 14.1 and Figures AI.56 to AI.59).
CMIP3 models projections indicated a decrease of winter precipita-
tion extending northeastward from South China Sea to south of Japan
under SRES A1B scenario, changes seen in CMIP5 projections but with
smaller spatial coverage (Figure 14.24).
An increase of extreme precipitation is projected over East Asia in a
warmer climate (Jiang et al., 2011; Lee et al., 2011; Li et al., 2011a,
2011b). A high-resolution model projects an increase of Meiyu pre-
cipitation in May through July, Changma precipitation over Korean
peninsula in May, and Baiu precipitation over Japan in July (Kusunoki
and Mizuta, 2008), and an increase of heavy precipitation over East
Asia under SRES A1B scenario (Kusunoki and Mizuta, 2008; Endo,
2012). CMIP3 models project a late withdrawal of Baiu (Kitoh and
Uchiyama, 2006), as has been observed in eastern and western Japan
(Endo, 2010). There is a significant increase in mean, daily maximum
and minimum temperatures in southeastern China, associated with a
decrease in the number of frost days and an increase in the heat wave
duration under SRES A2 scenario (Chen et al., 2011). The CMIP5 model
projections also indicate an increase of temperature in both boreal
winter and summer over East Asia for RCP4.5 (Table 14.1). A decrease
of the annual and seasonal maximum wind speeds is found under SRES
A2 scenario due to both the reduced intensity of cold waves and the
reduced intensity of the winter monsoons (Jiang and Zhao, 2013).

1271
Climate Phenomena and their Relevance for Future Regional Climate Change Chapter 14
14
The future warming patterns simulated by RCMs essentially follow
those of the driving GCMs (e.g., Dairaku et al., 2008). For summer pre-
cipitation, however, RCM downscaling usually shows different regional
details due to more realistic topographic forcing than in GCMs (Gao et
al., 2008, 2012a). The uncertainty of precipitation projection in eastern
China is larger than that in western China (Gao et al., 2012b). RCM
downscaling indicates that both the seasonal mean summer rain-
fall and extreme precipitation around Japan Islands are projected to
increase (Im et al., 2008; Iizumi et al., 2012).
Projections with a 5-km RCM show that the heaviest hourly precipita-
tion is projected to increase even in the near future (2030s) when tem-
perature increase is modest (Kitoh et al., 2009). A southwest expan-
sion of the subtropical anticyclone over the northwestern Pacific Ocean
associated with El Niño-like mean state changes in the Pacific and a
dry air intrusion in the mid-troposphere from the Asian continent gives
a favourable condition for intense precipitation in the Baiu season in
Japan (Kanada et al., 2010). Increased water vapour supply from the
south of the Baiu front and an intensified frontal zone with intense
mean updrafts contribute to the increased occurrence of intense daily
precipitation during the late Baiu season (Kanada et al., 2012).
In summary, based on CMIP5 model projections, there is medium con-
fidence that with an intensified East Asian summer monsoon,summer
precipitation over East Asia will increase (Table 14.3). Under RCP4.5
scenario, precipitation increase is likely over East Asia during the Mei-
yu-Changma-Baiu season in May to July, and precipitation extremes
are very likely to increase over the eastern Asian continent in all sea-
sons and over Japan in summer. However, there is only low confidence
in more specific details of the projected changes due to the limited
skill of CMIP5 models in simulating monsoon features such as the East
Asian monsoon rainband (Table 14.2).
14.8.10 West Asia
This region extends from the Mediterranean to the western fringes of
South Asia, covering the Middle East and the Arabian Peninsula and
includes large areas of barren desert. The climate over this region
varies from arid to semi-arid and precipitation is primarily received in
the cold season.
The western part of the region is on the margin of Atlantic and Medi-
terranean influences, primarily the NAO (Section 14.5.1) during winter
months, and indirectly the monsoon heat low (Section 14.2.2.1) in the
summer months. Precipitation in this region comes largely from pass-
ing ETCs (Section 14.6.2). Land-falling TCs (Section 14.6.1) that occa-
sionally influence the eastern part of the Arabian Peninsula are notable
extreme events. Pacific Ocean variability, associated with ENSO (Sec-
tion 14.2.4), and the ITCZ (Section 14.3.1) are also known to impact
weather and climate in different parts of West Asia.
In recent decades, there appears to be a weak but non-significant
downward trend in mean precipitation (Zhang et al., 2005; Alpert et al.,
2008; AlSarmi and Washington, 2011; Tanarhte et al., 2012), although
intense weather events appear to be increasing (Alpert et al., 2002;
Yosef et al., 2009). In contrast, upward temperature trends are notable
and robust (Alpert et al., 2008; AlSarmi and Washington, 2011; Tanar-
hte et al., 2012).
The ability of climate models to simulate historical climate, its change
and its variability, has improved in many important aspects since the
AR4 (see Figure 9.39 in Chapter 9). CMIP5 models tend to be able to
reproduce the basic climate state of the region as well as the main
phenomena affecting it with some fidelity (Table 14.2), but the region
is at the fringes of the influence of different drivers of European, Asian
and African climates and remains poorly analysed in the peer-reviewed
literature with respect to climate model performances.
The CMIP5 model projections for this century are for further warming
in all seasons, while precipitation shows some distinct sub-regional
and seasonally dependent changes, characterized by model scatter. In
both winter (October to March) and summer (April to September) pre-
cipitation in general is projected to decrease, (see Table 14.1, Figures
AI.52 to AI.55). However, the various interacting dynamical influenc-
es on precipitation of the region (that models have varying success
in capturing in the current climate) results in uncertainty in both the
patterns and magnitude of future precipitation change. Indeed, while
the overall pattern of change has remained the same between CMIP3
and CMIP5, the confidence has decreased somewhat and the boundary
between the Mediterranean decreases and the general mid-latitude
increase to the north has shifted closer to the region (Figures 14.26 and
AI.54 to AI.55). So, although the Mediterranean side still appears likely
to become drier, the likely precipitation changes for the interior land
masses are less clear and the intensified and northward shifting ITCZ
may imply an increase in precipitation in the most southern part of the
Arabian Peninsula. Overall, the projections by the end of the century
(2081–2100) indicates little overall change, although with a tendency
for reduced precipitation, particular in the high end scenarios (Figures
AI.5 to AI.55). However, regardless of the sign of precipitation change
in the high mountain regions of the interior, the influence of warming
on the snow pack will very likely cause important changes in the timing
and amount of the spring melt (Diffenbaugh et al., 2013).
Recent downscaling results (Lionello et al., 2008; Evans, 2009; Jin et
al., 2010; Dai, 2011) suggest that the eastern Mediterranean will expe-
rience a decrease in precipitation during the rainy season due to a
northward displacement of the storm tracks (Section 14.6.2). A north-
ward shift in the ITCZ results in more precipitation in the southern part,
not previously being seriously affected by it. A moderate change in the
annual cycle of precipitation has also been simulated by some models.
Precipitation and temperature statistics in RCMs for an area consist-
ing of the western part of the Arab Peninsula was assessed by Black
(2009) and Onol and Semazzi (2009) confirming GCM-based findings.
Increased drought duration has been projected (Kim and Byun, 2009).
Inland from the Mediterranean coastal areas, resolution of the terrain
becomes more important and, while downscaled results (Evans, 2008;
Marcella and Eltahir, 2011; Lelieveld et al., 2012) broadly agree with
GCM projections, higher resolution results in some differences associ-
ated with mountain barrier jets (Evans, 2008; see also Figure 14.26).
In summary, since AR4 climate models appear to have only modest-
ly improved fidelity in simulating aspects of large-scale climate
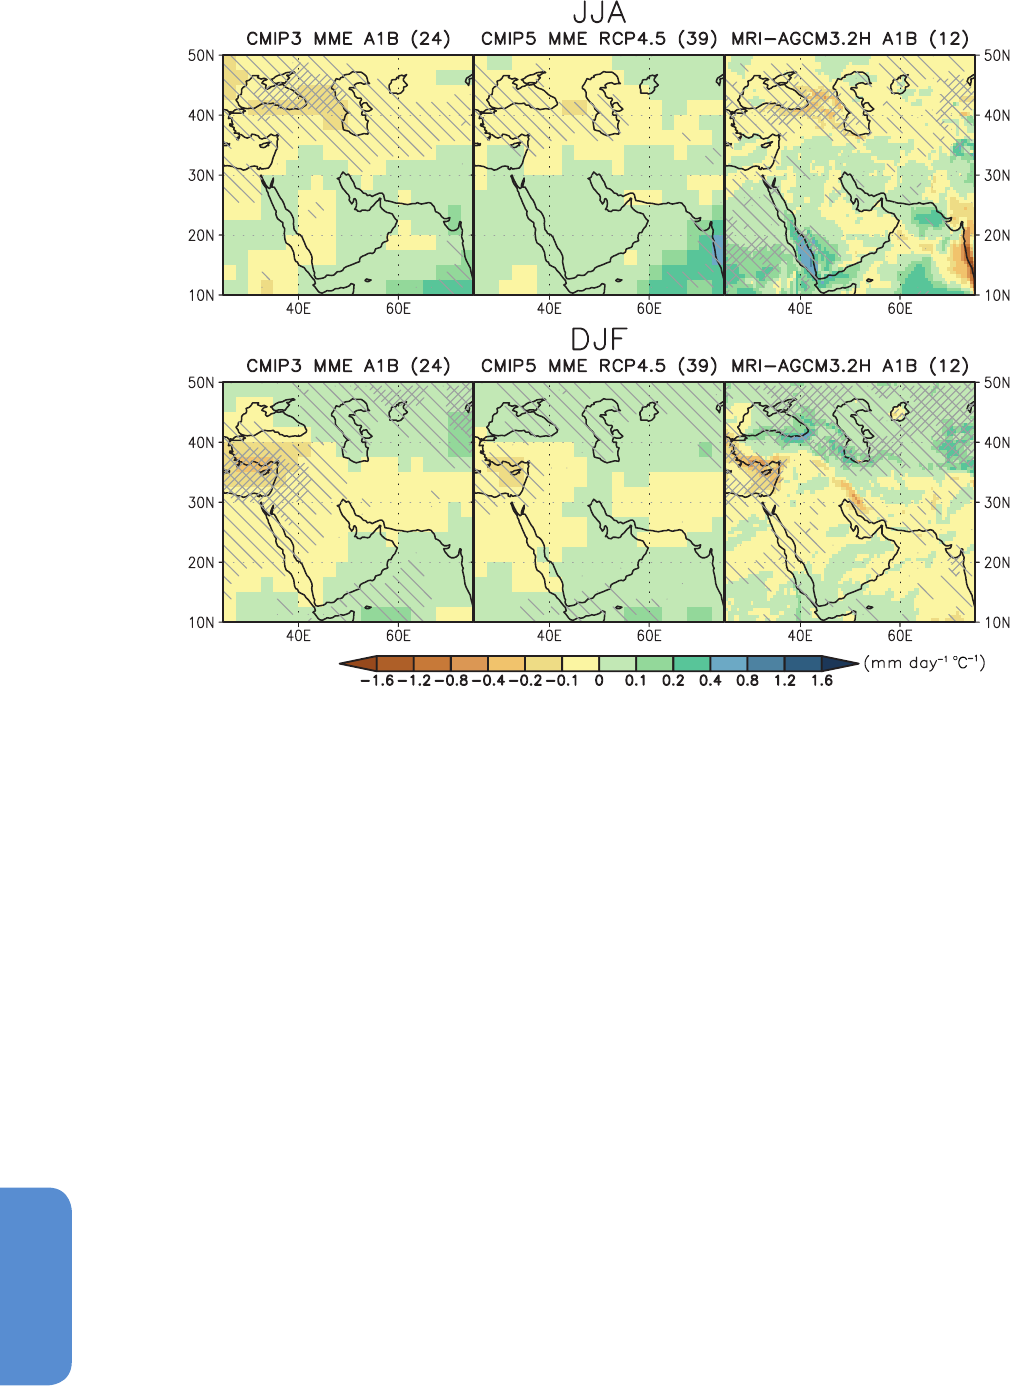
1272
Chapter 14 Climate Phenomena and their Relevance for Future Regional Climate Change
14
phenomena influencing regional climates over West Asia. Model
agreement, however, indicates that it is very likely that temperatures
will continue to increase. But at the same time, model agreement on
projected precipitation changes have reduced, resulting in medium
confidence in projections showing an overall reduction in precipitation.
14.8.11 South Asia
From June through September, the Indian summer monsoon (Section
14.2.2.1) dominates South Asia, while the northeast winter monsoon
contributes substantially to annual rainfall over southeastern India and
Sri Lanka. The winter weather systems are also important in northern
parts of South Asia, that is, the western Himalayas.
Seasonal mean rainfall shows interdecadal variability, noticeably a
declining trend with more frequent deficit monsoons (Kulkarni, 2012).
There are regional inhomogeneities: precipitation decreased over cen-
tral India along the monsoon trough (Figure 14.25) thought to be due
to a number of factors (Section 14.2.2) including black carbon, sul-
phate aerosols (Chung and Ramanathan, 2007; Bollasina et al., 2011),
land use changes (Niyogi et al., 2010) and SST rise over the Indo-Pacific
Figure 14.26 | Maps of precipitation changes for West Asia in 2080–2099 with respect to 1986–2005 in June, July and August (above) and December, January and February
(below) in the SRES A1B scenario with 24 CMIP3 models (left), and in the RCP4.5 scenario with 39 CMIP5 models (middle). The figures on the right are the precipitation changes
in 2075–2099 with respect to 1979–2003 in the SRES A1B scenario with the 12-member 60-km mesh Meteorological Research Institute (MRI)-Atmospheric General Circulation
Model 3.2 (AGCM3.2) multi-physics, multi-sea surface temperature (SST) ensembles (Endo et al., 2012). Precipitation changes are normalized by the global annual mean surface air
temperature changes in each scenario. Light hatching denotes where more than 66% of models (or members) have the same sign with the ensemble mean changes, while dense
hatching denotes where more than 90% of models (or members) have the same sign with the ensemble mean changes.
warm pool (Annamalai et al., 2013). The increase in the number of
monsoon break days over India (Dash et al., 2009), and the decline in
the number of monsoon depressions (Krishnamurthy and Ajayamohan,
2010), are consistent with the overall decrease in seasonal mean rain-
fall. The frequency of heavy precipitation events is increasing (Rajeevan
et al., 2008; Krishnamurthy et al., 2009; Sen Roy, 2009; Pattanaik and
Rajeevan, 2010), while light rain events are decreasing (Goswami et
al., 2006).
CMIP models reasonably simulate the annual cycle of precipitation and
temperature over South Asia (Table 14.2; Figure 9.38) but are limited
in simulating fine structures of rainfall variability on sub-seasonal and
sub-regional scales (Turner and Annamalai, 2012). CMIP5 models show
improved skill in simulating monsoon variability compared to CMIP3
(Sperber et al., 2012; Section 14.2.2).
Summer precipitation changes in South Asia are consistent overall
between CMIP3 and CMIP5 (Figure 14.24), but model scatter is large
in winter precipitation change (Figures 14.24 and AI.62). Changes in
the summer monsoon dominate annual rainfall (see Section 14.2.2).
The CMIP3 multi-model ensemble shows an increase in summer

1273
Climate Phenomena and their Relevance for Future Regional Climate Change Chapter 14
14
precipitation (Kumar et al., 2011a; May, 2011; Sabade et al., 2011),
although there are wide variations among model projections (Annam-
alai et al., 2007; Kripalani et al., 2007b). Spatially, the rainfall increase
is stronger over northern parts of South Asia, Bangladesh and Sri
Lanka, with a weak decrease over Pakistan (Turner and Annamalai,
2012). In RCP6.0 and RCP8.5 scenarios, frequency of extreme precip-
itation days shows consistent increasing trends in 2060 and beyond
(Chaturvedi et al., 2012; Figure AI.63). In six CMIP3 models, precipita-
tion anomalies during Indian summer monsoon breaks strengthen in a
warmer climate, but changes in the timing and duration of active/break
spells are variable among models (Mandke et al., 2007). Note that the
active/break spells of the monsoon are related to the MJO (see Section
14.3.2), a phenomenon that models simulate poorly (Section 9.5.2.3;
Lin et al., 2008a; Sperber and Annamalai, 2008).
High-resolution RCM and GCM projections showed an overall increase
of precipitation over a large area of peninsular India (Rupa Kumar et
al., 2006; Stowasser et al., 2009; Kumar et al., 2011a), but a significant
reduction in orographic rainfall in both seasonal mean and extreme
events on west coasts of India (Rajendran and Kitoh, 2008; Ashfaq et
al., 2009; Kumar et al., 2013). Such spatial variations in projected pre-
cipitation near orography are noticeable in Figure 14.24 on the back-
ground of the overall increase.
CMIP5 models project a clear increase in temperature over India
especially in winter (Figures AI.60 to AI.61), with enhanced warming
during night than day (Kumar et al., 2011a) and over northern India
(Kulkarni, 2012). In summer, extremely hot days and nights are project-
ed to increase. Table 14.1 summarizes the projected temperature and
precipitation changes for SAS in the RCP4.5 scenario based on CMIP5.
In summary, there is high confidence in projected rise in temperature.
There is medium confidence in summer monsoon precipitation increase
in the future over South Asia. Model projections diverge on smaller
regional scales.
14.8.12 Southeast Asia
Southeast Asia features a complex range of terrains and land–sea con-
trasts. Across the region, temperature has been increasing at a rate of
0.14°C to 0.20°C per decade since the 1960s (Tangang et al., 2007),
coupled with a rising number of hot days and warm nights, and a
decline in cooler weather (Manton et al., 2001; Caesar et al., 2011).
A positive trend in the occurrence of heavy (top 10% by rain amount)
and light (bottom 5%) rain events and a negative trend in moderate
(25 to 75%) rain events has been observed (Lau and Wu, 2007). Annual
total wet-day rainfall has increased by 22 mm per decade, while rain-
fall from extreme rain days has increased by 10 mm per decade (Alex-
ander et al., 2006; Caesar et al., 2011).
Several large-scale phenomena influence the climate of this region.
While ENSO (Section 14.4) influence is predominant in East Malay-
sia and areas east of it, Maritime continent monsoon (Section 14.2.3)
influences the climate in Peninsular Malaya. The impact of the IOD
(Section 14.3.3) is more prominent in eastern Indonesia. Thus climate
variability and trends differ vastly across the region and between
seasons. Between 1955 and 2005 the ratio of rainfall in the wet to
the dry seasons increased (Aldrian and Djamil, 2008). This appears to
be at least in part consistent with an upward trend of the IOD. While
an increasing frequency of extreme events has been reported in the
northern parts of South East Asia, decreasing trends in such events are
reported in Myanmar (Chang, 2011); see also Figure 14.25.
For a given region, strong seasonality in change is observed. In Penin-
sular Malaya during the southwest monsoon season, total rainfall and
the frequency of wet days decreased, but rainfall intensity increased in
much of the region (Deni et al., 2010). During the northeast monsoon,
total rainfall, the frequency of extreme rainfall events, and rainfall
intensity all increased over the peninsula (Suhaila et al., 2010).
High-resolution model simulations are necessary to resolve com-
plex terrain such as in Southeast Asia (Nguyen et al., 2012; Section
14.2.2.4). In a RCM downscaling simulation using the A1B emission
scenario (Chotamonsak et al., 2011), regional average rainfall was
projected to increase, consistent with a combination of the ‘warmer
getting wetter’ mechanism (Section 14.3.1), an increase in summer
monsoon, though there is a lack of consensus on future ENSO changes.
The spatial pattern of change is similar to that projected in the AR4
(Christensen et al., 2007, Section 11.4).
The median increase in temperature over land ranges from 0.8°C in
RCP2.6 to 3.2°C in RCP8.5 by the end of this century (2081–2100). A
moderate increase in precipitation is projected for the region: 1% in
RCP2.6 increasing to 8% in RCP8.5 by 2100 (Table 14.1, Supplemen-
tary Material Table 14.SM.1a to 14.SM.1c, Figures 14.27 and AI.64 to
AI.65). On islands neighbouring the southeast tropical Indian Ocean,
rainfall is projected to decrease during July to November (the IOD prev-
alent season), consistent with a slower oceanic warming in the east
than in the west tropical Indian Ocean, despite little change projected
in the IOD (Section 14.3.3).
In summary, warming is very likely to continue with substantial sub-re-
gional variations. There is medium confidence in a moderate increase in
rainfall, except on Indonesian islands neighbouring the southeast Indian
Ocean. Strong regional variations are expected because of terrain.
14.8.13 Australia and New Zealand
The climate of Australia is a mix of tropical and extratropical influenc-
es. Northern Australia lies in the tropics and is strongly affected by
the Australian monsoon circulation (Section 14.2.2) and ENSO (Section
14.4). Southern Australia extends into the extratropical westerly circu-
lation and is also affected by the middle latitude storm track (Section
14.6.2), the SAM (Section 14.5.2), mid-latitude transient wave propa-
gation, and remotely by the IOD (Section 14.3.3) and ENSO.
Eastern–northeastern Australian rainfall is strongly influenced by the
ENSO cycle, with La Niña years typically associated with wet conditions
and more frequent and intense tropical cyclones in summer, and El
Niño years with drier than normal conditions, most notably in spring.
The SAM plays a significant role in modulating southern Australian
rainfall, the positive SAM being associated with generally above-nor-
mal rainfall during summer (Hendon et al., 2007; Thompson et al.,
2011), but in winter with reduced rainfall, particularly in Southwest
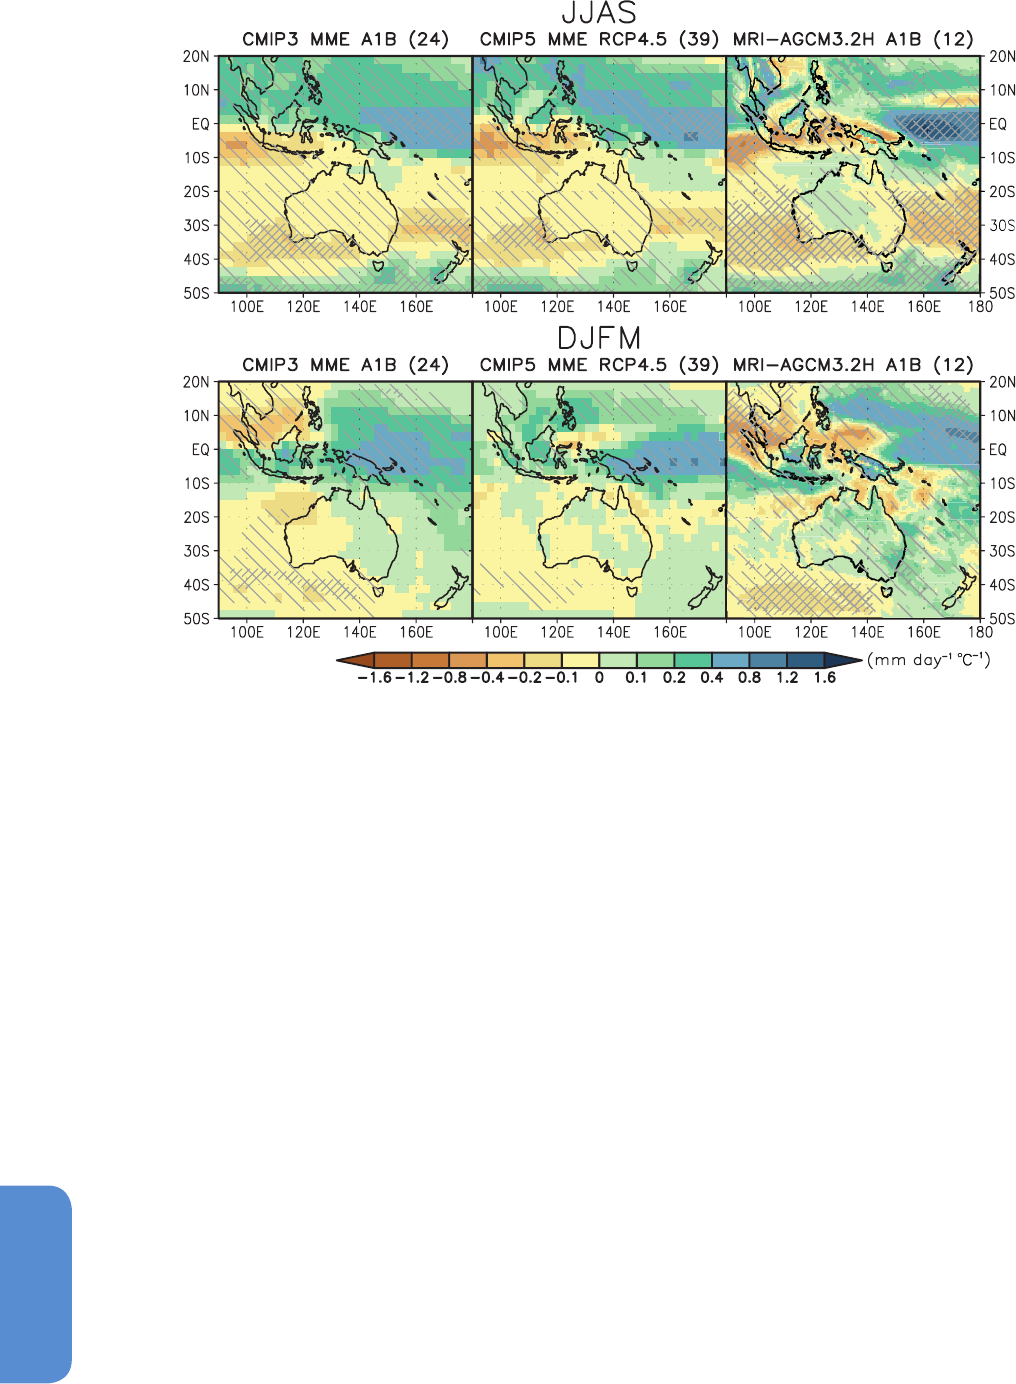
1274
Chapter 14 Climate Phenomena and their Relevance for Future Regional Climate Change
14
Western Australia (Hendon et al., 2007; Meneghini et al., 2007; Pezza
et al., 2008; Risbey et al., 2009; Cai et al., 2011c). Rossby wavetrains
induced by tropical convective anomalies associated with the IOD (Cai
et al., 2009), and associated with ENSO through its coherence with
the IOD (Cai et al., 2011b) also have a strong impact, leading to lower
winter and spring rainfall particularly over Southeastern Australia
during positive IOD and El Niño events. Along the eastern seaboard,
ETCs (Section 14.6.2) exert a strong influence on the regional climate,
while ENSO and other teleconnections play a lesser role (Risbey et al.,
2009; Dowdy et al., 2012).
Significant trends have been observed in Australian rainfall over recent
decades (Figure 14.25), varying vastly by region and season. Increasing
summer rainfall and decreasing temperature trends over northwest
Australia have raised the question of whether aerosols originating in
the NH play a role (Rotstayn et al., 2007; Shi et al., 2008b; Smith et al.,
2008; Rotstayn et al., 2009; Cai et al., 2011d), but there is no consensus
at present. By contrast, a prominent rainfall decline has been expe-
rienced in austral winter over southwest Western Australia (Cai and
Cowan, 2006; Bates et al., 2008) and in mid-to-late autumn over south-
Figure 14.27 | Maps of precipitation changes for Southeast Asia, Australia and New Zealand in 2080–2099 with respect to 1986–2005 in June to September (above) and Decem-
ber to March (below) in the SRES A1B scenario with 24 CMIP3 models (left), and in the RCP4.5 scenario with 39 CMIP5 models (middle). Right figures are the precipitation changes
in 2075–2099 with respect to 1979–2003 in the SRES A1B scenario with the 12-member 60- km mesh Meteorological Research Institute (MRI)-Atmospheric General Circulation
Model 3.2 (AGCM3.2) multi-physics, multi-sea surface temperature (SST) ensembles (Endo et al., 2012). Precipitation changes are normalized by the global annual mean surface air
temperature changes in each scenario. Light hatching denotes where more than 66% of models (or members) have the same sign with the ensemble mean changes, while dense
hatching denotes where more than 90% of models (or members) have the same sign with the ensemble mean changes.
eastern Australia (Murphy and Timbal, 2008). Over southwest Western
Australia, the decrease in winter rainfall since the late 1960s of about
20% have led to an even bigger (~50%) drop in inflow into dams. The
rainfall decline has been linked to changes in large-scale mean sea
level pressure (Bates et al., 2008), shifts in synoptic systems (Hope et
al., 2006), changes in baroclinicity (Frederiksen and Frederiksen, 2007),
the SAM (Cai and Cowan, 2006; Meneghini et al., 2007), land cover
changes (Timbal and Arblaster, 2006), anthropogenic forcing (Timbal
et al., 2006), Indian Ocean warming (England et al., 2006) and tele-
connection to Antarctic precipitation (van Ommen and Morgan, 2010).
Over southeastern Australia, the decreasing rainfall trend is largest
in autumn with sustained declines during the drought of 1997–2009,
especially in May (Cai and Cowan, 2008; Murphy and Timbal, 2008; Cai
et al., 2012a). The exact causes remain contentious, and for the decrease
in May, may include ENSO variability and long-term Indian Ocean
warming (Cai and Cowan, 2008; Ummenhofer et al., 2009b), a weak-
ening of the subtropical storm track due to decreasing baroclinic insta-
bility of the subtropical jet (Frederiksen et al., 2010; Frederiksen et al.,
2011a, 2011b) and a poleward shift the ocean–atmosphere circulation

1275
Climate Phenomena and their Relevance for Future Regional Climate Change Chapter 14
14
(Smith and Timbal, 2012; Cai and Cowan, 2013). The well-documented
poleward expansion of the subtropical dry zone (Seidel et al., 2008;
Johanson and Fu, 2009; Lucas et al., 2012), particularly in April and
May, is shown to account for much of the April–May reduction (Cai
et al., 2012a). Rainfall trends over southeastern Australia in spring, far
weaker but with a signature in the subtropical ridge (Cai et al., 2011a;
Timbal and Drosdowsky, 2012), have been shown to be linked with
trends and variability in the IOD (Cai et al., 2009; Ummenhofer et al.,
2009b). Antarctic proxy data that capture both eastern Australian rain-
fall and ENSO variability (Vance et al., 2012) show a predominance of
El Niño/drier conditions in the 20th century than was the average over
the last millennium.
On seasonal to decadal time scales, New Zealand precipitation is
modulated by the SAM (Kidston et al., 2009; Thompson et al., 2011),
ENSO (Kidson and Renwick, 2002; Ummenhofer and England, 2007)
and the IPO (Griffiths, 2007). Increased westerly flow across New Zea-
land, associated with negative SAM and with El Niño events, leads
to increased rainfall and generally lower than normal temperatures
in western regions. The positive SAM and La Niña conditions are gen-
erally associated with increased rainfall in the north and east of the
country, and warmer than normal conditions. On longer time scales,
a drying trend since 1979 across much of New Zealand during austral
summer is consistent with recent trends in the SAM and to a lesser
extent ENSO and the IPO (Griffiths, 2007; Ummenhofer et al., 2009a).
In western regions, however, the drying is accompanied by a trend
towards increased heavy rainfall (Griffiths, 2007). Temperatures over
New Zealand have risen by just under 1°C over the past century (Dean
and Stott, 2009). The upward trend has been modulated by an increase
in the frequency of cool southerly wind flows over the country since the
1950s, without which the observed warming is consistent with large-
scale anthropogenic forcing (Dean and Stott, 2009).
A recent analysis (Irving et al., 2012; their Figure 9) shows that climate
projections over Australia using CMIP5 models, which generally sim-
ulate the climate of Australia well (Watterson et al., 2013), are highly
consistent with existing CMIP3-derived projections. The projected
changes include a further 1.0 to 5.0°C temperature rise by the year
2070 (relative to 1990); a long-term drying over southern areas during
winter, particularly in the southwest (Figure 14.27), that is consistent
with an upward trend of the SAM (Pitman and Perkins, 2008; Shi et al.,
2008a; Cai et al., 2011c); a long-term rainfall decline over southern and
eastern areas during spring, in part consistent with a upward trend of
the IOD index (Smith and Chandler, 2010; Zheng et al., 2010; Weller
and Cai, 2013; Zheng et al., 2013). Precipitation change in northeast
Australia remains uncertain (Moise et al., 2012), related to the lack of
consensus over how ENSO may change (Collins et al., 2010; Section
14.4). In terms of climate extremes, more frequent hot days and nights
and less frequent cold days and nights are projected (Alexander and
Arblaster, 2009). Changes in the intensity and frequency of extreme
rainfall events generally follow the mean rainfall change (Kharin et al.,
2007), although there is an increase in most regions in the intensity of
short duration extremes (e.g., Alexander and Arblaster, 2009).
For New Zealand, future climate projections suggest further increases
in the westerlies in winter and spring, though model biases in jet lat-
itude in the present climate reduce confidence in the detail of future
projections (Barnes et al., 2010). The influence of poleward expansion
of the subtropical high-pressure belt is projected to lead to drier condi-
tions in parts of the country (Figure 14.27; Table 14.1), and a decrease
in westerly wind strength in northern regions. Such projections imply
increased seasonality of rainfall in many regions of New Zealand (Reis-
inger et al., 2010). Both flood and drought occurrence is projected
to approximately double over New Zealand during the 21st century,
under the SRES A1B scenario. Temperatures are projected to rise at
about 70% of the global rate, because of the buffering effect of the
oceans around New Zealand. Temperature rises are projected to be
smallest in spring (SON) while the season of greatest warming varies
by region around the country. Continued decreases in frost frequen-
cy, and increases in the frequency of high-temperature extremes, are
expected, but have not been quantified (Reisinger et al., 2010).
In summary, based on understanding of recent trends and on CMIP5
results, it is likely that cool season precipitation will decrease over
southern Australia associated in part with trends in the SAM, the IOD
and a poleward shift and expansion of the subtropical dry zone. It is
very likely that Australia will continue to warm through the 21st cen-
tury, at a rate similar to the global land surface mean. The frequency
of very warm days is very likely to increase through this century, across
the whole country.
It is very likely that temperatures will continue to rise over New Zea-
land. Precipitation is likely to increase in western regions in winter and
spring, but the magnitude of change is likely to remain comparable to
that of natural climate variability through the rest of the century. In
summer and autumn, it is as likely as not that precipitation amounts
will change.
14.8.14 Pacific Islands Region
The Pacific Islands region includes the northwest tropical Pacific, and
the tropical southwest Pacific. North of the Equator, the wet season
occurs from May to November. In the south, the wet seasons occurs
from November to April.
The phenomena mainly responsible for climate variations in the Pacif-
ic Islands are ENSO (Section 14.4), the SPCZ (Section 14.3.1.2), the
ITCZ (Section 14.3.1.1) and the WNPSM (Section 14.2.2.5). During El
Niño events, the ITCZ and SPCZ move closer to the equator, rainfall
decreases in western regions and increases in the central Pacific, and
tropical cyclone numbers tend to increase and to occur farther east
than normal (Diamond et al., 2012). During La Niña, the western trop-
ical Pacific tends to experience above-average numbers of tropical
cyclones (Nicholls et al., 1998; Lavender and Walsh, 2011).
The seasonal evolution of the SPCZ has a strong influence on the
seasonality of the climate of the southern tropical Pacific, particularly
during the wet season. The SPCZ moves northward during moderate
El Niño events and southward during La Niña events (Folland et al.,
2002; Vincent et al., 2011). During El Niño events, southwest Pacific
Island nations experience an increased occurrence of forest fires and
droughts (Salinger et al., 2001; Kumar et al., 2006b), and an increased
probability of tropical cyclone damage, as tropical cyclogenesis tends
to reside within 6° to 10° south of the SPCZ (Vincent et al., 2011).

1276
Chapter 14 Climate Phenomena and their Relevance for Future Regional Climate Change
14
Nauru experiences drought during La Niña as the SPCZ and ITCZ move
to the west (Brown et al., 2012c). During strong El Niño events (e.g.,
1982/1983, 1997/1998) the SPCZ undergoes an extreme swing of up
to 10 degrees towards the equator and collapses to a more zonally
oriented structure (Vincent et al., 2011; Section 14.3.2). The impacts
from these zonal SPCZ events are much more severe than those from
moderate El Niño events (Vincent et al., 2011; Cai et al., 2012b), and
can induce massive droughts and food shortages (Barnett, 2011).
Temperatures have increased at a rate between 0.1°C and 0.2°C per
decade throughout the Pacific Islands during the 20th century (Folland
et al., 2003). Changes in temperature extremes have followed those of
mean temperatures (Manton et al., 2001; Griffiths et al., 2005). During
1961–2000, locations to the northeast of the SPCZ became wetter,
with the largest trends occurring in the eastern Pacific Ocean (east of
160°W), while locations to the southwest of the SPCZ became drier
(Griffiths et al., 2003), indicative of a northeastward shift of the SPCZ.
Trends in the frequency of rain days were generally similar to those of
total annual rainfall (Manton et al., 2001; Griffiths et al., 2003). Since
1980, western Pacific monsoon- and ITCZ-related rain during June to
August has decreased (Hennessy et al., 2011).
Future projections for tropical Pacific Island nations are based on direct
outputs from a suite of CMIP3 models, updated using CMIP5 wherever
available (Brown et al., 2011; Hennessy et al., 2011; Irving et al., 2011;
Moise and Delage, 2011; Perkins, 2011; Perkins et al., 2012). These
projections carry a large uncertainty, even in the sign of change, as
discussed below and as evident in Table 14.1.
Annual average air and sea surface temperature are projected to con-
tinue to increase for all tropical Pacific countries. By 2055, under the
high A2 emissions scenario, the increase is projected to be 1°C to 2°C.
A rise in the number of hot days and warm nights is also projected, and
a decline in cooler weather, as already observed (Manton et al., 2001).
For a low-emission scenario, the lower range decreases about 0.5ºC
while the upper range reduces by between 0.2°C and 0.5°C.
To a large extent, the response of the ITCZ, the SPCZ, and the WNPSM
to greenhouse warming will determine how rainfall patterns will
change in tropical Pacific. In northwestern and near-equatorial regions,
rainfall during all seasons is projected to increase in the 21st century.
Wet season increases are consistent with the expected intensification
of the WNPSM and the ITCZ (Smith et al., 2012a). For the southwest-
ern tropical Pacific, the CMIP3 and CMIP5 ensemble mean change in
summer rainfall is far smaller than the inter-model range (Brown et
al., 2012b; Widlansky et al., 2013). There is a projected intensification
in the western part of the SPCZ and near the equator with little mean
change in SPCZ position (Brown et al., 2012a; Brown et al., 2012b).
For the southern group of the Cook Islands, the Solomon Islands, and
Tuvalu, average rainfall during the wet season is projected to increase;
and for Vanuatu, Tonga, Samoa, Niue, Fiji, a decrease in dry season
rainfall is accompanied by an increase in the wet season, indicating an
intensified seasonal cycle.
Extreme rainfall days are likely to occur more often in all regions related
to an intensification of the ITCZ and the SPCZ (Perkins, 2011). Although
the intensification appears to be reproduced in CMIP5 models (Brown
et al., 2012a), it has recently been questioned (Widlansky et al., 2013;
see Section 14.3.1). There are two competing mechanisms, the ‘wet
regions getting wetter’ and the ‘warmest getting wetter, or coldest get-
ting drier’ paradigms. These two mechanisms compete within much of
the SPCZ region. Based on a multi-model ensemble of 55 greenhouse
warming experiments, in which model biases were corrected, tropical
SST changes between 2°C to 3°C resulted in a 5% decrease of austral
summer moisture convergence in the current SPCZ region (Widlansky et
al., 2013). This projects a diminished rainy season for most Southwest
Pacific island nations. In Samoa and neighbouring islands, summer rain-
fall may decrease on average by 10 to 20% during the 21st century as
simulated by the hierarchy of bias-corrected atmospheric model experi-
ments. Less rainfall, combined with increasing surface temperatures and
enhanced potential evaporation, could increase the chance for longer-
term droughts in the region. Such projections are completely opposite
to those based on direct model outputs (Figure 14.27).
Recent downscaling experiments support the above conclusion regard-
ing the impact of biases on the SPCZ change, and suggest that the
projected intensification of the ITCZ may have uncertainties of a simi-
lar nature (Chapter 7 of Hennessy et al., 2011). In these experiments a
bias correction is applied to average sea surface temperatures, and the
atmosphere is forced with the ‘correct’ climatological seasonal cycle
together with warming derived from large-scale model outputs. The
results show opposite changes in much of the SPCZ and some of the
ITCZ regions, resulting in much lower confidence in rainfall projections.
Despite the uncertainty, there is general agreement in model projec-
tions regarding an increase in rainfall along the equator (Tables 14.1
and 14.2), and regarding a faster warming rate in the equatorial Pacific
than the off-equatorial regions (Xie et al., 2010b). A potential conse-
quence is an increase in the frequency of the zonal SPCZ events (Cai
et al., 2012b).
In summary, based on CMIP3 and CMIP5 model projections and
recently observed trends, it is very likely that temperatures, including
the frequency and magnitude of extreme high temperatures, will con-
tinue to increase through the 21st century. In equatorial regions, the
consistency across model projections suggests that rainfall is likely to
increase. However, given new model results and physical insights since
the AR4, the rainfall outlook is uncertain in regions directly affected by
the SPCZ and western portion of the ITCZ.
14.8.15 Antarctica
Much of the climate variability of Antarctica is modulated by the South-
ern Annular Mode (SAM, Section 14.5.2), the high-latitude atmospher-
ic response to ENSO (Section 14.4) and interactions between the two
(Stammerjohn et al., 2008; Fogt et al., 2011; see also Sections 2.7
and 10.3.3). Signatures of the SAM and ENSO in Antarctic tempera-
ture, snow accumulation and sea ice have been documented by many
observational and modelling studies (Bromwich et al., 2004; Guo et
al., 2004; Kaspari et al., 2004; van den Broeke and van Lipzig, 2004;
Marshall, 2007).
The positive SAM is associated on average with warmer conditions over
the Peninsula and colder conditions over East Antarctica, with a mixed

1277
Climate Phenomena and their Relevance for Future Regional Climate Change Chapter 14
14
and generally non-significant impact over West Antarctica (Kwok and
Comiso, 2002; Thompson and Solomon, 2002; van den Broeke and van
Lipzig, 2004). ENSO is associated with circulation anomalies over the
southeast Pacific that primarily affect West Antarctica (Bromwich et al.,
2004; Guo et al., 2004; Turner, 2004). ENSO variability tends to produce
out-of-phase variations between the western and eastern sectors of
West Antarctica (Bromwich et al., 2004; Kaspari et al., 2004), in associ-
ation with the PSA pattern (Section 14.7.1).
The positive summer/autumn trend in the SAM index in recent dec-
ades (Section 14.5.2) has been related to the contrasting temperature
trend patterns observed in these two seasons, with warming in the
east and north of the Antarctic Peninsula and cooling (or no significant
temperature change) over much of East Antarctica (Turner et al., 2005;
Thompson et al., 2011). The high polarity of the SAM is also consistent
with the significant increase in snow accumulation observed in the
southern part of the Peninsula (Thomas et al., 2008).
Unlike the eastern Antarctic Peninsula, its western coast shows maxi-
mum warming in austral winter (when the SAM does not exhibit any
significant trend), which has been attributed to reduced sea ice con-
centrations in the Bellingshausen Sea. Recent studies have emphasized
the role of tropical SST forcing not directly linked to ENSO to explain
the prominent spring- and wintertime atmospheric warming in West
Antarctica (Ding et al., 2011; Schneider et al., 2012). There is further
evidence of tropical SST influence on Antarctic temperatures and pre-
cipitation on decadal to inter-decadal time scales (Monaghan and
Bromwich, 2008; Okumura et al., 2012).
Modelling of Antarctic climate remains challenging, in part because of
the nature of the high-elevation ice sheet in the east Antarctic and its
effects on regional climate (Section 9.4.1.1). Moreover, modelling ice
properties themselves, for both land ice and sea ice, is an area that is
still developing despite improvements in recent years (Vancoppenolle
et al., 2009; Picard et al., 2012; Section 9.4.3). Modelling the role of the
stratosphere and of ozone recovery is critical for Antarctic climate, as
stratospheric change is intimately linked to trends in the SAM (Section
14.5.2).
The projected easing of the positive SAM trend in austral summer
(Section 14.5.2) may act to delay future loss of Antarctic sea ice (Bitz
and Polvani, 2012; Smith et al., 2012b). It is unclear what effect ENSO
will have on future Antarctic climate change as the ENSO response to
climate change remains uncertain (see 12.4.4.1 and 14.5.2 for more
information). Seasonally, changes in the strength of the circumpo-
lar westerlies are also expected during the 21st century as a result
of changes in the semi-annual oscillation caused by alterations in the
mid- to high-latitude temperature gradient in the SH. Bracegirdle et
al. (2008) considered modelled circulation changes over the Southern
Ocean and found a more pronounced strengthening of the autumn
peak of the semi-annual oscillation compared with the spring peak.
Future changes in surface temperature over Antarctica are likely to be
smaller than the global mean, and much smaller than those projected
for the Arctic, because of the buffering effect of the southern oceans,
and the thermal mass of the east Antarctic ice sheet (Section 12.4.6).
Warming is likely to bring increased precipitation on average across
Antarctica (Bracegirdle et al., 2008), but the spatial pattern of precipi-
tation change remains uncertain.
In summary, consistency across CMIP5 projections suggests it is very
likely that Antarctic temperatures will increase through the rest of
the century, but more slowly than the global mean rate of increase
(Table 14.1). SSTs of the oceans around Antarctica are likely to rise
more slowly than surface air temperature over the Antarctic land mass.
As temperatures rise, it is also likely that precipitation will increase
(Table 14.1), up to 20% or more over the East Antarctic. However, given
known difficulties associated with correctly modelling Antarctic cli-
mate, and uncertainties associated with future SAM and ENSO trends
and the extent of Antarctic sea ice, precipitation projections have only
medium confidence.

1278
Chapter 14 Climate Phenomena and their Relevance for Future Regional Climate Change
14
Table 14.1 | Temperature and precipitation projections by the CMIP5 global models. The figures shown are averages over SREX regions (Seneviratne et al., 2012) of the projections
by a set of 42 global models for the RCP4.5 scenario. Added to the SREX regions are a six other regions including the two Polar Regions, the Caribbean, Indian Ocean and Pacific
Island States (see Annex I for further details). The 26 SREX regions are: Alaska/NW Canada (ALA), Eastern Canada/Greenland/Iceland (CGI), Western North America (WNA), Central
North America (CNA), Eastern North America (ENA), Central America/Mexico (CAM), Amazon (AMZ), NE Brazil (NEB), West Coast South America (WSA), Southeastern South America
(SSA), Northern Europe (NEU), Central Europe (CEU), Southern Europe/the Mediterranean (MED), Sahara (SAH), Western Africa (WAF), Eastern Africa (EAF), Southern Africa (SAF),
Northern Asia (NAS), Western Asia (WAS), Central Asia (CAS), Tibetan Plateau (TIB), Eastern Asia (EAS), Southern Asia (SAS), Southeastern Asia (SEA), Northern Australia (NAS) and
Southern Australia/New Zealand (SAU). The area-mean temperature and precipitation responses are first averaged for each model over the 1986–2005 period from the historical
simulations and the 2016–2035, 2046–2065 and 2081–2100 periods of the RCP4.5 experiments. Based on the difference between these two periods, the table shows the 25th,
50th and 75th percentiles, and the lowest and highest response among the 42 models, for temperature in degrees Celsius and precipitation as a percent change. Regions in which
the middle half (25 to 75%) of this distribution is all of the same sign in the precipitation response are coloured light brown for decreasing precipitation and light green for increas-
ing precipitation. Information is provided for land areas contained in the boxes unless otherwise indicated. The temperature responses are averaged over the boreal winter and
summer seasons; December, January and February (DJF) and June, July and August (JJA) respectively. The precipitation responses are averaged over half year periods, boreal winter;
October, November, December, January, February and March (ONDJFM) and summer; April, May, June, July, August and September (AMJJAS).
(continued on next page)
RCP4.5 Temperature (°C) Precipitation (%)
REGION MONTH
a
Year min 25% 50% 75% max min 25% 50% 75% max
(land) DJF 2035 0.6 1.5 1.7 2.2 4.2 3 7 9 11 19
2065 0.4 3.0 3.4 4.5 8.0 5 14 17 21 37
2100 –0.9 3.7 5.0 6.2 10.0 –2 18 24 30 50
JJA 2035 0.3 0.8 1.0 1.2 3.0 –3 4 5 7 20
2065 0.5 1.3 1.8 2.3 4.8 1 7 10 12 34
2100 0.3 1.8 2.2 3.0 6.0 –2 10 13 17 39
Annual 2035 0.4 1.3 1.5 1.7 3.8 1 5 6 8 20
2065 0.3 2.4 2.8 3.5 6.4 3 11 13 15 35
2100 –0.4 3.0 3.9 4.7 7.8 –2 14 17 21 43
(sea) DJF 2035 0.2 2.2 2.8 3.3 6.7 –1 7 9 15 25
2065 –0.5 4.2 5.1 6.8 11.4 –2 14 18 25 39
2100 –2.2 5.4 7.0 9.1 14.8 –10 23 26 37 48
JJA 2035 0.1 0.5 0.6 0.7 1.9 –3 4 6 7 17
2065 0.0 0.8 1.2 1.4 2.9 –2 9 11 14 23
2100 –0.3 1.2 1.5 2.1 4.0 –3 12 16 18 29
Annual 2035 0.2 1.5 2.0 2.3 4.7 0 6 8 9 21
2065 –0.1 2.9 3.7 4.7 7.4 –1 11 13 20 28
2100 –1.0 3.7 4.9 6.5 9.3 –7 16 21 26 37
High latitudes
Canada/ DJF 2035 –0.2 1.2 1.7 1.9 3.1 0 4 5 9 14
Greenland/ 2065 0.6 2.8 3.4 3.9 6.6 3 9 12 15 21
Iceland 2100 –0.5 3.2 4.6 5.6 8.1 –2 11 15 22 32
JJA 2035 0.1 0.7 1.0 1.2 3.0 0 2 3 4 8
2065 0.5 1.3 1.8 2.3 4.5 2 5 6 9 16
2100 0.2 1.7 2.3 3.0 5.6 1 6 9 12 20
Annual 2035 0.2 1.1 1.3 1.6 2.9 0 3 4 6 9
2065 0.4 2.0 2.5 2.9 5.2 3 7 9 11 17
2100 –0.2 2.6 3.2 4.0 6.4 0 10 11 15 22
North Asia DJF 2035 0.5 1.1 1.5 2.2 4.0 2 6 8 10 22
2065 1.2 2.3 3.0 3.6 6.0 5 11 14 18 34
2100 0.2 3.0 3.8 4.9 7.8 5 13 18 22 44
JJA 2035 0.1 0.8 1.0 1.4 2.5 1 2 4 6 16
2065 0.8 1.5 2.0 2.7 4.4 –1 5 8 10 21
2100 0.8 1.9 2.4 3.5 5.1 –3 6 9 12 30
Annual 2035 0.4 1.1 1.3 1.6 3.0 1 4 5 7 18
2065 0.8 2.0 2.4 2.9 4.9 2 8 9 12 25
2100 0.2 2.5 3.2 3.8 5.8 1 10 12 15 35

1279
Climate Phenomena and their Relevance for Future Regional Climate Change Chapter 14
14
Table 14.1 (continued)
(continued on next page)
RCP4.5 Temperature (°C) Precipitation (%)
REGION MONTH
a
Year min 25% 50% 75% max min 25% 50% 75% max
North America
Alaska/ DJF 2035 0.0 1.1 1.7 2.4 3.4 –1 3 5 8 12
NW Canada 2065 1.2 2.8 3.6 4.8 7.4 3 9 11 17 29
2100 2.3 3.5 4.8 5.9 9.7 7 11 17 21 42
JJA 2035 0.3 0.7 1.0 1.4 2.8 –1 2 5 7 16
2065 0.7 1.3 1.8 2.3 4.9 –2 6 10 12 29
2100 0.9 1.8 2.2 3.1 5.2 –2 9 12 16 34
Annual 2035 0.4 1.0 1.4 1.8 2.8 0 3 6 7 14
2065 1.4 2.1 2.7 3.6 5.2 4 8 10 13 28
2100 1.7 2.5 3.5 4.3 6.7 3 11 14 17 33
West North DJF 2035 –0.4 0.7 1.1 1.5 2.5 –2 0 3 4 8
America 2065 0.9 1.7 2.2 2.6 4.0 –3 3 4 6 11
2100 1.3 2.2 2.6 3.4 5.2 –4 4 6 8 17
JJA 2035 0.3 0.9 1.1 1.3 2.1 –6 –1 1 3 9
2065 0.8 1.7 2.0 2.6 3.4 –7 –1 1 4 10
2100 0.9 2.1 2.5 3.4 4.6 –8 –1 2 6 10
Annual 2035 0.3 0.8 1.0 1.3 1.9 –4 –1 2 3 6
2065 0.9 1.7 2.0 2.5 3.4 –3 1 3 5 11
2100 1.1 2.0 2.6 3.4 4.3 –4 2 4 6 14
Central North DJF 2035 –0.1 0.7 1.1 1.6 2.9 –8 –1 1 5 11
America 2065 0.9 1.6 2.2 2.7 4.2 –7 1 4 7 17
2100 1.2 2.0 2.7 3.6 4.9 –6 –1 4 9 18
JJA 2035 0.3 0.8 1.1 1.4 2.3 –7 –2 0 3 9
2065 0.9 1.7 2.1 2.5 3.5 –16 –1 2 5 12
2100 1.0 2.1 2.5 3.1 4.6 –13 –1 2 5 13
Annual 2035 0.4 0.9 1.1 1.3 2.0 –4 –1 1 3 7
2065 1.0 1.7 2.0 2.4 3.4 –7 0 3 4 14
2100 1.1 2.0 2.6 3.1 4.3 –4 0 3 6 10
Eastern North DJF 2035 0.0 0.8 1.1 1.7 2.2 –6 0 3 7 12
America 2065 0.9 1.7 2.4 2.8 4.1 –2 4 7 9 18
2100 0.7 2.2 2.9 3.8 4.8 –4 6 9 12 20
JJA 2035 0.1 0.8 1.0 1.2 1.9 –4 0 3 5 9
2065 0.8 1.5 2.0 2.4 3.9 –6 2 4 6 14
2100 1.0 2.0 2.5 3.1 4.8 –7 2 5 7 14
Annual 2035 0.4 0.8 1.1 1.3 1.9 –4 1 3 5 9
2065 1.0 1.7 2.1 2.4 3.5 –1 3 5 7 14
2100 1.0 2.1 2.7 3.1 4.2 –2 4 7 9 14

1280
Chapter 14 Climate Phenomena and their Relevance for Future Regional Climate Change
14
Table 14.1 (continued)
(continued on next page)
RCP4.5 Temperature (°C) Precipitation (%)
REGION MONTH
a
Year min 25% 50% 75% max min 25% 50% 75% max
Central America
Central DJF 2035 0.3 0.6 0.8 0.9 1.3 –8 –3 –1 2 10
America 2065 0.7 1.2 1.5 1.7 2.1 –15 –4 –2 3 10
2100 1.0 1.6 1.8 2.4 2.7 –22 –5 0 2 11
JJA 2035 0.5 0.7 0.8 1.0 1.4 –8 –3 –1 2 7
2065 1.1 1.3 1.6 1.9 2.5 –15 –6 –2 1 6
2100 1.1 1.6 2.0 2.5 3.2 –17 –6 –2 1 12
Annual 2035 0.4 0.7 0.9 0.9 1.3 –8 –3 –1 1 6
2065 1.0 1.3 1.5 1.8 2.4 –14 –6 –2 1 6
2100 1.2 1.6 1.9 2.5 3.0 –17 –5 –2 1 9
Caribbean DJF 2035 0.3 0.5 0.6 0.7 1.0 –13 –4 0 3 8
(land and sea) 2065 0.6 1.0 1.2 1.4 1.8 –14 –6 –1 3 16
2100 0.7 1.2 1.4 1.9 2.4 –22 –6 0 5 15
JJA 2035 0.3 0.5 0.6 0.7 1.1 –17 –9 –6 0 11
2065 0.7 0.9 1.1 1.4 2.0 –25 –16 –11 –4 16
2100 0.7 1.1 1.3 1.8 2.5 –36 –18 –10 –3 13
Annual 2035 0.3 0.5 0.6 0.7 1.1 –12 –5 –3 1 8
2065 0.6 0.9 1.1 1.4 1.9 –19 –11 –5 –2 17
2100 0.7 1.2 1.4 1.9 2.4 –29 –10 –5 –1 14
South America
Amazon DJF 2035 0.4 0.7 0.8 0.9 1.6 –12 –2 0 2 4
2065 0.8 1.3 1.6 1.9 3.0 –22 –3 –1 2 6
2100 0.7 1.7 2.0 2.5 3.7 –22 –4 –1 1 8
JJA 2035 0.5 0.8 1.0 1.1 1.8 –14 –3 0 2 5
2065 1.0 1.5 1.8 2.1 3.3 –25 –4 –1 2 11
2100 1.3 1.8 2.2 2.8 4.2 –31 –4 –1 1 9
Annual 2035 0.4 0.8 0.9 1.0 1.8 –13 –2 0 1 4
2065 0.9 1.4 1.7 2.1 3.3 –23 –3 –1 1 7
2100 1.0 1.8 2.1 2.8 4.0 –25 –4 –1 1 7
Northeast DJF 2035 0.4 0.6 0.7 0.9 1.3 –10 –2 1 3 17
Brazil 2065 0.8 1.3 1.5 1.7 2.3 –15 –5 0 4 21
2100 0.8 1.6 1.8 2.4 2.9 –17 –5 –1 5 25
JJA 2035 0.3 0.7 0.8 1.0 1.7 –16 –6 –3 2 15
2065 0.8 1.4 1.6 1.9 3.0 –29 –10 –5 1 18
2100 1.1 1.7 1.9 2.5 3.3 –39 –14 –9 –4 27
Annual 2035 0.4 0.7 0.8 0.9 1.4 –11 –3 0 3 13
2065 0.8 1.4 1.6 1.8 2.6 –17 –6 –2 3 20
2100 1.0 1.7 1.9 2.5 3.1 –19 –7 –3 3 26
West Coast DJF 2035 0.5 0.7 0.8 0.9 1.2 –4 –1 1 3 6
South America 2065 0.9 1.2 1.5 1.7 2.1 –7 –1 1 4 7
2100 1.0 1.6 1.9 2.2 2.9 –8 0 2 5 9
JJA 2035 0.5 0.7 0.9 0.9 1.3 –9 –1 0 2 7
2065 1.1 1.3 1.5 1.8 2.5 –10 –2 –1 2 9
2100 1.3 1.6 1.9 2.4 3.0 –11 –2 1 4 11
Annual 2035 0.5 0.7 0.8 0.9 1.2 –4 0 1 2 5
2065 1.0 1.2 1.5 1.7 2.3 –6 –1 1 2 5
2100 1.1 1.5 1.8 2.3 2.8 –7 0 2 4 7

1281
Climate Phenomena and their Relevance for Future Regional Climate Change Chapter 14
14
Table 14.1 (continued)
(continued on next page)
RCP4.5 Temperature (°C) Precipitation (%)
REGION MONTH
a
Year min 25% 50% 75% max min 25% 50% 75% max
Southeastern DJF 2035 0.2 0.6 0.7 0.9 1.4 –7 0 2 4 10
South America 2065 0.7 1.1 1.3 1.6 2.4 –6 0 3 6 15
2100 0.6 1.3 1.7 2.2 3.0 –6 1 4 7 18
JJA 2035 0.0 0.4 0.6 0.8 1.2 –12 –1 2 6 19
2065 0.4 1.0 1.2 1.5 2.1 –13 1 5 7 17
2100 0.9 1.3 1.5 1.9 2.7 –18 1 4 8 27
Annual 2035 0.3 0.5 0.6 0.8 1.3 –6 0 1 4 12
2065 0.6 1.0 1.3 1.6 2.3 –6 1 3 6 13
2100 0.7 1.3 1.6 2.2 2.7 –8 1 4 7 17
Europe
Northern Europe DJF 2035 –0.3 0.6 1.3 2.3 3.0 –4 2 4 6 12
2065 –0.5 1.8 2.7 3.5 5.7 –1 3 8 11 24
2100 –3.2 2.6 3.4 4.4 6.0 2 7 11 14 25
JJA 2035 0.2 0.6 0.9 1.3 2.6 –6 2 4 6 11
2065 0.0 1.2 1.8 2.5 3.6 –10 2 3 8 18
2100 –1.1 1.6 2.2 3.0 4.7 –4 2 5 8 23
Annual 2035 0.1 0.8 1.1 1.6 2.7 –2 2 3 6 12
2065 –0.5 1.6 2.0 2.8 3.8 –5 3 5 9 17
2100 –2.3 2.1 2.7 3.5 4.5 1 5 8 10 24
Central Europe DJF 2035 –0.4 0.6 1.2 1.7 2.5 –4 0 3 5 11
2065 0.3 1.4 2.1 2.7 3.6 –3 2 6 10 17
2100 –0.8 2.0 2.6 3.4 5.1 –4 3 7 11 18
JJA 2035 0.3 0.9 1.1 1.5 2.4 –8 –3 0 4 9
2065 0.4 1.7 2.0 2.6 4.3 –13 –4 1 3 8
2100 0.4 2.0 2.7 3.0 4.6 –16 –6 0 5 13
Annual 2035 0.3 0.7 1.1 1.4 2.3 –3 –1 2 3 8
2065 0.4 1.5 1.9 2.4 3.2 –6 0 3 5 9
2100 –0.3 2.0 2.6 3.1 4.0 –5 0 4 6 14
Southern Europe/ DJF 2035 –0.1 0.6 0.8 1.0 1.5 –11 –4 –2 2 8
Mediterranean 2065 0.1 1.2 1.5 1.8 2.3 –15 –6 –3 0 7
2100 –0.2 1.5 2.0 2.4 3.0 –19 –7 –4 –1 9
JJA 2035 0.6 0.9 1.2 1.4 2.9 –16 –7 –4 –1 5
2065 1.0 1.9 2.2 2.6 4.3 –24 –12 –9 –4 5
2100 1.2 2.3 2.8 3.3 5.5 –28 –17 –11 –6 2
Annual 2035 0.3 0.8 1.0 1.2 2.0 –12 –4 –2 0 3
2065 0.7 1.5 1.7 2.1 3.1 –14 –8 –5 –2 3
2100 0.6 2.0 2.3 2.7 4.0 –19 –10 –6 –3 4
Africa
Sahara DJF 2035 0.1 0.8 1.0 1.1 1.5 –43 –11 –2 6 33
2065 0.6 1.5 1.7 2.0 2.5 –29 –15 –7 1 92
2100 0.7 1.8 2.2 2.6 3.1 –42 –14 –7 4 98
JJA 2035 0.4 0.9 1.1 1.2 2.0 –25 –5 3 8 45
2065 0.9 1.7 2.0 2.4 3.5 –31 –11 1 14 70
2100 1.1 2.2 2.4 3.2 4.5 –28 –15 –1 10 108
Annual 2035 0.4 0.9 1.0 1.1 1.5 –25 –7 0 7 45
2065 1.0 1.6 1.8 2.2 2.8 –31 –11 –3 8 57
2100 1.0 2.0 2.2 2.9 3.8 –27 –14 –6 9 86

1282
Chapter 14 Climate Phenomena and their Relevance for Future Regional Climate Change
14
Table 14.1 (continued)
(continued on next page)
RCP4.5 Temperature (°C) Precipitation (%)
REGION MONTH
a
Year min 25% 50% 75% max min 25% 50% 75% max
West Africa DJF 2035 0.4 0.8 0.9 1.0 1.3 –5 –1 2 3 9
2065 0.9 1.4 1.6 1.9 2.7 –10 1 4 5 7
2100 1.3 1.7 2.0 2.5 3.6 –5 1 4 6 11
JJA 2035 0.6 0.7 0.8 0.9 1.2 –4 0 1 2 6
2065 1.0 1.3 1.5 1.9 2.6 –9 –1 2 3 6
2100 0.9 1.6 1.8 2.6 3.3 –12 0 2 4 9
Annual 2035 0.6 0.7 0.8 0.9 1.2 –4 –1 1 3 8
2065 1.1 1.3 1.5 1.9 2.5 –10 0 2 4 6
2100 1.0 1.6 1.9 2.6 3.2 –8 1 3 4 8
East Africa DJF 2035 0.4 0.7 0.8 1.0 1.2 –4 –1 1 5 10
2065 0.8 1.3 1.5 1.8 2.5 –3 –1 3 7 19
2100 1.0 1.6 1.9 2.4 3.2 –6 –1 5 10 25
JJA 2035 0.5 0.7 0.9 1.0 1.2 –8 –3 0 2 12
2065 0.8 1.4 1.6 1.9 2.4 –10 –4 1 3 18
2100 0.7 1.7 2.0 2.5 3.1 –12 –4 0 5 19
Annual 2035 0.5 0.7 0.8 0.9 1.2 –5 –2 1 3 10
2065 1.0 1.3 1.6 1.9 2.4 –6 –2 1 6 17
2100 1.0 1.6 2.0 2.5 3.1 –7 –2 2 8 21
Southern DJF 2035 0.6 0.7 0.9 1.1 1.3 –11 –4 –2 0 3
Africa 2065 1.0 1.4 1.7 2.0 2.6 –19 –5 –3 –1 4
2100 1.1 1.8 2.1 2.7 3.3 –19 –7 –3 1 5
JJA 2035 0.5 0.8 0.9 1.0 1.5 –18 –9 –4 –1 9
2065 1.1 1.5 1.7 2.0 2.5 –29 –13 –8 –3 4
2100 1.4 1.8 2.1 2.6 3.3 –29 –18 –9 –3 12
Annual 2035 0.6 0.8 0.9 1.0 1.4 –13 –5 –2 0 4
2065 1.1 1.5 1.7 2.1 2.6 –15 –7 –4 –1 4
2100 1.4 1.8 2.1 2.7 3.3 –20 –7 –5 –1 5
West Indian DJF 2035 0.3 0.5 0.6 0.7 1.0 –10 0 2 3 10
Ocean 2065 0.6 1.0 1.1 1.3 1.8 –10 –1 2 5 13
2100 0.8 1.2 1.4 1.8 2.3 –9 –1 2 6 22
JJA 2035 0.4 0.5 0.6 0.7 1.0 –5 –1 2 5 12
2065 0.6 0.9 1.1 1.3 1.8 –7 –1 1 5 12
2100 0.7 1.2 1.4 1.8 2.3 –7 0 2 5 19
Annual 2035 0.3 0.5 0.6 0.7 1.0 –5 1 2 3 7
2065 0.6 1.0 1.1 1.3 1.8 –4 –1 2 4 11
2100 0.8 1.2 1.4 1.8 2.2 –5 0 2 5 19
Asia
West Asia DJF 2035 0.0 0.8 1.1 1.4 1.8 –12 0 3 6 14
2065 0.5 1.5 1.9 2.3 3.2 –10 –1 2 7 21
2100 0.6 1.9 2.4 2.9 3.8 –11 –3 4 9 20
JJA 2035 0.2 0.9 1.1 1.3 2.1 –10 –2 1 5 55
2065 1.1 1.7 2.1 2.6 4.0 –20 –6 –3 2 51
2100 1.2 2.0 2.7 3.4 4.7 –29 –6 –1 4 60
Annual 2035 0.1 0.9 1.0 1.2 1.8 –9 –2 3 4 27
2065 0.7 1.7 1.9 2.3 3.2 –12 –2 0 4 27
2100 0.9 2.1 2.5 3.1 4.1 –19 –2 1 6 28

1283
Climate Phenomena and their Relevance for Future Regional Climate Change Chapter 14
14
Table 14.1 (continued)
(continued on next page)
RCP4.5 Temperature (°C) Precipitation (%)
REGION MONTH
a
Year min 25% 50% 75% max min 25% 50% 75% max
Central Asia DJF 2035 –0.1 0.8 1.3 1.6 2.4 –6 0 4 8 19
2065 0.6 1.7 2.4 2.9 4.0 –9 –2 4 10 17
2100 1.0 2.3 2.7 3.3 5.4 –12 –1 5 12 25
JJA 2035 0.3 0.9 1.1 1.4 2.1 –13 –3 2 6 17
2065 1.1 1.7 2.1 2.6 4.3 –22 –5 1 6 16
2100 0.9 2.1 2.7 3.4 5.0 –17 –3 1 5 18
Annual 2035 0.2 0.8 1.1 1.3 2.0 –6 –1 2 6 13
2065 0.7 1.7 2.2 2.5 3.6 –13 –2 2 6 16
2100 0.8 2.2 2.6 3.2 4.8 –12 –4 4 8 18
Eastern Asia DJF 2035 0.3 0.8 1.0 1.3 2.3 –9 –1 1 3 7
2065 0.8 1.6 2.0 2.5 3.4 –5 3 5 9 16
2100 0.9 2.1 2.7 3.1 4.7 –9 5 9 15 30
JJA 2035 0.4 0.7 0.9 1.1 1.6 –3 0 2 3 6
2065 0.7 1.4 1.9 2.3 3.1 –2 3 6 8 18
2100 0.7 1.8 2.2 2.8 3.9 1 4 7 11 24
Annual 2035 0.3 0.9 0.9 1.1 1.7 –3 0 2 3 7
2065 0.9 1.6 1.9 2.2 3.0 –1 4 6 8 18
2100 0.7 1.9 2.4 3.0 3.9 –1 5 7 11 21
Tibetan DJF 2035 0.0 0.9 1.2 1.5 2.2 –3 2 4 8 15
Plateau 2065 0.9 1.9 2.3 2.9 3.9 –1 6 8 12 17
2100 1.4 2.3 2.8 3.5 5.5 2 6 11 16 25
JJA 2035 0.4 0.9 1.1 1.3 2.3 –5 1 3 5 12
2065 1.0 1.7 2.1 2.5 4.4 –3 2 6 9 25
2100 0.9 2.2 2.5 3.1 5.4 –4 5 9 13 37
Annual 2035 0.3 0.9 1.2 1.4 2.0 –2 1 4 5 11
2065 1.0 1.8 2.2 2.6 3.6 –1 4 7 9 22
2100 0.9 2.2 2.6 3.3 4.9 –1 6 9 14 32
South Asia DJF 2035 0.1 0.7 1.0 1.1 1.4 –18 –6 –1 4 8
2065 0.6 1.6 1.8 2.3 2.6 –17 –3 4 7 13
2100 1.4 2.0 2.3 3.0 3.7 –14 0 8 14 28
JJA 2035 0.3 0.6 0.7 0.9 1.3 –3 2 3 6 9
2065 0.9 1.1 1.3 1.7 2.6 –3 5 7 11 33
2100 0.7 1.4 1.7 2.2 3.3 –7 8 10 13 37
Annual 2035 0.2 0.7 0.8 1.0 1.3 –2 1 3 4 7
2065 0.8 1.4 1.6 1.9 2.5 –2 3 7 9 26
2100 1.3 1.7 2.1 2.7 3.5 –3 6 10 12 27
North Indian DJF 2035 0.1 0.5 0.6 0.7 1.0 –16 –3 1 7 22
Ocean 2065 0.5 1.0 1.2 1.5 1.9 –7 1 5 15 33
2100 0.8 1.3 1.5 2.0 2.5 –9 5 9 20 41
JJA 2035 0.2 0.5 0.6 0.7 1.0 –8 –1 2 5 16
2065 0.6 1.0 1.2 1.4 1.9 –7 2 6 9 23
2100 0.8 1.3 1.4 1.9 2.5 –10 5 8 12 36
Annual 2035 0.2 0.5 0.6 0.7 1.0 –5 0 1 4 12
2065 0.5 1.0 1.1 1.4 1.9 –4 3 6 9 22
2100 0.9 1.3 1.5 2.0 2.5 –5 5 9 13 38

1284
Chapter 14 Climate Phenomena and their Relevance for Future Regional Climate Change
14
Table 14.1 (continued)
(continued on next page)
RCP4.5 Temperature (°C) Precipitation (%)
REGION MONTH
a
Year min 25% 50% 75% max min 25% 50% 75% max
Southeast DJF 2035 0.3 0.5 0.7 0.8 1.1 –2 1 2 4 12
Asia (land) 2065 0.6 1.1 1.3 1.6 2.2 –1 1 3 8 13
2100 0.8 1.4 1.6 2.2 3.0 –5 2 6 9 19
JJA 2035 0.3 0.6 0.7 0.8 1.2 –3 0 1 3 7
2065 0.7 1.1 1.2 1.5 2.2 –2 0 3 7 13
2100 0.8 1.4 1.5 2.0 2.7 –3 2 4 9 19
Annual 2035 0.3 0.6 0.7 0.8 1.2 –2 0 1 3 8
2065 0.7 1.1 1.2 1.6 2.2 –1 1 3 7 13
2100 0.8 1.4 1.6 2.1 2.7 –2 2 5 10 18
Southeast DJF 2035 0.3 0.5 0.6 0.7 1.1 –3 0 2 3 9
Asia (sea) 2065 0.6 0.9 1.1 1.3 1.9 –4 0 3 6 10
2100 0.9 1.2 1.4 1.7 2.5 –5 1 3 6 11
JJA 2035 0.3 0.5 0.6 0.6 1.0 –4 0 1 2 7
2065 0.7 0.9 1.1 1.3 1.9 –2 2 3 5 9
2100 0.9 1.2 1.4 1.7 2.5 –1 2 3 6 16
Annual 2035 0.3 0.5 0.6 0.7 1.0 –4 0 2 3 8
2065 0.6 1.0 1.1 1.3 1.9 –2 1 3 5 7
2100 0.9 1.2 1.4 1.7 2.5 –3 2 4 6 9
Australia
North Australia DJF 2035 0.2 0.6 0.9 1.1 1.9 –20 –5 –2 3 8
2065 0.6 1.2 1.5 2.1 3.4 –18 –6 0 3 12
2100 1.1 1.6 2.0 2.6 4.0 –31 –8 –4 3 9
JJA 2035 0.4 0.8 0.9 1.1 1.4 –48 –10 –4 1 15
2065 0.9 1.4 1.6 1.9 2.3 –53 –15 –7 –1 17
2100 0.9 1.7 2.0 2.5 2.9 –46 –19 –8 2 11
Annual 2035 0.3 0.7 0.9 1.1 1.6 –24 –6 –3 1 7
2065 0.7 1.3 1.6 1.9 2.6 –21 –7 –2 2 11
2100 1.0 1.7 2.0 2.5 3.4 –33 –9 –4 1 8
South Australia/ DJF 2035 –0.1 0.6 0.8 1.0 1.2 –27 –5 –2 2 7
New Zealand 2065 0.4 1.2 1.5 1.7 2.2 –18 –4 0 2 11
2100 0.7 1.5 1.8 2.3 3.0 –17 –6 –2 2 8
JJA 2035 0.2 0.6 0.7 0.8 1.0 –22 –3 –1 1 4
2065 0.6 1.1 1.2 1.4 1.6 –21 –6 –3 2 11
2100 0.7 1.4 1.6 1.8 2.4 –20 –9 –3 2 7
Annual 2035 0.1 0.6 0.7 0.8 1.0 –24 –3 –2 1 5
2065 0.6 1.1 1.3 1.5 1.7 –18 –5 –1 1 10
2100 0.9 1.5 1.8 2.0 2.4 –17 –9 –2 2 7

1285
Climate Phenomena and their Relevance for Future Regional Climate Change Chapter 14
14
Table 14.1 (continued)
RCP4.5 Temperature (°C) Precipitation (%)
REGION MONTH
a
Year min 25% 50% 75% max min 25% 50% 75% max
The Pacific
Northern DJF 2035 0.2 0.5 0.6 0.7 0.9 –7 –2 0 3 11
Tropical Pacific 2065 0.7 1.0 1.1 1.4 1.9 –4 –2 1 6 12
2100 0.9 1.2 1.4 1.7 2.4 –6 –1 1 5 20
JJA 2035 0.3 0.5 0.6 0.7 1.0 –11 –2 1 3 8
2065 0.6 0.9 1.0 1.3 2.0 –9 –2 2 5 9
2100 0.8 1.1 1.4 1.8 2.6 –11 –1 2 4 16
Annual 2035 0.3 0.5 0.6 0.7 1.0 –8 –2 1 3 7
2065 0.6 1.0 1.1 1.3 1.9 –7 –1 1 4 9
2100 0.9 1.2 1.4 1.7 2.4 –8 0 1 4 18
Equatorial Pacific DJF 2035 0.1 0.5 0.6 0.7 1.2 –9 –1 7 11 44
2065 0.5 1.0 1.2 1.4 2.5 –4 5 12 19 226
2100 0.4 1.2 1.5 1.8 3.3 –27 7 16 29 309
JJA 2035 0.1 0.5 0.6 0.7 1.1 –18 5 10 14 40
2065 0.7 1.0 1.1 1.4 2.3 0 11 15 25 143
2100 0.5 1.2 1.5 1.8 2.9 –19 13 23 33 125
Annual 2035 0.1 0.5 0.7 0.7 1.1 –11 3 7 12 40
2065 0.7 1.0 1.2 1.4 2.3 –1 7 12 24 194
2100 0.5 1.2 1.4 1.8 2.9 –23 13 19 29 225
Southern Pacific DJF 2035 0.3 0.4 0.5 0.6 0.9 –7 –1 1 2 6
2065 0.6 0.8 1.0 1.2 1.5 –22 0 2 4 6
2100 0.8 1.0 1.3 1.5 2.0 –24 –1 3 5 8
JJA 2035 0.3 0.4 0.5 0.6 0.9 –10 0 1 3 8
2065 0.6 0.8 1.0 1.1 1.6 –18 –1 1 4 7
2100 0.8 1.0 1.2 1.5 2.1 –17 –2 2 4 10
Annual 2035 0.3 0.4 0.5 0.6 0.9 –8 0 1 2 7
2065 0.6 0.8 1.0 1.1 1.6 –21 0 2 3 5
2100 0.8 1.1 1.2 1.5 2.0 –21 0 2 4 6
Antarctica
(land) DJF 2035 0.1 0.5 0.6 0.8 1.3 –3 1 3 4 8
2065 0.1 1.0 1.3 1.6 2.3 –7 3 5 8 14
2100 0.5 1.5 1.7 2.1 3.1 –5 4 8 10 17
JJA 2035 –0.5 0.6 0.8 0.9 1.8 –3 2 5 6 13
2065 –0.1 1.2 1.4 1.8 2.5 1 6 8 13 16
2100 –0.3 1.5 1.9 2.4 3.8 –1 9 12 15 23
Annual 2035 –0.1 0.5 0.7 0.9 1.3 –3 2 4 5 9
2065 0.0 1.1 1.3 1.7 2.3 –3 4 7 10 14
2100 0.1 1.5 1.8 2.3 3.2 –3 7 9 13 21
(sea) DJF 2035 –0.3 0.2 0.4 0.5 0.7 –1 1 3 3 5
2065 –0.4 0.5 0.6 0.9 1.3 0 3 4 5 8
2100 –0.3 0.6 0.9 1.2 1.8 0 4 5 7 11
JJA 2035 –0.7 0.4 0.6 1.0 1.9 0 2 2 4 5
2065 –0.6 0.7 1.1 1.6 3.3 2 4 5 7 10
2100 –0.8 1.1 1.4 2.2 3.8 3 5 7 10 13
Annual 2035 –0.4 0.3 0.5 0.7 1.3 0 2 2 4 5
2065 –0.5 0.5 0.8 1.2 2.3 2 3 4 6 9
2100 –0.5 0.8 1.2 1.7 2.6 1 4 6 9 12
Notes:
a
Precipitation changes cover 6 months; ONDJFM and AMJJAS for winter and summer (Northern Hemisphere).

1286
Chapter 14 Climate Phenomena and their Relevance for Future Regional Climate Change
14
Table 14.2 | Assessed confidence (high, medium, low) in climate projections of regional temperature and precipitation change from the multi-model ensemble of CMIP5 models
for the RCP4.5 scenario. Column 1 refers to the SREX regions (cf. Seneviratne et al., 2012, page 12. The region’s coordinates can be found from their online Appendix 3.A) and six
additional regions including the two polar regions, the Caribbean, Indian Ocean and Pacific Island States (see Annex I for further details). Columns 2 to 4 show confidence in models’
ability to simulate present-day mean temperature and precipitation as well as the most important phenomena for that region based on Figures 9.39, 9.40, and 9.45. In column 4,
the individual phenomena are listed, with associated confidence levels shown below, in the same order as the phenomena. Note that only phenomena assessed in Figure 9.45 are
listed. Column 5 is an interpretation of the relevance of the main climate phenomena for future regional climate change, based on Table 14.3. Note that the SREX regions are smaller
than the regions listed in Table 14.3. Columns 6 and 7 express confidence in projected temperature and precipitation changes, based solely on model agreement for 2080–2099
vs. 1985–2005, as listed in Table 14.1 and in the maps shown in Annex I. The confidence is assessed for two periods for temperature (DJF and JJA) and two-half year periods for
precipitation (October to March and April to September). When the projections are consistent with no significant change, it is marked by an asterisk (*) and the assigned confidence
is medium. Further details on how confidence levels have been assigned are provided in the Supplementary Material (Section 14.SM.6.1).
Present Future
SREX Region Temperature Precipitation Main Phenomenon
Relevance of
Main Phenomena
Temperature Precipitation
1. ALA M L PNA/PDO
M/M
H H/H H/H
2. CGI
H M NAO
H
H H/H H/H
3. WNA
M L PNA/ENSO/PDO/Monsoon
M/M/M/M
M-H H/H M/M*
4. CNA
L H PNA/ENSO
M/M
M-H H/H M*/M*
5. ENA
H H PNA/ENSO/NAO/Monsoon
M/M/H/M
M-H H/H H/M
6. CAM
H M ENSO/TC
M/H
M-H H/H M*/M*
7. AMZ
H L ENSO
M
M H/H M*/M*
8. NEB
H M ENSO
M
M-H H/H M*/L
9. WSA
M L ENSO /SAM
M/M
M-H H/H L/M*
10. SSA
H L ENSO/SAM
M/M
M-H H/H L/L
11. NEU
M H NAO/blocking
H/L
H H/H H/L
12. CEU
H M NAO/blocking
H/L
H H/H M/M*
13. MED
H H NAO/blocking
H/L
H H/H L/M
14. SAH
M L NAO
H
H H/H M*/M*
15. WAF
M L Monsoon/AMO
M/M
M H/H L/M*
16. EAF
H L IOD
M
M H/H M*/M*
17. SAF
H L SAM/TC
M/H
H H/H M*/L
18. NAS
M L NAO/Blocking
H/L
M H/H H/H
19. WAS
H L NAO/IOD/TC
H/M/H
M-H H/H M*/M*
20. CAS
M L N/A N/A H/H M*/M*
21. TIB
M L Monsoon
M
M H/H H/H
22. EAS
M M ENSO/Monsoon/TC
M/M/H
M-H H/H M/H
23. SAS
M M Monsoon/IOD/ENSO/TC/MJO
M/M/M/H/L
L-H H/H M*/H
24. SEA
H M Monsoon/IOD/ENSO/TC/MJO
M/M/M/H/L
L-H H/H M/M
(continued on next page)

1287
Climate Phenomena and their Relevance for Future Regional Climate Change Chapter 14
14
Present Future
SREX Region Temperature Precipitation Main Phenomenon
Relevance of
Main Phenomena
Temperature Precipitation
25. NAU
H M ENSO/Monsoon/TC/IOD/MJO
M/M/H/M/L
L-H H/H M*/M*
26. SAU
H L SAM
M
M-H H/H M*/M*
1. Arctic (land) H L NAO
H
H H/H H/H
2. Arctic (sea) H L NAO
H
H H/H H/H
3. Antarctic (land) M M SAM
M
L-H H/H H/H
4. Antarctic (sea) M M SAM
M
L-H H/H H/H
5. Caribbean H L TC/ENSO
H/M
M-H H/H M*/M
6. West Indian
Ocean
H M IOD
M
N/A H/H M*/M*
7. North Indian
Ocean
H M Monsoon/MJO
M/L
N/A H/H L/M
8. SE Asia (sea) H M Monsoon/IOD/ENSO/TC/MJO
M/M/M/H/L
L-H H/H L/M
9. Northern
Tropical Pacific
H L ENSO/TC
M/H
M-H H/H M*/M*
10. Equatorial
Tropical Pacific
H M ENSO/MJO
M/L
M-H H/H M/M
11. Southern
Tropical Pacific
H H ENSO//MJO
M/L
M-H H/H M*/M*
Table 14.2 (continued)

1288
Chapter 14 Climate Phenomena and their Relevance for Future Regional Climate Change
14
Table 14.3 | Summary of the relevance of projected changes in major phenomena for mean change in future regional climate. The relevance is classified into high (red), medium (yellow), low (cyan), and ‘no obvious relevance’ (grey), based
on confidence that there will be a change in the phenomena (‘HP’ for high, ‘MP’ for medium, ‘LP’ for low), and confidence in the impact of the phenomena on each region (‘HI’ for high, ‘MI’ for medium, ‘LI’ for low). More information on how
these assessments have been constructed is given in the Supplementary Material (Section 14.SM.6.1).
Phenomena
Regions
Section
Monsoon Systems
MP—see Section 14.2
Tropical Phenomena
a
HP/MP/LP/LP—See Section 14.3
ENSO
LP—See Section 14.4
Annular and Dipolar Modes
HP—See Section 14.5
Tropical Cyclones
MP—See Section 14.6.1
Extratropical Cyclones
b
MP/HP—See Section 14.6.2
Arctic 14.8.2 HP/HI
The small projected increase
in NAO is likely to contrib-
ute to wintertime changes in
temperature and precipitation.
MP/HI
Projected increase in precipitation
in extratropical cyclones is likely
to enhance mean precipitation.
North America 14.8.3 MP/HI
It is likely the number of
consecutive dry days will
increase, and overall water
availability will be reduced.
HP/LI
Projected ITCZ shifts unre-
lated to ENSO changes will impact
temperature and precipita-
tion, especially in winter.
LP/HI
Likely changes in N. American
precipitation if ENSO changes.
HP/MI
The small projected increase in the
NAO index is likely to contribute to
wintertime temperature and pre-
cipitation changes in NE America.
MP/HI
Projected increases in extreme
precipitation near the centres
of tropical cyclones making
landfall along the western coast
of the USA and Mexico, the
Gulf Mexico, and the eastern
coast of the USA and Canada.
MP/HI
Projected increases in precipita-
tion in extratropical cyclones will
lead to large increases in
wintertime precipitation over the
northern third of the continent.
Central America
and Caribbean
14.8.4 MP/HI
Projected reduction in
mean precipitation .
HP/HI
Reduced mean precipitation
in southern Central America if
there is a southward displace-
ment of the East Pacific ITCZ.
LP/HI
Reduced mean precipitation if
El Niño events become more
frequent and/or intense.
MP/HI
More extreme precipitation near
the centres of tropical cyclones
making landfall along the
eastern and western coasts.
South America 14.8.5 MP/HI
Projected increase in extre-
me precipitation and in the
extension of monsoon area.
HP/HI
Projected increase in the mean
precipitation in the southeast
due to the projected southward
displacement of the SACZ.
LP/HI
Reduced mean precipita-
tion in eastern Amazonia
and increased precipitation
in the La Plata Basin.
HP/HI
Poleward shift of storm tracks
due to projected positive trend
in SAMS phase leads to less
precipitation in central Chile and
increased precipitation in the
southern tip of South America.
HP/HI
Southward displacement
of cyclogenesis activity
increases the precipitation
in the extreme south.
Europe and
Mediterranean
14.8.6 HP/HI
Projected increase in the NAO will
lead to enhanced winter warming
and precipitation over NW Europe.
MP/HI
Enhanced extremes of storm-
related precipitation and decreased
frequency of storm-related precipi-
tation over the E. Mediterranean.
Africa 14.8.7 MP/HI
Projected enhancement
of summer precipita-
tion in West Africa.
HP/LI
Enhanced precipitation in parts
of East Africa due to pro-
jected shifts in ITCZ. Modified
precipitation in West or East
Africa according to variations in
Atlantic or Indian Ocean SSTs.
LP/HI
Increased precipitation in
East Africa and decreased
precipitation and enhanced
warming in southern Africa if
El Niño events become more
frequent and/or intense.
HP/HI
Enhanced winter warming
over southern Africa due to
projected increase in SAM.
MP/HI
Projected increase in extreme
precipitation near the centres
of tropical cyclones making
landfall along the eastern coast
(including Madagascar).
HP/HI
Enhanced extremes of storm-
related precipitation and decreased
frequency of storm-related precipi-
tation over southwestern Africa.
Central and
North Asia
14.8.8 MP/MI
Projected enhancement
in summer mean
precipitation.
HP/LI
Projected enhancement in winter
warming over North Asia.
East Asia 14.8.9 MP/MI
Enhanced summer precipita-
tion due to intensification
of East Asian summer
monsoon circulation.
LP/HI
Enhanced warming if El
Niño events become more
frequent and/or intense.
MP/HI
Projected increase in extreme
precipitation near the centres of
tropical cyclones making landfall
in Japan, along coasts of east
China Sea and Sea of Japan.
MP/MI
Projected reduction in
midwinter precipitation.
(continued on next page)

1289
Climate Phenomena and their Relevance for Future Regional Climate Change Chapter 14
14
Table 14.3 (continued)
Phenomena
Regions
Section
Monsoon Systems
MP—see Section 14.2
Tropical Phenomena
a
HP/MP/LP/LP—See Section 14.3
ENSO
LP—See Section 14.4
Annular and Dipolar Modes
HP—See Section 14.5
Tropical Cyclones
MP—See Section 14.6.1
Extratropical Cyclones
b
MP/HP—See Section 14.6.2
West Asia 14.8.10 HP/LI
Enhanced precipitation in southern
parts of West Asia due to projected
northward shift in ITCZ.
MP/HI
Projected increase in extreme
precipitation near the centres of
tropical cyclones making landfall
on the Arabian Peninsula.
MP/LI
Projected decrease in mean
precipitation due to north-
ward shift of storm tracks.
South Asia 14.8.11 MP/MI
Enhanced summer
precipitation associated
with Indian Monsoon.
LP/MI
Strengthened break mon-
soon precipitation anomalies
associated with MJO.
LP/HI
Enhanced warming and
increased summer season
rainfall variability due to ENSO.
MP/HI
Projected increase in extreme
precipitation near the centres
of tropical cyclones making
landfall along coasts of Bay
of Bengal and Arabian Sea.
Southeast Asia 14.8.12 LP/MI
Decrease in precipitation
over Maritime continent.
HP/MI
Projected changes in
IOD-like warming pattern will
reduce mean precipitation in
Indonesia during Jul-Oct.
LP/HI
Reduction in mean precipitation
and enhanced warming if El
Niño events become more
frequent and/or intense.
MP/HI
Projected increase in extreme
precipitation near the centres of
tropical cyclones making landfall
along coasts of South China Sea,
Gulf of Thailand, and Andaman Sea.
Australia and
New Zealand
14.8.13 MP/LI
Mean monsoon pre-
cipitation may increase
over northern Australia.
HP/LI
More frequent zonal SPCZ
episodes may reduce pre-
cipitation in NE Australia.
LP/HI
Reduced precipitation in North
and East Australia and NZ if
El Niño events become more
frequent and/or intense.
HP/MI
Increased warming and
reduced precipitation in NZ and
South Aust. due to projected
positive trend in SAM.
MP/HI
More extreme precipitation
near the centres of tropical
cyclones making landfall along
the eastern, western, and
northern coasts of Australia.
HP/HI
Projected increase in extremes
of storm-related precipitation.
Pacific Islands
Region
14.8.14 HP/LI
Increased mean precipitation along
equator with ITCZ intensification.
More frequent zonal SPCZ episodes
leading to reduced precipitation in
southwest and increases in east.
HP/LI
Increased mean precipita-
tion in central/east Pacific if
El Niño events become more
frequent and/or intense.
HP/HI
More extreme precipitation near
the centres of tropical cyclones
passing over or near Pacific islands.
Antarctica 14.8.15 LP/MI
Increased warming over
Antarctic Peninsula and
reduced across central Pacific
if El Niño events become more
frequent and/or intense.
HP/HI
Increased warming over
Antarctic Peninsula and west
Antarctic related to positive
trend projected in SAM.
HP/MI
Increased precipitation in
coastal areas due to projected
poleward shift of storm track.

1290
Chapter 14 Climate Phenomena and their Relevance for Future Regional Climate Change
14
References
Abram, N. J., M. K. Gagan, J. E. Cole, W. S. Hantoro, and M. Mudelsee, 2008: Recent
intensification of tropical climate variability in the Indian Ocean. Nature Geosci.,
1, 849–853.
Ackerley, D., B. B. B. Booth, S. H. E. Knight, E. J. Highwood, D. J. Frame, M. R. Allen,
and D. P. Rowell, 2011: Sensitivity of twentieth-century Sahel rainfall to sulfate
aerosol and CO
2
forcing. J. Clim., 24, 4999–5014.
Aldrian, E., and Y. S. Djamil, 2008: Spatio-temporal climatic change of rainfall in east
Java Indonesia. Int. J. Climatol., 28, 435–448.
Alexander, L. V., and J. M. Arblaster, 2009: Assessing trends in observed and modelled
climate extremes over Australia in relation to future projections. Int. J. Climatol.,
29, 417–435.
Alexander, L. V., et al., 2006: Global observed changes in daily climate extremes of
temperature and precipitation. J. Geophys. Res. Atmos., 111, D05109.
Alexander, M., D. Vimont, P. Chang, and J. Scott, 2010: The impact of extratropical
atmospheric variability on ENSO: Testing the seasonal footprinting mechanism
using coupled model experiments. J. Clim., 23, 2885–2901.
Alexander, M., I. Blade, M. Newman, J. Lanzante, N. Lau, and J. Scott, 2002: The
atmospheric bridge: The influence of ENSO teleconnections on air-sea interaction
over the global oceans. J. Clim., 15, 2205–2231.
Alexander, M. A., 2010: Extratropical air-sea interaction, SST variability and the
Pacific Decadal Oscillation (PDO). In: Climate Dynamics: Why Does Climate
Vary? [D. S. a. F. Bryan (ed.)]. American Geophysical Union, Washingon, DC, pp.
123–148.
Allan, R., and B. Soden, 2008: Atmospheric warming and the amplification of
precipitation extremes. Science, 321, 1481–1484.
Alory, G., S. Wijffels, and G. Meyers, 2007: Observed temperature trends in the Indian
Ocean over 1960–1999 and associated mechanisms. Geophys. Res. Lett., 34,
L02606.
Alpert, P., S. Krichak, H. Shafir, D. Haim, and I. Osetinsky, 2008: Climatic trends to
extremes employing regional modeling and statistical interpretation over the E.
Mediterranean. Global Planet. Change, 63, 163–170.
Alpert, P., et al., 2002: The paradoxical increase of Mediterranean extreme daily
rainfall in spite of decrease in total values. Geophys. Res. Lett., 29, 31–34.
AlSarmi, S., and R. Washington, 2011: Recent observed climate change over the
Arabian Peninsula. J. Geophys. Res. Atmos., 116, D11109.
Alves, L. M., and J. A. Marengo, 2010: Assessment of regional seasonal predictability
using the PRECIS regional climate modeling system over South America. Theor.
Appl. Climatol., 100, 337–350.
Amador, J. A., E. J. Alfaro, O. G. Lizano, and V. O. Magana, 2006: Atmospheric forcing
of the eastern tropical Pacific: A review. Prog. Oceanogr., 69, 101–142.
AMAP, 2011: Snow, Water, Ice and Permafrost in the Arctic (SWIPA): Climate Change
and the Cryosphere, Arctic Monitoring and Assessment Programme, Oslo,
Norway, 538 pp.
Ambaum, M., B. Hoskins, and D. Stephenson, 2001: Arctic oscillation or North
Atlantic oscillation? J. Clim., 14, 3495–3507.
Ambaum, M. H. P., 2008: Unimodality of wave amplitude in the Northern Hemisphere.
J. Atmos. Sci., 65, 1077–1086.
An, S.-I., J.-W. Kim, S.-H. Im, B.-M. Kim, and J.-H. Park, 2011: Recent and future sea
surface temperature trends in the tropical Pacific warm pool and cold tongue
regions. Clim. Dyn., doi:10.1007/s00382-011-1129-7.
An, S. I., and B. Wang, 2000: Interdecadal change of the structure of the ENSO mode
and its impact on the ENSO frequency. J. Clim., 13, 2044–2055.
An, S. I., and F. F. Jin, 2000: An Eigen analysis of the interdecadal changes in the
structure and frequency of ENSO mode. Geophys. Res. Lett., 27, 2573–2576.
Anderson, B., J. Wang, G. Salvucci, S. Gopal, and S. Islam, 2010: Observed trends
in summertime precipitation over the southwestern United States. J. Clim., 23,
1937–1944.
Anderson, B. T., 2003: Tropical Pacific sea surface temperatures and preceding
sea level pressure anomalies in the subtropical North Pacific. J. Geophys. Res.
Atmos., 108, 4732.
Anderson, B. T., 2011: Near-term increase in frequency of seasonal temperature
extremes prior to the 2 degree C global warming target. Clim. Change, 108,
581–589.
Annamalai, H., K. Hamilton, and K. R. Sperber, 2007: The South Asian summer
monsoon and its relationship with ENSO in the IPCC AR4 simulations. J. Clim.,
20, 1071–1092.
Annamalai, H., J. Hafner, K. P. Sooraj, and P. Pillai, 2013: Global warming shifts
monsoon circulation, drying South Asia. J. Clim., 26, 2701–2718.
Anstey, J. A., and T. G. Shepherd, 2008: Response of the northern stratospheric polar
vortex to the seasonal alignment of QBO phase transitions. Geophys. Res. Lett.,
35, L22810.
Anstey, J. A., et al., 2013: Multi-model analysis of Northern Hemisphere winter
blocking, Part I: Model biases and the role of resolution. J. Geophys. Res. Atmos.,
118, doi: 10.1002/jgrd.50231.
Arblaster, J. M., G. A. Meehl, and D. J. Karoly, 2011: Future climate change in the
Southern Hemisphere: Competing effects of ozone and greenhouse gases.
Geophys. Res. Lett., 38, L02701.
Arriaga-Ramirez, S., and T. Cavazos, 2010: Regional trends of daily precipitation
indices in northwest Mexico and southwest United States. J. Geophys. Res., 115,
D144111.
Ashfaq, M., S. Ying, T. Wen-wen, R. J. Trapp, G. Xueijie, J. S. Pal, and N. S. Diffenbaugh,
2009: Suppression of South Asian summer monsoon precipitation in the 21st
century. Geophys. Res. Lett., doi:10.1029/2008gl036500.
Ashok, K., S. K. Behera, S. A. Rao, H. Y. Weng, and T. Yamagata, 2007: El Nino Modoki
and its possible teleconnection. J. Geophys. Res. Oceans, 112, C11007.
Athanasiadis, P. J., J. M. Wallace, and J. J. Wettstein, 2010: Patterns of wintertime
jet stream variability and their relation to the storm tracks. J. Atmos. Sci., 67,
1361–138.
Bader, J., M. D. S. Mesquita, K. I. Hodges, N. Keenlyside, S. Osterhus, and M. Miles,
2011: A review on Northern Hemisphere sea-ice, storminess and the North
Atlantic Oscillation: Observations and projected changes. Atmos. Res., 101,
809–834.
Baines, P. G., and C. K. Folland, 2007: Evidence for a rapid global climate shift across
the late 1960s. J. Clim., 20, 2721–2744.
Baldwin, M., D. Stephenson, and I. Jolliffe, 2009: Spatial weighting and iterative
projection methods for EOFs. J. Clim., 22, 234–243.
Baldwin, M. P., and D. W. J. Thompson, 2009: A critical comparison of stratosphere-
troposphere coupling indices. Q. J. R. Meteorol. Soc., 135, 1661–1672.
Baldwin, M. P., et al., 2001: The quasi-biennial oscillation. Rev. Geophys., 39, 179–
229.
Barnes, E., J. Slingo, and T. Woollings, 2012: A methodology for the comparison of
blocking climatologies across indices, models and climate scenarios. Clim. Dyn.,
38, 2467–2481.
Barnes, E. A., and D. L. Hartmann, 2012: Detection of Rossby wave breaking and its
response to shifts of the midlatitude jet with climate change. J. Geophys. Res.
Atmos., 117, D09117.
Barnes, E. A., and L. Polvani, 2013: Response of the midlatitude jets and of their
variability to increased greenhouse gases in the CMIP5 models. J. Clim., 26,
7117–7135.
Barnes, E. A., D. L. Hartmann, D. M. W. Frierson, and J. Kidston, 2010: Effect of latitude
on the persistence of eddy-driven jets. Geophys. Res. Lett., 37, L11804.
Barnett, J., 2011: Dangerous climate change in the Pacific Islands: Food production
and food security. Region. Environ. Change, 11, S229–S237.
Barriopedro, D., R. Garcia-Herrera, A. R. Lupo, and E. Hernandez, 2006: A climatology
of Northern Hemisphere blocking. J. Clim., 19, 1042–1063.
Barriopedro, D., R. García-Herrera, J. F. González-Rouco, and R. M. Trigo, 2010:
Application of blocking diagnosis methods to General Circulation Models. Part
II: Model simulations. Clim. Dyn., 35, 1393–1409.
Barros, V. R., M. Doyle, and I. Camilloni, 2008: Precipitation trends in southeastern
South America: Relationship with ENSO phases and the low-level circulation.
Theor. Appl. Climatol., 93, 19–33.
Bates, B., P. Hope, B. Ryan, I. Smith, and S. Charles, 2008: Key findings from the Indian
Ocean Climate Initiative and their impact on policy development in Australia.
Clim. Change, 89, 339–354.
Bates, S. C., 2010: Seasonal influences on coupled ocean-atmosphere variability in
the tropical Atlantic ocean. J. Clim., 23, 582–604.
Beck, C., J. Grieser, and B. Rudolf, 2005: A new monthly precipitation climatology
for the global land areas for the period 1951 to 2000. In: Climate Status Report
2004. German Weather Service, Offenbach, Germany, pp. 181–190.

1291
Climate Phenomena and their Relevance for Future Regional Climate Change Chapter 14
14
Becker, A., P. Finger, A. Meyer-Christoffer, B. Rudolf, K. Schamm, U. Schneider, and M.
Ziese, 2013: A description of the global land-surface precipitation data products
of the Global Precipitation Climatology Centre with sample applications
including centennial (trend) analysis from 1901–present. Earth Syst. Sci. Data,
5, 71–99.
Bell, C. J., L. J. Gray, A. J. Charlton-Perez, M. M. Joshi, and A. A. Scaife, 2009:
Stratospheric communication of El Niño teleconnections to European winter. J.
Clim., 22, 4083–4096.
Bender, M. A., T. R. Knutson, R. E. Tuleya, J. J. Sirutis, G. A. Vecchi, S. T. Garner, and I.
M. Held, 2010: Modeled impact of anthropogenic warming on the frequency of
intense Atlantic hurricanes. Science, 327, 454–458.
Bengtsson, L., K. I. Hodges, and E. Roeckner, 2006: Storm tracks and climate change.
J. Clim., 19, 3518–3543.
Bengtsson, L., K. I. Hodges, and N. Keenlyside, 2009: Will extratropical storms
intensify in a warmer climate? J. Clim., 22, 2276–2301.
Bengtsson, L., K. I. Hodges, M. Esch, N. Keenlyside, L. Kornblueh, J.-J. Luo, and T.
Yamagata, 2007: How may tropical cyclones change in a warmer climate? Tellus
A, 59, 539–561.
Berckmans, J., T. Woollings, M.-E. Demory, P.-L. Vidale, and M. Roberts, 2013:
Atmospheric blocking in a high resolution climate model: Influences of mean
state, orography and eddy forcing. Atmos. Sci. Lett., 14, 34–40.
Berrisford, P., B. J. Hoskins, and E. Tyrlis, 2007: Blocking and Rossby wave-breaking
on the dynamical tropopause in the Southern Hemisphere. J. Atmos. Sci., 64,
2881–2898.
Bhend, J., and H. von Storch, 2008: Consistency of observed winter precipitation
trends in northern Europe with regional climate change projections. Clim. Dyn.,
31, 17–28.
Biasutti, M., and A. Giannini, 2006: Robust Sahel drying in response to late 20th
century forcings. Geophys. Res. Lett., 33, L11706.
Biasutti, M., and A. H. Sobel, 2009: Delayed seasonal cycle and African monsoon in a
warmer climate. Geophys. Res. Lett., 36, L23707.
Biasutti, M., A. H. Sobel, and S. J. Camargo, 2009: The role of the Sahara Low in
summertime Sahel rainfall variability and change in the CMIP3 models. J. Clim.,
22, 5755–5771.
Biasutti, M., I. Held, A. Sobel, and A. Giannini, 2008: SST forcings and Sahel rainfall
variability in simulations of the twentieth and twenty-first centuries. J. Clim.,
21, 3471–3486.
Bitz, C. M., and L. M. Polvani, 2012: Antarctic climate response to stratospheric
ozone depletion in a fine resolution ocean climate model. Geophys. Res. Lett.,
39, L20705.
Bjerknes, J., 1969: Atmospheric teleconnections from the Equatorial Pacific. Mon.
Weather Rev., 97, 163–172.
Black, E., 2009: The impact of climate change on daily precipitation statistics in
Jordan and Israel. Atmos. Sci. Lett., 10, 192–200.
Black, E., J. Slingo, and K. Sperber, 2003: An observational study of the relationship
between excessively strong short rains in coastal East Africa and Indian Ocean
SST. Mon. Weather Rev., 131, 74–94.
Blázquez, J., and M. Nuñez, 2012: Analysis of uncertainties in future climate
projections for South America: Comparison of WCRP-CMIP3 and WCRP-CMIP5
models. Clim. Dyn., doi:10.1007/s00382-012-1489-7, 1-18.
Blázquez, J., M. N. Nuñez, and S. Kusunoki, 2012: Climate projections and
uncertainties over South America from MRI/JMA global model experiments.
Atmos. Clim. Sci., 2, 381–400.
Bluthgen, J., R. Gerdes, and M. Werner, 2012: Atmospheric response to the extreme
Arctic sea ice conditions in 2007. Geophys. Res. Lett., 39, L02707.
Boer, G., 2009: Changes in interannual variability and decadal potential predictability
under global warming. J. Clim., 22, 3098–3109.
Boer, G. J., and K. Hamilton, 2008: QBO influence on extratropical predictive skill.
Clim. Dyn., 31, 987–1000.
Bollasina, M., and Y. Ming, 2013: The general circulation model precipitation
bias over the southwestern equatorial Indian Ocean and its implications for
simulating the South Asian monsoon. Clim. Dyn., 40, 823–838.
Bollasina, M. A., Y. Ming, and V. Ramaswamy, 2011: Anthropogenic aerosols and the
weakening of the south Asian summer monsoon. Science, 334, 502–505.
Bombardi, R. J., and L. M. V. Carvalho, 2009: IPCC global coupled model simulations
of the South America monsoon system. Clim. Dyn., 33, 893–916.
Boo, K. O., G. Martin, A. Sellar, C. Senior, and Y. H. Byun, 2011: Evaluating the East
Asian monsoon simulation in climate models. J. Geophys. Res., 116, D01109.
Booth, B. B. B., N. J. Dunstone, P. R. Halloran, T. Andrews, and N. Bellouin, 2012:
Aerosols implicated as a prime driver of twentieth-century North Atlantic
climate variability. Nature, 484, 228–232.
Bracegirdle, T. J., and D. B. Stephenson, 2012: Higher precision estimates of regional
polar warming by ensemble regression of climate model projections. Clim. Dyn.,
39, 2805–2821.
Bracegirdle, T. J., W. M. Connolley, and J. Turner, 2008: Antarctic climate change over
the twenty first century. J. Geophys. Res., 113, D03103.
Bracegirdle, T. J., et al., 2013: Assessment of surface winds over the Atlantic, Indian,
and Pacific Ocean sectors of the Southern Ocean in CMIP5 models: Historical
bias, forcing response, and state dependence. J. Geophys. Res. Atmos., 118,
547–562.
Braganza, K., J. Gergis, S. Power, J. Risbey, and A. Fowler, 2009: A multiproxy index of
the El Niño-Southern Oscillation, AD 1525–1982. J. Geophys. Res. Atmos., 114,
D05106.
Brandefelt, J., 2006: Atmospheric modes of variability in a changing climate. J. Clim.,
19, 5934–5943.
Branstator, G., and F. Selten, 2009: “Modes of Variability’’ and Climate Change. J.
Clim., 22, 2639–2658.
Breugem, W., W. Hazeleger, and R. Haarsma, 2006: Multimodel study of tropical
Atlantic variability and change. Geophys. Res. Lett., doi:10.1029/2006GL027831.
Breugem, W., W. Hazeleger, and R. Haarsma, 2007: Mechanisms of northern tropical
Atlantic variability and response to CO2 doubling. J. Clim., doi:DOI 10.1175/
JCLI4137.1, 2691–2705.
Bromwich, D. H., A. J. Monaghan, and Z. C. Guo, 2004: Modeling the ENSO modulation
of Antarctic climate in the late 1990s with the polar MM5. J. Clim., 17, 109–132.
Brown, J., A. Moise, and R. Colman, 2012a: The South Pacific Convergence Zone
in CMIP5 simulations of historical and future climate. Clim. Dyn., doi:10.1007/
s00382-012-1591-x, 1–19.
Brown, J., A. Moise, and F. Delage, 2012b: Changes in the South Pacific Convergence
Zone in IPCC AR4 future climate projections. Clim. Dyn., 39, 1–19.
Brown, J., S. Power, F. Delage, R. Colman, A. Moise, and B. Murphy, 2011: Evaluation
of the South Pacific Convergence Zone in IPCC AR4 climate model simulations
of the twentieth century. J. Clim., 24, 1565–1582.
Brown, J., et al., 2012c: Implications of CMIP3 model biases and uncertainties for
climate projections in the western tropical Pacific. Clim. Change, doi:10.1007/
s10584-012-0603-5, 1–15.
Brown, R., and P. Mote, 2009: The response of Northern Hemisphere snow cover to a
changing climate. J. Clim., doi:10.1175/2008JCLI2665.1, 2124–2145.
Budikova, D., 2009: Role of Arctic sea ice in global atmospheric circulation: A review.
Global Planet. Change, 68, 149–163.
Buehler, T., C. C. Raible, and T. F. Stocker, 2011: The relationship of winter season
North Atlantic blocking frequencies to extreme cold and dry spells in the ERA-
40. Tellus A, 63, 212–222.
Bulic, I., and F. Kucharski, 2012: Delayed ENSO impact on spring precipitation over
the North/Atlantic European region. Clim. Dyn., 38, 2593–2612.
Bulic, I., C. Brankovic, and F. Kucharski, 2012: Winter ENSO teleconnections in a
warmer climate. Clim. Dyn., 38, 1593–1613.
Bunge, L., and A. J. Clarke, 2009: A verified estimation of the El Nino index Nino-3.4
since 1877. J. Clim., 22, 3979–3992.
Butchart, N., et al., 2006: Simulations of anthropogenic change in the strength of the
Brewer-Dobson circulation. Clim. Dyn., 27, 727–741.
Butler, A. H., D. W. J. Thompson, and R. Heikes, 2010: The steady-state atmospheric
circulation response to climate change-like thermal forcings in a simple General
Circulation Model. J. Clim., 23, 3474–3496.
Caesar, J., et al., 2011: Changes in temperature and precipitation extremes over the
Indo-Pacific region from 1971 to 2005. Int. J. Climatol., 31, 791–801.
Cai, W., and T. Cowan, 2008: Dynamics of late autumn rainfall reduction over
southeastern Australia. Geophys. Res. Lett., 35, L09708.
Cai, W., and T. Cowan, 2013: Southeast Australia autumn rainfall reduction: A
climate-change induced poleward shift of ocean-atmosphere circulation. J.
Clim., 26, 189–205.
Cai, W., T. Cowan, and A. Sullivan, 2009: Recent unprecedented skewness towards
positive Indian Ocean Dipole occurrences and its impact on Australian rainfall.
Geophys. Res. Lett., 36, L11705.
Cai, W., P. van Rensch, and T. Cowan, 2011a: Influence of global-scale variability on
the subtropical ridge over southeast Australia. J. Clim., 24, 6035–6053.

1292
Chapter 14 Climate Phenomena and their Relevance for Future Regional Climate Change
14
Cai, W., T. Cowan, and M. Thatcher, 2012a: Rainfall reductions over Southern
Hemisphere semi-arid regions: The role of subtropical dry zone expansion. Sci.
Rep., 2, doi: 10.1038/srep00702.
Cai, W., P. van Rensch, T. Cowan, and H. H. Hendon, 2011b: Teleconnection pathways
of ENSO and the IOD and the mechanisms for impacts on Australian rainfall. J.
Clim., 24, 3910–3923.
Cai, W., P. van Rensch, S. Borlace, and T. Cowan, 2011c: Does the Southern Annular
Mode contribute to the persistence of the multidecade-long drought over
southwest Western Australia? Geophys. Res. Lett., 38, L14712.
Cai, W., T. Cowan, A. Sullivan, J. Ribbe, and G. Shi, 2011d: Are anthropogenic aerosols
responsible for the northwest Australia summer rainfall increase? A CMIP3
perspective and implications. J. Clim., 24, 2556–2564.
Cai, W., et al., 2012b: More extreme swings of the South Pacific convergence zone
due to greenhouse warming. Nature, 488, 365–369.
Cai, W. J., and T. Cowan, 2006: SAM and regional rainfall in IPCC AR4 models: Can
anthropogenic forcing account for southwest Western Australian winter rainfall
reduction? Geophys. Res. Lett., 33, doi: 10.1029/2006gl028037.
Cai, W. J., A. Sullivan, and T. Cowan, 2011e: Interactions of ENSO, the IOD, and the
SAM in CMIP3 Models. J. Clim., 24, 1688–1704.
Camargo, S., M. Ting, and Y. Kushnir, 2012: Influence of local and remote SST on
NorthAtlantic tropical cyclone potential intensityClim. Dyn., 40, 1515–1529.
Campbell, J. D., M. A. Taylor, T. S. Stephenson, R. A. Watson, and F. S. Whyte, 2010:
Future climate of the Caribbean from a regional climate model. Int. J. Climatol.,
31, 1866–1878.
Cane, M. A., et al., 1997: Twentieth-century sea surface temperature trends. Science,
275, 957–960.
Carrera, M. L., R. W. Higgins, and V. E. Kousky, 2004: Downstream weather impacts
associated with atmospheric blocking over the northeast Pacific. J. Clim., 17,
4823–4839.
Carril, A. F., et al., 2012: Performance of a multi-RCM ensemble for South Eastern
South America. Clim. Dyn., 39, 2747–2768.
Carton, J., and B. Huang, 1994: Warm events in the tropical Atlantic. J. Phys.
Oceanogr., 24, 888–903.
Carvalho, L. M. V., C. Jones, and T. Ambrizzi, 2005: Opposite phases of the antarctic
oscillation and relationships with intraseasonal to interannual activity in the
tropics during the austral summer. J. Clim., 18, 702–718.
Carvalho, L. M. V., A. E. Silva, C. Jones, B. Liebmann, P. L. Silva Dias, and H. R. Rocha,
2011: Moisture transport and intraseasonal variability in the South America
Monsoon System. Clim. Dyn., 36, 1865–1880.
Cassou, C., and L. Terray, 2001: Dual influence of Atlantic and Pacific SST anomalies
on the North Atlantic/Europe winter climate. Geophys. Res. Lett., 28, 3195–3198.
Cassou, C., C. Deser, and M. A. Alexander, 2007: Investigating the impact of
reemerging sea surface temperature anomalies on the winter atmospheric
circulation over the North Atlantic. J. Clim., 20, 3510–3526.
Castro, C. L., R. A. Pielke Sr., and J. O. Adegoke, 2007: Investigation of the summer
climate of the contiguous United States and Mexico using the Regional
Atmospheric Modeling System (RAMS). Part I: Model climatology (1950–2002).
J. Clim., 20, 3844–3865.
Casty, C., C. C. Raible, T. F. Stocker, H. Wanner, and J. Luterbacher, 2007: A European
pattern climatology 1766–2000. Clim. Dyn., 29, 791–805.
Cattiaux, J., H. Douville, and Y. Peings, 2013: European temperatures in CMIP5:
Origins of present-day biases and future uncertainties. Clim. Dyn., doi:10.1007/
s00382-013-1731-y, 1–19.
Catto, J. L., L. C. Shaffrey, and K. I. Hodges, 2011: Northern Hemisphere extratropical
cyclones in a warming climate in the HiGEM High-Resolution Climate Model. J.
Clim., 24, 5336–5352.
Cavalcanti, I. F. A., and M. H. Shimizu, 2012: Climate fields over South America and
variability of SACZ and PSA in HadGEM-ES. Am. J. Clim. Change, 1, 132–144.
Cavazos, T., C. Turrent, and D. P. Lettenmaier, 2008: Extreme precipitation trends
associated with tropical cyclones in the core of the North American monsoon.
Geophys. Res. Lett., 35, doi: 10.1029/2008GL035832.
Cerezo-Mota, R., M. Allen, and R. Jones, 2011: Mechanisms controlling precipitation
in the northern portion of the North American monsoon. J. Clim., 24, 2771–2783.
Chadwick, R., I. Boutle, and G. Martin, 2013: Spatial patterns of precipitation change
in CMIP5: Why the rich don’t get richer in the tropics. J. Clim., 26, 3803–3822.
Chang, C.-H., 2011: Preparedness and storm hazards in a global warming world:
Lessons from Southeast Asia. Nat. Hazards, 56, 667–679.
Chang, C., J. Chiang, M. Wehner, A. Friedman, and R. Ruedy, 2011: Sulfate aerosol
control of tropical Atlantic climate over the twentieth century. J. Clim., 24,
2540–2555.
Chang, E. K. M., Y. Guo, and X. Xia, 2012: CMIP5 multimodel ensemble projection
of storm track change under global warming. J. Geophys. Res. Atmos., 117, doi:
10.1029/2012jd018578.
Chang, P., et al., 2006: Climate fluctuations of tropical coupled systems - The role of
ocean dynamics. J. Clim., 19, 5122–5174.
Chaturvedi, R. K., J. Joshi, M. Jayaraman, G. Bala, and N. H. Ravindranath, 2012: Multi-
model climate change projections for India under Representative Concentration
Pathways (RCPs): A preliminary analysis. Curr. Sci., 103, 791–802.
Chauvin, F., and J.-F. Royer, 2010: Role of the SST Anomaly structures in response
of cyclogenesis to global warming. In: Hurricanes and Climate Change [J.
B. Elsner, R. E. Hodges, J. C. Malmstadt and K. N. Scheitlin (eds.)]. Springer
Science+Business Media, Dordrecht, Netherlands, pp. 39–56.
Chen, D., 2003: A comparison of wind products in the context of ENSO prediction.
Geophys. Res. Lett., 30, doi: 10.1029/2002GL016121.
Chen, G., I. M. Held, and W. A. Robinson, 2007: Sensitivity of the latitude of the
surface westerlies to surface friction. J. Atmos. Sci., 64, 2899–2915.
Chen, G., J. Lu, and D. M. W. Frierson, 2008: Phase speed spectra and the latitude
of surface westerlies: Interannual variability and global warming trend. J. Clim.,
21, 5942–5959.
Chen, T.-C., and J.-h. Yoon, 2002: Interdecadal variation of the North Pacific
wintertime blocking. Mon. Weather Rev., 130, 3136–3143.
Chen, W., Z. Jiang, L. Li, and P. Yiou, 2011: Simulation of regional climate change
under the IPCC A2 scenario in southeast China. Clim. Dyn., 36, 491–507.
Cherchi, A., and A. Navarra, 2007: Sensitivity of the Asian summer monsoon to
the horizontal resolution: Differences between AMIP-type and coupled model
experiments. Clim. Dyn., 28, 273–290.
Cheung, H. N., W. Zhou, H. Y. Mok, and M. C. Wu, 2012: Relationship between Ural–
Siberian blocking and the East Asian winter monsoon in relation to the Arctic
Oscillation and the El Niño–Southern Oscillation. J. Clim., 25, 4242–4257.
Chiang, J., and D. Vimont, 2004: Analogous Pacific and Atlantic meridional modes of
tropical atmosphere-ocean variability. J. Clim., 4143–4158.
Choi, D. H., J. S. Kug, W. T. Kwon, F. F. Jin, H. J. Baek, and S. K. Min, 2010: Arctic
Oscillation responses to greenhouse warming and role of synoptic eddy
feedback. J. Geophys. Res. Atmos., 115, doi: 10.1029/2010jd014160.
Choi, J., S. An, and S. Yeh, 2012: Decadal amplitude modulation of two types of ENSO
and its relationship with the mean state. Clim. Dyn., 38, 2631–2644.
Choi, J., S. I. An, B. Dewitte, and W. W. Hsieh, 2009: Interactive feedback between the
Tropical Pacific Decadal Oscillation and ENSO in a Coupled General Circulation
Model. J. Clim., 22, 6597–6611.
Choi, J., S.-I. An, J.-S. Kug, and S.-W. Yeh, 2011: The role of mean state on changes in
El Niño’s flavor. Clim. Dyn., 37, 1205–1215.
Chotamonsak, C., E. P. Salathe, Jr., J. Kreasuwan, S. Chantara, and K. Siriwitayakorn,
2011: Projected climate change over Southeast Asia simulated using a WRF
regional climate model. Atmos. Sci. Lett., 12, 213–219.
Chou, C., J. D. Neelin, U. Lohmann, and J. Feichter, 2005: Local and remote impacts of
aerosol climate forcing on tropical precipitation. J. Clim., 18, 4621–4636.
Chou, C., J. C. H. Chiang, C.-W. Lan, C.-H. Chung, Y.-C. Liao, and C.-J. Lee, 2013:
Increase in the range between wet and dry season precipitation. Nature Geosci.,
6, 263–267.
Chou, S., et al., 2012: Downscaling of South America present climate driven by
4-member HadCM3 runs. Clim. Dyn., 38, 635–653.
Christensen, J. H., et al., 2007: Regional climate projections. In: Climate Change
2007: The Physical Science Basis. Contribution of Working Group I to the
Fourth Assessment Report of the Intergovernmental Panel on Climate Change
[Solomon, S., D. Qin, M. Manning, Z. Chen, M. Marquis, K. B. Averyt, M. Tignor
and H. L. Miller (eds.)] Cambridge University Press, Cambridge, United Kingdom
and New York, NY, USA, pp. 847–940.
Christiansen, B., 2005: The shortcomings of nonlinear principal component analysis
in identifying circulation regimes. J. Clim., 18, 4814–4823.
Chung, C. E., and V. Ramanathan, 2006: Weakening of North Indian SST gradients
and the monsoon rainfall in India and the Sahel. J. Clim., 19, 2036–2045.
Chung, C. E., and V. Ramanathan, 2007: Relationship between trends in
land precipitation and tropical SST gradient. Geophys. Res. Lett., 34, doi:
10.1029/2007gl030491.
Chylek, P., and G. Lesins, 2008: Multidecadal variability of Atlantic hurricane activity:
1851–2007. J. Geophys. Res., 113, D22106.

1293
Climate Phenomena and their Relevance for Future Regional Climate Change Chapter 14
14
Chylek, P., C. K. Folland, G. Lesins, and M. Dubey, 2010: The 20th Century bipolar
seesaw of the Arctic and Antarctic surface air temperatures. Geophys. Res. Lett.,
37, doi: 10.1029/2010GL042793.
Chylek, P., C. K. Folland, G. Lesins, M. Dubey, and M. Wang, 2009: Arctic air
temperature change amplification and the Atlantic Multidecadal Oscillation.
Geophys. Res. Lett., 36, doi: 10.1029/ 2009GL038777.
Chylek, P., C. Folland, L. Frankcombe, H. Dijkstra, G. Lesins, and M. Dubey, 2012:
Greenland ice core evidence for spatial and temporal variability of the Atlantic
Multidecadal Oscillation. Geophys. Res. Lett., 39, L09705.
Cobb, K. M., C. D. Charles, H. Cheng, and R. L. Edwards, 2003: El Nino/Southern
Oscillation and tropical Pacific climate during the last millennium. Nature, 424,
271–276.
Coelho, C. A. S., and L. Goddard, 2009: El Nino-induced tropical droughts in climate
change projections. J. Clim., 22, 6456–6476.
Colle, B. A., Z. Zhang, K. A. Lombardo, E. Chang, P. Liu, and M. Zhang, 2013: Historical
evaluation and future prediction of eastern North America and western Atlantic
extratropical cyclones in the CMIP5 models during the cool season. J. Clim., 26,
6882–6903.
Collins, M., et al., 2010: The impact of global warming on the tropical Pacific ocean
and El Niño. Nature Geosci., 3, 391–397.
Colman, R. A., A. F. Moise, and L. I. Hanson, 2011: Tropical Australian climate and the
Australian monsoon as simulated by 23 CMIP3 models. J. Geophys. Res. Atmos.,
116, doi: 10.1029/2010jd015149.
Comarazamy, D. E., and J. E. Gonzalez, 2011: Regional long-term climate change
(1950–2000) in the midtropical Atlantic and its impacts on the hydrological
cycle of Puerto Rico. J. Geophys. Res. Atmos., 116, doi: 10.1029/2010jd015414.
Compo, G. P., and P. D. Sardeshmukh, 2010: Removing ENSO-related variations from
the climate record. J. Clim., 23, 1957–1978.
Conway, D., C. Hanson, R. Doherty, and A. Persechino, 2007: GCM simulations of
the Indian Ocean dipole influence on East African rainfall: Present and future.
Geophys. Res. Lett., 34, doi: 10.1029/2006GL027597.
Cook, B., N. Zeng, and J.-H. Yoon, 2011: Will Amazonia dry out? Magnitude and
causes of change from IPCC Climate Model Projections. Earth Interact., 16,
1–27.
Cook, B. I., and R. Seager, 2013: The response of the North American Monsoon to
increased greenhouse gas forcing. J. Geophys. Res., 118,
Cook, K., 2008: Climate science: The mysteries of Sahel droughts. Nature Geosci.,
1, 647–648.
Cook, K. H., and E. K. Vizy, 2006: Coupled model simulations of the west African
monsoon system: Twentieth- and twenty-first-century simulations. J. Clim., 19,
3681–3703.
Cook, K. H., and E. K. Vizy, 2010: Hydrodynamics of the Caribbean Low-Level Jet and
its relationship to precipitation. J. Clim., 23, 1477–1494.
Coppola, E., F. Kucharski, F. Giorgi, and F. Molteni, 2005: Bimodality of the North
Atlantic Oscillation in simulations with greenhouse gas forcing. Geophys. Res.
Lett., 32, doi: 10.1029/2005gl024080.
Cravatte, S., T. Delcroix, D. Zhang, M. McPhaden, and J. Leloup, 2009: Observed
freshening and warming of the western Pacific Warm Pool. Clim. Dyn., 33,
565–589.
Croci-Maspoli, M., C. Schwierz, and H. Davies, 2007a: Atmospheric blocking: Space-
time links to the NAO and PNA. Clim. Dyn., 29, 713–725.
Croci-Maspoli, M., C. Schwierz, and H. C. Davies, 2007b: A multifaceted climatology
of atmospheric blocking and its recent linear trend. J. Clim., 20, 633–649.
Cunningham, C. A. C., and I. F. D. Cavalcanti, 2006: Intraseasonal modes of variability
affecting the South Atlantic Convergence Zone. Int. J. Climatol., 26, 1165–1180.
d’Orgeval, T., J. Polcher, and L. Li, 2006: Uncertainties in modelling future hydrological
change over West Africa. Clim. Dyn., 26, 93–108.
Dacre, H. F., and S. L. Gray, 2009: The spatial distribution and evolution characteristics
of North Atlantic Cyclones. Mon. Weather Rev., 137, 99–115.
Dai, A., 2011: Drought under global warming: A review. WIREs Clim. Change, 2,
45–65.
Dai, A., 2013: Increasing drought under global warming in observations and models.
Nature Clim. Change, 3, 52–58.
Dai, A., T. Qian, K. E. Trenberth, and J. D. Milliman, 2009: Changes in continental
freshwater discharge from 1948 to 2004. J. Clim., 22, 2773–2792.
Dairaku, K., S. Emori, and T. Nozawa, 2008: Impacts of global warming on hydrological
cycles in the Asian monsoon region. Adv. Atmos. Sci., 25, 960–973.
Dash, S. K., M. A. Kulkarni, U. C. Mohanty, and K. Prasad, 2009: Changes in the
characteristics of rain events in India. J. Geophys. Res. Atmos., 114, D10109.
Davini, P., C. Cagnazzo, S. Gualdi, and A. Navarra, 2012: Bidimensional diagnostics,
variability, and trends of Northern Hemisphere blocking. J. Clim., 25, 6496–6509.
Dawson, A., T. N. Palmer, and S. Corti, 2012: Simulating regime structures in weather
and climate prediction models. Geophys. Res. Lett., 39, L21805.
de Oliveira Vieira, S., P. Satyamurty, and R. V. Andreoli, 2013: On the South Atlantic
Convergence Zone affecting southern Amazonia in austral summer. Atmos. Sci.
Lett., 14, 1–6.
de Vries, H., T. Woollings, J. Anstey, R. J. Haarsma, and W. Hazeleger, 2013:
Atmospheric blocking and its relation to jet changes in a future climate. Clim.
Dyn., doi:10.1007/s00382-013-1699-7, 1–12.
Dean, S., and P. Stott, 2009: The effect of local circulation variability on the detection
and attribution of New Zealand temperature trends. J. Clim., 22, 6217–6229.
DeFries, R., L. Bounoua, and G. Collatz, 2002: Human modification of the landscape
and surface climate in the next fifty years. Global Change Biol., 8, 438–458.
Della-Marta, P. M., and J. G. Pinto, 2009: Statistical uncertainty of changes in winter
storms over the North Atlantic and Europe in an ensemble of transient climate
simulations. Geophys. Res. Lett., 36, doi: 10.1029/2009gl038557.
Deni, S. M., J. Suhaila, W. Z. W. Zin, and A. A. Jemain, 2010: Spatial trends of dry
spells over Peninsular Malaysia during monsoon seasons. Theor. Appl. Climatol.,
99, 357–371.
Déqué, M., S. Somot, E. Sanchez-Gomez, C. M. Goodess, D. Jacob, G. Lenderink, and
O. B. Christensen, 2012: The spread amongst ENSEMBLES regional scenarios:
Regional climate models, driving general circulation models and interannual
variability. Clim. Dyn., 38, 951–964.
Deser, C., A. S. Phillips, and M. A. Alexander, 2010a: Twentieth century tropical
sea surface temperature trends revisited. Geophys. Res. Lett., 37, doi:
10.1029/2010gl043321.
Deser, C., M. A. Alexander, S.-P. Xie, and A. S. Phillips, 2010b: Sea surface temperature
variability: Patterns and mechanisms. Annu. Rev. Mar. Sci., 2, 115–143.
Deser, C., R. Tomas, M. Alexander, and D. Lawrence, 2010c: The seasonal atmospheric
response to projected Arctic sea ice loss in the late twenty-first century. J. Clim.,
23, 333–351.
Deser, C., A. Phillips, V. Burdette, and H. Teng, 2012: Uncertainty in climate change
projections: The role of internal variability. Clim. Dyn., 38, 527–546.
Di Lorenzo, E., et al., 2009: Nutrient and salinity decadal variations in the central
and eastern North Pacific. Geophys. Res. Lett., 36, doi: 10.1029/2009GL038261.
Diamond, H. J., A. M. Lorrey, and J. A. Renwick, 2012: A southwest Pacific tropical
cyclone climatology and linkages to the El Niño–Southern Oscillation. J. Clim.,
26, 3–25.
Diffenbaugh, N. S., and M. Ashfaq, 2010: Intensification of hot extremes in the
United States. Geophys. Res. Lett., 37, L15701.
Diffenbaugh, N. S., M. Scherer, and M. Ashfaq, 2013: Response of snow-dependent
hydrologic extremes to continued global warming. Nature Clim. Change, 3,
379–384.
DiNezio, P. N., A. C. Clement, G. A. Vecchi, B. J. Soden, and B. P. Kirtman, 2009: Climate
response of the equatorial Pacific to global warming. J. Clim., 22, 4873–4892.
Ding, Q., E. Steig, D. Battisti, and M. Kuttel, 2011: Winter warming in West Antarctica
caused by central tropical Pacific warming. Nature Geosci., 4, 398–403.
Ding, Y., and J. C. L. Chan, 2005: The East Asian summer monsoon: An overview.
Meteorol. Atmos. Phys., 89, 117–142.
Ding, Y., G. Ren, Z. Zhao, Y. Xu, Y. Luo, Q. Li, and J. Zhang, 2007: Detection, causes and
projection of climate change over China: An overview of recent progress. Adv.
Atmos. Sci., doi:DOI 10.1007/s00376-007-0954-4, 954–971.
Dole, R., M. Hoerling, J. Perlwitz, J. Eischeid, and P. Pegion, 2011: Was there a basis
for anticipating the 2010 Russian heat wave? Geophys. Res. Lett., L06702, doi
10.1029/2010GL046582.
Dominguez, F., E. Rivera, D. P. Lettenmaier, and C. L. Castro, 2012: Changes in winter
precipitation extremes for the western United States under a warmer climate as
simulated by regional climate models. Geophys. Res. Lett., 39, L05803.
Donat, M. G., G. C. Leckebusch, S. Wild, and U. Ulbrich, 2011: Future changes in
European winter storm losses and extreme wind speeds inferred from GCM and
RCM multi-model simulations. Nat. Hazards Earth Syst. Sci., 11, 1351–1370.
Dong, B., R. T. Sutton, and T. Woollings, 2011: Changes of interannual NAO variability
in response to greenhouse gases forcing. Clim. Dyn., 37, 1621–1641.
Dong, L., T. J. Vogelsang, and S. J. Colucci, 2008: Interdecadal trend and ENSO-related
interannual variability in Southern Hemisphere blocking. J. Clim., 21, 3068–3077.
Döscher, R., and T. Koenigk, 2012: Arctic rapid sea ice loss events in regional coupled
climate scenario experiments. Ocean Sci. Discuss., 9, 2327–2373.

1294
Chapter 14 Climate Phenomena and their Relevance for Future Regional Climate Change
14
Dowdy, A. J., G. A. Mills, B. Timbal, and Y. Wang, 2012: Changes in the risk of
extratropical cyclones in eastern Australia. J. Clim., 26, 1403–1417.
Drumond, A. R. M., and T. Ambrizzi, 2005: The role of SST on the South American
atmospheric circulation during January, February and March 2001. Clim. Dyn.,
24, 781–791.
Du, Y., and S.-P. Xie, 2008: Role of atmospheric adjustments in the tropical Indian
Ocean warming during the 20th century in climate models. Geophys. Res. Lett.,
35, doi: 10.1029/2008GL033631.
Du, Y., L. Yang, and S. Xie, 2011: Tropical Indian Ocean influence on Northwest Pacific
tropical cyclones in summer following strong El Niño. J. Clim., 24, 315–322.
Du, Y., S. P. Xie, G. Huang, and K. M. Hu, 2009: Role of air-sea interaction in the
long persistence of El Niño-induced north Indian Ocean warming. J. Clim., 22,
2023–2038.
Dufek, A. S., T. Ambrizzi, and R. P. Rocha, 2008: Are reanalysis data useful for
calculating climate indices over South America? Ann. NY Acad. Sci., 1146,
87–104.
Duffy, P. B., and C. Tebaldi, 2012: Increasing prevalence of extreme summer
temperatures in the U.S. Clim. Change, 111, 487–495.
Dunion, J., and C. Velden, 2004: The impact of the Saharan air layer on Atlantic
tropical cyclone activity. Bull. Am. Meteorol. Soc., 85, 353–365.
Dunion, J., and C. Marron, 2008: A reexamination of the Jordan mean tropical
sounding based on awareness of the Saharan air layer: Results from 2002. J.
Clim., 21, 5242–5253.
Dunion, J. P., 2011: Rewriting the climatology of the tropical North Atlantic and
Caribbean Sea atmosphere. J. Clim., 24, 893–908.
Dunn-Sigouin, E., and S.-W. Son, 2013: Northern Hemisphere blocking frequency and
duration in the CMIP5 models. J. Geophys. Res. Atmos., 118, 1179–1188.
Elsner, J. B., J. P. Kossin, and T. H. Jagger, 2008: The increasing intensity of the
strongest tropical cyclones. Nature, 455, 92–95.
Emanuel, K., 2007: Environmental factors affecting tropical cyclone power
dissipation. J. Clim., 20, 5497–5509.
Emanuel, K., 2010: Tropical cyclone activity downscaled from NOAA-CIRESreanalysis,
1908–1958. J. Adv. Model. Earth Syst., 2, 12.
Emanuel, K., R. Sundararajan, and J. Williams, 2008: Hurricanes and global warming:
Results from downscaling IPCC AR4 simulations. Bull. Am. Meteorol. Soc., 89,
347–367.
Emanuel, K., S. Solomon, D. Folini, S. Davis, and C. Cagnazzo, 2012: Influence of
tropical tropopause layer cooling on Atlantic hurricane activity. J. Clim., 26,
2288–2301.
Endo, H., 2010: Long-term changes of seasonal progress in Baiu rainfall using 109
years (1901–2009) daily station data. Sola, 7, 5–8.
Endo, H., 2012: Future changes of Yamase bringing unusually cold summers over
northeastern Japan in CMIP3 multi-models. J. Meteorol. Soc. Jpn., 90A, 123-136.
Endo, H., A. Kitoh, T. Ose, R. Mizuta, and S. Kusunoki, 2012: Future changes and
uncertainties in Asian precipitation simulated by multiphysics and multi–sea
surface temperature ensemble experiments with high-resolution Meteorological
Research Institute atmospheric general circulation models (MRI-AGCMs). J.
Geophys. Res., 117, D16118.
Enfield, D., S. K. Lee, and C. Wang, 2006: How are large Western Hemisphere warm
pools formed? Prog. Oceanogr., 70, 346–365.
Engelbrecht, C. J., F. A. Engelbrecht, and L. L. Dyson, 2011: High-resolution model-
projected changes in mid-tropospheric closed-lows and extreme rainfall events
over southern Africa. Int. J. Climatol., 33, 173–187.
England, M. H., C. C. Ummenhofer, and A. Santoso, 2006: Interannual rainfall
extremes over southwest Western Australia linked to Indian ocean climate
variability. J. Clim., 19, 1948–1969.
Englehart, P. J., and A. V. Douglas, 2006: Defining intraseasonal rainfall variability
within the North American monsoon. J. Clim., 19, 4243–4253.
Evan, A., 2012: Atlantic hurricane activity following two major volcanic eruptions. J.
Geophys. Res. Atmos., 117, doi: 10.1029/2011JD016716.
Evan, A., G. Foltz, D. Zhang, and D. Vimont, 2011a: Influence of African dust on ocean-
atmosphere variability in the tropical Atlantic. Nature Geosci., 4, 762–765.
Evan, A. T., J. P. Kossin, C. E. Chung, and V. Ramanathan, 2011b: Arabian Sea tropical
cyclones intensified by emissions of black carbon and other aerosols. Nature,
479, 94–97.
Evan, A. T., J. P. Kossin, C. Chung, and V. Ramanathan, 2012: Evan et al. reply to Wang
et al. (2012), “Intensified Arabian Sea tropical storms”. Nature, 489, E2–E3.
Evan, A. T., D. J. Vimont, A. K. Heidinger, J. P. Kossin, and R. Bennartz, 2009: The
role of aerosols in the evolution of tropical North Atlantic Ocean temperature
anomalies. Science, 324, 778–781.
Evans, J. P., 2008: Changes in water vapor transport and the production of
precipitation in the eastern Fertile Crescent as a result of global warming. J.
Hydrometeorol., 9, 1390–1401.
Evans, J. P., 2009: 21st century climate change in the Middle East. Clim. Change,
92, 417–432.
Eyring, V., et al., 2013: Long-term ozone changes and associated climate impacts in
CMIP5 simulations. J. Geophys. Res. Atmos, doi:10.1002/jgrd.50316.
Falvey, M., and R. D. Garreaud, 2009: Regional cooling in a warming world: Recent
temperature trends in the southeast Pacific and along the west coast of
subtropical South America (1979–2006). J. Geophys. Res. Atmos., 114, D04102.
Fauchereau, N., B. Pohl, C. Reason, M. Rouault, and Y. Richard, 2009: Recurrent daily
OLR patterns in the Southern Africa/Southwest Indian Ocean region, implications
for South African rainfall and teleconnections. Clim. Dyn., 32, 575–591.
Fedorov, A. V., and S. G. Philander, 2000: Is El Nino changing? Science, 288, 1997–
2002.
Feldstein, S. B., and C. Franzke, 2006: Are the North Atlantic Oscillation and the
Northern Annular Mode distinguishable? J. Atmos. Sci., 63, 2915–2930.
Feliks, Y., M. Ghil, and A. W. Robertson, 2010: Oscillatory climate modes in the eastern
Mediterranean and their synchronization with the North Atlantic Oscillation. J.
Clim., 23, 4060–4079.
Feng, S., Q. Hu, and R. Oglesby, 2011: Influence of Atlantic sea surface temperatures
on persistent drought in North America. Clim. Dyn., 37, 569–586.
Fereday, D. R., J. R. Knight, A. A. Scaife, C. K. Folland, and A. Philipp, 2008: Cluster
analysis of North Atlantic-European circulation types and links with tropical
Pacific sea surface temperatures. J. Clim., 21, 3687–3703.
Fink, A., S. Pohle, J. Pinto, and P. Knippertz, 2012: Diagnosing the influence of diabatic
processes on the explosive deepening of extratropical cyclones. Geophys. Res.
Lett., 39, doi: 10.1029/2012GL051025.
Fink, A. H., T. Bruecher, V. Ermert, A. Krueger, and J. G. Pinto, 2009: The European
storm Kyrill in January 2007: Synoptic evolution, meteorological impacts and
some considerations with respect to climate change. Nat. Hazards Earth Syst.
Sci., 9, 405–423.
Fischer-Bruns, I., D. F. Banse, and J. Feichter, 2009: Future impact of anthropogenic
sulfate aerosol on North Atlantic climate. Clim. Dyn., 32, 511–524.
Fogt, R., D. Bromwich, and K. Hines, 2011: Understanding the SAM influence on the
South Pacific ENSO teleconnection. Clim. Dyn., 36, 1555–1576.
Fogt, R. L., J. Perlwitz, A. J. Monaghan, D. H. Bromwich, J. M. Jones, and G. J. Marshall,
2009: Historical SAM variability. Part II: Twentieth-century variability and Ttrends
from reconstructions, observations, and the IPCC AR4 models. J. Clim., 22, 5346–
5365.
Folland, C., M. Salinger, N. Jiang, and N. Rayner, 2003: Trends and variations in South
Pacific island and ocean surface temperatures. J. Clim., 16, 2859–2874.
Folland, C. K., J. A. Renwick, M. J. Salinger, and A. B. Mullan, 2002: Relative
influences of the Interdecadal Pacific Oscillation and ENSO on the South Pacific
Convergence Zone. Geophys. Res. Lett., 29, doi: 10.1029/2001GL014201.
Folland, C. K., J. Knight, H. W. Linderholm, D. Fereday, S. Ineson, and J. W. Hurrell,
2009: The summer North Atlantic Oscillation: Past, present, and future. J. Clim.,
22, 1082–1103.
Forster, P., et al., 2007: Changes in atmospheric constituents and in radiative forcing.
In: Climate Change 2007: The Physical Science Basis. Contribution of Working
Group I to the Fourth Assessment Report of the Intergovernmental Panel on
Climate Change [Solomon, S., D. Qin, M. Manning, Z. Chen, M. Marquis, K. B.
Averyt, M. Tignor and H. L. Miller (eds.)] Cambridge University Press, Cambridge,
United Kingdom and New York, NY, USA, pp. 129–234.
Frank, W., and P. Roundy, 2006: The role of tropical waves in tropical cyclogenesis.
Mon. Weather Rev., 134, 2397–2417.
Frederiksen, C. S., J. S. Frederiksen, J. M. Sisson, and S. L. Osbrough, 2011a: Changes
and projections in the annual cycle of the Southern Hemisphere circulation,
storm tracks and Australian rainfall. Int. J. Clim. Change Impacts Respons., 2,
143–162.
Frederiksen, C. S., J. S. Frederiksen, J. M. Sisson, and S. L. Osbrough, 2011b: Australian
winter circulation and rainfall changes and projections. Int. J. Clim. Change Strat.
Manage., 3, 170–188.
Frederiksen, J. S., and C. S. Frederiksen, 2007: Interdecadal changes in southern
hemisphere winter storm track modes. Tellus A, 59, 599–617.

1295
Climate Phenomena and their Relevance for Future Regional Climate Change Chapter 14
14
Frederiksen, J. S., C. S. Frederiksen, S. L. Osbrough, and J. M. Sisson, 2010: Causes of
changing Southern Hemispheric weather systems. In: Managing Climate Change
[I. Jupp, P. Holper and W. Cai (eds.)]. CSIRO Publishing, Collingwood, Victoria,
Australia, pp. 85–98.
Friedman, A. R., Y. T. Hwang, J. C. H. Chiang, and D. M. W. Frierson, 2013:
Interhemispheric temperature asymmetry over the 20th century and in future
projections. J. Clim., doi:10.1175/JCLI-D-12-00525.1.
Frierson, D. M. W., I. M. Held, and P. Zurita-Gotor, 2007: A gray-radiation aquaplanet
moist GCM. Part II: Energy transports in altered climates. J. Atmos. Sci., 64,
1680–1693.
Fučkar, N. S., S.-P. Xie, R. Farneti, E. A. Maroon, and D. M. W. Frierson, 2013: Influence
of the extratropical ocean circulation on the intertropical convergence zone in
an idealized coupled general circulation model. J. Clim., 26, 4612–4629.
Furtado, J., E. Di Lorenzo, N. Schneider, and N. A. Bond, 2011: North Pacific decadal
variability and climate change in the IPCC AR4 models. J. Clim., 24, 3049–3066.
Gamble, D. W., and S. Curtis, 2008: Caribbean precipitation: Review, model and
prospect. Prog. Phys. Geogr., 32, 265–276.
Gan, M. A., V. B. Rao, and M. C. L. Moscati, 2006: South American monsoon indices.
Atmos. Sci. Lett., 6, 219–223.
Gao, X., Y. Shi, and F. Giorgi, 2012a: A high resolution simulation of climate change
over China. Sci. China Earth Sci., 54, 462–472.
Gao, X., Y. Shi, R. Song, F. Giorgi, Y. Wang, and D. Zhang, 2008: Reduction of future
monsoon precipitation over China: Comparison between a high resolution RCM
simulation and the driving GCM. Meteorol. Atmos. Phys., 100, 73–86.
Gao, X., Y. Shi, D. Zhang, J. Wu, F. Giorgi, Z. Ji, and Y. Wang, 2012b: Uncertainties in
monsoon precipitation projections over China: Results from two high-resolution
RCM simulations. Clim. Res., 2, 213.
Gao, Y., L. R. Leung, E. P. Salathé, F. Dominguez, B. Nijssen, and D. P. Lettenmaier,
2012c: Moisture flux convergence in regional and global climate models:
Implications for droughts in the southwestern United States under climate
change. Geophys. Res. Lett., 39, L09711.
Garcia, R., and W. J. Randel, 2008: Acceleration of the Brewer–Dobson circulation
due to increases in greenhouse gases. J. Atmos. Sci., 65, 2731–2739.
Garfinkel, C. I., and D. L. Hartmann, 2011: The influence of the Quasi-Biennial
Oscillation on the troposphere in wintertime in a hierarchy of models, Part 1:
Simplified dry GCMs. J. Atmos. Sci., 68, 1273–1289.
Gastineau, G., and B. J. Soden, 2009: Model projected changes of extreme
wind events in response to global warming. Geophys. Res. Lett., 36, doi:
10.1029/2009gl037500.
Geng, Q. Z., and M. Sugi, 2003: Possible change of extratropical cyclone activity
due to enhanced greenhouse gases and sulfate aerosols - Study with a high-
resolution AGCM. J. Clim., 16, 2262–2274.
Gerber, E. P., and G. K. Vallis, 2007: Eddy-zonal flow interactions and the persistence
of the zonal index. J. Atmos. Sci., 64, 3296–3311.
Gerber, E. P., L. M. Polvani, and D. Ancukiewicz, 2008: Annular mode time scales
in the Intergovernmental Panel on Climate Change Fourth Assessment Report
models. Geophys. Res. Lett., 35, doi: 10.1029/2008gl035712.
Gerber, E. P., et al., 2010: Stratosphere-troposphere coupling and annular
mode variability in chemistry-climate models. J. Geophys. Res., 115, doi:
10.1029/2009jd013770.
Giannini, A., R. Saravanan, and P. Chang, 2003: Oceanic forcing of Sahel rainfall on
interannual to interdecadal time scales. Science, 302, 1027–1030.
Giannini, A., M. Biasutti, I. Held, and A. Sobel, 2008: A global perspective on African
climate. Clim. Change, 90, 359–383.
Giese, B., and S. Ray, 2011: El Niño variability in simple ocean data assimilation
(SODA), 1871–2008. J. Geophys. Res. Oceans, 116, 10.1029/2010JC006695.
Gillett, N. P., and J. C. Fyfe, 2013: Annular mode changes in the CMIP5 simulations.
Geophys. Res. Lett., 40, .
Giorgi, F., and X. Bi, 2009: Time of emergence (TOE) of GHG-forced precipitation
change hot-spots. Geophys. Res. Lett., 36, doi:10.1029/2009GL037593.
Gochis, D. J., L. Castillo-Brito, and J. Shuttleworth, 2007: Correlations between sea-
surface temperatures and warm season streamflow in northwest Mexico. Int. J.
Climatol., 27, 883–901.
Goldenberg, S. B., C. Landsea, A. M. Mestas-Nunez, and W. M. Gray, 2001: The recent
increase in Atlantic hurricane activity: Causes and implications. Science, 293,
474–479.
Gong, D. Y., and S. W. Wang, 1999: Definition of Antarctic Oscillation Index. Geophys.
Res. Lett., 26, 459–462.
Gong, D. Y., and C. H. Ho, 2002: The Siberian High and climate change over middle to
high latitude Asia. Theor. Appl. Climatol., 72, 1–9.
Good, P., J. A. Lowe, M. Collins, and W. Moufouma-Okia, 2008: An objective tropical
Atlantic sea surface temperature gradient index for studies of south Amazon
dry-season climate variability and change. Philos. Trans. R. Soc. London B, 363,
1761–1766.
Goswami, B. N., V. Venugopal, D. Sengupta, M. S. Madhusoodanan, and P. K.
Xavier, 2006: Increasing trend of extreme rain events over India in a warming
environment. Science, 314, 1442–1445.
Graff, L., and J. LaCasce, 2012: Changes in the extratropical storm tracks in response
to changes in SST in an AGCM. J. Clim., 25, 1854–1870.
Grantz, K., B. Rajagopalan, M. Clark, and E. Zagona, 2007: Seasonal shifts in the
North American monsoon. J. Clim., 20, 1923–1935.
Griffiths, G., M. Salinger, and I. Leleu, 2003: Trends in extreme daily rainfall across
the South Pacific and relationship to the South Pacific Convergence Zone. Int. J.
Climatol., 23, 847–869.
Griffiths, G., et al., 2005: Change in mean temperature as a predictor of extreme
temperature change in the Asia-Pacific region. Int. J. Climatol., 25, 1301–1330.
Griffiths, G. M., 2007: Changes in New Zealand daily rainfall extremes 1930 - 2004.
Weather Clim., 27, 3–44.
Gu, D. F., and S. G. H. Philander, 1995: Secular changes of annual and interannual
variability in the tropics during the past century. J. Clim., 8, 864–876.
Guilyardi, E., H. Bellenger, M. Collins, S. Ferrett, W. Cai, and A. Wittenberg, 2012: A
first look at ENSO in CMIP5. CLIVAR Exchanges, 58, 29-32.
Guo, Z. C., D. H. Bromwich, and K. M. Hines, 2004: Modeled antarctic precipitation.
Part II: ENSO modulation over West Antarctica. J. Clim., 17, 448–465.
Gutiérrez, D., et al., 2011: Coastal cooling and increased productivity in the main
upwelling zone off Peru since the mid-twentieth century. Geophys. Res. Lett.,
38, L07603.
Gutowski, W. J. et al., 2010: Regional, extreme monthly precipitation simulated by
NARCCAP RCMs. J. Hydrometeorol., 11, 1373–1379.
Gutzler, D. S., 2004: An index of interannual precipitation variability in the core of the
North American monsoon region. J. Clim., 17, 4473–4480.
Gutzler, D. S., and T. O. Robbins, 2011: Climate variability and projected change in
the western United States: Regional downscaling and drought statistics. Clim.
Dyn., 37, 835–849.
Gutzler, D. S., L. N. Long, J. Schemm, S. B. Roy, M. Bosilovich, J. C. Collier, M. Kanamitsu,
P. Kelly, D. Lawrence, M. I. Lee, R. L. Sánchez, B. Mapes, K. Mo, A. Nunes, E. A.
Ritchie, J. Roads, S. Schubert, H. Wei, and G. J. Zhang, 2009: Simulations of the
2004 North American Monsoon: NAMAP2. J. Climate, 22, 6716-6740.
Haarsma, R. J., et al., 2013: More hurricanes to hit Western Europe due to global
warming. Geophys. Res. Lett., doi:10.1002/grl.50360.
Haensler, A., S. Hagemann, and D. Jacob, 2011: The role of the simulation setup in
a long-term high-resolution climate change projection for the southern African
region. Theor. Appl. Climatol., 106, 153–169.
Haerter, J., E. Roeckner, L. Tomassini, and J. von Storch, 2009: Parametric
uncertainty effects on aerosol radiative forcing. Geophys. Res. Lett., 36, doi:
10.1029/2009GL039050.
Haigh, J. D., and H. K. Roscoe, 2006: Solar influences on polar modes of variability.
Meteorol. Z., 15, 371–378.
Häkkinen, S., P. B. Rhines, and D. L. Worthen, 2011: Atmospheric blocking and atlantic
multidecadal ocean variability. Science, 334, 655–659.
Hall, T., A. Sealy, T. Stephenson, S. Kusunoki, M. Taylor, A. A. Chen, and A. Kitoh, 2012:
Future climate of the Caribbean from a super-high-resolution atmospheric
general circulation model. Theor. Appl. Climatol., doi:10.1007/s00704-012-0779-
7, 1–17.
Han, W., et al., 2010: Patterns of Indian Ocean sea-level change in a warming
climate. Nature Geosci., 3, 546–550.
Handorf, K., and Dethloff, 2009: Atmospheric teleconnections and flow regimes
under future climate projections. 237–255.
Hansen, J., M. Sato, R. Ruedy, K. Lo, D. W. Lea, and M. Medina-Elizade, 2006: Global
temperature change. Proc. Natl. Acad. Sci. U.S.A., 103, 14288–14293.
Hansingo, K., and C. Reason, 2008: Modelling the atmospheric response to SST
dipole patterns in the South Indian Ocean with a regional climate model.
Meteorol. Atmos. Phys., 100, 37–52.
Hansingo, K., and C. Reason 2009: Modelling the atmospheric response over
southern Africa to SST forcing in the southeast tropical Atlantic and southwest
subtropical Indian Oceans. Int. J. Climatol., 29, 1001–1012.

1296
Chapter 14 Climate Phenomena and their Relevance for Future Regional Climate Change
14
Harrison, S. P., et al., 2003: Mid-Holocene climates of the Americas: A dynamical
response to changed seasonality. Clim. Dyn., 20, 663–688.
Hartmann, B., and G. Wendler, 2005: The Significance of the 1976 Pacific climate shift
in the climatology of Alaska. J. Clim., 18, 4824–4839.
Harvey, B. J., L. C. Shaffrey, T. J. Woollings, G. Zappa, and K. I. Hodges, 2012: How
large are projected 21st century storm track changes? Geophys. Res. Lett., 39,
L18707.
Haylock, M. R., et al., 2006: Trends in total and extreme South American rainfall in
1960–2000 and links with sea surface temperature. J. Clim., 19, 1490–1512.
Held, I., and M. Zhao, 2011: The response of tropical cyclone statistics to an increase
in CO
2
with fixed sea surface temperatures. J. Clim., 24, 5353–5364.
Held, I., T. Delworth, J. Lu, K. Findell, and T. Knutson, 2005: Simulation of Sahel drought
in the 20th and 21st centuries. Proc. Natl. Acad. Sci. U.S.A., 102, 17891–17896.
Held, I. M., 1993: Large-scale dynamics and global warming. Bull. Am. Meteorol.
Soc., 74, 228–241.
Held, I. M., and B. J. Soden, 2006: Robust responses of the hydrological cycle to
global warming. J. Clim., 19, 5686–5699.
Hendon, H. H., D. W. J. Thompson, and M. C. Wheeler, 2007: Australian rainfall
and surface temperature variations associated with the Southern Hemisphere
annular mode. J. Clim., 20, 2452–2467.
Hennessy, K., S. Power, and G. Cambers, Eds., 2011: Climate change in the Pacific:
Scientific Assessment and New Research. Regional Overview (Volume 1) and
Country Reports (Volume 2). Australian Bureau of Meteorology (BoM) and
Commonwealth Scientific and Industrial Organisation (CSIRO), Melbourne,
Australia.
Hermes, J., and C. Reason, 2009: Variability in sea-surface temperature and winds in
the tropical south-east Atlantic Ocean and regional rainfall relationships. Int. J.
Climatol., 29, 11–21.
Hernandez-Deckers, D., and J.-S. von Storch, 2010: Energetics responses to increases
in greenhouse gas concentration. J. Clim., 23, 3874–3887.
Hidayat, R., and S. Kizu, 2010: Influence of the Madden-Julian Oscillation on
Indonesian rainfall variability in austral summer. Int. J. Climatol., 30, 1816–1825.
Hill, K. J., A. S. Taschetto, and M. H. England, 2011: Sensitivity of South American
summer rainfall to tropical Pacific Ocean SST anomalies. Geophys. Res. Lett.,
38, L01701.
Hinton, T. J., B. J. Hoskins, and G. M. Martin, 2009: The influence of tropical sea
surface temperatures and precipitation on North Pacific atmospheric blocking.
Climate Dynamics, 33, 549-563.
Hirschi, M., et al., 2011: Observational evidence for soil-moisture impact on hot
extremes in southeastern Europe. Nature Geosci., 4, 17–21.
Ho, C. K., D. B. Stephenson, M. Collins, C. A. T. Ferro, and S. J. Brown, 2012: Calibration
strategies: A source of additional uncertainty in climate change projections. Bull.
Am. Meteorol. Soc., 93, 21–26.
Hoerling, M., J. Hurrell, J. Eischeid, and A. Phillips, 2006: Detection and attribution
of twentieth-century northern and southern African rainfall change. J. Clim., 19,
3989–4008.
Holland, G. J., and P. J. Webster, 2007: Heightened tropical cyclone activity in the
North Atlantic: Natural variability or climate trend? Philos. Trans. R. Soc. London
A, 365, 2695–2716.
Hope, P. K., W. Drosdowsky, and N. Nicholls, 2006: Shifts in the synoptic systems
influencing southwest Western Australia. Clim. Dyn., 26, 751–764.
Horel, J. D., and J. M. Wallace, 1981: Planetary-scale atmospheric phenomena
associated with the Southern Oscillation. Mon. Weather Rev., 109, 813–829.
Hori, M. E., D. Nohara, and H. L. Tanaka, 2007: Influence of Arctic Oscillation towards
the Northern Hemisphere surface temperature variability under the global
warming scenario. J. Meteorol. Soc. Jpn., 85, 847–859.
Hsieh, W. W., A. Wu, and A. Shabbar, 2006: Nonlinear atmospheric teleconnections.
Geophys. Res. Lett., 33, doi: 10.1029/2005gl025471.
Hsu, P.-C., T. Li, and B. Wang, 2011: Trends in global monsoon area and precipitation
in the past 30 years. Geophys. Res. Lett., 38, doi: 10.1029/2011GL046893.
Hsu, P.-C., T. Li, H. Murakami, and A. Kitoh, 2013: Future change of the global
monsoon revealed from 19 CMIP5 models. J. Geophys. Res. Atmos., 118, doi:
10.1002/jgrd.50145.
Hu, Z., A. Kumar, B. Jha, and B. Huang, 2012a: An Analysis of Forced and internal
variability in a warmer climate in CCSM3. J. Clim., 25, 2356–2373.
Hu, Z., A. Kumar, B. Jha, W. Wang, B. Huang, and B. Huang, 2012b: An analysis
of warm pool and cold tongue El Niños: Air-sea coupling processes, global
influences, and recent trends. Clim. Dyn., 38, 2017–2035.
Hu, Z. Z., 1997: Interdecadal variability of summer climate over East Asia and its
association with 500 hPa height and global sea surface temperature. J. Geophys.
Res. Atmos., 102, 19403–19412.
Hu, Z. Z., and Z. H. Wu, 2004: The intensification and shift of the annual North Atlantic
Oscillation in a global warming scenario simulation. Tellus A, 56, 112–124.
Huang, B., and Z. Liu, 2001: Temperature trend of the last 40 yr in the upper Pacific
Ocean. J. Clim., 14, 3738–3750.
Huang, G., K. M. Hu, and S. P. Xie, 2010: Strengthening of tropical Indian Ocean
teleconnection to the northwest Pacific since the mid-1970s: An atmospheric
GCM study. J. Clim., 23, 5294–5304.
Huang, J., X. Guan, and F. Ji, 2012: Enhanced cold-season warming in semi-arid
regions. Atmos. Chem. Phys. Discuss., 12, 4627–4653.
Huang, P., S.-P. Xie, K. Hu, G. Huang, and R. Huang, 2013: Patterns of the seasonal
response of tropical rainfall to global warming. Nature Geosci., 6, 357–361.
Huang, R., W. Chen, B. Yang, and R. Zhang, 2004: Recent advances in studies of the
interaction between the east Asian winter and summer monsoons and ENSO
cycle. Adv. Atmos. Sci., 21, 407–424.
Huffman, G. J., R. F. Adler, D. T. Bolvin, and G. Gu, 2009: Improving the global
precipitation record: GPCP Version 2.1. Geophys. Res. Lett., 36, L17808.
Hurrell, J. W., and C. Deser, 2009: North Atlantic climate variability: The role of the
North Atlantic Oscillation. J. Mar. Syst., 78, 28–41.
Hurrell, J. W., Y. Kushnir, G. Ottersen, and M. Visbeck, 2003: An overview of the North
Atlantic Oscillation. In: The North Atlantic Oscillation: Climate Significance
and Environmental Impact [J. W. Hurrell, Y. Kushnir, M. Visbeck and G. Ottersen
(eds.)]. American Geophysical Union, Washington, DC, pp. 1–35.
Huss, M., R. Hock, A. Bauder, and M. Funk, 2010: 100-year mass changes in the Swiss
Alps linked to the Atlantic Multidecadal Oscillation. Geophys. Res. Lett., 37, doi:
10.1029/2010GL042616.
Hwang, Y.-T., and D. M. W. Frierson, 2010: Increasing atmospheric poleward
energy transport with global warming. Geophys. Res. Lett., 37, doi:
10.1029/2010GL045440.
Ihara, C., Y. Kushnir, M. Cane, and V. de la Pena, 2009: Climate Change over the
Equatorial Indo-Pacific in Global Warming. J. Clim., 22, 2678–2693.
Iizumi, T., F. Uno, and M. Nishimori, 2012: Climate downscaling as a source of
uncertainty in projecting local climate change impacts. J. Meteorol. Soc. Jpn.,
90B, 83–90.
Im, E. S., J. B. Ahn, W. T. Kwon, and F. Giorgi, 2008: Multi-decadal scenario simulation
over Korea using a one-way double-nested regional climate model system. Part
2: Future climate projection (2021–2050). Clim. Dyn., 30, 239–254.
Ineson, S., A. A. Scaife, J. R. Knight, J. C. Manners, N. J. Dunstone, L. J. Gray, and
J. D. Haigh, 2011: Solar forcing of winter climate variability in the Northern
Hemisphere. Nature Geosci., 4, 753–757.
Inoue, J., J. Liu, and J. A. Curry, 2006: Intercomparison of arctic regional climate
models: Modeling clouds and radiation for SHEBA in May 1998. J. Clim., 19,
4167–4178.
Ionita, M., G. Lohmann, N. Rimbu, S. Chelcea, and M. Dima, 2012: Interannual to
decadal summer drought variability over Europe and its relationship to global
sea surface temperature. Clim. Dyn., 38, 363–377.
IPCC, 2007a: Climate Change 2007: The Physical Science Basis. Contribution of
Working Group I to the Fourth Assessment Report of the Intergovernmental
Panel on Climate Change [Solomon, S., D. Qin, M. Manning, Z. Chen, M. Marquis,
K. B. Averyt, M. Tignor and H. L. Miller (eds.)] Cambridge University Press,
Cambridge, United Kingdom and New York, NY, USA,996 pp.
IPCC, 2007b: Climate Change 2007: Impacts, Adaptation and Vulnerability.
Contribution of Working Group II to the Fourth Assessment Report of the
Intergovernmental Panel on Climate Change (IPCC) [M. L. Parry, O. F. Canziani,
J. P. Palutikof, P. J. van der Linden and C. E. Hanson (eds.)]. Cambridge University
Press, Cambridge, United Kingdom and New York, NY, USA, 976 pp.
IPCC, 2012: Managing the Risks of Extreme Events and Disasters to Advance
Climate Change Adaptation. A Special Report of Working Groups I and II of the
Intergovernmental Panel on Climate Change [C. B. Field, V. Barros, T. F. Stocker,
D. Qin, D. J. Dokken, K. L. Ebi, M. D. Mastrandrea, K. J. Mach, G.-K. Plattner,
S. K. Allen, M. Tignor and P.M. Midgley (eds.)]. Cambridge University Press,
Cambridge, United Kingdom and New York, NY, USA, 582 pp.
Irving, D., P. Whetton, and A. Moise, 2012: Climate projections for Australia: A first
glance at CMIP5. Aust. Mereorol. Oceanogr. J., 62, 211–225.
Irving, D., et al., 2011: Evaluating global climate models for the Pacific island region.
Clim. Res., 49, 169–187.

1297
Climate Phenomena and their Relevance for Future Regional Climate Change Chapter 14
14
Izumo, T., C. D. Montegut, J. J. Luo, S. K. Behera, S. Masson, and T. Yamagata, 2008:
The role of the western Arabian Sea upwelling in Indian monsoon rainfall
variability. J. Clim., 21, 5603–5623.
Jaeger, E. B., and S. I. Seneviratne, 2010: Impact of soil moisture–atmosphere
coupling on European climate extremes and trends in a regional climate model.
Clim. Dyn., 36, 1919–1939.
Janicot, S., et al., 2011: Intraseasonal variability of the West African monsoon.
Atmos. Sci. Lett., 12, 58–66.
Jiang, H., and E. Zipser, 2010: Contribution of tropical cyclones to the global
precipitation from eight seasons of TRMM data: Regional, seasonal, and
interannual variations. J. Clim., 23, 1526–1543.
Jiang, Y. L., and Z. Zhao, 2013: Maximum wind speed changes over China. Acta
Meteorol. Sin., 27, 63–74.
Jiang, Z., J. Song, L. Li, W. Chen, Z. Wang, and J. Wang, 2011: Extreme climate events
in China: IPCC-AR4 model evaluation and projection. Clim. Change, 110, 385–
401.
Jin, F., A. Kitoh, and P. Alpert, 2010: Water cycle changes over the Mediterranean: A
comparison study of a super-high-resolution global model with CMIP3. Philos.
Trans. R. Soc. London A, 68, 5137–5149.
Johanson, C. M., and Q. Fu, 2009: Hadley cell widening: Model simulations versus
observations. J. Clim., 22, 2713–2725.
Joly, M., A. Voldoire, H. Douville, P. Terray, and J.-F. Royer, 2007: African monsoon
teleconnections with tropical SSTs: Validation and evolution in a set of IPCC4
simulations. Clim. Dyn., 29, 1–20.
Jones, C., and L. M. V. Carvalho, 2013: Climate change in the South American
Monsoon System: Present climate and CMIP5 projections. J. Clim., doi:10.1175/
JCLI-D-12-00412.1.
Jones, D. A., W. Wang, and R. Fawcett, 2009a: High-quality spatial climate data-sets
for Australia. Aust. Meteorol. Oceanogr. J., 58, 233–248.
Jones, J. M., R. L. Fogt, M. Widmann, G. J. Marshall, P. D. Jones, and M. Visbeck,
2009b: Historical SAM variability. Part I: Century-ength seasonal reconstructions.
J. Clim., 22, 5319–5345.
Joshi, M. M., A. J. Charlton, and A. A. Scaife, 2006: On the influence of stratospheric
water vapor changes on the tropospheric circulation. Geophys. Res. Lett., 33,
doi: 10.1029/2006gl025983.
Jourdain, N., A. Gupta, A. Taschetto, C. Ummenhofer, A. Moise, and K. Ashok, 2013:
The Indo-Australian monsoon and its relationship to ENSO and IOD in reanalysis
data and the CMIP3/CMIP5 simulations. Clim. Dyn., doi:10.1007/s00382-013-
1676-1, 1–30.
Jung, T., et al., 2011: High-resolution global climate simulations with the ECMWF
model in project Athena: Experimental design, model climate, and seasonal
forecast skill. J. Clim., 25, 3155–3172.
Junquas, C., C. Vera, L. Li, and H. Treut, 2012: Summer precipitation variability over
Southeastern South America in a global warming scenario. Climate Dynamics,
38, 1867-1883.
Junquas, C., C. S. Vera, L. Li, and H. Treut, 2013: Impact of projected SST changes
on summer rainfall in southeastern South America. Clim. Dyn., 40, 1569–1589.
Kajikawa, Y., B. Wang, and J. Yang, 2010: A multi-time scale Australian monsoon
index. Int. J. Climatol., 30, 1114–1120.
Kanada, S., M. Nakano, and T. Kato, 2010: Changes in mean atmospheric structures
around Japan during July due to global warming in regional climate experiments
using a cloud resolving model. Hydrol. Res. Lett., 4, 11–14.
Kanada, S., M. Nakano, and T. Kato, 2012: Projections of future changes in
precipitation and the vertical structure of the frontal zone during the Baiu
season in the vicinity of Japan using a 5-km-mesh regional climate model. J.
Meteorol. Soc. Jpn., 90A, 65–86.
Kang, S., I. Held, D. Frierson, and M. Zhao, 2008: The response of the ITCZ to
extratropical thermal forcing: Idealized slab-ocean experiments with a GCM. J.
Clim., 21, 3521–3532.
Kao, H. Y., and J. Y. Yu, 2009: Contrasting Eastern-Pacific and Central-Pacific types of
ENSO. J. Clim., 22, 615–632.
Kapnick, S., and A. Hall, 2012: Causes of recent changes in western North American
snowpack. Clim. Dyn., 38, 1885–1899.
Karmalkar, A. V., R. S. Bradley, and H. F. Diaz, 2011: Climate change in Central
America and Mexico: Regional climate model validation and climate change
projections. Clim. Dyn., 37, 605–629.
Karnauskas, K. B., R. Seager, A. Kaplan, Y. Kushnir, and M. A. Cane, 2009: Observed
strengthening of the zonal sea surface temperature gradient across the
equatorial Pacific Ocean. J. Clim., 22, 4316–4321.
Karpechko, A. Y., 2010: Uncertainties in future climate attributable to uncertainties
in future Northern Annular Mode trend. Geophys. Res. Lett., 37, doi:
10.1029/2010gl044717.
Karpechko, A. Y., and E. Manzini, 2012: Stratospheric influence on tropospheric
climate change in the Northern Hemisphere. J. Geophys. Res., 117, doi:
10.1029/2011JD017036.
Karpechko, A. Y., N. P. Gillett, L. J. Gray, and M. Dall’Amico, 2010: Influence of ozone
recovery and greenhouse gas increases on Southern Hemisphere circulation. J.
Geophys. Res., 115, D22117.
Kaspari, S., P. A. Mayewski, D. A. Dixon, V. B. Spikes, S. B. Sneed, M. J. Handley, and
G. S. Hamilton, 2004: Climate variability in West Antarctica derived from annual
accumulation-rate records from ITASE firn/ice cores. Annals of Glaciology, 39,
585–594.
Kattsov, V. M., J. E. Walsh, W. L. Chapman, V. A. Govorkova, T. V. Pavlova, and X. D.
Zhang, 2007: Simulation and projection of arctic freshwater budget components
by the IPCC AR4 global climate models. J. Hydrometeorol., 8, 571–589.
Kaufman, D. S., et al., 2009: Recent warming reverses long-term Arctic cooling.
Science, 325, 1236–1239.
Kawatani, Y., K. Hamilton, and S. Watanabe, 2011: The Quasi-Biennial Oscillation in a
double CO
2
climate. J. Atmos. Sci., 68, 265–283.
Kawatani, Y., K. Hamilton, and A. Noda, 2012: The effects of changes in sea surface
temperature and CO
2
concentration on the Quasi-Biennial Oscillation. J. Atmos.
Sci., 69, 1734–1749.
Kawazoe, S., and W. Gutowski, 2013: Regional, very heavy daily precipitation in
NARCCAP simulations. J. Hydrometeorol., doi:10.1175/jhm-d-12-068.1.
Keenlyside, N., and M. Latif, 2007: Understanding equatorial Atlantic interannual
variability. J. Clim., 20, 131–142.
Keenlyside, N., M. Latif, J. Jungclaus, L. Kornblueh, and E. Roeckner, 2008: Advancing
decadal-scale climate prediction in the North Atlantic sector. Nature, 453,
84–88.
Khain, A., B. Lynn, and J. Dudhia, 2010: Aerosol effects on intensity of landfalling
hurricanes as seen from simulations with the WRF model with spectral bin
microphysics. J. Atmos. Sci., 67, 365–384.
Khain, A., N. Cohen, B. Lynn, and A. Pokrovsky, 2008: Possible aerosol effects on
lightning activity and structure of hurricanes. J. Atmos. Sci., 65, 3652–3677.
Kharin, V. V., F. W. Zwiers, X. Zhang, and G. C. Hegerl, 2007: Changes in temperature
and precipitation extremes in the IPCC ensemble of global coupled model
simulations. J. Clim., 20, 1419–1444.
Kidson, J. W., and J. A. Renwick, 2002: Patterns of convection in the tropical Pacific
and their influence on New Zealand weather. Int. J. Climatol., 22, 151–174.
Kidston, J., and E. P. Gerber, 2010: Intermodel variability of the poleward shift of the
austral jet stream in the CMIP3 integrations linked to biases in 20th century
climatology. Geophys. Res. Lett., 37.
Kidston, J., J. A. Renwick, and J. McGregor, 2009: Hemispheric-scale seasonality of
the Southern Annular Mode and impacts on the climate of New Zealand. J. Clim.,
22, 4759–4770.
Kidston, J., G. K. Vallis, S. M. Dean, and J. A. Renwick, 2011: Can the increase in the
eddy length scale under global warming cause the poleward shift of the jet
streams? J. Clim., 24, 3764–3780.
Kim, B. M., and S. I. An, 2011: Understanding ENSO regime behavior upon an
Increase in the warm-pool temperature using a simple ENSO model. J. Clim.,
24, 1438–1450.
Kim, D., and H. Byun, 2009: Future pattern of Asian drought under global warming
scenario. Theor. Appl. Climatol., 98, 137–150.
Kim, S. T., and J.-Y. Yu, 2012: The two types of ENSO in CMIP5 models. Geophys. Res.
Lett., doi:10.1029/2012GL052006.
Kitoh, A., and T. Uchiyama, 2006: Changes in onset and withdrawal of the East Asian
summer rainy season by multi-model global warming experiments. J. Meteorol.
Soc. Jpn., 84, 247–258.
Kitoh, A., and S. Kusunoki, 2008: East Asian summer monsoon simulation by a 20-km
mesh AGCM. Clim. Dyn., 31, 389–401.
Kitoh, A., S. Kusunoki, and T. Nakaegawa, 2011: Climate change projections
over South America in the late 21st century with the 20 and 60 km mesh
Meteorological Research Institute atmospheric general circulation model (MRI-
AGCM). J. Geophys. Res. Atmos., 116, D06105.
Kitoh, A., T. Ose, K. Kurihara, S. Kusunoki, M. Sugi, and KAKUSHIN Team-3 Modeling
Group, 2009: Projection of changes in future weather extremes using super-
high-resolution global and regional atmospheric models in the KAKUSHIN
Program: Results of preliminary experiments. Hydrol. Res. Lett., 3, 49–53.

1298
Chapter 14 Climate Phenomena and their Relevance for Future Regional Climate Change
14
Kitoh, A., H. Endo, K. Krishna Kumar, I. F. A. Cavalcanti, P. Goswami, and T. Zhou,
2013: Monsoons in a changing world regional perspective in a global context. J.
Geophys. Res. Atmos., 118, doi: 10.1002/jgrd.50258.
Kjellstrom, E., G. Nikulin, U. Hansson, G. Strandberg, and A. Ullerstig, 2011: 21st
century changes in the European climate: Uncertainties derived from an
ensemble of regional climate model simulations. Tellus A, 63, 24–40.
Kjellström, E., P. Thejll, M. Rummukainen, J. H. Christensen, F. Boberg, C. O. B, and C.
Fox Maule, 2013: Emerging regional climate change signals for Europe under
varying large-scale circulation conditions. Clim. Res., 56, 103–119.
Klein, S. A., B. J. Soden, and N.-C. Lau, 1999: Remote sea surface temperature
variations during ENSO: Evidence for a tropical atmospheric bridge. J. Clim., 12,
917–932.
Klingaman, N. P., S. J. Woolnough, H. Weller, and J. M. Slingo, 2011: The impact of
finer-resolution air-sea coupling on the Intraseasonal Oscillation of the Indian
monsoon. J. Clim., 24, 2451–2468.
Knight, J., 2009: The Atlantic Multidecadal Oscillation inferred from the forced
climate response in coupled general ciculation models. J. Clim., 22, 1610–1625.
Knight, J. R., R. J. Allan, C. K. Folland, M. Vellinga, and M. E. Mann, 2005: A signature
of persistent natural thermohaline circulation cycles in observed climate.
Geophys. Res. Lett., 32, L20708.
Knutson, T. R., and R. E. Tuleya, 2004: Impact of CO
2
-induced warming on simulated
hurricane intensity and precipitation: Sensitivity to the choice of climate model
and convective parameterization. J. Clim., 17, 3477–3495.
Knutson, T. R., et al., 2006: Assessment of twentieth-century regional surface
temperature trends using the GFDL CM2 coupled models. J. Clim., 19, 1624–
1651.
Knutson, T. R., et al., 2010: Tropical cyclones and climate change. Nature Geosci., 3,
157–163.
Knutson, T. R., et al., 2013: Dynamical downscaling projections of 21st century
Atlantic hurricane activity: CMIP3 and CMIP5 model-based scenarios. J. Clim.,
26, 6591–6617.
Kodama, C., and T. Iwasaki, 2009: Influence of the SST rise on baroclinic instability
wave activity under an aquaplanet condition. J. Atmos. Sci., 66, 2272–2287.
Kodera, K., M. E. Hori, S. Yukimoto, and M. Sigmond, 2008: Solar modulation of the
Northern Hemisphere winter trends and its implications with increasing CO2.
Geophys. Res. Lett., 35, doi: 10.1029/2007gl031958.
Koenigk, T., R. Döscher, and G. Nikulin, 2011: Arctic future scenario experiments with
a coupled regional climate model. Tellus A, 63, 69–86.
Kohler, M., N. Kalthoff, and C. Kottmeier, 2010: The impact of soil moisture
modifications on CBL characteristics in West Africa: A case-study from the
AMMA campaign. Q. J. R. Meteorol. Soc., 136, 442–455.
Koldunov, N. V., D. Stammer, and J. Marotzke, 2010: Present-day Arctic sea ice
variability in the Coupled ECHAM5/MPI-OM Model. J. Clim., 23, 2520–2543.
Kripalani, R., J. Oh, and H. Chaudhari, 2007a: Response of the East Asian summer
monsoon to doubled atmospheric CO2: Coupled climate model simulations and
projections under IPCC AR4. Theor. Appl. Climatol., 87, 1–28.
Kripalani, R. H., J. H. Oh, A. Kulkarni, S. S. Sabade, and H. S. Chaudhari, 2007b:
South Asian summer monsoon precipitation variability: Coupled climate model
simulations and projections under IPCC AR4. Theor. Appl. Climatol., 90, 133–159.
Krishnamurthy, C. K. B., U. Lall, and H. H. Kwon, 2009: Changing frequency and
intensity of rainfall extremes over India from 1951 to 2003. J. Clim., 22, 4737–
4746.
Krishnamurthy, V., and R. S. Ajayamohan, 2010: Composite structure of monsoon
low pressure systems and its relation to Indian rainfall. J. Clim., 23, 4285–4305.
Kruger, L. F., R. P. da Rocha, M. S. Reboita, and T. Ambrizzi, 2011: RegCM3 nested
in the HadAM3 scenarios A2 and B2: projected changes in cyclogeneses,
temperature and precipitation over South Atlantic Ocean. Clim. Change, 113,
599–621.
Kucharski, F., A. Bracco, J. Yoo, A. Tompkins, L. Feudale, P. Ruti, and A. Dell’Aquila,
2009a: A Gill-Matsuno-type mechanism explains the tropical Atlantic influence
on African and Indian monsoon rainfall. Q. J. R. Meteorol. Soc., 135, 569–579.
Kucharski, F., et al., 2009b: The CLIVAR C20C project: Skill of simulating Indian
monsoon rainfall on interannual to decadal timescales. Does GHG forcing play a
role? Clim. Dyn., 33, 615–627.
Kug, J.-S., and I.-S. Kang, 2006: Interactive Feedback between ENSO and the Indian
Ocean. J. Clim., 19, 1784–1801.
Kug, J.-S., F.-F. Jin, and S.-I. An, 2009: Two types of El Nino events: Cold tongue El
Niño and warm pool El Niño. J. Clim., 22, 1499–1515.
Kug, J. S., S. I. An, Y. G. Ham, and I. S. Kang, 2010: Changes in El Niño and La Niña
teleconnections over North Pacific-America in the global warming simulations.
Theor. Appl. Climatol., 100, 275–282.
Kulkarni, A., 2012: Weakening of Indian summer monsoon rainfall in warming
environment. Theor. Appl. Climatol., doi:10.1007/s00704-012-0591-4.
Kumar, K., S. Patwardhan, A. Kulkarni, K. Kamala, K. Rao, and R. Jones, 2011a:
Simulated projections for summer monsoon climate over India by a high-
resolution regional climate model (PRECIS). Curr. Sci., 101, 312–326.
Kumar, K., et al., 2011b: The once and future pulse of Indian monsoonal climate.
Clim. Dyn., 36, 2159–2170.
Kumar, K. K., B. Rajagopalan, M. Hoerling, G. Bates, and M. Cane, 2006a: Unraveling
the mystery of Indian Monsoon failure during El Niño. Science, 314, 115–119.
Kumar, P., et al., 2013: Downscaled climate change projections with uncertainty
assessment over India using a high resolution multi-model approach. Sci. Total
Environ., doi:10.1016/j.scitotenv.2013.01.051.
Kumar, V., R. Deo, and V. Ramachandran, 2006b: Total rain accumulation and rain-
rate analysis for small tropical Pacific islands: A case study of Suva, Fiji. Atmos.
Sci. Lett., 7, 53–58.
Kusunoki, S., and R. Mizuta, 2008: Future changes in the Baiu rain band projected by
a 20-km mesh global atmospheric model: Sea surface temperature dependence.
Sola, 4, 85–88.
Kusunoki, S., and O. Arakawa, 2012: Change in the precipitation intensity of the East
Asian summer monsoon projected by CMIP3 models. Clim. Dyn., 38, 2055–2072.
Kuzmina, S. I., L. Bengtsson, O. M. Johannessen, H. Drange, L. P. Bobylev, and M.
W. Miles, 2005: The North Atlantic Oscillation and greenhouse-gas forcing.
Geophys. Res. Lett., 32, doi: 10.1029/2004gl021064.
Kvamsto, N., P. Skeie, and D. Stephenson, 2004: Impact of labrador sea-ice extent on
the North Atlantic oscillation. Int. J. Climatol., 24, 603–612.
Kwok, R., and J. C. Comiso, 2002: Southern ocean climate and sea ice anomalies
associated with the Southern Oscillation. J. Clim., 15, 487–501.
L’Heureux, M. L., and D. W. J. Thompson, 2006: Observed relationships between the
El Niño–Southern Oscillation and the extratropical zonal-mean circulation. J.
Clim., 19, 276–287.
L’Heureux, M. L., and R. W. Higgins, 2008: Boreal winter links between the Madden-
Julian oscillation and the Arctic oscillation. J. Clim., 21, 3040–3050.
Laine, A., M. Kageyama, D. Salas-Melia, G. Ramstein, S. Planton, S. Denvil, and S.
Tyteca, 2009: An energetics study of wintertime Northern Hemisphere storm
tracks under 4 × CO(2) conditions in two ocean-atmosphere coupled models.
J. Clim., 22, 819–839.
Lam, H., M. H. Kok, and K. K. Y. Shum, 2012: Benefits from typhoons—the Hong Kong
perspective. Weather, 67, 16–21.
Lambert, S. J., and J. C. Fyfe, 2006: Changes in winter cyclone frequencies and
strengths simulated in enhanced greenhouse warming experiments: Results
from the models participating in the IPCC diagnostic exercise. Clim. Dyn., 26,
713–728.
Landsea, C. W., R. A. Pielke, A. Mestas-Nunez, and J. A. Knaff, 1999: Atlantic basin
hurricanes: Indices of climatic changes. Clim. Change, 42, 89–129.
Lang, C., and D. W. Waugh, 2011: Impact of climate change on the frequency of
Northern Hemisphere summer cyclones. J. Geophys. Res. Atmos., 116, D04103.
Langenbrunner, B., and J. D. Neelin, 2013: Analyzing ENSO teleconnections in CMIP
models as a measure of model fidelity in simulating precipitation. J. Clim.,
doi:10.1175/jcli-d-12-00542.1.
Lapp, S. L., J. M. St. Jacques, E. M. Barrow, and D. J. Sauchyn, 2012: GCM projections
for the Pacifi Decadal Oscillation under greenhouse forcing for the early 21st
century. International Journal of Climatology, 32, 1423–1442.
Lau, K., S. Shen, K. Kim, and H. Wang, 2006: A multimodel study of the twentieth-
century simulations of Sahel drought from the 1970s to 1990s. J. Geophys. Res.
Atmos., 111.
Lau, K., et al., 2008: The Joint Aerosol-Monsoon Experiment—A new challenge for
monsoon climate research. Bull. Am. Meteorol. Soc., doi:10.1175/BAMS-89-3-
369, 369–383.
Lau, K. M., and H. T. Wu, 2007: Detecting trends in tropical rainfall characteristics,
1979–2003. Int. J. Climatol., 27, 979–988.
Lau, N.-C., and M. J. Nath, 2012: A model study of heat waves over North America:
Meteorological aspects and projections for the 21st Century. J. Clim., 25, 4761–
4784.
Lavender, S., and K. Walsh, 2011: Dynamically downscaled simulations of Australian
region tropical cyclones in current and future climates. Geophys. Res. Lett., 38,
doi: 10.1029/2011GL047499.

1299
Climate Phenomena and their Relevance for Future Regional Climate Change Chapter 14
14
Leckebusch, G. C., U. Ulbrich, L. Froehlich, and J. G. Pinto, 2007: Property loss
potentials for European midlatitude storms in a changing climate. Geophys. Res.
Lett., 34, doi: 10.1029/2006gl027663.
Leckebusch, G. C., B. Koffi, U. Ulbrich, J. G. Pinto, T. Spangehl, and S. Zacharias, 2006:
Analysis of frequency and intensity of European winter storm events from a
multi-model perspective, at synoptic and regional scales. Clim. Res., 31, 59–74.
Lee, J. N., S. Hameed, and D. T. Shindell, 2008: The northern annular mode in summer
and its relation to solar activity variations in the GISS ModelE. J. Atmos. Sol.
Terres. Phys., 70, 730–741.
Lee, T.-C., K.-Y. Chan, H.-S. Chan, and M.-H. Kok, 2011: Projections of extreme rainfall
in Hong Kong in the 21st century. Acta Meteorol. Sin., 25, 691–709.
Lee, T.-C., T. R. Knutson, H. Kamahori, and M. Ying, 2012: Impacts of climate change
on tropical cyclones in the western North Pacific basin. Part I: Past observations.
Trop. Cyclone Res. Rev., 1, 213–230.
Lelieveld, J., et al., 2012: Climate change and impacts in the Eastern Mediterranean
and the Middle East. Clim. Change, 114, 667–687.
Leslie, L., D. Karoly, M. Leplastrier, and B. Buckley, 2007: Variability of tropical
cyclones over the southwest Pacific Ocean using a high-resolution climate
model. Meteorol. Atmos. Phys., 97, 171–180.
Leung, L. R., and Y. Qian, 2009: Atmospheric rivers induced heavy precipitation
and flooding in the western U.S. simulated by the WRF regional climate model.
Geophys. Res. Lett., 36, L03820.
Levine, R. C., and A. G. Turner, 2012: Dependence of Indian monsoon rainfall on
moisture fluxes across the Arabian Sea and the impact of coupled model sea
surface temperature biases. Clim. Dyn., 38, 2167-2190.
Levitus, S., G. Matishov, D. Seidov, and I. Smolyar, 2009: Barents Sea multidecadal
variability. Geophys. Res. Lett., 36, L19604.
Li, B., and T. J. Zhou, 2011: El Nino-Southern Oscillation-related principal interannual
variability modes of early and late summer rainfall over East Asia in sea surface
temperature-driven atmospheric general circulation model simulations. J.
Geophys. Res. Atmos., 116, 15.
Li, G., and B. Ren, 2012: Evidence for strengthening of the tropical Pacific ocean
surface wind speed during 1979–2001. Theor. Appl. Climatol., doi:10.1007/
s00704-0110-463-3.
Li, H., A. Dai, T. Zhou, and J. Lu, 2010a: Responses of East Asian summer monsoon
to historical SST and atmospheric forcing during 1950–2000. Clim. Dyn., 34,
501–514.
Li, H. M., L. Feng, and T. J. Zhou, 2011a: Multi-model projection of July-August
climate extreme changes over China under CO
2
doubling. Part II: Temperature.
Adv. Atmos. Sci., 28, 448–463.
Li, H. M., L. Feng, and T. J. Zhou, 2011b: Multi-model projection of July-August
climate extreme changes over China under CO
2
doubling. Part I: precipitation.
Adv. Atmos. Sci., 28, 433–447.
Li, J., and J. Wang, 2003: A modified zonal index and its physical sense. Geophys. Res.
Lett., 30, doi: 10.1029/2003GL017441.
Li, J., J. Feng, and Y. Li, 2012a: A possible cause of decreasing summer rainfall in
northeast Australia. Int. J. Climatol., 32, 995–1005.
Li, J. B., et al., 2011c: Interdecadal modulation of El Nino amplitude during the past
millennium. Nature Clim. Change, 1, 114–118.
Li, T., P. Liu, X. Fu, B. Wang, and G. Meehl, 2006: Spatiotemporal structures and
mechanisms of the tropospheric biennial oscillation in the Indo-Pacific warm
ocean regions. J. Clim., 19, 3070–3087.
Li, T., M. Kwon, M. Zhao, J. Kug, J. Luo, and W. Yu, 2010b: Global warming shifts Pacific
tropical cyclone location. Geophys. Res. Lett., 37, doi: 10.1029/2010GL045124.
Li, Y., and N. Lau, 2012: Impact of ENSO on the atmospheric variability over the north
Atlantic in late winter—Role of transient eddies. J. Clim., 25, 320–342.
Li, Y., N. C. Jourdain, A. S. Taschetto, C. C. Ummenhofer, K. Ashok, and A. Sen Gupta,
2012b: Evaluation of monsoon seasonality and the tropospheric biennial
oscillation transitions in the CMIP models. Geophys. Res. Lett., 39, L20713.
Liang, X.-Z., K. E. Kunkel, G. A. Meehl, R. G. Jones, and J. X. L. Wang, 2008a: Regional
climate models downscaling analysis of general circulation models present
climate biases propagation into future change projections. Geophys. Res. Lett.,
35, L08709.
Liang, X.-Z., J. Zhu, K. E. Kunkel, M. Ting, and J. X. L. Wang, 2008b: Do GCMs simulate
the North American monsoon precipitation seasonal-interannual variability? J.
Clim., 21, 4424–4448.
Lienert, F., J. C. Fyfe, and W. J. Marryfield, 2011: Do climate models capture the
tropical influences on North Pacific sea surface temperature variability? J. Clim.,
24, 6203–6209.
Lim, E.-P., and I. Simmonds, 2009: Effect of tropospheric temperature change on
the zonal mean circulation and SH winter extratropical cyclones. Clim. Dyn., 33,
19–32.
Lim, Y.-K., L. B. Stefanova, S. C. Chan, S. D. Schubert, and J. J. O’Brien, 2011:
High-resolution subtropical summer precipitation derived from dynamical
downscaling of the NCEP/DOE reanalysis:how much small-scale information is
added by a regional model? Clim. Dyn., 37, 1061–1080.
Lima, K., P. Satyamurty, and J. Fernández, 2010: Large-scale atmospheric conditions
associated with heavy rainfall episodes in Southeast Brazil. Theor. Appl. Climatol.,
101, 121–135.
Lin, H., G. Brunet, and J. Derome, 2009: An observed connection between the North
Atlantic Oscillation and the Madden-Julian Oscillation. J. Clim., 22, 364–380.
Lin, J. L., et al., 2008a: Subseasonal variability associated with Asian summer
monsoon simulated by 14 IPCC AR4 coupled GCMs. J. Clim., 21, 4541–4567.
Lin, J. L., et al., 2008b: North American monsoon and convectively coupled equatorial
waves simulated by IPCC AR4 coupled GCMs. J. Clim., 21, 2919–2937.
Linkin, M., and S. Nigam, 2008: The North Pacific Oscillation-West Pacific
teleconnection pattern: Mature-phase structure and winter impacts. J. Clim., 21,
1979–1997.
Lintner, B., and J. Neelin, 2008: Eastern margin variability of the South Pacific
Convergence Zone. Geophys. Res. Lett., 35, doi: 10.1029/2008gl034298.
Lionello, P., S. Planton, and X. Rodo, 2008: Preface: Trends and climate change in the
Mediterranean region. Global Planet. Change, 63, 87–89.
Liu, H. W., T. J. Zhou, Y. X. Zhu, and Y. H. Lin, 2012a: The strengthening East Asia
summer monsoon since the early 1990s. Chinese Science Bulletin, 57, 1553–
1558.
Liu, J., J. A. Curry, H. Wang, M. Song, and R. M. Horton, 2012b: Impact of declining
Arctic sea ice on winter snowfall. Proc. Natl. Acad. Sci. U.S.A., 109, 4074–4079.
Liu, J. P., and J. A. Curry, 2006: Variability of the tropical and subtropical ocean
surface latent heat flux during 1989–2000. Geophys. Res. Lett., 33, doi:
10.1029/2005gl024809.
Liu, Y., S.-K. Lee, B. A. Muhling, J. T. Lamkin, and D. B. Enfield, 2012c: Significant
reduction of the Loop Current in the 21st century and its impact on the Gulf of
Mexico. J. Geophys. Res., 117, C05039.
Liu, Z., and B. Huang, 2000: Cause of tropical Pacific warming trend. Geophys. Res.
Lett., 27, 1935–1938.
Liu, Z., S. Vavrus, F. He, N. Wen, and Y. Zhong, 2005: Rethinking tropical ocean
response to global warming: The enhanced equatorial warming. J. Clim., 18,
4684–4700.
Lockwood, M., R. G. Harrison, T. Woollings, and S. K. Solanki, 2010: Are cold winters
in Europe associated with low solar activity? Environ. Res. Lett., 5, doi:
10.1088/1748-9326/5/2/024001.
Loeptien, U., O. Zolina, S. Gulev, M. Latif, and V. Soloviov, 2008: Cyclone life cycle
characteristics over the Northern Hemisphere in coupled GCMs. Clim. Dyn., 31,
507–532.
Long, Z., W. Perrie, J. Gyakum, R. Laprise, and D. Caya, 2009: Scenario changes
in the climatology of winter midlatitude cyclone activity over eastern North
America and the Northwest Atlantic. J. Geophys. Res. Atmos., 114, doi:
10.1029/2008jd010869.
Lorenz, D. J., and D. L. Hartmann, 2003: Eddy-zonal flow feedback in the Northern
Hemisphere winter. J. Clim., 16, 1212–1227.
Lorenz, D. J., and E. T. DeWeaver, 2007: Tropopause height and zonal wind response
to global warming in the IPCC scenario integrations. J. Geophys. Res. Atmos.,
112, doi: 10.1029/2006jd008087.
Lu, J., G. A. Vecchi, and T. Reichler, 2007: Expansion of the Hadley cell under global
warming. Geophys. Res. Lett., 34, doi: 10.1029/2006gl028443.
Lu, J., G. Chen, and D. M. W. Frierson, 2008: Response of the zonal mean atmospheric
circulation to El Nino versus global warming. J. Clim., 21, 5835–5851.
Lu, J., G. Chen, and D. M. W. Frierson, 2010: The position of the mid latitude storm
track and eddy-driven westerlies in Aquaplanet AGCMs. J. Atmos. Sci., 67, 3984–
4000.
Lu, R., and Y. Fu, 2010: Intensification of East Asian summer rainfall interannual
variability in the twenty-first century simulated by 12 CMIP3 coupled models. J.
Clim., doi:10.1175/2009JCLI3130.1, 3316–3331.
Lucarini, V., and F. Ragone, 2011: Energetics of climate models: Net energy balance and
meridional enthalpy transport. Rev. Geophys., 49, doi: 10.1029/2009RG000323.
Lucas, C., H. Nguyen, and B. Timbal, 2012: An observational analysis of
southern hemisphere tropical expansion. J. Geophys. Res., 117, doi:
10.1029/2011JD017033.

1300
Chapter 14 Climate Phenomena and their Relevance for Future Regional Climate Change
14
Luo, D., W. Zhou, and K. Wei, 2010: Dynamics of eddy-driven North Atlantic
Oscillations in a localized shifting jet: Zonal structure and downstream blocking.
Clim. Dyn., 34, 73–100.
Luo, Y., and L. M. Rothstein, 2011: Response of the Pacific ocean circulation to
climate change. Atmosphere-ocean, 49, 235–244.
Lupo, A. R., I. I. Mokhov, M. G. Akperov, A. V. Chernokulsky, and H. Athar, 2012: A
dynamic analysis of the role of the planetary- and synoptic-scale in the summer
of 2010 blocking episodes over the European part of Russia. Adv. Meteorol.,
2012, 11.
Ma, J., and S.-P. Xie, 2013: Regional patterns of sea surface temperature change:
A source of uncertainty in future projections of precipitation and atmospheric
circulation. J. Clim., 26, 2482–2501.
Magnusdottir, G., C. Deser, and R. Saravanan, 2004: The effects of North Atlantic SST
and sea ice anomalies on the winter circulation in CCM3. Part I: Main features
and storm track characteristics of the response. J. Clim., 17, 857–876.
Mahajan, S., R. Zhang, and T. L. Delworth, 2011: Impact of the Atlantic meridional
overturning circulation (AMOC) on Arctic surface air temperature and sea ice
variability. J. Clim., 24, 6573–6581.
Mahowald, N., 2007: Anthropocene changes in desert area: Sensitivity to climate
model predictions. Geophys. Res. Lett., 34, doi: 10.1029/2007GL030472.
Malhi, Y., J. T. Roberts, R. A. Betts, T. J. Killeen, W. Li, and C. A. Nobre, 2008: Climate
change, deforestation, and the fate of the Amazon. Science, 319, 169–172.
Maloney, E. D., and J. Shaman, 2008: Intraseasonal variability of the West African
monsoon and Atlantic ITCZ. J. Clim., 21, 2898–2918.
Maloney, E. D., and S.-P. Xie, 2013: Sensitivity of MJO activity to the pattern of
climate warming. J. Adv. Model. Earth Syst., 5, 32–47.
Manatsa, D., W. Chingombe, H. Matsikwa, and C. H. Matarira, 2008: The superior
influence of Darwin Sea level pressure anomalies over ENSO as a simple drought
predictor for Southern Africa. Theor. Appl. Climatol., 92, 1–14.
Mandke, S. K., A. K. Sahai, M. A. Shinde, S. Joseph, and R. Chattopadhyay, 2007:
Simulated changes in active/break spells during the Indian summer monsoon
due to enhanced CO
2
concentrations: Assessment from selected coupled
atmosphere-ocean global climate models. Int. J. Climatol., 27, 837–859.
Mann, M. E., and K. A. Emanuel, 2006: Atlantic hurricane trends linked to climate
change. Eos Trans., 87, 233–241.
Manton, M. J., et al., 2001: Trends in extreme daily rainfall and temperature in
Southeast Asia and the South Pacific: 1961–1998. Int. J. Climatol., 21, 269–284.
Mantua, N. J., S. R. Hare, Y. Zhang, J. M. Wallace, and R. C. Francis, 1997: A Pacific
interdecadal climate oscillation with impacts on salmon production. Bull. Am.
Meteorol. Soc., 78, 1069–1079.
Marcella, M. P., and E. A. B. Eltahir, 2011: Modeling the summertime climate of
Southwest Asia: The role of land surface processes in shaping the climate of
semiarid regions. J. Clim., 25, 704–719.
Marchant, R., C. Mumbi, S. Behera, and T. Yamagata, 2007: The Indian Ocean
dipole—the unsung driver of climatic variability in East Africa. Afr. J. Ecol., 45,
4–16.
Marengo, J., et al., 2010a: Recent developments on the South American Monsoon
system. Int. J. Climatol., 32, 1–21.
Marengo, J., et al., 2012: Development of regional future climate change scenarios
in South America using the Eta CPTEC/HadCM3 climate change projections:
Climatology and regional analyses for the Amazon, São Francisco and the
Paraná River basins. Clim. Dyn., 38, 1829–1848.
Marengo, J. A., and C. C. Camargo, 2008: Surface air temperature trends in Southern
Brazil for 1960–2002. Int. J. Climatol., 28, 893–904.
Marengo, J. A., R. Jones, L. M. Alves, and M. C. Valverde, 2009: Future change of
temperature and precipitation extremes in South America as derived from the
PRECIS regional climate modeling system. Int. J. Climatol., 29, 2241–2255.
Marengo, J. A., M. Rusticucci, O. Penalba, and M. Renom, 2010b: An intercomparison
of observed and simulated extreme rainfall and temperature events during the
last half of the twentieth century: Part 2: Historical trends. Clim. Change, 98,
509–529.
Mariotti, A., and A. Dell’Aquila, 2012: Decadal climate variability in the Mediterranean
region: Roles of large-scale forcings and regional processes. Clim. Dyn., 38,
1129–1145.
Marshall, A. G., and A. A. Scaife, 2009: Impact of the QBO on surface winter climate.
J. Geophys. Res., 114, doi: 10.1029/ 2009jd011737.
Marshall, A. G., and A. A. Scaife, 2010: Improved predictability of stratospheric
sudden warming events in an atmospheric general circulation model
with enhanced stratospheric resolution. J. Geophys. Res. Atmos., 115, doi:
10.1029/2009jd012643.
Marshall, G. J., 2007: Half-century seasonal relationships between the Southern
Annular Mode and Antarctic temperatures. Int. J. Climatol., 27, 373–383.
Martius, O., L. M. Polvani, and H. C. Davies, 2009: Blocking precursors to stratospheric
sudden warming events. Geophys. Res. Lett., 36, L14806.
Marullo, S., V. Artale, and R. Santoleri, 2011: The SST multidecadal variability in the
Atlantic–Mediterranean region and its relation to AMO. J. Clim., 24, 4385–4401.
Masato, G., B. J. Hoskins, and T. J. Woollings, 2012: Wave-breaking characteristics of
midlatitude blocking. Q. J. R. Meteorol. Soc., 138, 1285–1296.
Masato, G., B. J. Hoskins, and T. Woollings, 2013: Winter and summer Northern
Hemisphere blocking in CMIP5 models. J. Clim., doi:10.1175/jcli-d-12-00466.1.
Mason, S., 2001: El Nino, climate change, and Southern African climate.
Environmetrics, 12, 327–345.
Massom, R. A., M. J. Pook, J. C. Comiso, N. Adams, J. Turner, T. Lachlan-Cope, and T. T.
Gibson, 2004: Precipitation over the interior East Antarctic ice sheet related to
midlatitude blocking-high activity. J. Clim., 17, 1914–1928.
Matsueda, M., 2011: Predictability of Euro-Russian blocking in summer of 2010.
Geophys. Res. Lett., 38, L06801.
Matsueda, M., H. Endo, and R. Mizuta, 2010: Future change in Southern Hemisphere
summertime and wintertime atmospheric blockings simulated using a
20-km-mesh AGCM. Geophys. Res. Lett., 37, L02803.
May, W., 2011: The sensitivity of the Indian summer monsoon to a global warming
of 2 degrees C with respect to pre-industrial times. Clim. Dyn., 37, 1843–1868.
McCabe, G., and D. Wolock, 2010: Long-term variability in Northern Hemisphere
snow cover and associations with warmer winters. Clim. Change, doi:10.1007/
s10584-009-9675-2, 141–153.
McDonald, R. E., 2011: Understanding the impact of climate change on Northern
Hemisphere extra-tropical cyclones. Clim. Dyn., 37, 1399–1425.
McLandress, C., and T. G. Shepherd, 2009: Simulated anthropogenic changes in the
Brewer–Dobson circulation, including its extension to high latitudes. J. Clim.,
22, 1516–1540.
Mearns, L. O., R. Arritt, S. Biner, M. Bukovsky, S. Stain, and et al., 2012: The North
American regional climate change assessment program: Overview of phase I
results. Bull. Am. Meteorol. Soc., 93, 1337–1362.
Meehl, G., and H. Teng, 2007: Multi-model changes in El Nino teleconnections over
North America in a future warmer climate. Clim. Dyn., 29, 779–790.
Meehl, G., J. Arblaster, and W. Collins, 2008: Effects of Black Carbon Aerosols on the
Indian Monsoon. J. Clim., 21, 2869–2882.
Meehl, G., A. Hu, and C. Tebaldi, 2010: Decadal Prediction in the Pacific Region. J.
Clim., 23, 2959–2973.
Meehl, G. A., 1997: The south Asian monsoon and the tropospheric biennial
oscillation. J. Clim., 10, 1921–1943.
Meehl, G. A., and A. Hu, 2006: Megadroughts in the Indian monsoon region and
southwest North America and a mechanism for associated multidecadal Pacific
sea surface temperature anomalies. J. Clim., 19, 1605–1623.
Meehl, G. A., and J. M. Arblaster, 2012: Relating the strength of the tropospheric
biennial oscillation (TBO) to the phase of the Interdecadal Pacific Oscillation
(IPO). Geophys. Res. Lett., 39, L20716.
Meehl, G. A., et al., 2007: Global climate projections. In: Climate Change 2007: The
Physical Science Basis. Contribution of Working Group I to the Fourth Assessment
Report of the Intergovernmental Panel on Climate Change [Solomon, S., D. Qin,
M. Manning, Z. Chen, M. Marquis, K. B. Averyt, M. Tignor and H. L. Miller (eds.)]
Cambridge University Press, Cambridge, United Kingdom and New York, NY,
USA, pp. 747–846.
Menary, M., W. Park, K. Lohmann, M. Vellinga, M. Palmer, M. Latif, and J. Jungclaus,
2012: A multimodel comparison of centennial Atlantic meridional overturning
circulation variability. Clim. Dyn., 38, 2377–2388.
Mendes, M. C. D., R. M. Trigo, I. F. A. Cavalcanti, and C. C. Da Camara, 2008: Blocking
episodes in the Southern Hemisphere: Impact on the climate of adjacent
continental areas. Pure Appl. Geophys., 165, 1941–1962.
Mendez, M., and V. Magana, 2010: Regional aspects of prolonged meteorological
droughts over Mexico and Central America. J. Clim., 23, 1175–1188.
Mendoza, B., V. Garcia-Acosta, V. Velasco, E. Jauregui, and R. Diaz-Sandoval, 2007:
Frequency and duration of historical droughts from the 16th to the 19th centuries
in the Mexican Maya lands, Yucatan Peninsula. Clim. Change, 83, 151–168.

1301
Climate Phenomena and their Relevance for Future Regional Climate Change Chapter 14
14
Meneghini, B., I. Simmonds, and I. N. Smith, 2007: Association between Australian
rainfall and the Southern Annular Mode. Int. J. Climatol., 27, 109–121.
Menendez, C. G., and A. Carril, 2010: Potential changes in extremes and links with
the Southern Annular Mode as simulated by a multi-model ensemble. Clim.
Change, 98, 359–377.
Metcalfe, S. E., M. D. Jones, S. J. Davies, A. Noren, and A. MacKenzie, 2010: Climate
variability over the last two millennia in the North American Monsoon, recorded
in laminated lake sediments from Laguna de Juanacatlan, Mexico. Holocene,
20, 1195–1206.
Miller, G. H., et al., 2010: Temperature and precipitation history of the Arctic. Q. Sci.
Rev., 29, 1679–1715.
Miller, R. L., G. A. Schmidt, and D. T. Shindell, 2006: Forced annular variations in
the 20th century intergovernmental panel on climate change fourth assessment
report models. J. Geophys. Res. Atmos., 111, doi: 10.1029/2005jd006323.
Minvielle, M., and R. D. Garreaud, 2011: Projecting rainfall changes over the South
American altiplano. J. Clim., 24, 4577–4583.
Mitas, C. M., and A. Clement, 2005: Has the Hadley cell been strengthening in recent
decades? Geophys. Res. Lett., 32, doi: 10.1029/2004gl021765.
Mitas, C. M., and A. Clement, 2006: Recent behavior of the Hadley cell and tropical
thermodynamics in climate models and reanalyses. Geophys. Res. Lett., 33, doi:
10.1029/2005gl024406.
Mitchell, T. D., and P. D. Jones, 2005: An improved method of constructing a database
of monthly climate observations and associated high-resolution grids. Int. J.
Climatol., 25, 693–712.
Mitchell, T. P., and J. M. Wallace, 1996: ENSO seasonality: 1950–78 versus 1979–92.
J. Clim., 9, 3149–3161.
Mizuta, R., 2012: Intensification of extratropical cyclones associated with the polar
jet change in the CMIP5 global warming projections. Geophys. Res. Lett., 39, doi:
10.1029/2012GL053032.
Mizuta, R., M. Matsueda, H. Endo, and S. Yukimoto, 2011: Future change in
extratropical cyclones associated with change in the upper troposphere. J. Clim.,
24, 6456–6470.
Mizuta, R., et al., 2012: Climate simulations using MRI-AGCM3.2 with 20-km grid. J.
Meteorol. Soc. Jpn., 90A, 233–258.
Mock, C. J., and A. R. Brunelle-Daines, 1999: A modern analogue of western United
States summer palaeoclimate at 6000 years before present. Holocene, 9, 541–
545.
Mohino, E., S. Janicot, and J. Bader, 2011: Sahel rainfall and decadal to multi-decadal
sea surface temperature variability. Clim. Dyn., 37, 419–440.
Moise, A., and F. Delage, 2011: New climate model metrics based on object-
orientated pattern matching of rainfall. J. Geophys. Res. Atmos., 116, doi:
10.1029/2010JD015318.
Moise, A. F., R. A. Colman, and J. R. Brown, 2012: Behind uncertainties in projections
of Australian tropical climate: Analysis of 19 CMIP3 models. J. Geophys. Res.
Atmos., 117, doi: 10.1029/2011jd017365.
Moise, A. F., R. A. Colman, and H. Zhang, 2005: Coupled model simulations of
current Australian surface climate and its changes under greenhouse warming:
An analysis of 18 CMIP2 models. Aust. Meteorol. Mag., 54, 291–307.
Monaghan, A. J., and D. H. Bromwich, 2008: Advances in describing recent Antarctic
climate variablity. Bull. Am. Meteorol. Soc., 89, 1295–1306.
Monahan, A. H., L. Pandolfo, and J. C. Fyfe, 2001: The preferred structure of variability
of the Northern Hemisphere atmospheric circulation. Geophys. Res. Lett., 28,
1019–1022.
Monahan, A. H., J. C. Fyfe, M. H. P. Ambaum, D. B. Stephenson, and G. R. North,
2009: Empirical Orthogonal Functions: The medium is the message. J. Clim., 22,
6501–6514.
Moron, V., A. W. Robertson, and J.-H. Qian, 2010: Local versus regional-scale
characteristics of monsoon onset and post-onset rainfall over Indonesia. Clim.
Dyn., 34, 281–299.
Moss, R. H., et al., 2010: The next generation of scenarios for climate change research
and assessment. Nature, 463, 747–756.
Muller, W. A., and E. Roeckner, 2006: ENSO impact on midlatitude circulation
patterns in future climate change projections. Geophys. Res. Lett., 33, doi:
10.1029/2005gl025032.
Müller, W. A., and E. Roeckner, 2008: ENSO teleconnections in projections of future
climate in ECHAM5/MPI-OM. Clim. Dyn., 31, 533–549.
Murakami, H., and B. Wang, 2010: Future change of North Atlantic tropical cyclone
tracks: Projection by a 20–km-mesh global atmospheric model. J. Clim., 23,
2699–2721.
Murakami, H., and M. Sugi, 2010: Effect of model resolution on tropical cyclone
climate projections. Sola, 6, 73–76.
Murakami, H., B. Wang, and A. Kitoh, 2011a: Future change of Western North Pacific
typhoons: Projections by a 20-km-mesh global atmospheric model. J. Clim., 24,
1154–1169.
Murakami, H., R. Mizuta, and E. Shindo, 2011b: Future changes in tropical cyclone
activity projected by multi-physics and multi-SST ensemble experiments using
the 60-km-mesh MRI-AGCM. Clim. Dyn., doi:10.1007/s00382-011-1223-x.
Murakami, H., M. Sugi, and A. Kitoh, 2013: Future changes in tropical cyclone activity
in the North Indian Ocean projected by high-resolution MRI-AGCMs. Clim. Dyn.,
40, 1949–1968.
Murakami, H., et al., 2012: Future changes in tropical cyclone activity projected by
the new high-resolution MRI-AGCM. J. Clim., 25, 3237–3260.
Murphy, B. F., and B. Timbal, 2008: A review of recent climate variability and climate
change in southeastern Australia. Int. J. Climatol., 28, 859–879.
Muza, M. N., L. M. V. Carvalho, C. Jones, and B. Liebmann, 2009: Intraseasonal and
interannual variability of extreme dry and wet events over southeastern South
America and the subtropical Atlantic during austral summer. J. Clim., 22, 1682–
1699.
Nanjundiah, R., V. Vidyunmala, and J. Srinivasan, 2005: The impact of increase in CO
2
on the simulation of tropical biennial oscillations (TBO) in 12 coupled general
circulation models. Atmos. Sci. Lett., 6, 183–191.
Neelin, J., C. Chou, and H. Su, 2003: Tropical drought regions in global warming and
El Nino teleconnections. Geophys. Res. Lett., 30, doi: 10.1029/2003GL018625.
Neelin, J. D., M. Munnich, H. Su, J. E. Meyerson, and C. E. Holloway, 2006: Tropical
drying trends in global warming models and observations. Proc. Natl. Acad. Sci.,
103, 6110–6115.
Neelin, J. D., B. Langenbrunner, J. E. Meyerson, A. Hall, and N. Berg, 2013: California
winter precipitation change under global warming in CMIP5 models. J. Clim.,
26, 6238–6256.
Nguyen, K., J. Katzfey, and J. McGregor, 2012: Global 60 km simulations with CCAM:
Evaluation over the tropics. Clim. Dyn., 39, 637–654.
Nicholls, N., C. Landsea, and J. Gill, 1998: Recent trends in Australian region tropical
cyclone activity. Meteorol. Atmos. Phys., 65, 197–205.
Nieto-Ferreira, R., and T. Rickenbach, 2010: Regionality of monsoon onset in South
America: A three-stage conceptual model. Int. J. Climatol., 31, 1309–1321.
Nigam, S., 2003: Teleconnections. In: Encyclopedia of Atmospheric Sciences [J. A. P.
J. R. Holton and J. A. Curry (eds.)]. Academic Press, San Diego, CA, USA, pp.
2243–2269.
Ninomiya, K., 2012: Characteristics of intense rainfalls over southwestern Japan
in the Baiu season in the CMIP3 20th century simulation and 21st century
projection. J. Meteorol. Soc. Jpn., 90A, 327–338.
Niyogi, D., C. Kishtawal, S. Tripathi, and R. S. Govindaraju, 2010: Observational
evidence that agricultural intensification and land use change may be reducing
the Indian summer monsoon rainfall. Water Resources Research, 46, W03533,
doi: 03510.01029/02008wr007082.
Nuñez, M. N., S. A. Solman, and M. F. Cabre, 2009: Regional climate change
experiments over southern South America. II: Climate change scenarios in the
late twenty-first century. Clim. Dyn., 32, 1081–1095.
O’Gorman, P. A., 2010: Understanding the varied response of the extratropical storm
tracks to climate change. Proc. Natl. Acad. Sci. U.S.A., 107, 19176–19180.
O’Gorman, P. A., and T. Schneider, 2008: Energy of midlatitude transient eddies in
idealized simulations of changed climates. J. Clim., 21, 5797–5806.
Okamoto, K., K. Sato, and H. Akiyoshi, 2011: A study on the formation and trend of the
Brewer-Dobson circulation. J. Geophys. Res., 116, doi: 10.1029/2010JD014953.
Okumura, Y. M., D. Schneider, C. Deser, and R. Wilson, 2012: Decadal-interdecadal
climate variability over Antarctica and linkages to the tropics: Analysis of ice
core, instrumental, and tropical proxy data. J. Clim., 25, 7421–7441.
Onol, B., and F. Semazzi, 2009: Regionalization of climate change simulations over
the Eastern Mediterranean. J. Clim., 22, 1944–1961.
Orlowsky, B., and S. Seneviratne, 2012: Global changes in extreme events: Regional
and seasonal dimension. Clim. Change, 110, 669–696.
Ose, T., and O. Arakawa, 2011: Uncertainty of future precipitation change due to
global warming associated with sea surface temperature change in the tropical
Pacific. J. Meteorol. Soc. Jpn., 89, 539–552.
Oshima, K., Y. Tanimoto, and S. P. Xie, 2012: Regional patterns of wintertime SLP
change over the North Pacific and their uncertainty in CMIP3 multi-model
projections. J. Meteorol. Soc. Jpn., 90, 385–396.

1302
Chapter 14 Climate Phenomena and their Relevance for Future Regional Climate Change
14
Ouzeau, G., J. Cattiaux, H. Douville, A. Ribes, and D. Saint-Martin, 2011: European
cold winter 2009–2010: How unusual in the instrumental record and how
reproducible in the ARPEGE-Climat model? Geophys. Res. Lett., 38, 6.
Palmer, T. N., 1999: A nonlinear dynamical perspective on climate prediction. J. Clim.,
12, 575–591.
Parker, D., C. Folland, A. Scaife, J. Knight, A. Colman, P. Baines, and B. Dong, 2007:
Decadal to multidecadal variability and the climate change background. J.
Geophys. Res., 112, D18115.
Patricola, C., and K. Cook, 2010: Northern African climate at the end of the twenty-
first century: An integrated application of regional and global climate models.
Clim. Dyn., 35, 193–212.
Pattanaik, D. R., and M. Rajeevan, 2010: Variability of extreme rainfall events over
India during southwest monsoon season. Meteorol. Appl., 17, 88–104.
Pavelsky, T., S. Kapnick, and A. Hall, 2011: Accumulation and melt dynamics of
snowpack from a multiresolution regional climate model in the central Sierra
Nevada, California. J. Geophys. Res. Atmos., 116, D16115.
Pavelsky, T. M., and L. C. Smith, 2006: Intercomparison of four global precipitation
data sets and their correlation with increased Eurasian river discharge to the
Arctic Ocean. J. Geophys. Res. Atmos., 111, D21112.
Peduzzi, P., et al., 2012: Global trends in tropical cyclone risk. Nature Clim. Change,
2, 289–294.
Perkins, S., 2011: Biases and model agreement in projections of climate extremes
over the tropical Pacific. Earth Interactions, 15, 1-36.
Perkins, S., D. Irving, J. Brown, S. Power, A. Moise, R. Colman, and I. Smith, 2012:
CMIP3 ensemble climate projections over the western tropical Pacific based on
model skill. Clim. Res., 51, 35–58.
Perlwitz, J., S. Pawson, R. L. Fogt, J. E. Nielsen, and W. D. Neff, 2008: Impact of
stratospheric ozone hole recovery on Antarctic climate. Geophys. Res. Lett., 35,
doi: 10.1029/2008gl033317.
Petersen, K. L., 1994: A warm and wet Little Climatic Optimum and a cold and dry
Little Ice Age in the southern Rocky Mountains, U.S.A. Clim. Change, 26, 243–
269.
Petoukhov, V., and V. A. Semenov, 2010: A link between reduced Barents-Kara sea
ice and cold winter extremes over northern continents. J. Geophys. Res. Atmos.,
115, D21111.
Pezza, A. B., T. Durrant, I. Simmonds, and I. Smith, 2008: Southern Hemisphere
synoptic behavior in extreme phases of SAM, ENSO, sea ice extent, and southern
Australia rainfall. J. Clim., 21, 5566–5584.
Pezzulli, S., D. Stephenson, and A. Hannachi, 2005: The variability of seasonality. J.
Clim., 18, 71–88.
Pfahl, S., and H. Wernli, 2012: Quantifying the relevance of atmospheric blocking
for co-located temperature extremes in the Northern Hemisphere on (sub-)daily
time scales. Geophys. Res. Lett., doi:10.1029/2012GL052261.
Philip, S., and G. Van Oldenborgh, 2006: Shifts in ENSO coupling processes under
global warming. Geophys. Res. Lett., 33, doi: 10.1029/2006GL026196.
Picard, G., F. Domine, G. Krinner, L. Arnaud, and E. Lefebvre, 2012: Inhibition of the
positive snow-albedo feedback by precipitation in interior Antarctica Nature
Clim. Change, doi:10.1038/NCLIMATE1590.
Pinto, J. G., M. K. Karreman, K. Born, P. M. Della-Marta, and M. Klawa, 2012:
Loss potentials associated with European windstorms under future climate
conditions. Clim. Res., 54, 1–20.
Pinto, J. G., U. Ulbrich, G. C. Leckebusch, T. Spangehl, M. Reyers, and S. Zacharias,
2007: Changes in storm track and cyclone activity in three SRES ensemble
experiments with the ECHAM5/MPI-OM1 GCM. Clim. Dyn., 29, 195–210.
Pitman, A. J., and S. E. Perkins, 2008: Regional projections of future seasonal and
annual changes in rainfall and temperature over Australia based on skill-
selected AR4 models. Earth Interact., 12, 1–50.
Plumb, R. A., 1977: The interaction of two internal waves with the mean flow:
Implications for the theory of the quasi-biennial oscillation. J. Atmos. Sci., 34,
1847–1858.
Pohl, B., N. Fauchereau, C. Reason, and M. Rouault, 2010: Relationships between
the Antarctic Oscillation, the Madden - Julian Oscillation, and ENSO, and
Consequences for Rainfall Analysis. J. Clim., 23, 238–254.
Polcher, J., et al., 2011: AMMA’s contribution to the evolution of prediction and
decision-making systems for West Africa. Atmos. Sci. Lett., 12, 2–6.
Polvani, L. M., M. Previdi, and C. Deser, 2011: Large cancellation, due to ozone
recovery, of future Southern Hemisphere atmospheric circulation trends.
Geophys. Res. Lett., 38, doi: 10.1029/2011gl046712.
Polyakov, I., V. Alexeev, U. Bhatt, E. Polyakova, and X. Zhang, 2010: North Atlantic
warming: Patterns of long-term trend and multidecadal variability. Clim. Dyn.,
34, 439–457.
Polyakov, I. V., et al., 2003: Variability and trends of air temperature and pressure in
the maritime Arctic, 1875–2000. J. Clim., 16, 2067–2077.
Poore, R. Z., M. J. Pavich, and H. D. Grissino-Mayer, 2005: Record of the North
American southwest monsoon from Gulf of Mexico sediment cores. Geology,
33, 209–212.
Popova, V. V., and A. B. Shmakin, 2010: Regional structure of surface-air temperature
fluctuatoons in Northern Eurasia in the latter half of the 20th and early 21st
centuries. Izvestiya Atmos. Ocean. Phys., 46, 144–158.
Power, S., and R. Colman, 2006: Multi-year predictability in a coupled general
circulation model. Clim. Dyn., 26, 247–272.
Power, S., M. Haylock, R. Colman, and X. Wang, 2006: The predictability of
interdecadal changes in ENSO activity and ENSO teleconnections. J. Clim., 19,
4755–4771.
Power, S., T. Casey, C. Folland, A. Colman, and V. Mehta, 1999: Inter-decadal
modulation of the impact of ENSO on Australia. Clim. Dyn., 15, 319–324.
Power, S. B., and I. N. Smith, 2007: Weakening of the Walker Circulation and apparent
dominance of El Nino both reach record levels, but has ENSO really changed?
Geophys. Res. Lett., 34, L18702.
Prat, O. P., and B. R. Nelson, 2012: Precipitation contribution of tropical cyclones in
the Southeastern United States from 1998 to 2009 using TRMM satellite data.
J. Clim., 26, 1047–1062.
Qian, J.-H., 2008: Why precipitation is mostly concentrated over islands in the
Maritime Continent. J. Atmos. Sci., 65, 1428–1441.
Qian, J.-H., A. W. Robertson, and V. Moron, 2010a: Interactions among ENSO, the
Monsoon, and Diurnal Cycle in rainfall variability over Java, Indonesia. J. Atmos.
Sci., 67, 3509–3524.
Qian, Y., S. J. Ghan, and L. R. Leung, 2010b: Downscaling hydroclimate changes
over the Western US based on CAM subgrid scheme and WRF regional climate
simulations. Int. J. Climatol., 30, 675–693.
Quadrelli, R., and J. M. Wallace, 2004: A simplified linear framework for interpreting
patterns of Northern Hemisphere wintertime climate variability. J. Clim., 17,
3728–3744.
Quintana, J. M., and P. Aceituno, 2012: Changes in the rainfall regime along the
extratropical west coast of South America (Chile): 30–43
o
S. Atmosfera, 25, 1–22.
Rabatel, A., et al., 2013: Current state of glaciers in the tropical Andes: A multi-
century perspective on glacier evolution and climate change. Cryosphere, 7,
81–102.
Raia, A., and I. F. A. Cavalcanti, 2008: The life cycle of the South American Monsoon
System. J. Clim., 21, 6227–6246.
Raible, C., 2007: On the relation between extremes of midlatitude cyclones
and the atmospheric circulation using ERA40. Geophys. Res. Lett., 34, doi:
10.1029/2006GL029084.
Raible, C. C., B. Ziv, H. Saaroni, and M. Wild, 2010: Winter synoptic-scale variability
over the Mediterranean Basin under future climate conditions as simulated by
the ECHAM5. Clim. Dyn., 35, 473–488.
Raible, C. C., P. M. Della-Marta, C. Schwierz, H. Wernli, and R. Blender, 2008: Northern
Hemisphere extratropical cyclones: A comparison of detection and tracking
methods and different reanalyses. Mon. Weather Rev., 136, 880–897.
Rajeevan, M., J. Bhate, and A. K. Jaswal, 2008: Analysis of variability and trends of
extreme rainfall events over India using 104 years of gridded daily rainfall data.
Geophys. Res. Lett., 35, doi: 10.1029/2008gl035143.
Rajendran, K., and A. Kitoh, 2008: Indian summer monsoon in future climate
projection by a super high-resolution global model. Curr. Sci., 95, 1560–1569.
Ramanathan, V., et al., 2005: Atmospheric brown clouds: Impacts on South Asian
climate and hydrological cycle. Proc. Natl. Acad. Sci. U.S.A., doi: 10.1073/
pnas.0500656102, 5326–5333.
Raphael, M. N., and M. M. Holland, 2006: Twentieth century simulation of the
southern hemisphere climate in coupled models. Part 1: Large scale circulation
variability. Clim. Dyn., 26, 217–228.
Rasmussen, R., et al., 2011: High-resolution coupled climate runoff simulations
of seasonal snowfall over Colorado; A process study of current and warmer
climate. J. Clim., 24, 3015–3048.
Rauscher, S. A., F. Giorgi, N. S. Diffenbaugh, and A. Seth, 2008: Extension and
Intensification of the Meso-American mid-summer drought in the twenty-first
century. Clim. Dyn., 31, 551–571.

1303
Climate Phenomena and their Relevance for Future Regional Climate Change Chapter 14
14
Rawlins, M. A., et al., 2010: Analysis of the Arctic system for freshwater cycle
intensification: Observations and expectations. J. Clim., 23, 5715–5737.
Re, M., and V. Barros, 2009: Extreme rainfalls in SE South America. Clim. Change,
96, 119–136.
Reboita, M. S., T. Ambrizzi, and R. P. da Rocha, 2009: Relationship between the
southern annular mode and southern hemisphere atmospheric systems. Rev.
Brasil. Meteorol., 24, doi: 10.1590/S0102-77862009000100005.
Reisinger, A., A. B. Mullan, M. Manning, D. Wratt, and R. Nottage, 2010: Global
and local climate change scenarios to support adaptation in New Zealand.
In: Climate Change Adaptation in New Zealand: Future Scenarios and Some
Sectoral Perspectives [R. A. C. Nottage, D. S. Wratt, J. F. Bornman, and K. Jones
(eds.)] VUW Press, Wellington, New Zealand, pp. 26–43.
Rind, D., 2008: The consequences of not knowing low-and high-latitude climate
sensitivity. Bull. Am. Meteorol. Soc., 89, 855–864.
Rinke, A., et al., 2006: Evaluation of an ensemble of Arctic regional climate models:
Spatiotemporal fields during the SHEBA year. Clim. Dyn., 26, 459–472.
Risbey, J. S., M. J. Pook, P. C. McIntosh, M. C. Wheeler, and H. H. Hendon, 2009: On
the remote drivers of rainfall variability in Australia. Mon. Weather Rev., 137,
3233–3253.
Riviere, G., 2011: A dynamical interpretation of the poleward shift of the jet streams
in global warming scenarios. J. Atmos. Sci., 68, 1253–1272.
Robertson, A. W., et al., 2011: The Maritime Continent monsoon. In: The Global
Monsoon System: Research and Forecast, 2nd ed. [C. P. Chang, Y. Ding, N. C.
Lau, R. H. Johnson, B. Wang and T. Yasunari (eds.)] World Scientific Singapore,
pp. 85–98.
Robinson, W. A., 2006: On the self-maintenance of midlatitude jets. J. Atmos. Sci.,
63, 2109–2122.
Rodrigues, R. R., R. J. Haarsma, E. J. D. Campos, and T. Ambrizzi, 2011: The impacts of
inter–El Niño variability on the tropical Atlantic and northeast Brazil climate. J.
Clim., 24, 3402–3422.
Rodriguez-Fonseca, B., et al., 2011: Interannual and decadal SST-forced responses of
the West African monsoon. Atmos. Sci. Lett., 12, 67–74.
Rosenfeld, D., M. Clavner, and R. Nirel, 2011: Pollution and dust aerosols modulating
tropical cyclones intensities. Atmos. Res., 102, 66–76.
Rotstayn, L., and U. Lohmann, 2002: Tropical rainfall trends and the indirect aerosol
effect. J. Clim., 15, 2103–2116.
Rotstayn, L. D., et al., 2007: Have Australian rainfall and cloudiness increased due
to the remote effects of Asian anthropogenic aerosols? J. Geophys. Res. Atmos.,
112, D09202.
Rotstayn, L. D., et al., 2009: Improved simulation of Australian climate and ENSO-
related climate variability in a GCM with an interactive aerosol treatment. Int. J.
Climatol., doi:10.1002/joc.1952.
Rouault, M., P. Florenchie, N. Fauchereau, and C. Reason, 2003: South East tropical
Atlantic warm events and southern African rainfall. Geophys. Res. Lett., 30, doi:
10.1029/2002GL014840.
Rowell, D. P., 2011: Sources of uncertainty in future changes in local precipitation.
Clim. Dyn., 39, 1929–1950.
Rowell, D. P., 2013: Simulating SST teleconnections to Africa: What is the state of the
art? J. Clim., doi:10.1175/jcli-d-12–00761.1.
Roxy, M., N. Patil, K. Ashok, and K. Aparna, 2013: Revisiting the Indian summer
monsoon-ENSO links in the IPCC AR4 projections: A cautionary outlook. Global
Planet. Change, doi:10.1016/j.gloplacha.2013.02.003, early on-line release.
Rupa Kumar, K., et al., 2006: High-resolution climate change scenarios for India for
the 21st century. Curr. Sci., 90, 334–345.
Rusticucci, M., and M. Renom, 2008: Variability and trends in indices of quality-
controlled daily temperature extremes in Uruguay. Int. J. Climatol., 28, 1083–
1095.
Rusticucci, M., J. Marengo, O. Penalba, and M. Renom, 2010: An intercomparison
of model-simulated in extreme rainfall and temperature events during the last
half of the twentieth century. Part 1: Mean values and variability. Clim. Change,
98, 493–508.
Ruti, P., and A. Dell’Aquila, 2010: The twentieth century African easterly waves in
reanalysis systems and IPCC simulations, from intra-seasonal to inter-annual
variability. Clim. Dyn., 35, 1099–1117.
Sabade, S., A. Kulkarni, and R. Kripalani, 2011: Projected changes in South Asian
summer monsoon by multi-model global warming experiments. Theor. Appl.
Climatol., 103, 543–565.
Saenger, C., A. Cohen, D. Oppo, R. Halley, and J. Carilli, 2009: Surface-temperature
trends and variability in the low-latitude North Atlantic since 1552. Nature
Geosci., 2, 492–495.
Saji, N. H., B. N. Goswami, P. N. Vinayachandran, and T. Yamagata, 1999: A dipole
mode in the tropical Indian Ocean. Nature, 401, 360–363.
Salahuddin, A., and S. Curtis, 2011: Climate extremes in Malaysia and the equatorial
South China Sea. Global Planet. Change, 78, 83–91.
Salathe Jr, E. P., L. R. Leung, Y. Qian, and Y. Zhang, 2010: Regional climate model
projections for the State of Washington. Clim. Change, 102, 51–75.
Salinger, M. J., J. A. Renwick, and A. B. Mullan, 2001: Interdecadal Pacific Oscillation
and South Pacific climate. Int. J. Climatol., 21, 1705–1722.
Sampe, T., and S.-P. Xie, 2010: Large-scale dynamics of the Meiyu-Baiu rainband:
Environmental forcing by the westerly jet. J. Climate, 23, 113–134.
Sansom, P. G., D. B. Stephenson, C. A. T. Ferro, G. Zappa, and L. Shaffrey, 2013: Simple
uncertainty frameworks for selecting weighting schemes and interpreting multi-
model ensemble climate change experiments. J. Clim., doi:10.1175/JCLI-D-12–
00462.1.
Santer, B. D., et al., 2007: Identification of human-induced changes in atmospheric
moisture content. Proc. Natl. Acad. Sci. U.S.A., 104, 15248–15253.
Sato, T., F. Kimura, and A. Kitoh, 2007: Projection of global warming onto regional
precipitation over Mongolia using a regional climate model. J. Hydrol., 333,
144–154.
Scaife, A., et al., 2011a: Climate change projections and stratosphere–troposphere
interaction. Clim. Dyn., 38, 2089–2097.
Scaife, A., et al., 2009: The CLIVAR C20C project: Selected twentieth century climate
events. Clim. Dyn., 33, 603–614.
Scaife, A. A., J. R. Knight, G. K. Vallis, and C. K. Folland, 2005: A stratospheric influence
on the winter NAO and North Atlantic surface climate. Geophys. Res. Lett., 32,
doi: 10.1029/2005gl023226.
Scaife, A. A., C. K. Folland, L. V. Alexander, A. Moberg, and J. R. Knight, 2008: European
climate extremes and the North Atlantic Oscillation. J. Clim., 21, 72–83.
Scaife, A. A., T. Wollings, J. Knight, G. Martin, and T. Hinton, 2010: Atmospheric
blocking and mean biases in 18 climate models. Journal of Climate, 23, 6143-
6152.
Scaife, A. A., et al., 2011b: Improved Atlantic winter blocking in a climate model.
Geophys. Res. Lett., 38, L23703.
Scarchilli, C., M. Frezzotti, and P. Ruti, 2011: Snow precipitation at four ice core sites
in East Antarctica: Provenance, seasonality and blocking factors. Clim. Dyn., 37,
2107–2125.
Schimanke, S., J. Koerper, T. Spangehl, and U. Cubasch, 2011: Multi-decadal variability
of sudden stratospheric warmings in an AOGCM. Geophys. Res. Lett., 38, L01801.
Schneider, D., C. Deser, and Y. Okumura, 2012: An assessment and interpretation of
the observed warming of West Antarctica in the austral spring. Clim. Dyn., 38,
323–347.
Schneider, N., and B. Cornuelle, 2005: The forcing of the Pacific decadal oscillation.
J. Clim., 18, 4355–4373.
Schneider, T., P. A. O’Gorman, and X. J. Levine, 2010: Water vapor and the dynamics
of climate changes. Rev. Geophys., 48, RG3001.
Schott, F. A., S.-P. Xie, and J. P. McCreary, 2009: Indian Ocean circulation and climate
variability. Rev. Geophys., 47, RG1002.
Schubert, J. J., B. Stevens, and T. Crueger, 2013: The Madden-Julian Oscillation as
simulated by the MPI Earth System Model: Over the last and into the next
millennium. J. Adv. Model. Earth Syst., 5, 71–84.
Schulz, N., J. P. Boisier, and P. Aceituno, 2012: Climate change along the arid coast of
northern Chile. Int. J. Climatol., 32, 1803–1814.
Screen, J. A., I. Simmonds, C. Deser, and R. Tomas, 2012: The atmospheric response to
three decades of observed Arctic sea ice loss. J. Clim., 26, 1230–1248.
Seager, R., and G. Vecchi, 2010: Greenhouse warming and the 21st century
hydroclimate of southwestern North America. Proc. Natl. Acad. Sci. U.S.A., 107,
21277–21282.
Seager, R., Y. Kushnir, M. Ting, M. Cane, N. Naik, and J. Miller, 2008: Would advance
knowledge of 1930s SSTs have allowed prediction of the dust bowl drought? J.
Clim., 21, 3261–3281.
Seager, R., N. Naik, and L. Vogel, 2012: Does Global Warming Cause Intensified
Interannual Hydroclimate Variability? J. Clim., 25, 3355-3372
Seager, R., et al., 2007: Model projections of an imminent transition to a more arid
climate in southwestern North America. Science, 316, 1181–1184.
Seager, R., et al., 2009: Mexican drought: An observational modeling and tree ring
study of variability and climate change. Atmosfera, 22, 1–31.

1304
Chapter 14 Climate Phenomena and their Relevance for Future Regional Climate Change
14
Seidel, D. J., Q. Fu, W. J. Randel, and T. J. Reichler, 2008: Widening of the tropical belt
in a changing climate. Nature Geosci., 1, 21–24.
Seierstad, I. A., and J. Bader, 2009: Impact of a projected future Arctic Sea Ice
reduction on extratropical storminess and the NAO. Clim. Dyn., 33, 937–943.
Semenov, V. A., 2007: Structure of temperature variability in the high latitudes of the
Northern Hemisphere. Izvestiya Atmos. Ocean. Phys., 43, 687–695.
Sen Gupta, A., A. Ganachaud, S. McGregor, J. N. Brown, and L. Muir, 2012: Drivers of
the projected changes to the Pacific Ocean equatorial circulation. Geophys. Res.
Lett., 39, L09605.
Sen Roy, S., 2009: A spatial analysis of extreme hourly precipitation patterns in India.
Int. J. Climatol., 29, 345–355.
Seneviratne, S., et al., 2010: Investigating soil moisture-climate interactions in a
changing climate: A review. Earth Sci. Rev., 95, 125–161.
Seneviratne, S. I., et al., 2012: Changes in climate extremes and their impacts on the
natural physical environment. In:Managing the Risks of Extreme Events and
Disasters to Advance Climate Change Adaptation. A Special Report of Working
Groups I and II of the Intergovernmental Panel on Climate Change (IPCC) [C. B.
Field, V. Barros, T. F. Stocker, D. Qin, D. J. Dokken, K. L. Ebi, M. D. Mastrandrea, K. J.
Mach, G. -K. Plattner, S. K. Allen, M. Tignor and P. M. Midgley (eds.)]. Cambridge
University Press, Cambridge, United Kingdom, and New York, NY, USA, pp.
109–230.
Servain, J., I. Wainer, J. McCreary, and A. Dessier, 1999: Relationship between the
equatorial and meridional modes of climatic variability in the tropical Atlantic.
Geophys. Res. Lett., 26, 485–488.
Seth, A., M. Rojas, and S. A. Rauscher, 2010: CMIP3 projected changes in the annual
cycle of the South American Monsoon. Clim. Change, 98, 331–357.
Seth, A., S. A. Rauscher, M. Rojas, A. Giannini, and S. J. Camargo, 2011: Enhanced
spring convective barrier for monsoons in a warmer world? Clim. Change, 104,
403–414.
Sheffield, J., and E. F. Wood, 2008: Projected changes in drought occurrence under
future global warming from multi-model, multi-scenario, IPCC AR4 simulations.
Clim. Dyn., 31, 79–105.
Shi, G., J. Ribbe, W. Cai, and T. Cowan, 2008a: An interpretation of Australian rainfall
projections. Geophys. Res. Lett., 35, L02702.
Shi, G., W. Cai, T. Cowan, J. Ribbe, L. Rotstayn, and M. Dix, 2008b: Variability and trend
of North West Australia rainfall: Observations and coupled climate modeling. J.
Clim., 21, 2938–2959.
Shongwe, M., G. van Oldenborgh, B. van den Hurk, and M. van Aalst, 2011: Projected
changes in mean and extreme precipitation in Africa under global warming. Part
II: East Africa. J. Clim., 24, 3718–3733.
Shongwe, M. E., G. J. van Oldenborgh, B. van den Hurk, B. de Boer, C. A. S. Coelho,
and M. K. van Aalst, 2009: Projected changes in mean and extreme precipitation
in Africa under global warming. Part I: Southern Africa. J. Clim., 22, 3819–3837.
Sigmond, M., and J. F. Scinocca, 2010: The influence of the basic state on the Northern
Hemisphere circulation response to climate change. J. Clim., 23, 1434–1446.
Sillmann, J., M. Croci-Maspoli, M. Kallache, and R. W. Katz, 2011: Extreme cold winter
temperatures in Europe under the influence of North Atlantic atmospheric
blocking. J. Clim., 24, 5899–5913.
Sillmann, J., V. V. Kharin, X. Zhang, F. W. Zwiers, and D. Bronaugh, 2013: Climate
extremes indices in the CMIP5 multimodel ensemble: Part 1. Model evaluation
in the present climate. J. Geophys. Res. Atmos., 118, 1716–1733.
Silva, A. E., and L. M. V. Carvalho, 2007: Large-scale index for South America
Monsoon (LISAM). Atmos. Sci. Lett., 8, 51–57.
Silva, V. B. S., and V. E. Kousky, 2012: The South American Monsoon System:
Climatology and variability. Chapter 5 in: Modern Climatology [S.-Y. Wang (ed.)],
pp 123-152.
Sinha, A., et al., 2011: A global context for megadroughts in monsoon Asia during
the past millennium. Quat. Sci. Rev., 30, 47–62.
Skansi, M. d. l. M., et al., 2013: Warming and wetting signals emerging from analysis
of changes in climate extreme indices over South America. Global Planet.
Change, 100, 295–307.
Smirnov, D., and D. Vimont, 2011: Variability of the Atlantic Meridional Mode during
the Atlantic hurricane season. J. Clim., 24, 1409–1424.
Smith, D. M., R. Eade, N. J. Dunstone, D. Fereday, J. M. Murphy, H. Pohlmann, and A.
A. Scaife, 2010: Skilful multi-year predictions of Atlantic hurricane frequency.
Nature Geosci, 3, 846–849.
Smith, I., and E. Chandler, 2010: Refining rainfall projections for the Murray Darling
Basin of south-east Australia—the effect of sampling model results based on
performance. Clim. Change, 102, 377–393.
Smith, I. N., and B. Timbal, 2012: Links between tropical indices and southern
Australian rainfall. Int. J. Climatol., 32, 33–40.
Smith, I. N., L. Wilson, and R. Suppiah, 2008: Characteristics of the northern
Australian rainy season. J. Clim., 21, 4298–4311.
Smith, I. N., A. F. Moise, and R. Colman, 2012a: Large scale circulation features in the
tropical Western Pacific and their representation in climate models. J. Geophys.
Res., 117, doi: 10.1029/2011JD016667.
Smith, K. L., L. M. Polvani, and D. R. Marsh, 2012b: Mitigation of 21st century
Antarctic sea ice loss by stratospheric ozone recovery. Geophys. Res. Lett., 39,
doi: 10.1029/2012GL053325.
Soares, W. R., and J. A. Marengo, 2009: Assessments of moisture fluxes east of
the Andes in South America in a global warming scenario. Int. J. Climatol., 29,
1395–1414.
Sobel, A., and S. Camargo, 2011: Projected future seasonal changes in tropical
summer climate. J. Clim., 24, 473–487.
Sohn, B., and S. Park, 2010: Strengthened tropical circulations in past three
decades inferred from water vapor transport. J. Geophys. Res. Atmos., 115, doi:
10.1029/2009JD013713.
Solman, S., M. Nuñez, and M. Cabré, 2008: Regional climate change experiments
over southern South America. I: Present climate. Clim. Dyn., 30, 533–552.
Solman, S., et al., 2013: Evaluation of an ensemble of regional climate model
simulations over South America driven by the ERA-Interim reanalysis: Model
performance and uncertainties. Clim. Dyn., doi:10.1007/s00382-013-1667-2,
1–19.
Solman, S. A., and H. Le Treut, 2006: Climate change in terms of modes of atmospheric
variability and circulation regimes over southern South America. Clim. Dyn., 26,
835–854.
Solomon, A., and M. Newman, 2011: Decadal predictability of tropical Indo-Pacific
Ocean temperature trends due to anthropogenic forcing in a coupled climate
model. Geophys. Res. Lett., 38, doi: 10.1029/2010GL045978.
Son, S. W., and S. Y. Lee, 2005: The response of westerly jets to thermal driving in a
primitive equation model. J. Atmos. Sci., 62, 3741–3757.
Son, S. W., et al., 2010: Impact of stratospheric ozone on Southern Hemisphere
circulation change: A multimodel assessment. J. Geophys. Res., 115, D00M07.
Sörensson, A. A., C. Menéndez, R. Ruscica, P. Alexander, P. Samuelsson, and U.
Willén, 2010: Projected precipitation changes in South America: A dynamical
downscaling within CLARIS.. Meteorol. Z., 19, 347–355.
Sperber, K., and H. Annamalai, 2008: Coupled model simulations of boreal summer
intraseasonal (30–50 day) variability, Part 1: Systematic errors and caution on
use of metrics. Clim. Dyn., 31, 345–372.
Sperber, K. R., et al., 2012: The Asian summer monsoon: An intercomparison of
CMIP5 vs. CMIP3 simulations of the late 20th century. Clim. Dyn., doi:10.1007/
s00382-012-1607-6, 1–34.
Stammerjohn, S. E., D. G. Martinson, R. C. Smith, X. Yuan, and D. Rind, 2008: Trends
in Antarctic annual sea ice retreat and advance and their relation to El Niño-
Southern Oscillation and Southern Annular Mode variability. J. Geophys. Res.,
113, C03S90.
Stephenson, D., A. Hannachi, and A. O’Neill, 2004: On the existence of multiple
climate regimes. Q. J. R. Meteorol. Soc., 130, 583–605.
Stephenson, D., V. Pavan, M. Collins, M. Junge, and R. Quadrelli, 2006: North Atlantic
Oscillation response to transient greenhouse gas forcing and the impact on
European winter climate: A CMIP2 multi-model assessment. Clim. Dyn., 27,
401–420.
Stevenson, S., B. Fox-Kemper, M. Jochum, R. Neale, C. Deser, and G. Meehl, 2012:
Will there be a significant change to El Nino in the twenty-first century? J. Clim.,
25, 2129–2145.
Stevenson, S. L., 2012: Significant changes to ENSO strength and impacts in
the twenty-first century: Results from CMIP5. Geophys. Res. Lett.,
doi:10.1029/2012GL052759.
Stoner, A. M. K., K. Hayhoe, and D. J. Wuebbles, 2009: Assessing General Circulation
Model simulations of atmospheric teleconnection patterns. J. Clim., 22, 4348–
4372.
Stowasser, M., H. Annamalai, and J. Hafner, 2009: Response of the South Asian
summer monsoon to global warming: Mean and synoptic systems. J. Clim., 22,
1014–1036.
Strong, C., G. Magnusdottir, and H. Stern, 2009: Observed feedback between winter
sea ice and the North Atlantic Oscillation. J. Clim., 22, 6021–6032.
Sugi, M., and J. Yoshimura, 2012: Decreasing trend of tropical cyclone frequency in
228-year high-resolution AGCM simulations. Geophys. Res. Lett., 39, L19805.

1305
Climate Phenomena and their Relevance for Future Regional Climate Change Chapter 14
14
Sugi, M., H. Murakami, and J. Yoshimura, 2009: A reduction in global tropical cyclone
frequency due to global warming. Sola, 5, 164–167.
Sugi, M., H. Murakami, and J. Yoshimura, 2012: On the mechanism of tropical cyclone
frequency changes due to global warming. J. Meteorol. Soc. Jpn., 90A, 397–408.
Suhaila, J., S. M. Deni, W. Z. W. Zin, and A. A. Jemain, 2010: Spatial patterns and
trends of daily rainfall regime in Peninsular Malaysia during the southwest and
northeast monsoons: 1975–2004. Meteorol. Atmos. Phys., 110, 1–18.
Sun, J., H. Wang, and W. Yuan, 2008: Decadal variations of the relationship between
the summer North Atlantic Oscillation and middle East Asian air temperature. J.
Geophys. Res. Atmos., 113, D15107.
Sun, Y., and Y. H. Ding, 2010: A projection of future changes in summer precipitation
and monsoon in East Asia. Science China Earth Sciences, 53, 284–300.
Sung, M.-K., G.-H. Lim, and J.-S. Kug, 2010: Phase asymmetric downstream
development of the North Atlantic Oscillation and its impact on the East Asian
winter monsoon. J. Geophys. Res., 115, doi: 10.1029/2009JD013153.
Sutton, R. T., and B. Dong, 2012: Atlantic Ocean influence on a shift in European
climate in the 1990s. Nature Geosci., 5, 788–792.
Swart, N. C., and J. C. Fyfe, 2012: Observed and simulated changes in the Southern
Hemisphere surface westerly wind-stress. Geophys. Res. Lett., 39, L16711.
Takahashi, K., and D. S. Battisti, 2007: Processes controlling the mean tropical Pacific
precipitation pattern. Part II: The SPCZ and the southeast Pacific dry zone. J.
Clim., 20, 5696–5706.
Takahashi, K., A. Montecinos, K. Goubanova, and B. Dewitte, 2011: ENSO regimes:
Reinterpreting the canonical and Modoki El Nino. Geophys. Res. Lett., 38, doi:
10.1029/2011gl047364.
Takaya, K., and H. Nakamura, 2005: Mechanisms of intraseasonal amplification of
the cold Siberian high. J. Atmos. Sci., 62, 4423–4440.
Tanarhte, M., P. Hadjinicolaou, and J. Lelieveld, 2012: Intercomparison of temperature
and precipitation data sets based on observations in the Mediterranean and the
Middle East. J. Geophys. Res. Atmos., 117, doi: 10.1029/2011JD017293.
Tangang, F. T., L. Juneng, and S. Ahmad, 2007: Trend and interannual variability of
temperature in Malaysia: 1961–2002. Theor. Appl. Climatol., 89, 127–141.
Tangang, F. T., et al., 2008: On the roles of the northeast cold surge, the Borneo
vortex, the Madden-Julian Oscillation, and the Indian Ocean Dipole during the
extreme 2006/2007 flood in southern Peninsular Malaysia. Geophys. Res. Lett.,
35, L14S07.
Taylor, C., A. Gounou, F. Guichard, P. Harris, R. Ellis, F. Couvreux, and M. De Kauwe,
2011a: Frequency of Sahelian storm initiation enhanced over mesoscale soil-
moisture patterns. Nature Geosci., 4, 430–433.
Taylor, C., et al., 2011b: New perspectives on land-atmosphere feedbacks from the
African Monsoon Multidisciplinary Analysis. Atmos. Sci. Lett., 12, 38–44.
Taylor, K. E., R. J. Stouffer, and G. A. Meehl, 2011c: An overview of CMIP5 and the
experiment design. Bull. Am. Meteorol. Soc., 93, 485–498.
Taylor, M. A., F. S. Whyte, T. S. Stephenson, and C. J.D, 2013: Why dry? Investigating the
future evolution of the Caribbean Low Level Jet to explain projected Caribbean
drying. Int. J. Climatol., 33, 784–792.
Taylor, M. A., T. S. Stephenson, A. Owino, A. A. Chen, and J. D. Campbell, 2011d:
Tropical gradient influences on Caribbean rainfall. J. Geophys. Res., 116, D00Q08.
Tedeschi, R. G., I. F. A. Cavalcanti, and A. M. Grimm, 2013: Influences of two types of
ENSO on South American precipitation. Int. J. Climatol., 33, 1382–1400.
Thomas, E. R., G. J. Marshall, and J. R. McConnell, 2008: A doubling in snow
accumulation in the western Antarctic Peninsula since 1850. Geophys. Res. Lett.,
35, L01706.
Thompson, D., and S. Solomon, 2009: Understanding recent stratospheric climate
change. J. Clim., 22, 1934–1943.
Thompson, D. W. J., and J. M. Wallace, 1998: The Arctic Oscillation signature in the
wintertime geopotential height and temperature fields. Geophys. Res. Lett., 25,
1297–1300.
Thompson, D. W. J., and J. M. Wallace, 2000: Annular modes in the extratropical
circulation. Part I: Month-to-month variability. J. Clim., 13, 1000–1016.
Thompson, D. W. J., and S. Solomon, 2002: Interpretation of recent Southern
Hemisphere climate change. Science, 296, 895–899.
Thompson, D. W. J., J. M. Wallace, J. J. Kennedy, and P. D. Jones, 2010: An abrupt drop
in Northern Hemisphere sea surface temperature around 1970. Nature, 467,
444–447.
Thompson, D. W. J., S. Solomon, P. J. Kushner, M. H. England, K. M. Grise, and D. J.
Karoly, 2011: Signatures of the Antarctic ozone hole in Southern Hemisphere
surface climate change. Nature Geosci., 4, 741–749.
Timbal, B., and J. M. Arblaster, 2006: Land cover change as an additional forcing to
explain the rainfall decline in the south west of Australia. Geophys. Res. Lett.,
33, L07717.
Timbal, B., and W. Drosdowsky, 2012: The relationship between the decline of South-
eastern Australian rainfall and the strengthening of the subtropical ridge. Int. J.
Climatol., doi:10.1002/joc.3492.
Timbal, B., J. M. Arblaster, and S. Power, 2006: Attribution of the late-twentieth-
century rainfall decline in southwest Australia. J. Clim., 19, 2046–2062.
Timmermann, A., F. F. Jin, and J. Abshagen, 2003: A nonlinear theory for El Nino
bursting. J. Atmos. Sci., 60, 152–165.
Ting, M., Y. Kushnir, R. Seager, and C. Li, 2009: Forced and internal twentieth-century
SST trends in the north Atlantic. J. Clim., 22, 1469–1481.
Ting, M., Y. Kushnir, R. Seager, and C. Li, 2011: Robust features of Atlantic multi-
decadal variability and its climate impacts. Geophys. Res. Lett., 38, L17705.
Tjernstrom, M., et al., 2004: Modeling the Arctic boundary layer: An evalutation of
six ARCMIP regional-scale models with data from the SHEBA project. Bound.
Layer Meteorol., 117, 337–381.
Tokinaga, H., and S. P. Xie, 2011: Weakening of the equatorial Atlantic cold tongue
over the past six decades. Nature Geosci., 4, 222–226.
Tokinaga, H., S. Xie, A. Timmermann, S. McGregor, T. Ogata, H. Kubota, and Y.
Okumura, 2012: Regional patterns of tropical Indo-Pacific climate change:
Evidence of the Walker Circulation weakening. J. Clim., 25, 1689–1710.
Trenberth, K.E., 2011: Changes in precipitation with climate change. Climate Res.,
47, 123-138.
Trenberth, K., and J. Fasullo, 2010: Simulation of present-day and twenty-first-
century energy budgets of the southern oceans. J. Clim., 23, 440–454.
Trenberth, K., J. Fasullo, and L. Smith, 2005: Trends and variability in column-
integrated atmospheric water vapor. Clim. Dyn., 24, 741–758.
Trenberth, K., C. Davis, and J. Fasullo, 2007a: Water and energy budgets of
hurricanes: Case studies of Ivan and Katrina. J. Geophys. Res. Atmos., 112, doi:
10.1029/2006JD008303.
Trenberth, K. E., D. P. Stepaniak, and J. M. Caron, 2000: The global monsoon as seen
through the divergent atmospheric circulation. J. Clim., 13, 3969–3993.
Trenberth, K. E., et al., 2007b: Observations: Surface and atmospheric climate change.
In: Climate Change 2007: The Physical Science Basis. Contribution of Working
Group I to the Fourth Assessment Report of the Intergovernmental Panel on
Climate Change [Solomon, S., D. Qin, M. Manning, Z. Chen, M. Marquis, K. B.
Averyt, M. Tignor and H. L. Miller (eds.)] Cambridge University Press, Cambridge,
United Kingdom and New York, NY, USA, pp. 235–336.
Trigo, R. M., I. F. Trigo, C. C. DaCamara, and T. J. Osborn, 2004: Climate impact of
the European winter blocking episodes from the NCEP/NCAR Reanalyses. Clim.
Dyn., 23, 17–28.
Turner, A., K. Sperber, J. Slingo, G. A. Meehl, C. R. Mechoso, M. Kimoto, and A.
Giannini, 2011: Modelling monsoons: Understanding and predicting current and
future behaviour. World Scientific Series on Asia-Pacific Weather and Climate,
Vol. 5. The Global Monsoon System: Research and Forecast, 2nd ed. [C. P. Chang,
Y. Ding, N.-C. Lau, R. H. Johnson, B. Wang and T. Yasunari (eds.)]. World Scientific
Publication Company, Singapore, 608 pp.
Turner, A. G., and H. Annamalai, 2012: Climate change and the South Asian summer
monsoon. Nature Clim. Change, 2, 587–595.
Turner, A. G., P. M. Inness, and J. M. Slingo, 2007a: The effect of doubled CO
2
and
model basic state biases on the monsoon-ENSO system. I: Mean response and
interannual variability. Q. J. R. Meteorol. Soc., 133, 1143–1157.
Turner, J., 2004: The El Niño–southern oscillation and Antarctica. Int. J. Climatol.,
24, 1–31.
Turner, J., J. E. Overland, and J. E. Walsh, 2007b: An Arctic and Antarctic perspective
on recent climate change. Int. J. Climatol., 27, 277–293.
Turner, J., et al., 2005: Antarctic climate change during the last 50 years. Int. J.
Climatol., 25, 279–294.
Tyrlis, E., and B. J. Hoskins, 2008: Aspects of a Northern Hemisphere atmospheric
blocking climatology. J. Atmos. Sci., 65, 1638–1652.
Ueda, H., A. Iwai, K. Kuwako, and M. E. Hori, 2006: Impact of anthropogenic forcing
on the Asian summer monsoon as simulated by eight GCMs. Geophys. Res. Lett.,
33, doi: 10.1029/2005gl025336.
Ulbrich, U., and M. Christoph, 1999: A shift of the NAO and increasing storm track
activity over Europe due to anthropogenic greenhouse gas forcing. Clim. Dyn.,
15, 551–559.
Ulbrich, U., G. C. Leckebusch, and J. G. Pinto, 2009: Extra-tropical cyclones in the
present and future climate: A review. Theor. Appl. Climatol., 96, 117–131.

1306
Chapter 14 Climate Phenomena and their Relevance for Future Regional Climate Change
14
Ulbrich, U., J. G. Pinto, H. Kupfer, G. C. Leckebusch, T. Spangehl, and M. Reyers, 2008:
Changing northern hemisphere storm tracks in an ensemble of IPCC climate
change simulations. J. Clim., 21, 1669–1679.
Ulbrich, U., et al., 2013: Are Greenhouse Gas Signals of Northern Hemisphere winter
extra-tropical cyclone activity dependent on the identification and tracking
methodology? Meteorol. Z., 22, 61-68.
Ummenhofer, C. C., and M. H. England, 2007: Interannual extremes in New Zealand
precipitation linked to modes of Southern Hemisphere climate variability. J.
Clim., 20, 5418–5440.
Ummenhofer, C. C., A. Sen Gupta, and M. H. England, 2009a: Causes of late
twentieth-century trends in New Zealand precipitation. J. Clim., 22, 3–19.
Ummenhofer, C. C., M. H. England, P. C. McIntosh, G. A. Meyers, M. J. Pook, J. S. Risbey,
A. S. Gupta, and A. S. Taschetto, 2009b: What causes southeast Australia’s worst
droughts? Geophys. Res. Lett., 36, doi: 10.1029/2008gl036801.
van den Broeke, M. R., and N. P. M. van Lipzig, 2004: Changes in Antarctic
temperature, wind and precipitation in response to the Antarctic Oscillation.
Ann. Glaciol., 39, 119–126.
van Ommen, T. D., and V. Morgan, 2010: Snowfall increase in coastal East Antarctica
linked with southwest Western Australian drought. Nature Geosci, 3, 267–272.
Vance, T. R., T. D. van Ommen, M. A. J. Curran, C. T. Plummer, and A. D. Moy, 2012:
A millennial proxy record of ENSO and eastern Australian rainfall from the Law
Dome ice core, East Antarctica. J. Clim., 26, 710–725.
Vancoppenolle, M., T. Fichefet, H. Goosse, S. Bouillon, G. Madec, and M. A. M.
Maqueda, 2009: Simulating the mass balance and salinity of arctic and antarctic
sea ice. 1. Model description and validation. Ocean Model., 27, 33–53.
Vasconcellos, F. C., and I. F. A. Cavalcanti, 2010: Extreme precipitation over
Southeastern Brazil in the austral summer and relations with the Southern
Hemisphere annular mode. Atmos. Sci. Lett., 11, 21–26.
Vautard, R., et al., 2007: Summertime European heat and drought waves induced
by wintertime Mediterranean rainfall deficit. Geophys. Res. Lett., 34, doi:
10.1029/2006GL028001.
Vecchi, G., and A. Wittenberg, 2010: El Nino and our future climate: Where do we
stand? WIREs Clim Change, 1, 260–270.
Vecchi, G. A., and B. J. Soden, 2007a: Global warming and the weakening of the
tropical circulation. J. Clim., 20, 4316–4340.
Vecchi, G. A., and B. J. Soden, 2007b: Increased tropical Atlantic wind shear in model
projections of global warming. Geophys. Res. Lett., 34, L08702.
Vecchi, G. A., B. J. Soden, A. T. Wittenberg, I. M. Held, A. Leetmaa, and M. J. Harrison,
2006: Weakening of tropical Pacific atmospheric circulation due to anthropogenic
forcing. Nature, 441, 73–76.
Vera, C., and G. Silvestri, 2009: Precipitation interannual variability in South America
from the WCRP-CMIP3 multi-model dataset. Clim. Dyn., 32, 1003–1014.
Vera, C., et al., 2006: Toward a unified view of the American Monsoon Systems. J.
Clim., 19, 4977–5000.
Vergara, W., et al., 2007: Visualizing future climate in Latin America: Results from
the application of the Earth Simulator. In: Latin America and Caribbean Region
Sustainable Development Working Paper No. 30. The World Bank, Washington,
DC, 82 pp.
Vial, J., and T. Osborn, 2012: Assessment of atmosphere-ocean general circulation
model simulations of winter northern hemisphere atmospheric blocking. Clim.
Dyn., 39, 95–112.
Vigaud, N., B. Pohl, and J. Crétat, 2012: Tropical-temperate interactions over southern
Africa simulated by a regional climate model. Clim. Dyn., doi:10.1007/s00382-
012-1314-3, 1–22.
Vigaud, N., Y. Richard, M. Rouault, and N. Fauchereau, 2009: Moisture transport
between the South Atlantic Ocean and southern Africa: Relationships with
summer rainfall and associated dynamics. Clim. Dyn., 32, 113–123.
Villarini, G., and G. A. Vecchi, 2012: Twenty-first-century projections of North Atlantic
tropical storms from CMIP5 models. Nature Clim. Change, 2, 604–607.
Vimont, D., M. Alexander, and A. Fontaine, 2009: Midlatitude excitation of tropical
variability in the Pacific: The role of thermodynamic coupling and seasonality. J.
Clim., 22, 518–534.
Vimont, D. J., and J. P. Kossin, 2007: The Atlantic Meridional Mode and hurricane
activity. Geophys. Res. Lett., 34, L07709.
Vincent, E., M. Lengaigne, C. Menkes, N. Jourdain, P. Marchesiello, and G. Madec,
2011: Interannual variability of the South Pacific Convergence Zone and
implications for tropical cyclone genesis. Clim. Dyn., 36, 1881–1896.
Vincent, L. A., W. A. van Wijngaarden, and R. Ropkinson, 2007: Surface temperature
and humidity trends in Canda for 1953–2005. J. Clim., 20, 5100–5113.
Vizy, E., and K. Cook, 2002: Development and application of a mesoscale climate
model for the tropics: Influence of sea surface temperature anomalies on the
West African monsoon. J. Geophys. Res. Atmos., 107, ACL 2-1-ACL 2–22.
Vuille, M., B. Francou, P. Wagnon, I. Juen, G. Kaser, B. G. Mark, and R. S. Bradley, 2008:
Climate change and tropical Andean glaciers: Past, present and future. Earth Sci.
Rev., 89, 79–96.
Walsh, K., K. McInnes, and J. McBride, 2012: Climate change impacts on tropical
cyclones and extreme sea levels in the South Pacific - A regional assessment.
Global Planet. Change, 80–81, 149–164.
Wang, B., 1995: Interdecadal changes in El-Nino onset in the last four decades. J.
Clim., 8, 267–285.
Wang, B., and Y. Wang, 1996: Temporal structure of the Southern Oscillation as
revealed by waveform and wavelet analysis. J. Clim., 9, 1586–1598.
Wang, B., and S. I. An, 2001: Why the properties of El Nino changed during the late
1970s. Geophys. Res. Lett., 28, 3709–3712.
Wang, B., and S. I. An, 2002: A mechanism for decadal changes of ENSO behavior:
Roles of background wind changes. Clim. Dyn., 18, 475–486.
Wang, B., and LinHo, 2002: Rainy season of the Asian-Pacific summer monsoon. J.
Clim., 15, 386–398.
Wang, B., and Q. Ding, 2006: Changes in global monsoon precipitation over the past
56 years. Geophys. Res. Lett., 33, L06711.
Wang, B., R. G. Wu, and T. Li, 2003: Atmosphere-warm ocean interaction and its
impacts on Asian-Australian monsoon variation. J. Clim., 16, 1195–1211.
Wang, B., I. S. Kang, and J. Y. Lee, 2004: Ensemble simulations of Asian-Australian
monsoon variability by 11 AGCMs. J. Clim., 17, 803–818.
Wang, B., Q. Ding, and J. Jhun, 2006: Trends in Seoul (1778–2004) summer
precipitation. Geophys. Res. Lett., 33, L15803.
Wang, B., J. Yang, and T. J. Zhou, 2008a: Interdecadal changes in the major modes
of Asian-Australian monsoon variability: Strengthening relationship with ENSO
since the late 1970s. J. Clim., 21, 1771–1789.
Wang, B., H.-J. Kim, K. Kikuchi, and A. Kitoh, 2011: Diagnostic metrics for evaluation
of annual and diurnal cycles. Clim. Dyn., 37, 941–955.
Wang, B., S. Xu, and L. Wu, 2012a: Intensified Arabian Sea tropical storms. Nature,
489, E1–E2.
Wang, B., J. Liu, H.-J. Kim, P. J. Webster, and S.-Y. Yim, 2012b: Recent change of the
global monsoon precipitation (1979–2008). Clim. Dyn., 39, 1123–1135.
Wang, C., S. K. Lee, and D. B. Enfield, 2007: Impact of the Atlantic warm pool on the
summer climate of the Western Hemisphere. J. Clim., 20, 5021–5040.
Wang, C., S. K. Lee, and D. B. Enfield, 2008b: Climate response to anomalously large
and small Atlantic warm pools during the summer. J. Clim., 21, 2437–2450.
Wang, H., 2001: The weakening of the Asian monsoon circulation after the end of
1970’s. Adv. Atmos. Sci., 376–386.
Wang, L., and W. Chen, 2010: How well do existing indices measure the strength of
the East Asian winter monsoon? Adv. Atmos. Sci., 27, 855–870.
Wang, L., R. Huang, L. Gu, W. Chen, and L. Kang, 2009a: Interdecadal variations
of the east Asian winter monsoon and their association with quasi-stationary
planetary wave activity. J. Clim., 22, 4860–4872.
Wang, L., W. Chen, W. Zhou, J. C. L. Chan, D. Barriopedro, and R. Huang, 2010: Effect
of the climate shift around mid 1970s on the relationship between wintertime
Ural blocking circulation and East Asian climate. Int. J. Climatol., 30, 153–158.
Wang, S. Y., R. R. Gillies, E. S. Takle, and W. J. Gutowski, 2009b: Evaluation of
precipitation in the Intermountain Region as simulated by the NARCCAP
regional climate models. Geophys. Res. Lett., 36, L11704.
Wang, X., C. Z. Wang, W. Zhou, D. X. Wang, and J. Song, 2011: Teleconnected
influence of North Atlantic sea surface temperature on the El Niño onset. Clim.
Dyn., 37, 663–676.
Wanner, H., et al., 2001: North Atlantic Oscillation—Concepts and studies. Surveys
in Geophysics, 22, 321–382.
Ward, P., M. Marfai, Poerbandono, and E. Aldrian, 2011: Climate adaptation in the
city of Jakarta. Chapter 13 in: Climate Adaptation and Flood Risk in Coastal
Cities [J. Aerts, W. Botzen, M. Bowman, P. Ward and P. Dircke (eds.)]. Routledge
Earthscan, Amsterdam, Netherlands, 330 pp.
Watanabe, S., and Y. Kawatani, 2012: Sensitivity of the QBO to mean tropical
upwelling under a changing climate simulated with an Earth System Model. J.
Meteorol. Soc. Jpn. II, 90A, 351–360.
Watterson, I., A. C. Hirst, and L. D. Rotstayn, 2013: A skill-score based evaluation of
simulated Australian climate. Australian Meteorol. Oceanogr. J., 63, 181-190.

1307
Climate Phenomena and their Relevance for Future Regional Climate Change Chapter 14
14
Watterson, I. G., 2009: Components of precipitation and temperature anomalies and
change associated with modes of the Southern Hemisphere. Int. J. Climatol., 29,
809–826.
Webster, P. J., A. M. Moore, J. P. Loschnigg, and R. R. Leben, 1999: Coupled ocean-
atmosphere dynamics in the Indian Ocean during 1997–98. Nature, 401, 356–
360.
Weller, E., and W. Cai, 2013: Realism of the Indian Ocean Dipole in CMIP5 models:
The implication for climate projections. J. Clim., 26, 6649–6659.
Widlansky, M., P. Webster, and C. Hoyos, 2011: On the location and orientation of the
South Pacific Convergence Zone. Clim. Dyn., 36, 561–578.
Widlansky, M. J., et al., 2013: Changes in South Pacific rainfall bands in a warming
climate. Nature Clim. Change, 3, 417–423.
Wiedenmann, J. M., A. R. Lupo, I. I. Mokhov, and E. A. Tikhonova, 2002: The climatology
of blocking anticyclones for the Northern and Southern Hemispheres: Block
intensity as a diagnostic. J. Clim., 15, 3459–3473.
Wilcox, L. J., A. J. Charlton-Perez, and L. J. Gray 2012: Trends in Austral jet
position in ensembles of high- and low-top CMIP5 models. J. Geophys. Res.,
doi:10.1029/2012JD017597.
Williams, A., and C. Funk, 2011: A westward extension of the warm pool leads to a
westward extension of the Walker circulation, drying eastern Africa. Clim. Dyn.,
37, 2417–2435.
Wilson, A. B., D. H. Bromwich, and K. M. Hines, 2012: Evaluation of Polar WRF
forecasts on the Arctic System Reanalysis domain:2. Atmopsheric hydrologic
cycle. J. Geophys. Res., 17, D04107.
Wittenberg, A., 2004: Extended wind stress analyses for ENSO. J. Clim., 17, 2526–
2540.
Wittenberg, A. T., 2009: Are historical records sufficient to constrain ENSO
simulations? Geophys. Res. Lett., 36, L12702.
Woollings, T., 2008: Vertical structure of anthropogenic zonal-mean atmospheric
circulation change. Geophys. Res. Lett., 35, L19702.
Woollings, T., 2010: Dynamical influences on European climate: An uncertain future.
Philos. Trans. R. Soc. London A, 368, 3733–3756.
Woollings, T., A. Charlton-Perez, S. Ineson, A. G. Marshall, and G. Masato, 2010:
Associations between stratospheric variability and tropospheric blocking. J.
Geophys. Res. Atmos., 115, D06108.
Woollings, T., J. Gregory, J. Pinto, M. Reyers, and D. Brayshaw, 2012: Response of
the North Atlantic storm track to climate change shaped by ocean-atmosphere
coupling. Nature Geosci., 5, 313–317.
Wu, J., and X. J. Gao, 2013: A gridded daily observation dataset over China region
and comparison with the other datasets. Chin. J. Geophys (in Chinese), 56,
1102–1111.
Wu, L. G., 2007: Impact of Saharan air layer on hurricane peak intensity. Geophys.
Res. Lett., 34, doi: 10.1029/2007GL029564.
Wu, Q., and X. Zhang, 2010: Observed forcing-feedback processes between Northern
Hemisphere atmospheric circulation and Arctic sea ice coverage. J. Geophys. Res.
Atmos., 115., doi: 10.1029/2009jd013574.
Wu, Q. G., and D. J. Karoly, 2007: Implications of changes in the atmospheric
circulation on the detection of regional surface air temperature trends. Geophys.
Res. Lett., 34, L08703.
Wu, R., B. P. Kirtman, and V. Krishnamurthy, 2008: An asymmetric mode of tropical
Indian Ocean rainfall variability in boreal spring. J. Geophys. Res. Atmos., 113,
D05104.
Wu, Y., M. Ting, R. Seager, H.-P. Huang, and M. A. Cane, 2011: Changes in storm
tracks and energy transports in a warmer climate simulated by the GFDL CM2.1
model. Clim. Dyn., 37, 53–72.
Xie, P., and P. A. Arkin, 1997: Global precipitation: A 17-year monthly analysis based
on gauge observations, satellite estimates, and numerical model outputs. Bull.
Am. Meteorol. Soc., 78, 2539–2558.
Xie, S.-P., et al., 2007: A regional ocean–atmosphere model for Eastern Pacific
climate: Toward reducing tropical biases. J. Clim., 20, 1504–1522.
Xie, S. P., and S. G. H. Philander, 1994: A coupled ocean-atmosphere model of
relevance to the ITCZ in the eastern Pacific. Tellus A, 46, 340–350.
Xie, S. P., and J. A. Carton, 2004: Tropical Atlantic variability: Patterns, mechanisms,
and impacts. Earth Clim. Ocean-Atmos. Interact., American Geophysical Union,
121–142.
Xie, S. P., K. Hu, J. Hafner, H. Tokinaga, Y. Du, G. Huang, and T. Sampe, 2009: Indian
Ocean capacitor effect on Indo-western Pacific climate during the summer
following El Niño. J. Clim., 22, 730–747.
Xie, S. P., Y. Du, G. Huang, X. T. Zheng, H. Tokinaga, K. M. Hu, and Q. Y. Liu, 2010a:
Decadal shift in El Niño influences on Indo-western Pacific and east Asian
climate in the 1970s. J. Clim., 23, 3352–3368.
Xie, S. P. D., C. Deser, G. A. Vecchi, J. Ma, H. Teng, and A. T. Wittenberg, 2010b: Global
warming pattern formation: Sea surface temperature and rainfall. J. Clim., 23,
966–986.
Xu, Y., X.-J. Gao, and F. Giorgi, 2009: Regional variability of climate change hot-spots
in East Asia. Adv. Atmos. Sci., 26, 783–792.
Xue, Y., et al., 2010: Intercomparison and analyses of the climatology of the West
African Monsoon in the West African Monsoon Modeling and Evaluation project
(WAMME) first model intercomparison experiment. Clim. Dyn., 35, 3–27.
Yamada, Y., K. Oouchi, M. Satoh, H. Tomita, and W. Yanase, 2010: Projection of changes
in tropical cyclone activity and cloud height due to greenhouse warming: Global
cloud-system-resolving approach. Geophys. Res. Lett., 37, L07709.
Yamagata, T., S. K. Behera, J.-J. Luo, S. Masson, M. Jury, and S. A. Rao, 2004: Coupled
ocean-atmosphere variability in the tropical Indian Ocean. Earth Clim. Ocean-
Atmos. Interact., American Geophysical Union, 189–212.
Yamazaki, A., and H. Itoh, 2009: Selective absorption mechanism for the maintenance
of blocking. Geophys. Res. Lett., 36, L05803.
Yan, H., L. G. Sun, Y. H. Wang, W. Huang, S. C. Qiu, and C. Y. Yang, 2011: A record
of the Southern Oscillation Index for the past 2,000 years from precipitation
proxies. Nature Geosci., 4, 611–614.
Yang, S., and J. H. Christensen, 2012: Arctic sea ice reduction and European cold
winters in CMIP5 climate change experiments. Geophys. Res. Lett., 39, L20707.
Yatagai, A., K. Kamiguchi, O. Arakawa, A. Hamada, N. Yasutomi, and A. Kitoh, 2012:
APHRODITE: Constructing a long-term daily gridded precipitation dataset for
Asia based on a dense network of rain gauges. Bull. Am. Meteorol. Soc., 93,
1401–1415.
Ye, Z. Q., and W. W. Hsieh, 2008: Changes in ENSO and associated overturning
circulations from enhanced greenhouse gases by the end of the twentieth
century. J. Clim., 21, 5745–5763.
Yeh, S.-W., Y.-G. Ham, and J.-Y. Lee, 2012: Changes in the tropical Pacific SST Trend
from CMIP3 to CMIP5 and its implication of ENSO. J. Clim., 25, 7764–7771.
Yeh, S.-W., B. P. Kirtman, J.-S. Kug, W. Park, and M. Latif, 2011: Natural variability of
the central Pacific El Nino event on multi-centennial timescales. Geophys. Res.
Lett., 38, L02704.
Yeh, S. W., and B. P. Kirtman, 2005: Pacific decadal variability and decadal ENSO
amplitude modulation. Geophys. Res. Lett., 32, L05703.
Yeh, S. W., J. S. Kug, B. Dewitte, M. H. Kwon, B. P. Kirtman, and F. F. Jin, 2009: El Nino
in a changing climate. Nature, 461, 511–515.
Yeung, J. K., J. A. Smith, G. Villarini, A. A.N., M. L. Baeck, and W. F. Krajewski, 2011:
Analyses of the warm season rainfall climatology of the northeastern USusing
regional climate model simulations and radar rainfall fields. Adv. Water Resour.,
34, 184–204.
Yin, J. H., 2005: A consistent poleward shift of the storm tracks in simulations of 21st
century climate. Geophys. Res. Lett., 32, 4.
Yin, L., R. Fu, E. Shevliakova, and R. Dickinson, 2012: How well can CMIP5 simulate
precipitation and its controlling processes over tropical South America? Clim.
Dyn., doi:10.1007/s00382-012-1582–y.
Ying, M., T. R. Knutson, H. Kamahori, and T.-C. Lee, 2012: Impacts of climate change
on tropical cyclones in the Western North Pacific Basin. Part II: Late twenty-first
century projections. Trop. Cyclone Res. Rev., 1, 231–241.
Yokoi, S., and Y. Takayabu, 2009: Multi-model projection of global warming impact
on tropical cyclone genesis frequency over the western north Pacific. J. Meteorol.
Soc. Jpn., 87, 525–538.
Yosef, Y., H. Saaroni, and P. Alpert, 2009: Trends in daily rainfall intensity over Israel
1950/1–2003/4. Open Atmos. Sci. J., 3, 196–203.
Yu, B., and F. W. Zwiers, 2010: Changes in equatorial atmospheric zonal circulations
in recent decades. Geophys. Res. Lett., 37, L05701.
Yu, R. C., B. Wang, and T. J. Zhou, 2004: Tropospheric cooling and summer monsoon
weakening trend over East Asia. Geophys. Res. Lett., 31, L22212.
Zahn, M., and H. von Storch, 2010: Decreased frequency of North Atlantic polar lows
associated with future climate warming. Nature, 467, 309–312.
Zahn, M., and R. Allan, 2011: Changes in water vapor transports of the ascending
branch of the tropical circulation. J. Geophys. Res. Atmos., 116, doi:
10.1029/2011JD016206.
Zanchettin, D., A. Rubino, and J. Jungclaus, 2010: Intermittent multidecadal-to-
centennial fluctuations dominate global temperature evolution over the last
millennium. Geophys. Res. Lett., 37, L14702.

1308
Chapter 14 Climate Phenomena and their Relevance for Future Regional Climate Change
14
Zappa, G., L. C. Shaffrey, and K. I. Hodges, 2013a: The ability of CMIP5 models to
simulate North Atlantic extratropical cyclones. J. Clim., doi:10.1175/jcli-d-12-
00501.1.
Zappa, G., L. C. Shaffrey, K. I. Hodges, P. G. Sansom, and D. B. Stephenson, 2013b:
A multi-model assessment of future projections of North Atlantic and European
extratropical cyclones in the CMIP5 climate models. J. Clim., doi:10.1175/jcli-d-
12-00573.1.
Zebiak, S. E., 1993: Air–sea interaction in the equatorial Atlantic region. J. Clim., 6,
1567–1586.
Zhang, C., 2005: Madden-Julian Oscillation. Rev. Geophys., 43, RG2003.
Zhang, H., P. Liang, A. Moise, and L. Hanson, 2013a: The response of summer
monsoon onset/retreat in Sumatra-Java and tropical Australia region to global
warming in CMIP3 models. Clim. Dyn., 40, 377–399.
Zhang, J., U. S. Bhatt, W. V. Tangborn, and C. S. Lingle, 2007: Climate downscaling
for estimating glacier mass balances in northwestern North America: Validation
with a USGS benchmark glacier. Geophys. Res. Lett., 34, L21505.
Zhang, L., L. Wu, and L. Yu, 2011a: Oceanic origin of a recent La Nia-like trend in the
tropical Pacific. Adv. Atmos. Sci., 28, 1109–1117.
Zhang, L. X., and T. J. Zhou, 2011: An assessment of monsoon precipitation changes
during 1901–2001. Clim. Dyn., 37, 279–296.
Zhang, M. H., and H. Song, 2006: Evidence of deceleration of atmospheric vertical
overturning circulation over the tropical Pacific. Geophys. Res. Lett., 33, L12701.
Zhang, Q., Y. Guan, and H. Yang, 2008: ENSO amplitude change in observation and
coupled models. Adv. Atmos. Sci., 25, 361–366.
Zhang, R., and T. L. Delworth, 2006: Impact of Atlantic multidecadal oscillations on
India/Sahel rainfall and Atlantic hurricanes. Geophys. Res. Lett., 33, L17712.
Zhang, R., and T. L. Delworth, 2009: A new method for attributing climate variations
over the Atlantic Hurricane Basin’s main development region. Geophys. Res.
Lett., 36, L06701.
Zhang, R., et al., 2013b: Have aerosols caused the observed Atlantic multidecadal
variability? J. Atmos. Sci., 70, 1135–1144.
Zhang, S., and B. Wang, 2008: Global summer monsoon rainy seasons. Int. J.
Climatol., 28, 1563–1578.
Zhang, X., R. Brown, L. Vincent, W. Skinner, Y. Feng, and E. Mekis, 2011b: Canadian
climate trends, 1950–2007. Canadian Biodiversity: Ecosystem Status and Trends
2012, Technical Thematic Report No. 5. Canadian Councils of Resource Ministers,
Ottowa, iv + 21p.
Zhang, X., et al., 2005: Trends in Middle East climate extreme indices from 1950 to
2003. J. Geophys. Res. Atmos., 110, doi: 10.1029/2005JD006181.
Zhang, X. B., F. W. Zwiers, and P. A. Stott, 2006: Multimodel multisignal climate
change detection at regional scale. J. Clim., 19, 4294–4307.
Zhao, M., and I. Held, 2012: TC-permitting GCM simulations of hurricane frequency
response to sea surface temperature anomalies projected for the late twenty-
first century. J. Clim., 25, 2995–3009.
Zhao, M., I. M. Held, S. J. Lin, and G. A. Vecchi, 2009: Simulations of global hurricane
climatology, interannual variability, and response to global warming using a
50-km resolution GCM. J. Clim., 22, 6653–6678.
Zheng, X.-T., S.-P. Xie, and Q. Liu, 2011: Response of the Indian Ocean basin mode
and its capacitor effect to global warming. J. Clim., 24, 6146–6164.
Zheng, X.-T., Y. Du, L. Liu, G. Huang, and Q. Liu, 2013: Indian Ocean Dipole response
to global warming in the CMIP5 multi-model ensemble. J. Clim., 26, 6067–6080.
Zheng, X. T., S. P. Xie, G. A. Vecchi, Q. Y. Liu, and J. Hafner, 2010: Indian Ocean Dipole
response to global warming: Analysis of ocean-atmospheric feedbacks in a
coupled model. J. Clim., 23, 1240–1253.
Zhou, T., B. Wu, and B. Wang, 2009a: How well do atmospheric general circulation
models capture the leading modes of the interannual variability of the Asian-
Australian monsoon? J. Clim., 22, 1159–1173.
Zhou, T., R. Yu, H. Li, and B. Wang, 2008a: Ocean forcing to changes in global
monsoon precipitation over the recent half-century. J. Clim., 21, 3833–3852.
Zhou, T. J., and R. C. Yu, 2005: Atmospheric water vapor transport associated with
typical anomalous summer rainfall patterns in China. J. Geophys. Res. Atmos.,
110, D08104.
Zhou, T. J., and L. W. Zou, 2010: Understanding the predictability of East Asian
summer monsoon from the reproduction of land-sea thermal contrast change
in AMIP-type simulation. J. Clim., 23, 6009–6026.
Zhou, T. J., L. X. Zhang, and H. M. Li, 2008b: Changes in global land monsoon area
and total rainfall accumulation over the last half century. Geophys. Res. Lett.,
35, L16707.
Zhou, T. J., D. Y. Gong, J. Li, and B. Li, 2009b: Detecting and understanding the multi-
decadal variability of the East Asian Summer Monsoon—Recent progress and
state of affairs. Meteorol. Z., 18, 455–467.
Zhou, T. J., et al., 2009c: The CLIVAR C20C project: Which components of the Asian-
Australian monsoon circulation variations are forced and reproducible? Clim.
Dyn., 33, 1051–1068.
Zhou, W., J. C. L. Chan, W. Chen, J. Ling, J. G. Pinto, and Y. Shao, 2009d: Synoptic-scale
controls of persistent low temperature and icy weather over southern China in
January 2008. Mon. Weather Rev., 137, 3978–3991.
Zhu, C., B. Wang, W. Qian, and B. Zhang, 2012: Recent weakening of northern East
Asian summer monsoon: A possible response to global warming. Geophys. Res.
Lett., 39, doi: 10.1029/2012GL051155.
Zhu, Y. L., and H. J. Wang, 2010: The Arctic and Antarctic Oscillations in the IPCC AR4
Coupled Models. Acta Meteorol. Sin., 24, 176–188.
