
1083
14
Regional Development
and Cooperation
Coordinating Lead Authors:
Shardul Agrawala (France), Stephan Klasen (Germany)
Lead Authors:
Roberto Acosta Moreno (Cuba), Leonardo Barreto-Gomez (Colombia / Austria), Thomas Cottier
(Switzerland), Alba Eritrea Gámez-Vázquez (Mexico), Dabo Guan (China / UK), Edgar E. Gutierrez-
Espeleta (Costa Rica), Leiwen Jiang (China / USA), Yong Gun Kim (Republic of Korea), Joanna
Lewis (USA), Mohammed Messouli (Morocco), Michael Rauscher (Germany), Noim Uddin
(Bangladesh / Australia), Anthony Venables (UK)
Contributing Authors:
Christian Flachsland (Germany), Kateryna Holzer (Ukraine / Switzerland), Joanna I. House (UK),
Jessica Jewell (IIASA / USA), Brigitte Knopf (Germany), Peter Lawrence (USA), Axel Michaelowa
(Germany / Switzerland), Victoria Schreitter (France / Austria)
Review Editors:
Volodymyr Demkine (Kenya / Ukraine), Kirsten Halsnaes (Denmark)
Chapter Science Assistants:
Iris Butzlaff (Germany), Nicole Grunewald (Germany)
This chapter should be cited as:
Agrawala S., S. Klasen, R. Acosta Moreno, L. Barreto, T. Cottier, D. Guan, E. E. Gutierrez-Espeleta, A. E. Gámez Vázquez, L.
Jiang, Y. G. Kim, J. Lewis, M. Messouli, M. Rauscher, N. Uddin, and A. Venables, 2014: Regional Development and Coopera-
tion. In: Climate Change 2014: Mitigation of Climate Change. Contribution of Working Group III to the Fifth Assessment
Report of the Intergovernmental Panel on Climate Change [Edenhofer, O., R. Pichs-Madruga, Y. Sokona, E. Farahani, S.
Kadner, K. Seyboth, A. Adler, I. Baum, S. Brunner, P. Eickemeier, B. Kriemann, J. Savolainen, S. Schlömer, C. von Stechow, T.
Zwickel and J.C. Minx (eds.)]. Cambridge University Press, Cambridge, United Kingdom and New York, NY, USA.

10841084
Regional Development and Cooperation
14
Chapter 14
Contents
Executive Summary � � � � � � � � � � � � � � � � � � � � � � � � � � � � � � � � � � � � � � � � � � � � � � � � � � � � � � � � � � � � � � � � � � � � � � � � � � � � � � � � � � � � � � � � � � � � � � � � � � � � � � � � � � � � � � 1086
14�1 Introduction � � � � � � � � � � � � � � � � � � � � � � � � � � � � � � � � � � � � � � � � � � � � � � � � � � � � � � � � � � � � � � � � � � � � � � � � � � � � � � � � � � � � � � � � � � � � � � � � � � � � � � � � � � 1088
14�1�1 Overview of issues
� � � � � � � � � � � � � � � � � � � � � � � � � � � � � � � � � � � � � � � � � � � � � � � � � � � � � � � � � � � � � � � � � � � � � � � � � � � � � � � � � � � � � � � � � 1088
14�1�2 Why regions matter
� � � � � � � � � � � � � � � � � � � � � � � � � � � � � � � � � � � � � � � � � � � � � � � � � � � � � � � � � � � � � � � � � � � � � � � � � � � � � � � � � � � � � � � � � 1089
14�1�3 Sustainable development and mitigation capacity at the regional level
� � � � � � � � � � � � � � � � � � � � � � � � � � � � � � � � � 1090
14.1.3.1 The ability to adopt new technologies
. . . . . . . . . . . . . . . . . . . . . . . . . . . . . . . . . . . . . . . . . . . . . . . . . . . . . . . . . . . . . . . 1090
14�2 Low-carbon development at the regional level: opportunities and barriers � � � � � � � � � � � � � � � � � � � � � � 1093
14�3 Development trends and their emission implications at the regional level � � � � � � � � � � � � � � � � � � � � � � 1093
14�3�1 Overview of trends in GHG emissions and their drivers by region
� � � � � � � � � � � � � � � � � � � � � � � � � � � � � � � � � � � � � � � � 1093
14�3�2 Energy and development
� � � � � � � � � � � � � � � � � � � � � � � � � � � � � � � � � � � � � � � � � � � � � � � � � � � � � � � � � � � � � � � � � � � � � � � � � � � � � � � � � � 1094
14.3.2.1 Energy as a driver of regional emissions
. . . . . . . . . . . . . . . . . . . . . . . . . . . . . . . . . . . . . . . . . . . . . . . . . . . . . . . . . . . . . 1094
14.3.2.2 Opportunities and barriers at the regional level for low-carbon development
in the energy sector
. . . . . . . . . . . . . . . . . . . . . . . . . . . . . . . . . . . . . . . . . . . . . . . . . . . . . . . . . . . . . . . . . . . . . . . . . . . . . . . . . . 1098
14�3�3 Urbanization and development
� � � � � � � � � � � � � � � � � � � � � � � � � � � � � � � � � � � � � � � � � � � � � � � � � � � � � � � � � � � � � � � � � � � � � � � � � � � � 1099
14.3.3.1 Urbanization as a driver of regional emissions
. . . . . . . . . . . . . . . . . . . . . . . . . . . . . . . . . . . . . . . . . . . . . . . . . . . . . . 1099
14.3.3.2 Opportunities and barriers at the regional level for low-carbon development in urbanization
. . . . . 1100
14�3�4 Consumption and production patterns in the context of development
� � � � � � � � � � � � � � � � � � � � � � � � � � � � � � � � � � � 1101
14.3.4.1 Consumption as a driver of regional emissions growth
. . . . . . . . . . . . . . . . . . . . . . . . . . . . . . . . . . . . . . . . . . . . . 1101
14.3.4.2 Embodied emission transfers between world regions
. . . . . . . . . . . . . . . . . . . . . . . . . . . . . . . . . . . . . . . . . . . . . . . 1102
14.3.4.3 Opportunities and barriers at the regional level for low-carbon development in
consumption patterns
. . . . . . . . . . . . . . . . . . . . . . . . . . . . . . . . . . . . . . . . . . . . . . . . . . . . . . . . . . . . . . . . . . . . . . . . . . . . . . . . 1104
14�3�5 Agriculture, forestry, and other land-use options for mitigation
� � � � � � � � � � � � � � � � � � � � � � � � � � � � � � � � � � � � � � � � � 1104
14�3�6 Technology transfer, low-carbon development, and opportunities for leapfrogging
� � � � � � � � � � � � � � � � � � � � � 1106
14.3.6.1 Examining low-carbon leapfrogging across and within regions
. . . . . . . . . . . . . . . . . . . . . . . . . . . . . . . . . . . . . 1107
14.3.6.2 Regional approaches to promote technologies for low-carbon development
. . . . . . . . . . . . . . . . . . . . . . . 1107
14�3�7 Investment and finance, including the role of public and private sectors and
public private partnerships
� � � � � � � � � � � � � � � � � � � � � � � � � � � � � � � � � � � � � � � � � � � � � � � � � � � � � � � � � � � � � � � � � � � � � � � � � � � � � � � � 1109
14.3.7.1 Participation in climate-specific policy instruments related to financing
. . . . . . . . . . . . . . . . . . . . . . . . . . . . 1109

10851085
Regional Development and Cooperation
14
Chapter 14
14�4 Regional cooperation and mitigation: opportunities and barriers � � � � � � � � � � � � � � � � � � � � � � � � � � � � � � � � � � � 1110
14�4�1 Regional mechanisms: conceptual
� � � � � � � � � � � � � � � � � � � � � � � � � � � � � � � � � � � � � � � � � � � � � � � � � � � � � � � � � � � � � � � � � � � � � � � � � 1110
14�4�2 Existing regional cooperation processes and their mitigation impacts
� � � � � � � � � � � � � � � � � � � � � � � � � � � � � � � � � � � 1111
14.4.2.1 Climate specific regional initiatives
. . . . . . . . . . . . . . . . . . . . . . . . . . . . . . . . . . . . . . . . . . . . . . . . . . . . . . . . . . . . . . . . . . 1111
14.4.2.2 Regional cooperation on energy
. . . . . . . . . . . . . . . . . . . . . . . . . . . . . . . . . . . . . . . . . . . . . . . . . . . . . . . . . . . . . . . . . . . . . 1114
14.4.2.3 Climate change cooperation under regional trade agreements
. . . . . . . . . . . . . . . . . . . . . . . . . . . . . . . . . . . . . 1117
14.4.2.4 Regional examples of cooperation schemes where synergies between adaptation and
mitigation are important
. . . . . . . . . . . . . . . . . . . . . . . . . . . . . . . . . . . . . . . . . . . . . . . . . . . . . . . . . . . . . . . . . . . . . . . . . . . . . 1118
14�4�3 Technology-focused agreements and cooperation within and across regions
� � � � � � � � � � � � � � � � � � � � � � � � � � � � 1119
14.4.3.1 Regional technology-focused agreements
. . . . . . . . . . . . . . . . . . . . . . . . . . . . . . . . . . . . . . . . . . . . . . . . . . . . . . . . . . . 1119
14.4.3.2 Inter-regional technology-focused agreements
. . . . . . . . . . . . . . . . . . . . . . . . . . . . . . . . . . . . . . . . . . . . . . . . . . . . . . 1120
14.4.3.3 South-South technology cooperation agreements
. . . . . . . . . . . . . . . . . . . . . . . . . . . . . . . . . . . . . . . . . . . . . . . . . . . 1121
14.4.3.4 Lessons learned from regional technology agreements
. . . . . . . . . . . . . . . . . . . . . . . . . . . . . . . . . . . . . . . . . . . . . 1121
14�4�4 Regional mechanisms for investments and finance
� � � � � � � � � � � � � � � � � � � � � � � � � � � � � � � � � � � � � � � � � � � � � � � � � � � � � � � 1122
14.4.4.1 Regional and sub-regional development banks and related mechanisms
. . . . . . . . . . . . . . . . . . . . . . . . . . . 1122
14.4.4.2 South-South climate finance
. . . . . . . . . . . . . . . . . . . . . . . . . . . . . . . . . . . . . . . . . . . . . . . . . . . . . . . . . . . . . . . . . . . . . . . . . 1122
14�5 Taking stock and options for the future � � � � � � � � � � � � � � � � � � � � � � � � � � � � � � � � � � � � � � � � � � � � � � � � � � � � � � � � � � � � � � � � � � � � � 1122
14�6 Gaps in knowledge and data � � � � � � � � � � � � � � � � � � � � � � � � � � � � � � � � � � � � � � � � � � � � � � � � � � � � � � � � � � � � � � � � � � � � � � � � � � � � � � � � � � � � 1122
14�7 Frequently Asked Questions � � � � � � � � � � � � � � � � � � � � � � � � � � � � � � � � � � � � � � � � � � � � � � � � � � � � � � � � � � � � � � � � � � � � � � � � � � � � � � � � � � � � � 1123
References � � � � � � � � � � � � � � � � � � � � � � � � � � � � � � � � � � � � � � � � � � � � � � � � � � � � � � � � � � � � � � � � � � � � � � � � � � � � � � � � � � � � � � � � � � � � � � � � � � � � � � � � � � � � � � � � � � � � � � � � � 1124

10861086
Regional Development and Cooperation
14
Chapter 14
Executive Summary
Regional cooperation already is a powerful force in the global
economy (medium evidence, high agreement). This is reflected in
numerous agreements related to trade and technology cooperation,
as well as trans-boundary agreements related to water, energy, trans-
port, etc. As a result, there is growing interest in regional cooperation
as a means to achieving mitigation objectives. A regional perspective
(where regions are defined primarily geographically, with further dif-
ferentiation related to economic proximity) recognizes differences in
the opportunities and barriers for mitigation, opportunities for joint
action on mitigation and common vulnerabilities, and assesses what
regional cooperation can and has already achieved in terms of mitiga-
tion. Regional cooperation can provide a linkage between global and
national / subnational action on climate change and can also comple-
ment national and global action. [Section 14.1.2, 14.4.1]
Regions can be defined in many different ways depending upon
the context� Mitigation challenges are often differentiated by region,
based on their levels of development. For the analysis of greenhouse
gas (GHG) projections, as well as of climate change impacts, regions
are typically defined in geographical terms. Regions can also be defined
at a supra-national or sub-national level. This chapter defines regions
as supra-national regions (sub-national regions are examined in Chap-
ter15). Ten regions are defined based on a combination of proximity
in terms of geography and levels of economic and human develop-
ment: East Asia (China, Korea, Mongolia) (EAS); Economies in Transi-
tion (Eastern Europe and former Soviet Union) (EIT); Latin America and
Caribbean (LAM); Middle East and North Africa (MNA); North America
(USA, Canada) (NAM); Pacific Organisation for Economic Co-operation
and Development 1990 (Japan, Australia, New Zealand) (POECD);
South-East Asia and Pacific (PAS); South Asia (SAS); sub-Saharan Africa
(SSA); Western Europe (WEU). Where appropriate, we also examine the
category of least-developed countries (LDC), which combines 33coun-
tries in SSA, 5in SAS, 9in PAS, and one each in LAM and the MNA, and
which are classified as such by the United Nations based on their low
incomes, low human assets, and high economic vulnerabilities. We also
examine regional cooperation initiatives through actual examples that
bear upon mitigation objectives, which do not typically conform to the
above listed world regions. [14.1.2]
There is considerable heterogeneity across and within regions
in terms of opportunities, capacity, and financing of climate
action, which has implications for the potential of different
regions to pursue low-carbon development (high confidence).
Several multi-model exercises have explored regional approaches to
mitigation. In general, these regional studies find that the costs of cli-
mate stabilization for an individual region will depend on the baseline
development of regional emission and energy-use and energy-pricing
policies, the mitigation requirement, the emissions reduction potential
of the region, and terms of trade effects of climate policy, particularly
in energy markets. [14.1.3, 14.2]
At the same time, there is a mismatch between opportunities
and capacities to undertake mitigation (medium confidence). The
regions with the greatest potential to leapfrog to low-carbon develop-
ment trajectories are the poorest developing regions where there are
few lock-in effects in terms of modern energy systems and urbaniza-
tion patterns. However, these regions also have the lowest financial,
technological, and human capacities to embark on such low-carbon
development paths and their cost of waiting is high due to unmet
energy and development needs. Emerging economies already have
more lock-in effects but their rapid build-up of modern energy systems
and urban settlements still offers substantial opportunities for low-car-
bon development. Their capacity to reorient themselves to low-carbon
development strategies is higher, but also faces constraints in terms of
finance, technology, and the high cost of delaying the installation of
new energy capacity. Lastly, industrialized economies have the larg-
est lock-in effects, but the highest capacities to reorient their energy,
transport, and urbanizations systems towards low-carbon develop-
ment. [14.1.3, 14.3.2]
Heterogeneity across and within regions is also visible at a more
disaggregated level in the energy sector (high confidence). Access
to energy varies widely across regions, with LDC and SSA being the
most energy-deprived regions. These regions emit less CO
2
, but offer
mitigation opportunities from future sustainable energy use. Regional
cooperation on energy takes different forms and depends on the degree
of political cohesion in a region, the energy resources available, the
strength of economic ties between participating countries, their insti-
tutional and technical capacity, political will and the available financial
resources. Regional cooperation on energy offers a variety of mitiga-
tion and adaptation options, through instruments such as harmonized
legalization and regulation, energy resources and infrastructure shar-
ing (e. g., through power pools), joint development of energy resources
(e. g., hydropower in a common river basin), and know-how transfer. As
regional energy cooperation instruments interact with other policies,
notably those specifically addressing climate change, they may affect
their ability to stimulate investment in low-carbon technologies and
energy efficiency. Therefore, there is a need for coordination between
these energy cooperation and regional / national climate policy instru-
ments. In this context, it is also important to consider spillovers on
energy that may appear due to trade. While mitigation policy would
likely lead to lower import dependence for energy importers, it can also
devalue endowments of fossil fuel exporting countries (with differ-
ences between regions and fuels). While the effect on coal exporters is
expected to be negative in the short- and long-term, as policies could
reduce the benefits of using coal, gas exporters could benefit in the
medium-term as coal is replaced by gas. The overall impact on oil is
more uncertain. [14.3.2, 14.4.2]
The impact of urbanization on carbon emissions also differs
remarkably across regions (high confidence). This is due to the
regional variations in the relationship between urbanization, economic
growth, and industrialization. Developing regions and their cities have
significantly higher energy intensity than developed regions, partly

10871087
Regional Development and Cooperation
14
Chapter 14
due to different patterns and forms of urban settlements. Therefore,
regional cooperation to promote environmentally friendly technology,
and to follow sustainably socioeconomic development pathways, can
induce great opportunities and contribute to the emergence of low-
carbon societies. [14.3.3]
In terms of consumption and production of GHG emissions,
there is great heterogeneity in regional GHG emissions in rela-
tion to the population, sources of emissions and gross domes-
tic product (GDP) (high confidence). In 2010, NAM, POECD, EIT,
and WEU, taken together, had 20.5 % of the world’s population, but
accounted for 58.3 % of global GHG emissions, while other regions
with 79.5 % of population accounted for 41.7 % of global emissions. If
we consider consumption-based emissions, the disparity is even larger
with NAM, POECD, EIT, and WEU generating around 65 % of global
consumption-based emissions. In view of emissions per GDP (inten-
sity), NAM, POECD and WEU have the lowest GHG emission intensities,
while SSA and PAS have high emission intensities and also the highest
share of forestry-related emissions. This shows that a significant part
of GHG-reduction potential might exist in the forest sector in these
developing regions. [14.3.4]
Regional prospects of mitigation action and low-carbon devel-
opment from agriculture and land-use change are mediated
by their development level and current pattern of emissions
(medium evidence, high agreement). Emissions from agriculture, for-
estry, and other land use (AFOLU) are larger in ASIA (SAS, EAS, and PAS
combined) and LAM than in other regions, and in many LDC regions,
emissions from AFOLU are greater than from fossil fuels. Emissions
were predominantly due to deforestation for expansion of agricul-
ture, and agricultural production (crops and livestock), with net sinks
in some regions due to afforestation. Region-specific strategies are
needed to allow for flexibility in the face of changing demographics,
climate change and other factors. There is potential for the creation of
synergies with development policies that enhance adaptive capacity.
[14.3.5]
In addition, regions use different strategies to facilitate tech-
nology transfer, low-carbon development, and to make use of
opportunities for leapfrogging (robust evidence, medium agree-
ment). Leapfrogging suggests that developing countries might be able
to follow more sustainable, low-carbon development pathways and
avoid the more emissions-intensive stages of development that were
previously experienced by industrialized nations. Time and absorptive
capacity, i. e., the ability to adopt, manage, and develop new technolo-
gies, have been shown to be a core condition for successful leapfrog-
ging. The appropriateness of different low-carbon pathways depends
on the nature of different technologies and the region, the institutional
architecture and related barriers and incentives, as well as the needs of
different parts of society. [14.3.6, 14.4.3]
In terms of investment and finance, regional participation in
different climate policy instruments varies strongly (high confi-
dence). For example, the Clean Development Mechanism (CDM) has
developed a distinct pattern of regional clustering of projects and buy-
ers of emission credits, with projects mainly concentrated in Asia and
Latin America, while Africa and the Middle East are lagging behind.
The regional distribution of the climate change projects of the Global
Environment Facility (GEF) is much more balanced than that of the
CDM. [14.3.7]
Regional cooperation for mitigation can take place via climate-
specific cooperation mechanisms or existing cooperation mech-
anisms that are (or can be) climate-relevant� Climate-specific
regional initiatives are forms of cooperation at the regional level that
are designed to address mitigation challenges. Climate-relevant initia-
tives were launched with other objectives, but have potential implica-
tions for mitigation at the regional level. [14.4.1]
Our assessment is that regional cooperation has, to date, only
had a limited (positive) impact on mitigation (medium evidence,
high agreement). Nonetheless, regional cooperation could play an
enhanced role in promoting mitigation in the future, particularly if it
explicitly incorporates mitigation objectives in trade, infrastructure,
and energy policies, and promotes direct mitigation action at the
regional level. [14.4.2, 14.5]
Most literature suggests that climate-specific regional coopera-
tion agreements in areas of policy have not played an impor-
tant role in addressing mitigation challenges to date (medium
confidence). This is largely related to the low level of regional inte-
gration and associated willingness to transfer sovereignty to supra-
national regional bodies to enforce binding agreements on mitigation.
[14.4.2, 14.4.3]
Even in areas with deep regional integration, economic mecha-
nisms to promote mitigation (including the European Union (EU)
Emission Trading Scheme (ETS)) have not been as successful as
anticipated in achieving intended mitigation objectives (high
confidence). While the EU-ETS has demonstrated that a cross-border
cap-and-trade system can work, the persistently low carbon price in
recent years has not provided sufficient incentives to motivate addi-
tional mitigation action. The low price is related to a number of fac-
tors, including the unexpected depth and duration of the economic
recession, uncertainty about the long-term emission-reduction targets,
import of credits from the CDM, and the interaction with other policy
instruments, particularly related to the expansion of renewable energy
as well as regulation on energy efficiency. As of the time of this assess-
ment in late 2013, it has proven to be politically difficult to address
this problem by removing emission permits temporarily, tightening the
cap, or providing a long-term mitigation goal. [14.4.2]
Climate-specific regional cooperation using binding regulation-
based approaches in areas of deep integration, such as EU direc-
tives on energy efficiency, renewable energy, and biofuels, have
had some impact on mitigation objectives (medium confidence).

10881088
Regional Development and Cooperation
14
Chapter 14
Nonetheless, theoretical models and past experience suggest that
there is substantial potential to increase the role of climate-specific
regional cooperation agreements and associated instruments, includ-
ing economic instruments and regulatory instruments. In this context,
it is important to consider carbon leakage of such regional initiatives
and ways to address it. [14.4.2, 14.4.1]
In addition, non-climate-related modes of regional coopera-
tion could have significant implications for mitigation, even if
mitigation objectives are not a component (medium confidence).
Regional cooperation with non-climate-related objectives but possible
mitigation implications, such as trade agreements, cooperation on
technology, and cooperation on infrastructure and energy, has to date
also had negligible impacts on mitigation. Modest impacts have been
found on the level of emissions of members of regional preferential
trade areas if these agreements are accompanied with environmental
agreements. Creating synergies between adaptation and mitigation
can increase the cost-effectiveness of climate change actions. Linking
electricity and gas grids at the regional level has also had a modest
impact on mitigation as it facilitated greater use of low-carbon and
renewable technologies; there is substantial further mitigation poten-
tial in such arrangements. [14.4.2]
Despite a plethora of agreements on technology, the impact on
mitigation has been negligible to date (medium confidence). A
primary focus of regional agreements surrounds the research, devel-
opment, and demonstration of low-carbon technologies, as well as
the development of policy frameworks to promote the deployment of
such technologies within different national contexts. In some cases,
geographical regions exhibit similar challenges in mitigating climate
change, which can serve as a unifying force for regional technology
agreements or cooperation on a particular technology. Other regional
agreements may be motivated by a desire to transfer technological
experience across regions. [14.4.3]
Regional development banks play a key role in mitigation
financing (medium confidence). The regional development banks,
the World Bank, the United Nations system, other multilateral institu-
tions, and the reducing emissions from deforestation and degradation
(REDD)+ partnership will be crucial in scaling up national appropriate
climate actions, e. g., via regional and thematic windows in the con-
text of the Copenhagen Green Climate Fund, such as a possible Africa
Green Fund. [14.4.4]
Going forward, regional mechanisms have considerably greater
potential to contribute to mitigation goals than have been real-
ized so far (medium confidence). In particular, these mechanisms have
provided different models of cooperation between countries on mitiga-
tion, they can help realize joint opportunities in the field of trade, infra-
structure, technology, and energy, and they can serve as a platform
for developing, implementing, and financing climate-specific regional
initiatives for mitigation, possibly also as part of global arrangements
on mitigation. [14.5]
14.1 Introduction
14�1�1 Overview of issues
This chapter provides an assessment of knowledge and practice on
regional development and cooperation to achieve climate change
mitigation. It will examine the regional trends and dimensions of the
mitigation challenge. It will also analyze what role regional initiatives,
both with a focus on climate change and in other domains such as
trade, can play in addressing these mitigation challenges.
The regional dimension of mitigation was not explicitly addressed in
the IPCC Fourth Assessment Report (AR4). Its discussion of policies,
instruments, and cooperative agreements (Working Group III AR4,
Chapter 13) was focused primarily on the global and national level.
However, mitigation challenges and opportunities differ significantly
by region. This is particularly the case for the interaction between
development / growth opportunities and mitigation policies, which are
closely linked to resource endowments, the level of economic develop-
ment, patterns of urbanization and industrialization, access to finance
and technology, and — more broadly — the capacity to develop and
implement various mitigation options. There are also modes of regional
cooperation, ranging from regional initiatives focused specifically on
climate change (such as the emissions trading scheme (ETS) of the
European Union (EU)) to other forms of cooperation in the areas of
trade, energy, or infrastructure, that could potentially provide a plat-
form for delivering and implementing mitigation policies. These dimen-
sions will be examined in this chapter.
Specifically, this chapter will address the following questions:
• Why is the regional level important for analyzing and achieving
mitigation objectives?
• What are the trends, challenges, and policy options for mitigation
in different regions?
• To what extent are there promising opportunities, existing exam-
ples, and barriers for leapfrogging in technologies and develop-
ment strategies to low-carbon development paths for different
regions?
• What are the interlinkages between mitigation and adaptation at
the regional level?
• To what extent can regional initiatives and regional integration
and cooperation promote an agenda of low-carbon climate-resil-
ient development? What has been the record of such initiatives,
and what are the barriers? Can they serve as a platform for further
mitigation activities?
The chapter is organized as follows: after discussing the definition
and importance of supra-national regions, sustainable development at
the regional level, and the regional differences in mitigation capaci-
ties, Section 14.2 will provide an overview of opportunities and bar-
riers for low-carbon development. Section 14.3 will examine current

10891089
Regional Development and Cooperation
14
Chapter 14
development patterns and goals and their emission implications at the
regional level. In this context, this section will discuss issues surround-
ing energy and development, urbanization and development, and
consumption and production patterns. Section 14.3 will also examine
opportunities and barriers for low-carbon development by examining
policies and mechanisms for such development-indifferent regions
and sectors. Moreover, it will analyze issues surrounding technology
transfer, investment, and finance. Section 14.4 will evaluate exist-
ing regional arrangements and their impact on mitigation, including
climate-specific as well as climate-relevant regional initiatives. In this
context, links between mitigation, adaptation and development will
be discussed. Also, the experiences of technology transfer and leap-
frogging will be evaluated. Section 14.5 will formulate policy options.
Lastly, Section 14.6 will outline gaps in knowledge and data related to
the issues discussed in this chapter.
The chapter will draw on Chapter 5 on emission trends and drivers,
Chapter 6 on transformation pathways, the sectoral Chapters 7 – 12,
and Chapter 16 on investment and finance, by analyzing the region-
specific information in these chapters. In terms of policy options, it dif-
fers from Chapters13 and15 by explicitly focusing on regions as the
main entities and actors in the policy arena.
We should note from the outset that there are serious gaps in the peer-
reviewed literature on several of the topics covered in this chapter, as
the regional dimension of mitigation has not received enough atten-
tion or the issues covered are too recent to have been properly ana-
lyzed in peer-reviewed literature. We will therefore sometimes draw on
grey literature or state the research gaps.
14�1�2 Why regions matter
This chapter only examines supra-national regions (i. e., regions in
between the national and global level). Sub-national regions are
addressed in Chapter 15. Thinking about mitigation at the regional
level matters mainly for three reasons:
First, regions manifest vastly different patterns in their level, growth,
and composition of GHG emissions, underscoring significant differ-
ences in socio-economic contexts, energy endowments, consump-
tion patterns, development pathways, and other underlying driv-
ers that influence GHG emissions and therefore mitigation options
and pathways (Section 14.3). For example, low-income countries in
sub-Saharan Africa, whose contribution to consumption-based GHG
emissions is currently very low, face the challenge to promote eco-
nomic development (including broader access to modern energy and
transport) while encouraging industrialization. Their mitigation chal-
lenge relates to choosing among development paths with different
mitigation potentials. Due to their tight resource situation and severe
capacity constraints, their ability to choose low-carbon development
paths and their opportunities to wait for more mitigation-friendly
technologies is severely constrained (Collier and Venables, 2012a).
Moreover, these development paths may be costly. Nonetheless, with
sufficient access to finance, technologies, and the appropriate institu-
tional environment, these countries might be able to leapfrog to low-
carbon development paths that would promote their economic devel-
opment and contribute to mitigating climate change in the medium
to long run. Emerging economies, on the other hand, which are fur-
ther along the way of carbon-intensive development, are better able
to adopt various mitigation options, but their gains from leapfrogging
may be relatively smaller. For more rapidly growing economies, the
opportunities to follow different mitigation paths are greater, as they
are able to quickly install new energy production capacities and build
up transport and urban infrastructure. However, once decisions have
been made, lock-in effects will make it costly for them to readjust
paths. In industrialized countries, the opportunities to leapfrog are
small and the main challenge will be to drastically re-orient existing
development paths and technologies towards lower-carbon intensity
of production and consumption. We call this the ‘regional heteroge-
neity’ issue.
Second, regional cooperation is a powerful force in global econom-
ics and politics — as manifest in numerous agreements related to
trade, technology cooperation, trans-boundary agreements relating
to water, energy, transport, and so on. From loose free-trade areas in
many developing countries to deep integration involving monetary
union in the EU, regional integration has built up platforms of coop-
eration among countries that could become the central institutional
forces to undertake regionally coordinated mitigation activities. Some
regions, most notably the EU, already cooperate on mitigation, using a
carbon-trading scheme and binding regulations on emissions. Others
have focused on trade integration, which might have repercussions on
the mitigation challenge. It is critical to examine to what extent these
forms of cooperation have already had an impact on mitigation and to
what extent they could play a role in achieving mitigation objectives
(Section 14.3). We call this the ‘regional cooperation and integration
issue’.
Third, efforts at the regional level complement local, domestic efforts
on the one hand and global efforts on the other hand. They offer the
potential of achieving critical mass in the size of markets required
to make policies, for example, on border tax adjustment, in exploit-
ing opportunities in the energy sector or infrastructure, or in creating
regional smart grids required to distribute and balance renewable
energy.
Given the policy focus of this chapter and the need to distinguish
regions by their levels of economic development, this chapter adopts
regional definitions that are based on a combination of economic and
geographic considerations. In particular, the chapter considers the fol-
lowing 10 regions: East Asia (China, Korea, Mongolia) (EAS); Econo-
mies in Transition (Eastern Europe and former Soviet Union) (EIT); Latin
America and Caribbean (LAM); Middle East and North Africa (MNA);
North America (USA, Canada) (NAM); Pacific Organisation for Eco-
nomic Co-operation and Development (OECD)-1990 members (Japan,

10901090
Regional Development and Cooperation
14
Chapter 14
Australia, New Zealand) (POECD); South East Asia and Pacific (PAS);
South Asia (SAS); sub-Saharan Africa (SSA); Western Europe (WEU).
These regions can, with very minor deviations, readily be aggregated
to regions used in scenarios and integrated models. They are also con-
sistent with commonly used World Bank regional classifications, and
can be aggregated into the geographic regions used by WGII. However,
if dictated by the reviewed literature, in some cases other regional
classifications are used. Regional cooperation initiatives define regions
by membership of these ventures. The least-developed countries (LDC)
region is orthogonal to the above regional definitions and includes
countries from SSA, SAS, PAS, and LAM.
14�1�3 Sustainable development and mitigation
capacity at the regional level
Sustainable development refers to the aspirations of regions to attain
a high level of well-being without compromising the opportunities of
future generations. Climate change relates to sustainable development
because there might be tradeoffs between development aspirations
and mitigation. Moreover, limited economic resources, low levels of
technology, poor information and skills, poor infrastructure, unstable
or weak institutions, and inequitable empowerment and access to
resources compromise the capacity to mitigate climate change. They
will also pose greater challenges to adapt to climate change and lead
to higher vulnerability (IPCC, 2001).
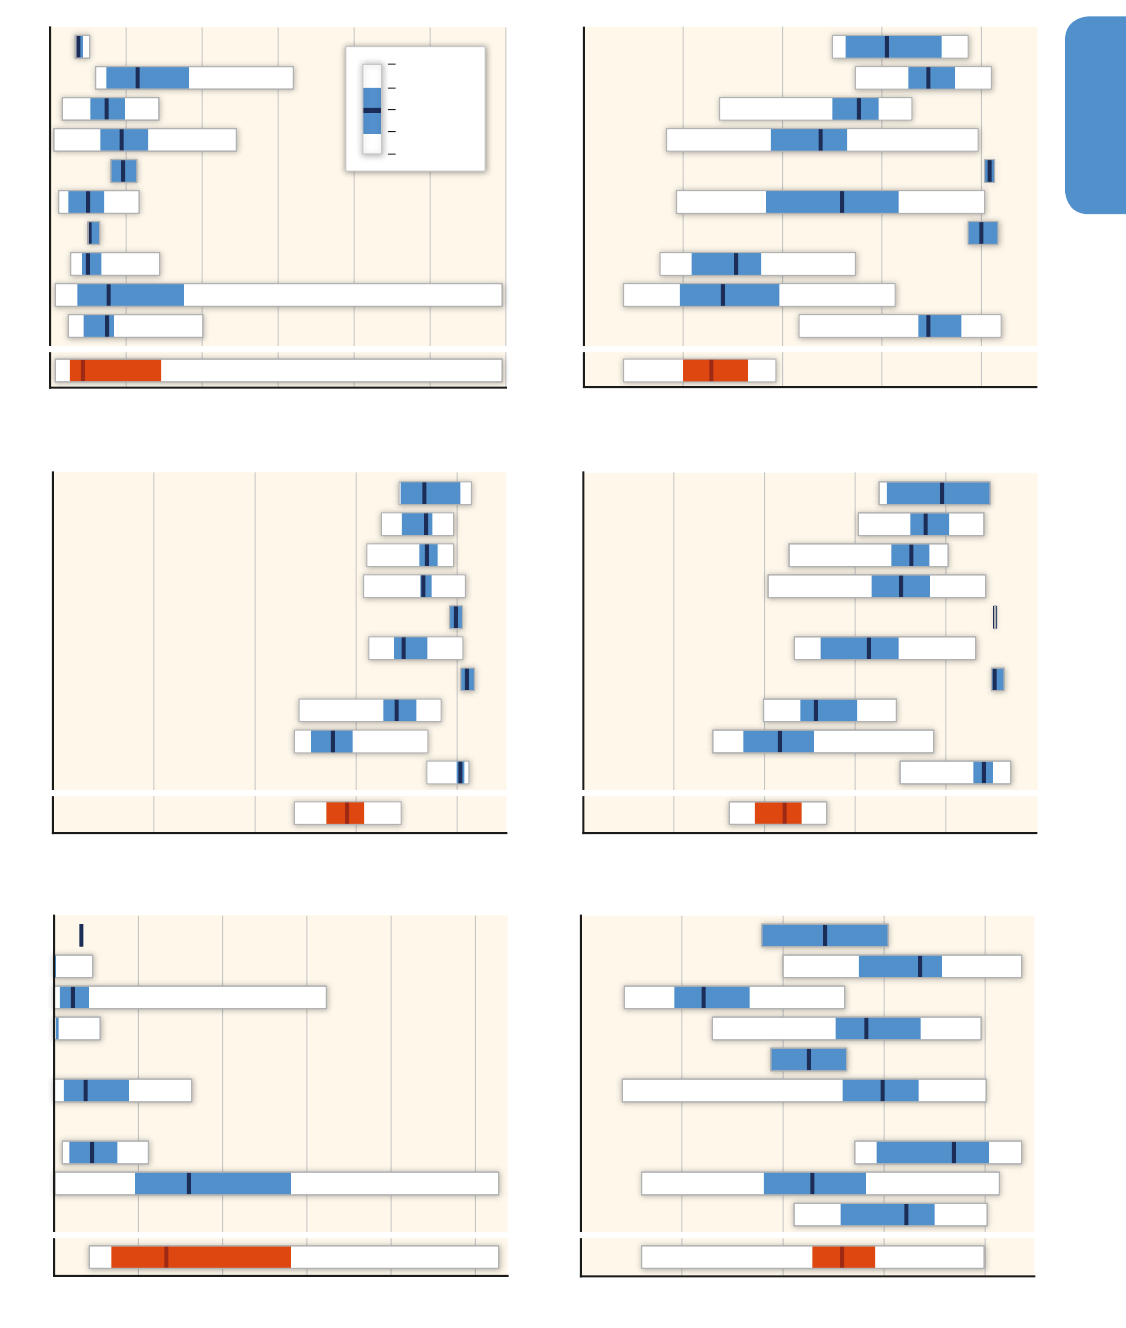
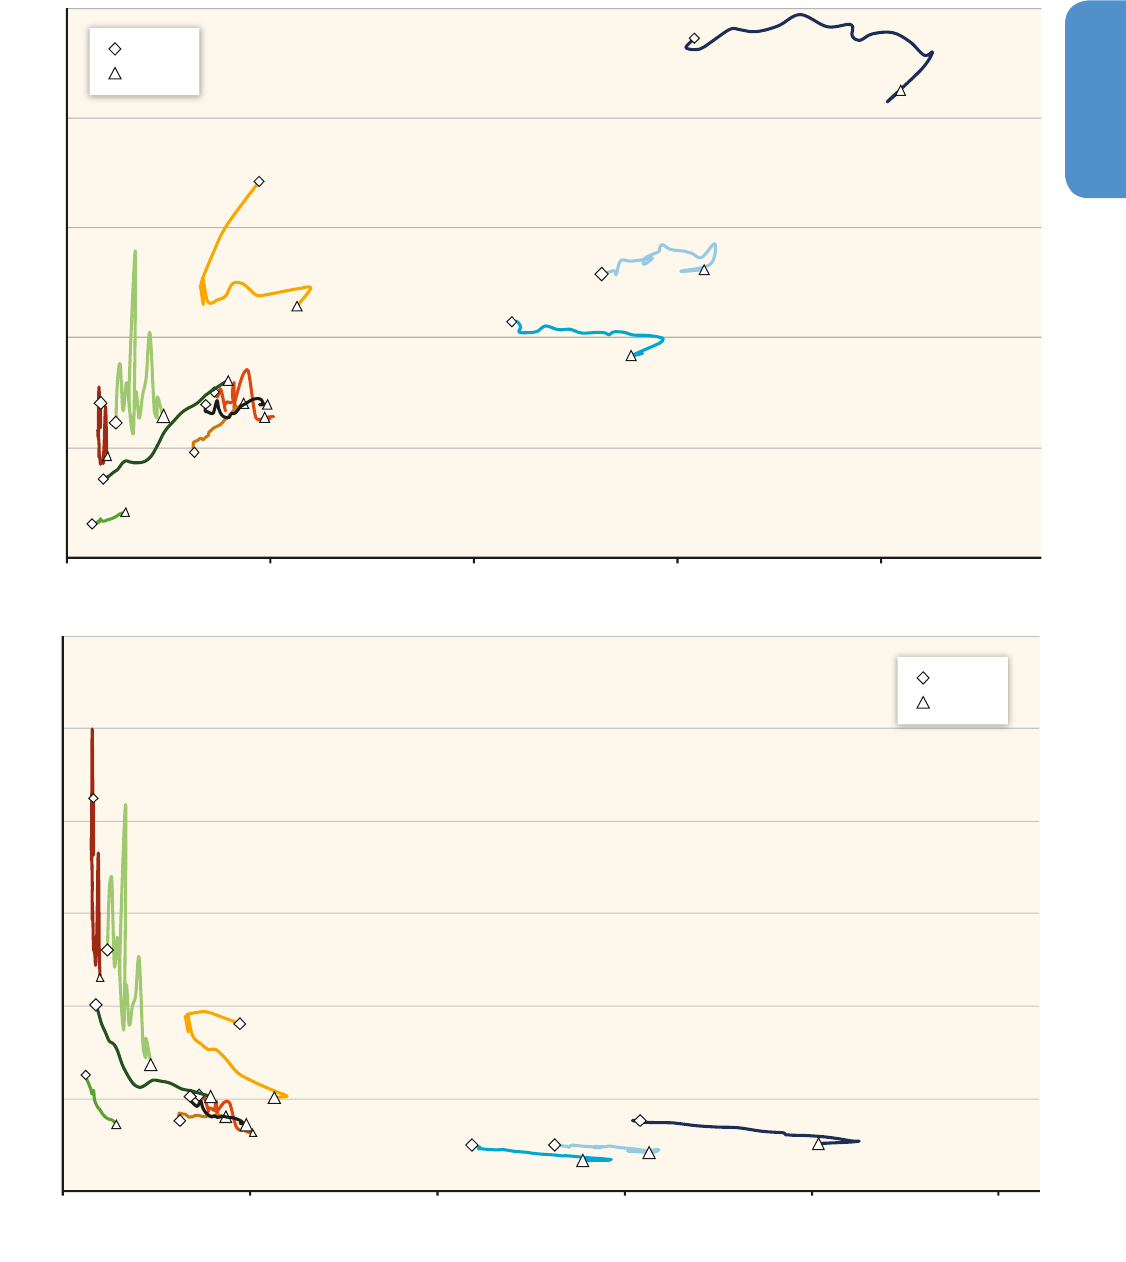
Figure 14.1 shows that regions differ greatly in development outcomes
such as education, human development, unemployment, and poverty.
In particular, those regions with the lowest level of per capita emis-
sions also tend to have the worst human development outcomes.
Generally, levels of adult education (Figure 14.1b), life expectancy
(Figure 14.1c), poverty, and the Human Development Index (Figure
14.1d) are particularly low in SSA, and also in LDCs in general. Unem-
ployment (Figure 14.1a) is high in SSA, MNA, and EIT, also in LDCs,
making employment-intensive economic growth a high priority there
(Fankhauser etal., 2008).
The regions with the poorest average development indicators also
tend to have the largest disparities in human development dimensions
(Grimm etal., 2008; Harttgen and Klasen, 2011). In terms of income,
LAM faces particularly high levels of inequality (Figure 14.1f). Gen-
der gaps in education, health, and employment are particularly large
in SAS and MNA, with large educational gender gaps also persisting
in SSA. Such inequalities will raise distributional questions regarding
costs and benefits of mitigation policies.
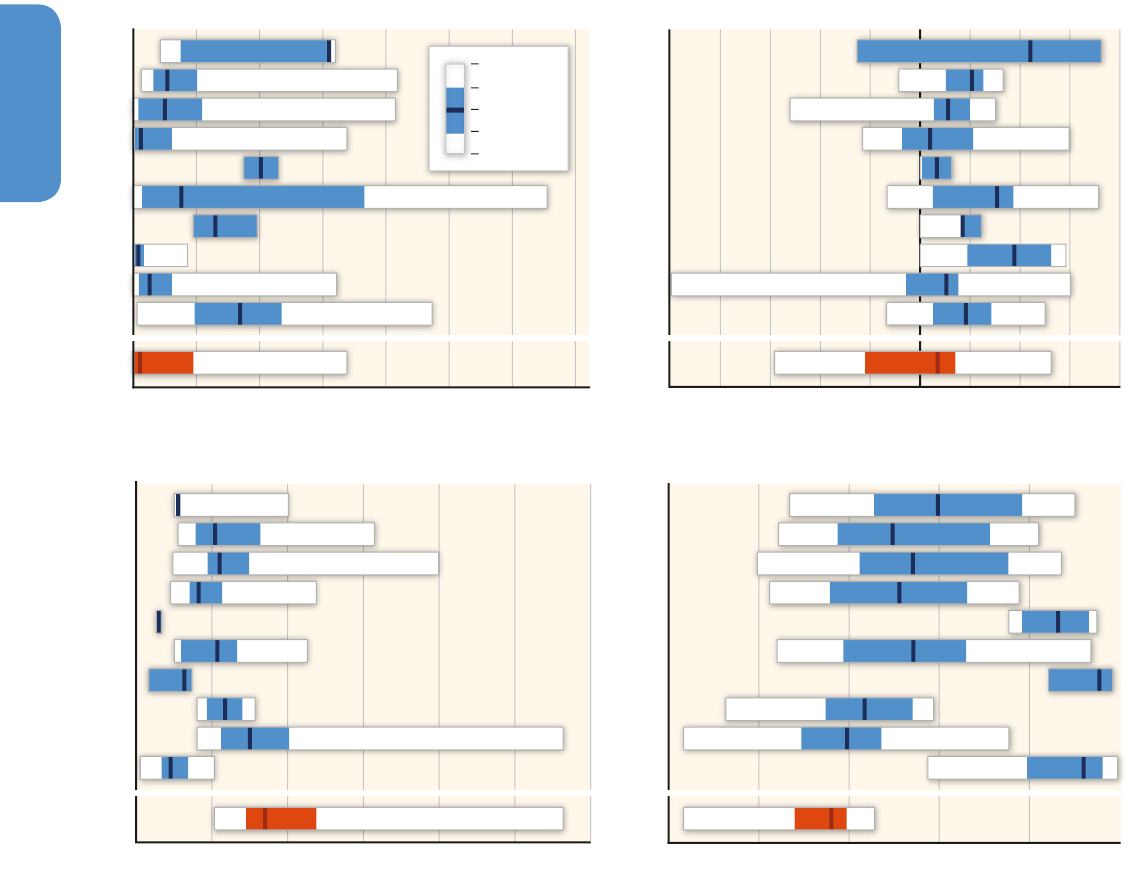
When thinking about inter-generational inequality (Figure 14.2b),
adjusted net savings (i. e., gross domestic savings minus deprecia-
tion of physical and natural assets plus investments in education and
minus damage associated with CO
2
emissions) is one way to measure
whether societies transfer enough resources to next generations. As
shown in Figure 14.2b, there is great variation in these savings rates.
In several regions, including SSA, MNA, LAM, as well as LDCs, there
are a number of countries where adjusted net savings are negative.
Matters would look even worse if one considered that — due to sub-
stantial population growth — future generations are larger in some
regions, considered a broader range of assets in the calculation of
depreciation, or considered that only imperfect substitution is possible
between financial savings and the loss of some natural assets. For
these countries, maintenance of their (often low) living standards is
already under threat. Damage from climate change might pose further
challenges and thereby limit the ability to engage in costly mitigation
activities.
14�1�3�1 The ability to adopt new technologies
Developing and adopting low-carbon technologies might be one way
to address the mitigation challenge. However, the capacity to adopt
new technologies, often referred to as absorptive capacity, as well as
to develop new technologies, is mainly located in four regions: NAM,
EAS, WEU, and POECD. This is also shown in Figure 14.2a, which plots
high-technology exports as share of total manufactured exports. High-
technology exports refer to products with high research and devel-
opment intensity, such as in aerospace, computers, pharmaceuticals,
scientific instruments, and electrical machinery. As visible in the fig-
ure, these exports are very low in most other regions, suggesting low
capacity to develop and competitively market new technologies. Since
most technological innovation happens in developed regions, techno-
logical spillovers could significantly increase the mitigation potential in
developing regions.
While Section 13.9 discusses inter-regional technology transfer
mechanisms, which could help foster this process, there is an emerg-
ing literature that looks at the determinants and precursors of suc-
cessful technology absorption. Some studies have found that for
energy technologies, the more technologically developed a country
is, the more likely it is to be able to receive innovations (Verdolini
and Galeotti, 2011; Dechezleprêtre et al., 2013). However, more
recent work looking at a wider range of mitigation technologies finds
that domestic technological development tends to crowd out foreign
innovations (Dechezleprêtre etal., 2013). But the determinants of the
receptivity of a host country or region go beyond the technological
development of the receiving countries. Some of these aspects are
relatively harder (or impossible) to influence with policy interven-
tions such as the geographical distance from innovating countries
(Verdolini and Galeotti, 2011) and linkages with countries with CO
2
-
efficient economies (Perkins and Neumayer, 2009). However, other
aspects can be influenced such as institutional capacity (Perkins and
Neumayer, 2012), and in particular the strength of intellectual prop-
erty laws to protect incoming technologies (Dechezleprêtre et al.,
2013).
Two further challenges for promoting mitigation in different regions are
the costs of capital, which circumscribe the ability to invest in new low-
10911091
Regional Development and Cooperation
14
Chapter 14
Figure 14�1 | Social provisions enabling regional capacities to embrace mitigation policies. Statistics refer to the year 2010 or the most recent year available. The red bar refers to
Least Developed Countries (LDC). Source: UNDP (2010), World Bank (2011).
Poverty Gap at USD1.25 a Day (PPP) [%] Income Share by Lowest 10%
Life Expectancy at Birth, Total [yr] Human Development Index (HDI)
0 3 6 9 12
Mean Years of Adults Schooling [yr]Unemployment [% of Total Labor Force]
0 20 40 60 80
0 10 20 30 40 50 60
0.0 0.2 0.4 0.6 0.8 1.0
0 10 20 30 40 50
0 1 2 3 4
Min
75
th
Percentile
Max
Median
25
th
Percentile
EIT
LAMLAM
EASEAS
SSASSA
MNAMNA
SASSAS
EIT
NAMNAM
WEUWEU
PASPAS
LDCLDC
LAMLAM
EASEAS
SSASSA
MNAMNA
SASSAS
EITEIT
NAMNAM
WEUWEU
POECDPOECD
PASPAS
LDCLDC
LAMLAM
EASEAS
SSASSA
MNAMNA
SASSAS
EITEIT
NAMNAM
WEUWEU
POECDPOECD
PASPAS
LDCLDC
POECDPOECD
e) f)
c) d)
a) b)
10921092
Regional Development and Cooperation
14
Chapter 14
carbon technologies, and differences in governance. Figure 14.2 pres-
ents the lending interest rate (Figure 14.2c) to firms by region as well as
the World Bank Governance index (Figure 14.2d). It shows that poorer
regions face higher interest rates and struggle more with governance
issues, both reducing the ability to effectively invest in a low-carbon
development strategy.
Conversely, there are different regional opportunities to promote miti-
gation activities. As discussed by Collier and Venables (2012a), Africa
has substantial advantages in the development of solar energy and
hydropower. However, as these investments are costly in human and
financial capital and depend on effective states and policies, these
advantages may not be realized unless the financing and governance
challenges discussed above are addressed.
In sum, differences in the level of economic development among
countries and regions affect their level of vulnerability to climate
change as well as their ability to adapt or mitigate (Beg etal., 2002).
Given these regional differences, the structure of multi-national or
multi-regional environmental agreements affects their chance of suc-
cess (Karp and Zhao, 2010). By taking these differences into account,
regional cooperation on climate change can help to foster mitigation
Figure 14�2 | Economic and governance indicators affecting regional capacities to embrace mitigation policies. Statistics refer to the year 2010 or the most recent year available.
The red bar refers to Least Developed Countries (LDC). Source: UNDP (2010), World Bank (2011). Note: The lending interest rate refers to the average interest rate charged by banks
to private sector clients for short- to medium-term financing needs. The governance index is a composite measure of governance indicators compiled from various sources, rescaled
to a scale of 0 to 1, with 0 representing weakest governance and 1 representing strongest governance.
0,0 0,2 0,4 0,6 0,8 1,0
Adjusted Net Savings, Including Particulate Emission Damage [% of GNI]High-Technology Exports [% of Manufactured Exports]
Lending Interest Rate [%] Governance index [0: Weak, 1: Strong]
0 10 20 30 40 50 60 70
0 10 20 30 40 50 60
-50 -40 -30 -20 -10 0 10 20 30 40
LAM
EAS
SSA
MNA
SAS
EIT
NAM
WEU
POECD
PAS
LDC
LAM
NAM
EAS
WEU
POECD
SSA
MNA
SAS
EIT
PAS
LDC
LAM
EAS
SSA
MNA
SAS
EIT
NAM
WEU
POECD
PAS
LDC
LAM
NAM
EAS
WEU
POECD
SSA
MNA
SAS
EIT
PAS
LDC
Min
75
th
Percentile
Max
Median
25
th
Percentile
c) d)
a) b)

10931093
Regional Development and Cooperation
14
Chapter 14
that considers distributional aspects, and can help addressing climate-
change impacts (Asheim etal., 2006). At the same time, disparities
between and within regions diminish the opportunities that countries
have to undertake effective mitigation policies (Victor, 2006).
14.2 Low-carbon development
at the regional level:
opportunities and barriers
There are great differences in the mitigation potential of regions. One
way to assess these heterogeneities is through integrated models on
the regional distribution of costs of mitigation pathways as well as
regional modelling exercises that compare integrated model results
for particular regions. The region-specific results are discussed in detail
in Chapter 6 using a higher level of regional aggregation than adopted
here (Section 6.3.6.4). They show that in an idealized scenario with a
universal carbon price, where mitigation costs are distributed in the
most cost-effective manner across regions, the macroeconomic costs
of mitigation differ considerably by region. In particular, in OECD
countries (including the regions WEU, NAM, and POECD), these costs
would be substantially lower, in LAM they would be average, and in
other regions they would be higher (Clarke etal., 2009; Tavoni etal.,
2014). These differences are largely due to the following: First, energy
and carbon intensities are higher in non-OECD regions, leading to
more opportunities for mitigation, but also to higher macroeconomic
costs. Second, some developing regions face particularly attractive
mitigation options (e. g., hydropower or afforestation) that would
shift mitigation there. Third, some developing regions, and in particu-
lar countries exporting fossil energy (which are concentrated in MNA,
but include countries in other regions as well), would suffer nega-
tive terms of trade effects as a result of aggressive global mitigation
policies, thus increasing the macroeconomic impact of mitigation (see
also Section14.4.2). The distribution of these costs could be adjusted
through transfer payments and other burden sharing regimes. The dis-
tribution of costs would shift towards OECD countries, if there was
limited participation among developing and emerging economies (de
Cian etal., 2013).
One should point out, however, that these integrated model results
gloss over many of the issues highlighted in this chapter, including
the regional differences in financial, technological, institutional, and
human resource capacities that will make the implementation of such
scenarios very difficult.
As many of the region-specific opportunities and barriers for low-
carbon development are sector-specific, we will discuss them in the
relevant sectoral sub-sections in Section 14.2.
14.3 Development trends and
their emission implications
at the regional level
14�3�1 Overview of trends in GHG emissions
and their drivers by region
Global GHG emissions have increased rapidly over the last two decades
(Le Quéré etal., 2009, 2012). Despite the international financial and
economic crisis, global GHG emissions grew faster between 2000 and
2010 than in the previous three decades (Peters etal., 2012b). Emis-
sions tracked at the upper end of baseline projections (see Sections 1.3
and 6.3) and reached around 49 – 50 GtCO
2
eq in 2010 (JRC / PBL, 2013;
IEA, 2012a; Peters etal., 2013). In 1990, EIT was the world’s highest
emitter of GHG emissions at 19 % of global total of 37 GtCO
2
eq, fol-
lowed by NAM at 18 %, WEU at 12 %, and EAS at 12 %, with the rest
of the world emitting less than 40 %. By 2010, the distribution had
changed remarkably. The EAS became the major emitter with 24 %
of the global total of 48 GtCO
2
eq (excluding international transport)
(JRC / PBL, 2013; IEA, 2012a). The rapid increase in emissions in devel-
oping Asia was due to the region’s dramatic economic growth and its
high population level.
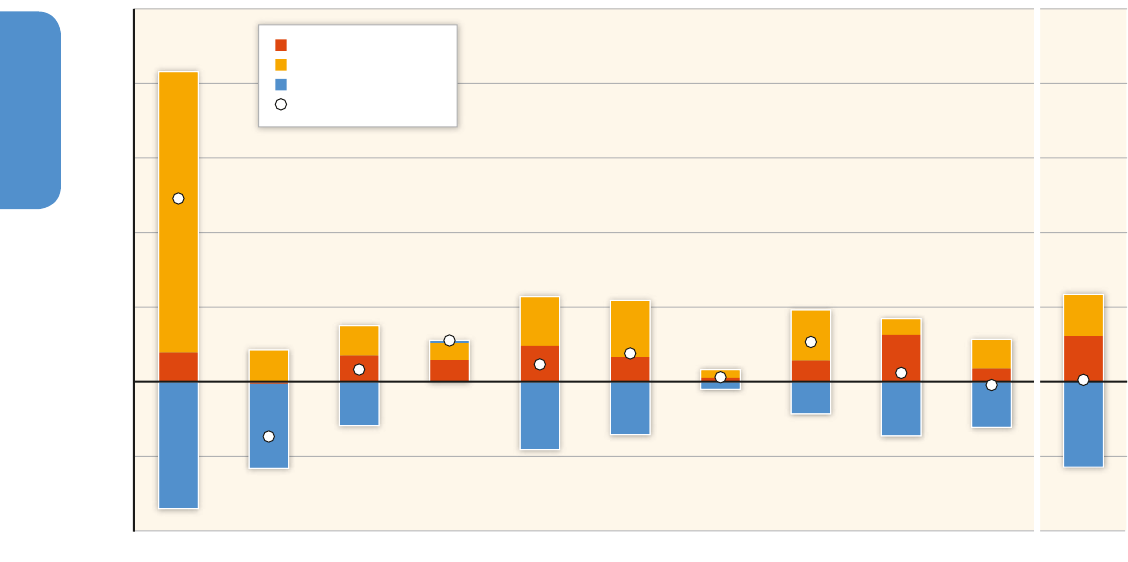
Figure 14.3 shows the change in GHG emissions in the 10 regions
(and additionally reporting for LDC including countries from several
regions) over the period from 1990 to 2010, broken down along
three drivers: Emissions intensity (emissions per unit of gross domes-
tic product (GDP)), GDP per capita, and population. As shown in the
figure, the most influential driving force for the emission growth
has been the increase of per capita income. Population growth also
affected the emission growth but decreases of GHG emission intensi-
ties per GDP contributed to lowering the growth rate of GHG emis-
sions. These tendencies are similar across regions, but with notable
differences. First, the magnitude of economic growth differed greatly
by region with EAS showing by far the highest growth in GDP per cap-
ita, leading to the highest growth in emissions in the past 20 years;
stagnating incomes in POECD contributed to low growth in emissions.
Second, falling population levels in EIT contributed to lower emissions
there. Third, improvements in the emission intensity were quantita-
tively larger than the increases in emissions due to income growth
in all richer regions (WEU, POECD, NAM, and EIT), while the picture
is more mixed in developing and emerging regions. Note also that
in LDCs emissions were basically flat with improvements in emission
intensity making up for increases in GDP and population.
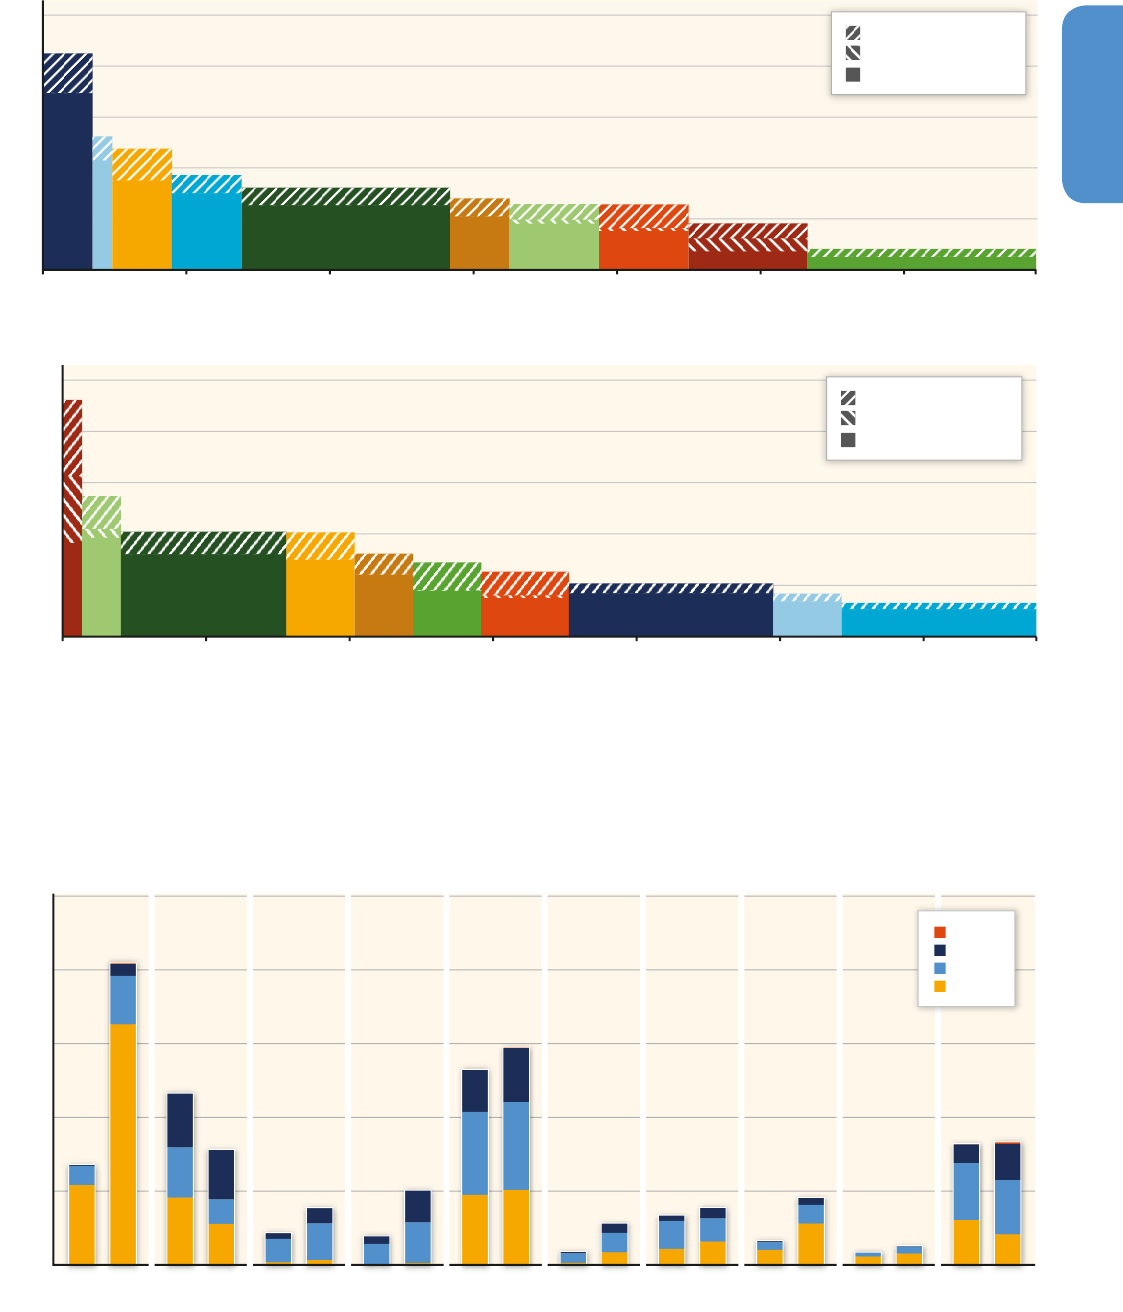
Other ways to look at heterogeneity of regional GHG emissions are
relative to the size of the total population, the size of the overall
economy and in terms of sources of these emissions. These perspec-
tives are shown in the two panels of Figure 14.4. In 2010, NAM, EIT,
POECD, and WEU, taken together, had 20 % of the world’s population,
but accounted for 39 % of global GHG emissions, while other regions
10941094
Regional Development and Cooperation
14
Chapter 14
with 80 % of population accounted for 61 % of global emissions (Fig-
ure 14.4). The contrast between the region with the highest per cap-
ita GHG emissions (NAM) and the lowest (SAS) is more pronounced:
5.0 % of the world’s population (NAM) emits 15 %, while 23 % (SAS)
emits 6.8 %. One of the important observations from Figure 14.4 (top
panel) is that some regions such as SSA and PAS have the lowest lev-
els of per capita emissions of CO
2
from non-forestry sources, but they
have GHG emissions per capita that are comparable to other regions
due to large emissions from land-use change and other non-CO
2
GHG
emissions.
The cumulative distribution of emissions per GDP (emission intensity)
shows a strikingly different picture (Figure 14.4 bottom panel). The
four regions with highest per capita emissions, NAM, EIT, POECD, and
WEU, have the lowest GHG emission intensities (emission per GDP),
except EIT. Some regions with low per capita emissions, such as SSA
and PAS, have high emission intensities and also highest share of
forestry-related emissions. This shows that a significant part of GHG-
reduction potential might exist in the forest sector in these developing
regions (see Chapter 11).
14�3�2 Energy and development
14�3�2�1 Energy as a driver of regional emissions
Final energy consumption is growing rapidly in many developing coun-
tries. Consequently, energy-related CO
2
emissions in developing coun-
try regions such as EAS, MNA, and PAS in 2010 were more than double
the level of 1990, while the CO
2
emission in EIT decreased by around
30 % (Figure 14.5). The composition of energy consumption also varies
by region. Oil dominates the final energy consumption in many regions
such as NAM, POECD, WEU, LAM, and MNA, while coal has the highest
share in EAS. The share of electricity in final energy consumption has
tended to grow in all regions.
When looking at trends in CO
2
emissions by source (see Figure 14.5),
the largest growth in total CO
2
emissions between 1990 and 2010 has
come from coal, followed by gas and oil. In this period, CO
2
emissions
from coal grew by 4.4 GtCO
2
in EAS, which is equivalent to roughly half
of the global net increase of CO
2
emissions from fossil fuel combustion.
These observations are in line with findings in the literature emphasiz-
ing the transformation of energy use patterns over the course of eco-
Figure 14�3 | Decomposition of drivers for changes in total annual GHG emissions (excluding international transport) in different world regions from 1990 – 2010 (Logarithmic
Mean Divisia Index (LMDI) method according to Ang, 2004). The white dots indicate net changes of GHG emissions from 1990 to 2010, and the bars, which are divided by three
colours, show the impacts on GHG emission changes resulting from changes in population, GDP per capita, and GHG emission per GDP. For example, the white dot for EAS shows
its emission increased by 7.4 Gt CO
2
eq, and the influence of the three driving factors are 1.2, 11, and – 5.1 GtCO
2
eq, which are indicated by red, yellow, and blue bars, respectively.
Data sources: GHG emission data (in CO
2
eq using 100-year GWP values) from JRC / PBL (2013) and IEA (2012a), see AnnexII.9; GDP (PPP) [Int$2005] from World Bank (2013a);
and population data from United Nations (2013).
0
3
6
9
12
15
-6
-3
EAS EIT LAM MNA NAM PAS POECD SAS SSA WEU LDC
Population
GDP (PPP) / Population
GHG Emissions / GDP (PPP)
Net GHG Emissions
Change in Annual GHG Emission from 1990-2010 [GtCO
2
eq/yr]
10951095
Regional Development and Cooperation
14
Chapter 14
Figure 14�5 | CO
2
emissions by sources and regions. Data source: IEA (2012a).
EAS EIT LAM MNA NAM PAS POECD SAS SSA WEU
1990 2010 1990 2010 1990 20101990 20101990 2010 1990 2010 1990 2010 1990 20101990 20101990 2010
CO
2
Emissions [GtCO
2
/yr]
0
2
4
6
8
10
Coal/Peat
Oil
Gas
Other
Figure 14�4 | Distribution of regional GHG emissions (excluding international transport) in relation to population and GDP: cumulative distribution of GHG emissions per capita
(top panel) and GDP (bottom panel). The percentages in the bars indicate a region’s share in global GHG emissions. Data sources: GHG emission data (in CO
2
eq using 100-year
GWP values) from JRC / PBL (2013) and IEA (2012a), see AnnexII.9; GDP (PPP) [Int$2005] from World Bank (2013a); and population data from United Nations (2013).
6916600050004000300020001000
0
5
10
15
20
Cumulative Population [Million]
GHG Emissions per Capita [(tCO
2
eq/cap)/yr]
25
NAM: 15.2%
POECD: 4.2%
EIT: 10.0%
WEU: 9.30%
EAS: 24.5%
MNA: 6.2%
PAS: 8.1% LAM: 7.9%
SSA: 7.8%
SAS: 6.8%
2010
CO
2
(Excluding Forest Fire)
CO
2
from Forest Fire
CH
4
, N
2
O, HFCs, PFCs, SF
6
67,85060,00050,00040,00030,00020,000
10,000
GHG Emissions per GDP (PPP) [(kgCO
2
eq/Int$
2005
)/yr]
Cumulative GDP (PPP) [Billion Int$
2005
]
0
0.5
1.0
1.5
2.0
2.5
2010
SSA: 7.8%
PAS: 8.1%
EAS: 24.5%
EIT 10.0%
MNA: 6.2%
SAS: 6.8%
LAM: 7.9%
NAM: 15.2%
POECD: 4.2%
WEU: 9.3%
CO
2
(Excluding Forest Fire)
CO
2
from Forest Fire
CH
4
, N
2
O, HFCs, PFCs, SF
6

10961096
Regional Development and Cooperation
14
Chapter 14
nomic development from traditional biomass to coal and liquid fuel
and finally natural gas and nuclear energy (Smil, 2000; Marcotullio and
Schulz, 2007; Krausmann etal., 2008). Similar transitions in energy use
are also observed for the primary energy carriers employed for electric-
ity production (Burke, 2010) and in household energy use (Leach, 1992;
Barnes and Floor, 1996).
Due to its role in global emissions growth since 1990, it is worthwhile
to look a little deeper into the underlying drivers for emissions in
EAS, which have been increased by nearly 8GtCO
2
eq between 1990
and 2010. The major part of the increase has been witnessed in the
years after 2002 (Minx etal., 2011). Efficiency gains and technological
progress particularly in energy-intensive sectors that had a decreas-
ing effect on emissions (Ma and Stern, 2008; Guan etal., 2009; Zhao
etal., 2010) were overcompensated by increasing effects of structural
changes of the Chinese economy after 2002 (Liao etal., 2007; Ma and
Stern, 2008; Guan etal., 2009; Zhao etal., 2010; Minx etal., 2011;
Liu etal., 2012a). Looking at changes from 2002 to 2005, Guan etal.
(2009) find manufacturing, particularly for exports (50 %) as well as
capital formation (35 %) to be the most important drivers from the
demand side. Along with an increasing energy intensity of GDP, Steckel
etal. (2011) identify a rising carbon intensity of energy, particularly
driven by an increased use of coal to have contributed to rapid increase
in emissions in the 2000s.
Figure 14.6 shows the relationship between GHG emissions and per
capita income levels. Individual regions have different starting levels,
directions, and magnitudes of changes. Developed regions (NAM, WEU,
POECD) appear to have grown with stable per capita emissions in the
last two decades, with NAM having much higher levels of per capita
emissions throughout (Figure 14.6 top panel). Carbon intensities of
GDP tended to decrease constantly for most regions as well as for the
globe (Figure 14.6 bottom panel).
Despite rising incomes and rising energy use, lack of access to modern
energy services remains a major constraint to economic development
in many regions (Uddin etal., 2006; Johnson and Lambe, 2009; IEA,
2013). The energy access situation is acute in LDCs (Chaurey etal.,
2012) but likely to improve there and in other parts of the world in
coming decades (Bazilian etal., 2012a). Of the world’s ‘energy poor’
1
,
95 % live in Asia and SSA (Rehman etal., 2012).
About 1.2 – 1.5 billion people — about 20 % of the global popula-
tion — lacked access to electricity in 2010 (IEA, 2010a, 2012b; World
Bank, 2012; Pachauri etal., 2012, 2013; Sovacool etal., 2012; Sustain-
able Energy for All, 2013) and nearly 2.5 – 3.0 billion — about 40 % of
the global population — lack access to modern cooking energy options
(Zerriffi, 2011; IEA, 2012b; Pachauri etal., 2012; Sovacool etal., 2012;
1
‘Energy poor’ population is defined as population without electricity access and / or
without access to modern cooking technologies (Rehman et al., 2012).
Rehman etal., 2012; Sustainable Energy for All, 2013). There is con-
siderable regional variation as shown in Table 14.1, with electricity
access being particularly low in SSA, followed by SAS.
The lack of access to electricity is much more severe in rural areas
of LDCs (85 %) and SSA (79 %) (IEA, 2010b; Kaygusuz, 2012). In
developing countries, 41 % of the rural population does not have
electricity access, compared to 10 % of the urban population (UNDP,
2009). This low access to electricity is compounded by the fact that
people rely on highly polluting and unhealthy traditional solid fuels
for household cooking and heating, which results in indoor air pollu-
tion and up to 3.5million premature deaths in 2010 — mostly women
and children; another half-million premature deaths are attributed to
household cooking fuel’s contribution to outdoor air pollution (Sath-
aye etal., 2011; Agbemabiese etal., 2012) (Lim etal., 2012); see Sec-
tion 9.7.3.1 and WGII Section 11.9.1.3). Issues that hinder access to
energy include effective institutions (Sovacool, 2012b), good business
models (e. g., ownership of energy service delivery organizations and
finance; Zerriffi, 2011), transparent governance (e. g., institutional
diversity; Sovacool, 2012a) and appropriate legal and regulatory
frameworks (Bazilian et al., 2012b; Sovacool, 2013). Despite these
factors, universal access to energy services by 2030 is taking shape
(Hailu, 2012).
Table 14�1 | Access to electricity in 2009
Population with
Access
(%)
Population Lacking
Access
(millions)
Latin America and Caribbean 93.4 30
North America 100.0 0
East Asia 97.8 29
Western Europe 100.0 0
POECD 100.0 0
Sub-Saharan Africa 32.4 487
Middle East and North Africa 93.7 23
South Asia 62.2 607
Economies in Transition 100.0 0
South East Asia and Pacific 74.3 149
Total 79�5 1330
Note: Information missing for several small islands, Mexico, Puerto Rico, Suriname, Hong
Kong SAR (China), North Korea, Macao SAR (China), Burundi, Cape Verde, Central Afri-
can Republic, Chad, Equatorial Guinea, Gambia, Guinea, Guinea-Bissau, Liberia, Mali,
Mauritania, Niger, Rwanda, Sierra Leone, Somalia, South Sudan, Swaziland, Djibouti,
Malta, Turkey, West Bank and Gaza, Bhutan. For OECD and EIT, no data are listed but
presumed to be 100 % access; these are recorded in italics. Source: World Bank (2012).
10971097
Regional Development and Cooperation
14
Chapter 14
Figure 14�6 | Relationship between GHG emissions per capita and GDP per capita (top panel), and GHG emissions per GDP and GDP and per capita (bottom panel) (1990 – 2010).
Data sources: GHG emission data (in CO
2
eq using 100-year GWP values) from JRC / PBL (2013) and IEA (2012a), see AnnexII.9; GDP (PPP) from World Bank (2013a); and popula-
tion data from United Nations (2013).
GDP (PPP) per Capita [Int$
2005
/cap]
40,00030,00020,0000 10,000
0
5
10
15
20
25
NAM
LAM
PAS
SSA
GHG Emissions per Capita [tCO
2
eq/cap]
POECD
WEU
EIT
SAS
EAS
MNA
World
1990
2010
1990
2010
0
50,00040,00030,00020,0000 10,000
1
2
3
4
5
6
NAM
POECD
WEU
EIT
SAS
LAM
EAS
MNA
PAS
SSA
World
GDP (PPP) per Capita [(Int$
2005
/cap)/yr]
GHG Emissions per GDP (PPP) [(kgCO
2
eq/Int$
2005
)/yr]

10981098
Regional Development and Cooperation
14
Chapter 14
14�3�2�2 Opportunities and barriers at the regional level
for low-carbon development in the energy
sector
The regional differences in opportunities and challenges for low-
carbon development in the energy sector described above arise due
to patters of energy production and use, the local costs and capital
investment needs of particular energy technologies, as well as their
implications for regulatory capacity (Collier and Venables, 2012b).The
choice of present and future energy technologies depends on the local
costs of technologies. Local prices indicate the opportunity cost of dif-
ferent inputs. While in some regions diverting resources from other
productive uses to climate change mitigation has a high opportunity
cost, in others the cost is lower.
Local costs mainly depend on two factors. First, they depend on the
natural advantage of the region. An abundant endowment will tend to
reduce the local price of resources to the extent that they are not freely
traded internationally. Trade restrictions may be due to high transport
costs or variability of the resource price, which reduces the return to
exports and thereby the opportunity cost of using the resource domesti-
cally.
Second, local costs depend on the capital endowment of the region.
Capital includes the accumulated stocks of physical capital and the
financial capital needed to fund investment, the levels of human capi-
tal and skills, and the institutional and governance capacity required to
implement and regulate economic activity. As shown in Section14.1.3,
developing regions are, to varying degrees, scarce in all of these types
of capital. Borrowing costs for developing countries are high, educa-
tion and skill levels are a serious constraint, and lack of government
regulatory capacity creates barriers (a high shadow price) on running
large-scale or network investments.
A number of features of energy production interact with local costs
and thereby determine the extent of uptake of particular technolo-
gies in different regions. In general, the high capital intensity of many
renewable technologies (IEA, 2010c) makes them relatively more
expensive in many capital and skill-scarce developing economies
(Strietska-Ilina, 2011). Different energy generation technologies also
use different feedstock, the price of which depends upon their local
availability and tradability; for example, coal-based electricity genera-
tion is relatively cheap in countries with large coal resources (Hepton-
stall, 2007).
Many power generation technologies, in particular nuclear and coal,
but also large hydropower, create heavy demands on regulatory
capacity because they have significant-scale economies and are long-
lived projects. This has several implications. The first is that projects
of this scale may be natural monopolies, and so need to be under-
taken directly by the state or by private utilities that are regulated.
Large-scale electricity systems have been ineffective in regions that
are scarce in regulatory capacity, resulting in under-investment, lack
of maintenance, and severe and persistent power shortages (Eberhard
etal., 2011). The second implication of scale is that a grid has to be
installed and maintained. As well as creating a heavy demand for capi-
tal, this also creates complex regulatory and management issues. This
problem can be less severe in the cases where off-grid electrification
or small-scale energy local energy systems (such as mini-hydro) are
feasible and economically advantageous; but even in such cases, local
institutional, financial, and regulatory capacity to build and maintain
such facilities are a challenge in places where such capacity is low (see
Chapter 7).
Third, if scale economies are very large, there are cross-border issues.
For example, smaller economies may have difficulty agreeing on
and / or funding cross-border power arrangements with their neighbors
(see Section 14.4). Several studies have examined the use of road-
maps to identify options for low-carbon development (Amer and Daim,
2010), with some taking a regional focus. For example, a study by Doig
and Adow (2011) examines options for low-carbon energy develop-
ment across six SSA countries. More common are studies examining
low-development roadmaps with a national focus, such as a recent
study that explores four possible low-carbon development pathways
for China (Wang and Watson, 2008).
Regional modelling exercises have also examined different mitigation
pathways in the energy sector in different regions. For example, the
Stanford Energy Modeling Forum (EMF)28, which focuses on mitiga-
tion pathways for Europe suggests that transformation pathways will
involve a greater focus on a switch to bioenergy for the whole energy
system and a considerable increase of wind energy in the power sys-
tem until 2050 that catches up with nuclear, while solar PV is only
of limited importance (Knopf etal., 2013). By contrast, in the Asian
Modeling Exercise (AME) for Asia it will involve a greater switch to
natural gas with carbon dioxide capture and storage (CCS) and solar
(van Ruijven etal., 2012).
Studies that examine potentials for low-carbon development within
different locations frequently focus on specific technologies and their
opportunities in a specific context. For example, there are several stud-
ies on low-carbon technology potential in SSA that focus on biomass
(Marrison and Larson, 1996; Hiemstra-van der Horst and Hovorka,
2009; Dasappa, 2011) and solar energy technologies (Wamukonya,
2007; Munzhedzi and Sebitosi, 2009; Zawilska and Brooks, 2011).
However, other technologies have perhaps less clear regional advan-
tages, including biofuels, which have been widely studied not just for
use in Brazil or in Latin America (Goldemberg, 1998; Dantas, 2011;
Lopes de Souza and Hasenclever, 2011) but also in South East Asia
(focusing on Malaysia) (Lim and Teong, 2010) and in OECD countries
(Mathews, 2007). Wind energy also has a wider geographic focus,
with studies ranging from East and South Asia (Lema and Ruby, 2007;
Lewis, 2007, 2011) to South America (Pueyo et al., 2011), and the
Middle East (Gökçek and Genç, 2009; Keyhani etal., 2010; Ilkılıç etal.,
2011). Examinations of geothermal energy and hydropower potential
are likewise geographically diverse (Hepbasli and Ozgener, 2004; Alam

10991099
Regional Development and Cooperation
14
Chapter 14
Zaigham etal., 2009; Kusre etal., 2010; Guzović etal., 2010; Kosnik,
2010; Fang and Deng, 2011).
Many developing regions are latecomers to large-scale energy produc-
tion. While developed regions have sunk capital in irreversible invest-
ments in power supply, transport networks, and urban structures,
many developing countries still need to do so. This creates a latecomer
advantage, as developing countries will be able to use the new and
more-efficient technologies that will be available when they make
these investments. However, being a latecomer also implies that there
are current energy shortages, a high shadow price on power, and an
urgent need to expand capacity. Further delay in anticipation of future
technical progress is particularly expensive (Collier and Venables,
2012b).
While the opportunities for switching to low-carbon development in
different regions are circumscribed by capacity in poorer countries or
lock-in effects in richer countries, there are low-cost options for reduc-
ing the carbon-intensity of the economies through the removal of
energy subsidies and the introduction of energy taxes. Energy subsidy
levels vary substantially by region (IEA, 2012; OECD, 2012; IMF, 2013).
Pre-tax consumption subsidies compare the consumer price to a world
price for the energy carrier, which may be due to direct price subsidies,
subsidies to producers leading to lower prices, or low production costs
for energy producers, relative to world market prices. Note that pre-
tax figures therefore do not correspond to the actual fiscal outlays of
countries to subsidize energy. In particular, for energy exporters, the
domestic costs of production might be lower than the world market
price and therefore a lower domestic price represents a lower fiscal
outlay compared to an energy importer who pays world market prices
(IEA, OECD, OPEC, and World Bank, 2010). Nevertheless, pre-tax figures
represent the opportunity costs to these energy exporters (IEA, OPEC,
OECD; and World Bank, 2011). An IMF policy paper (2013), reports that
in MNA as well as EIT, pre-tax energy subsidies are very high as a share
of GDP. Also in SAS, energy subsidies are substantial, and there are also
some subsidies in LAM and SSA where they are concentrated among
fuel exporters (IMF, 2013). Similar data on pre-tax subsidies is available
from the International Energy Agency (IEA) for a reduced set of coun-
tries. These data confirm the regional distribution of pre-tax energy
subsidies, particularly their high level in MNA and EIT (IEA, 2012c).
The OECD (2012) provides an inventory of various direct budgetary
transfers and reported tax expenditures that support fossil fuel pro-
duction or use in OECD countries. The OECD report finds that between
2005 and 2011, these incentives tended to benefit crude oil and other
petroleum products (70 % in 2011) more than coal (12 %) and natural
gas (18 %) in absolute terms (OECD, 2012).
Reducing energy subsidies would reduce the carbon-intensity of
growth and save fiscal resources. A report prepared for the Group
of Twenty Finance Ministers (G20) (IEA, OECD, OPEC, and World
Bank, 2011) not only reports data on fossil fuel and other energy-
support measures, but also draws some lessons on subsidy reform.
It concludes that three of the specific challenges facing developing
countries are strengthening social safety nets and improving target-
ing mechanisms for subsidies; informing the public and implement-
ing social policy or compensatory measures; and implementing the
reform in the context of broader energy sector reform (IEA, OECD,
OPEC, and World Bank, 2011).This issue, as well as the political econ-
omy of fuel subsidies and fuel taxation, is discussed in more detail in
Section 15.5.
14�3�3 Urbanization and development
14�3�3�1 Urbanization as a driver of regional emissions
Urbanization has been one of the most profound socioeconomic and
demographic trends during the past decades, particularly in less-urban-
ized developed regions (UNDESA, 2010), see Section 12.2. Accom-
panying the changes in industrial structure and economic develop-
ment, urbanization tends to increase fossil fuel consumption and CO
2
emissions at the global level (Jones, 1991; York etal., 2003; Cole and
Neumayer, 2004; York, 2007; Liddle and Lung, 2010). Studies of the
net impact of urbanization on energy consumption based on histori-
cal data suggest that — after controlling for industrialization, income
growth and population density — a 1 % of increase in urbanization
increases energy consumption per unit of GDP by 0.25 % (Parikh and
Shukla, 1995) to 0.47 % (Jones, 1991), and increases carbon emissions
per unit of energy use by 0.6 % to 0.75 % (Cole and Neumayer, 2004).
However, the impact of urbanization on energy use and carbon emis-
sions differs remarkably across regions and development level (Pou-
manyvong and Kaneko, 2010; Martínez-Zarzoso and Maruotti, 2011;
Poumanyvong etal., 2012). For instance, LAM has a similar urbanization
level as NAM and WEU, but substantially lower per capita CO
2
emis-
sions because of its lower-income level (World Bank, 2013b). In SSA,
the per capita carbon emissions remained unchanged in the past four
decades (JRC / PBL, 2013; IEA, 2012a), while the urbanization level of the
region almost doubled (UNDESA, 2011). This is because in SSA the rapid
urbanization was not accompanied by significant industrialization and
economic growth, the so-called ‘urbanization without growth’ (Easterly,
1999; Haddad etal., 1999; Fay and Opal, 2000; Ravallion, 2002).
On the one hand, per capita energy use of developing countries is sig-
nificantly lower than in developed countries (Figure 14.7 left panel). On
the other hand, per capita energy use of cities in developing regions
is usually higher than the national average, while the relationship is
reversed in developed regions (Kennedy et al., 2009; Grübler et al.,
2012). This is because in developing countries industrialization often
happens through manufacturing in cities, while developed regions have
mostly completed the industrialization process. Moreover, urban resi-
dents of developing regions usually have higher-income and energy-
consumption levels than their rural counterparts (see Section 12.3.2
for a more-detailed discussion). This is particularly true in developing
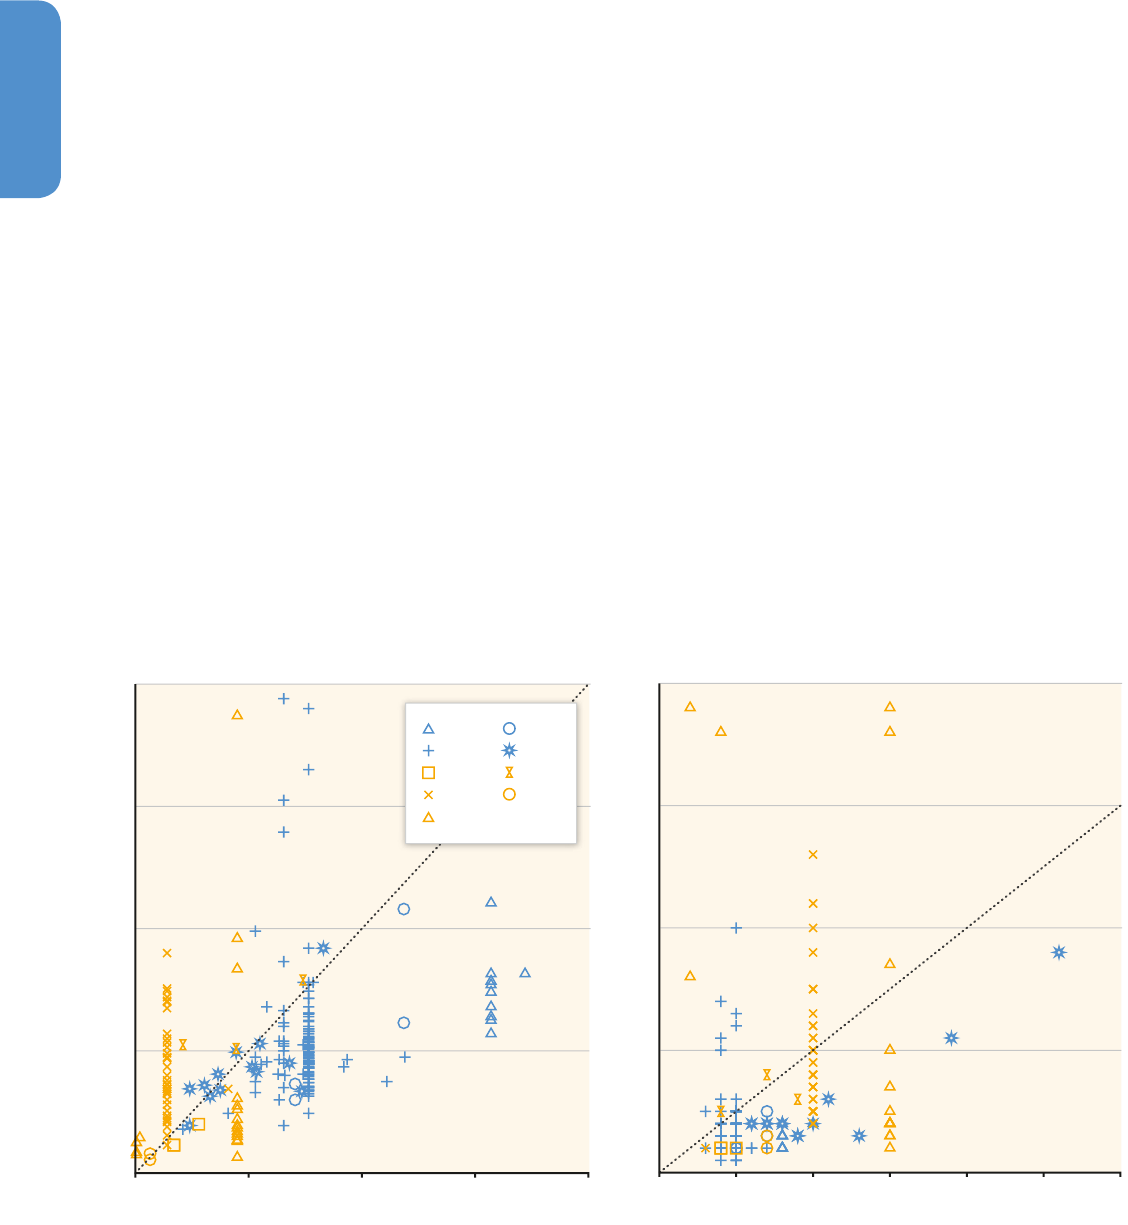
11001100
Regional Development and Cooperation
14
Chapter 14
Asia. In contrast, many cities in SSA and LAM have lower than national
average per capita energy use because of the so-called ‘urbanization
of poverty’ (Easterly, 1999; Haddad etal., 1999; Fay and Opal, 2000;
Ravallion, 2002). Other studies reveal an inverted-U shape between
urbanization and CO
2
emissions among countries of different economic
development levels. One study suggests that the carbon emissions
elasticity of urbanization is larger than 1 for the low-income group,
0.72 for the middle-income group, and negative (or zero) for the upper-
income group of countries (Martínez-Zarzoso and Maruotti, 2011).
Per capita energy consumption in cities of developing countries is
shown to be generally lower (Figure 14.7 left panel). At the same time,
studies reveal that cities in developing regions have significantly
higher energy intensity than cities in developed regions (Figure 14.7
right panel). Still, the majority of cities in both developed and develop-
ing countries (two-thirds in developed region and more than 60 % in
developing regions) have lower than national average energy inten-
sity. Important factors that contribute to the varying energy intensities
across cities are the different patterns and forms of urban settlements
(Glaeser and Kahn, 2010; Grübler and Fisk, 2012; see Section 12.3.2 for
a detailed discussion). Comparative analyses indicate that United
States cities consume 3.5 times more per capita energy in transporta-
tion than their European counterparts (Steemers, 2003) because the
latter are five times as dense as the former and have significantly
higher car ownership and average distance driven (Kahn, 2000). Sub-
urbanization in the United States may also contribute to increasing
residential fuel consumption and land-use change (Bento etal., 2005).
See Section 12.4 for a more-detailed discussion on urban form as a
driver for emissions.
14�3�3�2 Opportunities and barriers at the regional level
for low-carbon development in urbanization
Urbanization has important implications for global and regional miti-
gation challenges and opportunities. Many developing regions are pro-
jected to become more urbanized, and future global population growth
will almost entirely occur in cities of developing regions (IIASA, 2009;
UNDESA, 2011) (see Section 12.1). Due to their early stage of urban-
ization and industrialization, many SSA and Asian countries will inevi-
tably increase energy consumption and carbon emissions, which may
become a barrier for these regions to achieve mitigation goals. Assum-
ing that the historical effect of urbanization on energy use and carbon
emissions remains unchanged, the doubling of current urbanization
levels by 2050 in many low-urbanized developing countries (such as
India) implies 10 – 20 % more energy consumption and 20 – 25 % more
Figure 14�7 | Per capita energy use (left panel), and energy intensity in cities compared with the national average by regions (right panel), in the year 2000. The per capita energy
use of cities, represented by a dot above the green line, is higher than the national average; otherwise, is lower than the national average. Data sources: (1) city energy data is from
Grübler etal. (2012); (2) national energy data is from IEA energy balances (IEA, 2010d).
0 30252015
National Energy Intensity in the Year 2000 [MJ/GDP (PPP) Int$
2005
]
105
0
400300
National per Capita Energy Use [GJ/cap]
200100
City per Capita Energy Use [GJ/cap]
0
300
200
100
400
0
10
30
20
40
City Energy Intensity in the Year 2000 [MJ/GDP (PPP) Int$
2005
]
SSA
SAS
PAS
EAS
LAM
EIT
POECD
WEU
NAM
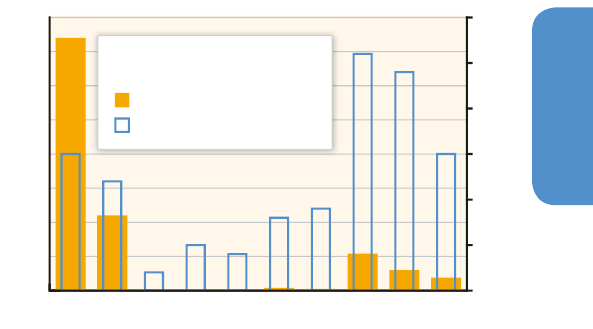
11011101
Regional Development and Cooperation
14
Chapter 14
CO
2
emissions (Jones, 1991). On the other hand, because they are still
at an early stage of urbanization and face large uncertainty in future
urban development trends (O’Neill et al., 2012), these regions have
great opportunities to develop energy-saving and resource-efficient
urban settlements. For instance, if the African and Asian population
increasingly grow into compact cities, rather than sprawl suburban
areas, these regions have great potential to reduce energy intensity
while proceeding urbanization.
An integrated and dynamic analysis reveals that if the world follows
different socioeconomic, demographic, and technological pathways,
urbanization may result in very different emission levels (O’Neill
etal., 2010). The study compares the net contributions of urbaniza-
tion to total emissions under the Intergovernmental Panel on Climate
Change (IPCC) Special Report on Emissions Scenarios SRES A2 and B2
scenarios (Nakicenovic and Swart, 2000). Under the A2 scenario, the
world is assumed to be heterogeneous, with fast population growth,
slow technological changes and economic growth. If all regions fol-
low the urbanization trends projected by the United Nations (UN)
Urbanization Prospects (UNDESA, 2006), extrapolated up to 2100 by
Grübler et al. (2007), the global total carbon emissions in 2100
increase by 3.7 GtC per year due to the impacts of urbanization
growth (Figure 14.8). In a B2 world, which assumes local solutions to
economic, social, and environmental sustainability issues, with con-
tinuous population growth and intermediate economic development,
and faster improvement in environmentally friendly technology, the
same urbanization trend generates a much smaller impact (1.1 GtC
per year in 2100) on global total carbon emissions. Considering the
differences in total emissions under different scenarios, the relative
change in emissions due to urbanization under B2 scenarios (12 %) is
also significantly lower than under A2 scenarios (15 %). Comparing
the impacts in different regions, the 1.1 GtC per year more global
total emissions due to urbanization under the B2 scenario is mostly
due to East Asia, SAS and other less urbanized developing regions.
Moreover, the relative changes in regional emissions due to urbaniza-
tion are also very significant in EAS (27 %), SAS (24 %), and SSA,
MNA, and PAS (15 %), considerably higher than in other regions
(< 10 %). Therefore, a growing urban population in developing
regions will inevitably pose significant challenges to global mitiga-
tion. Moreover, it also has important implications for adaption. How-
ever, urban climate change mitigation policies and strategies can
have important co-benefits by reducing the urban heat island effect
(see Section12.8.4).
14�3�4 Consumption and production patterns in
the context of development
As discussed in Section 5.4, the difference between production and
consumption accounting methods are that the former identifies the
place where emissions occur and the latter investigates emissions dis-
charged for the goods and services consumed within a certain geo-
graphic area.
14�3�4�1 Consumption as a driver of regional emissions
growth
Researchers have argued that the consumption-based accounting
method (Peters, 2008) provides a better understanding of the common
but differentiated responsibility between regions in different economic
development stages (Peters and Hertwich, 2008; Davis and Caldeira,
2010; Peters etal., 2011; Steinberger etal., 2012; Lenzen etal., 2012).
Consequently, much research effort has been focused on estimating
(1) country-level CO
2
emissions from both production and consumption
perspectives (Kondo etal., 1998; Lenzen, 1998; Peters and Hertwich,
2006; Weber and Matthews, 2007; Peters etal., 2007; Nansai et al.,
2008; Weber etal., 2008; Guan etal., 2009; Baiocchi and Minx, 2010);
and (2) the magnitude and importance of international trade in trans-
ferring emissions between regions (Davis and Caldeira, 2010; Peters
etal., 2012b; Wiebe etal., 2012). Reviews of modelling international
emission transfers are provided by Wiedmann etal. (2007), Wiedmann
(2009), Peters etal. (2012a), and Tukker and Dietzenbacher (2013).
During the period 1990 – 2008, the consumption emissions of EAS and
SAS grew by almost 5 – 6 % annually from 2.5 to 6.5GtCO
2
and from
0.8 to 2.0GtCO
2
, respectively. The other developing regions observed
a steadier growth rate in consumption emissions of 1 – 2.5 % per year.
This growth is largely driven by flourishing global trade, especially
trade between developing countries. The transfer of emissions via
traded products between developing countries grew at 21.5 % annu-
ally during 1990 – 2008 (Peters etal., 2011).
While per capita consumption emissions in developed regions are
far larger than the average level of developing countries, many high-
income households in large developing countries (e. g., China and
India) are similar to those in developed regions (Feng et al., 2009;
Figure 14�8 | Impact of urbanization on carbon emissions in 2100 for the world under
SRES A2 and B2 scenarios and by regions only under SRES B2 scenario. This figure is
based on O’Neill etal. (2010), data for NAM from the United States, POECD from Japan,
EIT from Russia, LAM from Mexico and Brazil, EAS from China, SAS from India, and other
from Indonesia. The urbanization scenario follows UN Urbanization Prospects (UNDESA,
2006), extrapolated up to 2100 by Grübler etal. (2007). The effect of urbanization on
emissions for the world and by region is shown in absolute and relative terms.
Absolute Increase in Carbon Emissions [GtC/yr]
Relative Change in Carbon Emissions [% of Baseline]
OtherSASEASLAMEITPOECDWEUNAMWorld
B2
World
A2
Absolute Change (Left Scale)
Relative Change (Right Scale)
0
5
10
15
20
25
30
0.0
0.5
1.0
1.5
2.0
2.5
3.0
3.5
4.0
Effect of Urbanization on Emissions for
the World and by Region in 2100

11021102
Regional Development and Cooperation
14
Chapter 14
Hubacek etal., 2009). Along with the rapid economic developments
and lifestyle changes in Asia, average consumption emissions have
increased 72 %, 74 %, and 120 % in PAS, SAS, and EAS, respectively,
and the growth is projected to be further accelerating (Hubacek etal.,
2007; Guan etal., 2008). Per capita consumption emissions in LDCs
have changed relatively little, due to minimal improvements in lifestyle.
In fact, per capita consumption emission in SSA has slightly decreased
from 0.63 tCO
2
to 0.57tCO
2
(Peters etal., 2011).
Methodologies, datasets, and modelling techniques vary between
studies, producing uncertainties of estimates of consumption-based
emissions and measures of emissions embodied in trade. These issues
and associated uncertainties in the estimates are addressed in detail in
Section 5.2.3.6.
14�3�4�2 Embodied emission transfers between world
regions
Figure 14.9 illustrates the net CO
2
emission transfer between 10 world
regions in 2007 using the Multi-Regional Input-Output Analysis (MRIO)
method and economic and emissions (from fossil fuel combustion)
data derived from the Global Trade Analysis Project (GTAP) Version 8.
Focusing on production-related emissions, the left-hand side of Figure
14.9 explains the magnitudes and regional final consumption destina-
tions of production emissions embodied in exports. Percentage values
represent total exported production emissions as a share of total pro-
duction emissions for each regional economy. Now, focusing on con-
sumption-related emissions, the right-hand side of Figure 14.9 illus-
trates the magnitudes and origins of production emissions embodied
Figure 14�9 | Net transfer of CO
2
emissions (from fossil fuel combustion only) between world regions in 2007 using the multi-regional input-output (MRIO) method. Flow widths
represent the magnitude of emissions (in MtCO
2
) released by left-hand side regions that have become embodied (along global supply chains) in the goods and services consumed
by the regions listed on the right-hand side. Figures for total exported production emissions and total imported consumption emissions are given, and the difference between
these two measures is shown as either a net export or net import emissions transfer. Percentages on the left-hand side indicate the total exported emissions as percentage of total
industry production emissions, while the percentage figures on the right-hand side indicate total imported emissions as percentage of the total industry consumption emissions.
Data reports global CO
2
emissions of 26.5 GtCO
2
in 2007 (22.8 Gt from industry and a further 3.7 Gt from residential sources). The analysis is performed using the MRIO model and
emissions data derived from GTAP Version 8 database, as explained and presented by Andrew and Peters (2013) .
South Asia (SAS)
Middle East and North Africa (MNA)
Western Europe (WEU)
North America
(USA, Canada) (NAM)
Sub-Saharan Africa (SSA)
South-East Asia and Pacific (PAS)
Latin America and Caribbean (LAM)
Pacific OECD-1990 Countries
(Japan, Aus, NZ) (POECD)
164 (36%)
204 (15%)
276 (24%)
287 (22%)
319 (35%)
356 (23%)
Net Import 18
Net Import 134
Net Import 46
Net import 870
457 (16%)
Net Import 482
530 (11%)
Economies in Transition
(Eastern Europe and
Former Soviet Union) (EIT)
584 (23%)
East Asia
(South Korea, Mongolia, China and
Taiwan, Province of China) (EAS)
1520 (27%)
Units: MtCO
2
Exported
Production
Emissions
Imported
Consumption
Emissions
126 (30%)
184 (14%)
294 (25%)
422 (29%)
215 (27%)
402 (25%)
Net Export 21
Net Export 105
Net Export 38
Net Export 285
1327 (36%)
Net Export 1102
1012 (18%)
299 (13%)
418 (9%)

11031103
Regional Development and Cooperation
14
Chapter 14
in regional final consumption imports. The associated percentages rep-
resent total imported consumption emissions as a share of total con-
sumption emissions. The difference between exported production
emissions and imported consumption emissions are highlighted to rep-
resent the net emission transfer between regions.
For example, EAS was the largest net emission exporter (1102 MtCO
2
)
in 2007, with total exported production emissions (1520 MtCO
2
)
accounting for 27 % of total production emissions (5692 MtCO
2
), while
imported consumption emissions (418 MtCO
2
) accounted for less than
10 % of total consumption emissions (4590 MtCO
2
). OECD countries
are the major destinations of export products in EAS. For example,
NAM and WEU account for 34 % and 29 % of EAS’s total exported
production emissions, respectively. In China, the largest economy in
EAS, the share of embodied emissions in exports to total annual emis-
sions have increased from 12 % in 1987 to 21 % in 2002, further to
33 % in 2005 (Weber etal., 2008), and settled around 30 % in 2007
(Minx etal., 2011). Producing exports have driven half of emissions
growth in China during 2002 – 2005 (Guan et al., 2009). Over 60 %
of embodied emissions in Chinese exports in 2005, mainly formed by
electronics, metal products, textiles, and chemical products, are trans-
ferred to developed countries (Weber etal., 2008). Based on the 2002
dataset, Dietzenbacher et al. (2012) argue that the embodied emis-
sions in China may be over-estimated by more than 60 % if the distinc-
tion between processing exports and normal exports is not made. In
contrast, WEU was the largest net emissions importer (870MtCO
2
) in
2007, with total exported production emissions (457 MtCO
2
) account-
ing for 16 % of total production emissions, while imported consump-
tion emissions (1327 MtCO
2
) accounted for 36 % of total consumption
emissions.
Figure 14�10 | Growth in bilateral traded CO
2
emissions between world regions from 1990 to 2008: Flow widths represent the growth in bilateral traded emissions (in MtCO
2
)
between 1990 and 2008, exported from left-hand side region and imported by right-hand side region. Flows representing a growth greater than 30MtCO
2
are shown individually.
Less significant flows have been combined and dropped to the background. Figures for the sum of all export / import connections of each region exhibiting positive growth are pro-
vided. Bracketed figures show the net growth in exported / imported emissions for each region after trade connections exhibiting negative growth (not shown in diagram) have been
accounted for. Trade connections exhibiting significant negative growth include EIT to WEU (– 267MtCO
2
), to EAS (– 121MtCO
2
), to POECD (– 80MtCO
2
), and to other regions (– 15
MtCO
2
). Total growth in inter-region traded emissions between 1990 and 2008 is found to be 2.5GtCO
2
(this does not include intra-region traded emissions, e. g., between the
United States and Canada). The analysis uses the emissions embodied in the bilateral trade (EEBT) approach.The input-output dataset, trade statistics, and emissions data derived
from Peters etal. (2011).
South Asia (SAS)
Middle East and North Africa (MNA)
East Asia
(South Korea, Mongolia, China and
Taiwan, Province of China) (EAS)
Western Europe (WEU)
North America
(USA, Canada) (NAM)
Sub-Saharan Africa (SSA)
South-East Asia and Pacific (PAS)
Latin America and Caribbean (LAM)
Pacific OECD-1990 Countries
(Japan, Aus, NZ) (POECD)
Economies in Transition
(Eastern Europe and Former Soviet Union) (EIT)
112
165
213 (212)
246 (142)
263 (242)
206 (200)
610 (342)
621
213
381 (260)
115
290
162 (160)
168
195
510
114 (109)
197 (179)
13 (-483)
1226
Exported
Emissions
Imported
Emissions
Units: MtCO
2

11041104
Regional Development and Cooperation
14
Chapter 14
Figure 14.10 demonstrates (using the emissions embodied in the bilat-
eral trade (EEBT) method) that the embodied CO
2
emissions in inter-
national bilateral trade between the 10 world regions have grown by
2.5Gt during 1990 – 2008. Considering exports, half of global growth is
accounted for by exports from EAS (1226MtCO
2
), followed by exports
from MNA and SAS with 20 % (510MtCO
2
) and 12 % (290MtCO
2
) of
global growth, respectively. The NAM region has increased imports
by 621 MtCO
2
, with the three Asian regions providing 75 % of the
increase. Although WEU observed positive import flows increase by
610MtCO
2
, it also saw a decrease of 268 MtCO
2
in some bilateral
trade connections, primarily from EIT (257MtCO
2
).
Many developing country regions have also observed considerable
increases in imported emissions during 1990 – 2008. The total growth
in developing countries accounts for 48 % of the global total. For
example, EAS, PAS, and LAM have increased their imported emissions
by 260MtCO
2
, 242MtCO
2
, and 212MtCO
2
, respectively. Over half of
the growth in EAS and LAM has been facilitated via trade with other
developing country regions. While trade with other developing country
regions has contributed over 90 % of increase in imported emissions
to PAS and SAS. These results are indicative of further growth of emis-
sions transfers within the Global South.
Recent research efforts have investigated the embodied emissions
at the sectoral level (Liu etal., 2012a; b; Lindner etal., 2013; Vetőné
Mózner, 2013) and emission transfers between industrial sectors
within or across country borders (Sinden etal., 2011; Homma etal.,
2012). Skelton etal. (2011) calculate total industrial sector production
and consumption attributions to map the embodied emissions deliv-
ered from production to consumption end through the global produc-
tion systems. They find that Western Europe tends to be a net importer
of emissions in all sectors but particularly so in the primary and sec-
ondary sectors.
14�3�4�3 Opportunities and barriers at the regional level
for low-carbon development in consumption
patterns
The growing discrepancy between production- and consumption-based
emissions discussed above, is most likely related to changing struc-
tures of international trade, although carbon leakage associated with
efforts to curb emissions in industrialized countries can play a role here
as well. It is also related to the fact that demand for emission-intensive
goods has not been reduced by as much as the production of emission-
intensive goods in industrialized countries. However, as identical goods
can be produced with different carbon content in different countries,
substitution processes need to be taken into account to assess how
global emissions would change in reaction to a change of imported
emissions (Jakob and Marschinski, 2013).
Climate change analysis and policies pay increasing attention to
consumption (Nakicenovic and Swart, 2000; Michaelis, 2003). Analy-
sis of household survey data from different regions shows that with
improving income levels, households spend an increasing proportion
of their income on energy-intensive goods (Figure 14.11) (O’Neill
et al., 2010). Households in SSA and PAS have much lower income
levels than more-developed regions, and spend a much larger share
of their smaller income on food and other basic needs. Households in
the more-developed PAS and NAM, on the other hand, spend a larger
share of their income on transportation, recreation, etc. With economic
growth, households in less-developed regions are expected to ‘west-
ernize’ their lifestyles, which will substantially increase per capita and
global total carbon emissions (Stern, 2006). Thus changing lifestyles
and consumption patterns (using taxes, subsidies, regulation, informa-
tion, and other tools) can be an important policy option for reducing
the emission-intensity of consumption patterns (Barrett etal., 2013). To
the extent that carbon leakage (see Section 5.4.1) contributes to this
increasing discrepancy between production and consumption-based
emissions, border-tax adjustments or other trade measures (Ismer and
Neuhoff, 2007) can be an option in the absence of a global agreement
on mitigation. This is discussed in more detail below.
14�3�5 Agriculture, forestry, and other land-use
options for mitigation
Emission of GHGs in the Agriculture, Forestry, and Other Land-Use
(AFOLU) options sector increased by 20 % from 9.3 GtCO
2
eq / yr
in
1970 to 11.2GtCO
2
eq / yr (Figure 5.18) in 2010, and contributed about
22 % to the global total in 2010 (JRC / PBL, 2013; IEA, 2012a). Over
this period, the increase in the Agriculture sub-sector was 35 %, from
Uganda
India
Indonesia
China
Russia
Brazil
Mexico
Japan
USA
SSA SAS PAS EAS EIT NMAPOECDLAMLAM
GDP/cap
Other
Transport
Food
Energy
0
20
40
60
80
100
0
5
10
15
20
25
30
35
40
GDP (MER) per Capita in 2001 [(1000 USD
2005
/cap)/yr]
Share of Household Expenditure in 2001 [%/yr]
Figure 14�11 | Expenditure share of households and per capita income, 2001. House-
hold expenditure is based on Zigova et al. (2009) and O’Neill et al. (2010). Per capita
GDP is from World Bank Development Indicators (World Bank, 2011).

11051105
Regional Development and Cooperation
14
Chapter 14
4.2GtCO
2
eq / yr
to 5.7GtCO
2
eq / yr, and in the Forestry and Other Land
Use (FOLU) sub-sector it rose from 5.1GtCO
2
eq / yr
to 5.5GtCO
2
eq / yr
(Section 5.3.5.4; see also Sections 11.2 and 11.3 for more-detailed
sector-specific values). The AFOLU emissions have been relatively
more significant in non-OECD-1990 regions, dominating, for example,
total GHG emissions from Middle East and Africa (MAF) and LAM
regions
2
(see Section 5.3.5.4 and Figure 5.6, Sections 11.2 and 11.4,
Figures11.5 and 11.7). In the LDCs, more than 90 % of the GHG emis-
sions from 1970 – 2010 were generated by AFOLU (Figure 5.20), and
emissions grew by 0.6 % per year over the past four decades (Box 5.3).
As outlined in Section 11.2.3, global FOLU CO
2
flux estimates are
based on a wide range of data sources, and include different pro-
cesses, definitions, and different approaches to calculating emissions;
this leads to a large range across global FOLU flux estimates (Figures
11.6 and 11.7). For the period 1750 – 2011, cumulative CO
2
fluxes have
been estimated at 660 (± 293)GtCO
2
based on the model approach of
Houghton (2003, updated in Houghton, 2012), while annual emissions
averaged 3.8 ± 2.9GtCO
2
/ yr in 2000 to 2009 (see Table 11.1). In Chap-
ter 11 of this assessment, Figure 11.7 shows the regional distribution
of FOLU CO
2
over the last four decades from a range of estimates. For
2000 to 2009, FOLU emissions were greatest in ASIA (1.1GtCO
2
/ yr)
and LAM (1.2 GtCO
2
/ yr) compared to MAF (0.56 GtCO
2
/ yr), OECD
(0.21GtCO
2
/ yr), and EIT (0.12 GtCO
2
/ yr) (Houghton, 2003; Pongratz
etal., 2009; Hurtt etal., 2011; Pan etal., 2011; Lawrence etal., 2012);
these are means across seven estimates, noting that in OECD and EIT
some estimates indicate net emissions, while others indicate a net sink
of CO
2
due to FOLU. Emissions were predominantly due to defores-
tation for expansion of agriculture, and agricultural production (crops
and livestock), with net sinks in some regions due to afforestation.
There have been decreases in FOLU-related emissions in most regions
since the 1980s, particular ASIA and LAM where rates of deforestation
have decreased (FAOSTAT, 2013; Klein Goldewijk et al., 2011; Hurtt
etal., 2011).
In the agriculture sub-sector 60 % of GHG emissions in 2010 were
methane, dominated by enteric fermentation and rice cultivation (see
Sections 5.3.5.4, 11.2.2, Figure 11.2). Nitrous oxide contributed 38 %
to agricultural GHG emissions, mainly from application of fertilizer and
manure. Between 1970 and 2010 emissions of methane increased by
18 % whereas emission of nitrous oxide increased by 73 %. The ASIA
region contributed most to global GHG emissions from agriculture,
particularly for rice cultivation, while the EIT region contributed least
(see Figure 11.5). Due to the projected increases in food production
by 2030, which drive short-term land conversion, the contribution of
developing countries to future GHG emissions is expected to be very
significant (Box11.6).
2
These belong to the so called five RC5 regions, which include ASIA, OECD-1990,
LAM, MAF, and Economies in Transition (EIT) (see AnnexII.2). The ten RC10
regions (see also AnnexII.2) used in this chapter further disaggregate OECD-1990
(WEU, NAM, POECD), MAF (MNA and SSA), and ASIA (EAS, SAS, PAS).
Trajectories from 2006 to 2100 of the four Representative Concentra-
tion Pathways (RCPs) (see Table6.2 in Section 6.3.2.1; Meinshausen
etal., 2011) show different combinations of land cover change (crop-
land and grazing land) and wood harvest as developed by four inte-
grated assessment models and harmonized in the Hurtt etal. (2011)
dataset. These results in regional emissions as illustrated by Figure
14.12 show the results from one Earth System Model (Lawrence etal.,
2012). However, even using a common land cover change dataset,
resulting forest cover, net CO
2
flux, and climate change vary substan-
tially across different Earth System Models (Brovkin etal., 2013). Fur-
thermore, as shown by Popp et al. (2013) projections regarding
regional land cover changes and related emissions can vary substan-
tially across different integrated models for the same concentration
scenario (see Figure 11.19).
Mitigation options in the AFOLU sector mainly focus on reducing
GHG emissions, increasing carbon sequestration, or using biomass to
0
200
400
600
800
1000
Historical RCP 2.6 RCP 4.5 RCP 6.0 RCP 8.5
Cumulative Land Use Flux: Historical (1850-2005) and RCP Projections (2005-2100) [GtCO
2
]
PAS
EAS
EIT
LAM
SAS
MAF
SSA
POECD
NAM
WEU
Figure 14�12 | Cumulative regional emissions of CO
2
from AFOLU. The four RCPs
developed for this Assessment Report explore the implications of a broad range of
future GHG concentration trajectories, resulting in a range of radiative forcing values
in the year 2100: 2.6, 4.5, 6.0, and 8.5Watts per square meter (see Table 6.2 in Sec-
tion 6.3.2.1; Meinshausen etal., 2011). Past and future land cover change and wood
harvest data was from Hurtt etal. (2011). The historical period is from 1850 to 2005,
the RCPs cover the period from 2005 to 2100. This figure shows results running the
scenarios in the Community Climate System Model (CCSM4) (Lawrence etal., 2012) as
illustrative of one of several Earth System Model results presented in the IPCC Working
Group I Report.

11061106
Regional Development and Cooperation
14
Chapter 14
generate energy to displace fossil fuels (Table 11.2). As such, poten-
tial activities involve reducing deforestation, increasing forest cover,
agroforestry, agriculture, and livestock management, and the produc-
tion of sustainable renewable biomass energy (Sathaye etal., 2005;
Smith et al., 2013) (see Box 11.6). Since development conditions
affect the possibilities for mitigation and leapfrogging, in business-
as-usual conditions, the current level of emission patterns is to persist
and intensify (Reilly etal., 2001; Parry etal., 2004; Lobell etal., 2008;
Iglesias etal., 2011a). This poses challenges in terms of these regions’
vulnerability to climate change, their prospects of mitigation actions
and low-carbon development from agriculture and land-use changes.
The WGII report shows that without adaptation, increases in local
temperature of more than 1 °C above pre-industrial are projected to
have negative effects on yields for the major crops (wheat, rice, and
maize) in both tropical and temperate regions, although individual
locations may benefit (see WGII 7.4). However, the quantification of
adaptation co-benefits and risks associated with specific mitigation
options is still in an emerging state (see Section 6.3.3 and 6.6) and,
as referred to in Section 11.5.5, subject to technological but also soci-
etal constraints.
Moreover, linking land productivity to an increase in water irrigation
demand in the 2080s to maintain similar current food production,
offers a scenario of a high-risk from climate change, especially for
regions such as South East Asia and Africa. These regions could benefit
from more technology and investment, especially at the farm level, in
the means of access to irrigation for food production to decrease the
impacts of climate change (Iglesias etal., 2011b). ‘Bottom-up’ regional
strategies to merge market forces, domestic policies, and finance have
been recommended for LAM (Nepstad et al., 2013). Region-specific
strategies are needed to allow for flexibility in the face of impacts and
to create synergies with development policies that enhance adaptive
lower levels of risk. This is the case for NAM, Western and Eastern
Europe, and POECD, but also South East Asia, Central America, and
Central Africa (Iglesias etal., 2011a).
Studies reveal large differences in the regional mitigation potential as
well as clear differences in the ranking of the most-effective options
(see Section 11.6.3). For a range of different mitigation scenarios across
the RC5 regions and all AFOLU measures, ASIA shows the largest eco-
nomic mitigation potential, both in forestry and agriculture, followed
by LAM, OECD-1990, MAF, and EIT. Reduced deforestation dominates
the forestry mitigation potential in LAM and MAF, but shows very lit-
tle potential in OECD-1990 and EIT. Forest management, followed by
afforestation, dominate in OECD-1990, EIT, and ASIA (see Figure 11.19).
Among agricultural measures, almost all of the global potential in rice
management practices is in ASIA, and the large potential for restoration
of organic soils also in ASIA (due to cultivated South East Asian peats),
and OECD-1990 (due to cultivated Northern peatlands).
Although climate and non-climate policies have been key to foster
opportunities for adaptation and mitigation regarding forestry and
agriculture, the above-mentioned scenarios imply very different abili-
ties to reduce emissions from land-use change and forestry in dif-
ferent regions, with the RCP4.5 implying the most ambitious reduc-
tions. Reducing the gap between technical potential and realized
mitigation requires, in addition to market-based trading schemes,
the elimination of barriers to implementation, including climate and
non-climate policy, and institutional, social, educational, and eco-
nomic constraints (Smith et al., 2008). Opportunities for coopera-
tion schemes arise at the regional level as, for instance, combining
reducing emissions from deforestation and degradation (REDD)+
and market transformation, which could potentially mitigate climate
change impacts by linking biodiversity, regional development and
cooperation favouring conservation (Nepstad etal., 2013), or river
basin management planning (Cooper et al., 2008; González-Zeas
etal., 2012).
14�3�6 Technology transfer, low-carbon
development, and opportunities for
leapfrogging
The notion of ‘leapfrogging’ has particular resonance in climate
change mitigation. It suggests that developing countries might be
able to follow more sustainable, low-carbon development path-
ways and avoid the more emissions-intensive stages of develop-
ment that were previously experienced by industrialized nations
(Goldemberg, 1998; Davison etal., 2000; Lee and Kim, 2001; Perkins,
2003; Gallagher, 2006; Ockwell etal., 2008; Walz, 2010; Watson and
Sauter, 2011; Doig and Adow, 2011). Other forms of technological
change that are more gradual than leapfrogging include the adop-
tion of incrementally cleaner or more energy-efficient technologies
that are commercially available (Gallagher, 2006).The evidence for
whether such low-carbon technology transitions can or have already
occurred, as well as specific models for low-carbon development,
have been increasingly addressed in the literature reviewed in this
section.
Most of the energy-leapfrogging literature deals with how latecomer
countries can catch up with the energy-producing or consuming tech-
nologies of industrialized countries (Goldemberg, 1998; Perkins, 2003;
Unruh and Carrillo-Hermosilla, 2006; Watson and Sauter, 2011; Lewis,
2012). Case studies of successful leapfrogging have shown that
both the build-up of internal knowledge within a country or indus-
try and the access to external knowledge are crucial (Lee and Kim,
2001; Lewis, 2007, 2011; Watson and Sauter, 2011). The increasing
specialization in global markets can make it increasingly difficult for
developing countries to gain access to external knowledge (Watson
and Sauter, 2011). Other studies have identified clear limits to leap-
frogging, for example, due to barriers in introducing advanced energy
technologies in developing countries where technological capabilities
to produce or integrate the technologies may be deficient (Gallagher,
2006).
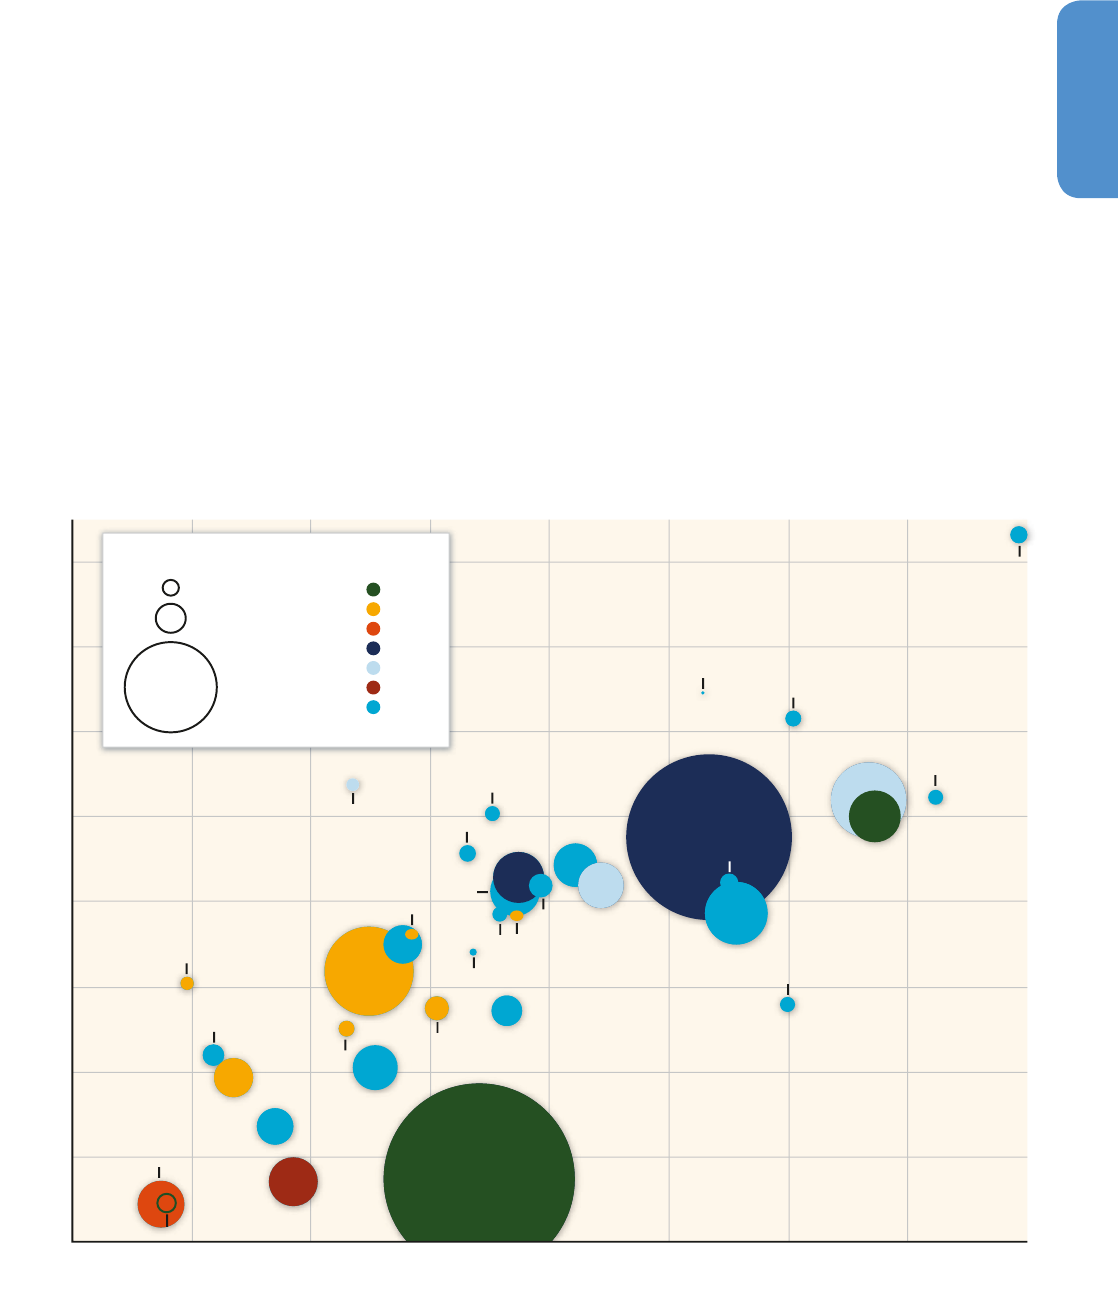
11071107
Regional Development and Cooperation
14
Chapter 14
14�3�6�1 Examining low-carbon leapfrogging across and
within regions
The strategies used by countries to leapfrog exhibit clear regional dif-
ferences. Many cases of technological leapfrogging have been docu-
mented in emerging Asia, including the Korean steel (D’Costa, 1994)
and automobile industries (Lee, 2005; Yoon, 2009), and the wind
power industries in China and India (Lema and Ruby, 2007; Lewis,
2007, 2011, 2012; Ru etal., 2012). Within Latin America, much atten-
tion has been focused on leapfrogging in transportation fuels, and
specifically the Brazilian ethanol program (Goldemberg, 1998; Dantas,
2011; Souza and Hasenclever, 2011).
Absorptive capacity, i. e., the ability to adopt, manage, and develop
new technologies, has been identified in the literature as a core condi-
tion for successful leapfrogging (Katz, 1987; Lall, 1987, 1998; Kim,
1998; Lee and Kim, 2001; Watson and Sauter, 2011). While difficult to
measure, absorptive capacity includes technological capabilities,
knowledge, and skills. It is therefore useful to examine regional differ-
ences across such technological capabilities, using metrics such as the
number of researchers within a country, and total research and devel-
opment (R&D) invested. These metrics are investigated on a national
and regional basis in Figure 14.13 along with total CO
2
emissions from
energy use.
14�3�6�2 Regional approaches to promote technologies
for low-carbon development
The appropriateness of different low-carbon development pathways
relies on factors that may vary substantially by region, including the
nature of technologies and their appropriateness within different
regions, the institutional architectures and related barriers and incen-
tives, and the needs of different parts of society within and across
Figure 14�13 | Emissions contribution and innovative capacity: regional comparison. Source: Data on researchers and R&D expenditures as percentage of GDP from the OECD
Main Science and Technology Indicators Database (OECD, 2011b); CO
2
from fossil fuels are for 2009 (IEA, 2011).
USA
CHN
JPN
DEU
KOR
FRA
CAN
ITA
AUS
ESP
NLD
AUT
TUR
ZAF
FIN
GBR
RUS
SWE
CHE
BEL
DNK
MEX
POL
NOR
PRT
CZE
IRL
HUN
GRC
NZL
SVN
CHL
LUX
SVK
ISL
EST
0.0
2.0
4.0
6.0
8.0
10.0
12.0
14.0
16.0
0.0 0.5 1.0 1.5 2.0 2.5 3.0 3.5 4.0
Researchers, per Thousand Employment
Gross Domestic Expenditures on
R&D as a Percentage of GDP
Tonnes of CO
2
10 Million
100 Million
1000 Million
EAS
EIT
LAM
NAM
POECD
SSA
WEU
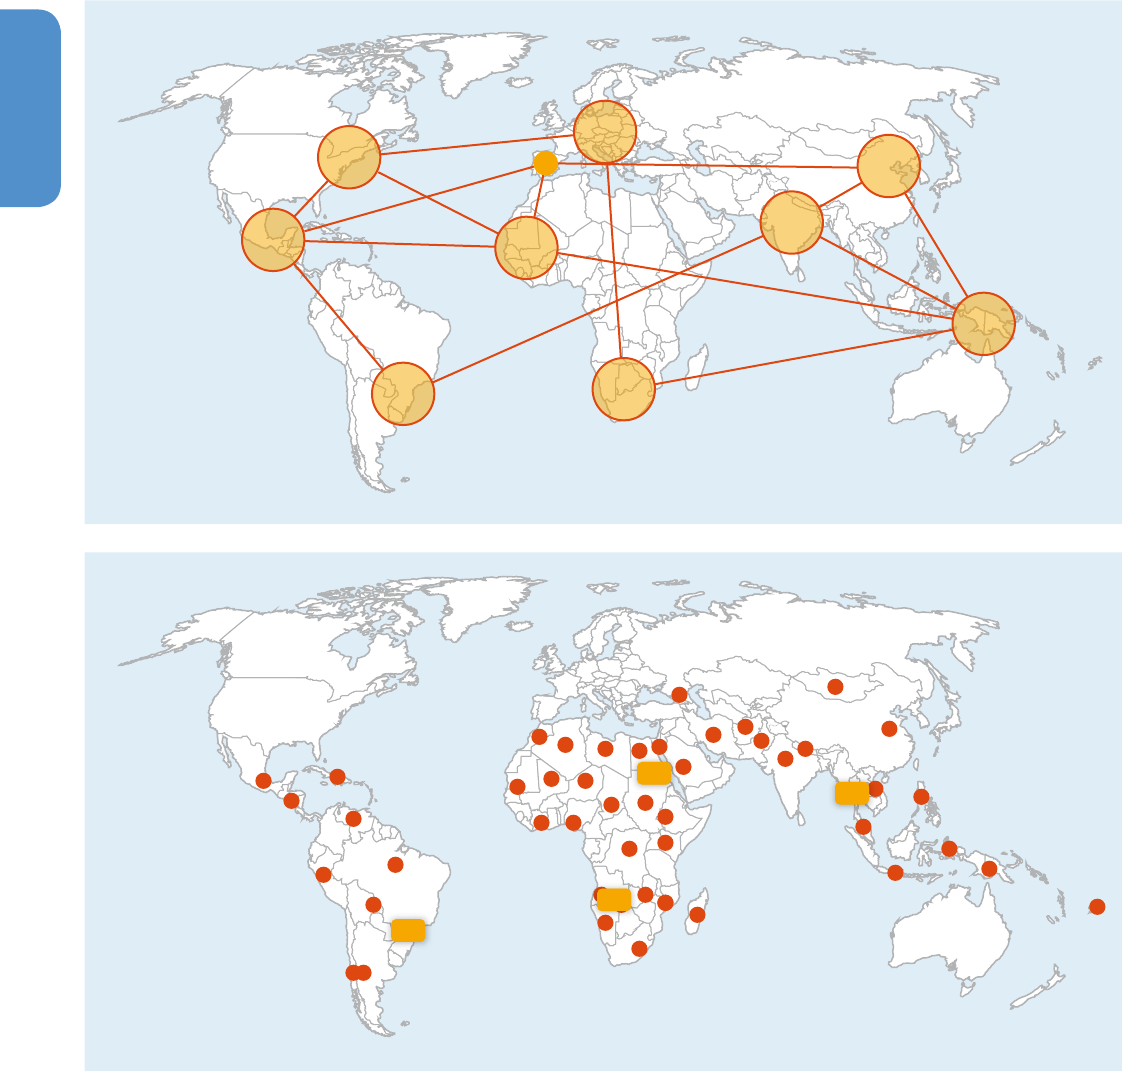
11081108
Regional Development and Cooperation
14
Chapter 14
regions. As a result, an appropriate low-carbon development pathway
for a rapidly emerging economy in EAS may not be appropriate for
countries in PAS or SSA (Ockwell etal., 2008). Low-carbon develop-
ment pathways could also be influenced by climatic or ecological
considerations, as well as renewable resource endowments (Gan and
Smith, 2011).
Regional institutions for low-carbon development
Many studies propose that regions could be a basis for establishing
low-carbon technology innovation and diffusion centres (Carbon Trust,
2008). Such centres could “enhance local and regional engagement
with global technological developments” and “catalyze domestic
capacity to develop, adapt and diffuse beneficial innovations” (Carbon
Figure 14�14 | Options for regionally coordinated climate technology networks. Upper map illustrates a network of climate technology research, development, and demonstration
(RD&D) centers (large circles) with a small secretariat (small circle); lower map illustrates a network of climate technology RD&D centers with national hubs (red dots) and regional
centers (yellow shapes). Source: Cochran etal. (2010).
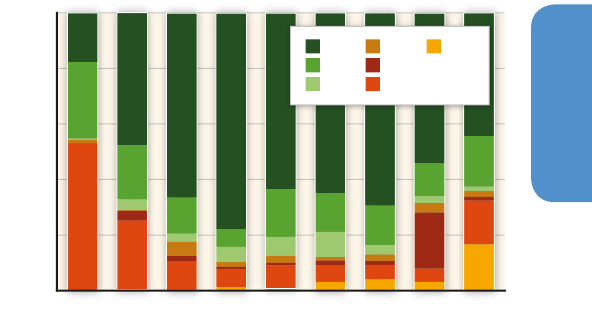
11091109
Regional Development and Cooperation
14
Chapter 14
Trust, 2008). In a report prepared for the United Nations Environment
Program (UNEP) by the National Renewable Energy Laboratory (NREL)
and the Energy Research Center of the Netherlands (ECN), several
options for structuring climate technology centres and networks were
presented that focus on establishing regionally based, linked networks,
as illustrated in Figure 14.14 (Cochran etal., 2010). A Climate Tech-
nology Center and Network (CTCN) was formally established by the
United Nations Framework Convention on Climate Change (UNFCCC)
at the Conference of Parties (COP)17 as part of the Cancun Agree-
ments. The CTCN, confirmed during COP18 in Doha, is jointly managed
by UNEP and the United Nations Industrial Development Organization
(UNIDO), an advisory board, and 11regionally based technology insti-
tutes serving as the CTCN consortium (UNEP Risoe Centre, 2013). The
structure of the CTCN is therefore similar to the one illustrated in the
left map in Figure 14.14.
14�3�7 Investment and finance, including the
role of public and private sectors and
public private partnerships
Since the signature of the UNFCCC in 1992, public finance streams
have been allocated for climate change mitigation and adaptation in
developing countries, e. g., through the Global Environment Facility
(GEF) and the Climate Investment Funds of the World Bank, but also
through bilateral flows (for a discussion of existing and proposed pub-
lic climate finance instruments, see Chapter 16). Moreover, since the
setup of the pilot phase for Activities Implemented Jointly in 1995 and
the operationalization of the Clean Development Mechanism (CDM)
and Joint Implementation (JI) from 2001 onwards, private finance
has flown into mitigation projects abroad (for an assessment of these
mechanisms, see Section 13.13.1). In this section, regional differences
are assessed in use of public finance instruments and private finance
triggered by market mechanisms.
14�3�7�1 Participation in climate-specific policy
instruments related to financing
The CDM has developed a distinct pattern of regional clustering of
projects and buyers of emission credits. Projects are concentrated in
EAS, SAS, and LAM. PAS has a lower level of participation, while EIT,
MNA, and SSA are lagging behind. Credit buyers are concentrated in
WEU (see Figure 14.15 for project volumes). This pattern has been rela-
tively stable since 2006, although in 2011 and 2012 the distribution
has become more balanced in terms of volumes.
The reasons for the skewed regional concentration of CDM projects have
been thoroughly researched. Jung (2006) assesses host country attrac-
tiveness through a cluster analysis, by looking at mitigation potential,
institutional CDM capacity, and general investment climate. Jung’s pre-
diction that China, India, Brazil, Mexico, Indonesia, and Thailand would
dominate was fully vindicated, and only Argentina and South Africa did
not perform as well as expected. Oleschak and Springer (2007) evaluate
host country risk according to the Kyoto-related institutional environ-
ment, the general regulatory environment, and the economic environ-
ment, and derive similar conclusions. Castro and Michaelowa (2010)
assess grey literature on host country attractiveness and find that even
discounting of CDM credits from advanced developing countries would
not be sufficient to bring more projects to low-income countries. Okubo
and Michaelowa (2010) find that capacity building is a necessary but
not sufficient condition for successful implementation of CDM projects.
Van der Gaast el al. (2009) discusses how technology transfer could
contribute to a more equitable distribution of projects.
For CDM programmes of activities that allow bundling an unlimited
number of projects, the distribution differs markedly. According to the
UNEP Riso Centre (2013), the SSA’s share is 10 times higher than for
ordinary CDM projects, while EAS and SAS’s share are one-third lower.
LAM region’s share remains the same. The reason for this more-bal-
anced distribution is the higher attractiveness of small-scale projects
in a low-income context (Hayashi etal., 2010). However, high fixed-
transaction costs of the CDM project cycle are a significant barrier for
small-scale projects (Michaelowa and Jotzo, 2005).
The distribution of JI projects, of which 90 % are implemented in the
EIT region, was not predicted by Oleschak and Springer (2007)’s list of
most-attractive JI countries. The shares have not shifted substantially
over time.
Figure 14.15 shows the regional distribution of pre-2013 credit vol-
umes for annual CDM project cohorts. It confirms the regionally skewed
distribution of CDM projects. In contrast, the 880 climate change proj-
ects of the GEF (a total of 3.1 billion current USD spent since the early
1990s) do not show a significant regional imbalance when assessed
in terms of numbers. Once volumes are assessed, they are somewhat
skewed towards EAS and SAS. Academic literature has evaluated the
regional distribution of GEF projects only to a very limited extent. Mee
etal. (2008) note that there is a correlation between national emis-
sions level and the number of GEF mitigation projects, which would
Figure 14�15 | Regional distribution of pre-2013 credit volumes for annual CDM
project cohorts. Raw data source: UNEP Risoe Centre (2013).
Share of Expected Certified Emissions
Reductions [%/yr]
0
20
40
60
80
100
201220112010200920082007200620052004
EAS
SAS
PAS
MNA
SSA
LAM
EIT

11101110
Regional Development and Cooperation
14
Chapter 14
lead to a concentration of projects in the same countries that have a
high share in CDM projects. Dixon etal. (2010) describe the regional
distribution of the energy efficiency, renewable energy, and transport
project portfolio, but do not discuss what drives this distribution.
While the general direction of bilateral climate finance flows from
the North to the South is clear, regional specificities have only par-
tially been addressed by the literature. Atteridge etal. (2009) assess
the 2008 climate finance flows from France, Germany, and Japan as
well as the European Investment Bank and find that 64 % of mitigation
finance went to Asia and Oceania, 9 % to SSA, 8 % to MNA, and 5 %
to LAM. With 11 %, EIT had a surprisingly high share. Climate Funds
Update (2013) provides data on pledges, deposits, and recipients of
the fast-start finance committed in the Copenhagen Accord. Of the
31.4 billion USD funds pledged by September 2011, 53 % came from
Asia, 37 % from Europe, 9 % from North America, and 1 % from Aus-
tralasia. Of 3.1 billion USD allocated to approved projects, 44 % was to
be spent in Asia, 37 % in Africa, 13 % in Latin America, 13 % in North
America and 6 % in Europe. There is no recent peer-reviewed literature
discussing flows from Multilateral Development Banks.
As of 2009, a total of 79 REDD readiness activities and 100 REDD dem-
onstration activities were reported (Cerbu etal., 2011). REDD readi-
ness activities were evenly distributed among regions (21 in Amazon
Region of South America, 19 in East Asia and the Pacific, 13 in Central
America and the Caribbean, and 22 in Africa). In contrast, East Asia
and the Pacific hold major REDD demonstration projects (40), followed
by 31 in Amazon, 18 in Africa, and 2 in South Asia (Cerbu etal., 2011).
Thirty-six countries, mainly in Latin America (15), Africa (15), and Asia-
Pacific (8) participate in the global initiative Forest Carbon Partnership
Facilities (Nguon and Kulakowski, 2013).
Other global and regional REDD+ initiatives include the UN-REDD
Program, which aims to support REDD+ readiness in 46 partner coun-
tries in Africa, Asia-Pacific, and Latin America; the REDD+ Partnership,
which serves as an interim platform for its partner countries to scale
up actions and finance for REDD+ initiatives in developing countries;
and the Forest Investment Program, which supports developing coun-
tries’ efforts to REDD and promotes sustainable forest management
(den Besten etal., 2013) (see also Section 11.10).
14.4 Regional cooperation and
mitigation: opportunities
and barriers
14�4�1 Regional mechanisms: conceptual
As a global environmental challenge, mitigation of climate change
would ideally require a global solution (see Chapter 13). However,
when global agreement is difficult to achieve, regional cooperation
may be useful to accomplish global mitigation objectives, at least
partially. The literature on international environmental governance
emphasizes the advantages of common objectives, common historical
and cultural backgrounds, geographical proximity, and a smaller num-
ber of negotiating parties, which make it easier to come to agreement
and to coordinate mitigation efforts. As a caveat, regional fragmen-
tation might hamper the achievement of global objectives (Biermann
etal., 2009; Zelli, 2011; Balsiger and VanDeveer, 2012). However, game-
theoretic models using the endogenous coalition formation framework
suggest that several regional agreements are better than one global
agreement with limited participation (Asheim etal., 2006; Osmani and
Tol, 2010). The underlying reason is that endogenous participation in a
global environmental agreement is very small since free-riders profit
more from the agreement than its signatories unless the number of
signatories is very small.
The discussion in this section distinguishes between climate-specific
and climate-relevant initiatives. Climate-specific regional initiatives
address mitigation challenges directly. Climate-relevant initiatives
were launched with other objectives, but have potential implications
for mitigation at the regional level, e. g. regional trade agreements and
regional cooperation on energy. This section will also address tradeoffs
and synergies between adaptation, mitigation, and development at
the regional level. Questions addressed in this chapter are in regard
to what extent the existing schemes have had an impact on mitigation
and to what extent they can be adjusted to have a greater mitiga-
tion potential in future. Since this section focuses on the mitigation
potential of regional cooperation, well-being, equity, intra- and inter-
generational justice will not be considered (see Sections 3.3 and 3.4
for a discussion on these issues).
An important aspect of regional mechanisms is related to efficiency
and consistency. As GHGs are global pollutants and their effect on
global warming is largely independent of the geographical location of
the emission source, all emitters of GHGs should be charged the same
implicit or explicit price. If this ‘law of one price’ is violated, mitigation
efforts will be inefficient. This would imply that regions should strive
for internal and external consistency of prices for GHGs. The law of one
price should apply within and across regions. As regards internal con-
sistency, regional markets for GHG emission permits, such as the EU
ETS, have the potential to achieve this goal at least in theory (Mont-
gomery, 1972). However, since existing trading schemes cover only a
part of GHG emissions, the law of one price is violated and mitigation
efforts tend to be inefficiently allocated.
External consistency is linked to the problem of GHG leakage. Specifi-
cally, regional climate regimes can lead to both carbon leakage (dis-
cussed in Section 5.4.1) and a decrease in competitiveness for partici-
pating countries (discussed in Section 13.8.1). Thus, the specific policies
addressing these concerns, particularly the latter, have a large impact
on an agreement’s regional and national acceptability. One of the
most widely discussed policies to correct for climate-related cost differ-

11111111
Regional Development and Cooperation
14
Chapter 14
ences between countries is border tax adjustments (BTAs), which are
similar to the (non-climate) value-added tax in the EU (Lockwood and
Whalley, 2010). There is agreement that BTAs can enhance competi-
tiveness of GHG- and trade-intensive industries within a given climate
regime (Alexeeva-Talebi etal., 2008; Kuik and Hofkes, 2010; Böhringer
etal., 2012; Balistreri and Rutherford, 2012; Lanzi etal., 2012). How-
ever, while BTAs ensure the competitiveness of acting countries, they
lead to severe welfare losses for non-acting ones (Winchester etal.,
2011; Böhringer etal., 2012; Ghosh etal., 2012; Lanzi etal., 2012),
particularly developing countries and the global South (Curran, 2009;
Brandi, 2013). Other solutions to the problem of carbon leakage
include incorporating more countries into regional agreements (Peters
and Hertwich, 2008, p.1406), and linking regional emission trading
systems. Tuerk etal. (2009) and Flachsland etal. (2009) show that link-
ing regional emission trading systems does not necessarily benefit all
parties, even though it is welfare-enhancing at a global level (see also
Section 13.7).
14�4�2 Existing regional cooperation processes
and their mitigation impacts
While there is ongoing discussion in the literature on the contin-
ued feasibility of negotiating and implementing global environ-
mental agreements (see Chapter 13), a distinct set of studies has
emerged that examines international coordination through gov-
ernance arrangements that aim at regional rather than universal
participation(Balsiger and VanDeveer, 2010, 2012; Balsiger and Debar-
bieux, 2011; Elliott and Breslin, 2011). Much of the literature adopts a
regional focus (Kato, 2004; Selin and Vandeveer, 2005; Komori, 2010;
van Deveer, 2011) or focuses on a particular environmental issue (Sch-
reurs, 2011; Pahl-Wostl etal., 2012). Since 60 % of the international
environmental agreements are regional (UNEP, 2001; Balsiger etal.,
2012), this broader set of regional environmental agreements can
provide insights on designing regional climate initiatives, although
further research is needed. In addition, several regional environmen-
tal agreements have climate change components, such as the Alpine
Convention’s Action Plan on Climate Change in the Alps in March
2009 (Alpine Convention, 2009).
This section examines a variety of regional initiatives with climate
implications. Figure 14.16 illustrates three major areas in which
regional climate change coordination can be classified: climate-spe-
cific agreements, technology-focused agreements, and trade-related
agreements. Most, but not all, regionally coordinated initiatives fit
into one of these three categories, though some span multiple cate-
gories. In addition, some of the programs within each category have
been implemented within a single geographic region, while others are
intra-regional. The following sections examine regional initiatives with
climate-specific objectives, trade agreements with climate implications,
regional cooperation on energy, and regional cooperation schemes
where mitigation and adaptation are important.
14�4�2�1 Climate specific regional initiatives
To date, specific regional climate policy initiatives have been rare,
and they need to be distinguished from transnational initiatives that
abound (Andonova etal., 2009). Grunewald etal. (2013) survey exist-
ing regional cooperation agreements on mitigation (except the agree-
ments in the European Union for which a large literature exists). Of the
15agreements surveyed, they find that most are built on existing trade
or regional integration agreements or are related to efforts by donors
and international agencies. Most relate to technology (see discussion
below), some to finance, and some to trade. Few of them have been
rigorously evaluated and the likely impact of most of these activities
appears to be limited, given their informal and mostly voluntary nature.
The technology-focused agreements are discussed in more detail
below. The EU has been an exception to this pattern of rather loose and
voluntary agreements, where deep integration has generated binding
and compulsory market-based as well as regulation-based initiatives.
Therefore, the discussion of impacts of the EU experience offers lessons
of the promise and challenges to use regional cooperation mechanisms
to further a mitigation agenda also for other regions.
Of the wide array of mitigation policy instruments (see Chapter 15
for a discussion of such instruments), only emission trading systems
have been applied on a regional scale: the EUETS covering the EU’s
27member states, Iceland, Norway, and Liechtenstein; and the West-
ern Climate Initiative (WCI), which initially included several states in
the United States and provinces in Canada, and now includes just Cali-
fornia and Quebec (see Section 13.7.1.2 for a detailed review).
While the EU has tried over many years to introduce a common CO
2
tax, these efforts have failed and only a minimum level of energy
taxes to apply across the EU could be defined. Most other supra-
national climate policy initiatives specialize on certain technologies.
These include the Methane to Markets Initiative, the Climate Technol-
ogy Initiative, the Carbon Sequestration Leadership Forum, and the
International Partnership for the Hydrogen Economy, which are open
for global membership (see Bäckstrand, (2008) for a summary of
these initiatives). In selected cases regional initiatives have emerged,
such as the Asia-Pacific Partnership for Climate Change, and the addi-
tion of regional collaboration in the framework of the UNFCCC (e. g.,
the Central Group 11 (CG 11) of Eastern European countries in transi-
tion or the African Group). An evaluation of these initiatives follows.
The EU ETS
The EU ETS is a mandatory policy, which has evolved over a decade in
strong interaction between the EU Commission, the European Parlia-
ment, member state governments, and industry lobbies (for an over-
view of the role of the different interests, see Skjærseth (2010). It has
gone through three phases, and shifted from a highly decentralized to
a centralized system.
The EU ETS is by far the largest emission trading system in the world,
covering over 12,000 installations belonging to over 4,000 companies

11121112
Regional Development and Cooperation
14
Chapter 14
and initially over 2 Gt of annual CO
2
emissions. It has thus been thor-
oughly researched (see Convery, (2009a), for a review of the literature,
and Lohmann, (2011), for a general critique).
How was institutional, political, and administrative feasibility achieved
in the case of the EU ETS? According to Skjærseth and Wettestad
(2009), from being an opponent of market mechanisms in climate
policy as late as 1997, the EU became a supporter of a large-scale
emissions trading system since 2000 due to a rare window of oppor-
tunity. The Kyoto Protocol had increased the salience of climate policy,
and according to EU rules, trading could be agreed through a quali-
fied majority, whereas a carbon tax required unanimity. Industry was
brought on board through grandfathering (Convery, 2009b) and the
lure of windfall profits generated by passing through the opportunity
cost of allowances into prices of electricity and other products not
exposed to international competition.
Environmental effectiveness of the EU ETS has essentially been deter-
mined by the stringency of allowance allocation. Initially, a decentral-
ized allocation system was put in place, which has been criticized by
researchers as leading to a ‘race to the bottom’ by member states
(Betz and Sato, 2006). Nevertheless, allowance prices reached levels
of almost 40.5USD
2010
(30 EUR
2008
), which was unexpected by ana-
lysts, and in the 2005 – 2007 pilot phase triggered emission reductions
estimated from 85 MtCO
2
(Ellerman and Buchner, 2008) up to over
170MtCO
2
(Anderson and Di Maria, 2011). The wide range is due to
the difficulty to assess baseline emissions. Hintermann (2010) sees
the initial price spike not as sign of a shortfall of allowances but as
market inefficiency due to a bubble, exercise of market power or com-
panies hedging against uncertain future emissions levels. This is cor-
roborated by the fact that the release of the 2005 emissions data in
April – May 2006 showed an allowance surplus and led to a price crash,
as allowances could not be banked into the second period starting
Figure 14�16 | Typology of regional agreements with mitigation implications. Figure includes selected regional agreements only, and is not comprehensive. While not all agree-
ments fit into the typology presented in this diagram, many do.
Intra-Regional
Inter-Regional
Inter-Regional
Intra-Regional
Climate-
Specific
Congo Basin Forest
Partnership REDD+
Initiatives
Great Green Wall of
the Sahara and the
Sahel Initiative
EU-ETS
Carribbean
Community
Climate Change
Centre
Clean Energy
Ministerial (CEM)
APEC Energy
Working Group
ASEAN Energy Security Forum
Regional Trade Agreements and
Preferential Trade Agreements
Africa-Brazil Agricultural
Innovation Marketplace
Carbon Sequestration Leadership Forum
COGEN 3 Initiative
Energy and Climate
Partnership of the
Americas
Asia Pacific Partnership
on Clean Development
and Climate
Technology-
Focused
Trade-
Related

11131113
Regional Development and Cooperation
14
Chapter 14
2008 (see Alberola and Chevallier, (2009) for an econometric analysis
of the crash). A clampdown of the EU Commission on member states’
allocation plan proposals for 2008 – 2012 reduced allocation by 10 %
(230milliontCO
2
per year for the period 2008 – 2012) and bolstered
price levels, the crash of industrial production due to the financial and
economic crisis of 2008 led to an emissions decrease by 450MtCO
2
and an allowance surplus for the entire 2008 – 2012 period. As a result,
prices fell by two-thirds but did not reach zero because allowances
could be banked beyond 2012, and the Commission acted swiftly to set
a stringent centralized emissions cap for the period 2013 – 2020 (see
Skjærseth, 2010, and Skjærseth and Wettestad, 2010, for the details of
the new rules and how interest groups and member states negotiated
them). This stabilized prices until late 2011. But again, the unexpected
persistence of industrial production decreases led to a situation of gen-
eral over-allocation and pressure on allowance prices. The European
Parliament and member states decided in late 2013 to stop auctioning
allowances between 2013 and 2015 to temporarily take up to 900 mil-
lion allowances out of the market (‘backloading’).
While there is a literature investigating short-term spot carbon price
fluctuations, which attributes price volatility to shifts in relative coal,
gas, and oil prices, weather, or business cycles (Alberola etal., 2008; Hin-
termann, 2010), the unexpected low prices in the EU ETS are more likely
to be driven by structural factors. Four structural factors discussed in the
literature are (1) the financial and economic crises (Neuhoff etal., 2012;
Aldy and Stavins, 2012); (2) the change of offset regulations (Neuhoff
etal., 2012); (3) the interaction with other policies (Fankhauser etal.,
2010; Van den Bergh etal., 2013); and (4) regulatory uncertainty and
lack of long-term credibility (Blyth and Bunn, 2011; Brunner etal., 2012;
Clò etal., 2013; Lecuyer and Quirion, 2013). There is no analysis avail-
able that quantitatively attributes a relative share of these explanatory
factors in the overall European Union Allowances (EUA) price develop-
ment, but all four factors seemed to have played a role in the sense that
the absence of any of them would have led to a higher carbon price. The
following paragraphs briefly review each of the four price drivers.
Financial and economic crises — the crash of industrial production
due to the financial and economic crisis of 2008 led to an emissions
decrease by 450 MtCO
2
and an allowance surplus for the entire
2008 – 2012 period. This has led to a decrease in EUA prices (Aldy etal.,
2003; Neuhoff etal., 2012) prices fell by two thirds but did not reach
zero because allowances could be banked beyond 2012, and the Com-
mission acted swiftly to set a stringent centralized emissions cap for
the period 2013 – 2020 (see Skjærseth (2010) and Skjærseth and Wet-
testad (2010) for the details of the new rules and how interest groups
and member states negotiated them). This action stabilized prices until
late 2011. Nonetheless, since then the price has again dropped and
the surplus has reached approximately 2billiontCO
2
(European Com-
mission, 2013a). Schopp and Neuhoff (2013) argue that when the sur-
plus of permits in the market exceeds the hedging needs of market
participants — which they find to be the case in the period from 2008
to at least 2020 — the remaining purchase of allowance is driven by
speculators applying high discount rates. As a consequence, the EUA
price remains below its long-term trend in the short-term until suffi-
cient scarcity is back in the market.
Import of offsets — The use of offsets should not have influenced the
price, as market participants should consider the future scarcity of off-
set credits and there is a limit to the maximum cumulated use of off-
sets between 2008 and 2020. Most large companies covered by the
EU ETS engaged in futures contracts for CER acquisition as early as
2006. However, changes in offset regulations in 2009 and 2011 led to
a pressure to rapidly import Certified Emission Reductions and Emis-
sion Reduction Units (CERs, ERUs). As due to rapidly rising issuance of
CERs, imports approached the maximum level allowed for the period
2008 – 2020, price pressure on CERs / ERUs increased, which in turn
generated pressure on the price of EUAs (Neuhoff etal., 2012).
Interaction with other policies — Interaction of the EU ETS with other
mitigation policies and the resulting effects on economic efficiency has
been discussed by del Río (2010) for renewable energy and energy-effi-
ciency policies, by Sorrell etal. (2009) for renewable energy certificates,
by Frondel et al. (2010) for renewable feed-in tariffs, and by Kautto
etal. (2012) for biomass energy. These studies find that other mitiga-
tion policies can drive the allowance price down due to a decrease
in the demand of allowances (Fankhauser etal. 2010; Van den Bergh
et al., 2013). However, there is no robust scientific assessment that
identifies which share of the price decline is due to expansion of renew-
able energy and improvement of energy efficiency. Section 15.7.3 deals
with this issue of policy interactions such as those of the EU ETS and
EU policies on energy efficiency, renewable, and biofuels in more detail,
including also a welfare analysis of such interactions.
Regulatory uncertainty and lack of long-term credibility — Regulatory
uncertainty (Clò etal., 2013; Lecuyer and Quirion, 2013) and the lack
of long-term credibility (Brunner etal., 2012) might also have influ-
enced the decline of the carbon price. The uncertainties surrounding
2030 and 2040 targets, potential short-term interventions to address
the low allowance price, the outcome of international climate nego-
tiations, as well as the inherent lack of credibility of long-term com-
mitment due to potential time inconsistency problems (Brunner etal.,
2012) probably increases the discount rate applied by market partici-
pants on future carbon prices. Indeed, it has been pointed out that the
current linear reduction factor of 1.74 % per year is not in line with
ambitious 2050 emission targets (achieving only around 50 % emis-
sions reduction compared to the EU’s 80 – 95 % target) (Neuhoff, 2011).
However, while lack of credibility as a factor driving EU ETS prices has
been discussed in some theoretical articles, no empirical evidence on
the magnitude of this factor on EUA prices is available.
Economic effectiveness of the EU ETS has been discussed with respect
to the mobilization of the cheapest mitigation options. While cheap
options such as biomass co-firing for coal power plants have been
exploited, it is contested whether price levels of allowances have been

11141114
Regional Development and Cooperation
14
Chapter 14
sufficiently high after the 2005 and 2009 crashes to drive emissions
reduction. Literature suggests that they have not been high enough
to drive renewable energy investment in the absence of feed-in tariffs
(Blanco and Rodrigues, 2008). Engels etal. (2008) surveyed companies
covered by the EU ETS and found widespread evidence of irrational
behavior, i. e., companies not mitigating even if costs were substan-
tially below allowance prices. Engels (2009) even finds that many com-
panies did not know their abatement costs. A barrier to participation
in trading could have been the highly scale-specific transaction costs,
which were estimated to reach over 2 EUR / EUA for small companies
in Ireland (Jaraitė etal., 2010). Given that 75 % of installations were
responsible for just 5 % of emissions in 2005 – 2006 (Kettner et al.,
2008), this is a relevant barrier to market participation. Another way of
mobilizing cheap options is increasing the reach of the EU ETS, either
through linking to other trading schemes or by allowing import of off-
set credits. Anger etal. (2009) find that linking can substantially reduce
compliance cost, especially if the allocation is done in an efficient way
that does not advantage energy-intensive industries. Linking to the
states of the European Economic Area and Switzerland has not been
researched to a large extent, with the exception of Schäfer (2009), who
shows how opposition of domestic interest groups in Switzerland and
lacking flexibility of the EU prevented linking. Access to credits from
the project-based mechanisms was principally allowed by the ‘Link-
ing Directive’ agreed in 2004. In 2005 – 2007, companies covered by
the EU ETS could import credits from the mechanisms without limit,
but access to the mechanisms has been reduced over time, e. g., by
national level limitations in the 2008 – 2012 period and a central lim-
itation for 2013 – 2020. The import option was crucial for the devel-
opment of the CDM market (Wettestad, 2009) and drove CER prices.
Skjærseth and Wettestad (2008), Chevallier (2010) and Nazifi (2010)
discuss the exchange between the member states and the EU Commis-
sion about import thresholds for the 2008 – 2012 period.
Distributional and broader social impacts of the EU ETS have not been
assessed by the literature to date except for impacts on specific indus-
trial sectors. While the majority of allowances for the electricity sector
are now sold through auctions, other industries receive free allocations
according to a system of 52 benchmarks. Competitiveness impacts
of the EU ETS have been analyzed intensively. Demailly and Quirion
(2008) find that auctioning of 50 % of allocations would only lead to
a 3 % loss in profitability of the steel sector, while in their analysis for
the cement sector Demailly and Quirion (2006) see a stronger expo-
sure with significant production losses at 50 % auctioning. Grubb and
Neuhoff (2006) and Hepburn etal. (2006) extended this analysis to
other sectors and concluded that higher shares of auctioning are not
jeopardizing competitiveness.
Summing up the experiences from the EU ETS, institutional feasibility
was achieved by a structurally lenient allocation, which puts into doubt
its environmental effectiveness. There was a centralization of allocation
over time, taking competences away from national governments. Sev-
eral factors have pushed the carbon prices down in the second phase of
the EU ETS. This has created a situation in which the target set by Euro-
pean policy makers is achieved, but carbon prices are low; while there
are efforts to stabilize the carbon price through backloading or an ambi-
tious emission target for 2030, at the time of this writing it has proven
politically difficult to reach agreement on these matters. Future reform
of the EU ETS will need to clarify the objectives of the scheme, i. e., a
quantitative emissions target or a strong carbon price (e. g., to stimulate
development of mitigation technologies). The link to the project-based
mechanisms was important to achieve cost-effectiveness, but this has
been eroded over time due to increasingly stringent import limits.
14�4�2�2 Regional cooperation on energy
Given the centrality of the energy sector for mitigation, regional coop-
eration in the energy sector could be of particular relevance. Regional
cooperation on renewable energy sources (RES) and energy efficiency
(EE) typically emerges from more general regional and / or interre-
gional agreements for cooperation at economic, policy, and legisla-
tive levels. It also arises through initiatives to share available energy
resources and to develop cross-border infrastructure. Regional coop-
eration mechanisms on energy take different forms depending, among
others, on the degree of political cohesion in the region, the energy
resources available, the strength of economic ties between participat-
ing countries, their institutional and technical capacity, and the finan-
cial resources that can be devoted to cooperation efforts.
In this context, it is also important to consider spillovers on energy that
may appear due to trade. As discussed in Chapter 6 (Section 6.6.2.2),
mitigating climate change would likely lead to lower import depen-
dence for energy importers (Shukla and Dhar, 2011; Criqui and Mima,
2012). The flip side of this trend is that energy-exporting countries
could lose out on significant energy-export revenues as the demand
for and prices of fossil fuels drops.
3
The effect on coal exporters is very
likely to be negative in the short- and long-term as mitigation action
would reduce the attractiveness of coal and reduce the coal wealth of
exporters (Bauer etal., 2013a; b; Cherp etal., 2013; Jewell etal., 2013).
Gas exporters could win out in the medium term as coal is replaced
by gas. The impact on oil is more uncertain. The effect of climate poli-
cies on oil wealth and export revenues is found to be negative in most
studies (IEA, 2009; Haurie and Vielle, 2011; Bauer et al., 2013a; b;
McCollum etal., 2014; Tavoni etal., 2014). However, some studies find
that climate policies would increase oil export revenues of mainstream
exporters by pricing carbon-intensive unconventionals out of the mar-
ket (Persson etal., 2007; Johansson etal., 2009; Nemet and Brandt,
2012). See also Section 6.3.6.6.
In the following section, some examples of regional cooperation will be
briefly examined, namely the implementation of directives on renew-
able energy resources in the EU (European Commission, 2001, 2003,
2009b) and in South East Europe under the Energy Community Treaty
3
See also Section 13.4 on burden sharing regimes that could be used to offset the
possible decrease in export revenue for fossil exporters.

11151115
Regional Development and Cooperation
14
Chapter 14
(Energy Community, 2005, 2008 and 2010), and energy resource sharing
through regional power pools and regional cooperation on hydropower.
Regional cooperation on renewable energy in the European
Union
The legislative and regulatory framework for renewable energy in the
EU has been set up through several directives of the European Com-
mission adopted by EU member states and the European parliament
(European Commission, 2001, 2003, 2009b). These directives are an
example of a regulatory instrument, in contrast to the cap-and-trade
mechanism of the EU ETS described above. In the past, the European
Community adopted two directives on the promotion of electricity
from renewable sources and on the promotion of biofuels (European
Commission, 2001, 2003). These two EU directives established indica-
tive targets for electricity from renewable sources and biofuels and
other renewables in transport, respectively, for the year 2010. Further-
more, they started a process of legal and regulatory harmonization
and required actions by EU member states to improve the develop-
ment of renewable energy (Haas etal., 2006, 2011; Harmelink etal.,
2006). There was progress toward the targets, but it did not occur at
the required pace (Rowlands, 2005; Patlitzianas etal., 2005; European
Commission, 2009a; Ragwitz et al., 2012). Therefore, the European
Commission proposed a comprehensive legislative and regulatory
framework for renewable energy with binding targets.
This led to the introduction of the Directive 2009 / 28 / EC on the promo-
tion of RES (European Commission, 2009b). In this directive, EU Mem-
ber States agreed to meet binding targets for the share of RES in their
gross final energy consumption by the year 2020. The overall target for
the European Union is 20 % of EU gross final energy consumption to
come from RES by the year 2020. The share of renewables in gross final
energy consumption has indeed increased substantially after passage
of the directive and stands at around 13 % in 2011.
The RES Directive is part of the EU climate and energy package
(European Commission, 2008). As such, it has interactions with the
other two pillars, namely the EU ETS and the EE-related directives.
On the basis of model analysis, the European Commission (European
Commission, 2011b) estimates that the implementation of the EU
RES directive could represent an emissions reduction of between
600 and 900MtCO
2
eq by the year 2020 in the EU-27 compared to
a baseline scenario (Capros etal., 2010). The introduction of regula-
tory instruments targeted at RES and / or EE on top of the EU ETS
appears justified on the grounds of the failure of the market to
provide incentives for the uptake of these technologies (European
Commission, 2013a). Still, the combined emission reductions result-
ing from RES deployment and EE measures leave the EU ETS with a
reduced portion of the effort necessary to achieve the 20 % EU emis-
sion reduction target by 2020 (e. g., European Commission, 2013a).
This, as discussed above, has contributed to a reduced carbon price
in the EU ETS (Abrell and Weigt, 2008; OECD, 2011a), affecting its
strength as a signal for innovation and investments in efficiency
and low-carbon technologies (e. g., European Commission, 2013b).
Therefore, coordination between RES and EE policies and the EU ETS
is needed and could include introducing adjustment mechanisms
into the EU ETS.
The implementation of the EU directives for renewable energy and the
achievement of the national targets have required considerable efforts
to surmount a number of barriers (Held etal., 2006; Haas etal., 2011;
Patlitzianas and Karagounis, 2011; Arasto etal., 2012). One obstacle
is the heterogeneity between EU member states regarding their insti-
tutional capacity, know-how, types of national policy instruments
and degrees of policy implementation (e. g., European Commission,
2013c). Still, the EU directives for renewable energy have contributed
to advancing the introduction of RES in the member states (Cardoso
Marques and Fuinhas, 2012). This regional cooperation has taken
place in the framework of a well-developed EU integration at the
political, legal, policy, economic, and industrial level. Only with these
close integration ties has it been possible to implement EU directives
on RES.
Power pools for energy resources sharing
Power pools have evolved as a form of regional cooperation in the
electricity sector and are an example of an opportunity for mitigation
that only arises for geographically close countries. Electricity intercon-
nections and common markets in a region primarily serve the purpose
of sharing least-cost generation resources and enhancing the reliabil-
ity of supply. Getting regional electricity markets to operate effectively
supports mitigation programs in the electricity sector. Cross-border
transmission systems (interconnectors), regional markets and trade,
and system-operating capability play a major role in both the econom-
ics and feasibility of intermittent renewables. In some cases, power
pools provide opportunities for sharing renewable energy sources,
notably hydropower and wind energy, facilitating fuel switching away
from fossil fuels (ICA, 2011; Khennas, 2012). In this context, there is a
correlation between the development of the power pool and the abil-
ity of a region to develop renewable electricity sources (Cochran etal.,
2012). A combination of electricity sector reform, allowing power utili-
ties to be properly run and sustainable, and regional wholesale market
development, with the corresponding regional grid development, is
necessary to tap their potential.
An example of a well-established power pool is the Nord Pool, the
common market for electricity in Scandinavia, covering Denmark, Swe-
den, Norway, and Finland. The Nordic power system is a mixture of
hydro, nuclear, wind, and thermal fossil power. With this mix, the pool
possesses sizeable amounts of flexible regulating generation sources,
specifically hydropower in Norway. These flexible hydropower plants
and pump storage plants allow compensating the inflexibility of wind
power generation (e. g., in Denmark), which cannot easily follow load
changes. Through the wholesale market, the Nord Pool can absorb and
make use of excess wind electricity generation originating in Denmark,
through complementary generation sources. This allows the Nord
Pool to integrate a larger share of wind energy (e. g., Kopsakangas-
Savolainen and Svento, 2013).

11161116
Regional Development and Cooperation
14
Chapter 14
In Africa there are five main power pools, namely the Southern Africa
Power Pool (SAPP), the West African Power Pool (WAPP), the East
African Power Pool (EAPP), the Central African Power Pool (CAPP),
and the Comité Maghrébin de l’Electricité (COMELEC). The SAPP, for
example, includes 12 countries: Botswana, Lesotho, Malawi, South
Africa, Swaziland, Zambia, Zimbabwe, Namibia, Tanzania, Angola,
Mozambique, and Democratic Republic of the Congo. Its generation
mix is dominated by coal-based power plants from South Africa, which
has vast coal resources and the largest generation capacity within
SAPP. Other resources available in the SAPP are hydropower from the
northern countries and, to a lower extent, nuclear power, and gas and
oil plants (Economic Consulting Associates (ECA), 2009; ICA, 2011).
Overall the scale of trade within these power pools is small, leading
to continued inefficiencies in the distribution of electricity genera-
tion across the continent (Eberhard etal., 2011). One of the driving
forces in SAPP is supplying rapid demand growth in South Africa with
hydropower generated in the northern part of the SAPP region. This
way, the power pool can contribute to switching from coal to hydro-
power (ICA, 2011; IRENA, 2013). African power pools and related
generation and transmission projects are financed through different
sources, including member contributions, levies raised on transactions
in the pool and donations and grants (Economic Consulting Associ-
ates (ECA), 2009). To the extent that financial sources are grants or
loans from donor countries or multi-lateral development banks, there
exists the possibility to tie financing to carbon performance standards
imposed on electricity generation and transmission infrastructure
projects.
Regional gas grids
Regional gas grids offer similar opportunities for mitigation (see
Chapter 7). In particular, they allow the replacement of high-carbon
coal-fired and diesel generation of electricity by gas-fired plants. Such
gas grids are developing in East Asia linking China with gas exporting
countries as well as in Eastern Europe, again linking gas exporters in
Eastern Europe and Central Asia with consumers in Western Europe
with the EU taking a coordinating role (Victor, 2006).
Regional cooperation on hydropower
Regional cooperation on hydropower may enable opportunities for
GHG-emissions reduction for geographically close countries by exploit-
ing hydropower power potential in one country and exporting electric-
ity to another, by joint development of a transboundary river system
(van Edig et al., 2001; Klaphake and Scheumann, 2006; Wyatt and
Baird, 2007; Grumbine etal., 2012), or by technology cooperation and
transfer to promote small hydropower (UNIDO, 2010; Kumar et al.,
2011; Kaunda et al., 2012). The development of hydropower poten-
tial, however, needs to comply with stringent environmental, social
and economic sustainability criteria as it has important ramifications
Box 14�1 | Regional cooperation on renewable energy in the Energy Community
The Energy Community extends the EU internal energy market
to South East Europe and beyond, based on a legally binding
framework. The Energy Community Treaty (EnCT) establishing
the Energy Community entered into force on 1 July 2006 (Energy
Community, 2005). The Parties to the Treaty are the European
Union, and the Contracting Parties Albania, Bosnia and Herzegov-
ina, Croatia, Former Yugoslav Republic of Macedonia, Montene-
gro, Serbia, the United Nations Interim Administration Mission in
Kosovo (UNMIK), Moldova and Ukraine. The Energy Community
treaty extended the so-called ‘acquis communautaire’, the body
of legislation, legal acts, and court decisions, which constitute
European law, to the contracting parties. As a result, contracting
parties are obliged to adopt and implement several EU direc-
tives in the areas of electricity, gas, environment, competition,
renewable energies, and energy efficiency. In the field of renew-
able energy, the EU acquis established the adoption of the EU
directives on electricity produced from renewable energy sources
and on biofuels. As a further step, in 2012, the Energy Community
adopted the EU RES Directive 2009 / 28 / EC (Energy Community,
2012). This allows contracting parties to use the cooperation
mechanisms (statistical transfers, joint projects, and joint support
schemes) foreseen by the RES directive under the same conditions
as the EU member states.
Analyses of the implementation of the acquis on renewables in the
energy community (EIHP, 2007, p.2007; Energy Community, 2008;
IEA, 2008; IPA and EPU-NTUA, 2010) found that progress in imple-
menting the EU directives has been dissimilar across Contracting
Parties, among others due to the heterogeneity between these
countries in institutional capacity, know-how, and pace of imple-
mentation of policies and regulatory frameworks (Energy Com-
munity, 2010; Mihajlov, 2010; Karakosta etal., 2011; Tešić etal.,
2011; Lalic etal., 2011). Still, economic and political ties between
South East Europe and the European Union and the prospect of
contracting parties to become EU member states have contributed
to the harmonization of legal, policy, and regulatory elements
for RES (Renner, 2009, p.20). Through the legally binding Energy
Community Treaty, the European Union has exported its legislative
frameworks on RES and EE to a neighboring region. Their further
implementation, however, requires strengthening national and
regional institutional capacity, developing regional energy markets
and infrastructure, and securing financing of projects.

11171117
Regional Development and Cooperation
14
Chapter 14
for development and climate change in the affected regions (Kumar
et al., 2011). In addition, there are difficult economic, political, and
social issues regarding water sharing, upstream and downstream
impacts, and other development objectives. Given its vulnerability to
droughts and other impacts of climate change, hydropower develop-
ment requires careful planning, including provisions for complemen-
tary electricity generation sources (Zarsky, 2010; Nyatichi Omambi
etal., 2012)
Regional cooperation on energy efficiency standards and
labelling
Standards and labels (S&L) for energy-efficient products are useful
in accelerating market transformation towards more energy-efficient
technologies. Energy-efficiency S&L programs help, for instance, reduc-
ing consumption of fossil fuels (e. g., diesel) for electricity generation.
Also, when applied to biomass-based cook stoves, S&L help decreas-
ing the use of traditional biomass for cooking (Jetter et al., 2012).
Standards and labelling programs at a regional-scale provide critical
mass for the creation of regional markets for energy efficiency and,
therefore, incentives to equipment manufacturers. They are also use-
ful in reducing non-tariff barriers to trade (NAEWG, 2002). Examples
of existing S&L regional programs are the European Energy Label-
ling directive, first published as Directive 92 / 75 / EEC by the European
Commission in 1992 (European Commission, 1992) and subsequently
revised (Directive 2010 / 30 / EU; European Commission, 2010), to har-
monize energy-efficiency S&L throughout EU member states and har-
monization efforts on energy-efficiency S&L between the U.S, Canada,
and Mexico as a means to reduce barriers to trade within the North
American Free Trade Agreement (NAFTA), (NAEWG, 2002; Wiel and
McMahon, 2005; Geller, 2006). Currently, several regional S&L initia-
tives are being developed, such as the Economic Community of West
African States (ECOWAS) regional initiative on energy-efficiency stan-
dards and labelling (ECREEE, 2012a), and the Pacific Appliance Label-
ling and Standards (PALS) program in Pacific Island Countries (IIEC
Asia, 2012).
14�4�2�3 Climate change cooperation under regional
trade agreements
International trade regulation is particularly relevant as mitigation
and adaptation policies often depend on trade policy (Cottier etal.,
2009; Hufbauer et al., 2010; Aerni et al., 2010). On the one hand,
trade liberalization induces structural change, which can have a direct
impact on emissions of pollutants such as GHGs. On the other hand,
regional trade agreements (RTAs), while primarily pursuing economic
goals, are suitable to create mechanisms for reducing emissions and
establish platforms for regional cooperation on mitigation and adap-
tation to climate change. In parallel to provisions on elimination of
tariff and non-tariff trade barriers, the new generation of RTAs con-
tains so called WTO-X provisions, which promote policy objectives
that are not discussed at the multilateral trade negotiations (Horn
etal., 2010). In particular, they offer the potential to refine criteria
for distinctions made on the basis of process and production methods
(PPMs), which are of increasing importance in addressing the link-
age of trade and environment and of climate change mitigation in
particular.
Regional trade agreements have flourished over the last two decades.
As of December 2013, the World Trade Organization (WTO) acknowl-
edged 379 notifications of RTAs to be in force(WTO, 2013), half of
which went into force only after 2000. This includes bilateral as well
as multilateral agreements such as, e. g., the EU, the NAFTA, the South-
ern Common Market (MERCOSUR), the Association of Southeast Asian
Nations (ASEAN) and the Common Market of Eastern and Southern
Africa (COMESA). Regional trade agreements increasingly transgress
regional relations and encompass transcontinental preferential trade
agreements (PTAs).
According to the economic theory of international trade, PTAs fos-
ter trade within regions and amongst member countries (trade cre-
ation) and they are detrimental to trade with third parties since trade
with non-member countries is replaced by intraregional trade (trade
diversion). Although the impacts of trade creation and trade diver-
sion have not been analyzed theoretically with respect to their envi-
ronmental impacts, conclusion by analogy implies that the effects on
pollution-intensive and green industries can be positive or negative
depending on the patterns of specialization. Most empirical studies
look at NAFTA and find mixed evidence on the environmental conse-
quences of regional trade integration in North America (Kaufmann
etal., 1993; Stern, 2007). The effects of NAFTA on Mexico turn out
to be small. Akbostancı etal. (2008) look at the EU-Turkey free trade
agreement and find weak evidence that the demand for dirty imports
declined slightly. A study including 162 countries that were involved
in RTAs supports the view that regional trade integration is good for
the environment (Ghosh and Yamarik, 2006). Among empirical stud-
ies looking at the effects of trade liberalization in general, Antweiler
etal. (2001), Frankel and Rose (2005), Kellenberg (2008) and Man-
agi etal. (2009) indicate that freer trade is slightly beneficial to the
environment. As shown in Section 14.3.4, carbon embodied in trade
is substantial and it has been increasing from 1990 to 2008 (Peters
etal., 2011).
Trade liberalization in major trade regions has fostered processes that
are relevant to climate change mitigation via the development of coop-
eration on climate issues. (Dong and Whalley, 2010, 2011) look at envi-
ronmentally motivated trade agreements and find that their impacts,
albeit positive, are very small. Many PTAs contain environmental chap-
ters or environmental side-agreements, covering the issues of environ-
mental cooperation and capacity building, commitments on enforce-
ment of national environmental laws, dispute settlement mechanisms
regarding environmental commitments, etc. (OECD, 2007). In the case
of NAFTA, the participating countries (Canada, Mexico, and the United
States) created the North American Agreement on Environmental Coop-
eration (NAAEC). The NAAEC established an international organization,
the Commission for Environmental Cooperation (CEC), to facilitate col-

11181118
Regional Development and Cooperation
14
Chapter 14
laboration and public participation to foster conservation, protection,
and enhancement of the North American environment in the context
of increasing economic, trade, and social links among the member
countries. Several factors, such as the CEC’s small number of actors,
the opportunities for issue linkage, and the linkage between national
and global governance systems have led to beneficial initiatives; yet
assessments stress its limitations and argue for greater interaction with
other forms of climate governance in North America (Betsill, 2007).
The Asia-Pacific Economic Forum (APEC) provides an example of how
trade-policy measures can be used to promote trade and investment in
environmental goods and services. In 2011, APEC leaders reaffirmed to
reduce the applied tariff rate to 5 % or less on goods on the APEC list
of environmental goods by the end of 2015 (APEC, 2011). Although the
legal status of these political declarations is non-binding, this ‘soft law’
can help to define the standards of good behavior of a ‘well-governed
state’ (Dupuy, 1990; Abbott and Snidal, 2000).
Recent evidence suggests that environmental provisions in RTAs do
affect CO
2
emissions of member countries (Baghdadi etal., 2013).
Member countries of RTAs that include environmental harmonization
policies converge in CO
2
emissions per capita, with the gap being
18 % lower than in countries without an RTA. On the other hand,
member countries of RTAs not containing such an environmental
agreement tend to diverge in terms of CO
2
emissions per capita.
Moreover, the authors find that membership in an RTA per se does
not affect average CO
2
emissions significantly whereas environmen-
tal policy harmonization within an RTA has a very small (0.3 %) but
significant effect on reducing emissions. Thus, regional agreements
with environmental provisions lead to slightly lower average emis-
sions in the region and a strong tendency for convergence in those
emissions.
There is a potential to expand PTA environmental provisions to specifi-
cally cover climate policy concerns. One of the few existing examples of
enhanced bilateral cooperation on climate change under PTAs relates
to the promotion of capacity building to implement the CDM under
the Kyoto Protocol provided for in Article 147 of the Japan-Mexico
Agreement for the Strengthening of the Economic Partnership. Holmes
etal. (2011) argue that PTAs can include provisions on establishment
of ETSs with mutual recognition of emissions allowances (i. e., linking
national ETSs in a region) and carbon-related standards. In promoting
mitigation and adaptation goals, PTAs can go beyond climate policy
cooperation provisions in environmental chapters and make climate
protection a crosscutting issue. Obligations to provide know-how and
transfer of technology, as well as concessions in other areas covered
by a PTA can provide appropriate incentives for PTA parties to accept
tariff distinctions based on PPMs (Cosbey, 2004). Although PTAs con-
stitute their own regulatory system of trade relations, the conclusion
of PTAs, the required level of trade liberalization, and trade measures
used under PTAs are subject to WTO rules (Cottier and Foltea, 2006).
While trade measures linked to emissions is a contentious issue in
the WTO (Bernasconi-Osterwalder etal., 2006; Holzer, 2010; Hufbauer
etal., 2010; Conrad, 2011), the use of carbon-related trade measures
under PTAs provides greater flexibility compared to their application
in normal trade based on the most-favored nation (MFN) principle.
Particularly, it reduces the risk of trade retaliations and the likelihood
of challenge of a measure in the WTO dispute settlement (Holzer and
Shariff, 2012).
While concerns are expressed in the literature about the coherence
between regional and multilateral cooperation (Leal-Arcas, 2011), it
is also recognized that PTAs could play a useful role in providing a
supplementary forum for bringing together a number of key players
(Lawrence, 2009) and fostering bilateral, regional, and trans-regional
environmental cooperation (Carrapatoso, 2008; Leal-Arcas, 2013).
With the current complexities of the UNFCCC negotiations, PTAs with
their negotiation leverages and commercial and financial incentives
can facilitate achievement of climate policy objectives. They can also
form a platform for realization of mitigation and adaptation policies
elaborated at a multilateral level (Fujiwara and Egenhofer, 2007).
14�4�2�4 Regional examples of cooperation schemes
where synergies between adaptation and
mitigation are important
Referring to potential regional actions to integrate adaptation and
mitigation, Burton etal. (2007) point out the need to incorporate adap-
tation in mitigation and development policies. An integrated approach
to climate change policies was considered and large-scale mitigation
opportunities at the national and regional level were identified, indi-
cating that scaling up could be realized through international initia-
tives (Kok and De Coninck, 2007).The UNFCCC Cancun agreements
include mandates for multiple actions at the regional level, in particular
related to adaptation and technology (UNFCCC, 2011). Some authors
also underlined the importance of the linkage between adaptation
and mitigation at the project level, in particular where the mitigative
capacity is low and the need for adaptation is high. This linkage facili-
tates the integration of sustainable development priorities with climate
policy, as well as the engagement of local policymakers in the mitiga-
tion agenda (Ayers and Huq, 2009). Section 4.6 underlines the large
similarities and the complementarities between mitigative and adap-
tive capacities.
Opportunities of synergies vary by sector (Klein etal., 2007). Promis-
ing options can be primarily identified in sectors that can play a major
role in both mitigation and adaptation, notably land use and urban
planning, agriculture and forestry, and water management (Swart and
Raes, 2007). It has been stated that forest-related mitigation activi-
ties can significantly reduce emissions from sources and increase CO
2
removals from sinks at a low cost. It was also suggested that those
activities can be designed promoting synergies with adaptation and
sustainable development (IPCC, 2007). Adaptation measures in the for-
estry sector are essential to climate change mitigation, for maintaining
the forest functioning status addressing the negative impacts of cli-
mate change (‘adaptation for forests’). They are also needed due to the

11191119
Regional Development and Cooperation
14
Chapter 14
role that forests play in providing local ecosystem services that reduce
vulnerability to climate change (‘adaptation for people’) (Vignola etal.,
2009; Locatelli et al., 2011). Information and multiple examples on
interactions between mitigation and adaptation that are mutually rein-
forcing in forests ecosystems and agriculture systems are provided in
Section 11.5.
Examples where integration of mitigation and adaptation processes
are necessary include REDD+ activities in the Congo Basin, a region
where there are well-established cooperation institutions to deal with
common forest matters, such as the Central Africa Forest Commis-
sion (COMIFAC) and the Congo Basin Forest Partnership (CBFP). Some
authors consider that the focus is currently on mitigation, and adap-
tion is insufficiently integrated (Nkem etal., 2010). Other authors have
suggested designing an overarching environmental road map or policy
strategy. The policy approaches for implementing REDD+, adaptation,
biodiversity conservation and poverty reductions may arise from them
(Somorin etal., 2011).
The Great Green Wall of the Sahara, launched by the African Union, is
another example to combine mitigation and adaptation approaches
to address climate change. It is a priority action of the Africa-EU
Partnership on Climate (European Union, 2011). The focus of the
initiative is adaptation and mitigation to climate change through
sustainable land management (SLM) practices. These practices are
increasingly recognized as crucial to improving the resilience of land
resources to the potentially devastating effects of climate change in
Africa (and elsewhere). Thus, it will contribute to maintaining and
enhancing productivity. SLM practices, which are referred in Sec-
tion 14.3.5 of this report, also contribute to mitigate climate change
through the reduction of GHG emissions and carbon sequestration
(Liniger etal., 2011).
There may, however, also be significant differences across regions in
terms of the scope of such opportunities and related regional coopera-
tive activities. At present there is not enough literature to assess these
possible synergies and tradeoffs between mitigation and adaptation in
sufficient depth for different regions.
14�4�3 Technology-focused agreements and
cooperation within and across regions
A primary focus of regional climate agreements surrounds the research,
development, and demonstration (RD&D) of low-carbon energy tech-
nologies, as well as the development of policy frameworks to promote
the deployment of such technologies within different national contexts
(Grunewald et al., 2013). While knowledge-sharing and joint RD&D
agreements related to climate change mitigation are possible in bilat-
eral, regional, and larger multilateral frameworks (de Coninck et al.,
2008), regional cooperation mechanisms may evolve as geographical
regions often exhibit similar challenges in mitigating climate change.
In some cases these similarities serve as a unifying force for regional
technology agreements or for cooperation on a particular regionally
appropriate technology.
Other regional agreements do not conform to traditional geographi-
cally defined regions, but rather may be motivated by a desire to
transfer technological experience across regions. In the particular
case of technology cooperation surrounding climate change mitiga-
tion, regional agreements are frequently comprised of countries that
have experience in developing or deploying a particular technology,
and countries that want to obtain such experience and deploy a simi-
lar technology. While many such agreements include countries from
the North sharing such experience with countries from the South, it
is increasingly common for agreements to also transfer technology
experiences from North to North, or from South to South. Other forms
of regional agreements on technology cooperation, including bilateral
technology cooperation agreements, may serve political purposes such
as to improve bilateral relations, or contribute to broader development
assistance goals. Multilateral technology agreements, such as those
facilitated under the UNFCCC, the Montreal Protocol, the IEA, and the
GEF, are not included in the scope of this chapter as they are discussed
in Chapter 13.
While there has been limited assessment of the efficacy of regional
agreements, when available such assessments are reviewed below.
14�4�3�1 Regional technology-focused agreements
Few regional technology-focused agreements conform to traditional
geographically defined regions. One exception is the Energy and Cli-
mate Partnership of the Americas (ECPA), which was initiated by the
United States, and is a regional partnership among Western hemi-
sphere countries to jointly promote clean energy, low-carbon devel-
opment, and climate-resilient growth (ECPA, 2012). Argentina, Brazil,
Canada, Chile, Colombia, Costa Rica, Dominica, Mexico, Peru, Trinidad,
and Tobago, and the United States as well as the Inter-American Devel-
opment Bank (IDB) and the Organization of American States (OAS)
have announced initiatives and / or are involved in ECPA-supported
projects. They focus on a range of topics, including advanced power
sector integration and cross border trade in electricity, advancing
renewable energy, and the establishment of an Energy Innovation Cen-
ter to serve as a regional incubator for implementation and financing
of sustainable energy innovation (ECPA, 2012). The ECPA could provide
a model for other neighboring countries to form regionally coordinated
climate change partnerships focused on technologies and issues that
are of common interest within the region.
While not explicitly focused on climate, the Regional Innovation and
Technology Transfer Strategies and Infrastructures (RITTS) program
provides an interesting example of a regionally coordinated technol-
ogy innovation and transfer agreement that could provide a model for
regional technology cooperation. RITTS reportedly helped to develop
the EU’s regional innovation systems, improve the efficiency of the

11201120
Regional Development and Cooperation
14
Chapter 14
support infrastructure for innovation and technology transfer, enhance
institutional capacity at the regional level, and promote the exchange
of experiences with innovation policy (Charles etal., 2000).
The ASEAN is a particularly active region in organizing initiatives
focused on energy technology cooperation that may contribute to
climate change mitigation. ASEAN has organized the Energy Security
Forum in cooperation with China, Japan, and Korea (the ASEAN+3)
that aims to promote greater emergency preparedness, wider use of
energy efficiency and conservation measures, diversification of types
and sources of energy, and development of indigenous petroleum (Phil-
ippine Department of Energy Portal, 2014). The Forum of the Heads of
ASEAN Power Utilities / Authorities (HAPUA) includes working groups
focused on electricity generation, transmission, and distribution;
renewable energy and environment; electricity supply industry ser-
vices; resource development; power reliability and quality; and human
resources (Philippine Department of Energy Portal, 2014). ASEAN’s Cen-
ter on Energy (ACE) (previously called the ASEAN-EC Energy Manage-
ment Training and Research Center) was founded in 1990 as an inter-
governmental organization to initiate, coordinate, and facilitate energy
cooperation for the ASEAN region, though it lacks a mandate to imple-
ment actual projects (Kneeland etal., 2005; UNESCAP, 2008; Poocha-
roen and Sovacool, 2012). In addition, the European Commission part-
nered with the ASEAN countries in the COGEN 3 initiative, focused on
promoting cogeneration demonstration projects using biomass, coal,
and gas technologies (COGEN3, 2005). Regional energy cooperation
in the ASEAN region has been mainly motivated by concerns about
security of energy supply (Kuik etal., 2011) and energy access (Bazil-
ian etal., 2012a), an increasing energy demand, fast-rising fossil fuel
imports, and rapidly growing emissions of GHGs and air pollutants
(USAID, 2007; UNESCAP, 2008; Cabalu etal., 2010; IEA, 2010b; c). As
a result, some policies have translated into action on the ground. For
example, during the APAEC 2004 – 2009, the regional 10 % target to
increase the installed renewable energy-based capacities for electric-
ity generation was met (Kneeland etal., 2005; Sovacool, 2009; ASEAN,
2010; IEA, 2010c).
The APEC also has an Energy Working Group (EWG) that was launched
in 1990 to maximize the energy sector’s contribution to the region’s
economic and social well-being, while mitigating the environmental
effects of energy supply and use (APEC Secretariat, 2012).
The ECOWAS regional energy program aims to strengthen regional
integration and to boost growth through market development to
fight poverty (ECOWAS, 2003, 2006). The ECOWAS Energy Protocol
includes provisions for member states to establish energy-efficiency
policies, legal and regulatory frameworks, and to develop renewable
energy sources and cleaner fuels. It also encourages ECOWAS member
states to assist each other in this process. The ECOWAS has recently
expanded further energy access initiatives, which were launched
by The Regional Centre for Renewable Energy and Energy Efficiency
(ECREEE, 2012a; b).
There are also examples of institutions that have been established
to serve as regional hubs for international clean energy technology
cooperation. For example, the Asia Energy Efficiency and Conservation
Collaboration Center (AEEC), which is part of the Energy Conservation
Center of Japan, promotes energy efficiency and conservation in Asian
countries through international cooperation (ECCJ / AEEC, 2011). One
of the longest-established institutions for promoting technology trans-
fer and capacity building in the South is the Asian and Pacific Center
for Transfer of Technology (APCTT), based in New Delhi, India. Founded
in 1977, APCTT operates under the auspices of the United Nations
Economic and Social Commission for Asia and the Pacific to facilitate
technology development and transfer in developing countries of the
region, with special emphasis on technological growth in areas such
as agriculture, bioengineering, mechanical engineering, construction,
microelectronics, and alternative energy generation (Asia-Pacific Part-
nership on Clean Development and Climate, 2013).
14�4�3�2 Inter-regional technology-focused
agreements
Some technology agreements have brought together non-traditional
regions, or spanned multiple regions. For example, the Asia-Pacific
Partnership on Clean Development and Climate (APP) brought
together Australia, Canada, China, India, Japan, Korea, and the United
States. These countries did not share a specific geography, but had
common interests surrounding mitigation technologies, as well as a
technology-oriented approach to climate change policy. The purpose
of the APP was to build upon existing bilateral and multilateral initia-
tives, although it was perceived by some to be offered forth by the
participating nations as an alternative to the Kyoto Protocol (Bäck-
strand, 2008; Karlsson-Vinkhuyzen and Asselt, 2009; Lawrence, 2009;
Taplin and McGee, 2010). The APP was a public-private partnership
that included many active private sector partners in addition to gov-
ernmental participants that undertook a range of projects across eight
task forces organized by sector. Initiated in 2006, the work of the APP
was formally concluded in 2011, although some projects have since
been transferred to the Global Superior Energy Performance Partner-
ship (GSEP) under the Clean Energy Ministerial. This includes projects
from the sectoral task forces on power generation and transmission,
cement, and steel (US Department of State, 2011; Clean Energy Minis-
terial, 2012). One study reviewing the implementation of the APP found
that a majority of participants found the information and experiences
exchanged within the program to be helpful, particularly on access to
existing technologies and know-how (Okazaki and Yamaguchi, 2011;
Fujiwara, 2012). The APP’s record on innovation and access to newer
technologies was more mixed, with factors such as limited funding and
a lack of capacity for data collection and management perceived as
barriers (Fujiwara, 2012). As discussed in Section13.6.3, it may also
have had a modest impact on governance (Karlsson-Vinkhuyzen and
Asselt, 2009; McGee and Taplin, 2009) and encouraged voluntary
action (Heggelund and Buan, 2009).

11211121
Regional Development and Cooperation
14
Chapter 14
Another technology agreement that brings together clean energy tech-
nology experience from different regions is the Clean Energy Ministerial
(CEM). The CEM convenes ministers with responsibility for clean energy
technologies from the world’s major economies and ministers from a
select number of smaller countries that are leading in various areas
of clean energy (Clean Energy Ministerial, 2012). The first CEM meet-
ing was held in Washington in 2010. The 23 governments participating
in CEM initiatives are Australia, Brazil, Canada, China, Denmark, the
European Commission, Finland, France, Germany, India, Indonesia, Italy,
Japan, Korea, Mexico, Norway, Russia, South Africa, Spain, Sweden, the
United Arab Emirates, the United Kingdom, and the United States. These
participant governments account for 80 % of global GHG emissions and
90 % of global clean energy investment (Clean Energy Ministerial, 2012).
A smaller agreement that focused on a broad range of mitigation
technologies, the Sustainable Energy Technology at Work (SETatWork)
Program, was comprised of two years of activities that ran from 2008
to 2010. SETatWork developed partnerships between organizations in
the EU, Asia, and South America focused on implementing the EU ETS
through identifying CDM project opportunities and transferring Euro-
pean technology and know-how to CDM host countries (European
Commission, 2011a).
Other inter-regional technology cooperation initiatives and agreements
focus on specific technology areas. For example, multiple initiatives
focus on the development or deployment of carbon dioxide capture
and storage (CCS) technologies, including the Carbon Sequestration
Leadership Forum (CSLF), the European CCS Demonstration Project
Network, The Gulf Cooperation Council CCS Strategic Workshop, and
the Global Carbon Capture and Storage Institute.
14�4�3�3 South-South technology cooperation
agreements
There are increasingly more examples of technology cooperation agree-
ments among and between developing countries, often in the context of
broader capacity building programs or agreements to provide financial
assistance. One example is the Caribbean Community Climate Change
Centre; which coordinates the Caribbean region’s response to climate
change and provides climate change-related policy advice and guide-
lines to the Caribbean Community (Caribbean Community Climate
Change Center, 2012). Larger countries such as China and Brazil have
taken an active role in promoting South-South cooperation. For example,
China has served as a key donor to the UNDP Voluntary Trust Fund for
the Promotion of South-South Cooperation, and United Nations Educa-
tional, Scientific and Cultural Organization (UNESCO) is working with
the China Science and Technology Exchange Centre, which is part of
China’s Ministry of Science and Technology, to develop a network for
South-South cooperation on science and technology to Address Cli-
mate Change (United Nations Development Programme: China, 2005;
UNESCO Bejing, 2012). The Brazilian Agricultural Research Corporation
has established several programs to promote agricultural and biofuel
cooperation with Africa, including the Africa-Brazil Agricultural Inno-
vation Marketplace, supported by Brazilian and international donors
(Africa-Brazil Agricultural Innovation Marketplace, 2012).
Other South-South programs of cooperation that do not focus on cli-
mate change explicitly still may encourage climate related technology
cooperation. For example, the India, Brazil, South Africa (IBSA) Trust
Fund implements South-South cooperation for the benefit of LDCs,
focusing on identifying replicable and scalable projects that can be
jointly adapted and implemented in interested developing countries
as examples of best practices in the fight against poverty and hunger.
Projects have included solar energy programs for rural electrification
and other projects with potential climate change mitigation benefits
(UNDP IBSA Fund, 2014).
14�4�3�4 Lessons learned from regional technology
agreements
A review of regional climate technology agreements reveals a complex
landscape of cooperation that includes diversity in structure, focus, and
effectiveness. While all of the regional agreements discussed above
vary in their achievements, the strength of the regional organization
or of the relationships of the members of the partnership also vary
substantially. This has a direct implication for the effectiveness of the
cooperation, and for any emissions reductions that can be attributed to
the program of cooperation.
Well-coordinated, regionally based organizations, such as ASEAN,
have served as an effective platform for cooperation on clean energy,
because such programs build upon a strong, pre-existing regional plat-
form for cooperation. Since most regional organizations coordinate
regional activity rather than govern it, most of these regional energy
and climate technology agreements focus on sharing information
and knowledge surrounding technologies, rather than implementing
actual projects, though there are exceptions. Since many countries are
involved in multiple regional agreements, often with a similar technical
focus, it can be difficult to attribute technology achievements to any
specific agreement or cooperation initiative.
Because of the large number of intra-regional climate technology agree-
ments with different types of membership structures and motivations, it
is very difficult to draw general lessons from these types of initiatives.
Since intra-regional technology agreements rarely build upon existing
regional governance structures, their efficacy depends both on the com-
mitment of the members, as well as the resources committed. The promi-
nence of regionally coordinated agreements in other arenas, including
environmental protection and trade, suggests that regions will play an
increasingly important role in climate-related cooperation in the future.
Experience with regional climate cooperation thus far suggests that
building upon pre-existing regional groupings and networks, particularly
those with strong economic or trade relationships, may provide the best
platform for enhanced regional climate change cooperation.

11221122
Regional Development and Cooperation
14
Chapter 14
14�4�4 Regional mechanisms for investments
and finance
14�4�4�1 Regional and sub-regional development banks
and related mechanisms
Regional institutions, including the regional multilateral develop-
ment banks and the regional economic commissions of the United
Nations, play an important role in stimulating action and funding
for mitigation activities (see Section 16.5.1.2 for a discussion of spe-
cific regional institutions). Development finance institutions chan-
neled an estimated 76.8billionUSD
2010
in 2010 / 2011 (Buchner etal.,
2011).
Appropriate governance arrangements at the national, regional, and
international level are an essential pre-requisite for efficient, effec-
tive, and sustainable financing of mitigation measures (see Chapter
16). The Report of the Secretary-General’s High-Level Advisory Group
on Climate Change Financing recommended that the delivery of
finance for adaptation and mitigation be scaled up through regional
institutions, given their strong regional ownership. It also found that
regional cooperation provides the greatest opportunity for analyzing
and understanding the problems of, and designing strategies for cop-
ing with, the impact of climate change and variability (United Nations,
2010).
There are few aggregated estimates of the split of finance by type
of disbursement organization available (see Chapter 16). A regional
breakdown of the recipients of Multilateral Development Bank (MDB)
climate finance based on the OECD Creditor Reporting System (CRS)
database shows that recipients are primarily located in Asia (26 %),
Latin America and the Caribbean (23 %) and Europe / Commonwealth
of Independent States region (19 %) (Buchner etal., 2011).
14�4�4�2 South-South climate finance
There are limited data available to accurately quantify South-South
climate finance flows, and many studies have pointed to a need for
more accessible and consistent data (Buchner et al., 2011). One
study that tracked overall development assistance from countries
that are not members of the OECD Development Assistance Com-
mittee (DAC) estimated flows of 9.66 billion to 12.88 billion USD
2010
(9to 12billionUSD
2006
) and projected that these flows would sur-
pass 15billionUSD by 2010 (ECOSOC, 2008; Buchner etal., 2011).
Brazil, India and China, the ‘emerging non-OECD donors’, are playing
an increasingly important role in the overall aid landscape, and these
countries also have programs to provide climate-related assistance
to developing countries (Buchner et al., 2011). The share of GEF
contributions that come from developing countries was estimated
to total 56.6 million USD
2010
(52.8millionUSD
2006
) (Ballesteros etal.,
2010).
14.5 Taking stock and
options for the future
A key finding from this chapter is that currently there is a wide gap
between the potential of regional cooperation to contribute to a mitiga-
tion agenda and the reality of modest to negligible impacts to date. As
shown in the discussion on climate-specific as well as climate-relevant
regional cooperation, the ability to use existing regional cooperation for
furthering a mitigation agenda, by pursuing a common and coordinated
energy policy, embodying mitigation objectives in trade agreements in
urbanization and infrastructure strategies, and developing and sharing
technologies at the regional level, is substantial. In principle, in many
regions the willingness to cooperate on such an agenda is substan-
tial. In the absence of an increasingly elusive global agreement, such
regional cooperation may provide the best alternative to furthering an
ambitious mitigation agenda. Also, if a global agreement emerges, such
regional cooperation could prove vital for its implementation.
At the same time, the reality is one of very low mitigation impacts to
date. Even in areas of deep integration where multiple instruments for
mitigation have been put into place, progress on mitigation has been
slower than anticipated. This is largely related to a political reluctance
to pursue the multiple policy instruments with sufficient rigor. The chal-
lenge will be to drastically increase the ambition of existing instru-
ments while carefully considering the positive and negative interac-
tions between these different policies. For regions where deep regional
integration is not present yet, the experience from the EU suggests
that only after a substantial transfer of sovereignty to regional bodies
can an ambitious mitigation be pursued. Such a transfer of sovereignty
is unlikely in most regions where the regional cooperation processes
are still in early stages of development. Alternatively, regional coop-
eration on mitigation can build on the substantial good-will within
regions to develop voluntary cooperation schemes in the fields out-
lined in the chapter that also further other development goals, such
as energy security, trade, infrastructure, or sustainable development.
Whether such voluntary cooperation will be sufficient to implement
ambitious mitigation measures to avoid the most serious impacts of
climate change remains an open question.
14.6 Gaps in knowledge
and data
While there is clear evidence from the theoretical and empirical litera-
ture that regional mechanisms have great potential to contribute to
mitigation goals, there are large gaps in knowledge and data related
to the issues covered in this chapter. In particular, there are gaps in the
literature on:

11231123
Regional Development and Cooperation
14
Chapter 14
• The quantitative impact of regional cooperation schemes on miti-
gation, especially in terms of quantifying their impact and sig-
nificance. While some of the mechanisms, such as the EU-ETS are
well-studied, many other cooperation mechanisms in the field of
technology, labelling, and information sharing have hardly been
analyzed at all.
• The factors that lead to the success or failure of regional coopera-
tion mechanisms, including regional disparities and the mismatch
between capacities and opportunities within and between regions.
This research would be useful to determine which cooperation
mechanisms are suitable for a particular region at a given stage
of development, resource endowment, a given level of economic
and political cooperation ties, institutional and technical national
capacities and heterogeneity among the participating countries.
• Synergies and tradeoffs between mitigation and adaptation. In
addition, it would be important to understand more about capacity
barriers for low-carbon development at the regional level, includ-
ing on the costs of capital and credit constraints. There is also very
little peer-reviewed literature assessing the mitigation potential
and actual achievements of climate-relevant regional cooperation
agreements (such as trade, energy, or infrastructure agreements).
• The empirical interaction of different policy instruments. It is clear
that regional policies interact with national and global initiatives,
and often there are many regional policies that interact within the
same regions. Not enough is known to what extent these many
initiatives support or counteract each other.
14.7 Frequently Asked
Questions
FAQ 14�1 How are regions defined in the AR5?
This chapter examines supra-national regions (i. e., regions in between
the national and global level). Sub-national regions are addressed in
Chapter 15. There are several possible ways to classify regions and
different approaches are used throughout the IPCC Fifth Assessment
Report (AR5). In most chapters, a five-region classification is used that
is consistent with the integrated models: OECD-1990, Middle East
and Africa, Economies in Transition, Asia, Latin America and the Carib-
bean. Given the policy focus of this chapter and the need to distinguish
regions by their levels of economic development, this chapter adopts
regional definitions that are based on a combination of economic and
geographic considerations. In particular, this chapter considers the fol-
lowing 10 regions: East Asia (China, Korea, Mongolia) (EAS); Econo-
mies in Transition (Eastern Europe and former Soviet Union) (EIT); Latin
America and Caribbean (LAM); Middle East and North Africa (MNA);
North America (USA, Canada) (NAM); South-East Asia and Pacific
(PAS); Pacific OECD-1990 members (Japan, Australia, New Zealand)
(POECD); South Asia (SAS); sub-Saharan Africa (SSA); Western Europe
(WEU). These regions can readily be aggregated to other regional clas-
sifications such as the regions used in scenarios and integrated assess-
ment models (e. g., the so-called Representative Concentration Path-
ways (RCP) regions), commonly used World Bank socio-geographic
regional classifications, and geographic regions used by WGII. In some
cases, special consideration will be given to the cross-regional group
of Least Developed Countries (LDCs), as defined by the United Nations,
which includes 33 countries in SSA, 5 in SAS, 8 in PAS, and one each
in LAM and MNA, and which are characterized by low incomes, low
human assets, and high economic vulnerability.
FAQ 14�2 Why is the regional level important
for analyzing and achieving mitigation
objectives?
Thinking about mitigation at the regional level matters for two rea-
sons. First, regions manifest vastly different patterns in their level,
growth, and composition of GHG emissions, underscoring significant
differences in socio-economic contexts, energy endowments, consump-
tion patterns, development pathways, and other underlying drivers
that influence GHG emissions and therefore mitigation options and
pathways [14.3]. We call this the ‘regional heterogeneity’ issue.
Second, regional cooperation, including the creation of regional insti-
tutions, is a powerful force in global economics and politics — as mani-
fest in numerous agreements related to trade, technology cooperation,
transboundary agreements relating to water, energy, transport, and so
on. It is critical to examine to what extent these forms of cooperation
have already had an impact on mitigation and to what extent they
could play a role in achieving mitigation objectives [14.4]. We call this
the ‘regional cooperation and integration issue’.
Third, efforts at the regional level complement local, domestic efforts
on the one hand, and global efforts on the other hand. They offer the
potential of achieving critical mass in the size of the markets required
to make policies, for example, on border tax adjustment, work, in cre-
ating regional smart grids required to distribute and balance renew-
able energy.
FAQ 14�3 How do opportunities and barriers for
mitigation differ by region?
Opportunities and barriers for mitigation differ greatly by region. On
average, regions with the greatest opportunities to bypass more car-
bon-intensive development paths and leapfrog to low-carbon develop-
ment are regions with low lock-in, in terms of energy systems, urban-
ization, and transport patterns. Poorer developing regions such as
sub-Saharan Africa, as well as most Least Developed Countries, fall into

11241124
Regional Development and Cooperation
14
Chapter 14
this category. Also, many countries in these regions have particularly
favorable endowments for renewable energy (such as hydropower or
solar potential). At the same time, however, they are facing particularly
strong institutional, technological, and financial constraints to under-
take the necessary investments. Often these countries also lack access
to the required technologies or the ability to implement them effec-
tively. Given their urgent need to develop and improve energy access,
their opportunities to engage in mitigation will also depend on sup-
port from the international community to overcome these barriers to
invest in mitigation. Conversely, regions with the greatest technologi-
cal, financial, and capacity advantages face much-reduced opportuni-
ties for low-cost strategies to move towards low-carbon development,
as they suffer from lock-in in terms of energy systems, urbanization,
and transportation patterns. Particularly strong opportunities for low-
carbon development exist in developing and emerging regions where
financial and institutional capacities are better developed, yet lock-in
effects are low, also due to their rapid planned installation of new
capacity in energy and transport systems. For these regions, which
include particularly Latin America, much of Asia, and parts of the
Middle East, a reorientation towards low-carbon development paths is
particularly feasible. [14.1, 14.2, 14.3]
FAQ 14�4 What role can and does regional coope-
ration play to mitigate climate change?
Apart from the European Union (with its Emissions Trading Scheme and
binding regulations on energy and energy efficiency), regional coopera-
tion has, to date, not played an important role in furthering a mitiga-
tion agenda. While many regional groupings have developed initiatives
to directly promote mitigation at the regional level — primarily through
sharing of information, benchmarking, and cooperation on technology
development and diffusion — the impact of these initiatives is very small
to date. In addition, regional cooperation agreements in other areas (such
as trade, energy, and infrastructure) can influence mitigation indirectly.
The effect of these initiatives and policies on mitigation is currently also
small, but there is some evidence that trade pacts that are accompanied
by environmental agreements have had some impact on reducing emis-
sions within the trading bloc. Nonetheless, regional cooperation could
play an enhanced role in promoting mitigation in the future, particularly
if it explicitly incorporates mitigation objectives in trade, infrastructure,
and energy policies and promotes direct mitigation action at the regional
level. With this approach regional cooperation could potentially play an
important role within the framework of implementing a global agree-
ment on mitigation, or could possibly promote regionally coordinated
mitigation in the absence of such an agreement. [14.4]

11251125
Regional Development and Cooperation
14
Chapter 14
References
Abbott K� W�, and D� Snidal (2000)� Hard and Soft Law in International Governance.
International Organization 54, 421 – 456. doi: 10.1162 / 002081800551280.
Abrell J�, and H� Weigt (2008)� The Interaction of Emissions Trading and Renew-
able Energy Promotion. Social Science Research Network, Rochester, NY. Avail-
able at: http: / / papers.ssrn.com / abstract=1317310.
Aerni P�, B� Boie, T� Cottier, K� Holzer, D� Jost, B� Karapinar, S� Matteotti, O�
Nartova, T� Payosova, L� Rubini, A� Shingal, F� Temmerman, E� Xoplaki,
and S� Z� Bigdeli (2010)� Climate Change and International Law: Exploring the
Linkages between Human Rights, Environment, Trade and Investment. German
Yearbook of International Law 53, 139 – 188. Available at: http: / / papers.ssrn.
com / sol3 / papers.cfm?abstract_id=1994464.
Africa-Brazil Agricultural Innovation Marketplace (2012)� Africa-Brazil Agri-
cultural Innovation Marketplace: A Partnership between Africa and Brazilian
organizations to enhance agricultural innovation and development. Available
at: http: / / www. africa-brazil. org / about-us / general-information.
Agbemabiese L�, J� Nkomo, and Y� Sokona (2012)� Enabling innovations in
energy access: An African perspective. Energy Policy 47, Supplement 1, 38 – 47.
doi: 10.1016 / j.enpol.2012.03.051, ISBN: 0301-4215.
Akbostancı E�, G� İpek Tunç, and S� Türüt-Aşık (2008)� Environmental impact of
customs union agreement with EU on Turkey’s trade in manufacturing industry.
Applied Economics 40, 2295 – 2304. doi: 10.1080 / 00036840600949405, ISBN:
0003-6846, 1466 – 4283.
Alam Zaigham N�, Z� Alam Nayyar, and N� Hisamuddin (2009)� Review of
geothermal energy resources in Pakistan. Renewable and Sustainable Energy
Reviews 13, 223 – 232. doi: 10.1016 / j.rser.2007.07.010, ISBN: 1364-0321.
Alberola E�, and J� Chevallier (2009)� Banking and borrowing in the EU ETS: An
econometric appraisal of the 2005 – 2007 intertemporal market. International
Journal of Energy, Environment and Economics 17, 1.
Alberola E�, J� Chevallier, and B� Chèze (2008)� Price drivers and structural
breaks in European carbon prices 2005 – 2007. Energy Policy 36, 787 – 797. doi:
10.1016 / j.enpol.2007.10.029, ISBN: 0301-4215.
Aldy J� E�, S� Barrett, and R� N� Stavins (2003)� Thirteen plus one: a comparison of
global climate policy architectures. Climate Policy 3, 373 – 397. doi: 10.1016 / j.
clipol.2003.09.004, ISBN: 1469-3062.
Aldy J� E�, and R� N� Stavins (2012)� The Promise and Problems of Pricing Car-
bon Theory and Experience. The Journal of Environment & Development 21,
152 – 180. doi: 10.1177 / 1070496512442508, ISBN: 1070-4965, 1552 – 5465.
Alexeeva-Talebi V�, A� Löschel, and T� Mennel (2008)� Climate Policy and the
Problem of Competitiveness: Border Tax Adjustments or Integrated Emission
Trading? ZEW Discussion Papers. Available at: http: / / www. econstor. eu / handle /
10419 / 24757.
Alpine Convention (2009)� Alpine Convention Action Plan on Climate Change in
the Alps. Available at: http: / / www. alpconv. org / en / ClimatePortal / actionplan /
Documents / AC_X_B6_en_new_fin.pdf.
Amer M�, and T� U� Daim (2010)� Application of technology roadmaps for
renewable energy sector. Technological Forecasting and Social Change 77,
1355 – 1370. doi: 10.1016 / j.techfore.2010.05.002.
Anderson B�, and C� Di Maria (2011)� Abatement and Allocation in the Pilot Phase
of the EU ETS. Environmental and Resource Economics, 83 – 103.
Andonova L� B�, M� M� Betsill, and H� Bulkeley (2009)� Transnational Climate Gov-
ernance. Global Environmental Politics 9, 52 – 73. doi: 10.1162 / glep.2009.9.2.52,
ISBN: 1526-3800.
Andrew R� M�, and G� P� Peters (2013)� A Multi-Region Input – Output Table Based
on the Global Trade Analysis Project Database (gtap-Mrio). Economic Systems
Research 25, 99 – 121. doi: 10.1080 / 09535314.2012.761953, ISBN: 0953-5314.
Ang B� W� (2004)� Decomposition analysis for policymaking in energy — which is
the preferred method? Energy Policy 32, 1131 – 1139. doi: 10.1016 / S0301-
4215(03)00076-4.
Anger N�, B� Brouns, and J� Onigkeit (2009)� Linking the EU emissions trading
scheme: economic implications of allowance allocation and global carbon con-
straints. Mitigation and Adaptation Strategies for Global Change 14, 379 – 398.
Antweiler W�, B� R� Copeland, and M� S� Taylor (2001)� Is Free Trade Good
for the Environment? American Economic Review 91, 877 – 908. doi:
10.1257 / aer.91.4.877, ISBN: 0002-8282.
APEC H�, United States (Ed.) (2011)� Leaders’ Declaration Annex C — Trade and
Investment in Environmental Goods and Services. Available at: http: / / www.
apec. org / Meeting-Papers / Leaders-Declarations / 2011 / 2011_aelm / 2011_aelm_
annexC.aspx.
APEC Secretariat (2012)� APEC Energy Overview 2011. Available at: http: / / www.
apec. org / Groups / SOM-Steering-Committee-on-Economic-and-Technical-
Cooperation / Working-Groups / Energy.aspx.
Arasto A�, L� Kujanpää, T� Mäkinen, R� W� R� Zwart, J� H� A� Kiel, and J� Vehlow
(2012)� Analysis and implications of challenges in achieving the targets of EU
RES-E directive. Biomass and Bioenergy 38, 109 – 116. doi: 10.1016 / j.biom-
bioe.2011.02.026, ISBN: 0961-9534.
ASEAN (2010)� ASEAN plan of action for energy cooperation (APAEC) 2010 – 2015.
Bringing Policies to Actions: Towards a cleaner, more efficient and sustain-
able ASEAN energy community. ASEAN Center for Energy. Available at: http: / /
aseanenergy.org / index.php / about / apaec.
Asheim G� B�, C� B� Froyn, J� Hovi, and F� C� Menz (2006)� Regional versus global
cooperation for climate control. Journal of Environmental Economics and Man-
agement 51, 93 – 109. doi: 10.1016 / j.jeem.2005.04.004, ISSN: 00950696.
Asia-Pacific Partnership on Clean Development and Climate (2013)� Asia-
Pacific Partnership on Clean Development and Climate. Available at: http: / /
asiapacificpartnership.org / english / about.aspx#Vision.
Atteridge A�, C� Siebert, R� Klein, C� Butler, and P� Tella (2009)� Bilateral Finance
Institutions and Climate Change: A Mapping of Climate Portfolios. Stockholm
Environment Institute, Stockholm, Sweden.
Ayers J� M�, and S� Huq (2009)� The value of linking mitigation and adaptation: A
case study of Bangladesh. Environmental Management 43, 753 – 764.
Bäckstrand K� (2008)� Accountability of Networked Climate Governance: The Rise
of Transnational Climate Partnerships. Global Environmental Politics 8, 74 – 102.
doi: 10.1162 / glep.2008.8.3.74, ISBN: 1526-3800.
Baghdadi L�, I� Martinez-Zarzoso, and H� Zitouna (2013)� Are RTA agreements
with environmental provisions reducing emissions? Journal of International
Economics 90, 378 – 390. doi: 10.1016 / j.jinteco.2013.04.001, ISBN: 0022-1996.
Baiocchi G�, and J� C� Minx (2010)� Understanding Changes in the UK’s CO
2
Emissions: A Global Perspective. Environmental Science & Technology 44,
1177 – 1184. doi: 10.1021 / es902662h, ISBN: 0013-936X.
Balistreri E� J�, and T� F� Rutherford (2012)� Subglobal carbon policy and the com-
petitive selection of heterogeneous firms. Energy Economics 34, Supplement
2, S190 – S197. doi: 10.1016 / j.eneco.2012.08.002, ISBN: 0140-9883.

11261126
Regional Development and Cooperation
14
Chapter 14
Ballesteros A�, S� Nakhooda, J� Werksman, and K� Hurlburt (2010)� Power,
Responsibility, and Accountability: Re-Thinking the Legitimacy of Institutions for
Climate Finance. World Resouces Institute, Washington, D. C., 84 pp. Available
at: http: / / www. wri. org / publication / power-responsibility-and-accountability.
Balsiger J�, and B� Debarbieux (2011)� Major challenges in regional environmen-
tal governance research and practice. Procedia — Social and Behavioral Sci-
ences 14, 1 – 8. doi: 10.1016 / j.sbspro.2011.03.010, ISBN: 1877-0428.
Balsiger J�, M� Prys, and N� Steinhoff (2012)� The Nature and Role of Regional
Agreements in International Environmental Politics: Mapping Agreements, Out-
lining Future Research. SSRN eLibrary GIGA Working Paper No 208, 4 – 32.
Available at: http: / / papers.ssrn.com / sol3 / papers.cfm?abstract_id=2170324.
Balsiger J�, and S� D� VanDeveer (2010)� Regional Governance and Environmen-
tal Problems. In: The International Studies Compendium Project. R. Denemark,
(ed.), Wiley Blackwell, Oxford, pp.6179 – 6200. ISBN: 978 – 1-4051 – 5238 – 9.
Balsiger J�, and S� D� VanDeveer (2012)� Navigating Regional Environmental Gov-
ernance. Global Environmental Politics 12, 1 – 17. doi: 10.1162 / GLEP_e_00120,
ISBN: 1526-3800.
Barnes D�, and W� Floor (1996)� Rural Energy in Developing Countries: A Challenge
for Economic Development. Annual Review Energy Environment 21, 497 – 530.
Barrett J�, G� Peters, T� Wiedmann, K� Scott, M� Lenzen, K� Roelich, and C�
Le Quéré (2013)� Consumption-based GHG emission accounting: a UK case
study. Climate Policy 13, 451 – 470. doi: 10.1080 / 14693062.2013.788858,
ISBN: 1469-3062.
Bauer N�, V� Bosetti, K� Calvin, M� Hamdi-Cherif, A� Kitous, D� McCollum, A�
Méjean, S� Rao, T� Hal, L� Paroussos, S� Ashina, and D� van Vuuren (2013a)�
CO
2
emission mitigation and fossil fuel markets: Dynamic and international
aspects of climate Policies. Technological Forecasting and Social Change.
Bauer N�, I� Mouratiadou, G� Luderer, L� Baumstark, R� J� Brecha, O� Eden-
hofer, and E� Kriegler (2013b)� Global fossil energy markets and climate
change mitigation — an analysis with REMIND. Climatic Change, 1 – 14. doi:
10.1007 / s10584-013-0901-6, ISBN: 0165-0009, 1573 – 1480.
Bazilian M�, P� Nussbaumer, C� Eibs-Singer, A� Brew-Hammond, V� Modi, B�
Sovacool, V� Ramana, and P�-K� Aqrawi (2012a)� Improving Access to Mod-
ern Energy Services: Insights from Case Studies. The Electricity Journal 25,
93 – 114. doi: 10.1016 / j.tej.2012.01.007, ISBN: 1040-6190.
Bazilian M�, P� Nussbaumer, H�-H� Rogner, A� Brew-Hammond, V� Foster, S�
Pachauri, E� Williams, M� Howells, P� Niyongabo, L� Musaba, B� Ó� Gal-
lachóir, M� Radka, and D� M� Kammen (2012b)� Energy access scenarios to
2030 for the power sector in sub-Saharan Africa. Utilities Policy 20, 1 – 16. doi:
10.1016 / j.jup.2011.11.002, ISBN: 0957-1787.
Beg N�, J� C� Morlot, O� Davidson, Y� Afrane-Okesse, L� Tyani, F� Denton, Y�
Sokona, J� P� Thomas, E� L� La Rovere, J� K� Parikh, K� Parikh, and A� Atiq
Rahman (2002)� Linkages between climate change and sustainable develop-
ment. Climate Policy 2, 129 – 144. doi: 10.3763 / cpol.2002.0216.
Bento A� M�, M� L� Cropper, A� M� Mobarak, and K� Vinha (2005)� The Effects of
Urban Spatial Structure on Travel Demand in the United States. Review of Eco-
nomics and Statistics 87, 466 – 478. doi: 10.1162 / 0034653054638292, ISBN:
0034-6535.
Van den Bergh K�, E� Delarue, and W� D’haeseleer (2013)� Impact of renewables
deployment on the CO
2
price and the CO
2
emissions in the European electricity
sector. Energy Policy 63, 1021 – 1031. doi: 10.1016 / j.enpol.2013.09.003, ISBN:
0301-4215.
Bernasconi-Osterwalder N�, D� Magraw, M� J� Oliva, E� Tuerk, and M� Orellana
(2006)� Environment and Trade: A Guide to WTO Jurisprudence. Earthscan Pub-
lications, UK and US, 370 pp. ISBN: 1844072983.
Den Besten J� W�, B� Arts, and P� Verkooijen (2013)� The evolution of REDD+: An
analysis of discursive-institutional dynamics. Environmental Science & Policy.
doi: 10.1016 / j.envsci.2013.03.009, ISBN: 1462-9011.
Betsill M� M� (2007)� Regional Governance of Global Climate Change: The North
American Commission for Environmental Cooperation. Global Environmental
Politics 7, 11 – 27. doi: 10.1162 / glep.2007.7.2.11, ISBN: 1526-3800.
Betz R�, and M� Sato (2006)� Emissions trading: lessons learnt from the 1st phase
of the EU ETS and prospects for the 2nd phase. Climate Policy 6, 351 – 359.
Biermann F�, P� Pattberg, H� van Asselt, and F� Zelli (2009)� The Fragmentation
of Global Governance Architectures: A Framework for Analysis. Global Environ-
mental Politics 9, 14 – 40. doi: 10.1162 / glep.2009.9.4.14, ISBN: 1526-3800.
Blanco M� I�, and G� Rodrigues (2008)� Can the future EU ETS support wind
energy investments? Energy Policy 36, 1509 – 1520.
Blyth W�, and D� Bunn (2011)� Coevolution of policy, market and technical price
risks in the EU ETS. Energy Policy 39, 4578 – 4593.
Böhringer C�, E� J� Balistreri, and T� F� Rutherford (2012)� The role of border car-
bon adjustment in unilateral climate policy: Overview of an Energy Modeling
Forum study (EMF 29). Energy Economics 34, Supplement 2, S97 – S110. doi:
10.1016 / j.eneco.2012.10.003, ISBN: 0140-9883.
Brandi C� (2013)� Trade and Climate Change: Environmental, Economic and Ethical
Perspectives on Border Carbon Adjustments. Ethics, Policy & Environment 16,
79 – 93. doi: 10.1080 / 21550085.2013.768395, ISBN: 2155-0085.
Brandt, A� R� and G� F� Nemet (2012)� Willingness to Pay for a Climate Backstop:
Liquid Fuel Producers and Direct CO
2
Air Capture. The Energy Journal 33,
53 – 82. Available at: http: / / ideas.repec.org / a / aen / journl / 33 – 1-a03.html.
Brovkin V�, L� Boysen, V� K� Arora, J� P� Boisier, P� Cadule, L� Chini, M� Claussen,
P� Friedlingstein, V� Gayler, B� J� J� M� van den Hurk, G� C� Hurtt, C� D� Jones,
E� Kato, N� de Noblet-Ducoudré, F� Pacifico, J� Pongratz, and M� Weiss
(2013)� Effect of Anthropogenic Land-Use and Land-Cover Changes on Climate
and Land Carbon Storage in CMIP5 Projections for the Twenty-First Century.
Journal of Climate 26, 6859 – 6881. doi: 10.1175 / JCLI-D-12-00623.1, ISBN:
0894-8755, 1520 – 0442.
Brunner S�, C� Flachsland, and R� Marschinski (2012)� Credible commitment in car-
bon policy. Climate Policy 12, 255 – 271. doi: 10.1080 / 14693062.2011.582327,
ISBN: 1469-3062.
Buchner B�, A� Falconer, M� Hervé-Mignucci, C� Trabacchi, and M� Brink-
man (2011)� The Landscape of Climate Finance. Climate Policy Initiative:
Venice 27, 60. Available at: http: / / climatepolicyinitiative.org / wp-content /
uploads / 2011 / 10 / The-Landscape-of-Climate-Finance-120120.pdf.
Burke P� J� (2010)� Income, resources, and electricity mix. Energy Economics 32,
616 – 626. doi: 10.1016 / j.eneco.2010.01.012, ISBN: 0140-9883.
Burton I�, L� Bizikova, T� Dickinson, and Y� Howard (2007)� Integrating adap-
tation into policy: upscaling evidence from local to global. Climate Policy 7,
371 – 376.
Cabalu H�, C� Alfonso, and C� Manuhutu (2010)� The role of regional cooperation
in energy security: the case of the ASEAN+3. International Journal of Global
Energy Issues 33, 56 – 72. ISBN: 0954-7118.

11271127
Regional Development and Cooperation
14
Chapter 14
Capros P�, L� Mantzos, N� Tasios, A� De Vita, and N� Kouvaritakis (2010)� EU
Energy Trends to 2030 — Update 2009. Institute of Communication and Com-
puter Systems of the National Technical University of Athens (ICCS-NTUA),
E3M-Lab. 180 pp. Available at: http: / / ec.europa.eu / energy / observatory /
trends_2030 / index_en.htm.
Carbon Trust (2008)� Low Carbon Technology Innovation and Diffusion Centres.
Carbon Trust, UK.
Cardoso Marques A� C�, and J� A� Fuinhas (2012)� Are public policies towards
renewables successful? Evidence from European countries. Renewable Energy
44, 109 – 118. doi: 10.1016 / j.renene.2012.01.007, ISBN: 0960-1481.
Caribbean Community Climate Change Center (2012)� Caribbean Community
Climate Change Centre. Available at: http: / / www. caribbeanclimate. bz / .
Carrapatoso A� F� (2008)� Environmental aspects in free trade agreements in the
Asia-Pacific region. Asia Europe Journal 6, 229 – 243.
Castro P�, and A� Michaelowa (2010)� The impact of discounting emission credits
on the competitiveness of different CDM host countries. Ecological Economics
70, 34 – 42. doi: 10.1016 / j.ecolecon.2010.03.022, ISBN: 0921-8009.
Cerbu G� A�, B� M� Swallow, and D� Y� Thompson (2011)� Locating REDD: A global
survey and analysis of REDD readiness and demonstration activities. Envi-
ronmental Science & Policy 14, 168 – 180. doi: 16 / j.envsci.2010.09.007, ISBN:
1462-9011.
Charles D� R�, C� Nauwelaers, B� Mouton, and D� Bradley (2000)� Assessment
of the Regional Innovation and Technology Transfer Strategies and Infrastruc-
tures (RITTS) Scheme. Centre for Urban and Regional Development Studies Uni-
versity of Newcastle. Available at: ftp: / / ftp. cordis. europa. eu / pub / innovation-
policy / studies / studies_regional_technology_transfer_strategies.pdf.
Chaurey A�, P� R� Krithika, D� Palit, S� Rakesh, and B� K� Sovacool (2012)� New
partnerships and business models for facilitating energy access. Energy Policy
47, Supplement 1, 48 – 55. doi: 10.1016 / j.enpol.2012.03.031, ISBN: 0301-
4215.
Cherp A�, J� Jewell, V� Vadim, N� Bauer, and E� De Cian (2013)� Global Energy
Security Under Different Climate Policies, GDP Growth Rates and Fossil
Resource Availabilities. Climatic Change 121, 1 – 12. doi: 10.1007 / s10584-013-
0950-x.
Chevallier J� (2010)� EUAs and CERs: Vector autoregression, impulse response
function and cointegration analysis. Economics Bulletin 30, 558.
De Cian E�, I� Keppo, J� Bollen, S� Carrara, H� Förster, M� Hübler, A� Kanudia,
S� Paltsev, R� Sands, and K� Schumacher (2013)� European-led climate
policy versus global mitigation action — Implications on trade, technology, and
energy. Climate Change Economics 4, 1 – 28.
Clarke L�, J� Edmonds, V� Krey, R� Richels, S� Rose, and M� Tavoni (2009)� Inter-
national climate policy architectures: Overview of the EMF 22 International
Scenarios. Energy Economics 31, Supplement 2, S64 – S81. doi: 10.1016 / j.
eneco.2009.10.013, ISBN: 0140-9883.
Clean Energy Ministerial (2012)� Clean Energy Ministerial Website. Available at:
http: / / www. cleanenergyministerial. org / about / index.html.
Climate Funds Update (2013)� Graphs and statistics. Available at: http: / / www.
climatefundsupdate. org / listing / global-climate-change-allianc#TOC-Graphs-
and-statistics.
Clò S�, S� Battles, and P� Zoppoli (2013)� Policy options to improve the effec-
tiveness of the EU emissions trading systems: A mulit-criteria analysis. Energy
Policy 57, 477 – 490.
Cochran J�, L� Bird, J� Heeter, and D� J� Arent (2012)� Integrating Variable Renewable
Energy in Electric Power Markets: Best Practices from International Experience,
Summary for Policymakers. US National Renewable Energy Laboratory (NREL),
Washington D. C., 16 pp. Available at: http: / / www. nrel. gov / docs / fy12osti /
53730.pdf.
Cochran J�, S� Cox, R� Benioff, H� de Coninck, and L� Würtenberger (2010)� An
exploration of options and functions of climate technology centers and net-
works. United Nations Environment Programme.
COGEN3 (2005)� COGEN Experience Overview. Available at: http: / / cogen3.
net / final / .
Cole M� A�, and E� Neumayer (2004)� Examining the Impact of Demographic Fac-
tors on Air Pollution. Population and Environment 26, 5 – 21. doi: 10.1023 / B:PO
EN.0000039950.85422.eb, ISBN: 0199-0039.
Collier P�, and A� J� Venables (2012a)� Greening Africa? Technologies, endow-
ments and the latecomer effect. Available at: http: / / www. csae. ox. ac. uk /
workingpapers / pdfs / csae-wps-2012 – 06.pdf.
Collier P�, and A� J� Venables (2012b)� Greening Africa? Technologies, endowments
and the latecomer effect. Energy Economics 34, Supplement 1, 75 – S84. doi:
10.1016 / j.eneco.2012.08.035, ISBN: 0140-9883.
De Coninck H�, C� Fischer, R� G� Newell, and T� Ueno (2008)� International
technology-oriented agreements to address climate change. Energy Policy 36,
335 – 356. doi: 10.1016 / j.enpol.2007.09.030, ISBN: 0301-4215.
Conrad C� R� (2011)� Processes and Production Methods (PPMs) in WTO Law:
Interfacing Trade and Social Costs. Cambridge University Press, 564 pp. ISBN:
9781107008120.
Convery F� J� (2009a)� Reflections — The emerging literature on emissions trading
in Europe. Review of Environmental Economics and Policy 3, 121.
Convery F� J� (2009b)� Origins and Development of the EU ETS. Environmental and
Resource Economics 43, 391 – 412.
Cooper P� J� M�, J� Dimes, K� P� C� Rao, B� Shapiro, B� Shiferaw, and S� Twomlow
(2008)� Coping better with current climatic variability in the rain-fed farming
systems of sub-Saharan Africa: An essential first step in adapting to future
climate change? Agriculture, Ecosystems & Environment 126, 24 – 35. doi:
10.1016 / j.agee.2008.01.007, ISBN: 0167-8809.
Cosbey A� (2004)� The Rush to Regionalism: Sustainable Development and
Regional / Bilateral Approaches to Trade and Investment Liberalization. Interna-
tional Institute for Sustainable Development, Manitoba, Canada, 49 pp. Avail-
able at: http: / / www. iisd. org / pdf / 2005 / trade_rush_region.pdf.
Cottier T�, and M� Foltea (2006)� Constitutional Functions of the WTO and
Regional Trade Agreements. In: Regional Trade Agreements and the WTO Legal
System. L. Bartels, F. Ortino, (eds.), Oxford University Press, pp.43 – 76. ISBN:
9780199206995.
Cottier T�, O� Nartova, and S� Z� Bigdeli (2009)� International Trade Regulation
and the Mitigation of Climate Change: World Trade Forum. Cambridge Univer-
sity Press, 456 pp. ISBN: 9780521766197.
Criqui P�, and S� Mima (2012)� European climate — energy security nexus: A
model based scenario analysis. Energy Policy 41, 827 – 842. doi: 10.1016 / j.
enpol.2011.11.061, ISBN: 0301-4215.
Curran L� (2009)� Carbon Taxing Imports — Can the North Reduce Global Warm-
ing While Avoiding Negative Economic Implications for the South? Social Sci-
ence Research Network, Rochester, NY, 18 pp. Available at: http: / / papers.ssrn.
com / abstract=1425421.

11281128
Regional Development and Cooperation
14
Chapter 14
D’Costa A� P� (1994)� State, steel and strength: Structural competitiveness and
development in South Korea. Journal of Development Studies 31, 44 – 81. doi:
10.1080 / 00220389408422348, ISBN: 0022-0388.
Dantas E� (2011)� The evolution of the knowledge accumulation function in the
formation of the Brazilian biofuels innovation system. International Journal of
Technology and Globalisation 5, 327 – 340. Available at: http: / / inderscience.
metapress.com / index / U741552T0333P561.pdf.
Dasappa S� (2011)� Potential of biomass energy for electricity generation in
sub-Saharan Africa. Energy for Sustainable Development 15, 203 – 213. doi:
10.1016 / j.esd.2011.07.006, ISBN: 0973-0826.
Davis S� J�, and K� Caldeira (2010)� Consumption-based accounting of CO
2
emis-
sions. Proceedings of the National Academy of Sciences 107, 5687 – 5692. doi:
10.1073 / pnas.0906974107.
Davison R�, D� Vogel, R� Harris, and N� Jones (2000)� Technology leapfrogging in
developing countries — An inevitable luxury? The Electronic Journal on Infor-
mation Systems in Developing Countries 1, 1 – 10.
Dechezleprêtre A�, M� Glachant, and Y� Ménière (2013)� What Drives the Inter-
national Transfer of Climate Change Mitigation Technologies? Empirical Evi-
dence from Patent Data. Environmental and Resource Economics 54, 161 – 178.
doi: 10.1007 / s10640-012-9592-0, ISBN: 0924-6460, 1573 – 1502.
Demailly D�, and P� Quirion (2006)� CO
2
abatement, competitiveness and leak-
age in the European cement industry under the EU ETS: grandfathering versus
output-based allocation. Climate Policy 6, 93 – 113.
Demailly D�, and P� Quirion (2008)� European Emission Trading Scheme and com-
petitiveness: A case study on the iron and steel industry. Energy Economics 30,
2009 – 2027.
Van Deveer S� D� (2011)� Networked Baltic Environmental Cooperation. Journal of
Baltic Studies 42, 37 – 55. doi: 10.1080 / 01629778.2011.538516, ISBN: 0162-
9778.
Dietzenbacher E�, J� Pei, and C� Yang (2012)� Trade, production fragmentation,
and China’s carbon dioxide emissions. Journal of Environmental Econom-
ics and Management 64, 88 – 101. Available at: http: / / ideas.repec.org / a / eee /
jeeman / v64y2012i1p88 – 101.html.
Dixon R� K�, R� M� Scheer, and G� T� Williams (2010)� Sustainable energy invest-
ments: contributions of the Global Environment Facility. Mitigation and Adap-
tation Strategies for Global Change 16, 83 – 102. doi: 10.1007 / s11027-010-
9253-y, ISBN: 1381-2386, 1573 – 1596.
Doig A�, and M� Adow (2011)� Low-Carbon Africa: Leapfrogging to a Green Future.
Christian Aid. Available at: http: / / www. christianaid. org. uk / resources / policy /
climate / low-carbon-africa.aspx.
Dong Y�, and J� Whalley (2010)� Carbon, Trade Policy and Carbon Free Trade Areas.
The World Economy 33, 1073 – 1094. doi: 10.1111 / j.1467-9701.2010.01272.x,
ISBN: 1467-9701.
Dong Y�, and J� Whalley (2011)� Carbon motivated regional trade arrangements:
Analytics and simulations. Economic Modelling 28, 2783 – 2792. doi: 10.1016 / j.
econmod.2011.08.016, ISBN: 0264-9993.
Dupuy P�-M� (1990)� Soft law and the international law of the environment. Michi-
gan Journal of International Law 12, 420 – 435.
Easterly W� (1999)� Life During Growth. Journal of Economic Growth 4, 239 – 276.
doi: 10.1023 / A:1009882702130, ISBN: 1381-4338.
Eberhard A�, O� Rosnes, M� Shkaratan, and H� Vennemo (2011)� Africa’s Power
Infrastructure: Investment, Integration, Efficiency. World Bank Publications,
Washington, D. C., 352 pp. ISBN: 9780821384558.
ECCJ / AEEC (2011)� Asia Energy Efficiency and Conservation Collaboration Center.
Available at: http: / / www. asiaeec-col. eccj. or. jp / .
Economic Consulting Associates (ECA) (2009)� The Potential of Regional
Power Sector Integration — South African Power Pool (SAPP) — Transmission
& Trading Case Study. London, UK, 49 pp. Available at: http: / / www. esmap.
org / sites / esmap.org / files / BN004 – 10_REISP-CD_South%20African%20
Power%20Pool-Transmission%20&%20Trading.pdf.
ECOSOC (2008)� Trends in South-South and Triangular Cooperation: Background
Study for the Development Cooperation Forum. United Nations Economic and
Social Council, 58 pp.
ECOWAS (2003)� ECOWAS Energy Protocol A / P4 / 1 / 03. Economic Commission of
West African States (ECOWAS), 79 pp. Available at: http: / / www. comm. ecowas.
int / sec / en / protocoles / WA_EC_Protocol_English-_DEFINITIF.pdf.
ECOWAS (2006)� Regional Initiatives to Scale up Energy Access for Economic
and Human Development Sharing Lessons Learned: The Case of the ECOWAS.
Economic Commission of West African States (ECOWAS), 13 pp. Available at:
http: / / www. gfse. at / fileadmin / files / Archive / GFSE_6 / CEDEAO_Briefing_paper_
for_GFSE_final.pdf.
ECPA (2012)� Energy and Climate Partnership of the Americas Website. Available at:
http: / / ecpamericas.org / .
ECREEE (2012a)� The ECOWAS Energy Efficiency Policy (EEEP). ECOWAS Regional
Centre for Renewable Energy and Energy Efficiency, Praia, Cape Verde, 56 pp.
ECREEE (2012b)� The ECOWAS Renewable Energy Policy (EREP). ECOWAS Regional
Centre for Renewable Energy and Energy Efficiency, Praia, Cape Verde, 92 pp.
Van Edig A�, N� van de Giesen, M� Andreini, and W� Laube (2001)� Transbound-
ary, institutional, and legal aspects of the Water Resources Commission in
Ghana in: IHP / OHP Nationalkommittee. Hydrological Challenges in Transbound-
ary Water Resources Management Sonderheft 12, 391 – 400. Available at:
http: / / www. glowa. org / de / literaturliste / dateien / aspects_of_wrc_in_ghana.pdf.
EIHP (2007)� Report on the Implementation of the Acquis on Renewables in the
Energy Community Contracting Parties. Energy Institute Hrvoje Pozar, Zagreb,
Croatia, 1 – 143 pp.
Ellerman A� D�, and B� K� Buchner (2008)� Over-allocation or abatement? A pre-
liminary analysis of the EU ETS based on the 2005 – 06 emissions data. Environ-
mental and Resource Economics 41, 267 – 287.
Elliott L�, and Breslin (Eds.) (2011)� Comparative Environmental Region-
alism. Routledge, London. Available at: http: / / www. routledge.
com / books / details / 9780415611435 / .
Energy Community (2005)� Treaty establishing the Energy Community. Avail-
able at: http: / / www. energy-community. org / portal / page / portal / ENC_
HOME / ENERGY_COMMUNITY / Legal / Treaty.
Energy Community (2008)� Report on Renewable Energy Sources — Implementa-
tion of the Acquis under the Energy Community Treaty — State of Play. Available
at: http: / / www. energy-community. org / pls / portal / docs / 103814.PDF.
Energy Community (2010)� Annual Report on the Implementation of the Acquis
under the Treaty Establishing the Energy Community. Energy Community Sec-
retariat, Vienna, Austria, 7 pp. Available at: http: / / www. energy-community.
org / pls / portal / docs / 722178.PDF.
Energy Community (2012)� Decision on the Implementation of Directive
2009 / 28 / EC and Amending Article 20 of the Energy Community Treaty. Avail-
able at: http: / / www. energy-community. org / pls / portal / docs / 1766219.PDF.

11291129
Regional Development and Cooperation
14
Chapter 14
Engels A� (2009)� The European Emissions Trading Scheme: An exploratory study
of how companies learn to account for carbon. Accounting, Organizations and
Society 34, 488 – 498. doi: 10.1016 / j.aos.2008.08.005, ISBN: 0361-3682.
Engels A�, L� Knoll, and M� Huth (2008)� Preparing for the “real”market: national
patterns of institutional learning and company behaviour in the European Emis-
sions Trading Scheme (EU ETS). European Environment 18, 276 – 297.
European Commission (1992)� Council Directive 92 / 75 / EEC Od 22 September
1992 on the Indication by Labelling and Standard Product Information of the
Consumption of Energy and Other Resources by Household Appliances. Avail-
able at: http: / / eur-lex.europa.eu / LexUriServ / LexUriServ.do?uri=CELEX:31992L
0075:en:HTML.
European Commission (2001)� Directive 2001 / 77 / EC of the European Parlia-
ment and of the Council of 27 September 2001 on the Promotion of Electricity
from Renewable Energy Sources in the Internal Electricity Market. Available at:
http: / / eur-lex.europa.eu / LexUriServ / LexUriServ.do?uri=OJ:L:2001:283:0033:00
40:EN:PDF.
European Commission (2003)� Directive 2003 / 30 / EC of the European Parliament
and of the Council of 8 May 2003 on the Promotion of the Use of Biofuels
or Other Renewable Fuels for Transport. Available at: http: / / eur-lex.europa.
eu / LexUriServ / LexUriServ.do?uri=OJ:L:2003:123:0042:0042:EN:PDF.
European Commission (2008)� 20 20 by 2020. Europe’s Climate Change Oppor-
tunity. European Commission, Brussels. Available at: http: / / eur-lex.europa.
eu / LexUriServ / LexUriServ.do?uri=COM:2008:0030:FIN:EN:PDF.
European Commission (2009a)� Directive 2009 / 31 / EC of the European Parlia-
ment and of the Council of 23 April 2009 on the geological storage of car-
bon dioxide. Available at: http: / / eur-lex.europa.eu / LexUriServ / LexUriServ.
do?uri=CELEX:32009L0031:EN:NOT.
European Commission (2009b)� Directive 2009 / 28 / EC of the European Parlia-
ment and of the Council of 23 April 2009 on the promotion of the use of energy
from renewable sources. Available at: http: / / eur-lex.europa.eu / LexUriServ /
LexUriServ.do?uri=CELEX:32009L0028:EN:NOT.
European Commission (2010)� Directive 2010 / 30 / EU of the European Parliament
and of the Council of 19 May 2010 on the Indication by Labelling and Stan-
dard Product Information of the Consumption of Energy and Other Resources
by Energy-Related Products. Available at: http: / / eur-lex.europa.eu / LexUriServ /
LexUriServ.do?uri=OJ:L:2010:153:0001:0012:EN:PDF.
European Commission (2011a)� SETatWork. Available at: http: / / setatwork.
eu / index.htm.
European Commission (2011b)� Accompanying the Document REPORT FROM THE
COMMISSION TO THE EUROPEAN PARLIAMENT AND THE COUNCIL PROGRESS
TOWARDS ACHIEVING THE KYOTO OBJECTIVES (required under Article 5 of
Decision 280 / 2004 / EC of the European Parliament and of the Council Concern-
ing a Mechanism for Monitoring Community Greenhouse Gas Emissions and
for Implementing the Kyoto Protocol. Brussels, 26 pp. Available at: http: / / ec.
europa.eu / clima / policies / g-gas / docs / sec_2011_1151_en.pdf.
European Commission (2013a)� Energy Efficiency and the ETS Study. Director-
ate-General for Internal Policies, Policy Department A: Economic and Scien-
tific Policy, Brussels, Belgium. Available at: http: / / www. europarl. europa. eu /
committees / fr / studiesdownload.html?languageDocument=EN&file=83590.
European Commission (2013b)� A 2030 Framework for Climate and Energy Poli-
cies (Green Paper). European Commission, Brussels, Belgium, 16 pp. Available at:
http: / / eur-lex.europa.eu / LexUriServ / LexUriServ.do?uri=COM:2013:0169:FIN:
EN:PDF.
European Commission (2013c)� Report from the Commission to the Euro-
pean Parliament, the Council, the European Economic and Social Commit-
tee and the Committee of the Regions — Renewable Energy Progress Report.
Brussels, Belgium, 15 pp. Available at: http: / / ec.europa.eu / energy / renew-
ables / reports / doc / com_2013_0175_res_en.pdf.
European Union (2011)� The Africa-European Union Strategic Partnership, Meet-
ing Current and Future Challenges together. Luxembourg Publications. Office of
the European Union. Available at: ISBN-978 – 92 – 824 – 2924doi:10.2860 / 76071.
Fang Y�, and W� Deng (2011)� The critical scale and section management of cas-
cade hydropower exploitation in Southwestern China. Energy 36, 5944 – 5953.
doi: 10.1016 / j.energy.2011.08.022, ISBN: 0360-5442.
Fankhauser S�, C� Hepburn, and J� Park (2010)� Combining multiple climate pol-
icy instruments: How not to do it. Climate Change Economics 01, 209 – 225. doi:
10.1142 / S2010007810000169, ISBN: 2010-0078, 2010 – 0086.
Fankhauser S�, F� Sehlleier, and N� Stern (2008)� Climate change, innovation and
jobs. Climate Policy 8, 421 – 429.
FAOSTAT (2013)� FAOSTAT database. Food and Agriculture Organization of the
United Nations. Available at: http: / / faostat.fao.org / .
Fay M�, and C� Opal (2000)� Urbanization Without Growth: A Not So Uncommon
Phenomenon. World Bank Publications, 30 pp.
Feng K�, K� Hubacek, and D� Guan (2009)� Lifestyles, technology and CO
2
emis-
sions in China: A regional comparative analysis. Ecological Economics 69,
145 – 154. Available at: http: / / ideas.repec.org / a / eee / ecolec / v69y2009i1p145 –
154.html.
Flachsland C�, R� Marschinski, and O� Edenhofer (2009)� Global trading versus
linking: Architectures for international emissions trading. Energy Policy 37,
1637 – 1647. doi: 10.1016 / j.enpol.2008.12.008, ISBN: 0301-4215.
Frankel J� A�, and A� K� Rose (2005)� Is Trade Good or Bad for the Environment?
Sorting Out the Causality. Review of Economics and Statistics 87, 85 – 91. doi:
10.1162 / 0034653053327577, ISBN: 0034-6535.
Frondel M�, N� Ritter, C� M� Schmidt, and C� Vance (2010)� Economic impacts
from the promotion of renewable energy technologies: The German experience.
Energy Policy 38, 4048 – 4056. doi: 10.1016 / j.enpol.2010.03.029, ISBN: 0301-
4215.
Fujiwara N� (2012)� Sector-Specific Activities as the Driving Force towards a Low-
Carbon Economy: From the Asia-Pacific Partnership to a Global Partnership.
CEPS, Brussles, 12 pp.
Fujiwara N�, and C� Egenhofer (2007)� Do regional integration approaches hold
lessons for climate change regime formation? The case of differentiated inte-
gration in Europe. In: Climate and Trade Policy: Bottom-up Approaches Towards
Global Agreement. Edward Elgar, pp.42 – 69. ISBN: 1847202276.
Van der Gaast W�, K� Begg, and A� Flamos (2009)� Promoting sustainable energy
technology transfers to developing countries through the CDM. Applied Energy
86, 230 – 236. doi: 10.1016 / j.apenergy.2008.03.009, ISBN: 0306-2619.
Gallagher K� S� (2006)� Limits to Leapfrogging in Energy Technologies: Evidence
from the Chinese Automobile Industry. Energy Policy 34, 383 – 394.
Gan J�, and C� T� Smith (2011)� Drivers for renewable energy: A comparison among
OECD countries. Biomass and Bioenergy 35, 4497 – 4503. doi: 10.1016 / j.biom-
bioe.2011.03.022, ISBN: 0961-9534.

11301130
Regional Development and Cooperation
14
Chapter 14
Geller H� (2006)� Minimum Efficiency Performance Standards, Labels, and Test Proce-
dures for Refrigerators, Freezers, and Room Air Conditioners in Canada, México,
the United States, China, and Other Developing and Transition Nations. Collab-
orative Labeling and Appliance Standards Program (CLASP), 19 pp. Available
at: http: / / www. clasponline. org / en / Resources / Resources / StandardsLabeling
ResourceLibrary / 2006 / ~ / media / Files / SLDocuments / 2006 – 2011 / 2006 – 07_
MEPSLabelTestProcedureForRefrigeratorsAndFreezers.pdf.
Ghosh M�, D� Luo, M� S� Siddiqui, and Y� Zhu (2012)� Border tax adjustments in the
climate policy context: CO
2
versus broad-based GHG emission targeting. Energy
Economics 34, Supplement 2, S154 – S167. doi: 10.1016 / j.eneco.2012.09.005,
ISBN: 0140-9883.
Ghosh S�, and S� Yamarik (2006)� Do Regional Trading Arrangements Harm the
Environment? An Analysis of 162 Countries in 1990. Applied Econometrics
and International Development 6, 15 – 36. Available at: http: / / papers.ssrn.
com / sol3 / papers.cfm?abstract_id=1241702.
Glaeser E� L�, and M� E� Kahn (2010)� The greenness of cities: Carbon dioxide emis-
sions and urban development. Journal of Urban Economics 67, 404 – 418. doi:
10.1016 / j.jue.2009.11.006, ISBN: 0094-1190.
Gökçek M�, and M� S� Genç (2009)� Evaluation of electricity generation and
energy cost of wind energy conversion systems (WECSs) in Central Turkey.
Applied Energy 86, 2731 – 2739. doi: 10.1016 / j.apenergy.2009.03.025, ISBN:
0306-2619.
Goldemberg J� (1998)� Leapfrog Energy Technologies. Energy Policy 26, 729 – 741.
González-Zeas D�, S� Quiroga, A� Iglesias, and L� Garrote (2012)� Look-
ing beyond the average agricultural impacts in defining adaptation needs in
Europe. Regional Environmental Change, 1 – 11. doi: 10.1007 / s10113-012-
0388-0, ISBN: 1436-3798, 1436 – 378X.
Grimm M�, K� Harttgen, S� Klasen, and M� Misselhorn (2008)� A Human Devel-
opment Index by Income Groups. World Development 36, 2527 – 2546. doi:
10.1016 / j.worlddev.2007.12.001, ISBN: 0305-750X.
Grubb M�, and K� Neuhoff (2006)� Allocation and competitiveness in the EU emis-
sions trading scheme: policy overview. Climate Policy 6, 7 – 30.
Grübler A�, X� Bai, T� Buettner, S� Dhakal, D� J� Fisk, T� Ichinose, J� E� Keirstead,
G� Sammer, D� Satterthwaite, N� B� Schulz, N� Shah, J� Steinberger, and
H� Weisz (2012)� Urban energy systems — Chapter 18. In: The Global Energy
Assessment — Toward a Sustainable Future. GEA Writing Team, (ed.), Cam-
bridge University Press, Cambridge, UK and New York, NY, USA and the Inter-
national Institute for Applied Systems Analysis, Vienna, Austria, pp.1307 – 1400.
ISBN: ISBN 9781107005198 Hardback, ISBN 9780521182935 Paperback.
Grübler A�, and D� Fisk (2012)� Energizing Sustainable Cities: Assessing Urban
Energy. Routledge, London, UK, 232 pp. ISBN: 9781136273629.
Grübler A�, B� O’Neill, K� Riahi, V� Chirkov, A� Goujon, P� Kolp, I� Prommer, S�
Scherbov, and E� Slentoe (2007)� Regional, national, and spatially explicit
scenarios of demographic and economic change based on SRES. Techno-
logical Forecasting and Social Change 74, 980 – 1029. doi: 10.1016 / j.tech-
fore.2006.05.023, ISBN: 0040-1625.
Grumbine R� E�, J� Dore, and J� Xu (2012)� Mekong hydropower: drivers of change
and governance challenges. Frontiers in Ecology and the Environment 10,
91 – 98. doi: 10.1890 / 110146, ISBN: 1540-9295.
Grunewald N�, I� Butzlaff, and S� Klasen (2013)� Regional Agreements to Address
Climate Change: Scope, Promise, Funding, and Impacts. Courant Research Cen-
tre, Discussion Papers 152, 26.
Guan D�, K� Hubacek, C� L� Weber, G� P� Peters, and D� M� Reiner (2008)� The driv-
ers of Chinese CO
2
emissions from 1980 to 2030. Global Environmental Change
18, 626 – 634. doi: 16 / j.gloenvcha.2008.08.001, ISBN: 0959-3780.
Guan D�, G� P� Peters, C� L� Weber, and K� Hubacek (2009)� Journey to world top
emitter: An analysis of the driving forces of China’s recent CO
2
emissions surge.
Geophysical Research Letters 36, L04709. doi: 10.1029 / 2008GL036540, ISBN:
0094-8276.
Guzović Z�, D� Lončar, and N� Ferdelji (2010)� Possibilities of electricity genera-
tion in the Republic of Croatia by means of geothermal energy. Energy 35,
3429 – 3440. doi: 10.1016 / j.energy.2010.04.036, ISBN: 0360-5442.
Haas R�, J� M� Glachant, N� Keseric, and Y� Perez (2006)� Competition in the
continental European electricity market: despair or work in progress? Elsevier
Global Energy Policy and Economics Series. In: Electricity Market Reform An
International Perspective. Elsevier Ltd, pp.265 – 311. ISBN: 978 – 0080450308.
Haas R�, C� Panzer, G� Resch, M� Ragwitz, G� Reece, and A� Held (2011)� A his-
torical review of promotion strategies for electricity from renewable energy
sources in EU countries. Renewable and Sustainable Energy Reviews 15,
1003 – 1034. doi: 10.1016 / j.rser.2010.11.015, ISBN: 1364-0321.
Haddad L�, M� T� Ruel, and J� L� Garrett (1999)� Are Urban Poverty and Under-
nutrition Growing? Some Newly Assembled Evidence. World Development 27,
1891 – 1904. doi: 10.1016 / S0305-750X(99)00093-5, ISBN: 0305-750X.
Hailu Y� G� (2012)� Measuring and monitoring energy access: Decision-support
tools for policymakers in Africa. Energy Policy 47, Supplement 1, 56 – 63. doi:
10.1016 / j.enpol.2012.03.065, ISBN: 0301-4215.
Harmelink M�, M� Voogt, and C� Cremer (2006)� Analysing the effective-
ness of renewable energy supporting policies in the European Union. Energy
Policy 34, 343 – 351. Available at: http: / / ideas.repec.org / a / eee / enepol /
v34y2006i3p343 – 351.html.
Harttgen K�, and S� Klasen (2011)� A Human Development Index by Internal
Migrational Status. Journal of Human Development and Capabilities 12,
393 – 424. Available at: http: / / ideas.repec.org / a / taf / jhudca / v12y2011i3p393 –
424.html.
Haurie A�, and M� Vielle (2011)� A Metamodel of the Oil Game under Climate
Treaties. INFOR: Information Systems and Operational Research 48, 215 – 228.
doi: 10.3138 / infor.48.4.215.
Hayashi D�, N� Müller, S� Feige, and A� Michaelowa (2010)� Towards a More
Standardised Approach to Baselines and Additionality under the CDM. UK
Department for International Development, Zurich, Switzerland, 174 pp. Avail-
able at: http: / / r4d.dfid.gov.uk / Output / 188945 / .
Heggelund G�, and I� Buan (2009)� China in the Asia – Pacific Partnership: conse-
quences for UN climate change mitigation efforts? International Environmental
Agreements: Politics, Law and Economics 9, 301 – 317. doi: 10.1007 / s10784-
009-9099-5, ISBN: 1567-9764.
Held A�, R� Haas, and M� Ragwitz (2006)� On the success of policy strategies for
the promotion of electricity from renewable energy sources in the EU. Energy
and Environment 17, 849 – 868. ISBN: 0958-305X.
Hepbasli A�, and L� Ozgener (2004)� Development of geothermal energy uti-
lization in Turkey: a review. Renewable and Sustainable Energy Reviews 8,
433 – 460. doi: 10.1016 / j.rser.2003.12.004, ISBN: 1364-0321.
Hepburn C�, M� Grubb, K� Neuhoff, F� Matthes, and M� Tse (2006)� Auctioning of
EU ETS phase II allowances: how and why. Climate Policy 6, 137 – 160.
Heptonstall P� (2007)� A review of electricity unit cost estimates. UK Energy
Research Centre Working Paper.

11311131
Regional Development and Cooperation
14
Chapter 14
Hiemstra-van der Horst G�, and A� J� Hovorka (2009)� Fuelwood: The “other”
renewable energy source for Africa? Biomass and Bioenergy 33, 1605 – 1616.
doi: 10.1016 / j.biombioe.2009.08.007, ISBN: 0961-9534.
Hintermann B� (2010)� Allowance price drivers in the first phase of the EU ETS.
Journal of Environmental Economics and Management 59, 43 – 56.
Holmes P�, T� Reilly, and J� Rollo (2011)� Border carbon adjustments
and the potential for protectionism. Climate Policy 11, 883 – 900. doi:
10.3763 / cpol.2009.0071, ISBN: 1469-3062.
Holzer K� (2010)� Proposals on carbon-related border adjustments: Prospects for
WTO Compliance. Carbon and Climate Law Review 1, 51 – 64.
Holzer K�, and N� Shariff (2012)� The Inclusion of Border Carbon Adjustments in
Preferential Trade Agreements: Policy Implications. Carbon and Climate Law
Review, 246 – 260.
Homma T�, K� Akimoto, and T� Tomoda (2012)� Quantitative evaluation of time-
series GHG emissions by sector and region using consumption-based account-
ing. Energy Policy 51, 816 – 827. doi: 10.1016 / j.enpol.2012.09.031, ISBN: 0301-
4215.
Horn H�, P� C� Mavroidis, and A� Sapir (2010)� Beyond the WTO? An Anatomy of
EU and US Preferential Trade Agreements. The World Economy 33, 1565 – 1588.
doi: 10.1111 / j.1467-9701.2010.01273.x, ISBN: 1467-9701.
Houghton R� A� (2003)� Revised estimates of the annual net flux of carbon to the
atmosphere from changes in land use and land management 1850 – 2000. Tel-
lus B 55, 378 – 390. doi: 10.1034 / j.1600-0889.2003.01450.x, ISBN: 1600-0889.
Houghton R� (2012)� Carbon emissions and the drivers of deforestation and forest
degradation in the tropics. Current Opinion in Environmental Sustainability 4,
597 – 603. doi: 10.1016 / j.cosust.2012.06.006, ISBN: 1877-3435.
Hubacek K�, D� Guan, J� Barrett, and T� Wiedmann (2009)� Environmental impli-
cations of urbanization and lifestyle change in China: Ecological and Water
Footprints. Journal of Cleaner Production 17, 1241 – 1248. doi: 10.1016 / j.
jclepro.2009.03.011, ISBN: 0959-6526.
Hubacek K�, D� Guan, and A� Barua (2007)� Changing lifestyles and consump-
tion patterns in developing countries: A scenario analysis for China and India.
Futures 39, 1084 – 1096. doi: 10.1016 / j.futures.2007.03.010, ISSN: 00163287.
Hufbauer G� C�, S� Chamowitz, and J� Kim (2010)� Global Warming
and the World Trading System. World Trade Review 9, 282 – 285. doi:
10.1017 / S1474745609990218.
Hurtt G�, L� Chini, S� Frolking, R� Betts, J� Feddema, G� Fischer, J� Fisk, K� Hib-
bard, R� Houghton, A� Janetos, C� Jones, G� Kindermann, T� Kinoshita,
K� K� Goldewijk, K� Riahi, E� Shevliakova, S� Smith, E� Stehfest, A�
Thomson, P� Thornton, D� Vuuren, and Y� Wang (2011)� Harmonization of
land-use scenarios for the period 1500 – 2100: 600 years of global gridded
annual land-use transitions, wood harvest, and resulting secondary lands.
Climatic Change 109, 117 – 161. Available at: http: / / ideas.repec.org / a / spr /
climat / v109y2011i1p117 – 161.html.
ICA I� C� for A� (2011)� Regional Power Status in African Power Pools. African Devel-
opment Bank, Tunis Belvédère, Tunisia, 120 pp. Available at: http: / / www. icafrica.
org / fileadmin / documents / Knowledge / Energy / ICA_RegionalPowerPools_
Report.pdf.
IEA (2008)� Energy in the Western Balkans. The Path to Reform and Reconstruction.
IEA Publications, Paris, France, 416 pp. ISBN: 978-92-64-04218-6.
IEA (2009)� World Energy Outlook 2009. International Energy Agency, Paris.
Available at: http: / / www. iea. org / publications / freepublications / publication /
name,3853,en.html.
IEA (2010a)� Energy Technology Perspectives 2010. Scenarios & Strategies to 2050.
International Energy Agency, Paris, France, 706 pp.
IEA (2010b)� Energy Poverty: How to Make Modern Energy Access Universal.
World Energy Outlook 2010. IEA Publications, Paris, France, 52 pp. Available
at: http: / / www. iea. org / publications / freepublications / publication / weo2010_
poverty.pdf.
IEA (2010c)� Deploying Renewables in Southeast Asia. Trends and Potentials. Paris,
France, 159 pp. Available at: http: / / www. iea. org / publications / freepublications /
publication / name,3907,en.html.
IEA (2010d)� CO
2
Emissions from Fuel Combustion 2010. Paris, France, 125 pp.
IEA (2011)� World Energy Outlook 2011. Organization for Economic Co-Operation,
740 pp. ISBN: 9264124144.
IEA (2012a)� CO
2
Emissions from Fuel Combustion. Beyond 2020 Online Database.
2012 Edition. Available at: http: / / data.iea.org.
IEA (2012b)� World Energy Outlook 2012. OECD / IEA, Paris, France, 690 pp. Avail-
able at: http: / / www. worldenergyoutlook. org / publications / weo-2012 / #d.
en.26099.
IEA (2012c)� World Energy Outlook 2012. International Energy Agency, Paris,
France, 690 pp. Available at: http: / / www. worldenergyoutlook. org / publica-
tions / weo-2012 / .
IEA (2013)� World Energy Outlook 2013. International Energy Agency, Paris, France,
708 pp. Available at: http: / / www. worldenergyoutlook. org / publications /
weo-2013 / .
IEA, OECD, OPEC, and World Bank (2010)� Analysis of the Scope of Energy Subsi-
dies and Suggestions for the G-20 Initiative. Joint Report Prepared for Submis-
sion to the G-20 Summit Toronto (Canada), 26 – 27 June 2010. Paris, Cannes,
France, 81 pp. Available at: http: / / www. oecd. org / env / 45575666.pdf.
IEA, OECD, OPEC, and World Bank (2011)� An Update of the G20 Pittsburgh and
Toronto Commitments. (Prepared for the G20 Meeting of Finance Ministers
and Central Bank Governors (Paris, 14 – 15 October 2011) and the G20 Summit
(Cannes, 3 – 4 November 2011). Joint Report by IEA, OPEC, OECD, and World
Bank on Fossil-Fuel and Other Energy Subsidies. Paris, Cannes, France.
Iglesias A�, R� Mougou, M� Moneo, and S� Quiroga (2011a)� Towards adaptation
of agriculture to climate change in the Mediterranean. Regional Environmental
Change 11, 159 – 166. doi: 10.1007 / s10113-010-0187-4, ISBN: 1436-3798.
Iglesias A�, S� Quiroga, and A� Diz (2011b)� Looking into the future of agricul-
ture in a changing climate. European Review of Agricultural Economics 38,
427 – 447. doi: 10.1093 / erae / jbr037, ISBN: 0165-1587, 1464 – 3618.
IIASA (2009)� GGI Scenario Database Version 2.0.1. Available at: http: / / www. iiasa.
ac. at / Research / GGI / DB.
IIEC Asia (2012)� Technical Analysis of Appliance Markets to Support the Pacific
Appliance Labeling and Standards (PALS) Programme. International Institute
for Energy Conservation — Asia (IIEC Asia), Bangkok, Thailand, 8 pp. Available
at: http: / / www. reeep. org / sites / default / files / Technical%20Analysis%20of%20
Appliance%20Markets%20to%20Support%20PALS%20Programme.pdf.
Ilkılıç C�, H� Aydın, and R� Behçet (2011)� The current status of wind energy
in Turkey and in the world. Energy Policy 39, 961 – 967. doi: 10.1016 / j.
enpol.2010.11.021, ISBN: 0301-4215.
IMF (2013)� Energy Subsidy Reform — Lessons and Implications. Washington, D. C.,
184 pp.

11321132
Regional Development and Cooperation
14
Chapter 14
IPA, and EPU-NTUA (2010)� Study on the Implementation of the New EU Renew-
ables Directive in the Energy Community. Final Report to Energy Community
Secretariat. IPA Energy + Water Economics and EPU-NTUA, Edinburgh, 346 pp.
Available at: http: / / www. energy-community. org / pls / portal / docs / 644177.PDF.
IPCC (2001)� Climate Change 2001: Impacts, Adaptation, and Vulnerability. Contri-
bution of Working Group II to the Third Assessment Report of the Intergovern-
mental Panel on Climate Change [McCarthy J. J., O. F. Canziani, N. A. Leary, D. J.
Dokken, K. S. White (eds.)]. Cambridge University Press, Cambridge, UK, 1042
pp. ISBN: 0521807689.
IPCC (2007)� Climate Change 2007: Impacts, Adaptation and Vulnerability. Contri-
bution of Working Group II to the Fourth Assessment Report of the Intergov-
ernmental Panel on Climate Change [M. L. Parry, O. F. Canziani, J. P. Palutikof, P. J.
van der Linden and C. E. Hanson (eds.)]. Cambridge University Press, Cambridge,
United Kingdom and New York, NY, USA, 986pp.
IRENA (2013)� Southern African Power Pool: Planning and Prospects from Renew-
able Energy. International Renewable Energy Agency, Bonn, Germany, 91 pp.
Available at: http: / / www. irena. org / DocumentDownloads / Publications / SAPP.
pdf.
Ismer R�, and K� Neuhoff (2007)� Border tax adjustment: a feasible way to sup-
port stringent emission trading. European Journal of Law and Economics 24,
137 – 164. doi: 10.1007 / s10657-007-9032-8, ISBN: 0929-1261, 1572 – 9990.
Jakob M�, and R� Marschinski (2013)� Interpreting trade-related CO
2
emission
transfers. Nature Climate Change 3, 19 – 23. doi: 10.1038 / nclimate1630, ISBN:
1758-678X.
Jaraitė J�, F� Convery, and C� Di Maria (2010)� Transaction costs for firms
in the EU ETS: lessons from Ireland. Climate Policy 10, 190 – 215. doi:
10.3763 / cpol.2009.0659.
Jetter J�, Y� Zhao, K� R� Smith, B� Khan, T� Yelverton, P� DeCarlo, and M� D� Hays
(2012)� Pollutant Emissions and Energy Efficiency under Controlled Condi-
tions for Household Biomass Cookstoves and Implications for Metrics Useful in
Setting International Test Standards. Environmental Science & Technology 46,
10827 – 10834. doi: 10.1021 / es301693f, ISBN: 0013-936X.
Jewell J�, A� Cherp, V� Vadim, N� Bauer, T� Kober, D� McCollum, D� P� van Vuuren,
and B� Van der Zwaan (2013)� Energy Security of China, India, the E. U. and
the U. S. Under Long-Term Scenarios. Climate Change Economics.
Johansson D�, C� Azar, K� Lindgren, and T� A� Persson (2009)� OPEC Strategies
and Oil Rent in a Climate Conscious World. The Energy Journal 30, 23 – 50.
Johnson F�, and F� Lambe (2009)� Energy Access, Climate and Development. Stock-
holm Environment Institute, Stockholm, 9 pp.
Jones D� W� (1991)� How urbanization affects energy-use in developing countries.
Energy Policy 19, 621 – 630.
JRC / PBL (2013)� Emission Database for Global Atmospheric Research (EDGAR),
Release Version 4.2 FT2010. European Commission, Joint Research Cen-
tre (JRC) / PBL Netherlands Environmental Assessment Agency. Available at:
http: / / edgar.jrc.ec.europa.eu.
Jung M� (2006)� Host country attractiveness for CDM non-sink projects. Energy
Policy 34, 2173 – 2184. doi: 10.1016 / j.enpol.2005.03.014, ISBN: 0301-4215.
Kahn M� E� (2000)� The environmental impact of suburbanization.
Journal of Policy Analysis and Management 19, 569 – 586. doi:
10.1002 / 1520-6688(200023)19:4<569::AID-PAM3>3.0.CO;2-P, ISBN: 1520-
6688.
Karakosta C�, S� Dimopoulou, H� Doukas, and J� Psarras (2011)� The potential
role of renewable energy in Moldova. Renewable Energy 36, 3550 – 3557. doi:
10.1016 / j.renene.2011.05.004, ISBN: 0960-1481.
Karlsson-Vinkhuyzen S� I�, and H� van Asselt (2009)� Introduction: exploring
and explaining the Asia-Pacific Partnership on Clean Development and Cli-
mate. International Environmental Agreements: Politics, Law and Economics 9,
195 – 211. doi: 10.1007 / s10784-009-9103-0, ISBN: 1567-9764, 1573 – 1553.
Karp L�, and J� Zhao (2010)� International Environmental Agreements: Emissions
Trade, Safety Valves and Escape Clauses. Revue Économique 61, 153. doi:
10.3917 / reco.611.0153, ISBN: 0035-2764, 1950 – 6694.
Kato H� (2004)� An Introduction to Regional Environmental Regimes in Asia and
the Pacific: The Present State and Future Prospects. Nagoya University Journal
of Law and Politics 202, 325 – 352.
Katz J� M� (1987)� Technology Generation in Latin American Manufacturing Indus-
tries. St. Martin’s Press, New York, ISBN: 0312790023 : 9780312790028.
Kaufmann R� K�, P� Pauly, and J� Sweitzer (1993)� The Effects of NAFTA on the
Environment. Energy Journal 14, 217 – 224.
Kaunda C� S�, C� Z� Kimambo, and T� K� Nielsen (2012)� Potential of Small-Scale
Hydropower for Electricity Generation in Sub-Saharan Africa. ISRN Renewable
Energy 2012, 1 – 15. doi: 10.5402 / 2012 / 132606, ISBN: 2090-746X.
Kautto N�, A� Arasto, J� Sijm, and P� Peck (2012)� Interaction of the EU ETS and
national climate policy instruments — Impact on biomass use. Biomass and Bio-
energy 38, 117 – 127. doi: 10.1016 / j.biombioe.2011.02.002, ISBN: 0961-9534.
Kaygusuz K� (2012)� Energy for sustainable development: A case of developing
countries. Renewable and Sustainable Energy Reviews 16, 1116 – 1126. doi:
10.1016 / j.rser.2011.11.013, ISBN: 1364-0321.
Kellenberg D� K� (2008)� A reexamination of the role of income for the trade and
environment debate. Ecological Economics 68, 106 – 115. doi: 10.1016 / j.ecole-
con.2008.02.007, ISBN: 0921-8009.
Kennedy C�, J� Steinberger, B� Gasson, Y� Hansen, T� Hillman, M� Havránek, D�
Pataki, A� Phdungsilp, A� Ramaswami, and G� V� Mendez (2009)� Green-
house Gas Emissions from Global Cities. Environ. Sci. Technol. 43, 7297 – 7302.
doi: 10.1021 / es900213p, ISBN: 0013-936X.
Kettner C�, A� Koppl, S� P� Schleicher, and G� Thenius (2008)� Stringency and dis-
tribution in the EU Emissions Trading Scheme: first evidence. Climate Policy 8,
41 – 61.
Keyhani A�, M� Ghasemi-Varnamkhasti, M� Khanali, and R� Abbaszadeh
(2010)� An assessment of wind energy potential as a power generation
source in the capital of Iran, Tehran. Energy 35, 188 – 201. doi: 10.1016 / j.
energy.2009.09.009, ISBN: 0360-5442.
Khennas S� (2012)� Understanding the political economy and key drivers of
energy access in addressing national energy access priorities and policies:
African Perspective. Energy Policy 47, Supplement 1, 21 – 26. doi: 10.1016 / j.
enpol.2012.04.003, ISBN: 0301-4215.
Kim L� (1998)� Crisis Construction and Organizational Learning: Capability Build-
ing in Catching-up at Hyundai Motor. Organization Science 9, 506 – 521. doi:
10.1287 / orsc.9.4.506, ISBN: 1047-7039, 1526 – 5455.
Klaphake A�, and W� Scheumann (2006)� Understanding transboundary water
cooperation: Evidence from Africa. Berlin: TU Berlin (Working Paper on Manage-
ment in Environmental Planning 013). Available at: http: / / www. bahnsysteme.
tu-berlin. de / fileadmin / a0731 / uploads / publikationen / workingpapers /
WP_14_2006_Klaphake_Scheuman_Transboundary_Wat_.pdf.

11331133
Regional Development and Cooperation
14
Chapter 14
Klein Goldewijk K�, A� Beusen, G� van Drecht, and M� de Vos (2011)� The
HYDE 3.1 spatially explicit database of human-induced global land-use change
over the past 12,000 years. Global Ecology and Biogeography 20, 73 – 86. doi:
10.1111 / j.1466-8238.2010.00587.x, ISBN: 1466-8238.
Klein R� J�, S� Huq, F� Denton, T� E� Downing, R� G� Richels, J� B� Robinson, and
F� L� Toth (2007)� Inter-relationships between adaptation and mitigation. Cli-
mate Change 200, 745 – 777.
Kneeland J�, C� Barnett, T� Juliani, and W� Knowland (2005)� Case Studies of
Regional Energy Cooperation Programs: APEC and ASEAN. USA, 101 pp. Avail-
able at: http: / / pdf.usaid.gov / pdf_docs / PNADD963.pdf.
Knopf B�, Y�-H� H� Chen, E� De Cian, H� Förster, A� Kanudia, I� Karkatsouli, I�
Keppo, T� Koljonen, K� Schumacher, and D� P� van Vuuren (2013)� Beyond
2020 — Strategies and costs for transforming the European energy system. Cli-
mate Change Economics 4, 38.
Kok M�, and H� De Coninck (2007)� Widening the scope of policies to address
climate change: directions for mainstreaming. Environmental Science & Policy
10, 587 – 599.
Komori Y� (2010)� Evaluating Regional Environmental Governance in
Northeast Asia. Asian Affairs: An American Review 37, 1 – 25. doi:
10.1080 / 00927671003591367, ISBN: 0092-7678.
Kondo Y�, Y� Moriguchi, and H� Shimizu (1998)� CO
2
emissions in Japan: Influences
of imports and exports. Applied Energy 59, 163 – 174. doi: 10.1016 / S0306-
2619(98)00011-7, ISBN: 0306-2619.
Kopsakangas-Savolainen M�, and R� Svento (2013)� Promotion of Market
Access for Renewable Energy in the Nordic Power Markets. Environmental and
Resource Economics 54, 549 – 569. doi: 10.1007 / s10640-012-9605-z, ISBN:
0924-6460, 1573 – 1502.
Kosnik L� (2010)� The potential for small scale hydropower development in the US.
Energy Policy 38, 5512 – 5519. doi: 10.1016 / j.enpol.2010.04.049, ISBN: 0301-
4215.
Krausmann F�, H� Schandl, and R� P� Sieferle (2008)� Socio-ecological regime
transitions in Austria and the United Kingdom. Ecological Economics 65,
187 – 201. doi: 10.1016 / j.ecolecon.2007.06.009, ISBN: 0921-8009.
Kuik O�, and M� Hofkes (2010)� Border adjustment for European emissions trad-
ing: Competitiveness and carbon leakage. Energy Policy 38, 1741 – 1748. doi:
10.1016 / j.enpol.2009.11.048, ISBN: 0301-4215.
Kuik O� J�, M� B� Lima, and J� Gupta (2011)� Energy security in a developing
world. Wiley Interdisciplinary Reviews: Climate Change 2, 627 – 634. doi:
10.1002 / wcc.118, ISBN: 1757-7799.
Kumar A�, T� Schei, A� Ahenkorah, R� Caceres Rodriguez, J�-M� Devernay, M�
Freitas, D� Hall, A� Killingtveit, and Z� Liu (2011)� Hydropower (Chapter
5). In: Renewable Energy Sources and Climate Change Mitigation — Special
Report of the Intergovernmental Panel on Climate Change [O. Edenhofer, R.
Pichs-Madruga, Y. Sokona, K. Seyboth, P. Matschoss, S. Kadner, T. Zwickel, P. Eick-
emeier, G. Hansen, S. Schlömer, C. von Stechow (eds)]. Cambridge University
Press, Cambridge, United Kingdom and New York, NY, USA, pp.437 – 496. ISBN:
9781107607101.
Kusre B� C�, D� C� Baruah, P� K� Bordoloi, and S� C� Patra (2010)� Assessment of
hydropower potential using GIS and hydrological modeling technique in Kopili
River basin in Assam (India). Applied Energy 87, 298 – 309. doi: 10.1016 / j.apen-
ergy.2009.07.019, ISBN: 0306-2619.
Lalic D�, K� Popovski, V� Gecevska, S� P� Vasilevska, and Z� Tesic (2011)� Analysis
of the opportunities and challenges for renewable energy market in the Western
Balkan countries. Renewable and Sustainable Energy Reviews 15, 3187 – 3195.
doi: 10.1016 / j.rser.2011.04.011, ISBN: 1364-0321.
Lall S� (1987)� Learning to Industrialize : The Acquisition of Technological Capa-
bility by India. Macmillan, Basingstoke, ISBN: 0333433750 9780333433751
0333433769 9780333433768.
Lall S� (1998)� Technological Capabilities in Emerging Asia. Oxford Development
Studies 26, 213 – 243.
Lanzi E�, J� Chateau, and R� Dellink (2012)� Alternative approaches for levelling
carbon prices in a world with fragmented carbon markets. Energy Econom-
ics 34, Supplement 2, S240 – S250. doi: 10.1016 / j.eneco.2012.08.016, ISBN:
0140-9883.
Lawrence P� (2009)� Australian climate policy and the Asia Pacific partnership on
clean development and climate (APP). From Howard to Rudd: continuity or
change? International Environmental Agreements: Politics, Law and Economics
9, 281 – 299. doi: 10.1007 / s10784-009-9102-1, ISBN: 1567-9764, 1573 – 1553.
Lawrence P� J�, J� J� Feddema, G� B� Bonan, G� A� Meehl, B� C� O’Neill, K� W� Ole-
son, S� Levis, D� M� Lawrence, E� Kluzek, K� Lindsay, and P� E� Thornton
(2012)� Simulating the Biogeochemical and Biogeophysical Impacts of Tran-
sient Land Cover Change and Wood Harvest in the Community Climate System
Model (CCSM4) from 1850 to 2100. Journal of Climate 25, 3071 – 3095. doi:
10.1175 / JCLI-D-11-00256.1, ISBN: 0894-8755, 1520 – 0442.
Leach G� (1992)� The energy transition. Energy Policy 20, 116 – 123. doi:
10.1016 / 0301-4215(92)90105-B, ISBN: 0301-4215.
Leal-Arcas R� (2011)� Proliferation of Regional Trade Agreements: Complement-
ing or Supplanting Multilateralism? Chicago Journal of International Law 11,
597 – 629.
Leal-Arcas R� (2013)� Climate Change Mitigation from the Bottom Up: Using Pref-
erential Trade Agreements to Promote Climate Change Mitigation. Carbon and
Climate Law Review, 34 – 42.
Lecuyer O�, and P� Quirion (2013)� Can uncertainty justify overlapping policy
instruments to mitigate emissions? Ecological Economics 93, 177 – 191. doi:
10.1016 / j.ecolecon.2013.05.009, ISBN: 0921-8009.
Lee K� (2005)� Making a Technological Catch Up: Barriers and Opportunities. Asian
Journal of Technology Innovation 13, 97 – 131.
Lee K�, and C� Kim (2001)� Technological Regimes, Catching Up, and Leapfrogging:
Findings from the Korean Industries. Research Policy 30, 459 – 483.
Lema A�, and K� Ruby (2007)� Between fragmented authoritarianism and policy
coordination: Creating a Chinese market for wind energy. Energy Policy 35,
3879 – 3890. doi: 10.1016 / j.enpol.2007.01.025, ISBN: 0301-4215.
Lenzen M� (1998)� Primary energy and greenhouse gases embodied in Australian
final consumption: an input – output analysis. Energy Policy 26, 495 – 506. doi:
10.1016 / S0301-4215(98)00012-3, ISBN: 0301-4215.
Lenzen M�, D� Moran, K� Kanemoto, B� Foran, L� Lobefaro, and A� Geschke
(2012)� International trade drives biodiversity threats in developing nations.
Nature 486, 109 – 112. doi: 10.1038 / nature11145, ISBN: 0028-0836.
Lewis J� I� (2007)� Technology Acquisition and Innovation in the Developing World:
Wind Turbine Development in China and India. Studies in Comparative Interna-
tional Development 42, 208 – 232.
Lewis J� I� (2011)� Building a National Wind Turbine Industry: Experiences from
China, India and South Korea. International Journal of Technology and Globali-
sation 5, 281 – 305.

11341134
Regional Development and Cooperation
14
Chapter 14
Lewis J� I� (2012)� Green Innovation in China: China’s Wind Power Industry and the
Global Transition to a Low-Carbon Economy. Columbia University Press, New
York.
Liao H�, Y� Fan, and Y�-M� Wei (2007)� What induced China’s energy intensity
to fluctuate: 1997 – 2006? Energy Policy 35, 4640 – 4649. doi: 10.1016 / j.
enpol.2007.03.028, ISBN: 0301-4215.
Liddle B�, and S� Lung (2010)� Age-structure, urbanization, and climate change
in developed countries: revisiting STIRPAT for disaggregated population and
consumption-related environmental impacts. Population and Environment 31,
317 – 343. doi: 10.1007 / s11111-010-0101-5, ISBN: 0199-0039, 1573 – 7810.
Lim S�, and L� K� Teong (2010)� Recent trends, opportunities and challenges of bio-
diesel in Malaysia: An overview. Renewable and Sustainable Energy Reviews
14, 938 – 954. doi: 10.1016 / j.rser.2009.10.027, ISBN: 1364-0321.
Lim S� S�, T� Vos, A� D� Flaxman, G� Danaei, K� Shibuya, H� Adair-Rohani, M� A�
AlMazroa, M� Amann, H� R� Anderson, K� G� Andrews, M� Aryee, C� Atkin-
son, L� J� Bacchus, A� N� Bahalim, K� Balakrishnan, J� Balmes, S� Barker-
Collo, A� Baxter, M� L� Bell, J� D� Blore, F� Blyth, C� Bonner, G� Borges, R�
Bourne, M� Boussinesq, M� Brauer, P� Brooks, N� G� Bruce, B� Brunekreef,
C� Bryan-Hancock, C� Bucello, R� Buchbinder, F� Bull, R� T� Burnett, T� E�
Byers, B� Calabria, J� Carapetis, E� Carnahan, Z� Chafe, F� Charlson, H�
Chen, J� S� Chen, A� T�-A� Cheng, J� C� Child, A� Cohen, K� E� Colson, B� C�
Cowie, S� Darby, S� Darling, A� Davis, L� Degenhardt, F� Dentener, D� C�
Des Jarlais, K� Devries, M� Dherani, E� L� Ding, E� R� Dorsey, T� Driscoll, K�
Edmond, S� E� Ali, R� E� Engell, P� J� Erwin, S� Fahimi, G� Falder, F� Farzad-
far, A� Ferrari, M� M� Finucane, S� Flaxman, F� G� R� Fowkes, G� Freedman,
M� K� Freeman, E� Gakidou, S� Ghosh, E� Giovannucci, G� Gmel, K� Gra-
ham, R� Grainger, B� Grant, D� Gunnell, H� R� Gutierrez, W� Hall, H� W� Hoek,
A� Hogan, H� D� Hosgood III, D� Hoy, H� Hu, B� J� Hubbell, S� J� Hutchings,
S� E� Ibeanusi, G� L� Jacklyn, R� Jasrasaria, J� B� Jonas, H� Kan, J� A� Kanis,
N� Kassebaum, N� Kawakami, Y�-H� Khang, S� Khatibzadeh, J�-P� Khoo, C�
Kok, F� Laden, R� Lalloo, Q� Lan, T� Lathlean, J� L� Leasher, J� Leigh, Y� Li,
J� K� Lin, S� E� Lipshultz, S� London, R� Lozano, Y� Lu, J� Mak, R� Malekzadeh,
L� Mallinger, W� Marcenes, L� March, R� Marks, R� Martin, P� McGale, J�
McGrath, S� Mehta, Z� A� Memish, G� A� Mensah, T� R� Merriman, R� Micha,
C� Michaud, V� Mishra, K� M� Hanafiah, A� A� Mokdad, L� Morawska, D�
Mozaffarian, T� Murphy, M� Naghavi, B� Neal, P� K� Nelson, J� M� Nolla, R�
Norman, C� Olives, S� B� Omer, J� Orchard, R� Osborne, B� Ostro, A� Page,
K� D� Pandey, C� D� Parry, E� Passmore, J� Patra, N� Pearce, P� M� Pelizzari, M�
Petzold, M� R� Phillips, D� Pope, C� A� Pope III, J� Powles, M� Rao, H� Razavi,
E� A� Rehfuess, J� T� Rehm, B� Ritz, F� P� Rivara, T� Roberts, C� Robinson, J� A�
Rodriguez-Portales, I� Romieu, R� Room, L� C� Rosenfeld, A� Roy, L� Rush-
ton, J� A� Salomon, U� Sampson, L� Sanchez-Riera, E� Sanman, A� Sapkota,
S� Seedat, P� Shi, K� Shield, R� Shivakoti, G� M� Singh, D� A� Sleet, E� Smith,
K� R� Smith, N� J� Stapelberg, K� Steenland, H� Stöckl, L� J� Stovner, K� Straif,
L� Straney, G� D� Thurston, J� H� Tran, R� Van Dingenen, A� van Donkelaar,
J� L� Veerman, L� Vijayakumar, R� Weintraub, M� M� Weissman, R� A� White,
H� Whiteford, S� T� Wiersma, J� D� Wilkinson, H� C� Williams, W� Williams, N�
Wilson, A� D� Woolf, P� Yip, J� M� Zielinski, A� D� Lopez, C� J� Murray, and M�
Ezzati (2012)� A comparative risk assessment of burden of disease and injury
attributable to 67 risk factors and risk factor clusters in 21 regions, 1990 – 2010:
a systematic analysis for the Global Burden of Disease Study 2010. The Lancet
380, 2224 – 2260. doi: 10.1016 / S0140-6736(12)61766-8, ISBN: 0140-6736.
Lindner S�, Z� Liu, D� Guan, Y� Geng, and X� Li (2013)� CO
2
emissions from China’s
power sector at the provincial level: Consumption versus production perspec-
tives. Renewable and Sustainable Energy Reviews 19, 164 – 172. doi: 10.1016 / j.
rser.2012.10.050, ISBN: 1364-0321.
Liniger H� P�, R� Mekdaschi Studer, C� Hauert, and M� Gurtner (2011)� Sustain-
able Land Management in Practice — Guidelines and Best Practices for Sub-
Saharan Africa. TerrAfrica, World Overview of Conservation Approaches and
Technologies (WOCAT) and Food and Agriculture Organization of the United
Nations (FAO), Rome, Italy, 240 pp.
Liu Z�, Y� Geng, S� Lindner, and D� Guan (2012a)� Uncovering China’s greenhouse
gas emission from regional and sectoral perspectives. Energy 45, 1059 – 1068.
doi: 10.1016 / j.energy.2012.06.007, ISBN: 0360-5442.
Liu Z�, Y� Geng, S� Lindner, H� Zhao, T� Fujita, and D� Guan (2012b)� Embod-
ied energy use in China’s industrial sectors. Energy Policy 49, 751 – 758. doi:
10.1016 / j.enpol.2012.07.016, ISBN: 0301-4215.
Lobell D� B�, M� B� Burke, C� Tebaldi, M� D� Mastrandrea, W� P� Falcon, and R� L�
Naylor (2008)� Prioritizing Climate Change Adaptation Needs for Food Secu-
rity in 2030. Science 319, 607 – 610. doi: 10.1126 / science.1152339, ISBN: 0036-
8075, 1095 – 9203.
Locatelli B�, V� Evans, A� Wardell, A� Andrade, and R� Vignola (2011)� Forests
and Climate Change in Latin America: Linking Adaptation and Mitigation. For-
ests 2, 431 – 450.
Lockwood B�, and J� Whalley (2010)� Carbon-motivated Border Tax Adjustments:
Old Wine in Green Bottles? World Economy 33, 810 – 819. doi: 10.1111 / j.1467-
9701.2010.01285.x, ISBN: 1467-9701.
Lohmann L� (2011)� The Endless Algebra of Climate Markets. Capitalism Nature
Socialism 22, 93 – 116. doi: 10.1080 / 10455752.2011.617507, ISBN: 1045-5752.
Lopes de Souza T�, and L� Hasenclever (2011)� The Brazilian system of innovation
for bioethanol: a case study on the strategic role of the standardisation process.
International Journal of Technology and Globalisation 5, 341 – 356. Available at:
http: / / inderscience.metapress.com / index / CQV184045T5380J4.pdf.
Ma C�, and D� I� Stern (2008)� China’s changing energy intensity trend: A
decomposition analysis. Energy Economics 30, 1037 – 1053. doi: 10.1016 / j.
eneco.2007.05.005, ISBN: 0140-9883.
Managi S�, A� Hibiki, and T� Tsurumi (2009)� Does trade openness improve envi-
ronmental quality? Journal of Environmental Economics and Management 58,
346 – 363. doi: 10.1016 / j.jeem.2009.04.008, ISBN: 0095-0696.
Marcotullio P� J�, and N� B� Schulz (2007)� Comparison of Energy Transitions in the
United States and Developing and Industrializing Economies. World Develop-
ment 35, 1650 – 1683. doi: 10.1016 / j.worlddev.2006.11.006, ISBN: 0305-750X.
Marrison C� I�, and E� D� Larson (1996)� A preliminary analysis of the biomass
energy production potential in Africa in 2025 considering projected land needs
for food production. Biomass and Bioenergy 10, 337 – 351. doi: 10.1016 / 0961-
9534(95)00122-0, ISBN: 0961-9534.
Martínez-Zarzoso I�, and A� Maruotti (2011)� The impact of urbanization on
CO
2
emissions: Evidence from developing countries. Ecological Economics 70,
1344 – 1353. doi: 10.1016 / j.ecolecon.2011.02.009, ISBN: 0921-8009.
Mathews J� A� (2007)� Biofuels: What a Biopact between North and South could
achieve. Energy Policy 35, 3550 – 3570. doi: 10.1016 / j.enpol.2007.02.011, ISBN:
0301-4215.

11351135
Regional Development and Cooperation
14
Chapter 14
McCollum D�, N� Bauer, K� Calvin, A� Kitous, and K� Riahi (2014)� Fossil resource
and energy security dynamics in conventional and carbon-constrained worlds.
Climatic Change, 1 – 14. doi: 10.1007 / s10584-013-0939-5, ISBN: 0165-0009,
1573 – 1480.
McGee J�, and R� Taplin (2009)� The role of the Asia Pacific Partnership in discur-
sive contestation of the international climate regime. International Environmen-
tal Agreements: Politics, Law and Economics 9, 213 – 238. doi: 10.1007 / s10784-
009-9101-2, ISBN: 1567-9764, 1573 – 1553.
Mee L� D�, H� T� Dublin, and A� A� Eberhard (2008)� Evaluating the Global Envi-
ronment Facility: A goodwill gesture or a serious attempt to deliver global
benefits? Global Environmental Change 18, 800 – 810. doi: 10.1016 / j.gloenv-
cha.2008.07.005, ISBN: 0959-3780.
Meinshausen M�, S� Smith, K� Calvin, J� Daniel, M� Kainuma, J�-F� Lamarque,
K� Matsumoto, S� Montzka, S� Raper, K� Riahi, A� Thomson, G� Velders,
and D� P� van Vuuren (2011)� The RCP greenhouse gas concentrations and
their extensions from 1765 to 2300. Climatic Change 109, 213 – 241. doi:
10.1007 / s10584-011-0156-z, ISBN: 0165-0009.
Michaelis L� (2003)� Sustainable consumption and greenhouse gas mitigation. Cli-
mate Policy 3, Supplement 1, S135 – S146. doi: 10.1016 / j.clipol.2003.10.012,
ISBN: 1469-3062.
Michaelowa A�, and F� Jotzo (2005)� Transaction costs, institutional rigidities and
the size of the clean development mechanism. Energy Policy 33, 511 – 523. doi:
10.1016 / j.enpol.2003.08.016, ISBN: 0301-4215.
Mihajlov A� (2010)� Opportunities and challenges for a sustainable energy policy in
SE Europe: SE European Energy Community Treaty. Renewable and Sustainable
Energy Reviews 14, 872 – 875. doi: 10.1016 / j.rser.2009.10.026, ISBN: 1364-
0321.
Minx J� C�, G� Baiocchi, G� P� Peters, C� L� Weber, D� Guan, and K� Hubacek (2011)�
A “Carbonizing Dragon”: China’s Fast Growing CO
2
Emissions Revisited. Envi-
ronmental Science & Technology 45, 9144 – 9153. doi: 10.1021 / es201497m,
ISBN: 0013-936X.
Montgomery W� D� (1972)� Markets in licenses and efficient pollution control
programs. Journal of Economic Theory 5, 395 – 418. doi: 10.1016 / 0022-
0531(72)90049-X, ISBN: 0022-0531.
Munzhedzi R�, and A� B� Sebitosi (2009)� Redrawing the solar map of South Africa
for photovoltaic applications. Renewable Energy 34, 165 – 169. doi: 10.1016 / j.
renene.2008.03.023, ISBN: 0960-1481.
NAEWG (2002)� North American Energy Efficiency Standards and Labeling. Avail-
able at: www. eere. energy. gov / buildings / appliance_standards.
Nakicenovic N�, and R� Swart (2000)� Special Report on Emissions Scenarios:
A Special Report of Working Group III of the Intergovernmental Panel on Cli-
mate Change. Cambridge University Press, Cambridge, UK, 612 pp. ISBN:
0521804930.
Nansai K�, R� Inaba, S� Kagawa, and Y� Moriguchi (2008)� Identifying com-
mon features among household consumption patterns optimized to minimize
specific environmental burdens. Journal of Cleaner Production, 538 – 548. doi:
10.1016 / j.jclepro.2007.01.008.
Nazifi F� (2010)� The price impacts of linking the European Union Emissions Trading
Scheme to the Clean Development Mechanism. Environmental Economics and
Policy Studies 12, 164 – 186.
Nepstad D� C�, W� Boyd, C� M� Stickler, T� Bezerra, and A� A� Azevedo (2013)�
Responding to climate change and the global land crisis: REDD+, market trans-
formation and low-emissions rural development. Philosophical Transactions
of the Royal Society B: Biological Sciences 368. doi: 10.1098 / rstb.2012.0167,
ISBN: 0962-8436, 1471 – 2970.
Neuhoff K� (2011)� Climate Policy after Copenhagen. Cambridge University Press.
Available at: http: / / ideas.repec.org / b / cup / cbooks / 9781107008939.html.
Neuhoff K�, A� Schopp, R� Boyd, K� Stelmakh, and A� Vasa (2012)� Banking
of Surplus Emissions Allowances: Does the Volume Matter? Social Science
Research Network, Rochester, NY, 23 pp. Available at: http: / / papers.ssrn.
com / abstract=2021733.
Nguon P�, and D� Kulakowski (2013)� Natural forest disturbances and the design
of REDD+ initiatives. Environmental Science & Policy 33, 332 – 345. doi:
10.1016 / j.envsci.2013.04.011, ISBN: 1462-9011.
Nkem J�, F� B� Kalame, M� Idinoba, O� A� Somorin, O� Ndoye, and A� Awono
(2010)� Shaping forest safety nets with markets: Adaptation to climate change
under changing roles of tropical forests in Congo Basin. Environmental Science
& Policy 13, 498 – 508.
Nyatichi Omambi A�, C� Shemsanga, and I� Sanchez (2012)� Climate Change
Impacts, Vulnerability, and Adaptation in East Africa (EA) and South America
(SA). In: Handbook of Climate Change Mitigation. W.-Y. Chen, J. Seiner, T. Suzuki,
M. Lackner, (eds.), Springer US, pp. 571 – 620. ISBN: 978 – 1-4419 – 7990 – 2,
978 – 1-4419 – 7991 – 9.
O’Neill B� C�, M� Dalton, R� Fuchs, L� Jiang, S� Pachauri, and K� Zigova
(2010)� Global demographic trends and future carbon emissions. Pro-
ceedings of the National Academy of Sciences 107, 17521 – 17526. doi:
10.1073 / pnas.1004581107, ISBN: 0027-8424, 1091 – 6490.
O’Neill B� C�, X� Ren, L� Jiang, and M� Dalton (2012)� The effect of urbanization
on energy use in India and China in the iPETS model. Energy Economics 34,
Supplement 3, S339 – S345. doi: 10.1016 / j.eneco.2012.04.004, ISBN: 0140-
9883.
Ockwell D� G�, J� Watson, G� MacKerron, P� Pal, and F� Yamin (2008)� Key policy
considerations for facilitating low carbon technology transfer to developing
countries. Energy Policy 36, 4104 – 4115. doi: 10.1016 / j.enpol.2008.06.019,
ISBN: 0301-4215.
OECD (2007)� Environment and Regional Trade Agreements. 230 pp. ISBN:
9789264006652.
OECD (2011a)� Interactions between Emission Trading Systems and Other Overlap-
ping Policy Instruments. Paris, France, 15 pp. Available at: http: / / www. oecd.
org / env / tools-evaluation / Interactions%20between%20Emission%20Trading%20
Systems%20and%20Other%20Overlapping%20Policy%20Instruments.pdf.
OECD (2011b)� OECD Science, Technology and Industry Scoreboard 2011: Inno-
vation and Growth in Knowledge Economies. Available at: http: / / www. oecd.
org / document / 10 / 0,3746,en_2649_33703_39493962_1_1_1_1,00.html.
OECD (2012)� Inventory of Estimated Budgetary Support and Tax Expenditures for
Fossil Fuels 2013.
Okazaki T�, and M� Yamaguchi (2011)� Accelerating the transfer and diffusion of
energy saving technologies steel sector experience — Lessons learned. Energy
Policy 39, 1296 – 1304. doi: 10.1016 / j.enpol.2010.12.001, ISBN: 0301-4215.
Okubo Y�, and A� Michaelowa (2010)� Effectiveness of subsidies for the Clean
Development Mechanism: Past experiences with capacity building in Africa and
LDCs. Climate and Development 2, 30 – 49. doi: 10.3763 / cdev.2010.0032, ISSN:
17565529, 17565537.

11361136
Regional Development and Cooperation
14
Chapter 14
Oleschak R�, and U� Springer (2007)� Measuring host country risk in CDM and JI
projects: a composite indicator. Climate Policy 7, 470 – 487.
Osmani D�, and R� S� J� Tol (2010)� The Case of two Self-Enforcing International
Agreements for Environmental Protection with Asymmetric Countries. Compu-
tational Economics 36, 93 – 119. doi: 10.1007 / s10614-010-9232-0.
Pachauri S�, A� Brew-Hammond, D� F� Barnes, D� H� Bouille, S� Gitonga, V� Modi,
G� Prasad, A� Rath, and H� Zerriffi (2012)� Chapter 19: Energy Access for
Development. In: Global Energy Assessment — Toward a Sustainable Future.
Cambridge University Press and the International Institute for Applied Sys-
tems Analysis, Cambridge, UK; New York, NY, USA; Laxenburg, Austria,
pp. 1401 – 1458. Available at: http: / / www. iiasa. ac. at / web / home / research /
Flagship-Projects / Global-Energy-Assessment / Chapte19.en.html.
Pachauri S�, B� J� van Ruijven, Y� Nagai, K� Riahi, D� P� van Vuuren, A� Brew-Ham-
mond, and N� Nakicenovic (2013)� Pathways to achieve universal household
access to modern energy by 2030. Environmental Research Letters 8, 024015.
doi: 10.1088 / 1748-9326 / 8 / 2 / 024015, ISBN: 1748-9326.
Pahl-Wostl C�, L� Lebel, C� Knieper, and E� Nikitina (2012)� From apply-
ing panaceas to mastering complexity: Toward adaptive water governance
in river basins. Environmental Science & Policy 23, 24 – 34. doi: 10.1016 / j.
envsci.2012.07.014, ISBN: 1462-9011.
Pan Y�, R� A� Birdsey, J� Fang, R� Houghton, P� E� Kauppi, W� A� Kurz, O� L� Phillips,
A� Shvidenko, S� L� Lewis, J� G� Canadell, P� Ciais, R� B� Jackson, S� W� Pacala,
A� D� McGuire, S� Piao, A� Rautiainen, S� Sitch, and D� Hayes (2011)� A Large
and Persistent Carbon Sink in the World’s Forests. Science 333, 988 – 993. doi:
10.1126 / science.1201609, ISBN: 0036-8075, 1095 – 9203.
Parikh J�, and V� Shukla (1995)� Urbanization, energy use and greenhouse effects
in economic development: Results from a cross-national study of develop-
ing countries. Global Environmental Change 5, 87 – 103. doi: 10.1016 / 0959-
3780(95)00015-G, ISBN: 0959-3780.
Parry M�, C� Rosenzweig, A� Iglesias, M� Livermore, and G� Fischer (2004)�
Effects of climate change on global food production under SRES emissions
and socio-economic scenarios. Global Environmental Change 14, 53 – 67. doi:
10.1016 / j.gloenvcha.2003.10.008, ISBN: 0959-3780.
Patlitzianas K� D�, A� G� Kagiannas, D� T� Askounis, and J� Psarras (2005)� The
policy perspective for RES development in the new member states of the EU.
Renewable Energy 30, 477 – 492. doi: 10.1016 / j.renene.2004.07.012, ISBN:
0960-1481.
Patlitzianas K�, and K� Karagounis (2011)� The progress of RES environment in
the most recent member states of the EU. Renewable Energy 36, 429 – 436. doi:
10.1016 / j.renene.2010.08.032, ISBN: 0960-1481.
Perkins R� (2003)� Environmental leapfrogging in developing countries: A critical
assessment and reconstruction. Natural Resources Forum 27, 177 – 188. doi:
10.1111 / 1477-8947.00053, ISBN: 1477-8947.
Perkins R�, and E� Neumayer (2009)� Transnational linkages and the spillover
of environment-efficiency into developing countries. Global Environmental
Change 19, 375 – 383. doi: 10.1016 / j.gloenvcha.2009.05.003, ISBN: 0959-3780.
Perkins R�, and E� Neumayer (2012)� Do recipient country characteristics affect
international spillovers of CO
2
-efficiency via trade and foreign direct invest-
ment? Climatic Change 112, 469 – 491. doi: 10.1007 / s10584-011-0204-8, ISBN:
0165-0009, 1573 – 1480.
Persson T� A�, C� Azar, D� Johansson, and K� Lindgren (2007)� Major oil exporters
may profit rather than lose, in a carbon-constrained world. Energy Policy 35,
6346 – 6353. doi: 10.1016 / j.enpol.2007.06.027, ISBN: 0301-4215.
Peters G� P� (2008)� From production-based to consumption-based national
emission inventories. Ecological Economics 65, 13 – 23. doi: 16 / j.ecole-
con.2007.10.014, ISBN: 0921-8009.
Peters G� P�, R� M� Andrew, T� Boden, J� G� Canadell, P� Ciais, C� Le Quéré, G�
Marland, M� R� Raupach, and C� Wilson (2013)� The challenge to keep
global warming below 2 °C. Nature Climate Change 3, 4 – 6. doi: 10.1038 / ncli-
mate1783, ISBN: 1758-678X.
Peters G� P�, S� Davis, and R� M� Andrew (2012a)� A synthesis of carbon in interna-
tional trade. Biogeosciences 9. doi: 10.5194 / bgd-9-3949-2012.
Peters G� P�, and E� G� Hertwich (2006)� Pollution embodied in trade: The Norwe-
gian case. Global Environmental Change 16, 379 – 387. doi: 10.1016 / j.gloenv-
cha.2006.03.001, ISBN: 0959-3780.
Peters G� P�, and E� G� Hertwich (2008)� CO
2
Embodied in International Trade with
Implications for Global Climate Policy. Environmental Science & Technology 42,
1401 – 1407. doi: 10.1021 / es072023k, ISBN: 0013-936X.
Peters G� P�, G� Marland, C� L� Quéré, T� Boden, J� G� Canadell, and M� R� Rau-
pach (2012b)� Rapid growth in CO
2
emissions after the 2008 – 2009 global
financial crisis. Nature Climate Change 2, 2 – 4. doi: 10.1038 / nclimate1332,
ISBN: 1758-678X.
Peters G� P�, J� C� Minx, C� L� Weber, and O� Edenhofer (2011)� Growth in emission
transfers via international trade from 1990 to 2008. Proceedings of the National
Academy of Sciences 108, 8903 – 8908. doi: 10.1073 / pnas.1006388108.
Peters G� P�, C� L� Weber, D� Guan, and K� Hubacek (2007)� China’s growing CO
2
emissions--a race between increasing consumption and efficiency gains. Envi-
ronmental Science & Technology 41, 5939 – 5944. ISBN: 0013-936X.
Philippine Department of Energy Portal (2014)� Official Website of the Phil-
lipine Department of Energy. Available at: http: / / www. doe. gov. ph / .
Pongratz J�, C� H� Reick, T� Raddatz, and M� Claussen (2009)� Effects of anthro-
pogenic land cover change on the carbon cycle of the last millennium. Global
Biogeochemical Cycles 23, 13 PP. doi: 200910.1029 / 2009GB003488.
Poocharoen O�, and B� K� Sovacool (2012)� Exploring the challenges of energy
and resources network governance. Energy Policy 42, 409 – 418. doi: 10.1016 / j.
enpol.2011.12.005, ISBN: 0301-4215.
Popp A�, S� K� Rose, K� Calvin, D� P� V� Vuuren, J� P� Dietrich, M� Wise, E� Stehfest,
F� Humpenöder, P� Kyle, J� V� Vliet, N� Bauer, H� Lotze-Campen, D� Klein,
and E� Kriegler (2013)� Land-use transition for bioenergy and climate stabili-
zation: model comparison of drivers, impacts and interactions with other land
use based mitigation options. Climatic Change, 1 – 15. doi: 10.1007 / s10584-
013-0926-x, ISBN: 0165-0009, 1573 – 1480.
Poumanyvong P�, and S� Kaneko (2010)� Does urbanization lead to less energy
use and lower CO
2
emissions? A cross-country analysis. Ecological Economics
70, 434 – 444. doi: 10.1016 / j.ecolecon.2010.09.029, ISBN: 0921-8009.
Poumanyvong P�, S� Kaneko, and S� Dhakal (2012)� Impacts of Urbanization
on National Residential Energy Use and CO
2
Emissions: Evidence from Low-,
Middle- and High-Income Countries. Hiroshima University, Graduate School for
International Development and Cooperation (IDEC). Available at: http: / / ideas.
repec.org / p / hir / idecdp / 2 – 5.html.
Pueyo A�, R� García, M� Mendiluce, and D� Morales (2011)� The role of technol-
ogy transfer for the development of a local wind component industry in Chile.
Energy Policy 39, 4274 – 4283. doi: 10.1016 / j.enpol.2011.04.045, ISBN: 0301-
4215.

11371137
Regional Development and Cooperation
14
Chapter 14
Le Quéré C�, R� J� Andres, T� Boden, T� Conway, R� A� Houghton, J� I� House, G�
Marland, G� P� Peters, G� van der Werf, A� Ahlström, R� M� Andrew, L� Bopp,
J� G� Canadell, P� Ciais, S� C� Doney, C� Enright, P� Friedlingstein, C� Hunt-
ingford, A� K� Jain, C� Jourdain, E� Kato, R� F� Keeling, K� Klein Goldewijk, S�
Levis, P� Levy, M� Lomas, B� Poulter, M� R� Raupach, J� Schwinger, S� Sitch,
B� D� Stocker, N� Viovy, S� Zaehle, and N� Zeng (2012)� The global carbon
budget 1959 – 2011. Earth System Science Data Discussions 5, 1107 – 1157. doi:
10.5194 / essdd-5-1107-2012, ISBN: 1866-3591.
Le Quéré C�, M� R� Raupach, J� G� Canadell, G� M� et Al, C� L� Q� et Al, G� Mar-
land, L� Bopp, P� Ciais, T� J� Conway, S� C� Doney, R� A� Feely, P� Foster, P�
Friedlingstein, K� Gurney, R� A� Houghton, J� I� House, C� Huntingford, P� E�
Levy, M� R� Lomas, J� Majkut, N� Metzl, J� P� Ometto, G� P� Peters, I� C� Pren-
tice, J� T� Randerson, S� W� Running, J� L� Sarmiento, U� Schuster, S� Sitch, T�
Takahashi, N� Viovy, G� R� van der Werf, and F� I� Woodward (2009)� Trends
in the sources and sinks of carbon dioxide. Nature Geoscience 2, 831 – 836. doi:
10.1038 / ngeo689, ISBN: 1752-0894.
Ragwitz M�, S� Steinhilber, G� Resch, C� Panzer, A� Ortner, S� Busch, M� Rath-
mann, C� Klessmann, C� Nabe, I� Lovinfosse de, K� Neuhoff, R� Boyd, M�
Junginger, R� Hoefnagels, N� Cusumano, A� Lorenzoni, J� Burgers, M�
Boots, I� Konstantinaviciute, and B� Weöres (2012)� RE-Shaping: Shap-
ing an Effective and Efficient European Renewable Energy Market. Karlsruhe,
Germany. Available at: http: / / www. reshaping-res-policy. eu / downloads / Final
report RE-Shaping_Druck_D23.pdf.
Ravallion M� (2002)� On the urbanization of poverty. Journal of Development Eco-
nomics 68, 435 – 442. doi: 10.1016 / S0304-3878(02)00021-4, ISBN: 0304-3878.
Rehman I� H�, A� Kar, M� Banerjee, P� Kumar, M� Shardul, J� Mohanty, and I�
Hossain (2012)� Understanding the political economy and key drivers of
energy access in addressing national energy access priorities and policies.
Energy Policy 47, Supplement 1, 27 – 37. doi: 10.1016 / j.enpol.2012.03.043,
ISBN: 0301-4215.
Reilly J�, P� H� Stone, C� E� Forest, M� D� Webster, H� D� Jacoby, and R� G� Prinn
(2001)� Uncertainty and Climate Change Assessments. Science 293, 430 – 433.
doi: 10.1126 / science.1062001, ISBN: 0036-8075, 1095 – 9203.
Renner S� (2009)� The Energy Community of Southeast Europe: A neo-functionalist
project of regional integration. European Integration Online Papers (EIoP) 13.
ISBN: 1027-5193.
Del Río P� (2010)� Analysing the interactions between renewable energy promo-
tion and energy efficiency support schemes: The impact of different instru-
ments and design elements. Energy Policy 38, 4978 – 4989. doi: 10.1016 / j.
enpol.2010.04.003, ISBN: 0301-4215.
Rowlands I� H� (2005)� The European directive on renewable electricity: con-
flicts and compromises. Energy Policy 33, 965 – 974. doi: 10.1016 / j.
enpol.2003.10.019, ISBN: 0301-4215.
Ru P�, Q� Zhi, F� Zhang, X� Zhong, J� Li, and J� Su (2012)� Behind the development
of technology: The transition of innovation modes in China’s wind turbine man-
ufacturing industry. Energy Policy 43, 58 – 69. doi: 10.1016 / j.enpol.2011.12.025,
ISBN: 0301-4215.
Van Ruijven B� J�, D� P� van Vuuren, J� van Vliet, A� Mendoza Beltran, S� Deet-
man, and M� G� J� den Elzen (2012)� Implications of greenhouse gas emission
mitigation scenarios for the main Asian regions. Energy Economics 34, Supple-
ment 3, S459 – S469. doi: 10.1016 / j.eneco.2012.03.013, ISBN: 0140-9883.
Sathaye J�, Lucon, A� Rahman, J� Christensen, F� Denton, J� Fujino, G� Heath,
S� Kadner, M� Mirza, H� Rudnick, A� Schlaepfer, and A� Shmakin (2011)�
Renewable Energy in the Context of Sustainable Development. In: Renewable
Energy Sources and Climate Change Mitigation — Special Report of the Inter-
governmental Panel on Climate Change [O. Edenhofer, R. Pichs-Madruga, Y.
Sokona, K. Seyboth, P. Matschoss, S. Kadner, T. Zwickel, P. Eickemeier, G. Han-
sen, S. Schlömer, C. von Stechow (eds)]. Cambridge University Press, Cambridge,
United Kingdom and New York, NY, USAISBN: 9781107607101.
Sathaye J�, W� Makundi, L� Dale, P� Chan, and K� Andrasko (2005)� Generalized
Comprehensive Mitigation Assessment Process (GCOMAP): A Dynamic Partial
Equilibrium Model for. U. S. Environmental Protection Agency, Washington,
D. C., 93 pp. Available at: http: / / eetd.lbl.gov / sites / all / files / lbnl-58291.pdf.
Schäfer W� (2009)� Some Talk, No Action (Yet): Interdependence, Domestic Inter-
ests and Hierarchical EU Governance in Climate Policy. Swiss Political Science
Review 15, 683 – 713.
Schopp A�, and K� Neuhoff (2013)� The Role of Hedging in Carbon Markets. Social
Science Research Network, Rochester, NY. Available at: http: / / papers.ssrn.
com / abstract=2239646.
Schreurs M� A� (2011)� Transboundary cooperation to address acid rain: Europe,
North America, and East Asia compared. In: Beyond Resource Wars Scarcity,
Environmental Degradation, and International Cooperation. S. Dinar, (ed.), MIT
Press, Cambridge, pp.89 – 116.
Selin H�, and S� D� Vandeveer (2005)� Canadian-U. S. Environmental Cooperation:
Climate Change Networks and Regional Action. American Review of Canadian
Studies 35, 353 – 378. doi: 10.1080 / 02722010509481376, ISBN: 0272-2011.
Shukla P� R�, and S� Dhar (2011)� Climate agreements and India: aligning options
and opportunities on a new track. International Environmental Agreements:
Politics, Law and Economics 11, 229 – 243. doi: 10.1007 / s10784-011-9158-6,
ISBN: 1567-9764, 1573 – 1553.
Sinden G� E�, G� P� Peters, J� Minx, and C� L� Weber (2011)� International flows of
embodied CO
2
with an application to aluminium and the EU ETS. Climate Policy
11, 1226 – 1245. doi: 10.1080 / 14693062.2011.602549, ISBN: 1469-3062.
Skelton A�, D� Guan, G� P� Peters, and D� Crawford-Brown (2011)� Mapping
Flows of Embodied Emissions in the Global Production System. Environmental
Science & Technology 45, 10516 – 10523. doi: 10.1021 / es202313e, ISBN: 0013-
936X.
Skjærseth J� B� (2010)� EU emissions trading: Legitimacy and stringency. Environ-
mental Policy and Governance 20, 295 – 308.
Skjærseth J� B�, and J� Wettestad (2008)� Implementing EU emissions trading:
success or failure? International Environmental Agreements: Politics, Law and
Economics 8, 275 – 290. doi: 10.1007 / s10784-008-9068-4, ISBN: 1567-9764,
1573 – 1553.
Skjærseth J� B�, and J� Wettestad (2009)� The origin, evolution and consequences
of the EU emissions trading system. Global Environmental Politics 9, 101 – 122.
Skjærseth J� B�, and J� Wettestad (2010)� Fixing the EU Emissions Trading Sys-
tem? Understanding the Post-2012 Changes. Global Environmental Politics 10,
101 – 123.
Smil V� (2000)� Energy in the Twentieth Century: Resources, Conversions, Costs,
Uses, and Consequences. Annual Review of Energy and the Environment 25,
21 – 51. doi: 10.1146 / annurev.energy.25.1.21.

11381138
Regional Development and Cooperation
14
Chapter 14
Smith P�, M� Bustamante, H� Ahammad, H� Clark, H� M� Dong, E� A� Elsiddig, H�
Haberl, R� J� Harper, M� Jafari, O� Masera, C� Mbow, N� H� Ravindranath,
C� W� Rice, C� Robledo, C� Abad, A� Romanovskaya, F� Sperling, R� Zoug-
more, G� Berndes, M� Herrero, A� Popp, A� de Siqueira Pinto, S� Sohi, and
F� N� Tubiello (2013)� How much land based greenhouse gas mitigation can be
achieved without compromising food security and environmental goals? Global
Change Biology to be submitted September 2012.
Smith P�, D� Martino, Z� Cai, D� Gwary, H� Janzen, P� Kumar, B� McCarl, S� Ogle,
F� O’Mara, C� Rice, B� Scholes, O� Sirotenko, M� Howden, T� McAllister, G�
Pan, V� Romanenkov, U� Schneider, S� Towprayoon, M� Wattenbach, and
J� Smith (2008)� Greenhouse gas mitigation in agriculture. Philosophical
Transactions of the Royal Society B: Biological Sciences 363, 789 – 813. doi:
10.1098 / rstb.2007.2184, ISBN: 0962-8436.
Somorin O� A�, H� Brown, I� J� Visseren-Hamakers, D� J� Sonwa, B� Arts, and J�
Nkem (2011)� The Congo Basin forests in a changing climate: Policy discourses
on adaptation and mitigation (REDD+). Global Environmental Change.
Sorrell S�, D� Harrison, D� Radov, P� Klevnas, and A� Foss (2009)� White cer-
tificate schemes: Economic analysis and interactions with the EU ETS. Energy
Policy 37, 29 – 42. doi: 10.1016 / j.enpol.2008.08.009, ISBN: 0301-4215.
Souza T� L� de, and L� Hasenclever (2011)� The Brazilian system of innovation
for bioethanol: a case study on the strategic role of the standardisation pro-
cess. International Journal of Technology and Globalisation 5, 341 — 356. doi:
10.1504 / IJTG.2011.039771.
Sovacool B� K� (2009)� Energy policy and cooperation in Southeast Asia: The his-
tory, challenges, and implications of the trans-ASEAN gas pipeline (TAGP) net-
work. Energy Policy 37, 2356 – 2367. doi: 10.1016 / j.enpol.2009.02.014, ISBN:
0301-4215.
Sovacool B� K� (2012a)� Design principles for renewable energy programs
in developing countries. Energy & Environmental Science 5, 9157. doi:
10.1039 / c2ee22468b, ISBN: 1754-5692, 1754 – 5706.
Sovacool B� K� (2012b)� Deploying Off-Grid Technology to Eradicate Energy Pov-
erty. Science 338, 47 – 48. doi: 10.1126 / science.1222307, ISBN: 0036-8075,
1095 – 9203.
Sovacool B� K� (2013)� A qualitative factor analysis of renewable energy and Sus-
tainable Energy for All (SE4ALL) in the Asia-Pacific. Energy Policy 59, 393 – 403.
doi: 10.1016 / j.enpol.2013.03.051, ISBN: 0301-4215.
Sovacool B� K�, C� Cooper, M� Bazilian, K� Johnson, D� Zoppo, S� Clarke, J�
Eidsness, M� Crafton, T� Velumail, and H� A� Raza (2012)� What moves and
works: Broadening the consideration of energy poverty. Energy Policy 42,
715 – 719. doi: 10.1016 / j.enpol.2011.12.007, ISBN: 0301-4215.
Steckel J� C�, M� Jakob, R� Marschinski, and G� Luderer (2011)� From carbon-
ization to decarbonization? — Past trends and future scenarios for China’s CO
2
emissions. Energy Policy 39, 3443 – 3455. doi: 10.1016 / j.enpol.2011.03.042,
ISBN: 0301-4215.
Steemers K� (2003)� Energy and the city: density, buildings and transport. Energy
and Buildings 35, 3 – 14. doi: 10.1016 / S0378-7788(02)00075-0, ISBN: 0378-
7788.
Steinberger J� K�, J� T� Roberts, G� P� Peters, and G� Baiocchi (2012)� Pathways of
human development and carbon emissions embodied in trade. Nature Climate
Change 2, 81 – 85. doi: 10.1038 / nclimate1371, ISBN: 1758-678X.
Stern N� (2006)� What is the Economics of Climate Change? World Economics 7.
Available at: http: / / www. minnlake. eans. net / Presse / PMitt / 2006 / 061030c76.
pdf.
Stern D� I� (2007)� The Effect of NAFTA on Energy and Environmental Effi-
ciency in Mexico. Policy Studies Journal 35, 291 – 322. doi: 10.1111 / j.1541-
0072.2007.00221.x, ISBN: 1541-0072.
Strietska-Ilina O� (2011)� Skills for green jobs: a global view: synthesis report
based on 21 country studies. International Labor Office, Geneva.
Sustainable Energy for All (2013)� Chapter 2: Universal Access to Modern Energy
Services. In: Global Tracking Framework. United Nations, New York, NY Avail-
able at: http: / / www. sustainableenergyforall. org / images / Global_Tracking /
7-gtf_ch2.pdf.
Swart R�, and F� Raes (2007)� Making integration of adaptation and mitigation
work: mainstreaming into sustainable development policies. Climate Policy 7,
288 – 303.
Taplin R�, and J� McGee (2010)� The Asia-Pacific Partnership: implementation
challenges and interplay with Kyoto. Wiley Interdisciplinary Reviews: Climate
Change 1, 16 – 22. doi: 10.1002 / wcc.10, ISSN: 17577780.
Tavoni M�, E� Kriegler, T� Aboumaboub, K� V� Calvin, G� De Maeure, J� Jewell,
T� Kober, P� Lucas, G� Luderer, D� McCollum, G� Marangoni, K� Riahi, and
D� Van Vuuren (2014)� The Distribution of the Major Economies’ Effort in the
Durban Platform Scenarios. Climate Change Economics.
Tešić M�, F� Kiss, and Z� Zavargo (2011)� Renewable energy policy in the Repub-
lic of Serbia. Renewable and Sustainable Energy Reviews 15, 752 – 758. doi:
10.1016 / j.rser.2010.08.016, ISBN: 1364-0321.
Tuerk A�, M� Mehling, C� Flachsland, and W� Sterk (2009)� Linking carbon mar-
kets: concepts, case studies and pathways. Climate Policy 9, 341 – 357. doi:
10.3763 / cpol.2009.0621, ISBN: 1469-3062.
Tukker A�, and E� Dietzenbacher (2013)� Global Multiregional Input – Output
Frameworks: An Introduction and Outlook. Economic Systems Research 25,
1 – 19. doi: 10.1080 / 09535314.2012.761179, ISBN: 0953-5314.
Uddin S� N�, R� Taplin, and X� Yu (2006)� Advancement of renewables in Ban-
gladesh and Thailand: Policy intervention and institutional settings. Natural
Resources Forum 30, 177 – 187. doi: 10.1111 / j.1477-8947.2006.00113.x, ISBN:
1477-8947.
UNDESA (United Nations, Department of Economic and Social Affairs)
(2006)� World Urbanization Prospects. The 2005 Revision. New York, USA,
210 pp. Available at: http: / / www. un. org / esa / population / publications /
WUP2005 / 2005WUPHighlights_Final_Report.pdf.
UNDESA (United Nations, Department of Economic and Social Affairs)
(2010)� World Urbanization Prospects. The 2009 Revision. New York, USA, 56
pp. Available at: http: / / esa.un.org / unpd / wup / doc_highlights.htm.
UNDESA (United Nations, Department of Economic and Social Affairs) (2011)�
World Urbanization Prospects. The 2011 Revision. The Population Division of
the Department of Economic and Social Affairs of the United Nations, New
York, USA, 318 pp. Available at: http: / / esa.un.org / unpd / wup / Documentation /
final-report.htm.
UNDP W� (2009)� The Energy Access Situation in Developing Countries. New York.
UNDP (2010)� Human Development Report 2010. Available at: http: / / hdr.undp.
org / en / reports / global / hdr2010 / chapters / de / .
UNDP IBSA Fund (2014)� India, Brazil and South Africa (IBSA) Fund. Available at:
http: / / tcdc2.undp.org / IBSA / .
UNEP (2001)� International Environmental Governance: Multilateral Environ-
ment Agreements. United Nations, New York. Available at: http: / / www. unep.
org / ieg / Meetings_docs / index.asp.

11391139
Regional Development and Cooperation
14
Chapter 14
UNEP Risoe Centre (2013)� UNEP Risoe CDM / JI Pipeline Analysis and Database.
Available at: http: / / cdmpipeline.org / .
UNESCAP (2008)� Energy Security and Sustainable Development in Asia and the
Pacific. Bangkok. Available at: http: / / www. unescap. org / esd / publications /
energy / theme_study / energy-security-ap.pdf.
UNESCO Bejing (2012)� UNESCO Chair in South-South Cooperation on Sci-
ence and Technology to Address Climate Change. Available at: http: / / www.
unescobej. org / natural-sciences / resources / news-and-upcoming-events / 2012 /
unesco-chair-in-south-south-cooperation-on-science-and-technology-to-
address-climate-change / .
UNFCCC (2011)� Decision 1 / CP.16. Report of the Conference of the Parties on Its
Sixteenth Session. Cancun. 29 November to 10 December 2010. Part Two.
UNIDO (2010)� Independent Thematic Review: UNIDO Projects for the Promotion of
Small Hydro Power for Productive Use. UNITED NATIONS INDUSTRIAL DEVEL-
OPMENT ORGANIZATION, Vienna, Austria. Available at: http: / / www. unido.
org / fileadmin / user_media / About_UNIDO / Evaluation / Project_reports / e-book_
small-hydro.PDF.
United Nations (2010)� Report of the Secretary-General’s High-level Advisory
Group on Climate Change Financing. United Nations. Available at: http: / / www.
un. org / wcm / webdav / site / climatechange / shared / Documents / AGF_
reports / AGF%20Report.pdf.
United Nations (2013)� World Population Prospect: The 2012 Revision.
United Nations Development Programme: China (2005)� South-South Coopera-
tion. Available at: http: / / www. undp. org. cn / modules.php?op=modload&name=
News&file=article&catid=17&sid=14.
Unruh G� C�, and J� Carrillo-Hermosilla (2006)� Globalizing carbon lock-in. Energy
Policy 34, 1185 – 1197. doi: 10.1016 / j.enpol.2004.10.013, ISBN: 0301-4215.
US Department of State (2011)� Asia-Pacific Partnership on Clean Development
and Climate. Available at: http: / / www. asiapacificpartnership. org / english /
default.aspx.
USAID (2007)� From Ideas to Action. Clean Energy Solutions for Asia to Address Climate
Change. USAID-Asia, 146 pp. Available at: http: / / usaid.eco-asia.org / programs /
cdcp / reports / Ideas-to-Action / From%20Ideas%20to%20Action_Complete%20
Report.pdf.
Verdolini E�, and M� Galeotti (2011)� At home and abroad: An empirical analysis
of innovation and diffusion in energy technologies. Journal of Environmental
Economics and Management 61, 119 – 134. doi: 10.1016 / j.jeem.2010.08.004,
ISBN: 0095-0696.
Vetőné Mózner Z� (2013)� A consumption-based approach to carbon emission
accounting — sectoral differences and environmental benefits. Journal of
Cleaner Production 42, 83 – 95. doi: 10.1016 / j.jclepro.2012.10.014, ISBN: 0959-
6526.
Victor D� G� (2006)� Toward Effective International Cooperation on Climate Change:
Numbers, Interests and Institutions. Global Environmental Politics 6, 90 – 103.
doi: Article, ISSN: 15263800.
Vignola R�, B� Locatelli, C� Martinez, and P� Imbach (2009)� Ecosystem-based
adaptation to climate change: what role for policy-makers, society and scien-
tists? Mitigation and Adaptation Strategies for Global Change 14, 691 – 696.
Walz R� (2010)� Competences for green development and leapfrogging in newly
industrializing countries. International Economics and Economic Policy 7,
245 – 265. doi: 10.1007 / s10368-010-0164-x, ISBN: 1612-4804.
Wamukonya N� (2007)� Solar home system electrification as a viable technol-
ogy option for Africa’s development. Energy Policy 35, 6 – 14. doi: 10.1016 / j.
enpol.2005.08.019, ISBN: 0301-4215.
Wang T�, and J� Watson (2008)� China’s Energy Transition: Pathways for Low Car-
bon Development. Sussex Energy Group SPRU, University of Sussex, UK and
Tyndall Centre for Climate Change Research, UK.
Watson J�, and R� Sauter (2011)� Sustainable innovation through leapfrogging: a
review of the evidence. International Journal of Technology and Globalisation 5,
170 — 189. doi: 10.1504 / IJTG.2011.039763.
Weber C� L�, and H� S� Matthews (2007)� Embodied environmental emissions in
U. S. international trade, 1997 – 2004. Environmental Science & Technology 41,
4875 – 4881. ISBN: 0013-936X.
Weber C� L�, G� P� Peters, D� Guan, and K� Hubacek (2008)� The contribution of
Chinese exports to climate change. Energy Policy 36, 3572 – 3577. doi: 16 / j.
enpol.2008.06.009, ISBN: 0301-4215.
Wettestad J� (2009)� Interaction between EU carbon trading and the international
climate regime: synergies and learning. International Environmental Agree-
ments: Politics, Law and Economics 9, 393 – 408. doi: 10.1007 / s10784-009-
9107-9, ISBN: 1567-9764, 1573 – 1553.
Wiebe K� S�, M� Bruckner, S� Giljum, and C� Lutz (2012)� Calculating Energy-
Related CO
2
Emissions Embodied in International Trade Using a Global
Input – Output Model. Economic Systems Research 24, 113 – 139. doi:
10.1080 / 09535314.2011.643293, ISBN: 0953-5314.
Wiedmann T� (2009)� A review of recent multi-region input – output models used
for consumption-based emission and resource accounting. Ecological Econom-
ics 69, 211 – 222. doi: 10.1016 / j.ecolecon.2009.08.026, ISBN: 0921-8009.
Wiedmann T�, M� Lenzen, K� Turner, and J� Barrett (2007)� Examining the global
environmental impact of regional consumption activities — Part 2: Review of
input – output models for the assessment of environmental impacts embodied in
trade. Ecological Economics 61, 15 – 26. doi: 10.1016 / j.ecolecon.2006.12.003,
ISSN: 09218009.
Wiel S�, and J� E� McMahon (2005)� Energy Efficiency Labels and Standards: A
Guidebook for Appliances, Equipment, and Lighting. Collaborative Labeling and
Appliance Standards Program (CLASP), Washington, D. C., USA, 321 pp. Avail-
able at: http: / / www. clasponline. org / Resources / Resources / StandardsLabeling
ResourceLibrary / 2005 / ~ / media / Files / SLDocuments / 2005_SLGuidebook /
English / SLGuidebook_eng_1_FullGuidebook.pdf.
Winchester N�, S� Paltsev, and J� M� Reilly (2011)� Will Border Carbon Adjustments
Work? The B. E. Journal of Economic Analysis & Policy 11. doi: 10.2202 / 1935-
1682.2696, ISBN: 1935-1682.
World Bank (2011)� World Development Indicators 2011. World Bank Publications,
Washington DC, USA, 488 pp. ISBN: 978 – 0-8213 – 8709 – 2.
World Bank (2012)� World Development Indicators 2012. World Bank Publications,
Washington DC, USA, 463 pp. ISBN: 978 – 0-8213 – 8985 – 0.
World Bank (2013a)� International Comparison Program Database 2013. Available
at: http: / / data.worldbank.org / data-catalog / international-comparison-program.
World Bank (2013b)� World Development Indicators 2013. World Bank Publica-
tions, Washington DC, USA, 152 pp. ISBN: 978 – 0-8213 – 9824 – 1.
WTO (2013)� WTO | Regional Trade Agreements gateway. Available at: http: / / www.
wto. org / english / tratop_e / region_e / region_e.htm.

11401140
Regional Development and Cooperation
14
Chapter 14
Wyatt A� B�, and I� G� Baird (2007)� Transboundary Impact Assessment in the
Sesan River Basin: The Case of the Yali Falls Dam. International Journal of Water
Resources Development 23, 427 – 442. doi: 10.1080 / 07900620701400443,
ISBN: 0790-0627.
Yoon S�-C� (2009)� Systemic problems in technology transfer in emerging mar-
kets. International Journal of Technology and Globalisation 4, 341 — 349. doi:
10.1504 / IJTG.2009.032735.
York R� (2007)� Demographic trends and energy consumption in European Union
Nations, 1960 – 2025. Social Science Research 36, 855 – 872. doi: 10.1016 / j.ssre-
search.2006.06.007, ISBN: 0049-089X.
York R�, E� A� Rosa, and T� Dietz (2003)� STIRPAT, IPAT and ImPACT: analytic tools
for unpacking the driving forces of environmental impacts. Ecological Econom-
ics 46, 351 – 365. doi: 10.1016 / S0921-8009(03)00188-5, ISBN: 0921-8009.
Zarsky L� (2010)� Climate-Resilient Industrial Development Paths: Design Prin-
ciples and Alternative Models. In: Towards New Developmentalism: Market as
Means rather than Master. S. R. Khan, J. Christiansen, (eds.), Taylor & Francis,
pp.227 – 251. ISBN: 9780203844311.
Zawilska E�, and M� J� Brooks (2011)� An assessment of the solar resource for
Durban, South Africa. Renewable Energy 36, 3433 – 3438. doi: 10.1016 / j.
renene.2011.05.023, ISBN: 0960-1481.
Zelli F� (2011)� The fragmentation of the global climate governance architec-
ture. Wiley Interdisciplinary Reviews: Climate Change 2, 255 – 270. doi:
10.1002 / wcc.104, ISBN: 1757-7799.
Zerriffi H� (2011)� Innovative business models for the scale-up of energy access
efforts for the poorest. Current Opinion in Environmental Sustainability 3,
272 – 278. doi: 10.1016 / j.cosust.2011.05.002, ISBN: 1877-3435.
Zhao X�, C� Ma, and D� Hong (2010)� Why did China’s energy intensity increase
during 1998 – 2006: Decomposition and policy analysis. Energy Policy 38,
1379 – 1388. doi: 10.1016 / j.enpol.2009.11.019, ISBN: 0301-4215.
Zigova K�, R� Fuchs, L� Jiang, B� C� O’Neill, and S� Pachauri (2009)� Household
Survey Data Used in Calibrating the Population-Environment-Technology
Model. International Institute for Applied Systems Analysis, Laxenburg, Austria,
31 pp. Available at: http: / / www. iiasa. ac. at / Admin / PUB / Documents / IR-09 – 046.
pdf.
