
811
11
Agriculture, Forestry and
Other Land Use (AFOLU)
Coordinating Lead Authors:
Pete Smith (UK), Mercedes Bustamante (Brazil)
Lead Authors:
Helal Ahammad (Australia), Harry Clark (New Zealand), Hongmin Dong (China), Elnour A. Elsiddig
(Sudan), Helmut Haberl (Austria), Richard Harper (Australia), Joanna House (UK), Mostafa Jafari
(Iran), Omar Masera (Mexico), Cheikh Mbow (Senegal), Nijavalli H. Ravindranath (India), Charles
W. Rice (USA), Carmenza Robledo Abad (Switzerland / Colombia), Anna Romanovskaya (Russian
Federation), Frank Sperling (Germany / Tunisia), Francesco N. Tubiello (FAO / USA / Italy)
Contributing Authors:
Göran Berndes (Sweden), Simon Bolwig (Denmark), Hannes Böttcher (Austria / Germany), Ryan
Bright (USA / Norway), Francesco Cherubini (Italy / Norway), Helena Chum (Brazil / USA), Esteve
Corbera (Spain), Felix Creutzig (Germany), Mark Delucchi (USA), Andre Faaij (Netherlands), Joe
Fargione (USA), Gesine Hänsel (Germany), Garvin Heath (USA), Mario Herrero (Kenya), Richard
Houghton (USA), Heather Jacobs (FAO / USA), Atul K. Jain (USA), Etsushi Kato (Japan), Oswaldo
Lucon (Brazil), Daniel Pauly (France / Canada), Richard Plevin (USA), Alexander Popp (Germany),
John R. Porter (Denmark / UK), Benjamin Poulter (USA), Steven Rose (USA), Alexandre de Siqueira
Pinto (Brazil), Saran Sohi (UK), Benjamin Stocker (USA), Anders Strømman (Norway), Sangwon Suh
(Republic of Korea / USA), Jelle van Minnen (Netherlands)
Review Editors:
Thelma Krug (Brazil), Gert-Jan Nabuurs (Netherlands)
Chapter Science Assistant:
Marina Molodovskaya (Canada / Uzbekistan)

812812
Agriculture, Forestry and Other Land Use (AFOLU)
11
Chapter 11
This chapter should be cited as:
Smith P., M. Bustamante, H. Ahammad, H. Clark, H. Dong, E. A. Elsiddig, H. Haberl, R. Harper, J. House, M. Jafari, O. Masera,
C. Mbow, N. H. Ravindranath, C. W. Rice, C. Robledo Abad, A. Romanovskaya, F. Sperling, and F. Tubiello, 2014: Agricul-
ture, Forestry and Other Land Use (AFOLU). In: Climate Change 2014: Mitigation of Climate Change. Contribution of
Working Group III to the Fifth Assessment Report of the Intergovernmental Panel on Climate Change [Edenhofer, O., R.
Pichs-Madruga, Y. Sokona, E. Farahani, S. Kadner, K. Seyboth, A. Adler, I. Baum, S. Brunner, P. Eickemeier, B. Kriemann, J.
Savolainen, S. Schlömer, C. von Stechow, T. Zwickel and J.C. Minx (eds.)]. Cambridge University Press, Cambridge, United
Kingdom and New York, NY, USA.

813813
Agriculture, Forestry and Other Land Use (AFOLU)
11
Chapter 11
Contents
Executive Summary � � � � � � � � � � � � � � � � � � � � � � � � � � � � � � � � � � � � � � � � � � � � � � � � � � � � � � � � � � � � � � � � � � � � � � � � � � � � � � � � � � � � � � � � � � � � � � � � � � � � � � � � � � � � � � � 816
11�1 Introduction � � � � � � � � � � � � � � � � � � � � � � � � � � � � � � � � � � � � � � � � � � � � � � � � � � � � � � � � � � � � � � � � � � � � � � � � � � � � � � � � � � � � � � � � � � � � � � � � � � � � � � � � � � � 818
11�2 New developments in emission trends and drivers � � � � � � � � � � � � � � � � � � � � � � � � � � � � � � � � � � � � � � � � � � � � � � � � � � � � � � � 819
11�2�1 Supply and consumption trends in agriculture and forestry
� � � � � � � � � � � � � � � � � � � � � � � � � � � � � � � � � � � � � � � � � � � � � � � 822
11�2�2 Trends of GHG emissions from agriculture
� � � � � � � � � � � � � � � � � � � � � � � � � � � � � � � � � � � � � � � � � � � � � � � � � � � � � � � � � � � � � � � � � 822
11�2�3 Trends of GHG fluxes from forestry and other land use
� � � � � � � � � � � � � � � � � � � � � � � � � � � � � � � � � � � � � � � � � � � � � � � � � � � � 825
11�3 Mitigation technology options and practices, and behavioural aspects � � � � � � � � � � � � � � � � � � � � � � � � � � � � 829
11�3�1 Supply-side mitigation options
� � � � � � � � � � � � � � � � � � � � � � � � � � � � � � � � � � � � � � � � � � � � � � � � � � � � � � � � � � � � � � � � � � � � � � � � � � � � � 829
11�3�2 Mitigation effectiveness (non- permanence: saturation,
human and natural impacts, displacement)
� � � � � � � � � � � � � � � � � � � � � � � � � � � � � � � � � � � � � � � � � � � � � � � � � � � � � � � � � � � � � � � � � 832
11�4 Infrastructure and systemic perspectives� � � � � � � � � � � � � � � � � � � � � � � � � � � � � � � � � � � � � � � � � � � � � � � � � � � � � � � � � � � � � � � � � � � � � 836
11�4�1 Land: a complex, integrated system
� � � � � � � � � � � � � � � � � � � � � � � � � � � � � � � � � � � � � � � � � � � � � � � � � � � � � � � � � � � � � � � � � � � � � � � � 836
11�4�2 Mitigation in AFOLU — feedbacks with land-use competition
� � � � � � � � � � � � � � � � � � � � � � � � � � � � � � � � � � � � � � � � � � � � � � 837
11�4�3 Demand-side options for reducing GHG emissions from AFOLU
� � � � � � � � � � � � � � � � � � � � � � � � � � � � � � � � � � � � � � � � � � � 838
11�4�4 Feedbacks of changes in land demand
� � � � � � � � � � � � � � � � � � � � � � � � � � � � � � � � � � � � � � � � � � � � � � � � � � � � � � � � � � � � � � � � � � � � � � 841
11�4�5 Sustainable development and behavioural aspects
� � � � � � � � � � � � � � � � � � � � � � � � � � � � � � � � � � � � � � � � � � � � � � � � � � � � � � � � 842
11�5 Climate change feedback and interaction with adaptation (includes vulnerability) � � � � � � � � � � � � 843
11�5�1 Feedbacks between ALOFU and climate change
� � � � � � � � � � � � � � � � � � � � � � � � � � � � � � � � � � � � � � � � � � � � � � � � � � � � � � � � � � � � 845
11�5�2 Implications of climate change on terrestrial carbon pools and mitigation potential of forests
� � � � � � � � � 845
11�5�3 Implications of climate change on peatlands, grasslands, and croplands
� � � � � � � � � � � � � � � � � � � � � � � � � � � � � � � � � 845
11�5�4 Potential adaptation options to minimize the impact of climate change on carbon stocks in forests and
agricultural soils
� � � � � � � � � � � � � � � � � � � � � � � � � � � � � � � � � � � � � � � � � � � � � � � � � � � � � � � � � � � � � � � � � � � � � � � � � � � � � � � � � � � � � � � � � � � � � 846
11�5�5 Mitigation and adaptation synergies and tradeoffs
� � � � � � � � � � � � � � � � � � � � � � � � � � � � � � � � � � � � � � � � � � � � � � � � � � � � � � � � 846

814814
Agriculture, Forestry and Other Land Use (AFOLU)
11
Chapter 11
11�6 Costs and potentials � � � � � � � � � � � � � � � � � � � � � � � � � � � � � � � � � � � � � � � � � � � � � � � � � � � � � � � � � � � � � � � � � � � � � � � � � � � � � � � � � � � � � � � � � � � � � � � � 847
11�6�1 Approaches to estimating economic mitigation potentials
� � � � � � � � � � � � � � � � � � � � � � � � � � � � � � � � � � � � � � � � � � � � � � � � 848
11�6�2 Global estimates of costs and potentials in the AFOLU sector
� � � � � � � � � � � � � � � � � � � � � � � � � � � � � � � � � � � � � � � � � � � � � 848
11�6�3 Regional disaggregation of global costs and potentials in the AFOLU sector
� � � � � � � � � � � � � � � � � � � � � � � � � � � � � 849
11�7 Co-benefits, risks, and spillovers � � � � � � � � � � � � � � � � � � � � � � � � � � � � � � � � � � � � � � � � � � � � � � � � � � � � � � � � � � � � � � � � � � � � � � � � � � � � � � � � 852
11�7�1 Socio-economic effects
� � � � � � � � � � � � � � � � � � � � � � � � � � � � � � � � � � � � � � � � � � � � � � � � � � � � � � � � � � � � � � � � � � � � � � � � � � � � � � � � � � � � � � 853
11�7�2 Environmental effects
� � � � � � � � � � � � � � � � � � � � � � � � � � � � � � � � � � � � � � � � � � � � � � � � � � � � � � � � � � � � � � � � � � � � � � � � � � � � � � � � � � � � � � � 855
11�7�3 Public perception
� � � � � � � � � � � � � � � � � � � � � � � � � � � � � � � � � � � � � � � � � � � � � � � � � � � � � � � � � � � � � � � � � � � � � � � � � � � � � � � � � � � � � � � � � � � � 857
11�7�4 Spillovers
� � � � � � � � � � � � � � � � � � � � � � � � � � � � � � � � � � � � � � � � � � � � � � � � � � � � � � � � � � � � � � � � � � � � � � � � � � � � � � � � � � � � � � � � � � � � � � � � � � � � 858
11�8 Barriers and opportunities � � � � � � � � � � � � � � � � � � � � � � � � � � � � � � � � � � � � � � � � � � � � � � � � � � � � � � � � � � � � � � � � � � � � � � � � � � � � � � � � � � � � � � � � 858
11�8�1 Socio-economic barriers and opportunities
� � � � � � � � � � � � � � � � � � � � � � � � � � � � � � � � � � � � � � � � � � � � � � � � � � � � � � � � � � � � � � � � � 858
11�8�2 Institutional barriers and opportunities
� � � � � � � � � � � � � � � � � � � � � � � � � � � � � � � � � � � � � � � � � � � � � � � � � � � � � � � � � � � � � � � � � � � � 858
11�8�3 Ecological barriers and opportunities
� � � � � � � � � � � � � � � � � � � � � � � � � � � � � � � � � � � � � � � � � � � � � � � � � � � � � � � � � � � � � � � � � � � � � � � 859
11�8�4 Technological barriers and opportunities
� � � � � � � � � � � � � � � � � � � � � � � � � � � � � � � � � � � � � � � � � � � � � � � � � � � � � � � � � � � � � � � � � � � 859
11�9 Sectoral implications of transformation pathways and sustainable development � � � � � � � � � � � � � � 859
11�9�1 Characterization of transformation pathways
� � � � � � � � � � � � � � � � � � � � � � � � � � � � � � � � � � � � � � � � � � � � � � � � � � � � � � � � � � � � � � 860
11�9�2 Implications of transformation pathways for the AFOLU sector
� � � � � � � � � � � � � � � � � � � � � � � � � � � � � � � � � � � � � � � � � � � 862
11�9�3 Implications of transformation pathways for sustainable development
� � � � � � � � � � � � � � � � � � � � � � � � � � � � � � � � � � 862
11�10 Sectoral policies � � � � � � � � � � � � � � � � � � � � � � � � � � � � � � � � � � � � � � � � � � � � � � � � � � � � � � � � � � � � � � � � � � � � � � � � � � � � � � � � � � � � � � � � � � � � � � � � � � � � � � 862
11�10�1 Economic incentives
� � � � � � � � � � � � � � � � � � � � � � � � � � � � � � � � � � � � � � � � � � � � � � � � � � � � � � � � � � � � � � � � � � � � � � � � � � � � � � � � � � � � � � � � � 864
11�10�2 Regulatory and control approaches
� � � � � � � � � � � � � � � � � � � � � � � � � � � � � � � � � � � � � � � � � � � � � � � � � � � � � � � � � � � � � � � � � � � � � � � � � 864
11�10�3 Information schemes
� � � � � � � � � � � � � � � � � � � � � � � � � � � � � � � � � � � � � � � � � � � � � � � � � � � � � � � � � � � � � � � � � � � � � � � � � � � � � � � � � � � � � � � � 868
11�10�4 Voluntary actions and agreements
� � � � � � � � � � � � � � � � � � � � � � � � � � � � � � � � � � � � � � � � � � � � � � � � � � � � � � � � � � � � � � � � � � � � � � � � � � 868
11�11 Gaps in knowledge and data � � � � � � � � � � � � � � � � � � � � � � � � � � � � � � � � � � � � � � � � � � � � � � � � � � � � � � � � � � � � � � � � � � � � � � � � � � � � � � � � � � � � � 868

815815
Agriculture, Forestry and Other Land Use (AFOLU)
11
Chapter 11
11�12 Frequently Asked Questions � � � � � � � � � � � � � � � � � � � � � � � � � � � � � � � � � � � � � � � � � � � � � � � � � � � � � � � � � � � � � � � � � � � � � � � � � � � � � � � � � � � � � � 869
11�13 Appendix Bioenergy: Climate effects, mitigation options, potential and
sustainability implications
� � � � � � � � � � � � � � � � � � � � � � � � � � � � � � � � � � � � � � � � � � � � � � � � � � � � � � � � � � � � � � � � � � � � � � � � � � � � � � � � � � � � � � � � 870
11�13�1 Introduction
� � � � � � � � � � � � � � � � � � � � � � � � � � � � � � � � � � � � � � � � � � � � � � � � � � � � � � � � � � � � � � � � � � � � � � � � � � � � � � � � � � � � � � � � � � � � � � � � � � 870
11�13�2 Technical bioenergy potential
� � � � � � � � � � � � � � � � � � � � � � � � � � � � � � � � � � � � � � � � � � � � � � � � � � � � � � � � � � � � � � � � � � � � � � � � � � � � � � � 870
11�13�3 Bioenergy conversion: technologies and management practices
� � � � � � � � � � � � � � � � � � � � � � � � � � � � � � � � � � � � � � � � � � 873
11�13�4 GHG emission estimates of bioenergy production systems
� � � � � � � � � � � � � � � � � � � � � � � � � � � � � � � � � � � � � � � � � � � � � � � � 877
11�13�5 Aggregate future potential deployment in integrated models
� � � � � � � � � � � � � � � � � � � � � � � � � � � � � � � � � � � � � � � � � � � � 882
11�13�6 Bioenergy and sustainable development
� � � � � � � � � � � � � � � � � � � � � � � � � � � � � � � � � � � � � � � � � � � � � � � � � � � � � � � � � � � � � � � � � � � 883
11�13�7 Tradeoffs and synergies with land, water, food, and biodiversity
� � � � � � � � � � � � � � � � � � � � � � � � � � � � � � � � � � � � � � � � � � 883
References � � � � � � � � � � � � � � � � � � � � � � � � � � � � � � � � � � � � � � � � � � � � � � � � � � � � � � � � � � � � � � � � � � � � � � � � � � � � � � � � � � � � � � � � � � � � � � � � � � � � � � � � � � � � � � � � � � � � � � � � � � 887

816816
Agriculture, Forestry and Other Land Use (AFOLU)
11
Chapter 11
Executive Summary
Agriculture, Forestry, and Other Land Use (AFOLU) is unique
among the sectors considered in this volume, since the mitiga-
tion potential is derived from both an enhancement of removals
of greenhouse gases (GHG), as well as reduction of emissions
through management of land and livestock (robust evidence;
high agreement). The land provides food that feeds the Earth’s human
population of ca. 7 billion, fibre for a variety of purposes, livelihoods
for billions of people worldwide, and is a critical resource for sustain-
able development in many regions. Agriculture is frequently central to
the livelihoods of many social groups, especially in developing coun-
tries where it often accounts for a significant share of production. In
addition to food and fibre, the land provides a multitude of ecosystem
services; climate change mitigation is just one of many that are vital
to human well-being (robust evidence; high agreement). Mitigation
options in the AFOLU sector, therefore, need to be assessed, as far as
possible, for their potential impact on all other services provided by
land. [Section 11.1]
The AFOLU sector is responsible for just under a quarter
(~10 – 12 GtCO
2
eq / yr) of anthropogenic GHG emissions mainly
from deforestation and agricultural emissions from livestock,
soil and nutrient management (robust evidence; high agreement)
[11.2]. Anthropogenic forest degradation and biomass burning (forest
fires and agricultural burning) also represent relevant contributions.
Annual GHG emissions from agricultural production in 2000 – 2010
were estimated at 5.0 – 5.8 GtCO
2
eq / yr while annual GHG flux from
land use and land-use change activities accounted for approximately
4.3 – 5.5 GtCO
2
eq / yr. Leveraging the mitigation potential in the sec-
tor is extremely important in meeting emission reduction targets
(robust evidence; high agreement) [11.9]. Since publication of the IPCC
Fourth Assessment Report (AR4), emissions from the AFOLU sector
have remained similar but the share of anthropogenic emissions has
decreased to 24 % (in 2010), largely due to increases in emissions in
the energy sector (robust evidence, high agreement). In spite of a large
range across global Forestry and Other Land Use (FOLU) flux estimates,
most approaches indicate a decline in FOLU carbon dioxide (CO
2
) emis-
sions over the most recent years, largely due to decreasing defores-
tation rates and increased afforestation (limited evidence, medium
agreement). As in AR4, most projections suggest declining annual net
CO
2
emissions in the long run. In part, this is driven by technological
change, as well as projected declining rates of agriculture area expan-
sion, which, in turn, is related to the expected slowing in population
growth. However, unlike AR4, none of the more recent scenarios proj-
ects growth in the near-term [11.9].
Opportunities for mitigation include supply-side and demand-
side options� On the supply side, emissions from land-use change
(LUC), land management and livestock management can be reduced,
terrestrial carbon stocks can be increased by sequestration in soils and
biomass, and emissions from energy production can be saved through
the substitution of fossil fuels by biomass (robust evidence; high agree-
ment) [11.3]. On the demand side, GHG emissions could be mitigated
by reducing losses and wastes of food, changes in diet and changes in
wood consumption (robust evidence; high agreement) [11.4] though
quantitative estimates of the potential are few and highly uncertain.
Increasing production without a commensurate increase in emissions
also reduces emission intensity, i. e., the GHG emissions per unit of
product that could be delivered through sustainable intensification;
another mechanism for mitigation explored in more detail here than in
AR4. Supply-side options depend on the efficacy of land and livestock
management (medium evidence; high agreement) [11.6]. Considering
demand-side options, changes in human diet can have a significant
impact on GHG emissions from the food production lifecycle (medium
evidence; medium agreement) [11.4]. There are considerably different
challenges involved in delivering demand-side and supply-side options,
which also have very different synergies and tradeoffs.
The nature of the sector means that there are potentially many
barriers to implementation of available mitigation options,
including accessibility to AFOLU financing, poverty, institutional,
ecological, technological development, diffusion and transfer
barriers (medium evidence; medium agreement) [11.7, 11.8]. Simi-
larly, there are important feedbacks to adaptation, conservation of nat-
ural resources, such as water and terrestrial and aquatic biodiversity
(robust evidence; high agreement) [11.5, 11.8]. There can be competi-
tion between different land uses if alternative options to use available
land are mutually exclusive, but there are also potential synergies, e. g.,
integrated systems or multi-functionality at landscape scale (medium
evidence; high agreement) [11.4]. Recent frameworks, such as those
for assessing environmental or ecosystem services, provide one mecha-
nism for valuing the multiple synergies and tradeoffs that may arise
from mitigation actions (medium evidence; medium agreement) [11.1].
Sustainable management of agriculture, forests, and other land is an
underpinning requirement of sustainable development (robust evi-
dence; high agreement) [11.4].
AFOLU emissions could change substantially in transformation
pathways, with significant mitigation potential from agriculture,
forestry, and bioenergy mitigation measures (medium evidence;
high agreement). Recent multi-model comparisons of idealized imple-
mentation transformation scenarios find land emissions (nitrous oxide,
N
2
O; methane, CH
4
; CO
2
) changing by – 4 to 99 % through 2030, and 7
to 76 % through 2100, with the potential for increased emissions from
land carbon stocks. Land-related mitigation, including bioenergy, could
contribute 20 to 60 % of total cumulative abatement to 2030, and 15 to
40 % to 2100. However, policy coordination and implementation issues
are challenges to realizing this potential [11.9]. Large-scale biomass
supply for energy, or carbon sequestration in the AFOLU sector provide
flexibility for the development of mitigation technologies in the energy
supply and energy end-use sectors, as many technologies already exist
and some of them are commercial (limited evidence; medium agree-
ment) [11.3], but there are potential implications for biodiversity, food
security, and other services provided by land (medium evidence, high

817817
Agriculture, Forestry and Other Land Use (AFOLU)
11
Chapter 11
agreement) [11.7]. Implementation challenges, including institutional
barriers and inertia related to governance issues, make the costs and
net emission reduction potential of near-term mitigation uncertain. In
mitigation scenarios with idealized comprehensive climate policies,
agriculture, forestry, and bioenergy contribute substantially to the
reduction of global CO
2
, CH
4
, and N
2
O emissions, and to the energy
system, thereby reducing policy costs (medium evidence; high agree-
ment) [11.9]. More realistic partial and delayed policies for global land
mitigation have potentially significant spatial and temporal leakage,
and economic implications, but could still be cost-effectively deployed
(limited evidence; limited agreement) [11.9].
Economic mitigation potential of supply-side measures in the
AFOLU sector is estimated to be 7�18 to 10�60 (full range:
0�49 – 10�60) GtCO
2
eq / yr in 2030 for mitigation efforts consis-
tent with carbon prices up to 100 USD / tCO
2
eq, about a third of
which can be achieved at < 20 USD / tCO
2
eq (medium evidence;
medium agreement) [11.6]. These estimates are based on studies that
cover both forestry and agriculture and that include agricultural soil
carbon sequestration. Estimates from agricultural sector-only studies
range from 0.3 to 4.6 GtCO
2
eq / yr at prices up to 100 USD / tCO
2
eq, and
estimates from forestry sector-only studies from 0.2 to 13.8 GtCO
2
eq / yr
at prices up to 100 USD / tCO
2
eq (medium evidence; medium agree-
ment) [11.6]. The large range in the estimates arises due to widely
different collections of options considered in each study, and because
not all GHGs are considered in all of the studies. The composition of
the agricultural mitigation portfolio varies with the carbon price, with
the restoration of organic soils having the greatest potential at higher
carbon prices (100 USD / tCO
2
eq) and cropland and grazing land man-
agement at lower (20 USD / tCO
2
eq). In forestry there is less difference
between measures at different carbon prices, but there are significant
differences between regions, with reduced deforestation dominat-
ing the forestry mitigation potential in Latin America and Caribbean
(LAM) and Middle East and Africa (MAF), but very little potential in
the member countries of the Organisation for Economic Co-operation
and Development (OECD-1990) and Economies in Transition (EIT). For-
est management, followed by afforestation, dominate in OECD-1990,
EIT, and Asia (medium evidence, strong agreement) [11.6]. Among
demand-side measures, which are under-researched compared to sup-
ply-side measures, changes in diet and reductions of losses in the food
supply chain can have a significant, but uncertain, potential to reduce
GHG emissions from food production (0.76 – 8.55 GtCO
2
eq / yr by 2050),
with the range being determined by assumptions about how the
freed land is used (limited evidence; medium agreement) [11.4]. More
research into demand-side mitigation options is merited. There are
significant regional differences in terms of mitigation potential, costs,
and applicability, due to differing local biophysical, socioeconomic, and
cultural circumstances, for instance between developed and develop-
ing regions, and among developing regions (medium evidence; high
agreement) [11.6].
The size and regional distribution of future mitigation potential
is difficult to estimate accurately because it depends on a num-
ber of inherently uncertain factors� Critical factors include popu-
lation (growth), economic and technological developments, changes
in behaviour over time (depending on cultural and normative back-
grounds, market structures and incentives), and how these translate
into demand for food, fibre, fodder and fuel, as well as development in
the agriculture, aquaculture and forestry sectors. Other factors impor-
tant to mitigation potential are potential climate change impacts on
carbon stocks in soils and forests including their adaptive capacity
(medium evidence; high agreement) [11.5]; considerations set by bio-
diversity and nature conservation requirements; and interrelations with
land degradation and water scarcity (robust evidence; high agreement)
[11.8].
Bioenergy can play a critical role for mitigation, but there are
issues to consider, such as the sustainability of practices and
the efficiency of bioenergy systems (robust evidence, medium
agreement) [11.4.4, Box 11.5, 11.13.6, 11.13.7]. Barriers to large-scale
deployment of bioenergy include concerns about GHG emissions from
land, food security, water resources, biodiversity conservation and live-
lihoods. The scientific debate about the overall climate impact related
to land use competition effects of specific bioenergy pathways remains
unresolved (robust evidence, high agreement) [11.4.4, 11.13]. Bioen-
ergy technologies are diverse and span a wide range of options and
technology pathways. Evidence suggests that options with low lifecy-
cle emissions (e. g., sugar cane, Miscanthus, fast growing tree species,
and sustainable use of biomass residues), some already available, can
reduce GHG emissions; outcomes are site-specific and rely on efficient
integrated ‘biomass-to-bioenergy systems’, and sustainable land-use
management and governance. In some regions, specific bioenergy
options, such as improved cookstoves, and small-scale biogas and
biopower production, could reduce GHG emissions and improve liveli-
hoods and health in the context of sustainable development (medium
evidence, medium agreement) [11.13].
Policies governing practices in agriculture and in forest conser-
vation and management need to account for both mitigation
and adaptation� One of the most visible current policies in the AFOLU
sector is the implementation of REDD+ (see Annex I), that can repre-
sent a cost-effective option for mitigation (limited evidence; medium
agreement) [11.10], with economic, social, and other environmental
co-benefits (e. g., conservation of biodiversity and water resources).

818818
Agriculture, Forestry and Other Land Use (AFOLU)
11
Chapter 11
11.1 Introduction
Agriculture, Forestry, and Other Land Use (AFOLU
1
) plays a central role
for food security and sustainable development (Section 11.9). Plants take
up carbon dioxide (CO
2
) from the atmosphere and nitrogen (N) from the
soil when they grow, re-distributing it among different pools, including
above and below-ground living biomass, dead residues, and soil organic
matter. The CO
2
and other non-CO
2
greenhouse gases (GHG), largely
methane (CH
4
) and nitrous oxide (N
2
O), are in turn released to the atmo-
sphere by plant respiration, by decomposition of dead plant biomass
and soil organic matter, and by combustion (Section 11.2). Anthropo-
genic land-use activities (e. g., management of croplands, forests, grass-
lands, wetlands), and changes in land use / cover (e. g., conversion of for-
est lands and grasslands to cropland and pasture, afforestation) cause
changes superimposed on these natural fluxes. AFOLU activities lead to
both sources of CO
2
(e. g., deforestation, peatland drainage) and sinks of
CO
2
(e. g., afforestation, management for soil carbon sequestration), and
to non-CO
2
emissions primarily from agriculture (e. g., CH
4
from livestock
and rice cultivation, N
2
O from manure storage and agricultural soils and
biomass burning (Section 11.2).
The main mitigation options within AFOLU involve one or more of
three strategies: reduction / prevention of emissions to the atmosphere
by conserving existing carbon pools in soils or vegetation that would
otherwise be lost or by reducing emissions of CH
4
and N
2
O (Section
11.3); sequestration — enhancing the uptake of carbon in terrestrial
reservoirs, and thereby removing CO
2
from the atmosphere (Section
11.3); and reducing CO
2
emissions by substitution of biological prod-
ucts for fossil fuels (Appendix 1) or energy-intensive products (Sec-
tion 11.4). Demand-side options (e. g., by lifestyle changes, reducing
losses and wastes of food, changes in human diet, changes in wood
consumption), though known to be difficult to implement, may also
play a role (Section 11.4).
Land is the critical resource for the AFOLU sector and it provides food
and fodder to feed the Earth’s population of ~7 billion, and fibre and
fuel for a variety of purposes. It provides livelihoods for billions of
people worldwide. It is finite and provides a multitude of goods and
ecosystem services that are fundamental to human well-being (MEA,
2005). Human economies and quality of life are directly dependent on
the services and the resources provided by land. Figure 11.1 shows the
many provisioning, regulating, cultural and supporting services pro-
vided by land, of which climate regulation is just one. Implementing
mitigation options in the AFOLU sector may potentially affect other
services provided by land in positive or negative ways.
In the Intergovernmental Panel on Climate Change (IPCC) Second
Assessment Report (SAR) (IPCC, 1996) and in the IPCC Fourth Assess-
1
The term AFOLU used here consistent with the (IPCC, 2006) Guidelines is also
consistent with Land Use, Land-Use Change and Forestry (LULUCF) (IPCC, 2003),
and other similar terms used in the scientific literature.
ment Report (AR4) (IPCC, 2007a), agricultural and forestry mitigation
were dealt with in separate chapters. In the IPCC Third Assessment
Report (TAR) (IPCC, 2001), there were no separate sectoral chapters
on either agriculture or forestry. In the IPCC Fifth Assessment Report
(AR5), for the first time, the vast majority of the terrestrial land surface,
comprising agriculture, forestry and other land use (AFOLU) (IPCC,
2006), is considered together in a single chapter, though settlements
(which are important, with urban areas forecasted to triple in size from
2000 global extent by 2030; Section 12.2), are dealt with in Chapter
12. This approach ensures that all land-based mitigation options can
be considered together; it minimizes the risk of double counting or
inconsistent treatment (e. g., different assumptions about available
land) between different land categories, and allows the consideration
of systemic feedbacks between mitigation options related to the land
surface (Section 11.4). Considering AFOLU in a single chapter allows
phenomena common across land-use types, such as competition for
land (Smith etal., 2010; Lambin and Meyfroidt, 2011) and water (e. g.,
Jackson etal., 2007), co-benefits (Sandor etal., 2002; Venter etal.,
2009), adverse side-effects (Section 11.7) and interactions between
mitigation and adaptation (Section 11.5) to be considered consistently.
The complex nature of land presents a unique range of barriers and
opportunities (Section 11.8), and policies to promote mitigation in the
AFOLU sector (Section 11.10) need to take account of this complexity.
In this chapter, we consider the competing uses of land for mitigation
and for providing other services (Sections 11.7; 11.8). Unlike the chap-
ters on agriculture and forestry in AR4, impacts of sourcing bioenergy
from the AFOLU sector are considered explicitly in a dedicated appen-
dix (Section 11.13). Also new to this assessment is the explicit con-
sideration of food / dietary demand-side options for GHG mitigation in
the AFOLU sector (Section 11.4), and some consideration of freshwa-
ter fisheries and aquaculture, which may compete with the agriculture
and forestry sectors, mainly through their requirements for land and / or
water, and indirectly, by providing fish and other products to the same
markets as animal husbandry.
This chapter deals with AFOLU in an integrated way with respect to
the underlying scenario projections of population growth, economic
growth, dietary change, land-use change (LUC), and cost of mitigation.
We draw evidence from both ‘bottom-up’ studies that estimate mitiga-
tion potentials at small scales or for individual options or technologies
and then scale up, and multi-sectoral ‘top-down’ studies that consider
AFOLU as just one component of a total multi-sector system response
(Section 11.9). In this chapter, we provide updates on emissions trends
and changes in drivers and pressures in the AFOLU sector (Section 11.2),
describe the practices available in the AFOLU sector (Section 11.3),
and provide refined estimates of mitigation costs and potentials for
the AFOLU sector, by synthesising studies that have become available
since AR4 (Section 11.6). We conclude the chapter by identifying gaps in
knowledge and data (Section 11.11), providing a selection of Frequently
Asked Questions (Section 11.12), and presenting an Appendix on bioen-
ergy to update the IPCC Special Report on Renewable Energy Sources
and Climate Change Mitigation (SRREN) (IPCC, 2011; see Section 11.13).

819819
Agriculture, Forestry and Other Land Use (AFOLU)
11
Chapter 11
11.2 New developments
in emission trends
and drivers
Estimating and reporting the anthropogenic component of gross and
net AFOLU GHG fluxes to the atmosphere, globally, regionally, and
at country level, is difficult compared to other sectors. First, it is not
always possible to separate anthropogenic and natural GHG fluxes
from land. Second, the input data necessary to estimate GHG emis-
sions globally and regionally, often based on country-level statistics
or on remote-sensing information, are very uncertain. Third, methods
for estimating GHG emissions use a range of approaches, from simple
default methodologies such as those specified in the IPCC GHG Guide-
lines
2
(IPCC, 2006), to more complex estimates based on terrestrial car-
bon cycle modelling and / or remote sensing information. Global trends
in total GHG emissions from AFOLU activities between 1971 and 2010
are shown in Figure 11.2; Figure 11.3 shows trends of major drivers of
emissions.
2
Parties to the United Nations Framework Convention on Climate Change
(UNFCCC) report net GHG emissions according to IPCC methodologies (IPCC,
2006). Reporting is based on a range of methods and approaches dependent on
available data and national capacities, from default equations and emission fac-
tors applicable to global or regional cases and assuming instantaneous emissions
of all carbon that will be eventually lost from the system following human action
(Tier 1) to more complex approaches such as model-based spatial analyses (Tier 3).
Figure 11�1 | Multiple ecosystem services, goods and benefits provided by land (after MEA, 2005; UNEP-WCMC, 2011). Mitigation actions aim to enhance climate regulation, but
this is only one of the many functions fulfilled by land.
Land
Goods and
Benefits
Policies and
Drivers
Primary Production
Decomposition
Soil Formation, Nutrient Cycling
Water Cycling, Weathering
Ecological Interactions
Evolutionary Processes
Climate Regulation
Hazard Regulation
Noise Regulation
Pollution Control
Air, Soil and Water Quality
Disease/Pest Regulation
Pollination
Food
Fibre
Water
Energy
Biodiversity
Recreation
Tourism
Spiritual
Religious
Cultural
Services
Provisioning
Services
Regulating
Services
Supporting
Services
AFOLU
+/- +/-
820820
Agriculture, Forestry and Other Land Use (AFOLU)
11
Chapter 11
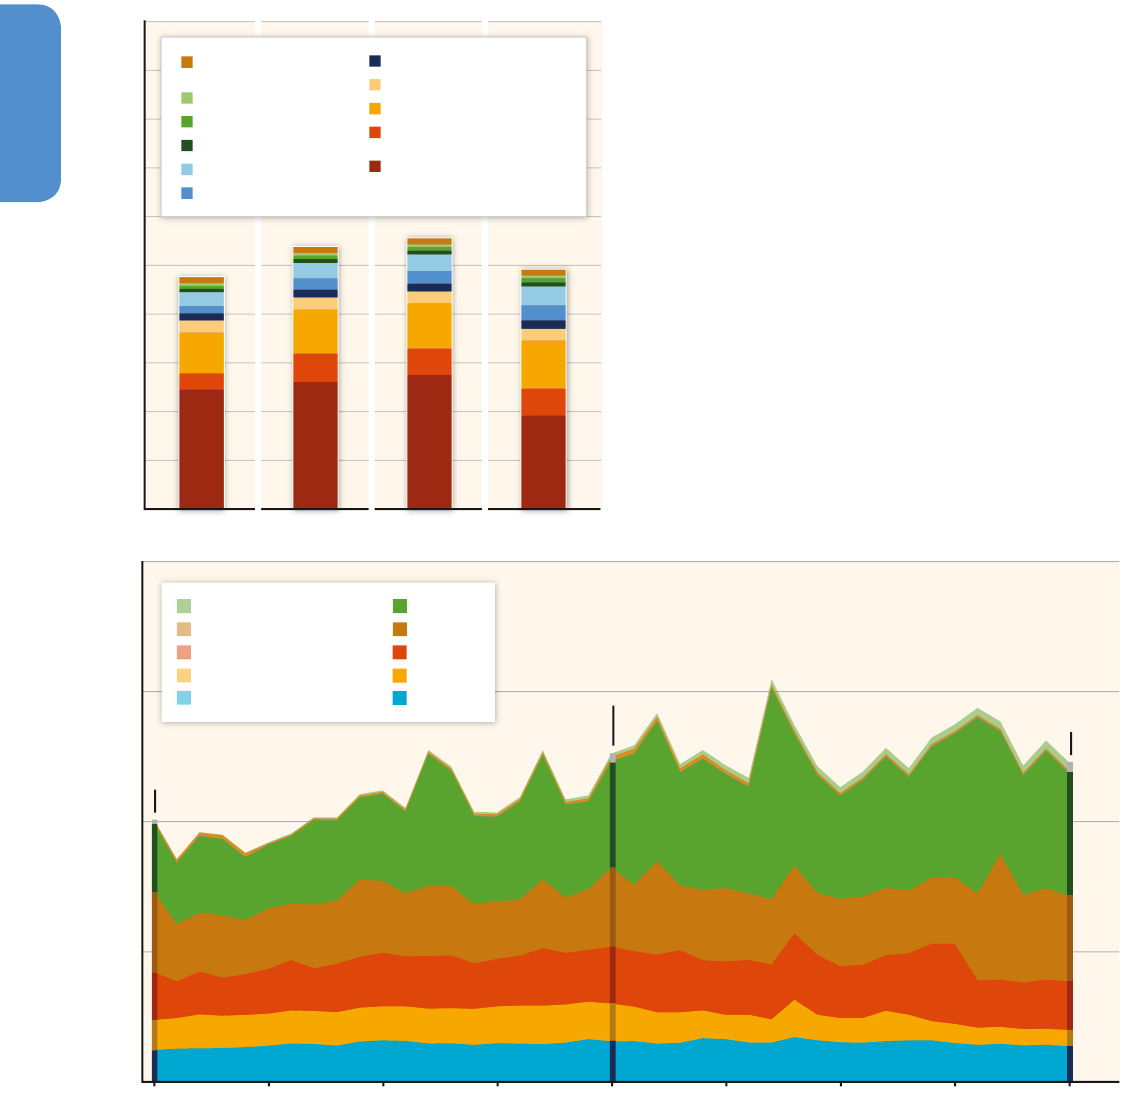
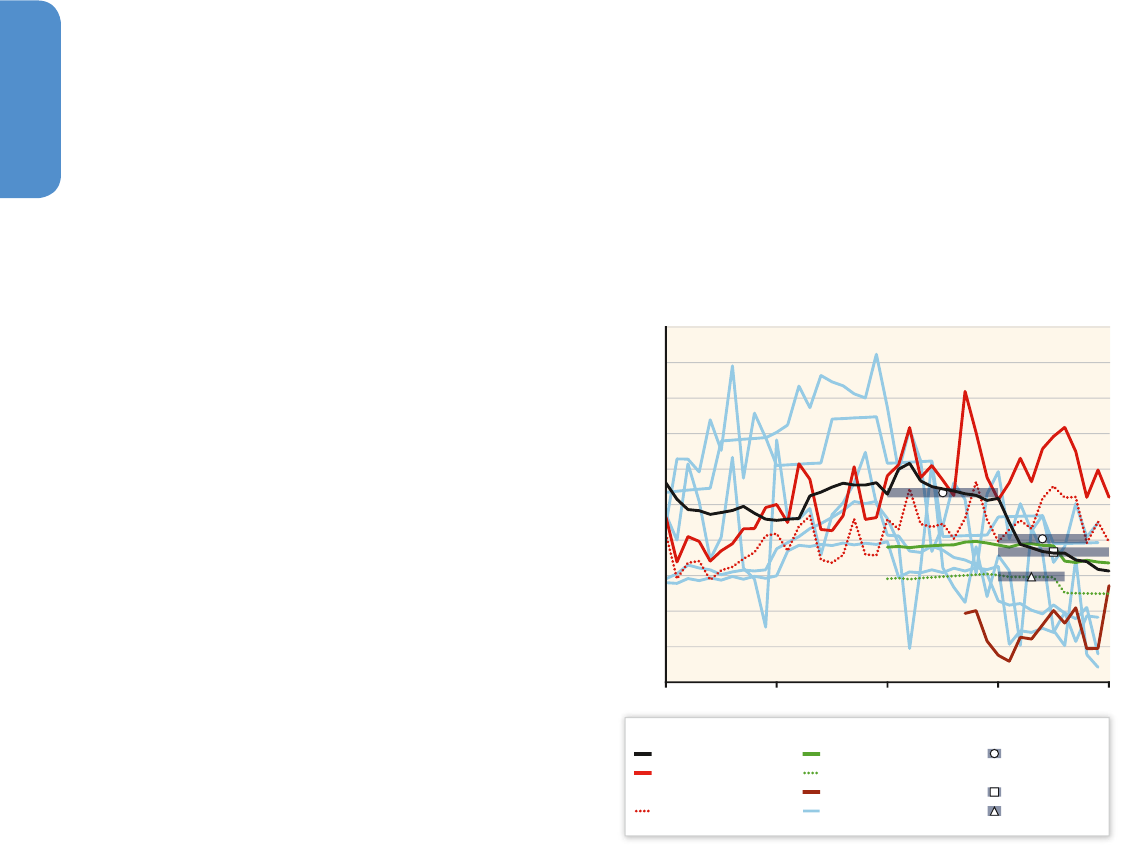
Figure 11�2 | Top: AFOLU emissions for the last four decades. For the agricultural sub-sectors emissions are shown for separate categories, based on FAOSTAT, (2013). Emissions
from crop residues, manure applied to soils, manure left on pasture, cultivated organic soils, and synthetic fertilizers are typically aggregated to the category ‘agricultural soils’ for
IPCC reporting. For the Forestry and Other Land Use (FOLU) sub-sector data are from the Houghton bookkeeping model results (Houghton etal., 2012). Emissions from drained
peat and peat fires are, for the 1970s and the 1980s, from JRC / PBL (2013), derived from Hooijer etal. (2010) and van der Werf etal. (2006) and for the 1990s and the 2000s, from
FAOSTAT, 2013. Bottom: Emissions from AFOLU for each RC5 region (see Annex II.2) using data from JRC / PBL (2013), with emissions from energy end-use in the AFOLU sector
from IEA (2012a) included in a single aggregated category, see Annex II.9, used in the AFOLU section of Chapter 5.7.4 for cross-sectoral comparisons. The direct emission data
from JRC / PBL (2013; see Annex II.9) represents land-based CO
2
emissions from forest and peat fires and decay that approximate to CO
2
flux from anthopogenic emission sources
in the FOLU sub-sector. Differences between FAOSTAT / Houghton data and JRC / PBL (2013) are discussed in the text. See Figures 11.4 and 11.6 for the range of differences among
available databases for AFOLU emissions.
0
2
4
6
8
10
18
16
14
12
1970-1979 1980-1989 1990-1999 2000-2009
Average Annual GHG Emissions [GtCO
2
eq/yr]
Crop Residues and Savannah
Burning (N
2
O,CH
4
)
Cultivated Organic Soils (N
2
O)
Crop Residues (N
2
O)
Manure Applied to Soils (N
2
O)
Manure on Pasture (N
2
O)
Synthetic Fertilizers (N
2
O)
Manure Management (CH
4
and N
2
O)
Rice Cultivation (CH
4
)
Enteric Fermentation (CH
4
)
Drained Peat and Peat Fires
(CO
2
, N
2
O, CH
4
)
Land Use Change and Forestry (CO
2
)
GHG Emissions [GtCO
2
eq/yr]
4.1
3.0
2.2
1.5
1.6
4.7
3.3
1.9
0.62
1.4
2.6
3.1
1.8
1.2
1.2
Total 10
Total 13
Total 12
ASIA (Indirect Emissions)
MAF (Indirect Emissions)
LAM (Indirect Emissions)
EIT (Indirect Emissions)
OECD-1990 (Indirect Emissions)
ASIA
MAF
LAM
EIT
OECD-1990
2010200520001995199019851980
19751970
0
5
10
15
20
821821
Agriculture, Forestry and Other Land Use (AFOLU)
11
Chapter 11
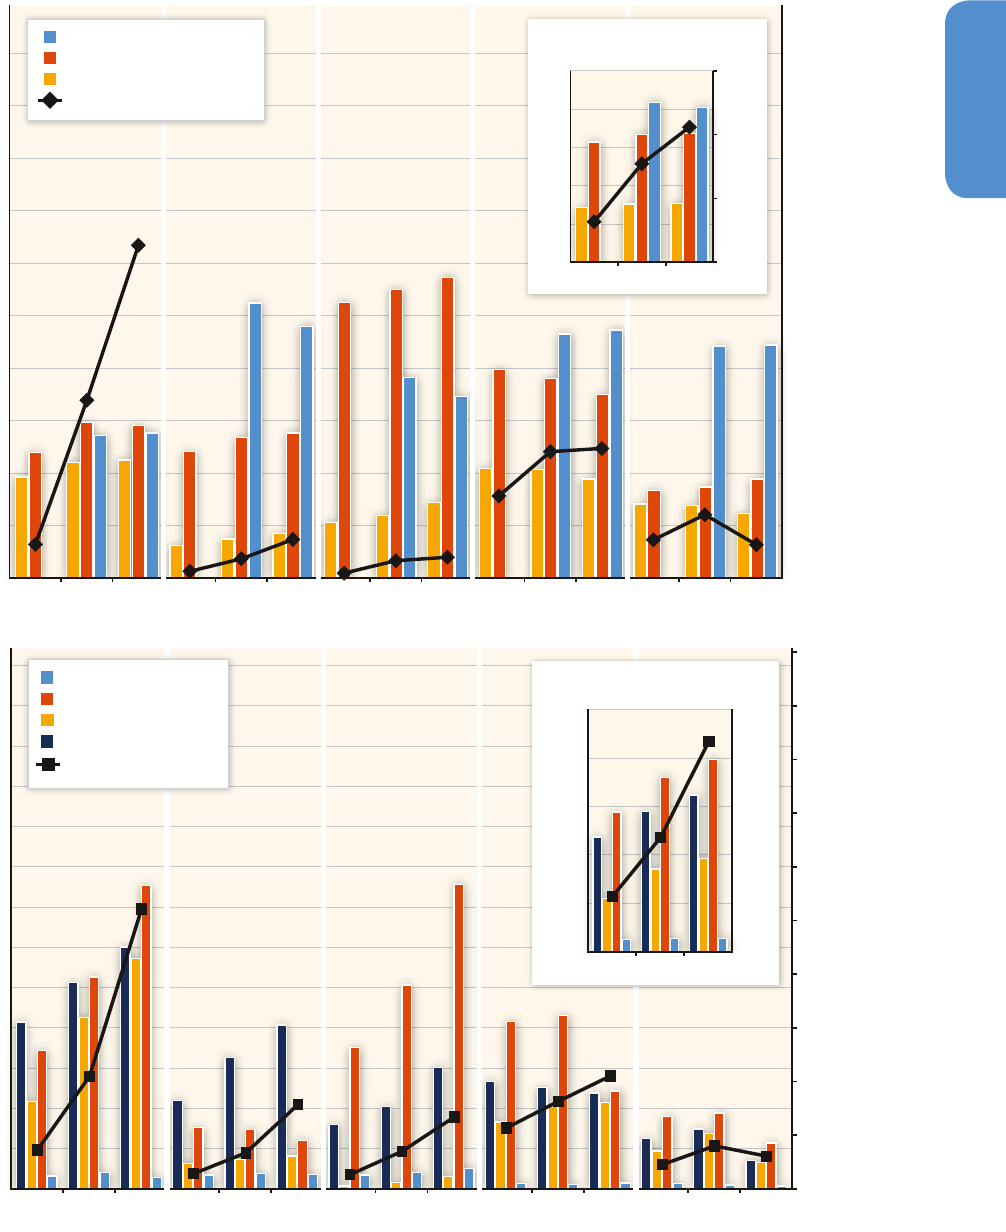
Figure 11�3 | Global trends from 1971 to 2010 in (top) area of land use (forest land — available only from 1990; 1000 Mha) and amount of N fertilizer use (million tonnes), and
(bottom) number of livestock (million heads) and poultry (billion heads). Data presented by regions: 1) Asia, 2) LAM, 3) MAF, 4) OECD-1990, 5) EIT (FAOSTAT, 2013). The area extent
of AFOLU land-use categories, from FAOSTAT, (2013): ‘Cropland’ corresponds to the sum of FAOSTAT categories ‘arable land’ and ‘temporary crops’ and coincides with the IPCC
category (IPCC, 2003); ‘Forest’ is defined according to FAO (2010); countries reporting to UNFCCC may use different definitions. ‘Permanent meadows and pasture’, are a subset of
IPCC category ‘grassland’ (IPCC, 2003), as the latter, by definition, also includes unmanaged natural grassland ecosystems.
EITOECD-1990MAFLAMASIA
1970 1990 2010 1970 1990 2010 1970 1990 2010 1970 1990 20101970 1990 2010
0.0
0.2
0.4
0.6
0.8
1.0
1.2
1.4
Forest Land
Permanent Meadows and Pastures
Cropland
N Fertilizers
Area of Land Use [1000 Mha]
0
10
20
30
40
50
60
70
1.6
1.8
2.0
80
90
100
Fertilizers Application [Million t]
0
1
2
3
4
5
0
100
150
50
[1000 Mha]
[Million t]
Global Trends from 1970 to 2010
1970 1990 2010
Poultry [Billion Heads]
Animals [Million Heads]
EITOECD-1990MAFLAMASIA
1970 1990 2010 1970 1990 2010 1970 1990 2010 1970 1990 20101970 1990 2010
0
100
200
300
400
500
600
700
800
0
2
4
6
8
10
12
Horses, Mules, Assess, Camels
Sheep and Goats
Pigs
Cattle and Buffaloes
Poultry (Billion Heads)
900
1000
1100
1200
1300
14
16
18
20
0
5
10
15
20
25
0
500
1000
1500
2500
2000
Global Trends from 1970 to 2010
[Billion Heads]
[Million Heads]
1970 1990 2010
822822
Agriculture, Forestry and Other Land Use (AFOLU)
11
Chapter 11
11�2�1 Supply and consumption trends in
agriculture and forestry
In 2010 world agricultural land occupied 4889 Mha, an increase of
7 % (311 Mha) since 1970 (FAOSTAT, 2013). Agricultural land area has
decreased by 53 Mha since 2000 due to a decline of the cropland area
(Organisation for Economic Co-operation and Development (OECD)-
1990, Economies in Transition (EIT)) and a decrease in permanent
meadows and pastures (OECD-1990 and Asia). The average amount of
cropland and pasture land per capita in 1970 was 0.4 and 0.8 ha and
by 2010 this had decreased to 0.2 and 0.5 ha per capita, respectively
(FAOSTAT, 2013).
Changing land-use practices, technological advancement and varietal
improvement have enabled world grain harvests to double from 1.2 to
2.5 billion tonnes per year between 1970 and 2010 (FAOSTAT, 2012).
Average world cereal yields increased from 1600 to 3030 kg / ha over
the same period (FAOSTAT, 2012) while there has also been a 233 %
increase in global fertilizer use from 32 to 106 Mt / yr, and a 73 %
increase in the irrigated cropland area (FAOSTAT, 2013).
Globally, since 1970, there has been a 1.4-fold increase in the num-
bers of cattle and buffalo, sheep and goats (which is closely linked to
the trend of CH
4
emissions in the sector; Section 11.2.2), and increases
of 1.6- and 3.7-fold for pigs and poultry, respectively (FAOSTAT, 2013).
Major regional trends between 1970 and 2010 include a decrease in
the total number of animals in Economies in Transition (EIT) and OECD-
1990 (except poultry), and continuous growth in other regions, particu-
larly Middle East and Africa (MAF) and Asia (Figure 11.3, bottom panel).
The soaring demand for fish has led to the intensification of freshwater
and marine fisheries worldwide, and an increased freshwater fisheries
catch that topped 11 Mt in 2010, although the marine fisheries catch
has slowly declined (78 Mt in 2010; FAOSTAT, 2013). The latter is, how-
ever, compensated in international markets by tremendous growth of
aquaculture production to 60 Mt wet weight in 2010, of which 37 Mt
originate from freshwater, overwhelmingly in Asia (FAOSTAT, 2013).
Between 1970 and 2010, global daily per capita food availability,
expressed in energy units, has risen from 10,008 to 11,850 kJ (2391 to
2831 kcal), an increase of 18.4 %; growth in MAF (10,716 kJ in 2010)
has been 22 %, and in Asia, 32 % (11,327 kJ in 2010; FAOSTAT, 2013).
The percentage of animal products in daily per capita total food con-
sumption has increased consistently in Asia since 1970 (7 to 16 %),
remained constant in MAF (8 %) and, since 1985, has decreased in
OECD-1990 countries (32 to 28 %), comprising, respectively, 1,790,
870 and 3,800 kJ in 2010 (FAOSTAT, 2013).
11�2�2 Trends of GHG emissions from
agriculture
Organic and inorganic material provided as inputs or output in the
management of agricultural systems are typically broken down
through bacterial processes, releasing significant amounts of CO
2
, CH
4
,
and N
2
O to the atmosphere. Only agricultural non-CO
2
sources are
reported as anthropogenic GHG emissions, however. The CO
2
emitted
is considered neutral, being associated to annual cycles of carbon fixa-
tion and oxidation through photosynthesis. The agricultural sector is
the largest contributor to global anthropogenic non-CO
2
GHGs,
accounting for 56 % of emissions in 2005 (U. S. EPA, 2011). Other
important, albeit much smaller non-CO
2
emissions sources from other
AFOLU categories, and thus not treated here, include fertilizer applica-
tions in forests. Annual total non-CO
2
GHG emissions from agriculture
in 2010 are estimated to be 5.2 – 5.8 GtCO
2
eq / yr (FAOSTAT, 2013; Tubi-
ello etal., 2013) and comprised about 10 – 12 % of global anthropo-
genic emissions. Fossil fuel CO
2
emissions on croplands added another
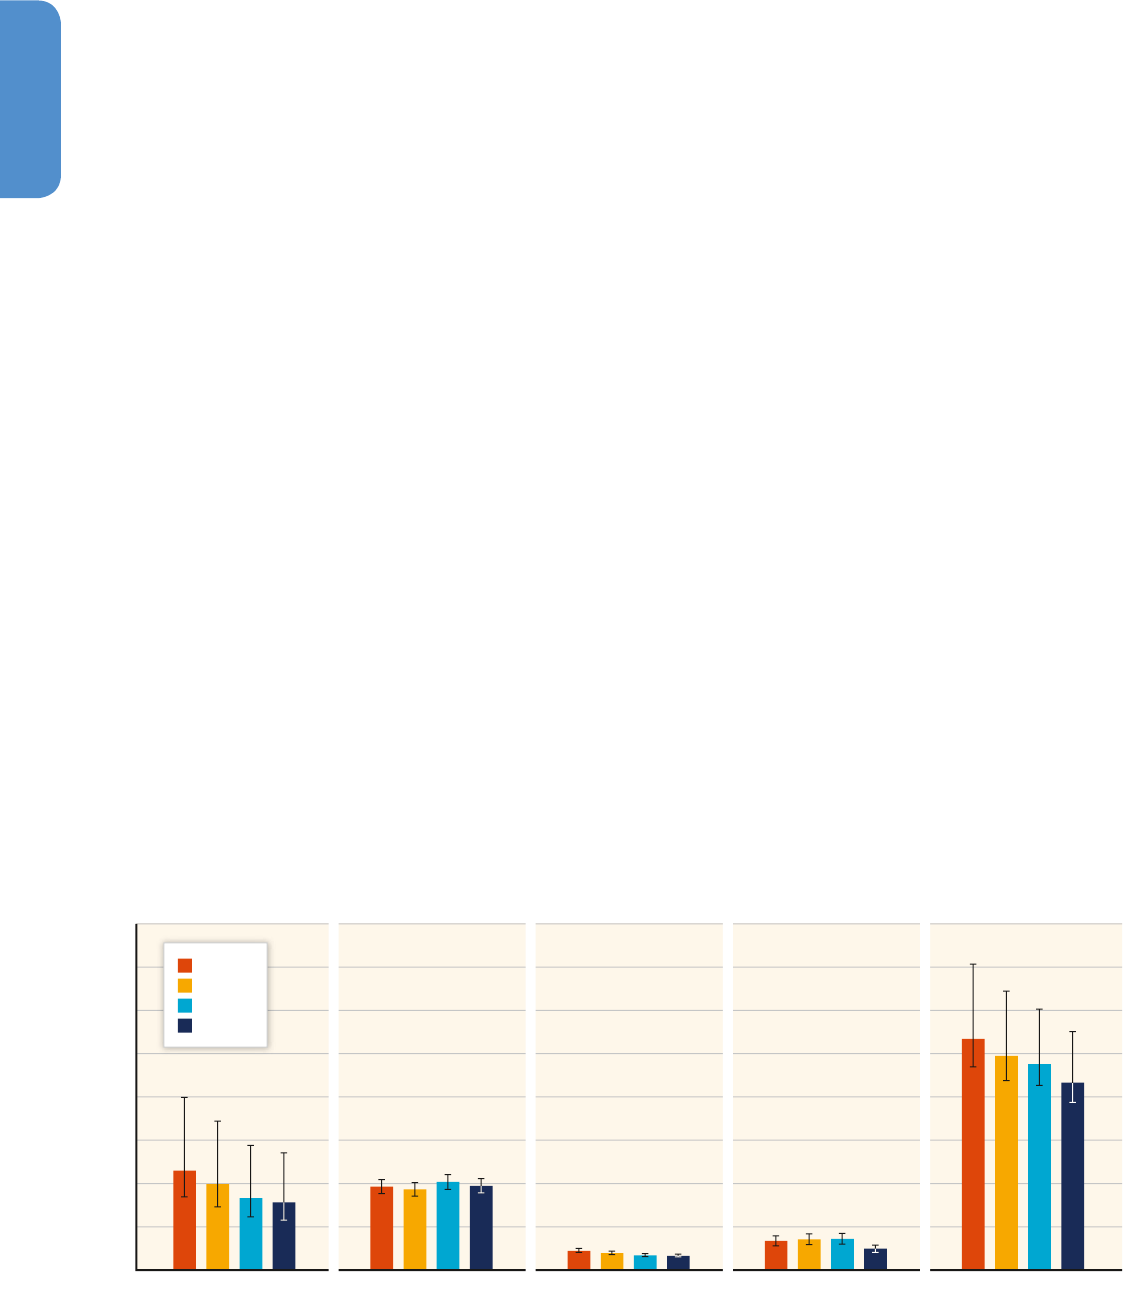
Figure 11�4 | Data comparison between FAOSTAT (2013), U. S. EPA (2006), and EDGAR (JRC / PBL, 2013) databases for key agricultural emission categories, grouped as agricultural
soils, enteric fermentation, manure management systems, and rice cultivation, for 2005 | Whiskers represent 95 % confidence intervals of global aggregated categories, computed
using IPCC guidelines (IPCC, 2006) for uncertainty estimation (from Tubiello etal., 2013).
GHGEmissions[GtCO
2
eq/yr]
0
1
2
3
4
5
6
7
8
TotalRice CultivationManure Management SystemsEnteric FermentationAgricultural Soils
EPA2006
EPA2011
EDGAR
FAO
823823
Agriculture, Forestry and Other Land Use (AFOLU)
11
Chapter 11
0.4 – 0.6 GtCO
2
eq / yr
in 2010 from agricultural use in machinery, such
as tractors, irrigation pumps, etc. (Ceschia etal., 2010; FAOSTAT, 2013),
but these emissions are accounted for in the energy sector rather than
the AFOLU sector. Between 1990 and 2010, agricultural non-CO
2
emis-
sions grew by 0.9 % / yr, with a slight increase in growth rates after
2005 (Tubiello etal., 2013).
Three independent sources of disaggregated non-CO
2
GHG emissions
estimates from agriculture at global, regional, and national levels are
available. They are mostly based on FAOSTAT activity data and IPCC
Tier 1 approaches (IPCC, 2006; FAOSTAT, 2012; JRC / PBL, 2013; U. S.
EPA, 2013). EDGAR and FAOSTAT also provide data at country level.
Estimates of global emissions for enteric fermentation, manure man-
agement and manure, estimated using IPCC Tier 2 / 3 approaches are
also available (e. g., (Herrero etal., 2013). The FAOSTAT, EDGAR and
U. S. EPA estimates are slightly different, although statistically con-
sistent given the large uncertainties in IPCC default methodologies
(Tubiello et al., 2013). They cover emissions from enteric fermenta-
tion, manure deposited on pasture, synthetic fertilizers, rice cultivation,
manure management, crop residues, biomass burning, and manure
applied to soils. Enteric fermentation, biomass burning, and rice cul-
tivation are reported separately under IPCC inventory guidelines, with
the remaining categories aggregated into ‘agricultural soils’. According
to EDGAR and FAOSTAT, emissions from enteric fermentation are the
largest emission source, while US EPA lists emissions from agricultural
soils as the dominant source (Figure 11.4).
The following analyses refer to annual total non-CO
2
emissions by all
categories. All three databases agree that that enteric fermentation
and agricultural soils represent together about 70 % of total emis-
sions, followed by paddy rice cultivation (9 – 11 %), biomass burning
(6 – 12 %) and manure management (7 – 8 %). If all emission catego-
ries are disaggregated, both EDGAR and FAOSTAT agree that the larg-
est emitting categories after enteric fermentation (32 – 40 % of total
agriculture emissions) are manure deposited on pasture (15 %) and
synthetic fertilizer (12 %), both contributing to emissions from agricul-
tural soils. Paddy rice cultivation (11 %) is a major source of global CH
4
emissions, which in 2010 were estimated to be 493 – 723 MtCO
2
eq / yr.
The lower end of the range corresponds to estimates by FAO (FAOSTAT,
2013), with EDGAR and US EPA data at the higher end. Independent
analyses suggest that emissions from rice may be at the lower end of
the estimated range (Yan etal., 2009).
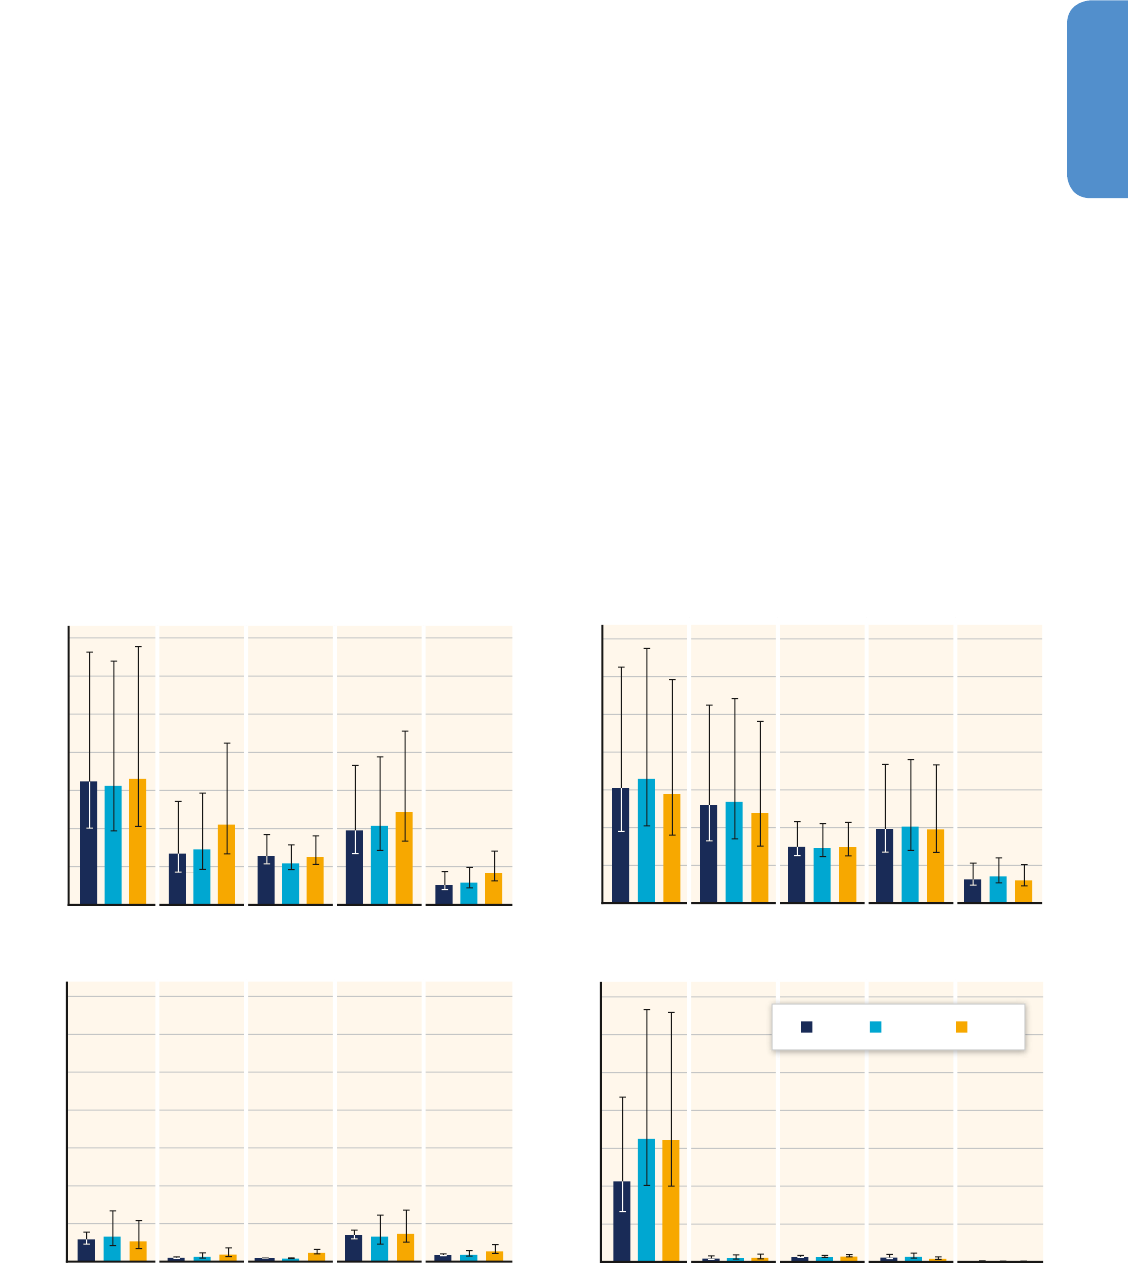
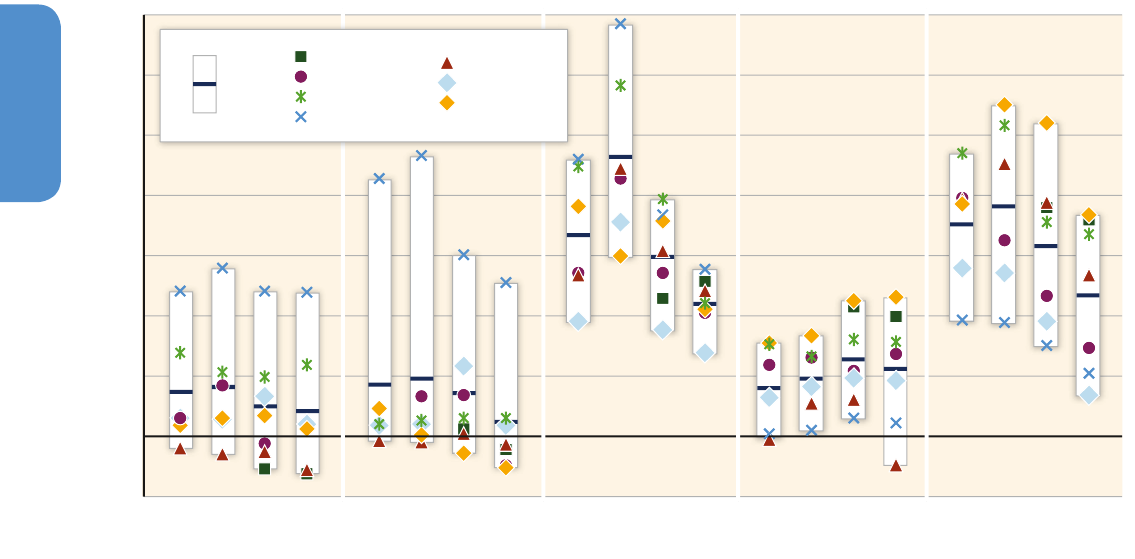
Figure 11�5 | Regional data comparisons for key agricultural emission categories in 2010 | Whiskers represent 95 % confidence intervals computed using IPCC guidelines (IPCC,
2006; Tubiello etal., 2013). The data show that most of the differences between regions and databases are of the same magnitude as the underlying emission uncertainties. [FAO-
STAT, 2013; JRC/PBL, 2013; U.S. EPA, 2013]
Manure Management Systems Rice Cultivation
0
0.2
0.4
0.6
0.8
1.0
1.2
1.4
0
0.2
0.4
0.6
0.8
1.0
1.2
1.4
0
0.2
0.4
0.6
0.8
1.0
1.2
1.4
ASIA LAM MAF OECD-1990 EIT
GHG Emissions [GtCO
2
eq/yr]
GHG Emissions [GtCO
2
eq/yr]GHG Emissions [GtCO
2
eq/yr]
GHG Emissions [GtCO
2
eq/yr]
Agricultural Soils Enteric Fermentation
0
0.2
0.4
0.6
0.8
1.0
1.2
1.4
ASIA LAM MAF OECD-1990 EIT
ASIA LAM MAF OECD-1990 EIT ASIA LAM MAF OECD-1990 EIT
FAO EDGAR EPA
824824
Agriculture, Forestry and Other Land Use (AFOLU)
11
Chapter 11
Enteric Fermentation. Global emissions of this important category
grew from 1.4 to 2.1 GtCO
2
eq / yr between 1961 and 2010, with aver-
age annual growth rates of 0.70 % (FAOSTAT, 2013). Emission growth
slowed during the 1990s compared to the long-term average, but
became faster again after the year 2000. In 2010, 1.0 – 1.5 GtCO
2
eq / yr
(75 % of the total emissions), were estimated to come from devel-
oping countries (FAOSTAT, 2013). Over the period 2000 – 2010, Asia
and the Americas contributed most, followed by Africa and Europe
(FAOSTAT, 2013); see Figure 11.5). Emissions have grown most in
Africa, on average 2.4 % / yr. In both Asia (2.0 % / yr) and the Ameri-
cas (1.1 % / yr), emissions grew more slowly, and decreased in Europe
(– 1.7 % / yr). From 2000 to 2010, cattle contributed the largest share
(75 % of the total), followed by buffalo, sheep and goats (FAOSTAT,
2013).
Manure. Global emissions from manure, as either organic fertilizer
on cropland or manure deposited on pasture, grew between 1961
and 2010 from 0.57 to 0.99 GtCO
2
eq / yr. Emissions grew by 1.1 % / yr
on average. Manure deposited on pasture led to far larger emissions
than manure applied to soils as organic fertilizer, with 80 % of emis-
sions from deposited manures coming from developing countries (FAO-
STAT, 2013; Herrero et al., 2013). The highest emitting regions from
2000 – 2010 were the Americas, Asia and Africa. Growth over the same
period was most pronounced in Africa, with an average of 2.5 % / yr,
followed by Asia (2.3 % / yr), and the Americas (1.2 % / yr), while there
was a decrease in Europe of – 1.2 % / yr. Two-thirds of the total came
from grazing cattle, with smaller contributions from sheep and goats.
In this decade, emissions from manure applied to soils as organic fertil-
izer were greatest in Asia, then in Europe and the Americas. Though the
continent with the highest growth rates of 3.4 % / yr, Africa’s share in
total emissions remained small. In this sub-category, swine and cattle
contributed more than three quarters (77 %) of the emissions. Emis-
sions from manure management grew from 0.25 to 0.36 GtCO
2
eq / yr,
resulting in average annual growth rates of only 0.6 % / yr during the
period 1961 – 2010. From 2000 – 2010 most emissions came from Asia,
then Europe, and the Americas (Figure 11.5).
Synthetic Fertilizer. Emissions from synthetic fertilizers grew at an aver-
age rate of 3.9 % / yr from 1961 to 2010, with absolute values increas-
ing more than 9-fold, from 0.07 to 0.68 GtCO
2
eq / yr (Tubiello et al.,
2013). Considering current trends, synthetic fertilizers will become a
larger source of emissions than manure deposited on pasture in less
than 10 years and the second largest of all agricultural emission cat-
egories after enteric fermentation. Close to three quarters (70 %) of
these emissions were from developing countries in 2010. In the decade
2000 – 2010, the largest emitter by far was Asia, then the Americas
and then Europe (FAOSTAT, 2012). Emissions grew in Asia by 5.3 % / yr,
in Africa by 2.0 % / yr, and in the Americas by 1.5 % / yr. Emissions
decreased in Europe (– 1.8 % / yr).
Rice. Emissions from rice are limited to paddy rice cultivation. From
1961 to 2010, global emissions increased with average annual growth
rates of 0.4 % / yr (FAOSTAT, 2013) from 0.37 to 0.52 GtCO
2
eq / yr. The
growth in global emissions has slowed in recent decades, consistent
with trends in rice cultivated area. During 2000 – 2010, the largest
share of emissions (94 %) came from developing countries, with Asia
being responsible for almost 90 % of the total (Figure 11.5). The larg-
est growth of emissions took place in in Africa (2.7 % / yr), followed by
Europe (1.4 % / yr). Growth rates in Asia and the Americas were much
smaller over the same period (0.4 – 0.7 % / yr).
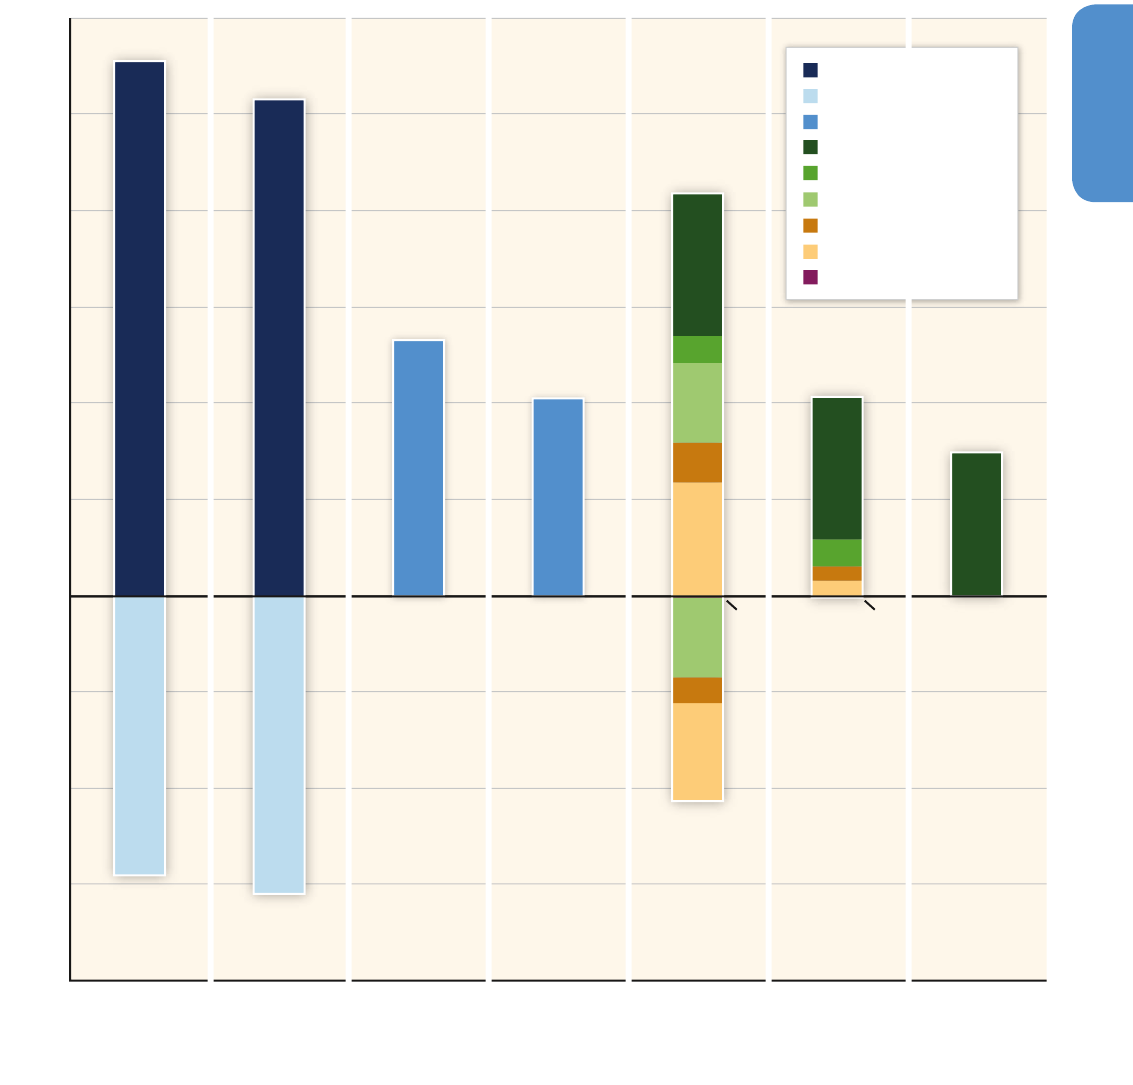
Figure 11�6 | Global net CO
2
emission estimates from FOLU including LUC. Black line:
Houghton bookkeeping model approach updated to 2010 as in (Houghton etal., 2012),
including LUC and forest management but no peatlands. Red lines: EDGAR ‘LULUCF’
emissions derived from the GFED 2.0 database (van der Werf etal., 2006) of emissions
due to all forest fires (includes both FOLU and non-FOLU fires), with (solid line) and
without (dotted line) peat fires and decay. Green lines: emissions from land-use change
and management from FAO agricultural and forest inventory data (FAOSTAT, 2013),
shown with (solid line) and without (dotted line) peat fires and peat degradation. Dark
red line: deforestation and degradation fires only based on satellite fire data from GFED
3.0 database (van der Werf etal., 2010). Light blue lines: a selection of process-based
vegetation model results, updated for WGI Chapter 6; (Le Quéré etal., 2013) include
LUC, some include forest management, none include peatlands. LPJ-wsl: (Poulter etal.,
2010); BernCC: (Stocker etal., 2011); VISIT: (Kato etal., 2011); ISAM: (Jain etal., 2013),
IMAGE 2.4 (Van Minnen etal., 2009, deforestation only). The symbols and transparent
rectangles represent mean values for the tropics only. Circles: tropical deforestation and
forest management (Pan etal., 2011), using the Houghton (2003) bookkeeping model
approach and FAO data. Triangle: tropical deforestation only, based on satellite forest
area and biomass data (Baccini etal., 2012; Harris etal., 2012). Square: tropical defor-
estation and forest management, based on satellite forest area and biomass data and
FAO data using bookkeeping model (Baccini etal., 2012; Harris etal., 2012).
Pan 1990-1999
and 2000 to 2007
Harris 2000 to 2005
Baccini 2000 to 2010GFED 3.0 Deforestation Fires only
EDGAR 4.2 all Forest Fires
and Peat
EDGAR 4.2 all Forest Fires
FAOSTAT 2013: incl. Peat
FAOSTAT 2013: excl. Peat
Process Modells
Average Values
Houghton Bookkeeping Model
1970 1980 1990 2000 2010
0
1
2
3
4
5
6
7
8
9
10
Carbon Dioxide Net Flux [GtCO
2
/yr]

825825
Agriculture, Forestry and Other Land Use (AFOLU)
11
Chapter 11
11�2�3 Trends of GHG fluxes from forestry and
other land use
3
This section focuses on the most significant non-agricultural GHG
fluxes to the atmosphere for which there are global trend data. Fluxes
resulting directly from anthropogenic FOLU activity are dominated by
CO
2
fluxes, primarily emissions due to deforestation, but also uptake
due to reforestation / regrowth. Non-CO
2
greenhouse gas emissions
from FOLU are small in comparison, and mainly arise from peat degra-
dation through drainage and biomass fires (Box 11.1; Box 11.2).
FOLU accounted for about a third of anthropogenic CO
2
emissions
from 1750 to 2011 and 12 % of emissions in 2000 to 2009 (Table
11.1). At the same time, atmospheric measurements indicate the land
as a whole was a net sink for CO
2
, implying a ‘residual’ terrestrial
sink offsetting FOLU emissions (Table 11.1). This sink is confirmed by
inventory measurements in both managed and unmanaged forests in
temperate and tropical regions (Phillips etal., 1998; Luyssaert etal.,
2008; Lewis etal., 2009; Pan etal., 2011). A sink of the right order of
magnitude has been accounted for in models as a result of the indirect
effects of human activity on ecosystems, i. e., the fertilizing effects of
increased levels of CO
2
and N in the atmosphere and the effects of
climate change (WGI Chapter 6; (Le Quéré etal., 2013), although some
of it may be due to direct AFOLU activities not accounted for in current
estimates (Erb etal., 2013). This sink capacity of forests is relevant to
AFOLU mitigation through forest protection.
3
The term ‘forestry and other land use’ used here, is consistent with AFOLU in the
(IPCC, 2006) Guidelines and consistent with LULUCF (IPCC, 2003).
Global FOLU CO
2
flux estimates (Table 11.1 and Figure 11.6) are based
on a wide range of data sources, and include different processes, defi-
nitions, and different approaches to calculating emissions (Houghton
etal., 2012; Le Quéré etal., 2013; Pongratz etal., 2013). This leads
to a large range across global FOLU flux estimates. Nonetheless, most
approaches agree that there has been a decline in FOLU CO
2
emissions
over the most recent years. This is largely due to a decrease in the rate
of deforestation (FAO, 2010; FAOSTAT, 2013).
Regional trends in FOLU CO
2
emissions are shown in Figure 11.7.
Model results indicate FOLU emissions peaked in the 1980s in Asia and
LAM regions and declined thereafter. This is consistent with a reduced
rate of deforestation, most notably in Brazil
4
, and some areas of affor-
estation, the latter most notably in China, Vietnam and India (FAO-
STAT, 2013). In MAF the picture is mixed, with the Houghton model
(Houghton etal., 2012) showing a continuing increase from the 1970s
to the 2000s, while the VISIT model (Kato etal., 2011) indicates a small
sink in the 2000s. The results for temperate and boreal areas repre-
sented by OECD and EIT regions are very mixed ranging from large
net sources (ISAM) to small net sinks. The general picture in temperate
and boreal regions is of declining emissions and / or increasing sinks.
These regions include large areas of managed forests subjected to har-
vest and regrowth, and areas of reforestation (e. g., following cropland
abandonment in the United States and Europe). Thus results are sensi-
tive to whether and how the models include forest management and
environmental effects on regrowing forests.
4
For annual deforestation rates in Brazil see http: / / www. obt. inpe. br / prodes / index.
php
Table 11�1 | Net global CO
2
flux from AFOLU.
1750 – 2011 1980 – 1989 1990 – 1999 2000 – 2009
Cumulative GtCO
2
GtCO
2
/ yr GtCO
2
/ yr GtCO
2
/ yr
IPCC WGI Carbon Budget, Table 6�1
a
:
Net AFOLU CO
2
flux
b
660 ± 293 5.13 ± 2.93 5.87 ± 2.93 4.03 ± 2.93
Residual terrestrial sink
c
– 550 ± 330 – 5.50 ± 4.03 – 9.90 ± 4.40 – 9.53 ± 4.40
Fossil fuel combustions and cement production
d
1338 ± 110 20.17 ± 1.47 23.47 ± 1.83 28.60 ± 2.20
Meta-analyses of net AFOLU CO
2
flux:
WGI, Table 6.2
e
4.77 ± 2.57 4.40 ± 2.20 2.93 ± 2.20
Houghton et al., 2012
f
4.18 ± 1.83 4.14 ± 1.83 4.03 ± 1.83
Notes: Positive fluxes represent net emissions and negative fluxes represent net sinks.
(a)
Selected components of the carbon budget in IPCC WGI AR5, Chapter 6, Table 6.1.
(b)
From the bookkeeping model accounting method of Houghton (2003) updated in Houghton etal., (2012), uncertainty based on expert judgement; 90 % confidence uncer-
tainty interval.
(c)
Calculated as residual of other terms in the carbon budget.
(d)
Fossil fuel flux shown for comparison (Boden etal., 2011).
(e)
Average of estimates from 12 process models, only 5 were updated to 2009 and included in the 2000 – 2009 mean. Uncertainty based on standard deviation across models,
90 % confidence uncertainty interval (WGI Chapter 6).
(f)
Average of 13 estimates including process models, bookkeeping model and satellite / model approaches, only four were updated to 2009 and included in the 2000 – 2009
mean. Uncertainty based on expert judgment.
826826
Agriculture, Forestry and Other Land Use (AFOLU)
11
Chapter 11
Figure 11�7 | Regional trends in net CO
2
fluxes from FOLU (including LUC). Houghton bookkeeping model approach updated to 2010 as in Houghton etal., (2012) and five
process-based vegetation models updated to 2010 for WGI Chapter 6; (Le Quéré etal., 2013): LPJ-wsl: (Poulter etal., 2010); BernCC: (Stocker etal., 2011); VISIT: (Kato etal., 2011);
ISAM: (Jain etal., 2013), IMAGE 2.4: ((Van Minnen etal., 2009), deforestation only). Only the FAO estimates (FAOSTAT, 2013) include peatlands.
-0.5
0.0
0.5
1.0
1.5
2.0
2.5
3.0
3.5
1970-
1979
1980-
1989
1990-
1999
2000-
2009
1970-
1979
1980-
1989
1990-
1999
2000-
2009
1970-
1979
1980-
1989
1990-
1999
2000-
2009
1970-
1979
1980-
1989
1990-
1999
2000-
2009
1970-
1979
1980-
1989
1990-
1999
2000-
2009
Max
OECD-1990 EIT ASIA MAF LAM
Min
Mean
FAOSTAT
BernCC
IMAGE 2.4
ISAM
VISIT
LPJ-wsl
Houghton
Net CO
2
Flux [GtCO
2
/yr]
The bookkeeping model method (Houghton, 2003; Houghton etal.,
2012) uses regional biomass, growth and decay rates from the inven-
tory literature that are not varied to account for changes in climate
or CO
2
. It includes forest management associated with shifting cul-
tivation in tropical forest regions as well as global wood harvest
and regrowth cycles. The primary source of data for the most recent
decades is FAO forest area and wood harvest (FAO, 2010). FAOSTAT
(2013) uses the default IPCC methodologies to compute stock-differ-
ence to estimate emissions and sinks from forest management, car-
bon loss associated with forest conversion to other land uses as a
proxy for emissions from deforestation, GFED4 data on burned area to
estimate emissions from peat fires, and spatial analyses to determine
emissions from drained organic soils (IPCC, 2007b). The other mod-
els in Figures 11.6 and 11.7 are process-based terrestrial ecosystem
models that simulate changing plant biomass and carbon fluxes, and
include climate and CO
2
effects, with a few now including the nitro-
gen cycle (Zaehle etal., 2011; Jain etal., 2013). Inclusion of the nitro-
gen cycle results in much higher modelled net emissions in the ISAM
model (Jain etal., 2013) as N limitation due to harvest removals lim-
its forest regrowth rates, particularly in temperate and boreal forests.
Change in land cover in the process models is from the HYDE dataset
(Goldewijk etal., 2011; Hurtt etal., 2011), based on FAO cropland and
pasture area change data. Only some process models include forest
management in terms of shifting cultivation (VISIT) or wood harvest
and forest degradation (ISAM); none account for emissions from peat-
lands (see Box 11.1).
Satellite estimates of change in land cover have been combined with
model approaches to calculate tropical forest emissions (Hansen etal.,
2010). The data is high resolution and verifiable, but only covers recent
decades, and does not account for fluxes due to LUC that occurred
prior to the start of the study period (e. g., decay or regrowth). Sat-
ellite data alone cannot distinguish the cause of change in land use
(deforestation, natural disturbance, management), but can be used in
conjunction with activity data for attribution (Baccini etal., 2012). A
recent development is the use of satellite-based forest biomass esti-
mates (Saatchi etal., 2011) together with satellite land cover change
in the tropics to estimate ‘gross deforestation’ emissions (Harris etal.,
2012) or further combining it with FAO and other activity data to esti-
mate net fluxes from forest area change and forest management (Bac-
cini etal., 2012).
A detailed breakdown of the component fluxes in (Baccini etal., 2012)
is shown in Figure 11.8. Where there is temporary forest loss through
management, ‘gross’ forest emissions can be as high as for permanent
forest loss (deforestation), but are largely balanced by ‘gross’ uptake
in regrowing forest, so net emissions are small. When regrowth does
not balance removals, it leads to a degradation of forest carbon stocks.
In Baccini etal. (2012) this degradation was responsible for 15 % of
total net emissions from tropical forests (Houghton, 2013; Figure 11.8).
Huang and Asner (2010) estimated that forest degradation in the Ama-
zon, particularly from selective logging, is responsible for 15 – 19 %
higher C emissions than reported from deforestation alone. Pan etal.
827827
Agriculture, Forestry and Other Land Use (AFOLU)
11
Chapter 11
Figure 11�8 | Breakdown of mean annual CO
2
fluxes from deforestation and forest management in tropical countries (GtCO
2
/ yr). Pan etal. (2011) estimates are based on FAO
data and the Houghton bookkeeping model (Houghton, 2003). Baccini etal. (2012) estimates are based on satellite land cover change and biomass data with FAO data, and the
Houghton (2003) bookkeeping model, with the detailed breakdown of these results shown in Houghton, (2013). Harris etal. (2012) estimates are based on satellite land cover
change and biomass data.
2.35
0.30
0.84
0.31
1.65
0.55
0.55
2.97
2.97
2.97
-0.06 Afforestation
-0.06 Afforestation
-1.64
-0.54
-2.05
5.32
4.11
11.11
10.30
-5.79
-6.20
-8
-6
-4
-2
0
2
4
6
8
10
12
Pan et al. "Gross
Deforestation
Emissions" and
"Regrowth Forest"
1990s
Pan et al. "Gross
Deforestation
Emissions" and
"Regrowth Forest"
Uptake 2000-2007
Pan et al. "Land Use
Change Emission"
i.e. Net Flux 1990s
Pan et al. "Land Use
Change Emission"
i.e. Net Flux
2000-2007
Baccini et al. Gross
Fluxes 2000-2007
Baccini et al. Net
Fluxes 2000-2007
Harris et al. "Gross
Deforestation"
Flux 2000-2007
Fluxes (+ Emissions, - Uptake) [GtCO
2
/yr]
“Gross Deforestation Emissions”
“Regrowth Forest”
Net “Land Use Change Emissions”
Shifting Cultivation
Fuelwood Harvest
Industrial Logging
Afforestation
Deforestation
Soils

828828
Agriculture, Forestry and Other Land Use (AFOLU)
11
Chapter 11
(2011) separated ‘gross emissions’ from deforestation and forest man-
agement on the one hand, from uptake in regrowing vegetation on the
other. Deforestation emissions decline from the 1990s to 2000 – 2007,
and uptake in regrowing vegetation increases, both contributing to the
decline in net tropical CO
2
emissions.
Satellite fire data have also been used to estimate FOLU emissions
(van der Werf etal., 2006); Box 11.2). The EDGAR
5
database ‘Land-
5
http: / / edgar.jrc.ec.europa.eu / index.php
Use Change and Forestry’ emissions are based on forest and peat
fire data from GFED 2.0 (van der Werf etal., 2006), with additional
estimates of post-burn decay, and emissions from degraded peat-
lands based on (Joosten, 2010); Box 11.1). However, GFED 2.0 fire
data does not distinguish anthropogenic AFOLU fires from other fires,
unlike GFED 3.0 (van der Werf etal., 2010); Box 11.2). Fire data also
does not capture significant additional AFOLU fluxes due to land
clearing and forest management that is by harvest rather than fire
(e. g., deforestation activities outside the humid tropics) or regrowth
following clearing. Thus EDGAR data only approximates the FOLU
flux.
Box 11�1 | AFOLU GHG emissions from peatlands and mangroves
Undisturbed waterlogged peatlands (organic soils) store a large
amount of carbon and act as small net sinks (Hooijer etal., 2010).
Drainage of peatlands for agriculture and forestry results in a
rapid increase in decomposition rates, leading to increased emis-
sions of CO
2
, and N
2
O, and vulnerability to further GHG emissions
through fire. The FAO emissions database estimates globally
250,000 km
2
of drained organic soils under cropland and grass-
land, with total GHG emissions of 0.9 GtCO
2
eq / yr in 2010 — with
the largest contributions from Asia (0.44 GtCO
2
eq / yr) and Europe
(0.18 GtCO
2
eq / yr) (FAOSTAT, 2013). Joosten (2010), estimated
that there are >500,000 km
2
of drained peatlands in the world
including under forests, with CO
2
emissions having increased
from 1.06 GtCO
2
/ yr in 1990 to 1.30 GtCO
2
/ yr in 2008, despite a
decreasing trend in Annex I countries, from 0.65 to 0.49 GtCO
2
/ yr,
primarily due to natural and artificial rewetting of peatlands.
In Southeast Asia, CO
2
emissions from drained peatlands in
2006 were 0.61±0.25 GtCO
2
/ yr (Hooijer etal., 2010). Satel-
lite estimates indicate that peat fires in equatorial Asia emitted
on average 0.39 GtCO
2
eq / yr over the period 1997 – 2009 (van
der Werf etal., 2010), but only 0.2 GtCO
2
eq / yr over the period
1998 – 2009. This lower figure is consistent with recent indepen-
dent FAO estimates over the same period and region. Mangrove
ecosystems have declined in area by 20 % (36 Mha) since 1980,
although the rate of loss has been slowing in recent years, reflect-
ing an increased awareness of the value of these ecosystems (FAO,
2007). A recent study estimated that deforestation of mangroves
released 0.07 to 0.42 GtCO
2
/ yr (Donato etal., 2011).
Box 11�2� | AFOLU GHG emissions from fires
Burning vegetation releases CO
2
, CH
4
, N
2
O, ozone-precursors
and aerosols (including black carbon) to the atmosphere. When
vegetation regrows after a fire, it takes up CO
2
and nitrogen.
Anthropogenic land management or land conversion fire activities
leading to permanent clearance or increasing levels of disturbance
result in net emissions to the atmosphere over time. Satellite-
detection of fire occurrence and persistence has been used to
estimate fire emissions (e. g., GFED 2.0 database; (van der Werf
etal., 2006). It is hard to separate the causes of fire as natural
or anthropogenic, especially as the drivers are often combined.
An update of the GFED methodology now distinguishes FOLU
deforestation and degradation fires from other management fires
(GFED 3.0 database; (van der Werf etal., 2010); Figure 11.6). The
estimated tropical deforestation and degradation fire emissions
were 1.39 GtCO
2
eq / yr during 1997 to 2009 (total carbon including
CO
2
, CH
4
, CO and black carbon), 20 % of all fire emissions. Carbon
dioxide FOLU fire emissions are already included as part of the
global models results such as those presented in Table 1.1 and
Figures 11.6 and 11.7. According to (FAOSTAT, 2013)
1
, in 2010 the
non-CO
2
component of deforestation and forest degradation fires
totalled 0.1 GtCO
2
eq / yr, with forest management and peatland
fires (Box 11.1) responsible for an additional 0.2 GtCO
2
eq / yr.
1
FOLU GHG emissions by fires include, as per IPCC GHG guidelines, all fires
on managed land. Most current FOLU estimates are limited however to fires
associated to deforestation, forest management and peat fires. Emissions
from prescribed burning of savannahs are reported under agriculture. Both
CO
2
and non-CO
2
emissions are accounted under these FOLU components,
but CO
2
emissions dominate.

829829
Agriculture, Forestry and Other Land Use (AFOLU)
11
Chapter 11
FAO estimates AFOLU GHG emissions (FAOSTAT, 2013)
6
based on
IPCC Tier 1 methodology
7
. With reference to the decade 2001 – 2010,
total GHG FOLU emissions were 3.2 GtCO
2
eq / yr including defor-
estation (3.8 GtCO
2
eq / yr), forest degradation and forest manage-
ment (– 1.8 GtCO
2
eq / yr), biomass fires including peatland fires
(0.3 GtCO
2
eq / yr), and drained peatlands (0.9 GtCO
2
eq / yr). The FAO
estimated total mean net GHG FOLU flux to the atmosphere decreased
from 3.9 GtCO
2
eq / yr in 1991 – 2000 to 3.2 GtCO
2
eq / yr in 2001 – 2010
(FAOSTAT, 2013).
11.3 Mitigation technology
options and practices,
and behavioural aspects
Greenhouse gases can be reduced by supply-side mitigation options (i. e.,
by reducing GHG emissions per unit of land / animal, or per unit of prod-
uct), or by demand-side options (e. g., by changing demand for food and
fibre products, reducing waste). In AR4, the forestry chapter (Nabuurs
etal., 2007) considered some demand-side options, but the agriculture
chapter focused on supply-side options only (Nabuurs etal., 2007; Smith
etal., 2007). In this section, we discuss only supply-side options (Section
11.3.1). Demand-side options are discussed in Section 11.4.
Mitigation activities in the AFOLU sector can reduce climate forcing in
different ways:
• Reductions in CH
4
or N
2
O emissions from croplands, grazing lands,
and livestock.
• Conservation of existing carbon stocks, e. g., conservation of forest
biomass, peatlands, and soil carbon that would otherwise be lost.
• Reductions of carbon losses from biota and soils, e. g., through
management changes within the same land-use type (e. g., reduc-
ing soil carbon loss by switching from tillage to no-till cropping) or
by reducing losses of carbon-rich ecosystems, e. g., reduced defor-
estation, rewetting of drained peatlands.
• Enhancement of carbon sequestration in soils, biota, and long-
lived products through increases in the area of carbon-rich eco-
systems such as forests (afforestation, reforestation), increased
carbon storage per unit area, e. g., increased stocking density in
6
http: / / faostat.fao.org /
7
Parties to the UNFCCC report net GHG emissions according to IPCC method-
ologies (IPCC, 2003, 2006). Reporting is based on a range of methods and
approaches dependent on available data and national capacities, from default
equations and emission factors applicable to global or regional cases and assum-
ing instantaneous emissions of all carbon that will be eventually lost from the
system following human action (Tier 1) to more complex approaches such as
model-based spatial analyses (Tier 3).
forests, carbon sequestration in soils, and wood use in construction
activities.
• Changes in albedo resulting from land-use and land-cover change
that increase reflection of visible light.
• Provision of products with low GHG emissions that can replace
products with higher GHG emissions for delivering the same ser-
vice (e. g., replacement of concrete and steel in buildings with
wood, some bioenergy options; see Section 11.13).
• Reductions of direct (e. g., agricultural machinery, pumps, fishing
craft) or indirect (e. g., production of fertilizers, emissions result-
ing from fossil energy use in agriculture, fisheries, aquaculture, and
forestry or from production of inputs); though indirect emission
reductions are accounted for in the energy end-use sectors (build-
ings, industry, energy generation, transport) so are not discussed
further in detail in this chapter.
11�3�1 Supply-side mitigation options
Mitigation potentials for agricultural mitigation options were given on
a ‘per-area’ and ‘per-animal’ in AR4 (Nabuurs etal., 2007; Smith etal.,
2007). All options are summarized in Table 11.2 with impacts on each
GHG noted, and a categorization of technical mitigation potential,
ease of implementation, and availability (supported by recent refer-
ences). These mitigation options can have additive positive effects, but
can also work in opposition, e. g., zero tillage can reduce the effective-
ness of residue incorporation. Most mitigation options were described
in detail in AR4 so are not described further here; additional practices
that were not considered in AR4, i. e., biochar, reduced emissions from
aquaculture, and bioenergy are described in Boxes 11.3, 11.4, and
11.5, respectively.
In addition to the per-area and per-animal mitigation options described
in AR4, more attention has recently been paid to options that reduce
emissions intensity by improving the efficiency of production (i. e., less
GHG emissions per unit of agricultural product; (Burney etal., 2010;
Bennetzen etal., 2012); a reduction in emissions intensity has long
been a feature of agricultural emissions reduction and is one compo-
nent of a process more broadly referred to as sustainable intensifica-
tion (Tilman etal., 2009; Godfray et al., 2010; Smith, 2013; Garnett
etal., 2013). This process does not rely on reducing inputs per se, but
relies on the implementation of new practices that result in an increase
in product output that is larger than any associated increase in emis-
sions (Smith, 2013). Even though per-area emissions could increase,
there is a net benefit since less land is required for production of the
same quantity of product. The scope to reduce emissions intensity
appears considerable since there are very large differences in emis-
sions intensity between different regions of the world (Herrero etal.,
2013). Sustainable intensification is discussed further in Section 11.4.2,
and trends in changes in emissions intensity are discussed further in
Section 11.6.

830830
Agriculture, Forestry and Other Land Use (AFOLU)
11
Chapter 11
Table 11�2 | Summary of supply-side mitigation options in the AFOLU sector. Technical Mitigation Potential: Area = (tCO
2
eq / ha) / yr; Animal = percent reduction of enteric emissions.
Low = < 1; <5 % (white), Medium = 1 – 10; 5 – 15 % (light grey), High = >10, >15 % (grey); Ease of Implementation (acceptance or adoption by land manager): Difficult (white),
Medium (light grey), Easy, i. e., universal applicability (grey); Timescale for Implementation: Long-term (at research and development stage; white), Mid-term (trials in place, within
5 – 10 years; light grey), Immediate (technology available now, grey).
Categories Practices and Impacts
Technical Mitiga-
tion Potential
Ease of Imple-
mentation
Timescale for
implementation
References
Forestry
Reducing deforestation
C: Conservation of existing C pools in forest vegetation and soil by controlling deforestation
protecting forest in reserves, and controlling other anthropogenic disturbances such as
fire and pest outbreaks. Reducing slash and burn agriculture, reducing forest fires.
1
CH
4,
N
2
O: Protection of peatland forest, reduction of wildfires. 2
Afforestation / Reforestation
C: Improved biomass stocks by planting trees on non-forested agricultural lands.
This can include either monocultures or mixed species plantings. These activities may
also provide a range of other social, economic, and environmental benefits.
3, 4, 5
Forest management
C: Management of forests for sustainable timber production including
extending rotation cycles, reducing damage to remaining trees, reducing
logging waste, implementing soil conservation practices, fertilization, and using
wood in a more efficient way, sustainable extortion of wood energy
6, 7, 8, 9
CH
4,
N
2
O: Wildfire behaviour modification. 10, 11, 12
Forest restoration
C: Protecting secondary forests and other degraded forests whose biomass and soil
C densities are less than their maximum value and allowing them to sequester C by
natural or artificial regeneration, rehabilitation of degraded lands, long-term fallows.
13, 14
CH
4,
N
2
O
: Wildfire behaviour modification.
Land-based agriculture
Cropland management
Croplands — plant
management
C: High input carbon practices, e. g., improved crop varieties, crop rotation, use
of cover crops, perennial cropping systems, agricultural biotechnology.
15, 16, 17
N
2
O: Improved N use efficiency. 18
Croplands — nutrient
management
C: Fertilizer input to increase yields and residue inputs
(especially important in low-yielding agriculture).
19, 20
N
2
O: Changing N fertilizer application rate, fertilizer type,
timing, precision application, inhibitors.
21, 22, 23, 24, 25, 105, 106
Croplands — tillage / residues
management
C: Reduced tillage intensity; residue retention. 17, 24, 26, 27
N
2
O: 28, 96, 97
CH
4:
96
Croplands — water
management
C: Improved water availability in cropland including water harvesting and application. 29
CH
4
: Decomposition of plant residues.
N
2
O: Drainage management to reduce emissions, reduce N runoff leaching.
Croplands — rice management
C: Straw retention. 30
CH
4
: Water management, mid-season paddy drainage. 31, 32, 98
N
2
O: Water management, N fertilizer application rate,
fertilizer type, timing, precision application.
32, 98, 99
Rewet peatlands drained
for agriculture
C: Ongoing CO
2
emissions from reduced drainage (but CH
4
emissions may increase). 33
Croplands — set-aside and LUC
C: Replanting to native grasses and trees. Increase C sequestration. 34, 35, 36, 37, 38
N
2
O: N inputs decreased resulting in reduced N
2
O.
Biochar application
C: Soil amendment to increase biomass productivity, and sequester C
(biochar was not covered in AR4 so is described in Box 11.3).
39, 40, 41
N
2
O: Reduced N inputs will reduce emissions. 39, 42
⇒

831831
Agriculture, Forestry and Other Land Use (AFOLU)
11
Chapter 11
Categories Practices and Impacts
Technical Mitiga-
tion Potential
Ease of Imple-
mentation
Timescale for
implementation
References
Grazing Land Management
Grazing lands — plant
management
C: Improved grass varieties / sward composition, e. g., deep rooting grasses,
increased productivity, and nutrient management. Appropriate stocking densities,
carrying capacity, fodder banks, and improved grazing management.
43, 44, 45
N
2
O 46
Grazing lands — animal
management
C: Appropriate stocking densities, carrying capacity management, fodder banks and
improved grazing management, fodder production, and fodder diversification.
43, 47
CH
4
N
2
O: Stocking density, animal waste management.
Grazing land — fire
management
C: Improved use of fire for sustainable grassland management.
Fire prevention and improved prescribed burning.
Revegetation
Revegetation
C: The establishment of vegetation that does not meet the definitions
of afforestation and reforestation (e. g., Atriplex spp.).
48
CH
4
: Increased grazing by ruminants may increase net emissions.
N
2
O: Reduced N inputs will reduce emissions.
Other
Organic soils — restoration
C: Soil carbon restoration on peatlands; and avoided net soil
carbon emissions using improved land management.
49
CH
4
: May increase.
Degraded soils — restoration
Land reclamation (afforestation, soil fertility management, water
conservation soil nutrients enhancement, improved fallow).
100, 101, 102, 103, 104
Biosolid applications
C: Use of animal manures and other biosolids for improved management
of nitrogen; integrated livestock agriculture techniques.
26
N
2
O
Livestock
Livestock — feeding
CH
4
: Improved feed and dietary additives to reduce emissions from
enteric fermentation; including improved forage, dietary additives
(bioactive compounds, fats), ionophores / antibiotics, propionate
enhancers, archaea inhibitors, nitrate and sulphate supplements.
50, 51, 52, 53, 54,
55, 56, 57, 58, 59
Livestock — breeding and
other long-term management
CH
4
: Improved breeds with higher productivity (so lower emissions per unit
of product) or with reduced emissions from enteric fermentation; microbial
technology such as archaeal vaccines, methanotrophs, acetogens, defaunation
of the rumen, bacteriophages and probiotics; improved fertility.
54, 55, 56, 58, 60, 61,
62, 63, 64, 65, 66,
67, 68, 69, 70, 71
Manure management
CH
4
: Manipulate bedding and storage conditions, anaerobic
digesters; biofilters, dietary additives.
56, 58, 72, 73
N
2
O: Manipulate livestock diets to reduce N excreta, soil applied and animal
fed nitrification inhibitors, urease inhibitors, fertilizer type, rate and timing,
manipulate manure application practices, grazing management.
56, 58, 72, 74, 75, 76, 77, 78
Integrated systems
Agroforestry (including
agropastoral and
agrosilvopastoral systems)
C: Mixed production systems can increase land productivity and
efficiency in the use of water and other resources and protect against
soil erosion as well as serve carbon sequestration objectives.
79, 80, 81, 82, 83,
84, 85, 86, 87, 88
N
2
O: Reduced N inputs will reduce emissions.
Other mixed biomass
production systems
C: Mixed production systems such as double-cropping systems and mixed crop-livestock
systems can increase land productivity and efficiency in the use of water and other resources
as well as serve carbon sequestration objectives. Perennial grasses (e. g., bamboo) can in
the same way as woody plants be cultivated in shelter belts and riparian zones / buffer strips
provide environmental services and supports C sequestration and biomass production.
82, 89, 90
N
2
O: Reduced N inputs will reduce emissions.
⇒

832832
Agriculture, Forestry and Other Land Use (AFOLU)
11
Chapter 11
11�3�2 Mitigation effectiveness
(non- permanence: saturation,
human and natural impacts,
displacement)
Since carbon sequestration in soil and vegetation and the retention of
existing carbon stocks forms a significant component of the mitigation
potential in the AFOLU sector, this section considers the factors affect-
ing this strategy compared to avoided GHG emissions.
Non-permanence / reversibility. Reversals are the release of previously
sequestered carbon, which negates some or all of the benefits from
sequestration that has occurred in previous years. This issue is some-
times referred to as ‘non-permanence’ (Smith, 2005). Various types of
carbon sinks (e. g., afforestation / reforestation, agricultural soil C) have
an inherent risk of future reversals.
Certain types of mitigation activities (e. g., avoided N
2
O from fertilizer,
emission reductions from changed diet patterns or reduced food-chain
losses) are effectively permanent since the emissions, once avoided,
cannot be re-emitted. The same applies to the use of bioenergy to dis-
place fossil-fuel emissions (Section 11.13) or the use of biomass-based
products to displace more emissions-intensive products (e. g., wood in
place of concrete or steel) in construction.
Reversals may be caused by natural events that affect yields / growth.
In some cases (e. g., frost damage, pest infestation, or fire; (Reichstein
etal., 2013), these effects may be temporary or short-term. Although
these events will affect the annual increment of C sequestration, they
may not result in a permanent decline in carbon stocks. In other cases,
such as stand replacing forest fires, insect or disease outbreaks, or
drought, the declines may be more profound. Although a substantial
loss of above-ground stored carbon could occur following a wildfire,
whether this represents a loss depends on what happens following the
fire and whether the forest recovers, or changes to a lower carbon-
storage state (see Box 11.2). Similarly, some systems are naturally
adapted to fire and carbon stocks will recover following fire, whereas
in other cases the fire results in a change to a system with a lower
carbon stock (e. g., Brown and Johnstone, 2011). For a period of time
following fire (or other disruptive event), the stock of carbon will be
less than that before the fire. Similarly, emissions of non-CO
2
gases
also need to be considered.
The permanence of the AFOLU carbon stock relates to the longevity of
the stock, i. e., how long the increased carbon stock remains in the soil
or vegetation. This is linked to consideration of the reversibility of the
increased carbon stock (Smith, 2005), as discussed in Section 11.5.2.
Saturation. Substitution of fossil fuel and material with biomass, and
energy-intensive building materials with wood can continue in perpe-
tuity. In contrast, it is often considered that carbon sequestration in
soils (Guldea etal., 2008) or vegetation cannot continue indefinitely.
The carbon stored in soils and vegetation reaches a new equilibrium
(as the trees mature or as the soil carbon stock saturates). As the
Categories Practices and Impacts
Technical Mitiga-
tion Potential
Ease of Imple-
mentation
Timescale for
implementation
References
Integration of biomass
production with subsequent
processing in food and
bioenergy sectors
C: Integrating feedstock production with conversion, typically producing animal feed
that can reduce demand for cultivated feed such as soy and corn and can also reduce
grazing requirements. Using agricultural and forestry residues for energy production.
91, 92, 93, 94, 95
N
2
O: Reduced N inputs will reduce emissions.
Bioenergy (see Box 11�5 and Section 11�13)
1
Van Bodegom etal., 2009;
2
Malmsheimer etal., 2008;
3
Reyer etal., 2009;
4
Sochacki etal., 2012;
5
IPCC, 2000;
6
DeFries and Rosenzweig, 2010;
7
Takimoto etal., 2008;
8
Masera
etal., 2003;
9
Silver etal., 2000;
10
Dezzeo etal., 2005;
11
Ito, 2005;
12
Sow etal., 2013;
13
Reyer etal., 2009;
14
Palm etal., 2004;
15
Godfray etal., 2010;
16
Burney etal., 2010;
17
Conant
etal., 2007;
18
Huang and Tang, 2010;
19
Lemke etal., 2010;
20
Eagle and Olander, 2012;
21
Snyder etal., 2007;
22
Akiyama etal., 2010;
23
Barton etal., 2011;
24
Powlson etal., 2011;
25
van Kessel etal., 2013;
26
Farage etal., 2007;
27
Smith, 2012;
28
Abdalla etal., 2013;
29
Bayala etal., 2008;
30
Yagi etal., 1997;
31
Tyagi etal., 2010;
32
Feng etal., 2013;
33
Lohila
etal., 2004;
34
Seaquist etal., 2008;
35
Mbow, 2010;
36
Assogbadjo etal., 2012;
37
Laganiere etal., 2010;
38
Bayala etal., 2011;
39
Singh etal., 2010;
40
Woolf etal., 2010;
41
Lehmann
etal., 2003;
42
Taghizadeh-Toosi etal., 2011;
43
Franzluebbers and Stuedemann, 2009;
44
Follett and Reed, 2010;
45
McSherry and Ritchie, 2013;
46
Saggar etal., 2004;
47
Thornton
and Herrero, 2010;
48
Harper etal., 2007;
49
Smith and Wollenberg, 2012;
50
Beauchemin etal., 2008;
51
Beauchemin etal., 2009;
52
Martin etal., 2010;
53
Grainger and Beauchemin,
2011;
54
Clark, 2013;
55
Cottle etal., 2011;
56
Eckard etal., 2010;
57
Sauvant and Giger-Reverdin, 2007;
58
Hristov etal., 2013;
59
Bryan etal., 2013;
60
Attwood and McSweeney, 2008;
61
Attwood etal., 2011;
62
Hegarty etal., 2007;
63
Hook etal., 2010;
64
Janssen and Kirs, 2008;
65
Martin etal., 2010;
66
Morgavi etal., 2008;
67
Morgavi etal., 2010;
68
Place and Mit-
loehner, 2010;
69
Waghorn and Hegarty, 2011;
70
Wright and Klieve, 2011;
71
Yan etal., 2010
72
Chadwick etal., 2011;
73
Petersen and Sommer, 2011;
74
de Klein etal., 2010;
75
de
Klein and Eckard, 2008;
76
Dijkstra etal., 2011
77
Schils etal., 2013;
78
VanderZaag etal., 2011;
79
Oke and Odebiyi, 2007;
80
Rice, 2008;
81
Takimoto etal., 2008;
82
Lott etal., 2009;
83
Sood and Mitchell, 2011;
84
Assogbadjo etal., 2012;
85
Wollenberg etal., 2012;
86
Semroc etal., 2012;
87
Souza etal. 2012;
88
Luedeling and Neufeldt, 2012;
89
Heggenstaller etal.,
2008;
90
Herrero etal., 2010;
91
Dale etal., 2009;
92
Dale etal., 2010;
93
Sparovek etal. 2007;
94
Sood and Mitchell, 2011;
95
Vermeulen etal., 2012;
96
Metay etal., 2007 ;
97
Rochette,
2008;
98
Ma etal., 2009;
99
Yao etal., 2010;
100
Arnalds, 2004;
101
Batjes, 2004;
102
Hardner etal., 2000;
103
May etal., 2004;
104
Zhao etal., 2005;
105
Huang and Tang, 2010;
106
Kim
etal., 2013.

833833
Agriculture, Forestry and Other Land Use (AFOLU)
11
Chapter 11
Box 11�3 | Biochar
This box summarizes the mitigation potential for biochar tech-
nologies, which were not considered in AR4. Biomass C stabiliza-
tion could be combined with (or substitute) bioenergy capture
as part of a land-based mitigation strategy (Lehmann, 2007).
Heating biomass with air excluded (pyrolysis) generates energy-
containing volatiles and gases. Hydrogen and O are preferentially
eliminated, creating a stable (biologically recalcitrant) C-rich co-
product (char). By adding char to soil as ‘biochar’ a system can be
established that may have a higher carbon abatement than typical
bioenergy alternatives (Woolf etal., 2010). The gain is probably
highest where efficient bioenergy is constrained by a remote, sea-
sonal, or diffuse biomass resource (Shackley etal., 2012). The ben-
efit of pyrolysis-biochar systems (PBS) is increased considerably if
allowance is made for the indirect effects of using biochar via the
soil. These effects include increased crop and biomass production
and decreased N
2
O and CH
4
emissions. Realizing the mitigation
potential for biochar technologies will be constrained by the need
for sustainable feedstock acquisition, competing biomass use
options are an important influence of the production process on
biochar properties. Considering sustainable feedstock production
and targeting biochar deployment on less fertile land, Woolf etal.
(2010) calculated maximum global abatement of 6.6 GtCO
2
eq / yr
from 2.27 Gt biomass C. Allowing for competition for virgin non-
waste biomass the value was lower (3.67 GtCO
2
eq / yr from 1.01
Gt biomass C), accruing 240 – 480 GtCO
2
eq abatement within 100
years.
Meta-analysis shows that in experimental situations crop produc-
tivity has, on average, been enhanced by circa 15 % near-term,
but with a wide range of effects (Jeffery etal., 2011; Biederman
and Harpole, 2013). This range is probably explained by the nature
and extent of pre-existing soil constraints. The Woolf etal. (2010)
analysis accordingly assumed crop yield increases of 0 – 90 % (rela-
tive). Relaxing this assumption by one-half decreased projected
abatement by 10 %. Decreasing an assumed 25 % suppression on
soil N
2
O flux by the same proportion had a smaller impact. Ben-
eficial interactions of biochar and the soil N cycle are beginning
to be understood with effects on mineralization, nitrification,
denitrification, immobilization and adsorption persisting at least
for days and months after biochar addition (Nelissen etal., 2012;
Clough etal., 2013). Although the often large suppression of soil
N
2
O flux observed under laboratory conditions can be increasingly
explained (Cayuela etal., 2013), this effect is not yet predictable
and there has been only limited validation of N
2
O suppression by
biochar in planted field soils (Liu etal., 2012; Van Zwieten etal.,
2013) or over longer timeframes (Spokas, 2013). The potential to
gain enhanced mitigation using biochar by tackling gaseous emis-
sions from manures and fertilizers before and after application to
soil are less well-explored (Steiner etal., 2010; Angst etal., 2013).
The abatement potential for PBS remains most sensitive to the
absolute stability of the C stored in biochar. Estimates of ‘half-
life’ have been inferred from wildfire charcoal (Lehmann, 2007)
or extrapolated from direct short-term observation. These give
values that range from <50 to >10,000 years, but predominantly
between 100 – 1000 years (Singh etal., 2012; Spokas, 2013).
Nonetheless, the assumption made by Woolf etal. (2010) for the
proportion of biochar C that is stable long-term (85 %) is subject
to refinement and field validation.
Demonstration of the equipment and infrastructure required for
effective use of energy products from biomass pyrolysis is still
limited, especially across large and small unit scales. Preliminary
analyses shows, however, that the break-even cost of biochar
production is likely to be location- and feedstock-specific (Shack-
ley etal., 2012; Field etal., 2013). Until economic incentives are
established for the stabilization of C, biochar adoption will depend
on predictable, positive effects on crop production. This requires
more research on the use of biochar as a regular low-dose soil
input, rather than single applications at rates >10t / ha, which
have so far been the norm (Sohi, 2012). Product standards are
also required, to ensure that biochar is produced in a way that
does not create or conserve problematic concentrations of toxic
contaminants, and to support regulated deployment strategies (IBI
Biochar, 2012; Downie etal., 2012).
soils / vegetation approach the new equilibrium, the annual removal
(sometimes referred to as the sink strength) decreases until it becomes
zero at equilibrium. This process is called saturation (Smith, 2005;
Körner, 2006, 2009; Johnston etal., 2009b) , and the uncertainty asso-
ciated with saturation has been estimated (Kim and McCarl, 2009). An
alternative view is that saturation does not occur, with studies from
old-growth forests, for example, showing that they can continue to
sequester C in soil and dead organic matter even if net living biomass
increment is near zero (e. g., Luyssaert et al., 2008). Peatlands are
unlikely to saturate in carbon storage, but the rate of C uptake may be
very slow (see Box 11.1).
Human and natural impacts. Soil and vegetation carbon sinks can be
impacted upon by direct human-induced, indirect human-induced, and
natural changes (Smith, 2005). All of the mitigation practices discussed
in Section 11.3.1 arise from direct human-induced impacts (deliberate

834834
Agriculture, Forestry and Other Land Use (AFOLU)
11
Chapter 11
management). Both sink processes and carbon stocks can be affected
by natural factors such as soil and hydrological conditions. Indirect
human-induced changes can impact carbon sinks and are influenced by
human activity, but are not directly related to the management of that
piece of land; examples include climate change and atmospheric nitro-
gen deposition. For some tree species, rising concentrations of tropo-
spheric ozone caused by human activities may counteract the effects of
increased atmospheric CO
2
or N deposition on tree growth (Sitch etal.,
2008; Matyssek etal., 2010). Natural changes that threaten to impact
the efficacy of mitigation measures are discussed in Section 11.5.
Displacement / leakage. Displacement / leakage arises from a change in
land use or land management that causes a positive or negative change
in emissions elsewhere. This can occur within or across national bound-
aries, and the efficacy of mitigation practices must consider the leak-
age implications. For example, if reducing emissions in one place leads
to increased emissions elsewhere, no net reduction occurs; the emis-
sions are simply displaced (Powlson etal., 2011; Kastner etal., 2011b;
a). However, this assumes a one-to-one correspondence. Murray etal.
(2004) estimated the leakage from different forest carbon programmes
and this varied from <10 % to >90 % depending on the nature of the
activity. West etal. (2010a) examined the impact of displaced activities
in different geographic contexts; for example, land clearing in the trop-
ics will release twice the carbon, but only produce half the crop yield
of temperate areas. Indirect land-use change is an important compo-
nent to consider for displaced emissions and assessments of this are an
emerging area. Indirect land-use change is discussed further in Section
11.4 and in relation to bioenergy in Section 11.13.
The timing of mitigation benefits from actions (e. g., bioenergy, forest
management, forest products use / storage) can vary as a result both of
the nature of the activity itself (e. g., from the temporal pattern of soil
or forest sequestration compared to biomass substitution), and rates
of adoption. Timing thus needs to be considered when judging the
effectiveness of a mitigation action. Cherubini etal. (2012) modelled
the impact of timing of benefits for three different wood applications
(fuel, non-structural panels, and housing construction materials) and
showed that the options provide mitigation over different timeframes,
and thus have different impacts on CO
2
concentrations and radiative
forcing. The temporal pattern of emissions and removals is especially
important in mitigating emissions of short-lived gases through carbon
sequestration (Lauder etal., 2013).
Box 11�4 | Aquaculture
Aquaculture is defined as the farming of fish, shellfish, and
aquatic plants (Hu etal., 2013). Although it is an ancient practice
in some parts of world, this sector of the food system is growing
rapidly. Since the mid-1970s, total aquaculture production has
grown at an average rate of 8.3 % per year (1970 – 2008; (Hu
etal., 2013). The estimated aquaculture production in 2009 was
55.10 Mt, which accounts for approximately 47 % of all the fish
consumed by humans (Hu etal., 2013). The sector is diverse, being
dominated by shellfish and herbivorous and omnivorous pond
fish, either entirely or partly utilizing natural productivity, but
globalizing trade and favourable economic conditions are driving
intensive farming at larger scales (Bostock etal., 2010). Potential
impacts of aquaculture, in terms emissions of N
2
O, have recently
been considered (Williams and Crutzen, 2010; Hu etal., 2012).
Global N
2
O emissions from aquaculture in 2009 were estimated to
be 93 ktN
2
O-N (~43 MtCO
2
eq), and will increase to 383 ktN
2
O-N
(~178 MtCO
2
eq) by 2030, which could account for 5.7 % of
anthropogenic N
2
O-N emissions if aquaculture continues to grow
at the present growth rate (~7.1 % / yr; Hu etal., 2012).
Some studies have focused on rice-fish farming, which is a
practice associated with wet rice cultivation in Southeast Asia,
providing protein, especially for subsistence-oriented farmers
(Bhattacharyya etal., 2013). Cultivation of fish along with rice
increases emissions of CH
4
(Frei etal., 2007; Bhattacharyya etal.,
2013), but decreases N
2
O emissions, irrespective of the fish spe-
cies used (Datta etal., 2009; Bhattacharyya etal., 2013). Although
rice-fish farming systems might be globally important in terms
of climate change, they are also relevant for local economy, food
security, and efficient water use (shared water), which makes
it difficult to design appropriate mitigation measures, because
of the tradeoffs between mitigation measures and rice and fish
production (Datta etal., 2009; Bhattacharyya etal., 2013). Feeding
rate and dissolved oxygen (DO) concentration could affect N
2
O
emissions from aquaculture systems significantly, and nitrifica-
tion and denitrification processes were equally responsible for the
emissions of N
2
O in these systems. Measures to control N
2
O from
aquaculture are described by Hu etal. (2012), and include the
maintenance of optimal operating conditions of the system, such
as appropriate pH and temperature, sufficient DO and good qual-
ity feed. Additionally, two potential ways to minimize N
2
O emis-
sions from aquaculture systems include ‘Aquaponic Aquaculture’
(polyculture consisting of fish tanks (aquaculture) and plants that
are cultivated in the same water cycle (hydroponic)), and Bioflocs
Technology (BFT) Aquaculture (which involves the development
and control of heterotrophic bacteria in flocs within the fish
culture component), where the growth of heterotrophic bacteria is
stimulated, leading to nitrogen uptake (Hu etal., 2012).

835835
Agriculture, Forestry and Other Land Use (AFOLU)
11
Chapter 11
Box 11�5 | Bioenergy
Bioenergy deployment offers significant potential for climate
change mitigation, but also carries considerable risks. The SRREN
(IPCC, 2011) suggested potential bioenergy deployment levels to
be between 100 – 300 EJ. This assessment agrees on a technical
bioenergy potential of around 100 EJ, and possibly 300 EJ and
higher. Integrated models project between 15 – 245 EJ / yr deploy-
ment in 2050, excluding traditional bioenergy. Achieving high
deployment levels would require, amongst others, extensive use
of agricultural residues and second-generation biofuels to miti-
gate adverse impacts on land use and food production, and the
co-processing of biomass with coal or natural gas with carbon
dioxide capture and storage (CCS) to produce low net GHG-
emitting transportation fuels and / or electricity. Integration of
crucial sectoral research (albedo effects, evaporation, counterfac-
tual land carbon sink assumptions) into transformation pathways
research, and exploration of risks of imperfect policy settings
(for example, in absence of a global CO
2
price on land carbon)
is subject of further research (Sections 11.9, 11.13.2, 11.13.4).
Small-scale bioenergy systems aimed at meeting rural energy
needs synergistically provide mitigation and energy access
benefits. Decentralized deployment of biomass for energy, in
combination with improved cookstoves, biogas, and small-scale
biopower, could improve livelihoods and health of around 2.6
billion people. Both mitigation potential and sustainability hinges
crucially on the protection of land carbon (high-density carbon
ecosystems), careful fertilizer application, interaction with food
markets, and good land and water management. Sustainability
and livelihood concerns might constrain beneficial deployment of
dedicated biomass plantations to lower values (Sections 11.13.3,
11.13.5, 11.13.7).
Lifecycle assessments for bioenergy options demonstrate a
plethora of pathways, site-specific conditions and technologies
that produce a wide range of climate-relevant effects. Specifically,
LUC emissions, N
2
O emissions from soil and fertilizers, co-prod-
ucts, process design and process fuel use, end-use technology,
and reference system can all influence the total attributional
lifecycle emissions of bioenergy use. The large variance for specific
pathways points to the importance of management decisions in
reducing the lifecycle emissions of bioenergy use. The total mar-
ginal global warming impact of bioenergy can only be evaluated
in a comprehensive setting that also addresses equilibrium effects,
e. g., indirect land-use change (iLUC) emissions, actual fossil fuel
substitution, and other effects. Structural uncertainty in modelling
decisions renders such evaluation exercises uncertain. Available
data suggest a differentiation between options that offer low
lifecycle emissions under good land-use management (e. g., sug-
arcane, Miscanthus, and fast-growing tree species) and those that
are unlikely to contribute to climate change mitigation (e. g., corn
and soybean), pending new insights from more comprehensive
consequential analyses (Sections 8.7, 11.13.4).
Coupling bioenergy and CCS (BECCS) has attracted particular
attention since AR4 because it offers the prospect of negative
emissions. Until 2050, the economic potential is estimated to be
between 2 – 10 GtCO
2
per year. Some climate stabilization sce-
narios see considerable higher deployment towards the end of the
century, even in some 580 – 650 ppm scenarios, operating under
different time scales, socioeconomic assumptions, technology
portfolios, CO
2
prices, and interpreting BECCS as part of an overall
mitigation framework. Technological challenges and potential
risks of BECCS include those associated with the provision of the
biomass feedstock as well as with the capture, transport and long-
term underground storage of CO
2
. BECCS faces large challenges in
financing and currently no such plants have been built and tested
at scale (Sections 7.5.5, 7.9, 11.13.3).
Land demand and livelihoods are often affected by bioenergy
deployment. Land demand for bioenergy depends on (1) the share
of bioenergy derived from wastes and residues; (2) the extent to
which bioenergy production can be integrated with food and fibre
production, and conservation to minimize land-use competition;
(3) the extent to which bioenergy can be grown on areas with
little current production; and (4) the quantity of dedicated energy
crops and their yields. Considerations of tradeoffs with water,
land, and biodiversity are crucial to avoid adverse effects. The total
impact on livelihood and distributional consequences depends on
global market factors, impacting income and income-related food-
security, and site-specific factors such as land tenure and social
dimensions. The often site-specific effects of bioenergy deploy-
ment on livelihoods have not yet been comprehensively evaluated
(Section 11.13.7).
Additionality: Another consideration for gauging the effectiveness of
mitigation is determining whether the activity would have occurred
anyway, with this encompassed in the concept of ‘additionality’ (see
Glossary).
Impacts of climate change: An area of emerging activity is predicting
the likely impacts of climate change on mitigation potential, both in
terms of impacts on existing carbon stocks, but also on the rates of
carbon sequestration. This is discussed further in Section 11.5.
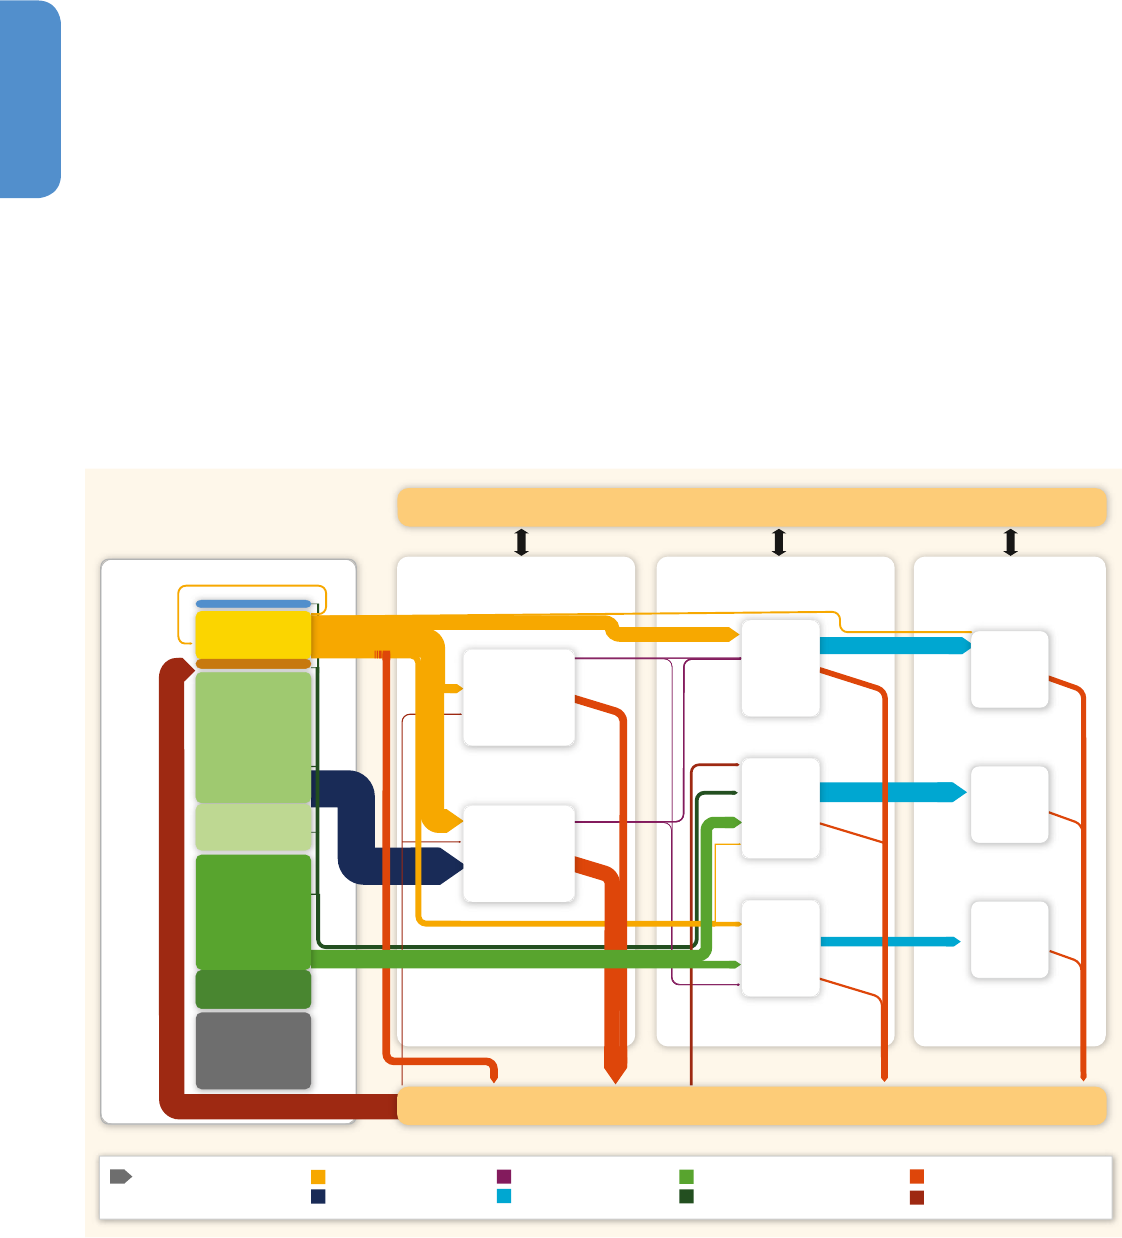
836836
Agriculture, Forestry and Other Land Use (AFOLU)
11
Chapter 11
11.4 Infrastructure and
systemic perspectives
Only supply-side mitigation options are considered in Section 11.3.
In this section, we consider infrastructure and systemic perspec-
tives, which include potential demand-side mitigation options in the
AFOLU sector. Since infrastructure is a minor issue in AFOLU com-
pared to energy end-use sectors, this section focusses on systemic
perspectives.
11�4�1 Land: a complex, integrated system
Mitigation in the AFOLU sector is embedded in the complex interactions
between socioeconomic and natural factors simultaneously affecting
land systems (Turner etal., 2007). Land is used for a variety of purposes,
including housing and infrastructure (Chapter 12), production of goods
and services through agriculture, aquaculture and forestry, and absorp-
tion or deposition of wastes and emissions (Dunlap and Catton, Jr., 2002).
Agriculture and forestry are important for rural livelihoods and employ-
ment (Coelho etal., 2012), while aquaculture and fisheries can be region-
ally important (FAO, 2012). More than half of the planet’s total land area
Figure 11�9 | Global land use and biomass flows arising from human economic activity in 2000 from the cradle to the grave. Values in Gt dry matter biomass / yr. Figure source:
(Smith etal., 2013b). If a source reported biomass flows in energy units, the numbers were converted to dry matter assuming a gross energy value of 18.5MJ / kg. The difference
between inputs and outputs in the consumption compartment is assumed to be released to the atmosphere (respiration, combustion); small differences may result from rounding.
Note that data sources a) area: (Erb etal., 2007; Schneider etal., 2009; FAO, 2010) ; b) biomass flows: (Wirsenius, 2003; Sims etal., 2006; Krausmann etal., 2008; FAOSTAT, 2012;
Kummu etal., 2012) are incomplete; more research is needed to close data gaps between different statistical sources such as agricultural, forestry, and energy statistics (Section
11.11). ‘Unused forests’ are pristine forests not harvested or otherwise used.
Unused
Forests
LAND
WASTE/RESIDUES
LIVESTOCK SYSTEM
TRADE
CONSUMPTIONPROCESSING
Urban
Cropland
Grazing
Land
Unused
- Natural
- Regenerating
Crops and Residues
Grazing and Hay
Forestry Products
Fuelwood from Non-Forests
Animal Raw Products
Final Products
Waste Flows and Residues
Recycling
6.36
1.78
0.16
13 Mkm²
2 Mkm²
2 Mkm
2
34 Mkm²
12 Mkm²
30 Mkm²
11 Mkm²
26 Mkm²
1.28
0.26
2.04
0.99
0.37
3.87
1.94
0.43
0.75
0.14
1.19
0.43
0.28
0.14
0.47
0.12
0.14
0.18
0.5
?
?
0.23
0.61
0.26
0.22
1.52
0.61
2.35
2.18
0.79
Food
Intake
Energy
Materials
Vegetable
Animal
Forestry
Monogastrics
Pigs
Poultry
Ruminants
Cattle, Sheep,
Goats, etc.
Food
Bioenergy
Other
Industries
and Manu-
facturing
0.67
Values in
Gt Dry Matter Biomass/yr
Extensive
Grazing
Cropland Fallows

837837
Agriculture, Forestry and Other Land Use (AFOLU)
11
Chapter 11
(134 Mkm
2
) is used for urban and infrastructure land, agriculture, and for-
estry. Less than one quarter shows relatively minor signs of direct human
use (Erb etal., 2007; Ellis etal., 2010; Figure 11.9). Some of the latter
areas are inhabited by indigenous populations, which depend on the land
for the supply of vitally important resources (Read etal., 2010).
Land-use change is a pervasive driver of global environmental change
(Foley etal., 2005, 2011) . From 1950 to 2005, farmland (cropland plus
pasture) increased from 28 to 38 % of the global land area excluding
ice sheets and inland waters (Hurtt etal., 2011). The growth of farmland
area (+33 %) was lower than that of population, food production, and
gross domestic product (GDP) due to increases in yields and biomass
conversion efficiency (Krausmann etal., 2012). In the year 2000, almost
one quarter of the global terrestrial net primary production (one third
of the above-ground part) was ‘appropriated’ by humans. This means
that it was either lost because the net primary productivity (the bio-
mass production of green plants, net primary production, NPP) of agro-
ecosystems or urban areas was lower than that of the vegetation they
replaced or it was harvested for human purposes, destroyed during har-
vest or burned in human-induced fires (Imhoff etal., 2004; Haberl etal.,
2007). The fraction of terrestrial NPP appropriated by humans doubled
in the last century (Krausmann etal., 2013), exemplifying the increasing
human domination of terrestrial ecosystems (Ellis etal., 2010). Growth
trajectories of the use of food, energy, and other land-based resources,
as well as patterns of urbanization and infrastructure development are
influenced by increasing population and GDP, as well as the on-going
agrarian-industrial transition (Haberl etal., 2011b; Kastner etal., 2012).
Growing resource use and land demand for biodiversity conservation
and carbon sequestration (Soares-Filho etal., 2010), result in increas-
ing competition for land (Harvey and Pilgrim, 2011; Section 11.4.2).
Influencing ongoing transitions in resource use is a major challenge
(WBGU, 2011; Fischer-Kowalski, 2011). Changes in cities, e. g., in terms
of infrastructure, governance, and demand, can play a major role in
this respect (Seto etal., 2012b; Seitzinger etal., 2012; Chapter 12).
Many mitigation activities in the AFOLU sector affect land use or land
cover and, therefore, have socioeconomic as well as ecological con-
sequences, e. g., on food security, livelihoods, ecosystem services or
emissions (Sections 11.1; 11.4.5; 11.7). Feedbacks involved in imple-
menting mitigation in AFOLU may influence different, sometimes
conflicting, social, institutional, economic, and environmental goals
(Madlener etal., 2006). Climate change mitigation in the AFOLU sector
faces a complex set of interrelated challenges (Sections 11.4.5; 11.7):
• Full GHG impacts, including those from feedbacks (e. g., iLUC) or
leakage, are often difficult to determine (Searchinger etal., 2008).
• Feedbacks between GHG reduction and other important objectives
such as provision of livelihoods and sufficient food or the mainte-
nance of ecosystem services and biodiversity are not completely
understood.
• Maximizing synergies and minimizing negative effects involves
multi-dimensional optimization problems involving various social,
economic, and ecological criteria or conflicts of interest between
different social groups (Martinez-Alier, 2002).
• Changes in land use and ecosystems are scale-dependent and may
proceed at different speeds, or perhaps even move in different
directions, at different scales.
11�4�2 Mitigation in AFOLU — feedbacks with
land-use competition
Driven by economic and population growth, increased demand for food
and bioenergy as well as land demand for conservation and urbanization
(e. g., above-ground biomass carbon losses associated with land-clearing
from new urban areas in the pan-tropics are estimated to be 5 % of the
tropical deforestation and land-use change emissions, (Seto etal., 2012a;
Section 12.2), competition for land is expected to intensify (Smith etal.,
2010; Woods etal., 2010). Maximization of one output or service (e. g.,
crops) often excludes, or at least negatively affects, others (e. g., conser-
vation; (Phalan etal., 2011). Mitigation in the AFOLU sector may affect
land-use competition. Reduced demand for AFOLU products generally
decreases inputs (fertilizer, energy, machinery) and land demand. The
ecological feedbacks of demand-side options are mostly beneficial since
they reduce competition for land and water (Smith etal., 2013b).
Some supply-side options, though not all, may intensify competition
for land and other resources. Based on Figure 11.9 one may distinguish
three cases:
• Optimization of biomass-flow cascades; that is, increased use
of residues and by-products, recycling of biogenic materials and
energetic use of wastes (WBGU, 2009). Such options increase
resource use efficiency and may reduce competition, but there may
also be tradeoffs. For example, using crop residues for bioenergy
or roughage supply may leave less C and nutrients on cropland,
reduce soil quality and C storage in soils, and increase the risk of
losses of carbon through soil erosion. Residues are also often used
as forage, particularly in the tropics. Forest residues are currently
also used for other purposes, e. g., chipboard manufacture, pulp
and paper production (González-Estrada etal., 2008; Blanco-Can-
qui and Lal, 2009; Muller, 2009; Ceschia etal., 2010).
• Increases in yields of cropland (Burney etal., 2010; Foley etal.,
2011; Tilman etal., 2011; Mueller etal., 2012; Lobell etal., 2013),
grazing land or forestry and improved livestock feeding efficiency
(Steinfeld et al., 2010; Thornton and Herrero, 2010) can reduce
land competition if yield increases relative to any additional inputs
and the emission intensity (i. e., GHG emissions per unit of prod-
uct) decreases. This may result in tradeoffs with other ecological,
social, and economic costs (IAASTD, 2009) although these can to
some extent be mitigated if intensification is sustainable (Tilman
etal., 2011). Another caveat is that increases in yields may result in
rebound effects that increase consumption (Lambin and Meyfroidt,
2011; Erb, 2012) or provide incentives to farm more land (Matson

838838
Agriculture, Forestry and Other Land Use (AFOLU)
11
Chapter 11
and Vitousek, 2006), and hence may fail to spare land (Section
11.10).
• Land-demanding options reduce GHG emissions by harness-
ing the potential of the land for either C sequestration or growing
energy crops (including food crops used as feedstocks for bioenergy
production). These options result in competition for land (and some-
times other resources such as water) that may have substantial
social, economic, and ecological effects (positive or negative; (UNEP,
2009; WBGU, 2009; Chum etal., 2011; Coelho etal., 2012). Such
options may increase pressures on ecosystems (e. g., forests) and
GHG emissions related to direct and indirect LUC, contribute to price
increases of agricultural products, or negatively affect livelihoods
of rural populations. These possible impacts need to be balanced
against possible positive effects such as GHG reduction, improved
water quality (Townsend etal., 2012), restoration of degraded land
(Harper etal., 2007), biodiversity protection (Swingland etal., 2002),
and job creation (Chum etal., 2011; Coelho etal., 2012).
Therefore, an integrated energy / agriculture / land-use approach for mit-
igation in AFOLU can help to optimize synergies and mitigate negative
effects (Popp etal., 2011; Smith, 2012; Creutzig etal., 2012a; Smith
etal., 2013b).
11�4�3 Demand-side options for reducing GHG
emissions from AFOLU
Some changes in demand for food and fibre can reduce GHG emissions
in the production chain (Table 11.3) through (i) a switch to the con-
sumption of products with higher GHG emissions in the process chain to
products with lower GHG emissions and (ii) by making land available for
other GHG reduction activities e. g., afforestation or bioenergy (Section
11.4.4). Food demand change is a sensitive issue due to the prevalence
of hunger, malnutrition, and the lack of food security in many regions
(Godfray etal., 2010). Sufficient production of, and equitable access to,
food are both critical for food security (Misselhorn etal., 2012). GHG
emissions may be reduced through changes in food demand without
jeopardizing health and well-being by (1) reducing losses and wastes of
food in the supply chain as well as during final consumption; (2) chang-
ing diets towards less GHG-intensive food, e. g., substitution of animal
products with plant-based food, while quantitatively and qualitatively
maintaining adequate protein content, in regions with high animal
product consumption; and (3) reduction of overconsumption in regions
where this is prevalent. Substituting plant-based diets for animal-based
diets is complex since, in many circumstances, livestock can be fed on
plants not suitable for human consumption or growing on land with
high soil carbon stocks not suitable for cropping; hence, food produc-
tion by grazing animals contributes to food security in many regions of
the world (Wirsenius, 2003; Gill etal., 2010).
Reductions of losses in the food supply chain — Globally, rough esti-
mates suggest that ~30 – 40 % of all food produced is lost in the sup-
ply chain from harvest to consumption (Godfray etal., 2010). Energy
embodied in wasted food is estimated at ~36 EJ / yr (FAO, 2011). In
developing countries, up to 40 % is lost on farm or during distribution
due to poor storage, distribution, and conservation technologies and
procedures. In developed countries, losses on farm or during distribu-
tion are smaller, but the same amount is lost or wasted in service sec-
tors and at the consumer level (Foley etal., 2005; Parfitt etal., 2010;
Godfray etal., 2010; Gustavsson etal., 2011; Hodges etal., 2011). How-
ever, uncertainties related to losses in the food supply chain are large
and more research is needed.
Not all losses are (potentially) avoidable because losses in households
also include parts of products normally not deemed edible (e. g., peels of
some fruits and vegetables). According to Parfitt etal. (2010), in the UK,
18 % of the food waste is unavoidable, 18 % is potentially avoidable,
and 64 % is avoidable. Data for Austria, Netherlands, Turkey, the United
Kingdom, and the United States, derived with a variety of methods,
show that food wastes at the household level in industrialized countries
are 150 – 300 kg per household per year (Parfitt etal., 2010). According
to a top-down mass-flow modelling study based on FAO commodity
balances completely covering the food supply chain, but excluding non-
edible fractions, food loss values range from 120 – 170 kg / cap / yr in Sub-
Saharan Africa to 280 – 300 kg / cap / yr in Europe and North America.
Table 11�3 | Overview of demand-side mitigation options in the AFOLU sector.
Measure Description References
Reduced losses in the
food supply chain
Reduced losses in the food supply chain and in final consumption reduces energy use and GHG
emissions from agriculture, transport, storage and distribution, and reduce land demand.
(Godfray etal., 2010; Gustavsson
etal., 2011), see text.
Changes in human diets
towards less emission-
intensive products
Where appropriate, reduced consumption of food items with high GHG emissions per unit
of product, to those with low GHG products can reduce GHG emissions. Such demand
changes can reduce energy inputs in the supply chain and reduces land demand.
(Stehfest etal., 2009;
FAO, 2011), see text
Demand-side options related
to wood and forestry
Wood harvest in forests releases GHG and at least temporarily reduces forest C stocks. Conservation of wood (products)
through more efficient use or replacement with recycled materials and replacing wood from illegal logging or destructive
harvest with wood from certified sustainable forestry (Section 11.10) can save GHG emissions. Substitution of wood
for non-renewable resources can reduce GHG emissions, e. g., when wood is substituted for emission-intensive
materials such as aluminium, steel, or concrete in buildings. Integrated optimization of C stocks in forests and in
long-lived products, as well as the use of by-products and wastes for energy, can deliver the highest GHG benefits.
(Gustavsson etal., 2006;
Werner etal., 2010;
Ingerson, 2011), see text.
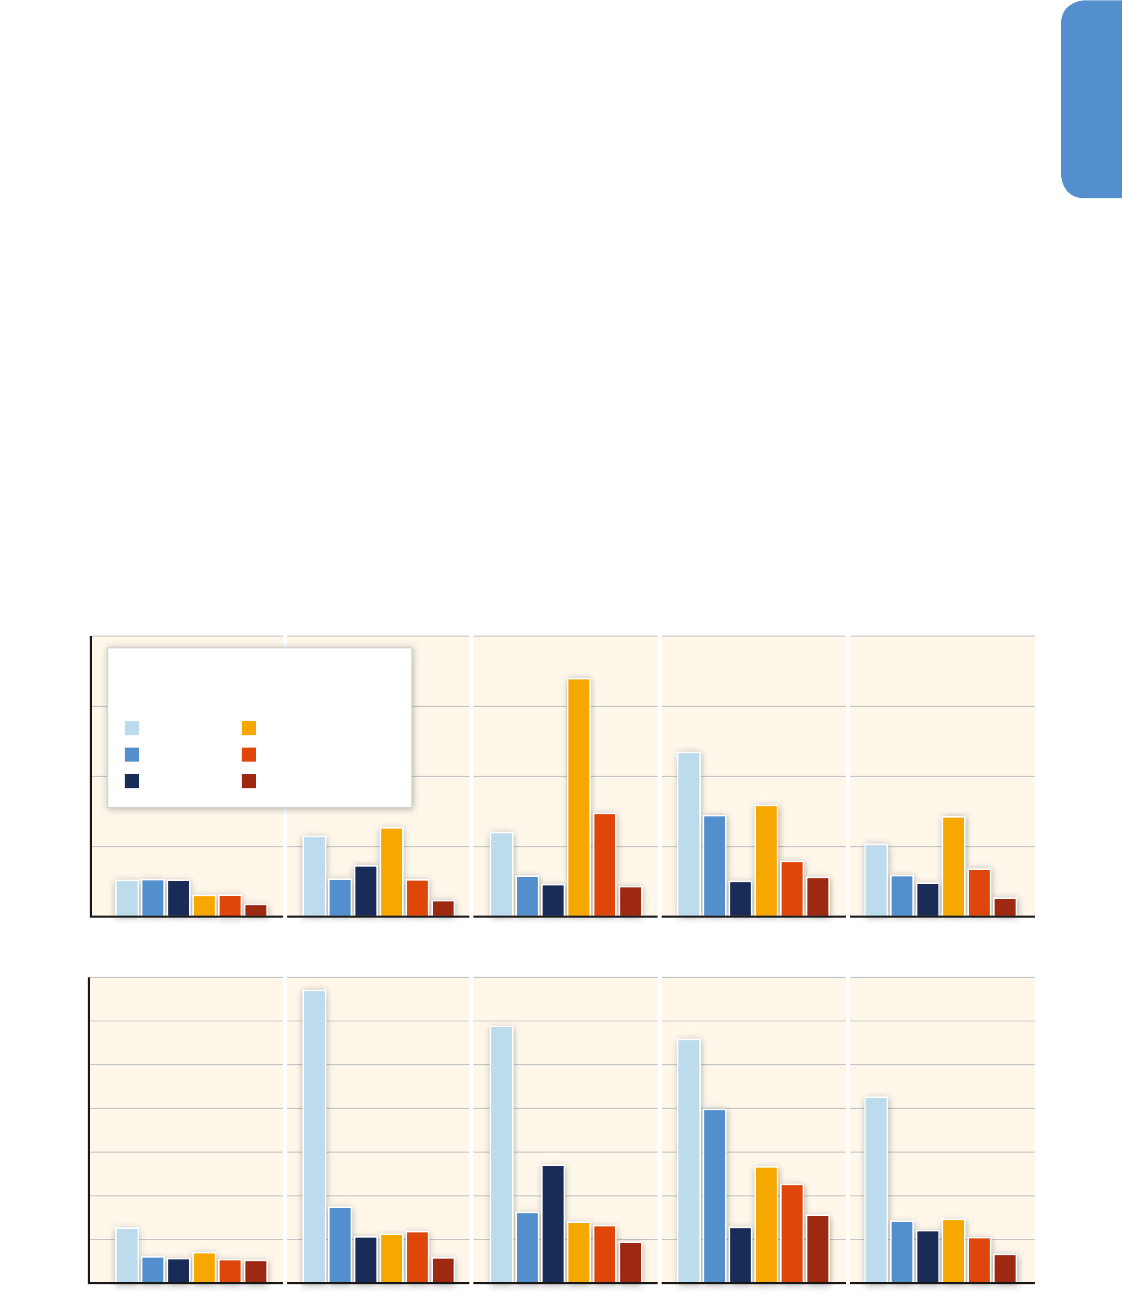
839839
Agriculture, Forestry and Other Land Use (AFOLU)
11
Chapter 11
Losses ranging from 20 % in Sub-Saharan Africa to more than 30 % in
the industrialized countries were calculated (Gustavsson etal., 2011).
A range of options exist to reduce wastes and losses in the supply
chain: investments into harvesting, processing and storage technolo-
gies in the developing countries, awareness raising, taxation and other
incentives to reduce retail and consumer-related losses primarily in the
developed countries. Different options can help to reduce losses (i. e.,
increase efficiency) in the supply chain and at the household level. Sub-
stantial GHG savings could be realized by saving one quarter of the
wasted food according to (Gustavsson etal., 2011); see Table 11.4.
Changes in human diets — Land use and GHG effects of changing diets
require widespread behavioural changes to be effective; i. e., a strong
deviation from current trajectories (increasing demand for food, in par-
ticular for animal products). Cultural, socioeconomic and behavioural
aspects of implementation are discussed in Sections 11.4.5 and 11.7.
Studies based on Lifecycle Assessment (LCA) methods show substan-
tially lower GHG emissions for most plant-based food than for ani-
mal products (Carlsson-Kanyama and González, 2009; Pathak et al.,
2010; Bellarby etal., 2012; Berners-Lee etal., 2012), although there
are exceptions, e. g., vegetables grown in heated greenhouses or
transported by airfreight (Carlsson-Kanyama and González, 2009).
A comparison of three meals served in Sweden with similar energy
and protein content based on (1) soy, wheat, carrots, and apples, (2)
pork, potatoes, green beans, and oranges, and (3) beef, rice, cooked
frozen vegetables, and tropical fruits revealed GHG emissions of 0.42
kgCO
2
eq for the first option, 1.3 kgCO
2
eq for the second, and 4.7
kgCO
2
eq for the third, i. e., a factor of >10 difference (Carlsson-Kan-
yama and González, 2009). Most LCA studies quoted here use attribu-
tional LCA; differences to results from consequential LCA (see Annex
II) are generally not large enough to reverse the picture (Thomassen
etal., 2008). The GHG benefits of plant-based food over animal prod-
ucts hold when compared per unit of protein (González etal., 2011).
In addition to plant-based foods having lower emissions than animal-
based ones, GHG emissions of livestock products also vary consider-
ably; emissions per unit of protein are highest for beef and lower for
pork, chicken meat, eggs and dairy products (de Vries and de Boer,
2010) due to their feed and land-use intensities. Figure 11.10 presents
a comparison between milk and beef for different production systems
and regions of the world (Herrero etal., 2013). Beef production can use
up to five times more biomass for producing 1 kg of animal protein
than dairy. Emissions intensities for the same livestock product also
Figure 11�10 | Biomass use efficiencies for the production of edible protein from (top) beef and (bottom) milk for different production systems and regions of the world (Herrero
etal., 2013).
0
500
1000
1500
2000
0
50
100
150
200
250
300
350
Biomass Use Efficiencies for Beef
[kg Feed / kg Protein]
Biomass Use Efficiencies for Milk
[kg Feed per kg Protein]
North America, Europe WorldAfricaAsiaLatin America
Livestock Systems
Temperate
Humid
Arid
Temperate
Humid
Arid
Grazing
Mixed Crop-Livestock

840840
Agriculture, Forestry and Other Land Use (AFOLU)
11
Chapter 11
vary largely between different regions of the world due to differences
in agro-ecology, diet quality, and intensity of production (Herrero etal.,
2013). In overall terms, Europe and North America have lower emis-
sions intensities per kg of protein than Africa, Asia, and Latin America.
This shows that the highest potential for improving emissions inten-
sities lies in developing countries, if intensification strategies can be
matched to local resources and contexts.
Studies based on integrated modelling show that changes in diets
strongly affect future GHG emissions from food production (Stehfest
etal., 2009; Popp etal., 2010; Davidson, 2012). Popp etal. (2010) esti-
mated that agricultural non-CO
2
emissions (CH
4
and N
2
O) would triple
by 2055 to 15.3 GtCO
2
eq / yr if current dietary trends and population
growth were to continue. Technical mitigation options on the sup-
ply side, such as improved cropland or livestock management, alone
could reduce that value to 9.8 GtCO
2
eq / yr, whereas emissions were
reduced to 4.3 GtCO
2
eq / yr in a ‘decreased livestock product’ scenario
and to 2.5 GtCO
2
eq / yr if both technical mitigation and dietary change
were assumed. Hence, the potential to reduce GHG emissions through
changes in consumption was found to be substantially higher than
that of technical mitigation measures. Stehfest et al., (2009) evalu-
ated effects of dietary changes on CO
2
(including C sources / sinks of
ecosystems), CH
4
, and N
2
O emissions. In a ‘business-as-usual’ scenario
largely based on FAO (2006), total GHG emissions were projected to
reach 11.9 GtCO
2
eq / yr in 2050. The following changes were evaluated:
no ruminant meat, no meat, and a diet without any animal products.
Changed diets resulted in GHG emission savings of 34 – 64 % compared
to the ‘business-as-usual’ scenario; a switch to a ‘healthy diet’ recom-
mended by the Harvard Medical School would save 4.3 GtCO
2
eq / yr
(– 36 %). Adoption of the ‘healthy diet’ (which includes a meat, fish and
egg consumption of 90 g / cap / day) would reduce global GHG abatement
costs to reach a 450 ppm CO
2
eq concentration target by ~50 % com-
pared to the reference case (Stehfest etal., 2009). The analysis assumed
nutritionally sufficient diets; reduced supply of animal protein was com-
pensated by plant products (soy, pulses, etc.). Considerable cultural and
social barriers against a widespread adoption of dietary changes to low-
GHG food may be expected (Davidson, 2012; Smith etal., 2013, 11.4.5).
A limitation of food-related LCA studies is that they have so far sel-
dom considered the emissions resulting from LUC induced by chang-
ing patterns of food production (Bellarby etal., 2012) . A recent study
(Schmidinger and Stehfest, 2012) found that cropland and pastures
required for the production of beef, lamb, calf, pork, chicken, and
milk could annually sequester an amount of carbon equivalent to
30 – 470 % of the GHG emissions usually considered in LCA of food
products if the land were to be reforested. Land-related GHG costs dif-
fer greatly between products and depend on the time horizon (30 – 100
yr) assumed (Schmidinger and Stehfest, 2012). If cattle production
contributes to tropical deforestation (Zaks et al., 2009; Bustamante
etal., 2012; Houghton etal., 2012), land-use related GHG emissions
are particularly high (Cederberg etal., 2011). These findings underline
the importance of diets for GHG emissions in the food supply chain
(Garnett, 2011; Bellarby etal., 2012). A potential co-benefit is a reduc-
tion in diet-related health risks in regions where overconsumption of
animal products is prevalent (McMichael etal., 2007).
Demand-side options related to wood and forestry — A comprehen-
sive global, long-term dataset on carbon stocks in long-lived wood
Table 11�4 | Changes in global land use and related GHG reduction potentials in 2050 assuming the implementation of options to increase C sequestration on farmland, and use
of spared land for either biomass production for energy or afforestation. Afforestation and biomass for bioenergy are both assumed to be implemented only on spare land and are
mutually exclusive (Smith etal., 2013b).
Cases Food crop area
Livestock
grazing area
C sink on
farmland
1
Afforestation of
spare land
2,3
Biomass for
bioenergy on
spare land
2,4
Total mitigation
potential
Difference in
mitigation from
reference case
[Gha] GtCO
2
eq / yr
Reference 1.60 4.07 3.5 6.1 1.2 – 9.4 4.6 – 12.9 0
Diet change 1.38 3.87 3.2 11.0 2.1 – 17.0 5.3 – 20.2 0.7 – 7.3
Yield growth 1.49 4.06 3.4 7.3 1.4 – 11.4 4.8 – 14.8 0.2 – 1.9
Feeding efficiency 1.53 4.04 3.4 7.2 1.4 – 11.1 4.8 – 14.5 0.2 – 1.6
Waste reduction 1.50 3.82 3.3 10.1 1.9 – 15.6 5.2 – 18.9 0.6 – 6.0
Combined 1.21 3.58 2.9 16.5 3.2 – 25.6 6.1 – 28.5 1.5 – 15.6
Notes:
1
Potential for C sequestration on cropland for food production and livestock grazing land with improved soil C management. The potential C sequestration rate was derived
from Smith etal., (2008).
2
Spare land is cropland or grazing land not required for food production, assuming increased but still sustainable stocking densities of livestock based on Haberl etal., (2011);
Erb etal., (2012).
3
Assuming 11.8 (tCO
2
eq / ha) / yr (Smith etal., 2000).
4
Assumptions were as follows. High bioenergy value: short-rotation coppice or energy grass directly replaces fossil fuels, energy return on investment 1:30, dry-matter biomass
yield 190 GJ / ha / yr
(WBGU, 2009). Low bioenergy value: ethanol from maize replaces gasoline and reduces GHG by 45 %, energy yield 75 GJ / ha / yr (Chum etal., 2011).
Some energy crops may, under certain conditions, sequester C in addition to delivering bioenergy; the effect is context-specific and was not included. Whether bioenergy or
afforestation is a better option to use spare land for mitigation needs to be decided on a case-by-case basis.

841841
Agriculture, Forestry and Other Land Use (AFOLU)
11
Chapter 11
products in use (excluding landfills) shows an increase from approxi-
mately 2.2 GtC in 1900 to 6.9 GtC in 2008 (Lauk etal., 2012). Per
capita, carbon stored in wood products amounted to ~1.4 tC / cap in
1900 and ~1.0 tC / cap in 2008. The net yearly accumulation of long-
lived wood products in use varied between 35 and 91 MtC / yr in the
period 1960 – 2008 (Lauk etal., 2012). The yearly accumulation of C in
products and landfills was ~200 MtC / yr in the period 1990 – 2008 (Pan
etal., 2011). If more long-lived wood products were used, C sequestra-
tion and mitigation could be enhanced.
Increased wood use does not reduce GHG emissions under all circum-
stances because wood harvest reduces the amount of carbon stored in
the forest, at least temporarily, and increases in wood harvest levels
may result in reduced long-term carbon storage in forests (Ingerson,
2011; Böttcher etal., 2012; Holtsmark, 2012; Lamers and Junginger,
2013). Reducing wood consumption, e. g., through paper recycling, can
reduce GHG emissions (Acuff and Kaffine, 2013), as may the use of
wood from sustainable forestry in place of emission-intensive materi-
als such as concrete, steel, or aluminium. Recent studies suggest that,
where technically possible, substitution of wood from sustainably
managed forests for non-wood materials in the construction sector
(concrete, steel, etc.) in single-family homes, apartment houses, and
industrial buildings, reduces GHG emissions in most cases (Werner
etal., 2010; Sathre and O’Connor, 2010; Ximenes and Grant, 2013).
Most of the emission reduction results from reduced production emis-
sions, whereas the role of carbon sequestration in products is relatively
small (Sathre and O’Connor, 2010). Werner etal. (2010) show that GHG
benefits are highest when wood is primarily used for long-lived prod-
ucts, the lifetime of products is maximized, and energy use of woody
biomass is focused on by-products, wood wastes, and end-of-lifecycle
use of long-lived wood products.
11�4�4 Feedbacks of changes in land demand
Mitigation options in the AFOLU sector, including options such as bio-
mass production for energy, are highly interdependent due to their
direct and indirect impacts on land demand. Indirect interrelation-
ships, mediated via area demand for food production, which in turn
affects the area available for other purposes, are difficult to quan-
tify and require systemic approaches. Table 11.4 (Smith etal., 2013b)
shows the magnitude of possible feedbacks in the land system in
2050. It first reports the effect of single mitigation options compared
to a reference case, and then the combined effect of all options. The
reference case is similar to the (FAO, 2006a) projections for 2050 and
assumes a continuation of on-going trends towards richer diets, con-
siderably higher cropland yields (+54 %) and moderately increased
cropland areas (+9 %). The diet change case assumes a global con-
tract-and-converge scenario towards a nutritionally sufficient low
animal product diet (8 % of food calories from animal products). The
yield growth case assumes that yields in 2050 are 9 % higher than
those in the reference case, according to the ‘Global Orchestration’
scenario in (MEA, 2005). The feeding efficiency case assumes on aver-
age 17 % higher livestock feeding efficiencies than the reference case.
The waste reduction case assumes a reduction of the losses in the
food supply chain by 25 % (Section 11.4.3). The combination of all
options results in a substantial reduction of cropland and grazing
areas (Smith etal., 2013b), even though the individual options cannot
simply be added up due to the interactions between the individual
compartments.
Table 11.4 shows that demand-side options save GHG by freeing up
land for bioenergy or afforestation and related carbon sequestration.
The effect is strong and non-linear, and more than cancels out reduced
C sequestration potentials on farmland. Demand-side potentials are
substantial compared to supply-side mitigation potentials (Section
11.3), but implementation may be difficult (Sections 11.7; 11.8). Esti-
mates of GHG savings from bioenergy are subject to large uncertain-
ties related to the assumptions regarding power plants, utilization
pathway, energy crop yields, and effectiveness of sustainability criteria
(Sections 11.4.5; 11.7; 11.13).
The systemic effects of land-demanding mitigation options such as
bioenergy or afforestation depend not only on their own area demand,
but also on land demand for food and fibre supply (Chum etal., 2011;
Coelho etal., 2012; Erb etal., 2012b). In 2007, energy crops for trans-
port fuels covered about 26.6 Mha or 1.7 % of global cropland (UNEP,
2009). Assumptions on energy crop yields (Section 11.13) are the main
reason for the large differences in estimates of future area demand
of energy crops in the next decades, which vary from <100 Mha to
>1000 Mha, i. e., 7 – 70 % of current cropland (Sims etal., 2006; Smeets
etal., 2007; Pacca and Moreira, 2011; Coelho etal., 2012). Increased
pressure on land systems may also emerge when afforestation claims
land, or forest conservation restricts farmland expansion (Murtaugh
and Schlax, 2009; Popp etal., 2011).
Land-demanding mitigation options may result in feedbacks such as
GHG emissions from land expansion or agricultural intensification,
higher yields of food crops, higher prices of agricultural products,
reduced food consumption, displacement of food production to other
regions and consequent land clearing, as well as impacts on biodiver-
sity and non-provisioning ecosystem services (Plevin etal., 2010; Popp
etal., 2012).
Restrictions to agricultural expansion due to forest conservation,
increased energy crop area, afforestation and reforestation may
increase costs of agricultural production and food prices. In a model-
ling study, conserving C-rich natural vegetation such as tropical forests
was found to increase food prices by a factor of 1.75 until 2100, due
to restrictions of cropland expansion, even if no growth of energy crop
area was assumed (Wise etal., 2009). Food price indices (weighted
average of crop and livestock products) are estimated to increase until
2100 by 82 % in Africa, 73 % in Latin America, and 52 % in Pacific Asia
if large-scale bioenergy deployment is combined with strict forest con-
servation, compared to a reference scenario without forest conserva-
tion and bioenergy (Popp etal., 2011). Further trade liberalization can

842842
Agriculture, Forestry and Other Land Use (AFOLU)
11
Chapter 11
lead to lower costs of food, but also increases the pressure on land,
especially on tropical forests (Schmitz etal., 2011).
Increased land demand for GHG mitigation can be partially compen-
sated by higher agricultural yield per unit area (Popp et al., 2011).
While yield increases can lead to improvements in output from less
land, generate better economic returns for farmers, help to reduce
competition for land, and alleviate environmental pressures (Burney
etal., 2010; Smith et al., 2010), agricultural intensification if poorly
implemented incurs economic costs (Lotze-Campen etal., 2010) and
may also create social and environmental problems such as nutrient
leaching, soil degradation, pesticide pollution, impact on animal wel-
fare, and many more (IAASTD, 2009). Maintaining yield growth while
reducing negative environmental and social effects of agricultural
intensification is, therefore, a central challenge, requiring sustainable
management of natural resources as well as the increase of resource
efficiency (DeFries and Rosenzweig, 2010), two components of sustain-
able intensification (Garnett etal., 2013).
Additional land demand may put pressures on biodiversity, as LUC
is one of the most important drivers of biodiversity loss (Sala etal.,
2000). Improperly managed large-scale agriculture (or bioenergy) may
negatively affect biodiversity (Groom etal., 2008), which is a key pre-
requisite for the resilience of ecosystems, i. e., their ability to adapt to
changes such as climate change, and to continue to deliver ecosystem
services in the future (Díaz etal., 2006; Landis etal., 2008). However,
implementing appropriate management, such as establishing bioen-
ergy crops or plantations for carbon sequestration in already degraded
ecosystems areas represents an opportunity where bioenergy can be
used to achieve positive environmental outcomes (e. g., Hill etal., 2006;
Semere and Slater, 2007; Campbell et al., 2008; Nijsen etal., 2012).
Because climate change is also an important driver of biodiversity loss
(Sala etal., 2000), bioenergy for climate change mitigation may also be
beneficial for biodiversity if it is planned with biodiversity conservation
in mind (Heller and Zavaleta, 2009; Dawson etal., 2011; Section 11.13).
Tradeoffs related to land demand may be reduced through multifunc-
tional land use, i. e., the optimization of land to generate more than
one product or service such as food, animal feed, energy or materials,
soil protection, wastewater treatment, recreation, or nature protection
(de Groot, 2006; DeFries and Rosenzweig, 2010; Section 11.7). This
also applies to the potential use of ponds and other small water bodies
for raising fish fed with agricultural waste (Pullin etal., 2007).
11�4�5 Sustainable development and behaviou-
ral aspects
The assessment of impacts of AFOLU mitigation options on sustainable
development requires an understanding of a complex multilevel system
where social actors make land-use decisions aimed at various develop-
ment goals, one of them being climate change mitigation. Depending
on the specific objectives, the beneficiaries of a particular land-use
choice may differ. Thus tradeoffs between global, national, and local
concerns and various stakeholders need to be considered (see also Sec-
tion 4.3.7 and WGII Chapter 20). The development context provides
opportunities or barriers for AFOLU (May etal., 2005; Madlener etal.,
2006; Smith and Trines, 2006; Smith etal., 2007; Angelsen, 2008; How-
den etal., 2008; Corbera and Brown, 2008; Cotula etal., 2009; Catta-
neo etal., 2010; Junginger etal., 2011; Section 11.8 and Figure 11.11).
Further, AFOLU measures have additional effects on development,
beyond improving the GHG balance (Foley et al., 2005; Alig et al.,
2010; Calfapietra etal., 2010; Busch etal., 2011; Smith etal., 2013b;
Branca etal., 2013; Albers and Robinson, 2013). These effects can be
positive (co-benefits) or negative (adverse side-effects) and do not
necessarily overlap geographically, socially or in time (Section 11.7
and Figure 11.11). This creates the possibility of tradeoffs, because an
AFOLU measure can bring co-benefits to one social group in one area
(e. g., increasing income), while bringing adverse side-effects to others
somewhere else (e. g., reducing food availability).
Table 11.5 summarizes the issues commonly considered when assess-
ing the above-mentioned interactions at various levels between sus-
tainable development and AFOLU.
Social complexity: Social actors in the AFOLU sector include indi-
viduals (farmers, forest users), social groups (communities, indigenous
groups), private companies (e. g., concessionaires, food-producer multi-
nationals), subnational authorities, and national states (see Table 11.6).
Figure 11�11 | Dynamic interactions between the development context and AFOLU.
AFOLU
Measures
Institutional
Arrangements
Social and
Human Assets
Natural Assets
State of and Access to
Infrastructure and Technology
Economic Assets
Development
Context
Effects of AFOLU measures
on sustainable development
(Section 11.7 Co-benefits,
risks and spillovers)
Enabling conditions to AFOLU
measures as provided by the
development context (Section
11.8 Barriers and opportunities)

843843
Agriculture, Forestry and Other Land Use (AFOLU)
11
Chapter 11
Table 11�5 | Issues related to AFOLU measures and sustainable development.
Dimensions Issues
Social and human assets Population growth and migration, level of education, human capacity, individual skills, indigenous and traditional
knowledge, cultural values, equity and health, animal welfare, organizational capacity
Natural assets Availability of natural resources (land, forest, water, agricultural land, minerals, fauna), GHG balance, ecosystem integrity,
biodiversity conservation, ecosystem services, the productive capacity of ecosystems, ecosystem health and resilience
State of infrastructure
and technology
Availability of infrastructure and technology and industrial capacity, technology development, appropriateness, acceptance
Economic factors Credit capacity, employment creation, income, wealth distribution / distribution mechanisms, carbon finance, available capital / investments, market access
Institutional arrangements Land tenure and land-use rights, participation and decision making mechanisms (e. g., through Free, Prior and Informed Consent), sectoral and cross-
sectoral policies, investment in research, trade agreements and incentives, benefit sharing mechanisms, existence and forms of social organization
Based on Madlener etal. (2006), Sneddon etal. (2006), Pretty (2008), Corbera and Brown (2008), Macauley and Sedjo (2011), and de Boer etal. (2011).
Spatial scale refers on the one hand to the size of an intervention
(e. g., in number of hectares) and on the other hand to the biophysical
characterization of the specific land (e. g., soil type, water availability,
slope). Social interactions tend to become more complex the bigger
the area of an AFOLU intervention, on a social-biophysical continuum:
family / farm — neighbourhood — community — village — city — prov-
ince — country — region — globe. Impacts from AFOLU measures on
sustainable development are different along this spatial-scale con-
tinuum (Table 11.6). The challenge is to provide landscape governance
that responds to societal needs as well as biophysical capacity at dif-
ferent spatial scales (Görg, 2007; Moilanen and Arponen, 2011; van
der Horst and Vermeylen, 2011).
Temporal scale: As the concept of sustainable development includes
current and future generations, the impacts of AFOLU over time need
to be considered (see Chapter 4). Positive and negative impacts of
AFOLU measures can be realized at different times. For instance, while
reducing deforestation has an immediate positive impact on reducing
GHG emissions, reforestation will have a positive impact on C seques-
tration over time. Further, in some circumstances, there is the risk of
reversing current emission reductions in the future (see Section 11.3.2
on non-permanence).
Behavioural aspects: Level of education, cultural values and tradi-
tion, as well as access to markets and technology, and the decision
power of individuals and social groups, all influence the perception of
potential impacts and opportunities from AFOLU measures, and con-
sequently have a great impact on local land management decisions
(see Chapters 2, 3, and 4; Guthinga, 2008; Durand and Lazos, 2008;
Gilg, 2009; Bhuiyan etal., 2010; Primmer and Karppinen, 2010; Durand
and Vázquez, 2011). When decisions are taken at a higher adminis-
trative level (e. g., international corporations, regional authorities or
national states), other factors or values play an important role, includ-
ing national and international development goals and priorities, poli-
cies and commitments, international markets or corporate image (see
Chapters 3 and 4). Table 11.7 summarizes the emerging behavioural
aspects regarding AFOLU mitigation measures.
Land-use policies (Section 11.10) have the challenge of balancing
impacts considering these parameters: social complexity, spatial scale,
temporal scale, and behavioural aspects. Vlek and Keren (1992) and
Vlek (2004) indicate the following dilemmas relevant to land-manage-
ment decisions: Who should take the risks, when (this generation or
future generations) and where (specific place) co-benefits and poten-
tial adverse effects will take place, and how to mediate between indi-
vidual vs. social benefits. Addressing these dilemmas is context-spe-
cific. Nevertheless, the fact that a wide range of social actors need to
face these dilemmas explains, to a certain extent, disagreements about
environmental decision making in general, and land-management
decisions in particular (Villamor etal., 2011; Le etal., 2012; see Section
11.10) .
11.5 Climate change feedback
and interaction with
adaptation (includes
vulnerability)
When reviewing the inter-linkages between climate change mitiga-
tion and adaptation within the AFOLU sector the following issues need
to be considered: (i) the impact of climate change on the mitigation
potential of a particular activity (e. g., forestry and agricultural soils)
over time, (ii) potential synergies / tradeoffs within a land-use sector
between mitigation and adaptation objectives, and (iii) potential trad-
eoffs across sectors between mitigation and adaptation objectives.
Mitigation and adaptation in land-based ecosystems are closely inter-
linked through a web of feedbacks, synergies, and tradeoffs (Section
11.8). The mitigation options themselves may be vulnerable to climatic
change (Section 11.3.2) or there may be possible synergies or tradeoffs
between mitigation and adaptation options within or across AFOLU
sectors.

844844
Agriculture, Forestry and Other Land Use (AFOLU)
11
Chapter 11
Table 11�6 | Characterization of social actors in AFOLU.
Social actors Characterization
Individuals (legal and illegal forest users, farmers) Rather small-scale interventions, although some can be medium-scale
Decisions taken rather at the local level
Social groups (communities, indigenous peoples) Small to medium interventions
Decisions taken at the local or regional levels
Sub-national authorities (provinces, states) Medium to large interventions
Decisions taken at the national or sub-national level, depending on the governance structure
State (national level) Rather large interventions
Decisions taken at the national level, often in line with international agreements
Corporate (at the national or multinational levels) Rather large interventions. Decisions can be taken within a specific region / country, in another country, or at global
level (e. g., for multinational companies). National and international markets play a key role in decision making
Table 11�7 | Emerging behavioural aspects relevant for AFOLU mitigation measures.
Change in Emerging behavioural aspects in AFOLU
Consumption patterns Dietary change: Several changes in diet can potentially reduce GHG emissions, including reduction of food waste and reduction of or
changes in meat consumption (especially in industrialized countries). On the other hand, increasing income and evolving lifestyles with
increasing consumption of animal protein in developing countries are projected to increase food-related GHG emissions.
The potential of reducing GHG emissions in the food sector needs to be understood in a wider and changing socio-cultural context that determines nutrition.
Potential drivers of change: Health awareness and information, income increase, lifestyle
References 1, 2,3, 4, 5
Production patterns Large-scale land acquisition: The acquisition of (long-term rights) of large areas of farmland in lower-income countries, by
transnational companies, agribusiness, investments funds or government agencies. There are various links between these acquisitions
and GHG emissions in the AFOLU sector. On one hand because some acquisitions are aimed at producing energy crops (through non-
food or ‘flex-crops’), on the other because these can cause the displacement of peoples and activity, increasing GHG leakage.
Impacts on livelihood, local users rights, local employment, economic activity, or on biodiversity conservation are of concern.
Potential drivers of change: International markets and their mechanisms, national and international policies
References 6, 7, 8
Production and
consumption patterns
Switching to low-carbon products: Land managers are sensitive to market changes. The promotion of low-carbon products as a means for
reducing GHG emissions can increase the land area dedicated to these products. Side-effects from this changes in land management (positive and
negative), and acceptability of products and technologies at the production and consumption sides are context-related and cannot be generalized
Potential drivers of change: International agreements and markets, accessibility to rural energy, changes in energy demand
References 9, 10, 11
Relation between
producers and consumers
Certification: Labelling, certification, or other information-based instruments have been developed for promoting
behavioural changes towards more sustainable products (Section 11.10). Recently, the role of certification in reducing
GHG while improving sustainability has been explored, especially for bioenergy (Section 11.13).
Potential drivers of change: Consumer awareness, international agreements, cross-national sector policies and initiatives.
References 11, 12, 13, 14
Management priorities Increasing interest in conservation and sustainable (land) management: Changing management practices towards
more sustainable ones as alternative for gaining both environmental and social co-benefits, including climate change mitigation,
is gaining recognition. Concerns about specific management practices, accountability methods of co-benefits, and sharing
mechanisms seem to be elements of concerns when promoting a more sustainable management of natural resources.
Potential drivers of change: Policies and international agreements and their incentive mechanisms, schemes for payments for environmental services.
References 15, 16, 17, 18, 19
1
Stehfest etal. (2009);
2
Roy etal. (2012);
3
González etal. (2011);
4
Popp etal. (2010);
5
Schneider etal. (2011);
6
Cotula (2012);
7
Messerli etal. (2013);
8
German etal. (2013);
9
Muys
etal. (2014);
10
MacMillan Uribe etal. (2012);
11
Chakrabarti (2010);
12
Karipidis etal. (2010);
13
Auld etal. (2008);
14
Diaz-Chavez (2011);
15
Calegari etal. (2008);
16
Deal etal. (2012);
17
DeFries and Rosenzweig (2010);
18
Hein and van der Meer (2012);
19
Lippke etal. (2003).

845845
Agriculture, Forestry and Other Land Use (AFOLU)
11
Chapter 11
The IPCC WGI presents feedbacks between climate change and the car-
bon cycle (WGI Chapter 6; Le Quéré etal., 2013), while WGII assesses
the impacts of climate change on terrestrial ecosystems (WGII Chapter
4) and crop production systems (WGII Chapter 7), including vulnerabil-
ity and adaptation. This section focuses particularly on the impacts of
climate change on mitigation potential of land-use sectors and inter-
actions that arise with adaptation, linking to the relevant chapters of
WGI and WGII reports.
11�5�1 Feedbacks between ALOFU and climate
change
AFOLU activities can either reduce or accelerate climate change by
affecting biophysical processes (e. g., evapotranspiration, albedo) and
change in GHG fluxes to and from the atmosphere (WGI). Whether a
particular ecosystem is functioning as sink or source of GHG emission
may change over time, depending on its vulnerability to climate change
and other stressors and disturbances. Hence, mitigation options avail-
able today (Section 11.3) in the AFOLU sectors may no longer be avail-
able in the future.
There is robust evidence that human-induced land-use changes have
led to an increased surface albedo (WGI Chapter 8; Myhre and Shin-
dell, 2013). Changes in evapotranspiration and surface roughness may
counteract the effect of changes in albedo. Land-use changes affect
latent heat flux and influence the hydrological cycle. Biophysical cli-
mate feedbacks of forest ecosystems differ depending on regional
climate regime and forest types. For example, a decrease in tropical
forests has a positive climate forcing through a decrease in evapora-
tive cooling (Bala etal., 2007; Bonan, 2008). An increase in conifer-
ous-boreal forests compared to grass and snow provides a positive cli-
mate forcing through lowering albedo (Bala etal., 2007; Bonan, 2008;
Swann etal., 2010). There is currently low agreement on the net bio-
physical effect of land-use changes on the global mean temperature
(WGI Chapter 8; Myhre and Shindell, 2013). By contrast, the biogeo-
chemical effects of LUC on radiative forcing through emissions of GHG
is positive (WGI Chapter 8; Sections 11.2.2; 11.2.3).
11�5�2 Implications of climate change on
terrestrial carbon pools and mitigation
potential of forests
Projections of the global carbon cycle to 2100 using ‘Coupled Model
Intercomparison Project Phase 5 (CMIP5) Earth System Models’ (WGI
Chapter 6; Le Quéré etal., 2013) that represent a wider range of com-
plex interactions between the carbon cycle and the physical climate
system consistently estimate a positive feedback between climate and
the carbon cycle, i. e., reduced natural sinks or increased natural CO
2
sources in response to future climate change. Implications of climate
change on terrestrial carbon pools biomes and mitigation potential of
forests.
Rising temperatures, drought, and fires may lead to forests becoming a
weaker sink or a net carbon source before the end of the century (Sitch
etal., 2008). Pervasive droughts, disturbances such as fire and insect
outbreaks, exacerbated by climate extremes and climate change put
the mitigation benefits of the forests at risk (Canadell and Raupach,
2008; Phillips etal., 2009; Herawati and Santoso, 2011). Forest distur-
bances and climate extremes have associated carbon balance implica-
tions (Millar etal., 2007; Kurz etal., 2008; Zhao and Running, 2010;
Potter etal., 2011; Davidson, 2012; Reichstein etal., 2013). Allen etal.
(2010) suggest that at least some of the world’s forested ecosystems
may already be responding to climate change.
Experimental studies and observations suggest that predicted changes
in temperature, rainfall regimes, and hydrology may promote the die-
back of tropical forests (e. g., Nepstad et al., 2007). The prolonged
drought conditions in the Amazon region during 2005 contributed to
a decline in above-ground biomass and triggered a release of 4.40 to
5.87 GtCO
2
(Phillips etal., 2009). Earlier model studies suggested Ama-
zon die-back in the future (Cox etal., 2013; Huntingford etal., 2013).
However, recent model estimates suggest that rainforests may be more
resilient to climate change, projecting a moderate risk of tropical forest
reduction in South America and even lower risk for African and Asian
tropical forests (Gumpenberger etal., 2010; Cox etal., 2013; Hunting-
ford etal., 2013).
Arcidiacono-Bársony etal., (2011) suggest that the mitigation benefits
from deforestation reduction under REDD+ (Section 11.10.1) could be
reversed due to increased fire events, and climate-induced feedbacks,
while Gumpenberger et al., (2010) conclude that the protection of
forests under the forest conservation (including REDD) programmes
could increase carbon uptake in many tropical countries, mainly due to
CO
2
fertilization effects, even under climate change conditions.
11�5�3 Implications of climate change on
peatlands, grasslands, and croplands
Peatlands: Wetlands, peatlands, and permafrost soils contain higher
carbon densities relative to mineral soils, and together they comprise
extremely large stocks of carbon globally (Davidson and Janssens,
2006). Peatlands cover approximately 3 % of the Earth’s land area
and are estimated to contain 350 – 550 Gt of carbon, roughly between
20 to 25 % of the world’s soil organic carbon stock (Gorham, 1991;
Fenner etal., 2011). Peatlands can lose CO
2
through plant respiration
and aerobic peat decomposition (Clair etal., 2002) and with the onset
of climate change, may become a source of CO
2
(Koehler etal., 2010).
Large carbon losses are likely from deep burning fires in boreal peat-
lands under future projections of climate warming and drying (Flanni-
gan etal., 2009). A study by Fenner etal. (2011) suggests that climate
change is expected to increase the frequency and severity of drought
in many of the world’s peatlands which, in turn, will release far more
GHG emissions than thought previously. Climate change is projected
to have a severe impact on the peatlands in northern regions where

846846
Agriculture, Forestry and Other Land Use (AFOLU)
11
Chapter 11
most of the perennially frozen peatlands are found (Tarnocai, 2006).
According to Schuur etal. (2008), the thawing permafrost and conse-
quent microbial decomposition of previously frozen organic carbon, is
one of the most significant potential feedbacks from terrestrial ecosys-
tems to the atmosphere in a changing climate. Large areas of perma-
frost will experience thawing (WGI Chapter 12), but uncertainty over
the magnitude of frozen carbon losses through CO
2
or CH
4
emissions
to the atmosphere is large, ranging between 180 and 920 GtCO
2
by
the end of the 21st century under the Representative Concentration
Pathways (RCP)8.5 scenario (WGI Chapter 6; Le Quéré etal., 2013).
Grasslands: Tree cover and biomass in savannah has increased over
the past century (Angassa and Oba, 2008; Witt etal., 2009; Lunt etal.,
2010; Rohde and Hoffman, 2012) leading to increased carbon storage
per hectare (Hughes etal., 2006; Liao etal., 2006; Throop and Archer,
2008; Boutton etal., 2009), which has been attributed to land man-
agement, rising CO
2
, climate variability, and climate change. Climate
change and CO
2
may affect grazing systems by altering species compo-
sition; for example, warming will favour tropical (C4) species over tem-
perate (C3) species but CO
2
increase would favour C3 grasses (Howden
etal., 2008).
Croplands: Climate change impacts on agriculture will affect not only
crop yields, but also soil organic carbon (SOC) levels in agricultural
soils (Rosenzweig and Tubiello, 2007). Such impacts can be either posi-
tive or negative, depending on the particular effect considered, which
highlights the uncertainty of the impacts. Elevated CO
2
concentrations
alone are expected to have positive effects on soil carbon storage,
because of increased above- and below-ground biomass production
in agro-ecosystems. Similarly, the lengthening of the growing season
under future climate will allow for increased carbon inputs into soils.
Warmer temperatures could have negative impacts on SOC, by speed-
ing decomposition and by reducing inputs by shortening crop lifecycles
(Rosenzweig and Tubiello, 2007), but increased productivity could
increase SOC stocks (Gottschalk etal., 2012).
11�5�4 Potential adaptation options to
minimize the impact of climate change
on carbon stocks in forests and
agricultural soils
Forests: Forest ecosystems require a longer response time to adapt.
The development and implementation of adaptation strategies is also
lengthy (Leemans and Eickhout, 2004; Ravindranath, 2007). Some
examples of the adaptation practices (Murthy etal., 2011) are as fol-
lows: anticipatory planting of species along latitude and altitude,
assisted natural regeneration, mixed-species forestry, species mix
adapted to different temperature tolerance regimes, fire protection
and management practices, thinning, sanitation and other silvicultural
practices, in situ and ex situ conservation of genetic diversity, drought
and pest resistance in commercial tree species, adoption of sustain-
able forest management practices, increase in Protected Areas and
linking them wherever possible to promote migration of species, for-
ests conservation and reduced forest fragmentation enabling species
migration, and energy-efficient fuel-wood cooking devices to reduce
pressure on forests.
Agricultural soils: On current agricultural land, mitigation and adap-
tation interaction can be mutually re-enforcing, particularly for improv-
ing resilience to increased climate variability under climate change
(Rosenzweig and Tubiello, 2007). Many mitigation practices imple-
mented locally for soil carbon sequestration will increase the ability
of soils to hold soil moisture and to better withstand erosion and will
enrich ecosystem biodiversity by establishing more diversified crop-
ping systems, and may also help cropping systems to better withstand
droughts and floods, both of which are projected to increase in fre-
quency and severity under a future warmer climate (Rosenzweig and
Tubiello, 2007).
11�5�5 Mitigation and adaptation synergies and
tradeoffs
Mitigation choices taken in a particular land-use sector may further
enhance or reduce resilience to climate variability and change within or
across sectors, in light of the multiple, and often competing, pressures
on land (Section 11.4), and shifting demographics and consumption
patterns (e. g., (O’Brien etal., 2004; Sperling etal., 2008; Hunsberger
and Evans, 2012). Land-use choices driven by mitigation concerns
(e. g., forest conservation, afforestation) may have consequences for
adaptive responses and / or development objectives of other sectors
(e. g., expansion of agricultural land). For example, reducing emis-
sions from deforestation and degradation may also yield co-benefits
for adaptation by maintaining biodiversity and other ecosystem goods
and services, while plantations, if they reduce biological diversity may
diminish adaptive capacity to climate change (e. g., Chum etal., 2011).
Primary forests tend to be more resilient to climate change and other
human-induced environmental changes than secondary forests and
plantations (Thompson etal., 2009). The impact of plantations on the
carbon balance is dependent on the land-use system they replace.
While plantation forests are often monospecies stands, they may be
more vulnerable to climatic change (see IPCC WGII Chapter 4). Smith
and Olesen (2010) identified a number of synergies between options
that deliver mitigation in agriculture while also enhancing resilience to
future climate change, the most prominent of which was enhancement
of soil carbon stocks.
Adaptation measures in return may help maintain the mitigation
potential of land-use systems. For example, projects that prevent
fires and restore degraded forest ecosystems also prevent release of
GHGs and enhance carbon stocks (CBD and GiZ, 2011). Mitigation
and adaptation benefits can also be achieved within broader-level
objectives of AFOLU measures, which are linked to sustainable devel-
opment considerations. Given the exposure of many livelihoods and
communities to multiple stressors, recommendations from case stud-

847847
Agriculture, Forestry and Other Land Use (AFOLU)
11
Chapter 11
ies suggest that climate risk-management strategies need to appreci-
ate the full hazard risk envelope, as well as the compounding socio-
economic stressors (O’Brien etal., 2004; Sperling etal., 2008). Within
this broad context, the potential tradeoffs and synergies between
mitigation, adaptation, and development strategies and measures
need to be considered. Forest and biodiversity conservation, protected
area formation, and mixed-species forestry-based afforestation are
practices that can help to maintain or enhance carbon stocks, while
also providing adaptation options to enhance resilience of forest
ecosystems to climate change (Ravindranath, 2007). Use of organic
soil amendments as a source of fertility could potentially increase
soil carbon (Gattinger etal., 2012). Most categories of adaptation
options for climate change have positive impacts on mitigation. In
the agriculture sector, cropland adaptation options that also contrib-
ute to mitigation are ‘soil management practices that reduce fertilizer
use and increase crop diversification; promotion of legumes in crop
rotations; increasing biodiversity, the availability of quality seeds and
integrated crop / livestock systems; promotion of low energy produc-
tion systems; improving the control of wildfires and avoiding burning
of crop residues; and promoting efficient energy use by commercial
agriculture and agro-industries’ (FAO, 2008, 2009a). Agroforestry is
an example of mitigation-adaptation synergy in the agriculture sec-
tor, since trees planted sequester carbon and tree products provide
livelihood to communities, especially during drought years (Verchot
etal., 2007).
11.6 Costs and potentials
This section deals with economic costs and potentials of climate
change mitigation (emission reduction or sequestration of carbon)
within the AFOLU sector. Economic mitigation potentials are distin-
guished from technical or market mitigation potentials (Smith, 2012).
Technical mitigation potentials represent the full biophysical potential
of a mitigation option, without accounting for economic or other con-
straints. These estimates account for constraints and factors such as
land availability and suitability (Smith, 2012), but not any associated
costs (at least explicitly). By comparison, economic potential refers to
mitigation that could be realized at a given carbon price over a specific
period, but does not take into consideration any socio-cultural (for
example, lifestyle choices) or institutional (for example, political, policy,
and informational) barriers to practice or technology adoption. Eco-
nomic potentials are expected to be lower than the corresponding
technical potentials. Also, policy incentives (e. g., a carbon price; see
also Section 11.10) and competition for resources across various miti-
gation options, tend to affect the size of economic mitigation poten-
tials in the AFOLU sector (McCarl and Schneider, 2001). Finally, market
potential is the realized mitigation outcome under current or forecast
market conditions encompassing biophysical, economic, socio-cultural,
and institutional barriers to, as well as policy incentives for, technologi-
cal and / or practice adoption, specific to a sub-national, national or
supra-national market for carbon. Figure 11.12 (Smith, 2012) provides
a schematic view of the three types of mitigation potentials.
Economic (as well as market) mitigation potentials tend to be con-
text-specific and are likely to vary across spatial and temporal scales.
Unless otherwise stated, in the rest of this section, economic potentials
are expressed in million tonnes (Mt) of mitigation in carbon dioxide
equivalent (CO
2
eq) terms, that can arise from an individual mitiga-
tion option or from an AFOLU sub-sector at a given cost per tonne of
CO
2
eq. (USD / tCO
2
eq) over a given period to 2030, which is ‘additional’
to the corresponding baseline or reference case levels.
Various supply-side mitigation options within the AFOLU sector are
described in Section 11.3, and Section 11.4 considers a number of
potential demand-side options. Estimates for costs and potentials are
not always available for the individual options described. Also, aggre-
gate estimates covering both the supply- and demand-side options for
mitigation within the AFOLU sector are lacking, so this section mostly
focuses on the supply-side options. Key uncertainties and sensitivities
around mitigation costs and potentials in the AFOLU sector are (1) car-
bon price, (2) prevailing biophysical and climatic conditions, (3) existing
management heterogeneity (or differences in the baselines), (4) man-
agement interdependencies (arising from competition or co-benefits
across tradition production, environmental outcomes and mitigation
strategies or competition / co-benefits across mitigation options), (5) the
extent of leakage, (6) differential impact on different GHGs associated
with a particular mitigation option, and (7) timeframe for abatement
activities and the discount rate. In this section, we (a) provide aggregate
mitigation potentials for the AFOLU sector (because these wereprovided
separately for agriculture and forestry in AR4), (b) provide estimates of
Figure 11�12 | Relationship between technical, economic, and market potential (based
on Smith, 2012).
Physical /
Biological
(e.g. Land
Suitability)
Economic
Social /
Political /
Institutional /
Educational
Market
Technical Potential
Physically / Biologically
Constrained Potential
Economic Potential
Socially / Politically
Constrained Potential
Market Potential
Maximum Value
GHG Mitigation
Potential
Minimum Value
Barriers: Potential:

848848
Agriculture, Forestry and Other Land Use (AFOLU)
11
Chapter 11
global mitigation costs and potentials published since AR4, and (c) pro-
vide a regional disaggregation of the potentials to show how potential,
and the portfolio of available options, varies in different world regions.
11�6�1 Approaches to estimating economic
mitigation potentials
Bottom-up and top-down modelling approaches are used to estimate
AFOLU mitigation potentials and costs. While both approaches provide
useful estimates for mitigation costs and potentials, comparing bot-
tom-up and top-down estimates is not straightforward.
Bottom-up estimates are typically derived for discrete abatement
options in agriculture at a specific location or time, and are often based
on detailed technological, engineering and process information, and
data on individual technologies (DeAngelo etal., 2006). These studies
provide estimates of how much technical potential of particular AFOLU
mitigation options will become economically viable at certain carbon
dioxide-equivalent prices. Bottom-up mitigation responses are typically
restricted to input management (for example, changing practices with
fertilizer application and livestock feeding) and mitigation costs esti-
mates are considered ‘partial equilibrium’ in that the relevant input-
output prices (and, sometimes, quantities such as area or production
levels) are held fixed. As such, unless adjusted for potential overlaps
and tradeoffs across individual mitigation options, adding up various
individual estimates to arrive at an aggregate for a particular land-
scape or at a particular point in time could be misleading.
With a ‘systems’ approach, top-down models (described in Chapter 6;
Section 11.9) typically take into account possible interactions between
individual mitigation options. These models can be sector-specific or
economy-wide, and can vary across geographical scales: sub-national,
national, regional, and global. Mitigation strategies in top-down mod-
els may include a broad range of management responses and practice
changes (for example, moving from cropping to grazing or grazing to
forestry) as well as changes in input-output prices (for example, land
and commodity prices). Such models can be used to assess the cost
competitiveness of various mitigation options and implications across
input-output markets, sectors, and regions over time for large-scale
domestic or global adoption of mitigation strategies. In top-down
modelling, dynamic cost-effective portfolios of abatement strategies
are identified incorporating the lowest cost combination of mitigation
strategies over time from across sectors, including agricultural, forestry,
and other land-based sectors across the world that achieve the climate
stabilization target (see Chapter 6). Top-down estimates for 2030 are
included in this section, and are revisited in Section 11.9 when consid-
ering the role of the AFOLU sector in transformation pathways.
Providing consolidated estimates of economic potentials for mitigation
within the AFOLU sector as a whole is complicated because of complex
interdependencies, largely stemming from competing demands on land
for various agricultural and forestry (production and mitigation) activi-
ties, as well as for the provision of many ecosystem services (Smith etal.,
2013a). These interactions are discussed in more detail in Section 11.4.
11�6�2 Global estimates of costs and potentials
in the AFOLU sector
Through combination of forestry and agriculture potentials from AR4,
total mitigation potentials for the AFOLU sector are estimated to be ~3
to ~7.2 GtCO
2
eq / yr in 2030 at 20 and 100 USD / tCO
2
eq, respectively
(Figure 11.13), including only supply-side options in agriculture (Smith
etal., 2007) and a combination of supply- and demand-side options for
forestry (Nabuurs etal., 2007).
Estimates of global economic mitigation potentials in the AFOLU sec-
tor published since AR4 are shown in Figure 11.14, with AR4 estimates
shown for comparison (IPCC, 2007a).
Table 11.8 summarizes the ranges of global economic mitigation
potentials from AR4 (Nabuurs et al., 2007; Smith et al., 2007), and
studies published since AR4 that are shown in full in Figure 11.14, for
agriculture, forestry, and AFOLU combined.
As described in Section 11.3, since AR4, more attention has been paid
to options that reduce emissions intensity by improving the efficiency
of production (i. e., less GHG emissions per unit of agricultural prod-
uct; Burney etal., 2010; Bennetzen etal., 2012). As agricultural and
silvicultural efficiency have improved over recent decades, emissions
intensities have declined (Figure 11.15). Whilst emissions intensity has
increased (1960s to 2000s) by 45 % for cereals, emissions intensities
have decreased by 38 % for milk, 50 % for rice, 45 % for pig meat,
76 % for chicken, and 57 % for eggs.
The implementation of mitigation measures can contribute to further
decrease emission intensities of AFOLU commodities (Figure 11.16;
which shows changes of emissions intensities when a commodity-
specific mix of mitigation measures is applied). For cereal production,
mitigation measures considered include improved cropland agronomy,
nutrient and fertilizer management, tillage and residue management,
and the establishment of agro-forestry systems. Improved rice manage-
ment practices were considered for paddy rice cultivation. Mitigation
measures applied in the livestock sector include improved feeding and
dietary additives. Countries can improve emission intensities of AFOLU
commodities through increasing production at the same level of input,
the implementation of mitigation measures, or a combination of both.
In some regions, increasing current yields is still an option with a signifi-
cant potential to improve emission intensities of agricultural production.
Foley etal. (2011) analyzed current and potential yields that could be
achieved for 16 staple crops using available agricultural practices and
technologies and identified large ‘yield gaps’, especially across many
parts of Africa, Latin America, and Eastern Europe. Better crop manage-
ment practices can help to close yield gaps and improve emission inten-
sities if measures are selected that also have a mitigation potential.
Figure 11�13 | Mitigation potential for the AFOLU sector, plotted using data from AR4 (Nabuurs etal., 2007; Smith etal., 2007). Whiskers show the range of estimates (+ / - 1
standard deviation) for agricultural options for which estimates are available.
Mitigation Potential [MtCO
2
eq/yr (2030)]
-250
0
250
750
500
1250
1000
1750
1500
Cropland
Management
Manure
Management
LivestockRestore
Degraded Lands
Restore Cultivated
Organic Soils
Grazing Land
Management
Agroforestry and
Regrowth on
Remaining Land
Rice
Management
-1SD
Mean
+1SD
Up to
100 USD
Up to
50 USD
Up to
20 USD
0
1
2
3
4
5
6
ForestryAgriculture Total
Mitigation Potential [GtCO
2
eq/yr (2030)]
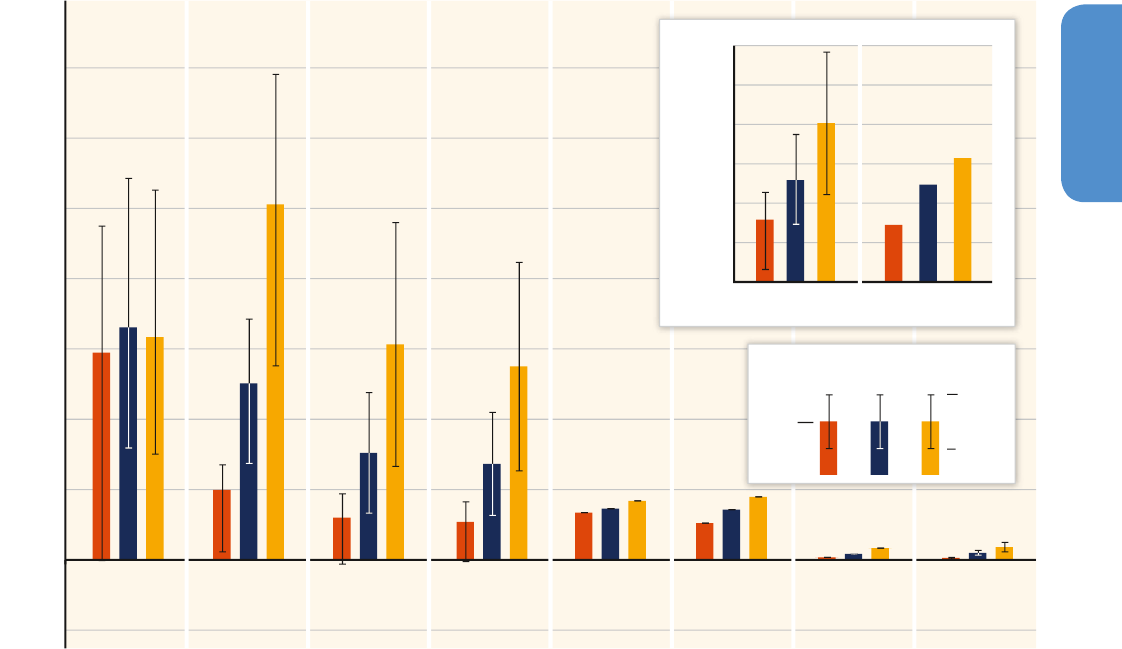
849849
Agriculture, Forestry and Other Land Use (AFOLU)
11
Chapter 11
ties, as well as for the provision of many ecosystem services (Smith etal.,
2013a). These interactions are discussed in more detail in Section 11.4.
11�6�2 Global estimates of costs and potentials
in the AFOLU sector
Through combination of forestry and agriculture potentials from AR4,
total mitigation potentials for the AFOLU sector are estimated to be ~3
to ~7.2 GtCO
2
eq / yr in 2030 at 20 and 100 USD / tCO
2
eq, respectively
(Figure 11.13), including only supply-side options in agriculture (Smith
etal., 2007) and a combination of supply- and demand-side options for
forestry (Nabuurs etal., 2007).
Estimates of global economic mitigation potentials in the AFOLU sec-
tor published since AR4 are shown in Figure 11.14, with AR4 estimates
shown for comparison (IPCC, 2007a).
Table 11.8 summarizes the ranges of global economic mitigation
potentials from AR4 (Nabuurs et al., 2007; Smith et al., 2007), and
studies published since AR4 that are shown in full in Figure 11.14, for
agriculture, forestry, and AFOLU combined.
As described in Section 11.3, since AR4, more attention has been paid
to options that reduce emissions intensity by improving the efficiency
of production (i. e., less GHG emissions per unit of agricultural prod-
uct; Burney etal., 2010; Bennetzen etal., 2012). As agricultural and
silvicultural efficiency have improved over recent decades, emissions
intensities have declined (Figure 11.15). Whilst emissions intensity has
increased (1960s to 2000s) by 45 % for cereals, emissions intensities
have decreased by 38 % for milk, 50 % for rice, 45 % for pig meat,
76 % for chicken, and 57 % for eggs.
The implementation of mitigation measures can contribute to further
decrease emission intensities of AFOLU commodities (Figure 11.16;
which shows changes of emissions intensities when a commodity-
specific mix of mitigation measures is applied). For cereal production,
mitigation measures considered include improved cropland agronomy,
nutrient and fertilizer management, tillage and residue management,
and the establishment of agro-forestry systems. Improved rice manage-
ment practices were considered for paddy rice cultivation. Mitigation
measures applied in the livestock sector include improved feeding and
dietary additives. Countries can improve emission intensities of AFOLU
commodities through increasing production at the same level of input,
the implementation of mitigation measures, or a combination of both.
In some regions, increasing current yields is still an option with a signifi-
cant potential to improve emission intensities of agricultural production.
Foley etal. (2011) analyzed current and potential yields that could be
achieved for 16 staple crops using available agricultural practices and
technologies and identified large ‘yield gaps’, especially across many
parts of Africa, Latin America, and Eastern Europe. Better crop manage-
ment practices can help to close yield gaps and improve emission inten-
sities if measures are selected that also have a mitigation potential.
Figure 11�13 | Mitigation potential for the AFOLU sector, plotted using data from AR4 (Nabuurs etal., 2007; Smith etal., 2007). Whiskers show the range of estimates (+ / - 1
standard deviation) for agricultural options for which estimates are available.
Mitigation Potential [MtCO
2
eq/yr (2030)]
-250
0
250
750
500
1250
1000
1750
1500
Cropland
Management
Manure
Management
LivestockRestore
Degraded Lands
Restore Cultivated
Organic Soils
Grazing Land
Management
Agroforestry and
Regrowth on
Remaining Land
Rice
Management
-1SD
Mean
+1SD
Up to
100 USD
Up to
50 USD
Up to
20 USD
0
1
2
3
4
5
6
ForestryAgriculture Total
Mitigation Potential [GtCO
2
eq/yr (2030)]
Mitigation potentials and costs differ largely between AFOLU com-
modities (Figure 11.16). While average abatement costs are low for
roundwood production under the assumption of perpetual rotation,
costs of mitigation options applied in meat and dairy production sys-
tems have a wide range (1:3 quartile range: 58 – 856 USD / tCO
2
eq).
Calculations of emission intensities are based on the conservative
assumption that production levels stay the same after the applica-
tion of the mitigation option. However, some mitigation options can
increase production. This would not only improve food security but
could also increase the cost-effectiveness of mitigation actions in the
agricultural sector.
Agriculture and forestry-related mitigation could cost-effectively
contribute to transformation pathways associated with long-run
climate change management (Sections 11.9 and 6.3.5). Transforma-
tion pathway modelling includes LUC, as well as land-management
options that reduce emissions intensities and increase sequestration
intensities. However, the resulting transformation pathway emissions
(sequestration) intensities are not comparable to those discussed
here. Transformation pathways are the result of integrated modelling
and the resulting intensities are the net result of many effects. The
intensities capture mitigation technology adoption, but also changes
in levels of production, land-cover change, mitigation technology
competition, and model-specific definitions for sectors / regions / and
assigned emissions inventories. Mitigation technology competition,
in particular, can lead to intensification (and increases in agricultural
emissions intensities) that support cost-effective adoption of other
mitigation strategies, such as afforestation or bioenergy (Sections
11.9 and 6.3.5).
11�6�3 Regional disaggregation of global costs
and potentials in the AFOLU sector
Figure 11.17 shows the economically viable mitigation opportunities
in AFOLU in 2030 by region and by main mitigation option at carbon
prices of up to 20, 50, and 100 USD / tCO
2
eq. The composition of the
agricultural mitigation portfolio varies greatly with the carbon price
(Smith, 2012), with low cost options such as cropland management
being favoured at low carbon prices, but higher cost options such as
restoration of cultivated organic soils being more cost-effective at
higher prices. Figure 11.17 also reveals some very large differences in
mitigation potential, and different ranking of most effective options,
between regions. Across all AFOLU options, Asia has the largest mitiga-
tion potential, with the largest mitigation in both forestry and agricul-
ture, followed by LAM, OECD-1990, MAF, and EIT.
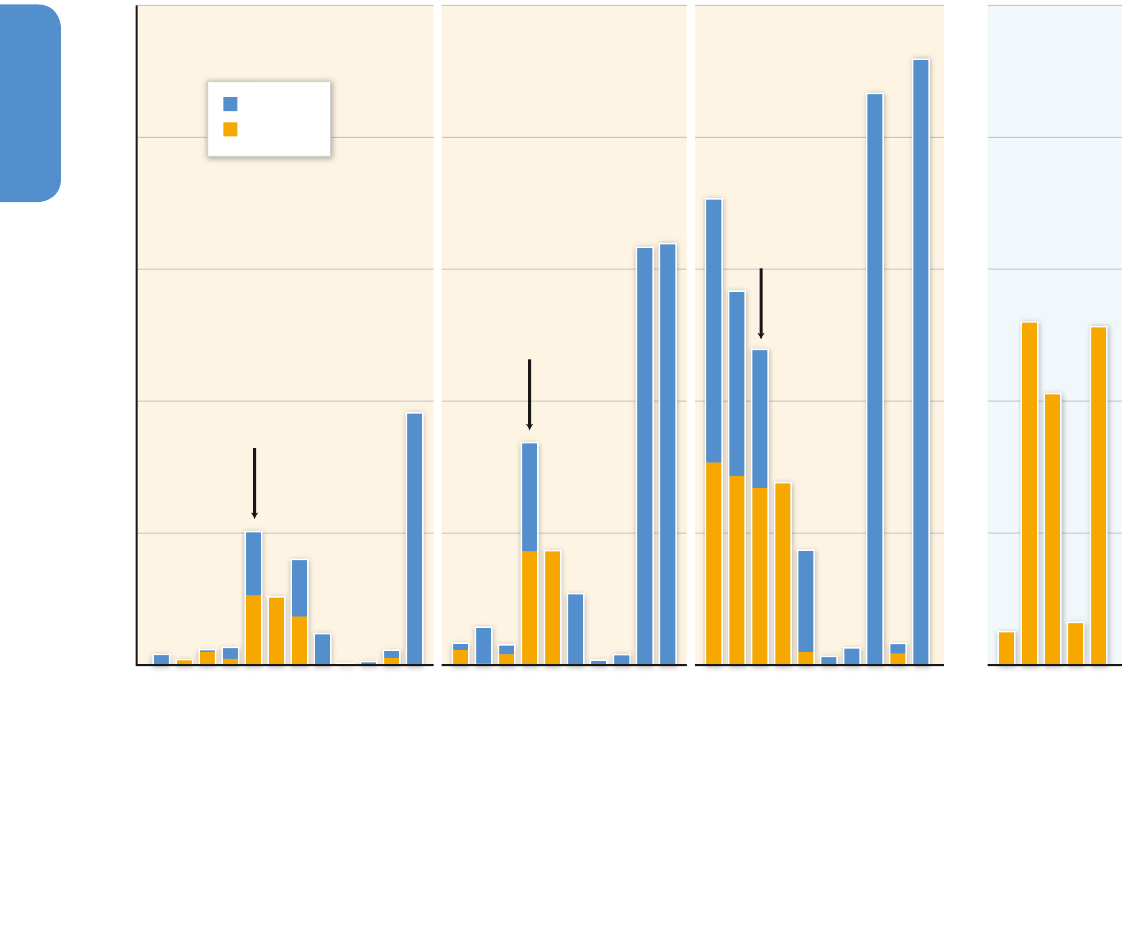
850850
Agriculture, Forestry and Other Land Use (AFOLU)
11
Chapter 11
Figure 11�14 | Estimates of economic mitigation potentials in the AFOLU sector published since AR4, (AR4 estimates shown for comparison, denoted by arrows), including
bottom-up, sectoral studies, and top-down, multi-sector studies. Some studies estimate potential for agriculture and forestry, others for one or other sector. Supply-side mitigation
potentials are estimated for around 2030, but studies range from estimates for 2025 (Rose etal., 2012) to 2035 (Rose and Sohngen, 2011). Studies are collated for those reporting
potentials at carbon prices of up to ~20 USD / tCO
2
eq (actual range 1.64 – 21.45), up to ~50 USD / tCO
2
eq (actual range 31.39 – 50.00), and up to ~100 USD / tCO
2
eq (actual range
70.0 – 120.91). Demand-side options (shown on the right-hand side of the figure) are for ~2050 and are not assessed at a specific carbon price, and should be regarded as techni-
cal potentials. Smith etal. (2013) values are mean of the range. Not all studies consider the same options or the same GHGs; further details are given in the text.
Mitigation Potential [GtCO
2
eq/yr]
0
3
6
9
12
15
Smith et al. (2013) - Diet and All Measures
Smith et al. (2013) - Feed Improvement
Popp et al. (2011)
Stehfest et al. (2009) - High [No Animal Products]
Stehfest et al. (2009) - Low [Waste Reduction Only]
Kindermann et al. (2008)
Rose et al. (2012) - IMAGE 2.3 450 ppm
Sohngen (2009)
Rose and Songhen (2011) - Ideal Policy Scenario
Rose and Songhen (2011) - Policy DC1
Golub et al. (2009)
Smith et al. (2008)
IPCC AR4 (2007)
UNEP (2011)
McKinsey & Co (2009)
Kindermann et al. (2008)
Sohngen (2009)
Rose and Songhen (2011) - Ideal Policy Scenario
Rose and Songhen (2011) - Policy DC1
Golub et al. (2009)
Smith et al. (2008)
IPCC AR4 (2007)
Rose et al. (2012) - IMAGE 2.3 550 ppm
Rose et al. (2012) - GTEM EMF-21 4.5 W/m
2
Rose et al. (2012) - MESSAGE EMF-21 3.0 W/m
2
Kindermann et al. (2008)
Rose et al. (2012) - IMAGE 2.3 650 ppm
Rose and Songhen (2011) - Ideal Policy Scenario
Rose and Songhen (2011) - Policy DC1
Golub et al. (2009)
UNEP (2011)
Smith et al. (2008)
IPCC AR4 (2007)
Rose et al. (2012) - IMAGE 2.2 EMF-21 4.5 W/m
2
Rose et al. (2012) - MESSAGE A2r-21 4.5W/m
2
Rose et al. (2012) - MESSAGE EMF-21 4.5 W/m
2
Rose et al. (2012) - GRAPE EMF-21 4.5 W/m
2
Forestry
Agriculture
Up to 20 USD/tCO
2
eq Up to 50 USD/tCO
2
eq Up to 100 USD/tCO
2
eq Demand-Side
Measures -
Technical
Potentials
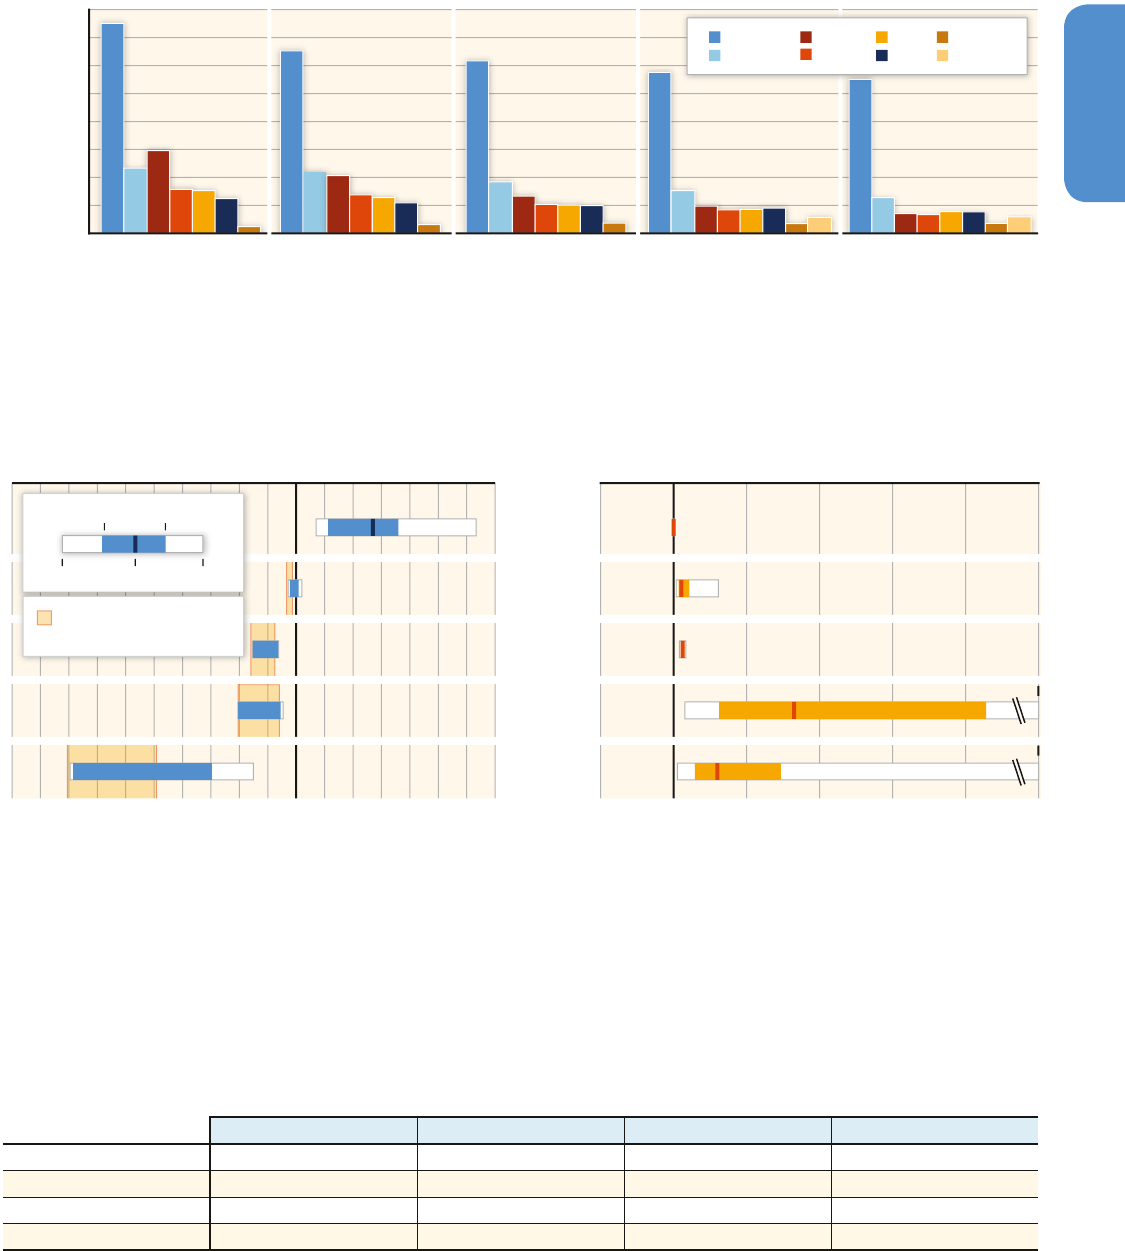
851851
Agriculture, Forestry and Other Land Use (AFOLU)
11
Chapter 11
Figure 11�15 | GHG emissions intensities of selected major AFOLU commodities for decades 1960s – 2000s, based on (Tubiello etal., 2012). i) Cattle meat, defined as GHG (enteric
fermentation + manure management of cattle, dairy and non-dairy) / meat produced; ii) Pig meat, defined as GHG (enteric fermentation + manure management of swine, market
and breeding) / meat produced; iii) Chicken meat, defined as GHG (manure management of chickens) / meat produced; iv) Milk, defined as GHG (enteric fermentation + manure man-
agement of cattle, dairy) / milk produced; v) Eggs, defined as GHG (manure management of chickens, layers) / egg produced; vi) Rice, defined as GHG (rice cultivation) / rice produced;
vii) Cereals, defined as GHG (synthetic fertilizers) / cereals produced; viii) Wood, defined as GHG (carbon loss from harvest) / roundwood produced. Data Source: (FAOSTAT, 2013).
0
1
2
3
4
5
6
7
8
GHG Emissions Intensities
[kgCO
2
eq/kg of Commodity;
kgCO
2
eq/m
3
Roundwood]
Cattle Meat
Pig Meat
Chicken
Eggs
Rice
Milk
Cereals
Roundwood
1960-1970 1970-1980 1980-1990 1990-2000 2000-2010
Figure 11�16 | Potential changes of emission intensities of major AFOLU commodities through implementation of commodity-specific mitigation measures (left panel) and related
mitigation costs (right panel). Commodities and GHG emission sources are defined as in Figure 11.15, except for roundwood, expressed as the amount of carbon sequestered
per unit roundwood from reforestation and afforestation within dedicated plantation cycles. Agricultural emission intensities represent regional averages, calculated based on
2000 – 2010 data (FAOSTAT, 2013) for selected commodities. Data on mitigation potentials and costs of measures are calculated using the mean values reported by (Smith etal.,
2008) and the maximum and minimum are defined by the highest and lowest values for four climate zones for cereals and rice, or five geographical regions for milk and cattle
meat. Emission intensities and mitigation potentials of roundwood production are calculated using data from Sathaye etal. (2005; 2006), FAO (2006), and IPCC (2006); maximum
and minimum values are defined by the highest and lowest values for 10 geographical regions. The right panel shows the mitigation costs (in USD / tCO
2
eq) of commodity-specific
mitigation measures (25
th
to 75
th
percentile range).
-7-6-5-4-3-2-10123456710 9 8
Roundwood
Cereals
Rice
Milk
Cattle Meat
Indicative Levelized Cost of Conserved Carbon [USD2010/tCO2eq]Emission Intensity [tCO
2
eq/t Product or tCO
2
eq/m³ Roundwood]
-200 0 200 400 600 800 1000
Minimum
75
th
percentile
Maximum Median
25
th
percentile
2000-2010 Global Average
Emission Intensities
2100
6200
Table 11�8 | Ranges of global mitigation potential (GtCO
2
eq / yr) reported since AR4 | All values are for 2030 except demand-side options that are for ~2050 (full data shown in
Figure 11.14).
up to 20 USD / tCO
2
eq up to 50 USD / tCO
2
eq up to 100 USD / tCO
2
eq Technical potential only
Agriculture onl y
1
0 – 1.59 0.03 – 2.6 0.26 – 4.6 -
Forestry only 0.01 – 1.45 0.11 – 9.5 0.2 – 13.8 -
AFOLU tota l
1,2
0.12 – 3.03 0.5 – 5.06 0.49 – 10.6 -
Demand-side options - - - 0.76 – 8.55
Notes:
1
All lower range values for agriculture are for non-CO
2
GHG mitigation only and do not include soil C sequestration
2
AFOLU total includes only estimates where both agriculture and forestry have been considered together.
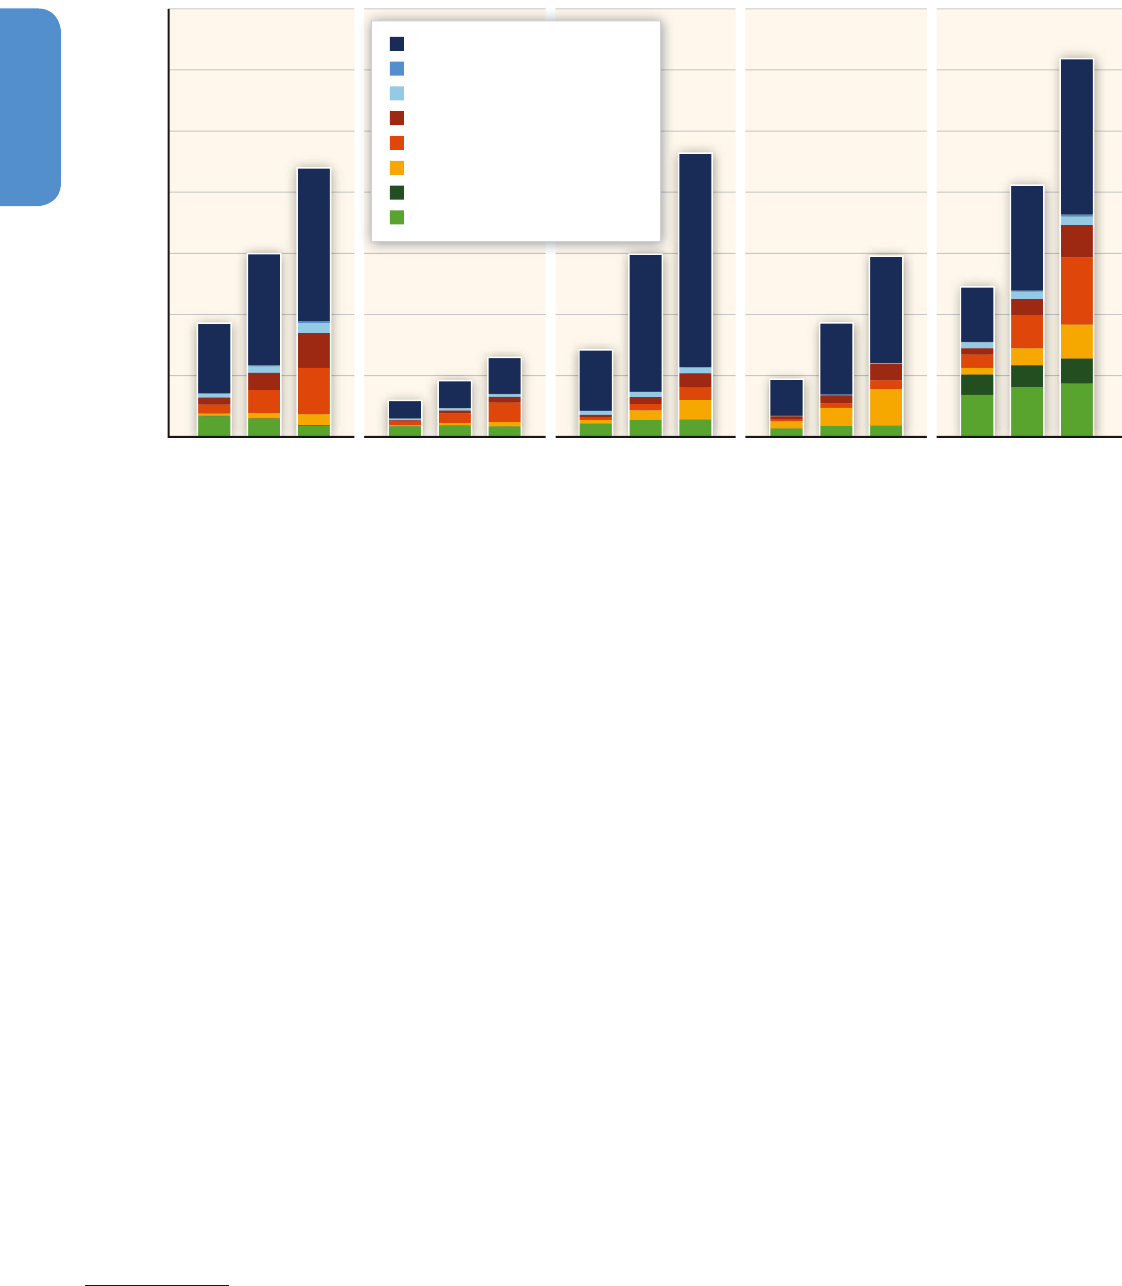
852852
Agriculture, Forestry and Other Land Use (AFOLU)
11
Chapter 11
Differences between the most effective forestry options in each region
(Figure 11.18) are particularly striking, with reduced deforestation
dominating the forestry mitigation potential LAM and MAF, but very
little potential in OECD-1990 and EIT. Forest management, followed
by afforestation, dominate in OECD-1990, EIT, and Asia (Figure 11.18).
Among agricultural options, among the most striking of regional dif-
ferences are the rice management practices for which almost all of the
global potential is in Asia, and the large potential for restoration of
organic soils also in Asia (due to cultivated Southeast Asian peats), and
OECD-1990 (due to cultivated northern peatlands; Figure 11.18).
11.7 Co-benefits, risks,
and spillovers
Implementation of AFOLU mitigation measures (Section 11.3) will
result in a range of outcomes beyond changes in GHG balances with
respect to institutional, economic, social, and environmental objectives.
To the extent these effects are positive, they can be deemed ‘co-bene-
fits’; if adverse and uncertain, they imply risks.
8
A global assessment of
8
Co-benefits and adverse side-effects describe effects in non-monetary units
without yet evaluating the net effect on overall social welfare. Please refer to the
respective sections in the framing chapters as well as to the glossary in Annex I for
concepts and definitions — particularly Sections 2.4, 3.6.3, and 4.8.
the co-benefits and adverse side-effects of AFOLU mitigation measures
is challenging for a number of reasons. First, co-benefits and adverse
side-effects depend on the development context and the scale of the
intervention (size), i. e., implementing the same AFOLU mitigation mea-
sure in two different areas (different countries or different regions
within a country) can have different socio-economic, institutional, or
environmental effects (Forner etal., 2006; Koh and Ghazoul, 2008; Tra-
bucco etal., 2008; Zomer etal., 2008; Alves Finco and Doppler, 2010;
Alig etal., 2010, p.201; Colfer, 2011; Davis etal., 2013; Albers and
Robinson, 2013; Muys etal., 2014). Thus the effects are site-specific
and generalizations are difficult. Second, these effects do not necessar-
ily overlap geographically, socially, or over the same time scales (Sec-
tion 11.4.5). Third, there is no general agreement on attribution of co-
benefits and adverse side-effects to specific AFOLU mitigation
measures; and fourth there are no standardized metrics for quantifying
many of these effects. Modelling frameworks are being developed that
allow an integrated assessment of multiple outcomes at landscape
(Bryant et al., 2011), project (Townsend et al., 2012), and smaller
(Smith etal., 2013a) scales. Table 11.9 presents an overview of the
potential effects from AFOLU mitigation measures, while the text pres-
ents the most relevant co-benefits and potential adverse side-effects
from the recent literature.
Maximizing co-benefits of AFOLU mitigation measures can increase
efficiency in achieving the objectives of other international agree-
ments, including the United Nations Convention to Combat Desertifi-
cation (UNCCD, 2011), or the Convention on Biological Diversity (CBD),
and mitigation actions may also contribute to a broader global sus-
Figure 11�18 | Regional differences in forestry options, shown as a proportion of total potential available in forestry in each region. Global forestry activities (annual amount
sequestered or emissions avoided above the baseline for forest management, reduced deforestation and afforestation), at carbon prices up to 100 USD / tCO
2
are aggregated to
regions from results from three models of global forestry and land use: the Global Timber Model (GTM; Sohngen and Sedjo, 2006), the Generalized Comprehensive Mitigation
Assessment Process (Sathaye etal., 2006), and the Dynamic Integrated Model of Forestry and Alternative Land Use (Benítez etal., 2007).
0
20
40
60
80
100
100 USD50 USD20 USD 100 USD50 USD20 USD 100 USD50 USD20 USD 100 USD50 USD20 USD 100 USD50 USD20 USD
OECD-1990 EIT LAM MAF ASIA
Proportion from Forest Management
Proportion from Reduced Deforestation
Proportion from Afforestation
Share of Forestry Options [%]
Figure 11�17 | Economic mitigation potentials in the AFOLU sector by region. Agriculture values are from Smith etal. (2007). Forestry values are from Nabuurs etal. (2007). For
forestry, 20 USD values correspond to ‘low’, and 100 USD values correspond to ‘high’ values from Nabuurs etal. (2007). Values of 50 USD represent the mean of the ‘high’ and
‘low’ values from Nabuurs etal. (2007).
Economic Mitigation Potential [GtCO
2
eq/yr (2030)]
0
0.5
1.0
1.5
2.0
2.5
3.0
3.5
100 USD50 USD20 USD 100 USD50 USD20 USD 100 USD50 USD20 USD 100 USD50 USD20 USD 100 USD50 USD20 USD
OECD-1990 EIT LAM MAF ASIA
Forestry
Manure Management
Livestock
Restoration of Degraded Lands
Restoration of Cultivated Organic Soils
Grazing Land Management
Rice Management
Cropland Management
Carbon Price per tCO
2
eq
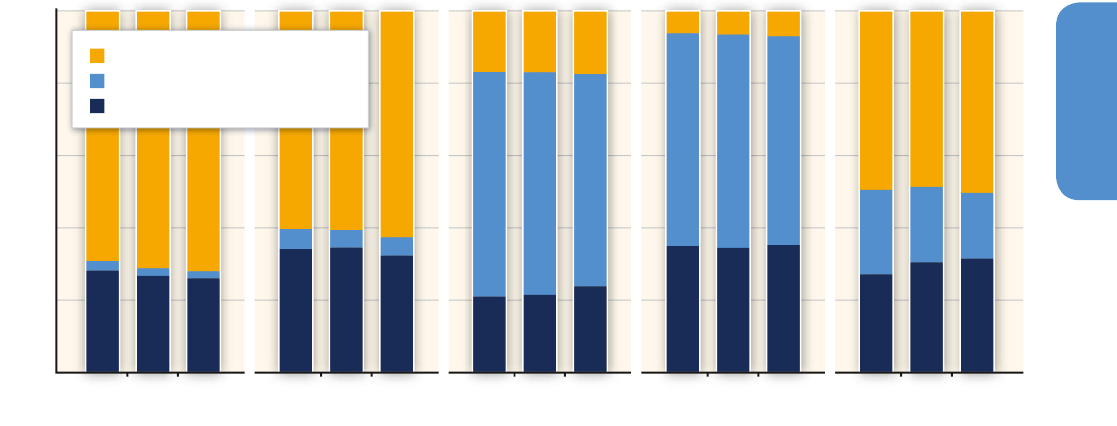
853853
Agriculture, Forestry and Other Land Use (AFOLU)
11
Chapter 11
tainability agenda (Harvey etal., 2010; Gardner etal., 2012; see Chap-
ter 4). In many cases, implementation of these agendas is limited by
capital, and mitigation may provide a new source of finance (Tubiello
etal., 2009).
11�7�1 Socio-economic effects
AFOLU mitigation measures can affect institutions and living conditions
of the various social groups involved. This section includes potential
effects of AFOLU mitigation measures on three dimensions of sustain-
able development: institutional, social, and economic (Section 11.4.5).
AFOLU mitigation measures may have impacts on land tenure and
land-use rights for several social groups including indigenous peoples,
local communities and other social groups, dependant on natural
assets. Co-benefits from AFOLU mitigation measures can be clarifica-
tion of land tenure and harmonization of rights, while adverse side-
effects can be lack of recognition of customary rights, loss of tenure or
possession rights, and even displacement of social groups (Sunderlin
etal., 2005; Chhatre and Agrawal, 2009; Blom etal., 2010; Sikor etal.,
2010; Robinson etal., 2011; Rosemary, 2011; Larson, 2011; Rosendal
and Andresen, 2011). Whether an impact on land tenure and use rights
is positive or negative depends upon two factors: (a) the institutions
regulating land tenure and land-use rights (e. g., laws, policies), and
(b) the level of enforcement by such institutions (Corbera and Brown,
2008; Araujo etal., 2009; Rosemary, 2011; Larson etal., 2013; Albers
and Robinson, 2013). More research is needed on specific tenure forms
(e. g., individual property, state ownership or community rights), and
on the specific effects from tenure and rights options, on enabling
AFOLU mitigation measures and co-benefits in different regions under
specific circumstances (Sunderlin et al., 2005; Katila, 2008; Chhatre
and Agrawal, 2009; Blom etal., 2010; Sikor etal., 2010; Robinson etal.,
2011; Rosemary, 2011; Larson, 2011; Rosendal and Andresen, 2011).
AFOLU mitigation measures can support enforcement of sectoral
policies (e. g., conservation policies) as well as cross-sectoral coordi-
nation (e. g., facilitating a landscape view for policies in the agricul-
ture, energy, and forestry sectors (Brockhaus etal., 2013). However,
AFOLU mitigation activities can also introduce or reduce clashes with
existing policies in other sectors (e. g., if a conservation policy covers
a forest area, where agricultural land is promoted by another policy
(Madlener etal., 2006; Halsnæs and Verhagen, 2007; Smith et al.,
2007; Beach etal., 2009; Alig etal., 2010; Jackson and Baker, 2010;
DeFries and Rosenzweig, 2010; Pettenella and Brotto, 2011; Section
11.10).
An area of increasing concern since AR4 is the potential impact of
AFOLU mitigation measures on food security. Efforts to reduce hun-
ger and malnutrition will increase individual food demand in many
developing countries, and population growth will increase the num-
ber of individuals requiring secure and nutritionally sufficient food
production. Thus, a net increase in food production is an essential
component for securing sustainable development (Ericksen et al.,
2009; FAO, WFP, and IFAD, 2012). AFOLU mitigation measures linked
to increases in food production (e. g., agroforestry, intensification
of agricultural production, or integrated systems) can increase food
availability and access especially at the local level, while other mea-
sures (e. g., forest or energy crop plantations) can reduce food pro-
duction at least locally (Foley etal., 2005; McMichael et al., 2007;
the co-benefits and adverse side-effects of AFOLU mitigation measures
is challenging for a number of reasons. First, co-benefits and adverse
side-effects depend on the development context and the scale of the
intervention (size), i. e., implementing the same AFOLU mitigation mea-
sure in two different areas (different countries or different regions
within a country) can have different socio-economic, institutional, or
environmental effects (Forner etal., 2006; Koh and Ghazoul, 2008; Tra-
bucco etal., 2008; Zomer etal., 2008; Alves Finco and Doppler, 2010;
Alig etal., 2010, p.201; Colfer, 2011; Davis etal., 2013; Albers and
Robinson, 2013; Muys etal., 2014). Thus the effects are site-specific
and generalizations are difficult. Second, these effects do not necessar-
ily overlap geographically, socially, or over the same time scales (Sec-
tion 11.4.5). Third, there is no general agreement on attribution of co-
benefits and adverse side-effects to specific AFOLU mitigation
measures; and fourth there are no standardized metrics for quantifying
many of these effects. Modelling frameworks are being developed that
allow an integrated assessment of multiple outcomes at landscape
(Bryant et al., 2011), project (Townsend et al., 2012), and smaller
(Smith etal., 2013a) scales. Table 11.9 presents an overview of the
potential effects from AFOLU mitigation measures, while the text pres-
ents the most relevant co-benefits and potential adverse side-effects
from the recent literature.
Maximizing co-benefits of AFOLU mitigation measures can increase
efficiency in achieving the objectives of other international agree-
ments, including the United Nations Convention to Combat Desertifi-
cation (UNCCD, 2011), or the Convention on Biological Diversity (CBD),
and mitigation actions may also contribute to a broader global sus-
Figure 11�18 | Regional differences in forestry options, shown as a proportion of total potential available in forestry in each region. Global forestry activities (annual amount
sequestered or emissions avoided above the baseline for forest management, reduced deforestation and afforestation), at carbon prices up to 100 USD / tCO
2
are aggregated to
regions from results from three models of global forestry and land use: the Global Timber Model (GTM; Sohngen and Sedjo, 2006), the Generalized Comprehensive Mitigation
Assessment Process (Sathaye etal., 2006), and the Dynamic Integrated Model of Forestry and Alternative Land Use (Benítez etal., 2007).
0
20
40
60
80
100
100 USD50 USD20 USD 100 USD50 USD20 USD 100 USD50 USD20 USD 100 USD50 USD20 USD 100 USD50 USD20 USD
OECD-1990 EIT LAM MAF ASIA
Proportion from Forest Management
Proportion from Reduced Deforestation
Proportion from Afforestation
Share of Forestry Options [%]

854854
Agriculture, Forestry and Other Land Use (AFOLU)
11
Chapter 11
Pretty, 2008; Godfray etal., 2010; Jackson and Baker, 2010; Graham-
Rowe, 2011; Jeffery etal., 2011).
Regarding human health reduced emissions from agriculture and for-
estry may also improve air, soil, and water quality (Smith etal., 2013a),
thereby indirectly providing benefits to human health and well-being.
Demand-side measures aimed at reducing the proportion of livestock
products in human diets that are high in animal products are also
associated with multiple health benefits (McMichael etal., 2007; Ste-
hfest etal., 2009; Marlow etal., 2009). AFOLU mitigation measures,
particularly in the livestock sector, can have an impact on animal wel-
fare (Sundrum, 2001; Lund and Algers, 2003; Keeling etal., 2011; Kehl-
bacher etal., 2012; Koknaroglu and Akunal, 2013).
A major area of concern is related to the potential impacts of
AFOLU mitigation measures on equity (Sections 3.3; 4.2; 4.7;
Box 11�6 | Challenges for mitigation in developing countries in the AFOLU sector
Mitigation challenges related to the AFOLU sector
The contribution of developing countries to future GHG emissions
is expected to be very significant due to projected increases in food
production by 2030 driving short-term land conversion in these
countries. Mitigation efforts in the AFOLU sector rely mainly on
reduction of GHG emissions and an increase in carbon sequestra-
tion (Table 11.2). Potential activities include reducing deforesta-
tion, increasing forest cover, agroforestry, agriculture and livestock
management, and production of sustainable renewable energy
(Sathaye etal., 2005; Smith etal., 2013b). Although agriculture and
forestry are important sectors for GHG abatement (Section 11.2.3),
it is likely that technology alone will not be sufficient to deliver the
necessary transitions to a low-GHG future (Alig etal., 2010; Section
11.3.2). Other barriers include access to market and credits, techni-
cal capacities to implement mitigation options, including accurate
reporting of emission levels and emission factors based on activity
data, and institutional frameworks and regulations (Corbera and
Schroeder, 2011; Mbow etal., 2012; Sections 11.7; 11.8). Addition-
ally, the diversity of circumstances among developing countries
makes it difficult to establish the modelled relationships between
GDP and CO
2
emissions per capita found by using the Kaya
identity. This partly arises from the wide gap between rural and
urban communities, and the difference in livelihoods (e. g., the use
of fuel wood, farming practices in various agro-ecological condi-
tions, dietary preferences with a rising middle class in developing
countries, development of infrastructure, and behavioural change,
etc.; Lambin and Meyfroidt, 2011). Also, some mitigation pathways
raise the issue of non-permanence and leakage that can lead to
the transfer activities to non-protected areas, which may threaten
conservation areas in countries with low capacities (Lippke etal.,
2003; Jackson and Baker, 2010; Section 11.3.2).
Critical issues to address are the co-benefits and adverse side-
effects associated with changed agricultural production, the
necessary link between mitigation and adaptation, and how to
manage incentives for a substantial GHG abatement initiative
without compromising food security (Smith and Wollenberg, 2012;
Sections 11.5; 11.7). The challenge is to strike a balance between
emissions reductions / adaptation and development / poverty
alleviation priorities, or to find policies that co-deliver. Mitigation
pathways in developing countries should address the dual need
for mitigation and adaptation through clear guidelines to manage
multiple options (Section 11.5.4). Prerequisites for the successful
implementation of AFOLU mitigation projects are ensuring that
(a) communities are fully engaged in implementing mitigation
strategies, (b) any new strategy is consistent with ongoing policies
or programmes, and (c) a priori consent of small holders is given.
Extra effort is required to address equity issues including gender,
challenges, and prospects (Mbow etal., 2012).
Mitigation challenges related to the bioenergy sector
Bioenergy has a significant mitigation potential, provided that the
resources are developed sustainably and that bioenergy sys-
tems are efficient (Chum etal., 2011; Section 11.9.1). Bioenergy
production can be integrated with food production in developing
countries, e. g., through suitable crop rotation schemes, or use of
by-products and residues (Berndes etal., 2013). If implemented
sustainably this can result in higher food and energy outcomes
and hence reduce land-use competition. Some bioenergy options
in developing countries include perennial cropping systems, use of
biomass residues and wastes, and advanced conversion systems
(Beringer etal., 2011; Popp etal., 2011; Box 7.1). Agricultural and
forestry residues can provide low-carbon and low-cost feedstock
for bioenergy. Biomass from cellulosic bioenergy crops feature
substantially in future energy systems, especially in the framework
of global climate policy that aims at stabilizing CO
2
concentration
at low levels (Popp etal., 2011; Section 11.13). The large-scale
use of bioenergy is controversial in the context of developing
countries because of the risk of reducing carbon stocks and
releasing carbon to the atmosphere (Bailis and McCarthy, 2011),
threats to food security in Africa (Mbow, 2010), and threats to
biodiversity via the conversion of forests to biofuel (e. g., palm oil)
plantations. Several studies underline the inconsistency between
the need for bioenergy and the requirement for, e. g., Africa, to
use its productive lands for sustainable food production (Cotula
etal., 2009). Efficient biomass production for bioenergy requires a
range of sustainability requirements to safeguard food production,
biodiversity, and terrestrial carbon storage.

855855
Agriculture, Forestry and Other Land Use (AFOLU)
11
Chapter 11
4.8). Depending on the actual and perceived distribution of socio-
economic benefits, responsibilities (burden sharing), as well the
access to decision making, financing mechanisms, and technology,
AFOLU mitigation measures can promote inter- and intra-genera-
tional equity (Di Gregorio etal., 2013). Conversely, depending on
the policy instruments and the implementation schemes of these
mitigation measures, they can increase inequity and land conflicts,
or marginalize small-scale farm / forest owners or users (Robinson
etal., 2011; Kiptot and Franzel, 2012; Huettner, 2012; Mattoo and
Subramanian, 2012). Potential impacts on equity and benefit-shar-
ing mechanisms arise for AFOLU activities using forestry measures
in developing countries including conservation, restoration, reduced
deforestation and degradation, as well as sustainable management
and afforestation / reforestation (Combes Motel etal., 2009; Catta-
neo etal., 2010; Rosemary, 2011).
Large-scale land acquisition (often referred to as ‘land grabbing’)
related to the promotion of AFOLU mitigation measures (especially for
production of bioenergy crops) and its links to sustainable develop-
ment in general, and equity in particular, are emerging issues in the
literature (Cotula etal., 2009; Scheidel and Sorman, 2012; Mwakaje,
2012; Messerli etal., 2013; German etal., 2013).
In many cases, the implementation of agricultural and forestry systems
with positive impacts mitigating climate change are limited by capi-
tal, and carbon payments or compensation mechanisms may provide
a new source of finance (Tubiello etal., 2009). For instance, in some
cases, mitigation payments can help to make production of non-timber
forest products (NTFP) economically viable, further diversifying income
at the local level (Singh, 2008). However, depending on the accessibil-
ity of the financing mechanisms (payments, compensation, or other)
economic benefits can become concentrated, marginalizing many
local stakeholders (Combes Motel etal., 2009; Alig etal., 2010; Asante
etal., 2011; Asante and Armstrong, 2012; Section 11.8). The realiza-
tion of economic co-benefits is related to the design of the specific
mechanisms and depends upon three main variables: (a) the amount
and coverage of these payments, (b) the recipient of the payments, and
(c) timing of payments (ex-ante or ex-post; Corbera and Brown, 2008;
Skutsch etal., 2011)� Further considerations on financial mechanisms
and carbon payments, both within and outside UNFCCC agreements,
are described in Section 11.10.
Financial flows supporting AFOLU mitigation measures (e. g., those
resulting from the REDD+) can have positive effects on conserving
biodiversity, but could eventually create conflicts with conservation
of biodiversity hotspots, when their respective carbon stocks are low
(Gardner etal., 2012; Section 11.10). Some authors propose that car-
bon payments can be complemented with biodiversity payments as an
option for reducing tradeoffs with biodiversity conservation (Phelps
etal., 2010a). Bundling of ecosystem service payments, and links to
carbon payments, is an emerging area of research (Deal and White,
2012).
11�7�2 Environmental effects
Availability of land and land competition can be affected by AFOLU
mitigation measures. Different stakeholders may have different views
on what land is available, and when considering several AFOLU mitiga-
tion measures for the same area, there can be different views on the
importance of the goods and ecosystem services provided by the land,
e. g., some AFOLU measures can increase food production but reduce
water availability or other environmental services. Thus decision mak-
ers need to be aware of potential site-specific tradeoffs within the sec-
tor. A further potential adverse side-effect is that of increasing land
rents and food prices due to a reduction in land availability for agricul-
ture in developing countries (Muller, 2009; Smith etal., 2010, 2013b;
Rathmann etal., 2010; Godfray etal., 2010; de Vries and de Boer, 2010;
Harvey and Pilgrim, 2011; Amigun etal., 2011; Janzen, 2011; Cotula,
2012; Scheidel and Sorman, 2012; Haberl etal., 2013a).
AFOLU mitigation options can promote conservation of biological
diversity (Smith etal., 2013a) both by reducing deforestation (Chhatre
etal., 2012; Murdiyarso etal., 2012; Putz and Romero, 2012; Visseren-
Hamakers et al., 2012), and by using reforestation / afforestation to
restore biodiverse communities on previously developed farmland
(Harper et al., 2007). However, promoting land-use changes (e. g.,
through planting monocultures on biodiversity hot spots) can have
adverse side-effects, reducing biodiversity (Koh and Wilcove, 2008;
Beringer etal., 2011; Pandit and Grumbine, 2012; Ziv etal., 2012; Hert-
wich, 2012; Gardner etal., 2012).
In addition to potential climate impacts, land-use intensity drives the
three main N loss pathways (nitrate leaching, denitrification, and ammo-
nia volatilization) and typical N balances for each land use indicate that
total N losses also increase with increasing land-use intensity (Steven-
son etal., 2010). Leakages from the N cycle can cause air (e. g., ammo-
nia (NH
3
+
), nitrogen oxides (NO
x
))
9
, soil nitrate (NO
3
-
) and water pollu-
tion (e. g., eutrophication), and agricultural intensification can lead to
a variety of other adverse environmental impacts (Smith etal., 2013a).
Combined strategies (e. g., diversified crop rotations and organic N
sources) or single-process strategies (e. g., reduced N rates, nitrification
inhibitors, and changing chemical forms of fertilizer) can reduce N losses
(Bambo etal., 2009; Gardner and Drinkwater, 2009). Integrated systems
may be an alternative approach to reduce leaching (Section 11.10).
AFOLU mitigation measures can have either positive or negative
impacts on water resources, with responses dependant on the miti-
gation measure used, site conditions (e. g., soil thickness and slope,
hydrological setting, climate; Yu etal., 2013) and how the particular
mitigation measure is managed. There are two main components:
water yield and water quality. Water yields can be manipulated
with forest management, through afforestation, reforestation, for-
9
Please see Section 7.9.2 and WGII Section 11.9 for a discussion of health effects
related to air pollution.

856856
Agriculture, Forestry and Other Land Use (AFOLU)
11
Chapter 11
Table 11�9 | Summary of potential co-benefits (green arrows) and adverse side-effects (orange arrows) from AFOLU mitigation measures; arrows pointing up / down denote posi-
tive / negative effect on the respective issue. These effects depend on the specific context (including bio-physical, institutional, and socio-economic aspects) as well as on the scale
of implementation. For an assessment of macroeconomic, cross-sectoral effects associated with mitigation policies (e. g., on energy prices, consumption, growth, and trade), see
Sections 3.9, 6.3.6, 13.2.2.3, and 14.4.2. Note: Co-benefits / adverse side-effects of bioenergy are discussed in Section 11.13.
Issue Potential co-benefit or adverse side-effect Scale AFOLU mitigation measure
Institutional
Land tenure and
use rights
Improving (↑) or diminishing (↓) tenure and use rights for local
communities and indigenous peoples, including harmonization of
land tenure and use regimes (e.g., with customary rights)
Local to national Forestry (4, 5, 6, 8, 9, 12, 20)
Sectoral policies
Promoting (↑) or contradicting (↓) the enforcement of
sectoral (forest and/or agriculture) policies
National Forestry (2, 5, 6, 9, 20); land-based
agriculture (7, 11, 20)
Cross-sectoral
policies
Cross-sectoral coordination (↑) or clashes (↓) between
forestry, agriculture, energy, and/or mining policies
Local to national Forestry (7, 20); agriculture (7, 11, 20)
Participative
mechanisms
Creation/use of participative mechanisms (↑) for decision making
regarding land management (including participation of various
social groups, e.g., indigenous peoples or local communities)
Local to national Forestry (4, 5, 6, 8, 9, 14, 20); agriculture
(20, 32); integrated systems (20, 34)
Benefit sharing
mechanisms
Creation/use of benefits-sharing mechanisms (↑) from AFOLU mitigation measures
Local to national Forestry (4, 5, 6, 8, 20)
Social
Food security
Increase (↑) or decrease (↓) on food availability and access
Local to national Forestry (18, 19); agriculture (7, 15, 18,
19, 23, 28, 30); livestock (2, 3, 19, 35, 36);
integrated systems (18, 19); biochar (17, 26)
Local/traditional
knowledge
Recognition (↑) or denial (↓) of indigenous and local
knowledge in managing (forest/agricultural) land
Local/sub-national Forestry (4, 5, 6, 8, 20); agriculture (20, 28);
integrated systems (2); livestock (2, 3, 35); biochar (2)
Animal welfare Changes in perceived or measured animal welfare (perceived due to
cultural values or measured, e.g., through amount of stress hormones)
Local to national Livestock (2, 31, 35, 37, 38)
Cultural values
Respect and value cultural habitat and traditions (↑), reduce (↓), or
increase (↑) existing conflicts or social discomfort (4, 5, 6, 20, 8)
Local to trans-
boundary
Forestry (4, 5, 6, 9, 20)
Human health Impacts on health due to dietary changes, especially in societies
with a high consumption of animal protein (↓)
Local to global Changes in demand patterns (31, 36)
Equity
Promote (↑) or not (↓) equal access to land, decision making, value chain,
and markets as well as to knowledge- and benefit-sharing mechanisms
Local to global Forestry (4, 5, 6, 8, 9, 10, 20); agriculture (11, 23, 32)
Economic
Income
Increase (↑) or decrease (↓) in income. There are
concerns regarding income distribution (↑)
Local Forestry (6, 7, 8, 16, 20, 21, 22); agriculture (16, 19,
20, 23, 28); livestock (2, 3); integrated systems (7,
20); biochar (24); changes in demand patterns (2)
Employment
Employment creation (↑) or reduction of employment
(especially for small farmers or local communities) (↓)
Local Forestry (8, 20); agriculture (20, 23); livestock
(2, 3); integrated systems (7, 20)
Financing
mechanisms
Access (↑) or lack of access (↓) to new financing schemes
Local to global Forestry (6, 8, 16, 20); agriculture
(16, 20); livestock (2, 3)
Economic activity
Diversification and increase in economic activity (↑) while concerns on equity (↑)
Local Forestry (6, 7, 8, 20); land-based agriculture
(16, 19, 20, 23, 28); livestock (2, 3)
Environmental
Land availability
Competition between land uses and risk of activity or community displacement (↑)
Local to trans-
boundary
Forestry and land-based-agriculture (5, 6, 15,
18, 20, 29, 30); livestock (2, 3, 29, 40)
Biodiversity
Monocultures can reduce biodiversity (↓). Ecological restoration
increases biodiversity and ecosystem services (↑) by 44 and 25%
respectively (28). Conservation, forest management, and integrated
systems can keep biodiversity (↑) and/or slow desertification (↓)
Local to trans-
boundary
Forestry (1, 19, 20, 27); on conservation and
forest management (1, 19, 21, 27, 30); agriculture
and integrated systems (15, 19, 20, 28, 30)
Albedo
Positive impacts (↑) on albedo and evaporation and interactions with ozone
Local to global See Section 11.5
N and P cycles
Impacts on N and P cycles in water (↓/↑) especially from
monocultures or large agricultural areas
Local to trans-
boundary
Agriculture (19, 23, 30, 35); livestock (2, 3, 30)
Water resources Monocultures and /or short rotations can have negative impacts on water availability
(↓). Potential water depletion due to irrigation (↓). Some management practices
can support regulation of the hydrological cycle and protection of watersheds (↑)
Local to trans-
boundary
Forestry (1, 19, 20, 27); land-based agriculture
(30, 44); integrated systems (2, 30, 44)
Soil
Soil conservation (↑) and improvement of soil quality and fertility (↑). Reduction
of erosion. Positive or negative carbon mineralization priming effect (↑/↓)
Local Forestry (44, 45); land-based agriculture (13, 19,
23, 28, 30); integrated systems biochar (39, 40)
New products
Increase (↑) or decrease (↓) on fibre availability as well
as non-timber/non-wood products output
Local to national Forestry (18, 19, 41, 42); agriculture (7, 15, 18,
19, 23, 28, 30); integrated systems (18, 19)
Ecosystem resilience
Increase (↑) or reduction (↓) of resilience, reduction of disaster risks (↓)
Local to trans-
boundary
Forestry, integrated systems (11, 33; see Section 11.5)
⇒

857857
Agriculture, Forestry and Other Land Use (AFOLU)
11
Chapter 11
est thinning, or deforestation. In general, reduction in water yields
in afforestation / reforestation projects has been reported in both
groundwater or surface catchments (Jackson etal., 2005), or where
irrigation water is used to produce bioenergy crops. For water sup-
ply security, it is important to consider the relative yield reduction
and this can have severe consequences in dry regions with inherent
water shortages (Wang etal., 2011c). Where there is a water imbal-
ance, however, this additional water use can be beneficial by reduc-
ing the efflux of salts (Jackson etal., 2005). Another aspect of water
yield is the reduction of flood peaks, and also prolonged periods of
water flow, because discharge is stabilized (Jackson et al., 2005),
however low flows can be reduced because of increased forest
water use. Water quality can be affected by AFOLU in several ways.
For example, minimum tillage systems have been reported to reduce
water erosion and thus sedimentation of water courses (Lal, 2011).
Deforestation is well known to increase erosion and thus efflux of
silt; avoiding deforestation will prevent this. In other situations,
watershed scale reforestation can result in the restoration of water
quality (e. g., Townsend et al., 2012). Furthermore, strategic place-
ment of tree belts in lands affected by dryland salinity can remedi-
ate the affected lands by lowering the water table (Robinson etal.,
2004) . Various types of AFOLU mitigation can result in degradation
of water sources through the losses of pesticides and nutrients to
water (Smith etal., 2013a).
AFOLU mitigation measures can have several impacts on soil. Increas-
ing or maintaining carbon stocks in living biomass (e. g., through forest
or agroforestry systems) will reduce wind erosion by acting as wind
breaks and may increase crop production; and reforestation, conserva-
tion, forest management, agricultural systems, or bioenergy systems
can be used to restore degraded or abandoned land (Smith etal., 2008;
Stickler et al., 2009; Chatterjee and Lal, 2009; Wicke et al., 2011b;
Sochacki etal., 2012). Silvo-pastoral systems can help to reverse land
degradation while providing food (Steinfeld etal., 2008, 2010; Janzen,
2011). Depending on the soil type, production temperature regimes,
the specific placement and the feedstock tree species, biochar can
have positive or negative carbon mineralization priming effects over
time (Zimmerman etal., 2011; Luo etal., 2011).
AFOLU mitigation options can promote innovation, and many technolog-
ical supply-side mitigation options outlined in Section 11.3 also increase
agricultural and silvicultural efficiency. At any given level of demand for
agricultural products, intensification increases output per unit area and
would therefore, if all else were equal, allow the reduction in farmland
area, which would in turn free land for C sequestration and / or bioen-
ergy production (Section 11.4). For example, a recent study calculated
potentially large GHG reductions from global agricultural intensification
by comparing the past trajectory of agriculture (with substantial yield
improvements), with a hypothetical trajectory with constant technol-
ogy (Burney etal., 2010). However, in real-world situations increases in
yield may result in feedbacks such as increased consumption (‘rebound
effects’; see Section 11.4; Lambin and Meyfroidt, 2011; Erb, 2012).
11�7�3 Public perception
Mitigation measures that support sustainable development are likely to
be viewed positively in terms of public perception, but a large-scale drive
towards mitigation without inclusion of key stakeholder communities
involved would likely not be greeted favourably (Smith and Wollenberg,
2012). However, there are concerns about competition between food and
AFOLU outcomes, either because of an increasing use of land for biofuel
plantations (Fargione et al., 2008; Alves Finco and Doppler, 2010), or
afforestation / reforestation (Mitchell etal., 2012), or by blocking the trans-
formation of forest land into agricultural land (Harvey and Pilgrim, 2011).
Further, lack of clarity regarding the architecture of the future inter-
national climate regime and the role of AFOLU mitigation measures is
perceived as a potential threat for long-term planning and long-term
investments (Streck, 2012; Visseren-Hamakers etal., 2012). Certain tech-
Issue Potential co-benefit or adverse side-effect Scale AFOLU mitigation measure
Technology
Infrastructure
Increase (↑) or decrease (↓) in availability of and access to infrastructure.
Competition for infrastructure for agriculture (↑), can increase social conflicts
Local Agriculture (20, 46, 47)
Technology
innovation and
transfer
Promote (↑) or delay (↓) technology development and transfer
Local to global Forestry (7, 13, 25); agriculture (23); livestock (2, 3)
Technology
Acceptance
Can facilitate acceptance of sustainable technologies (↑)
Local to national Forestry (7, 13, 25); livestock (2, 3, 35)
Notes: AFOLU mitigation measures are grouped following the structure given in Table 11.2
Sources:
1
Trabucco etal., 2008;
2
Steinfeld etal., 2010;
3
Gerber etal., 2010;
4
Sikor etal., 2010;
5
Rosemary, 2011;
6
Pettenella and Brotto, 2011;
7
Jackson and Baker, 2010;
8
Corbera
and Schroeder, 2011;
9
Colfer, 2011;
10
Blom etal., 2010;
11
Halsnæs and Verhagen, 2007;
12
Larson, 2011;
13
Lichtfouse etal., 2009;
14
Thompson etal., 2011;
15
Graham-Rowe, 2011;
16
Tubiello etal., 2009;
17
Barrow, 2012;
18
Godfray etal., 2010;
19
Foley etal., 2005;
20
Madlener etal., 2006;
21
Strassburg etal., 2012;
22
Canadell and Raupach, 2008;
23
Pretty, 2008;
24
Galinato etal., 2011;
25
Macauley and Sedjo, 2011;
26
Jeffery etal., 2011;
27
Benayas etal., 2009;
28
Foley etal., 2011;
29
Haberl etal., 2013;
30
Smith etal., 2013;
31
Stehfest etal.,
2009;
32
Chhatre etal., 2012;
33
Seppälä etal., 2009;
34
Murdiyarso etal., 2012;
35
de Boer etal., 2011;
36
McMichael etal., 2007;
37
Koknaroglu and Akunal, 2013;
38
Kehlbacher etal.,
2012;
39
Zimmerman etal., 2011;
40
Luo etal., 2011;
41
Mirle, 2012;
42
Albers and Robinson, 2013;
43
Smith etal., 2013a;
44
Chatterjee and Lal, 2009;
45
Smith, 2008;
46
Ziv etal., 2012;
47
Beringer etal., 2011;
48
Douglas etal., 2009

858858
Agriculture, Forestry and Other Land Use (AFOLU)
11
Chapter 11
nologies, such as animal feed additives and genetically modified organ-
isms are banned in some jurisdictions due to perceived health and / or
environmental risks. Public perception is often as important as scien-
tific evidence of hazard / risk in considering government policy regarding
such technologies (Royal Society, 2009; Smith and Wollenberg, 2012).
11�7�4 Spillovers
Emerging knowledge on the importance of ecosystems services as a
means for addressing climate change mitigation and adaptation have
brought attention to the role of ecosystem management for achiev-
ing several development goals, beyond climate change adaptation
and mitigation. This knowledge has enhanced the creation of ecosys-
tem markets (Section 11.10). In some jurisdictions ecosystem markets
are developing (MEA, 2005; Engel etal., 2008; Deal and White, 2012;
Wünscher and Engel, 2012)and these allow valuation of various com-
ponents of land-use changes, in addition to mitigation (Mayrand and
Paquin, 2004; Barbier, 2007). Different approaches are used; in some
cases the individual components (both co-benefits and adverse side-
effects) are considered singly (bundled), in other situations they are
considered together (stacked) (Deal and White, 2012). Ecosystem mar-
ket approaches can serve as a framework to assess the benefits of miti-
gation actions from project, to regional and national level (Farley and
Costanza, 2010). Furthermore, designing ecosystem market approaches
yields methodologies for the evaluation of individual components (e. g.,
water quality response to reforestation, timber yield), and other types of
ecosystem service (e. g., biodiversity, social amenity; Bryan etal., 2013).
11.8 Barriers and opportunities
Barriers and opportunities refer to the conditions provided by the devel-
opment context (Section 11.4.5). These conditions can enable and facil-
itate (opportunities) or hinder (barriers) the full use of AFOLU mitiga-
tion measures. AFOLU programmes and policies can help to overcome
barriers, but countries being affected by many barriers will need time,
financing, and capacity support. In some cases, international negotia-
tions have recognized these different circumstances among countries
and have proposed corresponding approaches (e. g., a phased approach
in the REDD+, Green Climate Fund; Section 11.10). Corresponding to
the development framework presented in Section 11.4.5, the following
types of barriers and benefits are discussed: socio-economic, environ-
mental, institutional, technological, and infrastructural.
11�8�1 Socio-economic barriers and
opportunities
The design and coverage of the financing mechanisms is key to suc-
cessful use of the AFOLU mitigation potential (Section 11.10; Chapter
16). Questions remain over which costs will be covered by such mecha-
nisms. If financing mechanisms fail to cover at least transaction and
monitoring costs, they will become a barrier to the full implementation
of AFOLU mitigation. According to some studies, opportunity costs also
need to be fully covered by any financing mechanism for the AFOLU
sector, especially in developing countries, as otherwise AFOLU mitiga-
tion measures would be less attractive compared to returns from other
land uses (Angelsen, 2008; Cattaneo etal., 2010; Böttcher etal., 2012).
Conversely, if financing mechanisms are designed to modify economic
activity, they could provide an opportunity to leverage a larger propor-
tion of AFOLU mitigation potential.
Scale of financing sources can become either a barrier (if a relevant
financial volume is not secured) or create an opportunity (if finan-
cial sources for AFOLU suffice) for using AFOLU mitigation potential
(Streck, 2012; Chapter 16). Another element is the accessibility to
AFOLU financing for farmers and forest stakeholders (Tubiello etal.,
2009, p. 200; Havemann, 2011; Colfer, 2011). Financial concerns,
including reduced access to loan and credits, high transaction costs or
reduced income due to price changes of carbon credits over the project
duration, are potential risks for AFOLU measures, especially in develop-
ing countries, and when land holders use market mechanisms (e. g.,
Afforestation and Reforestation (A / R) Clean Development Mechanism
(CDM); Madlener etal., 2006).
Poverty is characterized not only by low income, but also by insuf-
ficient food availability in terms of quantity and / or quality, limited
access to decision making and social organization, low levels of
education and reduced access to resources (e. g., land or technology;
UNDP International Poverty Centre, 2006). High levels of poverty can
limit the possibilities for using AFOLU mitigation options, because of
short-term priorities and lacking resources. In addition, poor communi-
ties have limited skills and sometimes lack of social organization that
can limit the use and scaling up of AFOLU mitigation options, and can
increase the risk of displacement, with other potential adverse side-
effects (Smith and Wollenberg, 2012; Huettner, 2012). This is especially
relevant when forest land sparing competes with other development
needs e. g., increasing land for agriculture or promoting some types of
mining (Forner etal., 2006), or when large-scale bioenergy compro-
mises food security (Nonhebel, 2005; Section 11.13).
Cultural values and social acceptance can determine the feasibility of
AFOLU measures, becoming a barrier or an opportunity depending of
the specific circumstances (de Boer etal., 2011).
11�8�2 Institutional barriers and opportunities
Transparent and accountable governance and swift institutional estab-
lishment are very important for a sustainable implementation of AFOLU
mitigation measures. This includes the need to have clear land tenure
and land-use rights regulations and a certain level of enforcement, as
well as clarity about carbon ownership (Palmer, 2011; Thompson etal.,

859859
Agriculture, Forestry and Other Land Use (AFOLU)
11
Chapter 11
2011; Markus, 2011; Rosendal and Andresen, 2011; Murdiyarso etal.,
2012 Sections 11.4.5; 11.10; Chapters 14; 15).
Lack of institutional capacity (as a means for securing creation of equal
institutions among social groups and individuals) can reduce feasibil-
ity of AFOLU mitigation measures in the near future, especially in areas
where small-scale farmers or forest users are the main stakeholders
(Laitner etal., 2000; Madlener etal., 2006; Thompson etal., 2011a). Lack
of an international agreement that supports a wide implementation of
AFOLU measures can become a major barrier for realizing the mitiga-
tion potential from the sector globally (Section 11.10; Chapter 13).
11�8�3 Ecological barriers and opportunities
Mitigation potential in the agricultural sector is highly site-specific,
even within the same region or cropping system (Baker etal., 2007;
Chatterjee and Lal, 2009). Availability of land and water for different
uses need to be balanced, considering short- and long-term priorities,
and global differences in resource use. Consequently, limited resources
can become an ecological barrier and the decision of how to use them
needs to balance ecological integrity and societal needs (Jackson,
2009).
At the local level, the specific soil conditions, water availability, GHG
emission-reduction potential as well as natural variability and resil-
ience to specific systems will determine the level of realization of miti-
gation potential of each AFOLU measure (Baker etal., 2007; Halvorson
etal., 2011). Frequent droughts in Africa and changes in the hydro-
meteorological events in Asia and Central and South America are
important in defining the specific regional potential (Bradley et al.,
2006; Rotenberg and Yakir, 2010). Ecological saturation (e. g., soil car-
bon or yield) means that some AFOLU mitigation options have their
own limits (Section 11.5). The fact that many AFOLU measures can
provide adaptation benefits provides an opportunity for increasing
ecological efficiency (Guariguata etal., 2008; van Vuuren etal., 2009;
Robledo etal., 2011; Section 11.5).
11�8�4 Technological barriers and
opportunities
Technological barriers refer to the limitations in generating, procuring,
and applying science and technology to identify and solve an environ-
mental problem. Some mitigation technologies are already applied now
(e. g., afforestation, cropland, and grazing land management, improved
livestock breeds and diets) so there are no technological barriers for
these options, but others (e. g., some livestock dietary additives, crop
trait manipulation) are still at the development stage (see Table 11.2).
The ability to manage and re-use knowledge assets for scientific com-
munication, technical documentation and learning is lacking in many
areas where mitigation could take place. Future developments pres-
ent opportunities for additional mitigation to be realized if efforts to
deliver ease-of-use and range-of-use are guaranteed. There is also a
need to adapt technology to local needs by focusing on existing local
opportunities (Kandji etal., 2006), as proposed in Nationally Appropri-
ate Mitigation Actions (NAMAs) (Section 11.10).
Barriers and opportunities related to monitoring, reporting, and veri-
fication of the progress of AFOLU mitigation measures also need be
considered. Monitoring activities, aimed at reducing uncertainties, pro-
vide the opportunity of increasing credibility in the AFOLU sector. How-
ever there are technical challenges. For instance, monitoring carbon
in forests with high spatial variability in species composition and tree
density can pose a technical barrier to the implementation of some
AFOLU activities (e. g., REDD+; Baker etal., 2010; Section 11.10). The
IPCC National Greenhouse Gas Inventory Guidelines (Paustian etal.,
2006) also provide an opportunity, because they offer standard sci-
entific methods that countries already use to report AFOLU emissions
and removals under the UNFCCC. Also, field research in high-biomass
forests (Gonzalez etal., 2010) shows that remote sensing data and
Monte Carlo quantification of uncertainty offer a technical opportu-
nity for implementing REDD+ (Section 11.10). Exploiting the exist-
ing human skills within a country is essential for realizing full AFOLU
potential. A lack of trained people can therefore become a barrier to
implementation of appropriate technologies (Herold and Johns, 2007).
Technology improvement and technology transfer are two crucial
components for the sustainable increase of agricultural production
in developed and developing regions with positive impacts in terms
of mitigation, soil, and biodiversity conservation (Tilman etal., 2011).
International and national policy instruments are relevant to foster
technology transfer and to support research and development (Section
11.10.4), overcoming technological barriers.
11.9 Sectoral implications
of transformation
pathways and sustain-
able development
Some climate change management objectives require large-scale
transformations in human societies, in particular in the produc-
tion and consumption of energy and the use of the land resource.
Chapter 6 describes alternative ‘transformation pathways’ of societ-
ies over time from now into the future, consistent with different cli-
mate change outcomes. Many pathways that foresee large efforts in
mitigation will have implications for sustainable development, and
corrective actions to move toward sustainability may be possible.
However, impacts on development are context specific and depend
upon scale and institutional agreements of the AFOLU options, and
not merely on the type of option (see Sections 11.4 for development
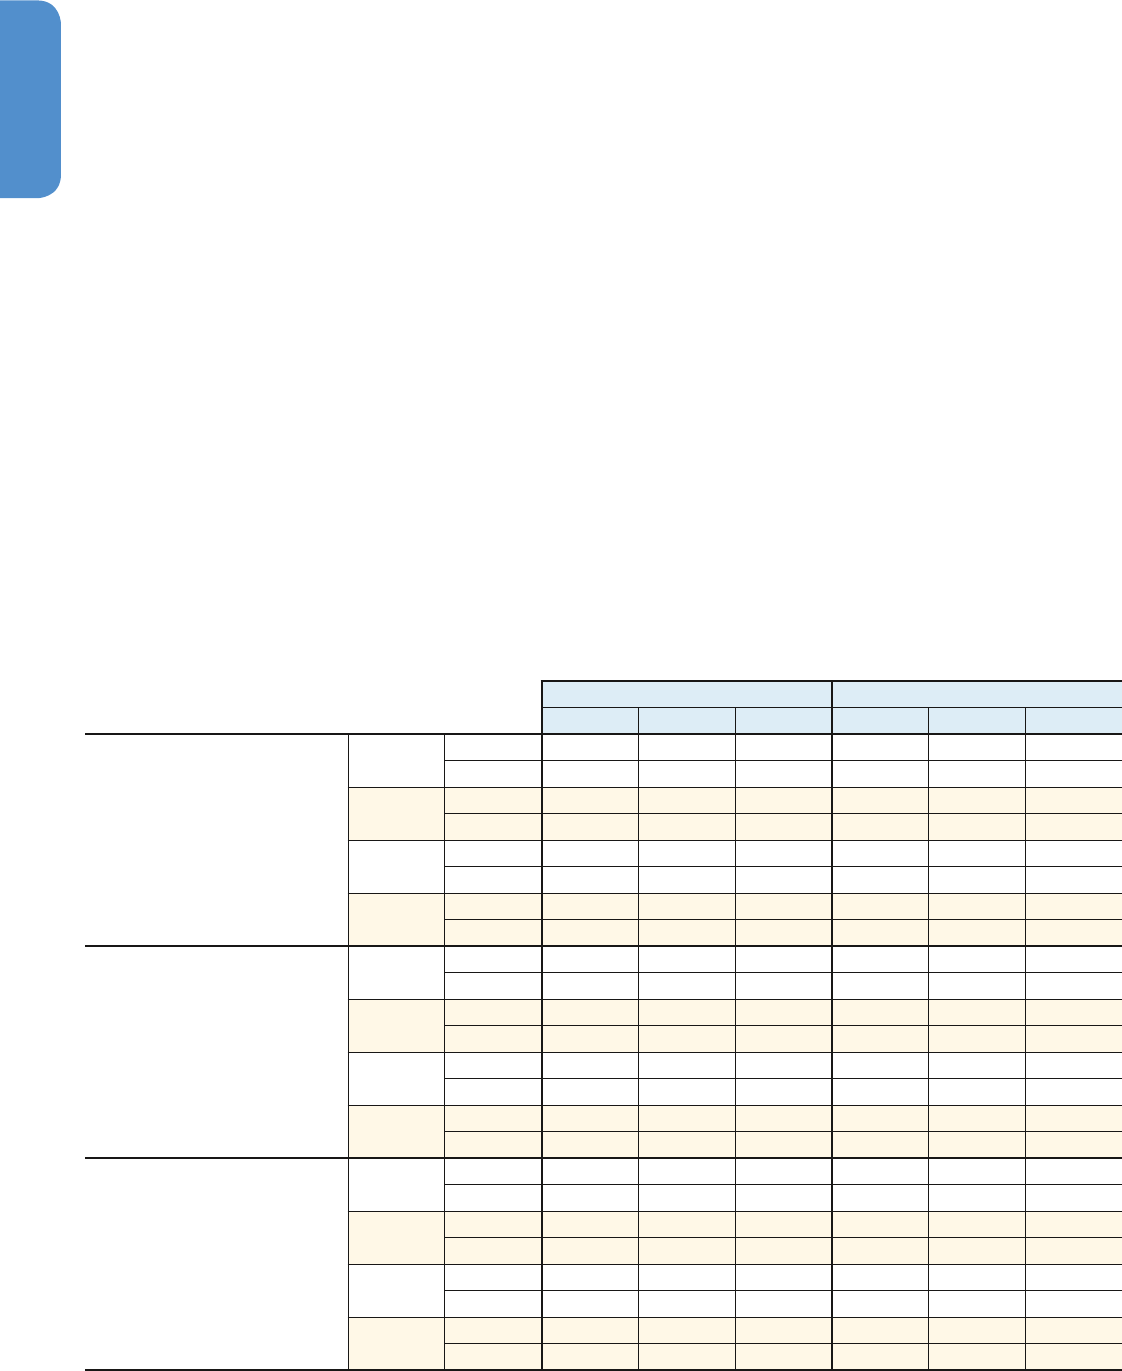
860860
Agriculture, Forestry and Other Land Use (AFOLU)
11
Chapter 11
context and systemic view, 11.7 for potential co-benefits and adverse
effects, and 11.8 for opportunities and challenges). To evaluate sec-
toral implications of transformation pathways, it is useful to first
characterize the pathways in terms of mitigation technologies and
policy assumptions.
11�9�1 Characterization of transformation
pathways
Uncertainty about reference AFOLU emissions is significant both his-
torically (Section 11.2) and in projections (Section 6.3.1.3). The trans-
formation projections of the energy system, AFOLU emissions and
land-use are characterized by the reference scenario, as well as the
abatement policy assumptions regarding eligible abatement options,
regions covered, and technology costs over time. Many mitigation
scenarios suggest a substantial cost-effective mitigation role for land
related mitigation assuming idealized policy implementation, with
immediate, global, and comprehensive availability of land-related miti-
gation options. However, policy implementation of large-scale land-
based mitigation will be challenging. In addition, the transformation
pathways often ignore, or only partially cover, important mitigation
risks, costs, and benefits (e. g., transaction costs or Monitoring Report-
ing and Verification (MRV) costs), and other developmental issues
including intergenerational debt or non-monetary benefits (Ackerman
etal., 2009; Lubowski and Rose, 2013).
In recent idealized implementation scenarios from a model compari-
son study, land-related changes can represent a significant share of
emissions reductions (Table 11.10). In these scenarios, models assume
an explicit terrestrial carbon stock incentive, or a global forest protec-
tion policy, as well as an immediate global mitigation policy in general.
Bioenergy is consistently deployed (because it is considered to reduce
net GHG emissions over time; see Section 6.3.5), and agricultural emis-
sions are priced. Note that bioenergy related mitigation is not captured
in Table 11.10. The largest land emission reductions occur in net CO
2
emissions, which also have the greatest variability across models.
Some models exhibit increasing land CO
2
emissions under mitigation,
as bioenergy feedstock production leads to LUC, while other models
exhibit significant reductions with protection of existing terrestrial car-
bon stocks and planting of new trees to increase carbon stocks. Land-
related CO
2
and N
2
O mitigation is more important in the nearer-term
Table 11�10 | Cumulative land-related emissions reductions, land reduction share of global reductions, and percent of baseline land emissions reduced for CH
4
, CO
2
, and N
2
O in
idealized implementation 550 and 450 ppm CO
2
eq scenarios. The number of scenarios is indicated for each GHG and atmospheric concentration goal. Negative values represent
increases in emissions (Kriegler etal., 2013). Bioenergy-related mitigation is not captured in the table.
550 ppm 450 ppm
2010 – 2030 2010 – 2050 2010 – 2100 2010 – 2030 2010 – 2050 2010 – 2100
Cumulative global land-related
emissions reductions (GtCO
2
eq)
CH
4
min 3.5 17.5 51.4 0.0 4.5 52.3
(n = 5 / 5) max 9.8 46.0 201.7 12.7 50.5 208.6
CO
2
min – 20.2 – 43.2 – 129.8 – 20.3 – 50.8 – 153.9
(n = 11 / 10) max 280.9 543.0 733.4 286.6 550.5 744.6
N
2
O min 3.1 8.4 25.5 3.1 8.4 25.5
(n = 4 / 4) max 8.2 27.7 96.6 9.7 29.3 96.8
Sum
min – 8.7 2.5 53.9 – 3.7 5.6 69.7
(n = 4 / 4)
max 295.2 587.7 903.5 301.4 596.9 940.3
Land reductions share of total
global emissions reductions
CH
4
min 25 % 20 % 20 % 22 % 20 % 16 %
max 37 % 40 % 42 % 30 % 31 % 36 %
CO
2
min – 43 % – 12 % – 4 % – 20 % -8 % -4 %
max 74 % 48 % 17 % 73 % 47 % 15 %
N
2
O
min 52 % 61 % 65 % 53 % 61 % 65 %
max 95 % 90 % 87 % 78 % 83 % 85 %
Sum
min -11 % 0 % 1 % -2 % 1 % 1 %
max 70 % 47 % 19 % 69 % 46 % 17 %
Percent of baseline land
emissions reduced
CH
4
min 3 % 8 % 10 % 0 % 2 % 10 %
max 8 % 16 % 28 % 10 % 18 % 30 %
CO
2
min -42 % -89 % 0 % -42 % -104 % 0 %
max 373 % 417 % 504 % 381 % 423 % 512 %
N
2
O
min 4 % 6 % 8 % 4 % 6 % 8 %
max 10 % 16 % 22 % 12 % 17 % 22 %
Sum
min -4 % 1 % 7 % -2 % 1 % 8 %
max 97 % 100 % 73 % 99 % 101 % 76 %

861861
Agriculture, Forestry and Other Land Use (AFOLU)
11
Chapter 11
for some models. Land-related N
2
O and CH
4
reductions are a signifi-
cant part of total N
2
O and CH
4
reductions, but only a small fraction
of baseline emissions, suggesting that models have cost-effective rea-
sons to keep N
2
O and CH
4
emissions. Emissions reductions from land
increase only slightly with the stringency of the atmospheric concen-
tration goal, as energy and industry emission reductions increase faster
with target stringency. This result is consistent with previous studies
(Rose etal., 2012). Land-based CO
2
reductions can be over 100 % of
baseline emissions, from the expansion of managed and unmanaged
forests for sequestration.
Emissions reductions from individual land-related technologies, espe-
cially bioenergy, are not generally reported in transformation path-
way studies. In part, this is due to emphasis on the energy system, but
also other factors that make it difficult to uniquely quantify mitiga-
tion by technology. An exception is Rose etal. (2012) who reported
agriculture, forest carbon, and bioenergy abatement levels for vari-
ous atmospheric concentration goals. Cumulatively, over the century,
bioenergy was the dominant strategy, followed by forestry, and then
agriculture. Bioenergy cumulatively generated approximately 5 to
52 GtCO
2
eq and 113 to 749 GtCO
2
eq mitigation by 2050 and 2100,
respectively. In total, land-related strategies contributed 20 to 60 %
of total cumulative abatement to 2030, 15 to 70 % to 2050, and 15
to 40 % to 2100.
Within models, there is a positive correlation between emissions
reductions and GHG prices. However, across models, it is less clear, as
some estimate large reductions with a low GHG price, while others
estimate low reductions despite a high GHG price (Rose etal., 2012).
For the most part, these divergent views are due to differences in
model assumptions and are difficult to disentangle. Overall, while a
tighter target and higher carbon price results in a decrease in land-use
emissions, emissions decline at a decreasing rate. This is indicative of
the rising relative cost of land mitigation, the increasing demand for
bioenergy, and subsequent increasing need for overall energy system
GHG abatement and energy consumption reductions. For additional
discussion of land’s potential role in transformation pathways, espe-
cially regarding physical land-use and bioenergy, see sections 6.3.2.4
and 6.3.5.
Models project increased deployment of, and dependence on, modern
bioenergy (i. e., non-traditional bioenergy that is produced centrally to
service communities rather than individual household production for
heat and cooking), with some models projecting up to 95 EJ per year
by 2030, and up to 245 EJ per year by 2050. Models universally project
that the majority of agriculture and forestry mitigation, and bioenergy
primary energy, will occur in developing and transitional economies
(Section 6.3.5).
More recently, the literature has begun analyzing more realistic policy
contexts. This work has identified a number of policy coordination and
implementation issues. There are many dimensions to policy coordina-
tion: technologies, sectors, regions, climate and non-climate policies,
and timing. There are three prominent issues. First, there is coordina-
tion between mitigation activities. For instance, increased bioenergy
incentives without global terrestrial carbon stock incentives or global
forest protection policy, could result in substantial land conversion
and emissions with large-scale deployment of energy crops. The pro-
jected emissions come primarily from the displacement of pasture,
grassland, and natural forest (Sections 6.3.5 and 11.4.3). Energy crop-
land expansion also results in non-energy cropland conversion. These
studies find that ignoring land conversion emissions with energy crop
expansion, results in the need for deeper emissions reductions in the
fossil and industrial sectors, and increased total mitigation costs.
However, illustrative scenarios by (Calvin etal., 2013a) suggest that
extensive forest protection policies may be needed for managing bio-
energy driven deforestation. Note that providing energy crops, espe-
cially while protecting terrestrial carbon stocks, could result in a sig-
nificant increase in food prices, potentially further exacerbated if also
expanding forests (Wise etal., 2009; Popp etal., 2011; Reilly etal.,
2012; Calvin et al., 2013a; see also Sections 11.4.3 and 11.13.7).
In addition to competition between energy crops and forest carbon
strategies, there is also competition between avoided deforestation
and afforestation mitigation strategies, but synergies between forest
management and afforestation (Rose and Sohngen, 2011). Bioenergy
sustainability policies across sectors also need to be coordinated
(Frank etal., 2013).
The second major concern is coordination of mitigation activity over
time. The analyses noted in the previous paragraph assume the abil-
ity to globally protect or incentivize all, or a portion, of forest carbon
stocks. A few studies to date have evaluated the implications of stag-
gered forest carbon incentives — across regions and forest carbon
activities. For instance, (Calvin etal., 2009) estimate land CO
2
emis-
sions increases of 4 and 6 GtCO
2
/ yr in 2030 and 2050, respectively,
from scenarios with staggered global regional climate policies that
include forest carbon incentives. And, Rose and Sohngen (2011) find
that fragmented or delayed forest carbon policy could accelerate defor-
estation. They project 60 – 100 GtCO
2
of leakage by 2025 with a carbon
price of 15 USD
2010
/ tCO
2
that rises at 5 % per year. Regional agriculture
and forestry mitigation supply costs are also affected by regional par-
ticipation / non-participation, with non-participating regions potentially
increasing the mitigation costs for participating regions (Golub etal.,
2009). Staggered adoption of land-mitigation policies will likely have
institutional and socioeconomic implications as well (Madlener etal.,
2006). Institutional issues, especially clarification of land tenure and
property rights and equity issues (Section 11.7), will also be critical for
successful land mitigation in forestry over time (Palmer, 2011; Gupta,
2012; Karsenty etal., 2014).
Finally, the type of incentive structure has implications. International
land-related mitigation projects are currently regarded as high risk car-
bon market investments, which may affect market appeal. Also, mitiga-
tion scenarios assume that all emissions and sequestration changes
are priced (similar to capping all emissions). However, mitigation,
especially in agriculture and forestry, may be sought through volun-

862862
Agriculture, Forestry and Other Land Use (AFOLU)
11
Chapter 11
tary markets, where mitigation suppliers choose whether to participate
(Section 11.10). For instance, Rose etal. (2013) estimate reduced miti-
gation potential, as well as over-crediting, for United States agriculture
and forestry with voluntary mitigation supply incentives, e. g., mitiga-
tion decreased 25 – 55 % at 15 USD
2010
/ tCO
2
eq due to non-participant
leakage and non-additional crediting.
11�9�2 Implications of transformation pathways
for the AFOLU sector
Transformation pathways indicate that a combination of forces can
result in very different projected landscapes relative to today, even
in baseline scenarios (Section 6.3.5). For instance, Popp etal. (2013)
evaluate three models, and show that projected 2030 baseline changes
from today alone vary sharply across models in all regions (Figure
11.19). See Section 6.3.5 for global land cover change results for a
broader set of studies and policy contexts. In the examples in Figure
11.19, projections exhibit growth and reductions in both non-energy
cropland (e. g., ASIA), and energy cropland (e. g., ASIA, OECD-1990,
EIT). Furthermore, different kinds of land are converted when baseline
cropland expands (e. g., MAF). Mitigation generally induces greater
land cover changes than in baseline scenarios, but there are very differ-
ent potential transformation visions. Overall, it is difficult to generalize
on regional land cover effects of mitigation. For the same atmospheric
concentration goal, some models convert significant area, some do
not. There is energy cropland expansion in many regions that supports
the production of bioenergy. Less consistent is the response of forest
land, primarily due to differences in the land carbon options / policies
modelled (Section 6.3.5). Finally, there is relatively modest additional
land conversion in the 450 ppm, compared to the 550 ppm, scenarios,
which is consistent with the declining role of land-related mitigation
with policy stringency.
The implications of transformation pathway scenarios with large
regional expansion of forest cover for carbon sequestration, depends
in part on how the forest area increases (Figure 11.19; Popp etal.,
2013). If forest areas increase through the expansion of natural veg-
etation, biodiversity and a range of other ecosystem services pro-
vided by forests could be enhanced. If afforestation occurs through
large-scale plantation, however, some negative impacts on biodiver-
sity, water, and other ecosystem services could arise, depending on
what land cover the plantation replaces and the rotation time (Sec-
tion 11.7). Similar issues arise with large-scale bioenergy, and envi-
ronmental impacts of energy crop plantations, which largely depend
upon where, how, and at what scale they are implemented, and how
they are managed (Davis etal., 2013; see Section 11.13.6). Not sur-
prisingly, the realistic policy coordination and implementation issues
discussed in Section 11.9.1 could have significant land-use conse-
quences, and additional policy design research is essential to better
characterize mitigation costs, net emissions, and other social implica-
tions.
11�9�3 Implications of transformation pathways
for sustainable development
The implications of the transformation pathways on sustainable
development are context- and time-specific. A detailed discussion of
the implications of large-scale LUC, competition between different
demands for land, and the feedbacks between LUC and other services
provided by land is provided in Section 11.4, potential co-benefits
and adverse side-effects are discussed in Section 11.7, and Section
6.6 compares potential co-benefits and adverse side-effects across
sectors, while Section 11.8 presents the opportunities and barriers
for promoting AFOLU mitigation activities in the future. Finally, Sec-
tion 11.13 discusses the specific implications of increasing bioenergy
crops.
11.10 Sectoral policies
Climate change and different policy and management choices inter-
act. The interrelations are particularly strong in agriculture and for-
estry: climate has a strong influence on these sectors that also con-
stitute sources of GHG as well as sinks (Golub etal., 2009). The land
provides a multitude of ecosystem services, climate change mitigation
being just one of many services that are vital to human well-being.
The nature of the sector means that there are, potentially, many bar-
riers and opportunities as well as a wide range of potential impacts
related to the implementation of AFOLU mitigation options (Sections
11.7 and 11.8). Successful mitigation policies need to consider how
to address the multi-functionality of the sector. Furthermore, physi-
cal environmental limitations are central for the implementation of
mitigation options and associated policies (Pretty, 2013). The cost-
effectiveness of different measures is hampered by regional variabil-
ity. National and international agricultural and forest climate policies
have the potential to redefine the opportunity costs of international
land-use in ways that either complement or hinder the attainment
of climate change mitigation goals (Golub etal., 2009). Policy inter-
actions could be synergistic (e. g., research and development invest-
ments and economic incentives for integrated production systems) or
conflicting (e. g., policies promoting land conversion vs. conservation
policies) across the sector (see Table 11.11). Additionally, adequate
policies are needed to orient practices in agriculture and in forestry
toward global sharing of innovative technologies for the efficient use
of land resources to support effective mitigation options (see Table
11.2).
Forty-three countries in total (as of December 2010) have pro-
posed NAMAs to the UNFCCC. Agriculture and forestry activities
were considered as ways to reduce their GHG emissions in 59 and
94 % of the proposed NAMAs. For the least developed countries,
the forestry sector was quoted in all the NAMAs, while the agricul-
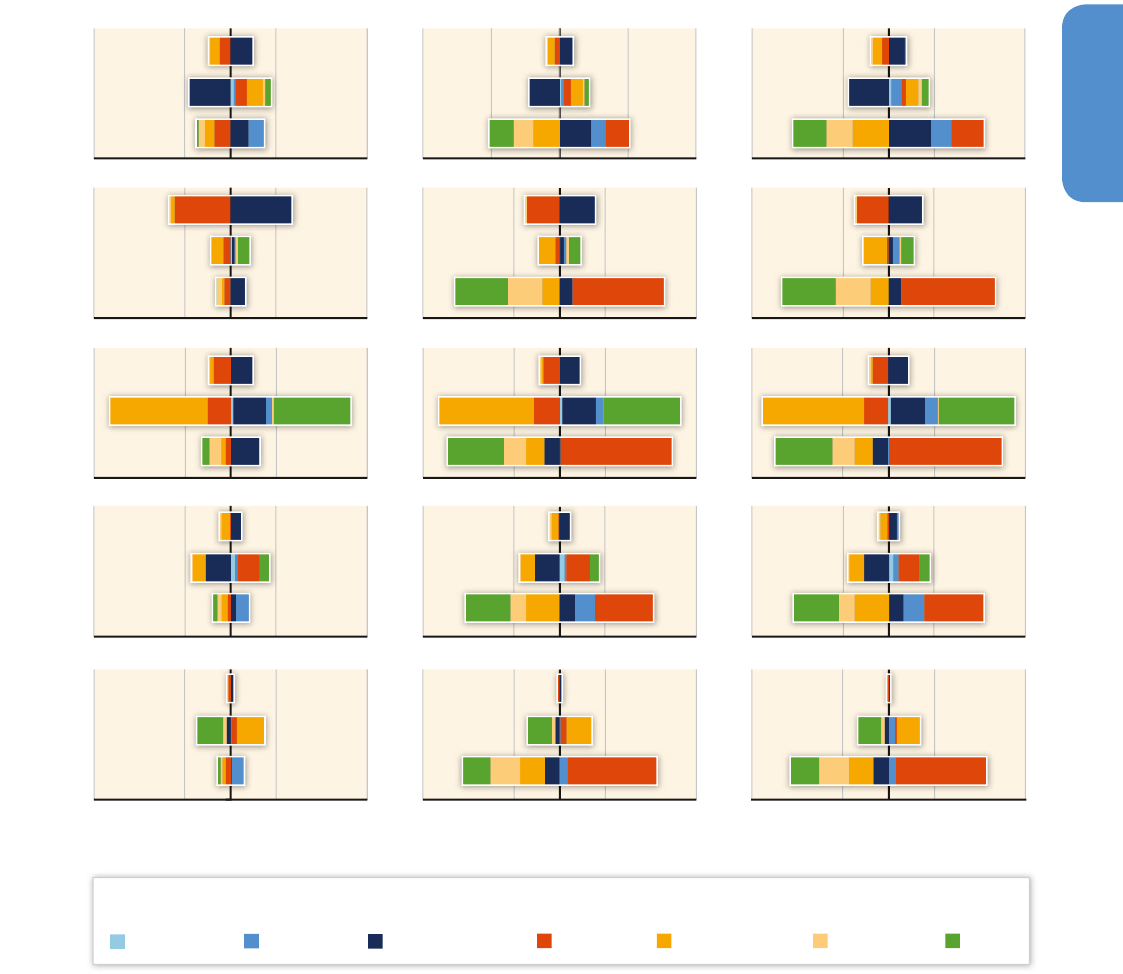
863863
Agriculture, Forestry and Other Land Use (AFOLU)
11
Chapter 11
tural sector was represented in 70 % of the NAMAs (Bockel etal.,
2010). Policies related to the AFOLU sector that affect mitigation are
discussed below according to the instruments through which they
may be implemented (economic incentives, regulatory and control
approaches, information, communication and outreach, research
and development). Economic incentives (e. g., special credit lines for
low-carbon agriculture, sustainable agriculture and forestry prac-
tices, tradable credits, payment for ecosystem services) and regula-
tory approaches (e. g., enforcement of environmental law to reduce
deforestation, set-aside policies, air and water pollution control
reducing nitrate load and N
2
O emissions) have been effective in dif-
ferent cases. Investments in research, development, and diffusion
(e. g., improved fertilizer use efficiency, livestock improvement, better
forestry management practices) could result in positive and synergis-
tic impacts for adaptation and mitigation (Section 11.5). Emphasis
is given to REDD+, considering its development in recent years, and
relevance for the discussion of mitigation policies in the forestry sec-
tor.
Figure 11�19 | Regional land cover change by 2030 from 2005 from three models for baseline (left) and idealized policy implementation 550 ppm CO
2
eq (centre) and 450 ppm
CO
2
eq (right) scenarios. (Popp etal., 2013).
Other arable
Other
Pasture
Energy crops ForestAbandoned
Non-energy crops
450 ppm CO
2
eq550 ppm CO
2
eqBaseline
GCAM
IMAGE
REMIND
-MAgPIE
REMIND
-MAgPIE
REMIND
-MAgPIE
REMIND
-MAgPIE
REMIND
-MAgPIE
ASIA
GCAM
IMAGE
LAM
GCAM
IMAGE
MAF
GCAM
IMAGE
OECD-1990
-300 -100 100 300
GCAM
IMAGE
Million Hectares
EIT
-300 -100 100 300
Million Hectares
-300 -100 100 300
Million Hectares
Type of Land Cover Change

864864
Agriculture, Forestry and Other Land Use (AFOLU)
11
Chapter 11
11�10�1 Economic incentives
Emissions trading: Carbon markets occur under both compliance
schemes and as voluntary programmes. A review of existing offset
programmes was provided by Kollmuss etal. (2010). More details are
also presented in Section 15.5.3. Compliance markets (Kyoto offset
mechanisms, mandatory cap-and-trade systems, and other manda-
tory GHG systems) are created and regulated by mandatory national,
regional, or international carbon reduction regimes (Kollmuss etal.,
2010). The three Kyoto Protocol mechanisms are very important for
the regulatory market: CDM, Joint Implementation (JI) and the Emis-
sions Trading System (ETS). Currently, AFOLU projects in CDM only
include specific types of projects: for agriculture — methane avoid-
ance (manure management), biogas projects, agricultural residues
for biomass energy; for forestry — reforestation and afforestation. By
June 2013, the total number of registered CDM projects was 6989,
0.6 and 2.5 % of this total being related to afforestation / reforestation
and agriculture, respectively (UNFCCC — CDM); therefore, finance
streams coming from A / R CDM Projects are marginal from the global
perspective. An analysis of A / R CDM projects suggests crucial fac-
tors for the performance of these projects are initial funding support,
design, and implementation guided by large organizations with tech-
nical expertise, occurrence on private land (land with secured prop-
erty rights attached), and that most revenue from Certified Emission
Reductions (CERs) is directed back to local communities (Thomas
etal., 2010).
Table 11�11 | Some regional and global programs and partnerships related to illegal logging, forest management and conservation and REDD+.
Programme / Institution / Source Context Objectives and Strategies
Forest Law Enforcement and
Governance (FLEG) /
World Bank /
www. worldbank. org / eapfleg
Illegal logging and lack of appropriate forest governance
are major obstacle to countries to alleviate poverty, to
develop their natural resources and to protect global
and local environmental services and values
Support regional forest law enforcement and governance (FLEG)
Improving Forest Law Enforcement
and Governance in the European
Neighbourhood Policy East Countries
and Russia (ENPI-FLEG) / EU /
www. enpi-fleg. org
Regional cooperation in the European Neighbourhood
Policy Initiative East Countries (Armenia, Azerbaijan,
Belarus, Georgia, Moldova, and Ukraine), and Russia
following up on the St. Petersburg Declaration
Support governments, civil society, and the private sector in participating
countries in the development of sound and sustainable forest management
practices, including reducing the incidence of illegal forestry activities.
Forest Law Enforcement, Governance
and Trade (FLEGT) / European Union /
www. euflegt. efi. int /
Illegal logging has a devastating impact on some of the
world’s most valuable forests. It can have not only serious
environmental, but also economic and social consequences.
Exclude illegal timber from markets, to improve the supply of legal timber and to increase
the demand for responsible wood products. Central elements are trade accords to
ensure legal timber trade and support good forest governance in the partner countries.
There are a number of countries in Africa, Asia, South and Central America currently
negotiating FLEGT Voluntary Partnership Agreements (VPAs) with the European Union.
Program on Forests (PROFOR) / multiple
donors including the European
Union, European countries,
Japan and the World Bank /
www. profor. info
Well-managed forests have the potential to reduce
poverty, spur economic development, and contribute
to a healthy local and global environment
Provide in-depth analysis and technical assistance on key forest questions
related to livelihoods, governance, financing, and cross-sectoral issues. PROFOR
activities comprise analytical and knowledge generating work that support the
strategy’s objectives of enhancing forests‘ contribution to poverty reduction,
sustainable development and the protection of environmental services.
UN-REDD Programme / United Nations /
www. un-redd. org
The UN collaborative initiative on Reducing Emissions from
Deforestation and forest Degradation (REDD) in developing
countries was launched in 2008 and builds on the convening
role and technical expertise of the FAO, UNDP, and the UNEP.
The Programme supports national REDD+ readiness efforts in 46 partner
countries (Africa, Asia-Pacific, and Latin America) through (i) direct support
to the design and implementation of REDD+ National Programmes;
and (ii) complementary support to national REDD+ action (common
approaches, analyses, methodologies, tools, data, and best practices).
REDD+ Partnership / International
effort (50 different countries) /
www. reddpluspartnership. org
The UNFCCC has encouraged the Parties to coordinate their
efforts to reduce emissions from deforestation and forest
degradation. As a response, countries attending the March
2010 International Conference on the Major Forest Basins,
hosted by the Government of France, agreed on the need
to forge a strong international partnership on REDD+.
The REDD+ Partnership serves as an interim platform for its partner countries to
scale up actions and finance for REDD+ initiatives in developing countries (including
improving the effectiveness, efficiency, transparency, and coordination of REDD+
and financial instruments), to facilitate knowledge transfer, capacity enhancement,
mitigation actions and technology development, and transfer among others.
Forest Investment Program
(FIP) / Strategic Climate Fund (a
multi-donor Trust Fund within the
Climate Investment Funds)
www. climateinvestmentfunds. org / cif /
Reduction of deforestation and forest degradation
and promotion of sustainable forest management,
leading to emission reductions and the
protection of carbon terrestrial sinks.
Support developing countries’ efforts to REDD and promote sustainable
forest management by providing scaled-up financing to developing
countries for readiness reforms and public and private investments,
identified through national REDD readiness or equivalent strategies.
Forest Carbon Partnership
(FCPF) / World Bank /
www. forestcarbonpartnership. org
Assistance to developing countries to implement
REDD+ by providing value to standing forests.
Builds the capacity of developing countries to reduce emissions from deforestation
and forest degradation and to tap into any future system of REDD+.
Indonesia-Australia Forest
Carbon Partnership /
www. iafcp. or. id
Australia’s assistance on climate change and builds on long-
term practical cooperation between Indonesia and Australia.
The Partnership supports strategic policy dialogue on climate change,
the development of Indonesia‘s National Carbon Accounting System,
and implementing demonstration activities in Central Kalimantan.

865865
Agriculture, Forestry and Other Land Use (AFOLU)
11
Chapter 11
There are compliance schemes outside the scope of the Kyoto Proto-
col, but these are carried out exclusively at the national level, with no
relation to the Protocol. In 2011, Australia started the Carbon Farming
Initiative (CFI) that allows farmers and investors to generate tradable
carbon offsets from farmland and forestry projects. This followed sev-
eral years of state-based and voluntary activity that resulted in 65,000
ha of A / R projects (Mitchell etal., 2012). Another example is The West-
ern Arnhem Land Fire Abatement Project (WALFA), a fire management
project in Australia initiated in 2006 that produces a tradable carbon
offset through the application of improved fire management using tra-
ditional management practices of indigenous land owners (Whitehead
etal., 2008; Bradstock etal., 2012). Alberta’s offset credit system is
a compliance mechanism for entities regulated under the province’s
mandatory GHG emission intensity-based regulatory system (Koll-
muss etal., 2010). In the case of N
2
O emissions from agriculture, the
Alberta Quantification Protocol for Agricultural N
2
O Emissions Reduc-
tions issues C offset credits for on-farm reductions of N
2
O emissions
and fuel use associated with the management of fertilizer, manure, and
crop residues for each crop type grown. Other N
2
O emission reduction
protocols (e. g., Millar etal., 2010) are being considered for the Veri-
fied Carbon Standard, the American Carbon Registry, and the Climate
Action Reserve (Robertson etal., 2013).
Agriculture and Forestry activities are not covered by the European
Union Emissions Trading Scheme (EU ETS), which is by far the largest
existing carbon market. Forestry entered the New Zealand Kyoto Pro-
tocol compliant ETS in 2008, and mandatory reporting for agriculture
began in 2012, although full entry of agriculture into the scheme has
been delayed indefinitely. Agricultural participants include meat pro-
cessors, dairy processors, nitrogen fertilizer manufacturers and import-
ers, and live animal exporters, although some exemptions apply (Gov-
ernment of New Zealand). California’s Cap-and-Trade Regulation took
effect on January 1, 2012, with amendments to the Regulation effec-
tive September 1, 2012. The enforceable compliance obligation began
on January 1, 2013. Four types of projects were approved as eligible
to generate carbon credits to regulated emitters in California: avoid-
ance of methane emissions from installation of anaerobic digesters on
farms, carbon sequestration in urban and rural forestry, and destruc-
tion of ozone depleting substances (California Environmental Protec-
tion Agency).
Voluntary carbon markets operate outside of the compliance markets.
By enabling businesses, governments, non-governmental organizations
(NGOs), and individuals to purchase offsets that were created either
in the voluntary market or through the CDM, they can offset their
emissions (Verified or Voluntary Emissions Reductions (VERs)). The vol-
untary offset market includes a wide range of programmes, entities,
standards, and protocols (e. g., Community & Biodiversity Standards,
Gold Standard, Plan Vivo among others) to improve the quality and
credibility of voluntary offsets. The most common incentives for the
quantity buyers of carbon credits in the private sector are corporate
social responsibility and public relations. Forest projects are increas-
ing in the voluntary markets. Transactions of carbon credits from this
sector totalled 133 million USD in 2010, 95 % of them in voluntary
markets (Peters-Stanley etal., 2011).
Reducing emissions from deforestation; reducing emissions from forest
degradation; conservation of forest carbon stocks; sustainable man-
agement of forests; and enhancement of forest carbon stocks (REDD+):
REDD+ consists of forest-related activities implemented voluntarily by
developing countries that may, in isolation or jointly lead to significant
climate change mitigation
10
. REDD+ was introduced in the agenda of
the UNFCCC in 2005, and has since evolved to an improved under-
standing of the potential positive and negative impacts, methodologi-
cal issues, safeguards, and financial aspects associated with REDD+
implementation. Here, we first address the REDD+ discussions under
the UNFCCC, but also introduce other REDD+-related initiatives. The
novel aspects of REDD+ under the Convention, relative to previous
forest-related mitigation efforts by developing countries under the
UNFCCC are its national and broader coverage, in contrast to project-
based mitigation activities
11
(e. g., under the CDM of the Kyoto Proto-
col). Its main innovation is its results-based approach, in which pay-
ments are done ex post in relation to a mitigation outcome already
achieved, as opposed to project-based activities, where financing is
provided ex ante in relation to expected outcomes. A phased approach
to REDD+ was agreed at the UNFCCC, building from the develop-
ment of national strategies or action plans, policies and measures,
and evolving into results-based actions that should be fully measured,
reported, and verified — MRV (UNFCCC Dec. 1 / 16). REDD+ payments
are expected for results-based actions, and although the UNFCCC has
already identified potential ways to pay for these
12
, the financing archi-
tecture for the REDD+ mechanism is still under negotiation under the
UNFCCC.
Meanwhile, and as a result to the explicit request from the UNFCCC for
early actions in REDD+, different regional and global programmes and
partnerships address forest management and conservation and readi-
ness for REDD+ (Table 11.11), while some REDD+ strategies have
started in countries with significant forest cover (see Box 11.7 for
examples). Initiatives include multilateral activities (e. g., UN-REDD
10
Decision 1 / CP.16 (FCCC / CP / 2010 / 7 / Add.1 , paragraph 70) “Encourages
developing countries to contribute to mitigation actions in the forest sector by
undertaking the following activities, as deemed appropriate by each Party and in
accordance with their respective capabilities and national circumstances — reduc-
ing emissions from deforestation; reducing emissions from forest degradation;
conservation of forest carbon stocks; sustainable management of forests; and
enhancement of forest carbon stocks”.
11
Decision 1 / CP.16 (FCCC / CP / 2010 / 7 / Add.1 , paragraph 73) “Decides that the
activities undertaken by Parties referred to in paragraph 70 above should be
implemented in phases, beginning with the development of national strategies
or action plans, policies and measures, and capacity-building, followed by the
implementation of national policies and measures and national strategies or
action plans that could involve further capacity-building, technology development
and transfer and results-based demonstration activities, and evolving into results-
based actions that should be fully measured, reported and verified”.
12
Decision 2 / CP.17 (FCCC / CP / 2011 / 9 / Add.1, paragraph 65) “Agrees that results-
based finance provided to developing country Parties that is new, additional and
predictable may come from a wide variety of sources, public and private, bilateral
and multilateral, including alternative sources”.

866866
Agriculture, Forestry and Other Land Use (AFOLU)
11
Chapter 11
Programme, Forest Carbon Partnership Facility, Forest Investment Pro-
gram), bilateral activities (e. g., Tanzania-Norway, Indonesia-Norway),
country driven initiatives (in addition to 16 UN-REDD Programme
countries, the Programme also supports 31 other partner countries
across Africa, Asia-Pacific, and Latin America and the Caribbean; UN-
REDD Programme — Support to Partner Countries).
REDD+ can be a very cost-effective option for mitigating climate change
and could supply a large share of global abatement of emissions from
the AFOLU sector from the extensive margin of forestry, especially
through reducing deforestation in tropical regions (Golub etal., 2009).
Issues of concern for REDD+ implementation have been captured under
REDD+ safeguards in line with the UNFCCC Cancun Agreement. To
respond to the requirements outlined in the UNFCCC agreement, a num-
ber of steps need to be considered in the development of country-level
safeguard information systems for REDD+ including defining social and
environmental objectives, assessing potential benefits and risks from
REDD+, assessing current safeguard systems, drafting a strategic plan or
policy, and establishing a governance system.
A growing body of literature has analyzed different aspects related to
the implementation, effectiveness, and scale of REDD+, as well as the
interactions with other social and environmental co-benefits (e. g.,
Angelsen etal., 2008; Levin etal., 2008; Larson, 2011; Gardner etal.,
2012). Results-based REDD+ actions, which are entitled to results-
based finance, require internationally agreed rules for MRV. Measur-
ing and monitoring the results will most likely rely on a combination of
remotely-sensed data with ground-based inventories. The design of a
REDD policy framework (and specifically its rules) can have a significant
impact on monitoring costs (Angelsen etal., 2008; Böttcher etal., 2009).
Forest governance is another central aspect in recent studies, including
debate on decentralization of forest management, logging concessions
in public-owned commercially valuable forests, and timber certifica-
tion, primarily in temperate forests (Agrawal etal., 2008). Although the
majority of forests continue to be formally owned by governments, there
are indications that the effectiveness of forest governance is increas-
ingly independent of formal ownership (Agrawal etal., 2008). However,
there are widespread concerns that REDD+ will increase costs on forest-
dependent peoples and in this context, stakeholders rights, including
rights to continue sustainable traditional land-use practices, appear as a
precondition for REDD development (Phelps etal., 2010b).
Some studies have addressed the potential displacement of emissions,
i. e., a reduction of emissions in one place resulting in an increase
of emissions elsewhere (or leakage) (Santilli et al., 2005; Forner
etal., 2006; Nabuurs etal., 2007; Strassburg etal., 2008, 2009; Sec-
tion 11.3.2). The national coverage of REDD+ might ameliorate the
issue of emissions displacement, a major drawback of project-based
approaches (Herold and Skutsch, 2011). To minimize transnational dis-
placement of emissions, REDD+ needs to stimulate the largest number
of developing countries to engage voluntarily. There are also concerns
about the impacts of REDD+ design and implementation options on
biodiversity conservation, as areas of high C content and high biodi-
versity are not necessarily coincident. Some aspects of REDD+ imple-
mentation that might affect biodiversity include site selection, man-
agement strategies, and stakeholder engagement (Harvey etal., 2010).
From a conservation biology perspective, it is also relevant where
the displacement occurs, as deforestation and exploitation of natural
Box 11�7 | Examples of REDD+ initiatives at national scale in different regions with significant
extension of forest cover
Amazon Fund: The Amazon Fund in Brazil was officially cre-
ated in 2008 by a presidential decree. The Brazilian Development
Bank (BNDES) was given the responsibility of managing it. The
Norwegian government played a key role in creating the fund by
donating funds to the initiative in 2009. Since then, the Amazon
Fund has received funds from two more donors: the Federal
Republic of Germany and Petrobrás, Brazil’s largest oil company.
As of February 2013, 1.03 billion USD has been pledged, with 227
million USD approved for activities (Amazon Fund).
UN-REDD Democratic Republic of Congo: The Congo Basin
rainforests are the second largest after Amazonia. In 2009,
Democratic Republic of the Congo (DRC), with support of UN-
REDD Programme and Forest Carbon Partnership Facility (FCPC),
started planning the implementation stages of REDD+ readiness.
The initial DRC National Programme transitioned into the full
National Programme (Readiness Plan) after it was approved by
the UN-REDD Programme Policy Board in 2010 (UN-REDD Pro-
gramme). The budget comprises 5.5 million USD
2010
and timeframe
is 2010 – 2013.
Indonesia-Norway REDD+ Partnership: In 2010, the Indo-
nesia-Norway REDD+ Partnership was established through an
agreement between governments of the two countries. The
objective was to ‘support Indonesia’s efforts to reduce emissions
from deforestation and degradation of forests and peatlands.
Indonesia agreed to take systematic and decisive action to
reduce its forest and peat-related GHG emissions, whereas Nor-
way agreed to support those efforts by making available up to
1 billion USD
2010
, exclusively on a payment-for-results basis over
the next few years’ (UN-REDD Programme). In 2013, Indonesia’s
government has extended the moratorium on new forest conces-
sions for a further two years, protecting an additional 14.5 Mha
of forest.

867867
Agriculture, Forestry and Other Land Use (AFOLU)
11
Chapter 11
resources could move from areas of low conservation value to those of
higher conservation value, or to other natural ecosystems, threatening
species native to these ecosystems (Harvey etal., 2010). Additionally,
transnational displacement could cause deforestation to move into
relatively intact areas of high biodiversity value, or into countries that
currently have little deforestation (Putz and Redford, 2009).
Taxes, charges, subsidies: Financial regulations are another approach
to pollution control. A range of instruments can be used: pollution
charges, taxes on emission, taxes on inputs, and subsidies (Jakobsson
etal., 2002). Nitrogen taxes are one possible instrument, since agri-
cultural emissions of N
2
O mainly derive from the use of nitrogenous
fertilizers. An analysis of the tax on the nitrogen content of synthetic
fertilizers in Sweden indicated that direct N
2
O emissions from agri-
cultural soils in Sweden (the tax abolished in 2010) would have been
on average 160 tons or 2 % higher without the tax (Mohlin, 2013).
Additionally, the study showed that removal of the N tax could com-
pletely counteract the decreases in CO
2
emissions expected from
the future tax increase on agricultural CO
2
. The mitigation potential
of GHG-weighted consumption taxes on animal food products was
estimated for the EU using a model of food consumption (Wirsenius
etal., 2011). A 7 % reduction of current GHG emission in European
Union (EU) agriculture was estimated with a GHG-weighted tax on
animal food products of 79 USD
2010
/ tCO
2
eq (60 EUR
2010
/ tCO
2
eq). Low-
interest loans can also support the transition to sustainable agricul-
tural practices as currently implemented in Brazil, the second largest
food exporter, through the national programme (launched in 2010;
Plano ABC).
11�10�2 Regulatory and control approaches
Deforestation control and land planning (protected areas and land
sparing / set-aside policies): The rate of deforestation in the tropics and
relative contribution to anthropogenic carbon emissions has been
declining (Houghton, 2012; see Section 11.2 for details). Public policies
have had a significant impact by reducing deforestation rates in some
tropical countries (see, e. g., Box 11.8).
Since agricultural expansion is one of the drivers of deforestation (espe-
cially in tropical regions), one central question is if intensification of
agriculture reduces cultivated areas and results in land sparing by con-
centrating production on other land. Land sparing would allow released
lands to sequester carbon, provide other environmental services, and
protect biodiversity (Fischer etal., 2008). In the United States, over 13
Mha of former cropland are enrolled in the US Conservation Reserve
Program (CRP), with biodiversity, water quality, and carbon sequestra-
tion benefits (Gelfand etal., 2011). In 1999, China launched the Grain
for Green Program or Sloping Land Conversion Program as a national
measure to increase vegetation cover and reduce erosion. Cropland and
barren land were targeted and over 20 Mha of land were converted into
mostly tree-based plantations. Over its first 10 years between ~800 to
1700 MtCO
2
eq (Moberg, 2011) were sequestered.
Environmental regulation (GHG and their precursors emissions con-
trol): In many developed countries, environmental concerns related
to water and air pollution since the mid-1990s led to the adoption of
laws and regulations that now mandate improved agricultural nutrient
management planning (Jakobsson etal., 2002). Some policy initiatives
deal indirectly with N leakages and thus promote the reduction of N
2
O
emissions. The EU Nitrates Directive (1991) sets limits on the use of fer-
tilizer N and animal manure N in nitrate-vulnerable zones. Across the
27 EU Member States, 39.6 % of territory is subject to related action
programmes. However, in terms of the effectiveness of environmen-
tal policies and agriculture, there has been considerable progress in
controlling point pollution, but efforts to control non-point pollution of
nutrients have been less successful, and potential synergies from vari-
ous soil-management strategies could be better exploited. Emission
targets for the AFOLU sector were also introduced by different coun-
tries (e. g., Climate Change Acts in UK and Scotland; European Union).
Bioenergy targets: Many countries worldwide, by 2012, have set tar-
gets or mandates or both for bioenergy, to deliver to multiple policy
objectives, such as climate change mitigation, energy security, and
rural development. The bulk of mandates continue to come from the
EU-27 but 13 countries in the Americas, 12 in Asia-Pacific, and 8 in
Africa have mandates or targets in place (Petersen, 2008; www.
biofuelsdigest. com). For the sustainability of biofuels implementation,
land-use planning and governance are central (Tilman etal., 2009), as
related policy and legislation, e. g., in agriculture, forestry, environment
and trade, can strongly influence the development of bioenergy pro-
grammes (Jull etal., 2007). A recent study analyzed the consequences
of renewable targets of EU member states on the CO
2
sink of EU for-
ests, and indicated a decrease in the forest sink by 4 – 11 % (Böttcher
etal., 2012). Another possible tradeoff of biofuel targets is related to
international trade. Global trade in biofuels might have a major impact
on other commodity markets (e. g., vegetable oils or animal fodder)
and has already caused a number of trade disputes, because of subsi-
dies and non-tariff barriers (Oosterveer and Mol, 2010).
Box 11�8 | Deforestation control in Brazil
The Brazilian Action Plan for the Prevention and Control of
Deforestation in the Legal Amazon (PPCDAm) includes coor-
dinated efforts among federal, state, and municipal govern-
ments, and civil organizations, remote-sensing monitoring,
significant increase of new protected areas (Soares-Filho
etal., 2010), and combination of economic and regulatory
approaches. For example, since 2008 federal government
imposed sanctions to municipalities with very high deforesta-
tion rates, subsidies were cut and new credit policies made
rural credit dependent on compliance with environmental
legislation (Macedo etal., 2012; Nolte etal., 2013).

868868
Agriculture, Forestry and Other Land Use (AFOLU)
11
Chapter 11
11�10�3 Information schemes
Acceptability by land managers and practicability of mitigation mea-
sures (Table 11.2) need to be considered, because the efficiency of a
policy is determined by the cost of achieving a given goal (Sections
11.4.5; 11.7). Therefore, costs related to education and communica-
tion of policies should be taken into account (Jakobsson etal., 2002).
Organizations created to foster the use of science in environmental
policy, management, and education can facilitate the flow of informa-
tion from science to society, increasing awareness of environmental
problems (Osmond etal., 2010). In the agriculture sector, non-profit
conservation organizations (e. g., The Sustainable Agriculture Network
(SAN)) and governments (e. g., Farming for a Better Climate, Scotland)
promote the social and environmental sustainability of activities by
developing standards and educational campaigns.
Certification schemes also support sustainable agricultural practices
(Sections 11.4.5; 11.7). Climate-friendly criteria reinforce existing cer-
tification criteria and provide additional value. Different certification
systems also consider improvements in forest management, reduced
deforestation and carbon uptake by regrowth, reforestation, agrofor-
estry, and sustainable agriculture. In the last 20 years, forest certifica-
tion has been developed as an instrument for promoting sustainable
forest management. Certification schemes encompass all forest types,
but there is a concentration in temperate forests (Durst etal., 2006).
Approximately 8 % of global forest area has been certified under a
variety of schemes and 25 % of global industrial roundwood comes
from certified forests (FAO, 2009b). Less than 2 % of forest area in
African, Asian, and tropical American forests are certified, and most
certified forests (82 %) are large and managed by the private sector
(ITTO, 2008). In the forestry sector, many governments have worked
towards a common understanding of sustainable forest management
(Auld et al., 2008). Certification bodies certify that farms or groups
comply with standards and policies (e. g., Rainforest Alliance Certified).
In some, specific voluntary climate change adaptation and mitigation
criteria are included.
Forest certification as an instrument to promote sustainable forest
management (SFM) and biodiversity maintenance was evaluated by
(Rametsteiner and Simula, 2003) they indicated that standards used
for issuing certificates upon compliance are diverse, but often include
elements that set higher than minimum standards.
Further, independent audits are an incentive for improving forest
management. In spite of many difficulties, forest certification was
considered successful in raising awareness, disseminating knowledge
on the SFM concept worldwide, and providing a tool for a range of
applications other than the assessment of sustainability, e. g., verify-
ing carbon sinks. Another evaluation of certification schemes for con-
serving biodiversity (Harvey etal., 2008) indicated some constraints
that probably also apply to climate-friendly certification: weakness
of compliance or enforcement of standards, transaction costs and
paperwork often limit participation, and incentives are insufficient to
attract high levels of participation. Biofuel certification is a specific
case as there are multiple actors and several successive segments
of biofuel production pathways: feedstock production, conversion of
the feedstock to biofuels, wholesale trade, retail, and use of biofuels
in engines (Gnansounou, 2011). Because of the length and the com-
plexity of biofuel supply chains assessing sustainability is challenging
(Kaphengst etal., 2009).
11�10�4 Voluntary actions and agreements
Innovative agricultural practices and technologies can play a central
role in climate change mitigation and adaptation, with policy and insti-
tutional changes needed to encourage the innovation and diffusion of
these practices and technologies to developing countries. Under the
UNFCCC, the 2007 Bali Action Plan identified technology development
and transfer as a priority area. A Technology Mechanism was estab-
lished by Parties at the COP16 in 2010 “to facilitate the implementation
of enhanced action on technology development and transfer, to sup-
port action on mitigation and adaptation, in order to achieve the full
implementation of the Convention” (UNFCCC). For agriculture, Burney
etal., (2010) indicated that investment in yield improvements compared
favourably with other commonly proposed mitigation strategies.
Additionally, adaptation measures in agriculture can also generate
significant mitigation effects. Lobell et al. (2013) investigated the
co-benefits of adaptation measures on farm level that reduced GHG
emissions from LUC. The study focused on investments in research
for developing and deploying new technologies (e. g., disease-resis-
tant or drought-tolerant crops, or soil-management techniques). It
concluded that broad-based efforts to adapt agriculture to climate
change have mitigation co-benefits that are associated with lower
costs than many activities focusing on mitigation, especially in devel-
oped countries.
11.11 Gaps in knowledge
and data
Data and knowledge gaps include:
• Improved global high-resolution data sets of crop production
systems (including crop rotations, variety selection, fertilization
practices, and tillage practices), grazing areas (including quality,
intensity of use, management), and freshwater fisheries and aqua-
culture, also comprising subsistence farming.
• Globally standardized and homogenized data on soil as well as
forest degradation and a better understanding of the effects of
degradation on carbon balances and productivity.

869869
Agriculture, Forestry and Other Land Use (AFOLU)
11
Chapter 11
• Improved understanding of the mitigation potential, interplay, and
costs as well as environmental and socio-economic consequences
of land use-based mitigation options such as improved agricul-
tural management, forest conservation, bioenergy production, and
afforestation on the national, regional, and global scale.
• Better understanding of the effect of changes in climate param-
eters, rising CO
2
concentrations and N deposition on productivity
and carbon stocks of different types of ecosystems, and the related
consequences for land-based climate change mitigation potentials.
11.12 Frequently Asked
Questions
FAQ 11�1 How much does AFOLU contribute
to GHG emissions and how is this
changing?
Agriculture and land-use change, mainly deforestation of tropical for-
ests, contribute greatly to anthropogenic greenhouse gas emissions
and are expected to remain important during the 21st century. Annual
GHG emissions (mainly CH
4
and N
2
O) from agricultural production in
2000 – 2010 were estimated at 5.0 – 5.8 GtCO
2
eq / yr, comprising about
10 – 12 % of global anthropogenic emissions. Annual GHG flux from
land use and land-use change activities accounted for approximately
4.3 – 5.5 GtCO
2
eq / yr, or about 9 – 11 % of total anthropogenic green-
house gas emissions. The total contribution of the AFOLU sector to
anthropogenic emissions is therefore around one quarter of the global
anthropogenic total.
FAQ 11�2 How will mitigation actions in AFOLU
affect GHG emissions over different
timescales?
There are many mitigation options in the AFOLU sector that are already
being implemented, e. g., afforestation, reducing deforestation, crop-
land and grazing land management, fire management, and improved
livestock breeds and diets. These can be implemented now. Others
(such as some forms of biotechnology and livestock dietary additives)
are still in development and may not be applicable for a number of
years. In terms of the mode of action of the options, in common with
other sectors, non-CO
2
greenhouse gas emission reduction is immedi-
ate and permanent. However, a large portion of the mitigation poten-
tial in the AFOLU sector is carbon sequestration in soils and vegetation.
This mitigation potential differs, in that the options are time-limited
(the potential saturates), and the enhanced carbon stocks created are
reversible and non-permanent. There is, therefore, a significant time
component in the realization and the duration of much of the mitiga-
tion potential available in the AFOLU sector.
FAQ 11�3 What is the potential of the main
mitigation options in AFOLU for
reducing GHG emissions?
In general, available top-down estimates of costs and potentials sug-
gest that AFOLU mitigation will be an important part of a global cost-
effective abatement strategy. However, potentials and costs of these
mitigation options differ greatly by activity, regions, system boundaries,
and the time horizon. Especially, forestry mitigation options — includ-
ing reduced deforestation, forest management, afforestation, and
agro-forestry — are estimated to contribute 0.2 – 13.8 GtCO
2
/ yr of
economically viable abatement in 2030 at carbon prices up to 100
USD / tCO
2
eq. Global economic mitigation potentials in agriculture in
2030 are estimated to be up to 0.5 – 10.6 GtCO
2
eq / yr. Besides supply-
side-based mitigation, demand-side mitigation options can have a sig-
nificant impact on GHG emissions from food production. Changes in
diet towards plant-based and hence less GHG-intensive food can result
in GHG emission savings of 0.7 – 7.3 GtCO
2
eq / yr in 2050, depending
on which GHGs and diets are considered. Reducing food losses and
waste in the supply chain from harvest to consumption can reduce
GHG emissions by 0.6 – 6.0 GtCO
2
eq / yr.
FAQ 11�4 Are there any co-benefits associated
with mitigation actions in AFOLU?
In several cases, the implementation of AFOLU mitigation measures
may result in an improvement in land management and there-
fore have socio-economic, health, and environmental benefits: For
example, reducing deforestation, reforestation, and afforestation
can improve local climatic conditions, water quality, biodiversity
conservation, and help to restore degraded or abandoned land. Soil
management to increase soil carbon sequestration may also reduce
the amount of wind and water erosion due to an increase in surface
cover. Further considerations on economic co-benefits are related to
the access to carbon payments either within or outside the UNFCCC
agreements and new income opportunities especially in developing
countries (particularly for labour-intensive mitigation options such as
afforestation).
FAQ 11�5 What are the barriers to reducing
emissions in AFOLU and how can these
be overcome?
There are many barriers to emission reduction. Firstly, mitigation prac-
tices may not be implemented for economic reasons (e. g., market
failures, need for capital investment to realize recurrent savings), or a

870870
Agriculture, Forestry and Other Land Use (AFOLU)
11
Chapter 11
range of factors including risk-related, political / bureaucratic, logistical,
and educational / societal barriers. Technological barriers can be over-
come by research and development; logistical and political / bureau-
cratic barriers can be overcome by better governance and institutions;
education barriers can be overcome through better education and
extension networks; and risk-related barriers can be overcome, for
example, through clarification of land tenure uncertainties.
11.13 Appendix Bioenergy:
Climate effects,
mitigation options,
potential and sustain-
ability implications
11�13�1 Introduction
SRREN (IPCC, 2011) provided a comprehensive overview on bioenergy
(Chum etal., 2011). However, a specific bioenergy Appendix in the
context of the WGIII AR5 contribution is necessary because (1) many
of the more stringent mitigation scenarios (resulting in 450 ppm, but
also 550 ppm CO
2
eq concentration by 2100, see Section 11.9.1) heav-
ily rely on a large-scale deployment of bioenergy with carbon dioxide
capture and storage (BECCS); (2) there has been a large body of lit-
erature published since SRREN, which complements and updates the
analysis presented in this last report; (3) bioenergy is important for
many chapters (Chapters 6; 7; 8; 10; 11), which makes it more use-
ful to treat it in a single section instead of in many scattered chapter
sections throughout the report. Chapter 11 is the appropriate location
for the Appendix, as bioenergy analysis relies crucially on land-use
assessments.
Bioenergy is energy derived from biomass, which can be deployed
as solid, liquid, and gaseous fuels for a wide range of uses, includ-
ing transport, heating, electricity production, and cooking (Chum etal.,
2011). Bioenergy has a significant mitigation potential, but there are
issues to consider, such as the sustainability of practices and the effi-
ciency of bioenergy systems (Chum etal., 2011). Bioenergy systems can
cause both positive and negative effects and their deployment needs
to balance a range of environmental, social, and economic objectives
that are not always fully compatible. The consequences of bioenergy
implementation depend on (1) the technology used; (2) the location,
scales, and pace of implementation; (3) the land category used (for-
est, grassland, marginal lands, and crop lands); and (4) the business
models and practices adopted — including how these integrate with or
displace the existing land use.
As an update to the SRREN, this report presents (1) a more fine-grained
assessment of the technical bioenergy potential reflecting diverse per-
spectives in the literature; (2) recent potential estimates on techno-
logical solutions such as BECCS; (3) an in-depth description of differ-
ent lifecycle emission accounting methods and their results; (4) a small
increase in uncertainty on the future economic bioenergy potential; (5)
a comprehensive assessment of diverse livelihood and sustainability
effects of bioenergy deployment, identifying the need for systematic
aggregation.
11�13�2 Technical bioenergy potential
The technical bioenergy potential, also known as the technical pri-
mary biomass potential for bioenergy, is the amount of the theoretical
bioenergy output obtainable by full implementation of demonstrated
technologies or practices (IPCC, 2011). Unfortunately there is no
standard methodology to estimate the technical bioenergy potential,
which leads to diverging estimates. Most of the recent studies estimat-
ing technical bioenergy potentials assume a ‘food / fibre first principle’
and exclude deforestation, eventually resulting in an estimate of the
‘environmentally sustainable bioenergy potential’ when a comprehen-
sive range of environmental constraints is considered (Batidzirai etal.,
2012).
Recently published estimates that are based in this extended defini-
tion of global technical bioenergy potentials in 2050 span a range of
almost three orders of magnitude, from <50 EJ / yr to >1,000 EJ / yr
(Smeets etal., 2007; Field etal., 2008; Haberl etal., 2010; Batidzirai
etal., 2012). For example, Chum etal. reported global technical bioen-
ergy potentials of 50 – 500 EJ / yr for the year 2050 (IPCC, 2011), and the
Global Energy Assessment gave a range of 160 – 270 EJ / yr (Johansson
etal., 2012). The discussion following the publication of these global
reports has not resulted in a consensus on the magnitude of the future
global technical bioenergy potential, but has helped to better under-
stand some of its many structural determinants (Wirsenius etal., 2011;
Berndes, 2012; Erb et al., 2012a). How much biomass for energy is
technically available in the future depends on the evolution of a mul-
titude of social, political, and economic factors, e. g., land tenure and
regulation, trade, and technology (Dornburg etal., 2010).
Figure 11.20 shows estimates of the global technical bioenergy poten-
tial in 2050 by resource categories. Ranges were obtained from assess-
ing a large number of studies based on a food / fibre first principle and
various restrictions regarding resource limitations and environmental
concerns but no explicit cost considerations (Hoogwijk et al., 2005;
Smeets etal., 2007; Smeets and Faaij, 2007; van Vuuren etal., 2009;
Hakala etal., 2009; Dornburg etal., 2010; Haberl etal., 2010, 2011a;
Gregg and Smith, 2010; Chum etal., 2011; GEA, 2012; Rogner etal.,
2012). Most studies agree that the technical bioenergy potential in
2050 is at least approximately 100 EJ / yr with some modelling assump-
tions leading to estimates exceeding 500 EJ / yr (Smeets etal., 2007). As
stated, different views about sustainability and socio-ecological con-
straints lead to very different estimates, with some studies reporting
much lower figures.
871871
Agriculture, Forestry and Other Land Use (AFOLU)
11
Chapter 11
As shown in Figure 11.20, the total technical bioenergy potential is
composed of several resource categories that differ in terms of their
absolute potential, the span of the ranges — which also reflect the
relative agreement / disagreement in the literature — and the implica-
tions of utilizing them. Regional differences — which are not addressed
here — are also important as the relative size of each biomass resource
within the total potential and its absolute magnitude vary widely
across countries and world regions.
Forest and Agriculture residues� Forest residues (Smeets and Faaij,
2007; Smeets etal., 2007; Dornburg etal., 2010; Haberl etal., 2010;
Gregg and Smith, 2010; Rogner etal., 2012) include residues from silvi-
cultural thinning and logging; wood processing residues such as saw-
dust, bark, and black liquor; and dead wood from natural disturbances,
such as storms and insect outbreaks (irregular source). The use of these
resources is in general beneficial and any adverse side-effects can be
mitigated by controlling residue removal rates considering biodiversity,
climate, topography, and soil factors. There is a near-term tradeoff, par-
ticularly within temperate and boreal regions, in that organic matter
retains organic C for longer if residues are left to decompose slowly
instead of being used for energy. Agricultural residues (Smeets etal.,
2007; Hakala etal., 2009; Haberl etal., 2010, 2011a; Gregg and Smith,
2010; Chum etal., 2011; Rogner etal., 2012) include manure, harvest
residues (e. g., straw), and processing residues (e. g., rice husks from
rice milling) and are also in general beneficial. However, mitigating
potential adverse side-effects — such as the loss of soil C — associated
to harvesting agriculture residues is more complex as they depend on
the different crops, climate, and soil conditions (Kochsiek and Knops,
2012; Repo etal., 2012). Alternative uses of residues (bedding, use
as fertilizer) need to be considered. Residues have varying collection
and processing costs (in both agriculture and forestry) depending on
residue quality and dispersal, with secondary residues often having the
benefits of not being dispersed and having relatively constant qual-
ity. Densification and storage technologies would enable cost-effective
collections over larger areas. Optimization of crop rotation for food
and bioenergy output and the use of residues in biogas plants may
result in higher bioenergy yields from residues without food-energy
competition.
Optimal forest harvesting is defined as the fraction of sustainable
harvest levels (often set equal to net annual increment) in forests
available for wood extraction, which is additional to the projected bio-
mass demand for producing other forest products. This includes both
biomass suitable for other uses (e. g., pulp and paper production) and
biomass that is not used commercially (Smeets and Faaij, 2007; Chum
etal., 2011). The resource potential depends on both environmental
and socio-economic factors. For example, the change in forest man-
agement and harvesting regimes due to bioenergy demand depends
on forest ownership and the structure of the associated forest indus-
try. Also, the forest productivity — and C stock — response to changes
in forest management and harvesting depends on the character of
the forest ecosystem, as shaped by historic forest management and
events such as fires, storms, and insect outbreaks, but also on the
management scheme (e. g., including replanting after harvest, soil
protection, recycling of nutrients, and soil types (Jonker etal., 2013;
Lamers etal., 2013). In particular, optimizing forest management for
mitigation is a complex issue with many uncertainties and still sub-
ject to scientific debate. Intensive forest management activities of the
early- to mid-twentieth century as well as other factors such as recov-
ery from past overuse, have led to strong forest C sinks in many OECD
regions (Pan etal., 2011; Loudermilk etal., 2013; Nabuurs etal., 2013;
Erb etal., 2013). However, the capacity of these sinks is being reduced
as forests approach saturation (Smith, 2005; Körner, 2006; Guldea
etal., 2008; Nabuurs etal., 2013; Sections 11.2.3, 11.3.2). Active for-
est management, including management for bioenergy, is therefore
important for sustaining the strength of the forest carbon sink well
into the future (Nabuurs etal., 2007, 2013; Canadell and Raupach,
2008; Ciais etal., 2008), although countries should realize that for
some old forest areas, conserving carbon stocks may be preferential,
and that the actively managed forests may for some time (decades)
act as sources.
Organic wastes include waste from households and restaurants,
discarded wood products such as paper, construction, and demolition
wood waste, and waste waters suitable for anaerobic biogas produc-
tion (Haberl etal., 2010; Gregg and Smith, 2010). Organic waste may
be dispersed and also heterogeneous in quality but the health and
environmental gains from collection and proper management through
Figure 11�20 | Global Technical Bioenergy Potential by main resource category for the
year 2050 | The figure shows the ranges in the estimates by major resource category of
the global technical bioenergy potential. The color grading is intended to show quali-
tatively the degree of agreement in the estimates, from blue (large agreement in the
literature) to purple (medium agreement) to red (small agreement). In addition, reduc-
ing traditional biomass demand by increasing its use efficiency could release the saved
biomass for other energy purposes with large benefits from a sustainable development
perspective.
0
75
25
50
125
100
150
Dedicated
Crops
Forest and
Agriculture
Residues
Industrial
Organic
Residues
Optimal
Forest
Harvesting
Projected
Reduced
Demand of
Traditional
Biomass
Global Primary Biomass Energy Supply [EJ/yr]
Global Bioenergy Use in 2010
High
Medium
Agreement in the Literature
Low
675
872872
Agriculture, Forestry and Other Land Use (AFOLU)
11
Chapter 11
Detailed country studies have estimated the fraction of non-renewable
biomass from traditional bioenergy use to vary widely, e. g., from 1.6 %
for the Democratic Republic of Congo to 73 % for Burundi (CDM-SSC
WG, 2011) with most countries in the range between 10 – 30 % (i. e.,
meaning that 70 – 90 % of total traditional bioenergy use is managed
sustainably). Thus a fraction of the traditional biomass saved through
better technology, should not be used for other energy purposes but
simply not consumed to help restore the local ecosystems.
11�13�3 Bioenergy conversion: technologies and
management practices
Numerous conversion technologies can transform biomass to heat,
power, liquid, and gaseous fuels for use in the residential, industrial,
transport, and power sectors (see Chum etal., 2011; GEA, 2012) for a
comprehensive coverage of each alternative, and Figure 11.21 for the
pathways concerning liquid and gaseous fuels). Since SRREN, the
major advances in the large-scale production of bioenergy include the
increasing use of hybrid biomass-fossil fuel systems. For example, cur-
rent commercial coal and biomass co-combustion technologies are the
lowest-cost technologies for implementing renewable energy policies,
enabled by the large-scale pelletized feedstocks trade (REN21, 2013;
Junginger etal., 2014). Direct biopower use is also increasing commer-
cially on a global scale (REN21, 2013, p.21). In fact, using biomass for
electricity and heat, for example, co-firing of woody biomass with coal
in the near term and large heating systems coupled with networks for
district heating, and biochemical processing of waste biomass, are
among the most cost-efficient and effective biomass applications for
GHG emission reduction in modern pathways (Sterner and Fritsche,
2011).
Integrated gasification combined cycle (IGCC) technologies for co-
production of electricity and liquid fuels from coal and biomass with
higher efficiency than current commercial processes are in demonstra-
tion phase to reduce cost (Williams etal., 2011; GEA, 2012; Larson
etal., 2012). Coupling of biomass and natural gas for fuels is another
option for liquid fuels (Baliban etal., 2013) as the biomass gasification
technology development progresses. Simulations suggest that inte-
grated gasification facilities are technically feasible (with up to 50 %
biomass input; Meerman et al., 2011), and economically attractive
with a CO
2
price of about 66 USD
2010
/ tCO
2
(50 EUR
2010
/ tCO
2
) (Meerman
etal., 2012). Many gasification technology developments around the
world are in pilot, demonstration, operating first commercial scale for
a variety of applications (see examples in Bacovsky etal., 2013; Balan
etal., 2013).
Many pathways and feedstocks (Figure 11.21) can lead to biofuels for
aviation. The development of biofuel standards started and enabled
testing of 50 % biofuel in jet fuel for commercial domestic and trans-
atlantic flights by consortia of governments, aviation industry, and
associations (IEA, 2010; REN21, 2013). Advanced ‘drop in’ fuels, such
as iso-butanol, synthetic aviation kerosene from biomass gasification
Figure 11�21 | Production pathways to liquid and gaseous fuels from biomass and, for comparison from fossil fuels (adapted from GEA, 2012; Turkenburg etal., 2012).
LPG
Jet
Fuel
Petrol Diesel
CNG,
LNG
H₂
Coal
Lignocellulosic
Biomass
Sugar and
Starch Crops
Oil Crops
Hydrolysis
Anaerobic
Digestion
(Biogas)
Extraction
Esterification
Gasification Pyrolysis
Synthesis
Chemical or
Bio Refining
Fossil Fuels Biomass
Fermentation
Re-
newable
Diesel
Refining
Ethanol
Butanol
FTL
DME MeOH
Drop-in
Biofuels
Biodiesel
Mixed
Alcohols
Hydro
Thermal
Upgrade
Wet Biomass
Refining
Blending
Crude Oil Natural Gas
Developing Technologies
Commercial Technologies
combustion or anaerobic digestion can be significant. Competition
with alternative uses of the wastes may limit this resource potential.
Dedicated biomass plantations include annual (cereals, oil, and
sugar crops) and perennial plants (e. g., switchgrass, Miscanthus) and
tree plantations (both coppice and single-stem plantations (e. g., wil-
low, poplar, eucalyptus, pine; (Hoogwijk et al., 2005, 2009; Smeets
etal., 2007; van Vuuren etal., 2009; Dornburg etal., 2010; Wicke etal.,
2011b; Haberl etal., 2011a). The range of estimates of technical bio-
energy potentials from that resource in 2050 is particularly large (<50
to > 500 EJ / yr). Technical bioenergy potentials from dedicated bio-
mass plantations are generally calculated by multiplying (1) the area
deemed available for energy crops by (2) the yield per unit area and
year (Batidzirai etal., 2012; Coelho etal., 2012). Some studies have
identified a sizable technical potential (up to 100 EJ) for bioenergy pro-
duction using marginal and degraded lands (e. g., saline land) that are
currently not in use for food production or grazing (Nijsen etal., 2012).
However, how much land is really unused and available is contested
(Erb etal., 2007; Haberl etal., 2010; Coelho etal., 2012). Contrasting
views on future technical bioenergy potentials from dedicated biomass
plantations can be explained by differences in assumptions regarding
feasible future agricultural crop yields, livestock feeding efficiency,
land availability for energy crops and yields of energy crops (Dornburg
etal., 2010; Batidzirai etal., 2012; Erb etal., 2012a). Most scientists
agree that increases in food crop yields and higher feeding efficiencies
and lower consumption of animal products results in higher techni-
cal bioenergy potential. Also, there is a large agreement that careful
policies for implementation focused on land-use zoning approaches
(including nature conservation and biodiversity protection), multifunc-
tional land use, integration of food and energy production, avoidance
of detrimental livelihood impacts, e. g., on livestock grazing and subsis-
tence farming, and consideration of equity issues, and sound manage-
ment of impacts on water systems are crucial for sustainable solutions.
Reduced traditional biomass demand� A substantial quantity of
biomass will become available for modern applications by improving
the end-use efficiency of traditional biomass consumption for energy,
mostly in households but also within small industries (such as char-
coal kilns, brick kilns, etc.). Traditional bioenergy represents approxi-
mately 15 % of total global energy use and 80 % of current bioenergy
use (≈35 EJ / yr) and helps meeting the cooking needs of ~2.6 billion
people (Chum etal., 2011; IEA, 2012b). Traditional bioenergy use cov-
ers several end-uses including cooking, water, and space heating, and
small-industries (such as brick and pottery kilns, bakeries, and many
others). Cooking is the dominant end use; it is mostly done in open
fires and rudimentary stoves, with approximately 10 – 20 % conversion
efficiency, leading to very high primary energy consumption. Advanced
woodburning and biogas stoves can potentially reduce biomass fuel
consumption by 60 % or more (Jetter etal., 2012) and further lower
the atmospheric radiative forcing, reducing CO
2
emissions, and in many
cases black carbon emissions, by up to 90 % (Anenberg etal., 2013).
Assuming that actual savings reach on average 30 – 60 % of current
consumption, the total bioenergy potential from reducing traditional
bioenergy demand can be estimated at 8 – 18 EJ / yr. An unknown frac-
tion of global traditional biomass is consumed in a non-environmen-
tally sustainable way, leading to forest degradation and deforestation.

873873
Agriculture, Forestry and Other Land Use (AFOLU)
11
Chapter 11
Detailed country studies have estimated the fraction of non-renewable
biomass from traditional bioenergy use to vary widely, e. g., from 1.6 %
for the Democratic Republic of Congo to 73 % for Burundi (CDM-SSC
WG, 2011) with most countries in the range between 10 – 30 % (i. e.,
meaning that 70 – 90 % of total traditional bioenergy use is managed
sustainably). Thus a fraction of the traditional biomass saved through
better technology, should not be used for other energy purposes but
simply not consumed to help restore the local ecosystems.
11�13�3 Bioenergy conversion: technologies and
management practices
Numerous conversion technologies can transform biomass to heat,
power, liquid, and gaseous fuels for use in the residential, industrial,
transport, and power sectors (see Chum etal., 2011; GEA, 2012) for a
comprehensive coverage of each alternative, and Figure 11.21 for the
pathways concerning liquid and gaseous fuels). Since SRREN, the
major advances in the large-scale production of bioenergy include the
increasing use of hybrid biomass-fossil fuel systems. For example, cur-
rent commercial coal and biomass co-combustion technologies are the
lowest-cost technologies for implementing renewable energy policies,
enabled by the large-scale pelletized feedstocks trade (REN21, 2013;
Junginger etal., 2014). Direct biopower use is also increasing commer-
cially on a global scale (REN21, 2013, p.21). In fact, using biomass for
electricity and heat, for example, co-firing of woody biomass with coal
in the near term and large heating systems coupled with networks for
district heating, and biochemical processing of waste biomass, are
among the most cost-efficient and effective biomass applications for
GHG emission reduction in modern pathways (Sterner and Fritsche,
2011).
Integrated gasification combined cycle (IGCC) technologies for co-
production of electricity and liquid fuels from coal and biomass with
higher efficiency than current commercial processes are in demonstra-
tion phase to reduce cost (Williams etal., 2011; GEA, 2012; Larson
etal., 2012). Coupling of biomass and natural gas for fuels is another
option for liquid fuels (Baliban etal., 2013) as the biomass gasification
technology development progresses. Simulations suggest that inte-
grated gasification facilities are technically feasible (with up to 50 %
biomass input; Meerman et al., 2011), and economically attractive
with a CO
2
price of about 66 USD
2010
/ tCO
2
(50 EUR
2010
/ tCO
2
) (Meerman
etal., 2012). Many gasification technology developments around the
world are in pilot, demonstration, operating first commercial scale for
a variety of applications (see examples in Bacovsky etal., 2013; Balan
etal., 2013).
Many pathways and feedstocks (Figure 11.21) can lead to biofuels for
aviation. The development of biofuel standards started and enabled
testing of 50 % biofuel in jet fuel for commercial domestic and trans-
atlantic flights by consortia of governments, aviation industry, and
associations (IEA, 2010; REN21, 2013). Advanced ‘drop in’ fuels, such
as iso-butanol, synthetic aviation kerosene from biomass gasification
or upgrading of pyrolysis liquids, can be derived through a number
of possible conversion routes such as hydro treatment of vegetable
oils, iso-butanol, and Fischer-Tropsch synthesis from gasification of
biomass (Hamelinck and Faaij, 2006; Bacovsky etal., 2010; Meerman
etal., 2011, 2012; Rosillo-Calle etal., 2012); see also Chapter 8). In
specific cases, powering electric cars with electricity from biomass has
higher land-use efficiency and lower global-warming potential (GWP)
effects than the usage of bioethanol from biofuel crops for road trans-
port across a range of feedstocks, conversion technologies, and vehicle
classes (Campbell etal., 2009; Schmidt etal., 2011)
13
, though costs
are likely to remain prohibitive for considerable time (van Vliet etal.,
2011a; b; Schmidt etal., 2011).
The number of routes from biomass to a broad range of biofuels,
shown in Figure 11.21, includes hydrocarbons connecting today’s fos-
sil fuels industry in familiar thermal / catalytic routes such as gasifica-
tion (Williams etal., 2011; Larson etal., 2012) and pyrolysis (Brown
et al., 2011; Bridgwater, 2012; Elliott, 2013; Meier et al., 2013). In
addition, advances in genomic technology, the emphasis in systems
approach, and the integration between engineering, physics, chem-
istry, and biology bring together many new approaches to biomass
conversion (Liao and Messing, 2012) such as (1) biomolecular engi-
neering (Li etal., 2010; Favaro etal., 2012; Peralta-Yahya etal., 2012;
Lee etal., 2013; Yoon et al., 2013); (2) deconstruction of lignocellu-
losic biomass through combinations of mild thermal and biochemi-
cal routes in multiple sequential or consolidated steps using similar
biomolecular engineering tools (Rubin, 2008; Chundawat etal., 2011;
Beckham etal., 2012; Olson etal., 2012; Tracy etal., 2012; Saddler and
Kumar, 2013; Kataeva etal., 2013); and (3) advances in (bio)catalysis
and basic understanding of the synthesis of cellulose are leading to
routes for many fuels and chemicals under mild conditions (Serrano-
Ruiz etal., 2010; Carpita, 2012; Shen etal., 2013; Triantafyllidis etal.,
2013; Yoon etal., 2013). Fundamental understanding of biofuel pro-
duction increased for microbial genomes by forward engineering of
cyanobacteria, microalgae, aiming to arrive at minimum genomes for
synthesis of biofuels or chemicals (Chen and Blankenship, 2011; Eckert
etal., 2012; Ungerer et al., 2012; Jones and Mayfield, 2012; Kontur
etal., 2012; Lee etal., 2013).
Bioenergy coupled with CCS (Spath and Mann, 2004; Liu etal., 2010)
is seen as an option to mitigate climate change through negative emis-
sions if CCS can be successfully deployed (Cao and Caldeira 2010;
Lenton and Vaughan 2009). BECCS features prominently in long-run
mitigation scenarios (Sections 6.3.2 and 6.3.5) for two reasons: (1) The
potential for negative emissions may allow shifting emissions in time;
and (2) in scenarios, negative emissions from BECCS compensate for
residual emissions in other sectors (most importantly transport) in the
second half of the 21st century. As illustrated in Figure 11.22, BECCS
is markedly different than fossil CCS because it not only reduces CO
2
emissions by storing C in long-term geological sinks, but it continu-
13
Biomass can be used for electric transport and biofuels within one pathway
(Macedo et al., 2008)
Figure 11�21 | Production pathways to liquid and gaseous fuels from biomass and, for comparison from fossil fuels (adapted from GEA, 2012; Turkenburg etal., 2012).
LPG
Jet
Fuel
Petrol Diesel
CNG,
LNG
H₂
Coal
Lignocellulosic
Biomass
Sugar and
Starch Crops
Oil Crops
Hydrolysis
Anaerobic
Digestion
(Biogas)
Extraction
Esterification
Gasification Pyrolysis
Synthesis
Chemical or
Bio Refining
Fossil Fuels Biomass
Fermentation
Re-
newable
Diesel
Refining
Ethanol
Butanol
FTL
DME MeOH
Drop-in
Biofuels
Biodiesel
Mixed
Alcohols
Hydro
Thermal
Upgrade
Wet Biomass
Refining
Blending
Crude Oil Natural Gas
Developing Technologies
Commercial Technologies
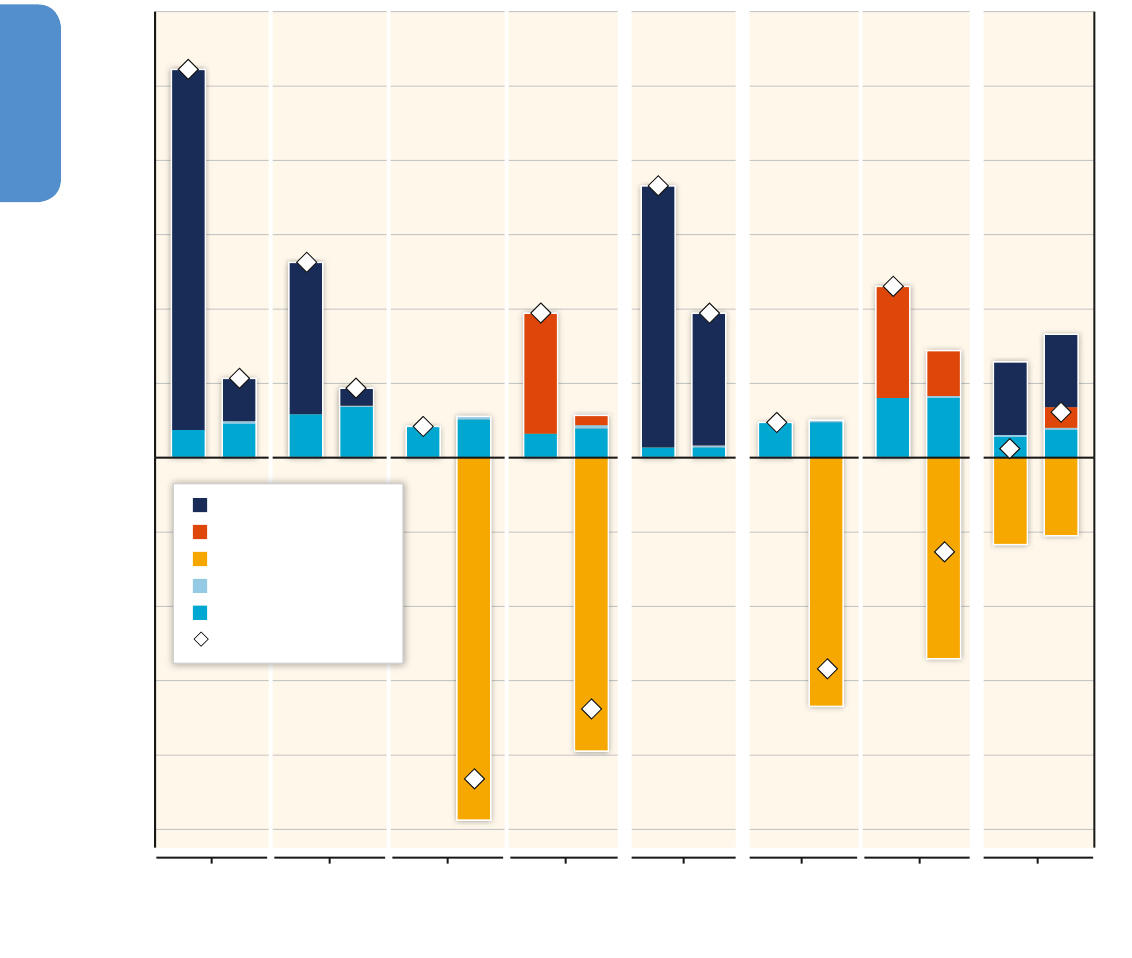
874874
Agriculture, Forestry and Other Land Use (AFOLU)
11
Chapter 11
Figure 11�22 | Illustration of the sum of CO
2
eq (GWP
100
)* emissions from the process chain of alternative transport and power generation technologies both with and without
CCS. (*Differences in C-density between forest biomass and switchgrass are taken into account but not calorific values (balance-of-plant data are for switchgrass, ref. Larson etal.,
2012). Specific emissions vary with biomass feedstock and conversion technology combinations, as well as lifecycle GHG calculation boundaries. For policy relevant purposes,
counterfactual and market-mediated aspects (e. g., iLUC), changes in soil organic carbon, or changes in surface albedo need also to be considered, possibly leading to significantly
different outcomes, quantitatively (Section 11.13.4, Figures 11.23 and 11.24).Unit: gCO
2
eq / MJ
El
(left y-axis, electricity); gCO
2
eq / MJ combusted (right y-axis, transport fuels). Direct
CO
2
emissions from energy conversion (‘vented’ and ‘stored’) are adapted from the mean values in Tables 12.7, 12.8, and 12.15 of ref. [1], which are based on the work of refs.
[2, 3], and characterized with the emission metrics in ref. [4]. Impacts upstream in the supply chain associated with feedstock procurement (i. e., sum of GHGs from mining / cultiva-
tion, transport, etc.) are adapted from refs. [5, 6] and Figure 11.23 (median values).
1
Larson, etal. (2012);
2
Woods, etal., (2007) ;
3
Liu etal. (2010);
4
Guest etal. (2013);
5
Turconi etal. (2013);
6
Jaramillo etal. (2008)
Notes:
*
Global Warming Potential over 100 years. See Glossary and Section 1.2.5.
ALCA GHG Emissions [gCO
2
eq/MJ
el
]
ALCA GHG Emissions [gCO
2
eq/MJ
Fuel Combusted
]
Coal IGCC Natural Gas CC Switchgrass Forest Biomass* Coal Coal +
F.
Biomass
Coal +
Switch-
grass
Forest Biomass*Switchgrass
Electricity CTLs BTLs C + BTLs
0
50
100
150
200
250
300
Fossil Combustion CO
2
Vented
Biogenic CO
2
Vented
Biogenic CO
2
Stored
CO
2
Transport and Storage
Net
Value Chain GHGs
-250
-200
-150
-100
-50
CCS CCSNo CCS CCSNo CCS CCSNo CCS CCSNo CCS CCSNo CCS CCSNo CCS CCSNo CCS CCS

875875
Agriculture, Forestry and Other Land Use (AFOLU)
11
Chapter 11
ally sequesters CO
2
from the air through regeneration of the biomass
resource feedstock.
BECCS deployment is in the development and exploration stages. The
most relevant BECCS project is the ‘Illinois Basin — Decatur Project’
that is projected to inject 1 MtCO
2
/ yr (Gollakota and McDonald, 2012;
Senel and Chugunov, 2013). In the United States, two ethanol fuel pro-
duction by fermentation facilities are currently integrated commercially
with carbon dioxide capture, pipeline transport, and use in enhanced
oil recovery in nearby facilities at a rate of about 0.2 MtCO
2
/ yr (DiP-
ietro etal., 2012). Altogether, there are 16 global BECCS projects in
exploration stage (Karlsson and Byström, 2011).
Critical to overall CO
2
storage is the realization of a lignocellulosic
biomass supply infrastructure for large-scale commodity feedstock
production and efficient advanced conversion technologies at scale;
both benefit from cost reductions and technological learning as does
the integrated system with CCS, with financial and institutional con-
ditions that minimize the risks of investment and facilitate dissemi-
nation (Eranki and Dale, 2011; IEA, 2012c, 2013). Integrated analy-
sis is needed to capture system and knock-on effects for bioenergy
potentials. A nascent feedstock infrastructure for densified biomass
trading globally could indicate decreased pressure on the need for
closely co-located storage and production (IEA, 2011; Junginger
etal., 2014).
The overall technical potential is estimated to be around 10 GtCO
2
storage per year for both Integrated Gasification Combined Cycle
(IGCC)-CCS co-firing (IGCC with co-gasification of biomass), and Bio-
mass Integrated Gasification Combined Cycle (BIGCC)-CCS dedicated,
and around 6 GtCO
2
storage for biodiesel based on gasification and
Fischer-Tropsch synthesis (FT diesel), and 2.7 GtCO
2
for biomethane
production (Koornneef etal., 2012, 2013). Another study estimates the
potential capacity (similar to technical potential) to be between 2.4
and 10 GtCO
2
per year for 2030 – 2050 (McLaren, 2012). The economic
potential, at a CO
2
price of around 70 USD / t is estimated to be around
3.3 GtCO
2
, 3.5 GtCO
2
, 3.1 GtCO
2
and 0.8 GtCO
2
in the corresponding
four cases, judged to be those with highest economic potential (Koorn-
neef etal., 2012, 2013). Potentials are assessed on a route-by-route
basis and cannot simply be added, as they may compete and substitute
each other. Practical figures might be not much higher than 2.4 GtCO
2
per year at 70 – 250 USD / tCO
2
(McLaren, 2012). Altogether, until 2050,
the economic potential is anywhere between 2 – 10 GtCO
2
per year.
Some climate stabilization scenarios see considerable higher deploy-
ment towards the end of the century, even in some 580 – 650 ppm sce-
narios, operating under different time scales, socioeconomic assump-
tions, technology portfolios, CO
2
prices, and interpreting BECCS as part
of an overall mitigation framework (e. g., Rose etal., 2012; Kriegler
etal., 2013; Tavoni and Socolow, 2013).
Possible climate risks of BECCS relate to reduction of land carbon
stock, feasible scales of biomass production and increased N
2
O emis-
sions, and potential leakage of CO
2
, which has been stored in deep
geologic reservoirs (Rhodes and Keith, 2008). The assumptions of suf-
ficient spatially appropriate CCS capture, pipeline, and storage infra-
structure are uncertain. The literature highlights that BECCS as well as
CCS deployment is dependent on strong financial incentives, as they
are not cost competitive otherwise (Sections 7.5.5; 7.6.4; 7.9; 7.12).
Figure 11.22 illustrates some GHG effects associated with BECCS
pathways. Tradeoffs between CO
2
capture rate and feedstock conver-
sion efficiency are possible. Depicted are pathways with the highest
removal rate but not necessarily with the highest feedstock conver-
sion rate. Among all BECCS pathways, those based on integrated gas-
ification combined cycle produce most significant geologic storage
potential from biomass, alone (shown in Figure 11.23, electricity) or
coupled with coal. Fischer-Tropsch diesel fuel production with biomass
as feedstock and CCS attached to plant facilities could enable BECCS
for transport; uncertainties in input factors, and output metrics warrant
further research (van Vliet etal., 2009). Fischer-Tropsch diesel would
also allow net removal but at lower rates than BIGCC.
Economics of scale in power plant size are crucial to improve economic
viability of envisaged BECCS projects. Increasing power plant size
requires higher logistic challenges in delivering biomass.
Scales of 4,000 to 10,000 Mg / day needed for >600 MW power plants
could become feasible as the biomass feedstock supply logistic devel-
opment with manageable logistic costs if biomass is derived from
high-yield monocrops; logistical costs are more challenging when bio-
mass is derived from residues (e. g., Argo etal., 2013; Junginger etal.,
2014). Large-scale biomass production with flexible integrated poly-
generation facilities for fuels and / or power can improve the techno-
economic performance, currently above market prices to become more
economically competitive over time (Meerman et al., 2011). In the
future, increased operating experience of BECCS IGCC-CCS through
technological improvements and learning could enable carbon neutral
electricity and, in combination with CCS, could result in net removal of
CO
2
(Figure 11.22). BECCS is among the lowest cost CCS options for a
number of key industrial sectors (Meerman etal., 2013). It should be
noted that primary empiric cost and performance data for dedicated
bioenergy plants are not yet available and needed for comprehensively
assessing BECCS. The current status of CCS and on-going research
issues are discussed in Sections 7.5.5 and 7.6.4. Social concerns con-
stitute a major barrier for implement demonstration and deployment
projects.
Integrated bio-refineries continue to be developed; for instance, 10 %
of the ethanol or corresponding sugar stream goes into bio-products
in Brazil (REN21, 2012) including making ethylene for polymers (IEA-
ETSAP and IRENA, 2013). Multi product bio-refineries could produce a
wider variety of co-products to enhance the economics of the overall
process, facilitating learning in the new industry (IEA, 2011); Lifecycle
Analyses (LCAs) for these systems are complex (Pawelzik etal., 2013).
876876
Agriculture, Forestry and Other Land Use (AFOLU)
11
Chapter 11
Figure 11�23 | Direct CO
2
eq (GWP
100
) emissions from the process chain or land-use disturbances of major bioenergy product systems, not including impacts from LUC (see Figure
11.24). The interpretation of values depends also on baseline assumption about the land carbon sink when appropriate and the intertemporal accounting frame chosen, and should
also consider information from Figure 11.24. The lower and upper bounds of the bars represent the minimum and the maximum value reported in the literature. Whenever possible,
peer-reviewed scientific literature published post SRREN is used (but results are comparable). Note that narrow ranges may be an artefact of the number of studies for a given case.
Results are disaggregated in a manner showing the impact of Feedstock production (in gCO
2
eq / MJ lower heating value (LHV) of feedstock) and the contributions from end prod-
uct / conversion technology.Results from conversion into final energy products Heat, Power, and Transport fuels include the contribution from Feedstock production and are shown
in gCO
2
eq / MJ of final product. For some pathways, additional site-specific climate forcing agents apply and are presented as separate values to be added or subtracted from the
value indicated by the median in the Feedstock bar (dark grey). Final products are also affected by these factors, but this is not displayed here. References: Corn 1 – 7; Oil crops 1,
8, 8 – 12; Crop residues 1, 4, 13 – 24; Sugarcane 2, 3, 5, 6, 25 – 27; Palm Oil 2, 3, 10, 28 – 31; Perennial grasses 1, 3, 11, 18, 22, 32 – 40; Short Rotation Woody Crops 1, 3, 6, 12, 22,
33, 35, 37, 38, 41 – 53; Forestry 5, 6, 38, 49, 54 – 66; Biogas, open storage: 67 – 69; Biogas, closed storage 69 – 71; Waste cooking oil: 22, 72 – 74. Note that the biofuels technolo-
gies for transport from lignocellulosic feedstocks, short rotation woody crops, and crop residues, including collection and delivery, are developing so larger ranges are expected than
for more mature commercial technologies such as sugarcane ethanol and waste cooking oil (WCO) biodiesel. The biogas electricity bar represents scenarios using LCAs to explore
treating mixtures of a variety of lignocellulosic feedstocks (e. g., ensiled grain or agricultural residues or perennial grasses) with more easily biodegradable wastes (e. g., from animal
husbandry), to optimize multiple outputs. Some of the scenarios assume CH
4
leakage, which leads to very high lifecycle emissions.
1
Gelfand etal. (2013);
2
Nemecek etal. (2012);
3
Hoefnagels etal. (2010);
4
Kaufman etal. (2010);
5
Cherubini etal. (2009);
6
Cherubini (2012);
7
Wang etal. (2011b);
8
Milazzo etal.
(2013);
9
Goglio etal. (2012);
10
Stratton etal. (2011);
11
Fazio and Monti (2011);
12
Börjesson and Tufvesson (2011);
13
Cherubini and Ulgiati (2010);
14
Li etal. (2012);
15
Luo etal.
(2009);
16
Gabrielle and Gagnaire (2008);
17
Smith etal. (2012b);
18
Anderson-Teixeira etal. (2009);
19
Nguyen etal. (2013);
20
Searcy and Flynn (2008);
21
Giuntoli etal. (2013);
22
Whita-
ker etal. (2010);
23
Wang etal. (2013a);
24
Patrizi etal. (2013);
25
Souza etal. (2012a);
26
Seabra etal. (2011);
27
Walter etal. (2011);
28
Choo etal. (2011);
29
Harsono etal. (2012);
30
Sian-
gjaeo etal. (2011);
31
Silalertruksa and Gheewala (2012);
32
Smeets etal. (2009b);
33
Tiwary and Colls (2010);
34
Wilson etal. (2011);
35
Brandão etal. (2011);
36
Cherubini and Jungmeier
(2010);
37
Don etal. (2012);
38
Pucker etal. (2012);
39
Monti etal. (2012);
40
Bai etal. (2010);
41
Bacenetti etal. (2012);
42
Budsberg etal. (2012);
43
González-García etal. (2012a);
44
González-García (2012b) ;
45
Stephenson etal. (2010);
46
Hennig and Gawor (2012);
47
Buonocore etal. (2012);
48
Gabrielle etal. (2013);
49
Dias and Arroja (2012);
50
González-García
etal. (2012b);
51
Roedl (2010);
52
Djomo etal. (2011);
53
Njakou Djomo etal. (2013);
54
McKechnie etal. (2011);
55
Pa etal. (2012);
56
Puettmann etal. (2010);
57
Guest etal. (2011);
58
Valente etal. (2011);
59
Whittaker etal. (2011);
60
Bright and Strømman (2009);
61
Felder and Dones (2007);
62
Solli etal. (2009);
63
Lindholm etal. (2011);
64
Mallia and Lewis (2013);
65
Bright etal. (2010);
66
Bright and Strømman (2010);
67
Rehl etal. (2012);
68
Blengini etal. (2011);
69
Boulamanti etal. (2013);
70
Lansche and Müller (2012);
71
De Meester etal. (2012);
72
Sunde etal. (2011);
73
Thamsiriroj and Murphy (2011);
74
Talens Peiró etal. (2010)
ALCA GHG Emissions [gCO
2
eq/MJ]
∆Albedo
Biogenic CO
2
Electricity
Feedstock
Median
Max
Min
Transportation
Feedstock Production and Site-Specific Climate Forcing AgentsEnd-Use Lifecycle GHG Emissions
∆SOC
Heat
Corn
(USA)
Oil Crops
(Europe)
Crop Residues
(North America, Europe)
Sugarcane
(Brazil)
Palm Oil
(Southeast
Asia)
Perennial Grasses
(USA and Europe)
Short Rotation Woody
Crops
(USA, Europe,
South America)
Forestry
(North America and Europe)
Biogas
(Europe),
Closed
Storage*
Biogas
(Europe),
Open
Storage*
Waste
Cooking
Oil
(World)
Annuals Perennials Woody
# of Cases:
# of Ref.:
*Digestate
43354611964551632157676662N/A63
1015292013145530281311530314361417171082512N/A710
4753
2621136
-90
-60
-30
0
30
60
90
120
150
269
N.A.
Waste

877877
Agriculture, Forestry and Other Land Use (AFOLU)
11
Chapter 11
There are alternatives to land-based bioenergy. Microalgae, for exam-
ple, offer a high-end technical potential. However, it might be com-
promised by water supply, if produced in arid land, or by impacts on
ocean ecosystems. To make microalgae cost competitive, maximizing
algal lipid content (and then maximizing growth rate) requires techno-
logical breakthroughs (Davis etal., 2011a; Sun etal., 2011; Jonker and
Faaij, 2013). The market potential depends on the co-use of products
for food, fodder, higher value products, and fuel markets (Chum etal.,
2011).
Similarly, lignocellulosic feedstocks produced from waste or residues,
or grown on land unsupportive of food production (e. g., contaminated
land for remediation as in previously mined land) have been suggested
to reduce socio-environmental impact. In addition, lignocellulosic
feedstocks can be bred specifically for energy purposes, and can be
harvested by coupling collection and pre-processing (densification and
others) in depots prior to final conversion, which could enable deliv-
ery of more uniform feedstocks throughout the year (Eranki and Dale,
2011; U. S. DOE, 2011; Argo etal., 2013).
Various conversion pathways are in research and development (R&D),
near commercialization, or in early deployment stages in several coun-
tries (see Section 2.6.3 in Chum etal., 2011). More productive land is
also more economically attractive for cellulosic feedstocks, in which
case competition with food production is more likely. Depending on
the feedstock, conversion process, prior land use, and land demand,
lignocellulosic bioenergy can be associated with high or low GHG
emissions (e. g., Davis etal., 2011b). Improving agricultural lands and
reducing non-point pollution emissions to watersheds remediate nitro-
gen run off and increase overall ecosystems’ health (Van Dam etal.,
2009a; b; Gopalakrishnan et al., 2012). Also regeneration of saline
lands by salt-tolerant tree and grass species can have a large potential
on global scale as demonstrated by Wicke etal. (2011).
A range of agro-ecological options to improve agricultural practices
such as no / low tillage conservation, agroforestry, etc., have potential
to increase yields (e. g., in sub-Saharan Africa), while also providing a
range of co-benefits such as increased soil organic matter. Such options
require a much lower level of investment and inputs and are thus more
readily applicable in developing countries, while also holding a low risk
of increased GHG emissions (Keating etal., 2013).
Substantial progress has also been achieved in the last four years in
small-scale bioenergy applications in the areas of technology inno-
vation, impact evaluation and monitoring, and in large-scale imple-
mentation programmes. For example, advanced combustion biomass
cookstoves, which reduce fuel use by more than 60 % and hazardous
pollutant as well as short-lived climate pollutants by up to 90 %, are
now in the last demonstration stages or commercial (Kar etal., 2012;
Anenberg et al., 2013). Innovative designs include micro-gasifiers,
stoves with thermoelectric generators to improve combustion efficiency
and provide electricity to charge LED lamps while cooking, stoves with
advanced combustion chamber designs, and multi-use stoves (e. g.,
cooking and water heating for bathing (Ürge-Vorsatz et al., 2012;
Anenberg etal., 2013). Biogas stoves, in addition to providing clean
combustion, help reduce the health risks associated with the disposal
of organic wastes. There has also been a boost in cookstove dissemi-
nation efforts ranging from regional (multi-country) initiatives (Wang
etal., 2013b) to national, and project-level interventions. In total, more
than 200 large-scale cookstove projects are in place worldwide, with
several million efficient cookstoves installed each year (Cordes, 2011).
A Global Alliance for Clean Cookstoves has been launched that is pro-
moting the adoption of 100 million clean and efficient cookstoves per
year by 2030 and several countries have launched National Cookstove
Programs in recent years (e. g., Mexico, Peru, Honduras, and others).
Many cookstove models are now manufactured in large-scale indus-
trial facilities using state-of-the-art materials and combustion design
technology. Significant efforts are also in place to develop interna-
tional standards and regional stove testing facilities. In addition to pro-
viding tangible local health and other sustainable benefits, replacing
traditional open fires with efficient biomass cookstoves has a global
mitigation potential estimated to be between 0.6 and 2.4 GtCO
2
eq / yr
(Ürge-Vorsatz etal., 2012).
Small-scale decentralized biomass power generation systems based on
biomass combustion and gasification and biogas production systems
have the potential to meet the electricity needs of rural communities in
the developing countries. The biomass feedstocks for these small-scale
systems could come from residues of crops and forests, wastes from
livestock production, and / or from small-scale energy plantations (Faaij,
2006).
11�13�4 GHG emission estimates of bioenergy
production systems
The combustion of biomass generates gross GHG emissions roughly
equivalent to the combustion of fossil fuels. If bioenergy production
is to generate a net reduction in emissions, it must do so by offset-
ting those emissions through increased net carbon uptake of biota and
soils. The appropriate comparison is then between the net biosphere
flux in the absence of bioenergy compared to the net biosphere flux in
the presence of bioenergy production. Direct and indirect effects need
to be considered in calculating these fluxes.
Bioenergy systems directly influence local and global climate through
(i) GHG emissions from fossil fuels associated with biomass produc-
tion, harvest, transport, and conversion to secondary energy carriers
(von Blottnitz and Curran, 2007; van der Voet etal., 2010); (ii) CO
2
and
other GHG emissions from biomass or biofuel combustion (Cherubini
etal., 2011); (iii) atmosphere-ecosystem exchanges of CO
2
following
land disturbance (Berndes etal., 2013; Haberl, 2013); (iv) climate forc-
ing resulting from emissions of short-lived GHGs like black carbon and
other chemically active gases (NO
x
, CO, etc.) (Tsao etal., 2012; Jetter
etal., 2012); (v) climate forcing resulting from alteration of biophysi-
cal properties of the land surface affecting the surface energy balance
878878
Agriculture, Forestry and Other Land Use (AFOLU)
11
Chapter 11
Figure 11�24 | Estimates of GHG
LUC
emissions — GHG emissions from biofuel production-induced LUC (as gCO
2
eq / MJ
fuel produced
) over a 30-year time horizon organized by fuel(s),
feedstock, and study.Assessment methods, LUC estimate types and uncertainty metrics are portrayed to demonstrate the diversity in approaches and differences in results within
and across any given category. Points labeled ‘a’ on the Y-axis represent a commonly used estimate of lifecycle GHG emissions associated with the direct supply chain of petroleum
gasoline (frame A) and diesel (frame B). These emissions are not directly comparable to GHG
LUC
because the emission sources considered are different, but are potentially of inter-
est for scaling comparison. Based on Warner etal. (2013). Please note: These estimates of global LUC are highly uncertain, unobservable, unverifiable, and dependent on assumed
policy, economic contexts, and inputs used in the modelling. All entries are not equally valid nor do they attempt to measure the same metric despite the use of similar naming
conventions (e. g., iLUC). In addition, many different approaches to estimating GHG
LUC
have been used. Therefore, each paper has its own interpretation and any comparisons should
be made only after careful consideration. *CO
2
eq includes studies both with and without CH
4
and N
2
O accounting.
-
0
LUC Estimate Type Assessment Method Uncertainty Bars
Scenarios, Marginal LUC
Miscanthus
Maize Stover
Switchgrass
Scenarios, Average LUC
iLUC Factor
Arithmetic Mean, Marginal LUC
Switchgrass
Median, Marginal LUC
Maximum
Minimum
Deterministic (Simplified)
Causal Descriptive
Optimization Modeling
Economic Equilibrium Modeling
Meta-analysis
Distribution
Statistics
97.5
th
Percentile
2.5
th
Percentile
iLUC
Factor
+iLUC 100%
+iLUC 75%
+iLUC 50%
+iLUC 25%
dLUC
150
100
50
0
-50
Soy Palm Rapeseed
SunflowerJatropha
Yeh 2010 Unnasch 2009
(D) Petroleum Fuel
(GHG Emissions from
Land Disturbance Only)
US EPA 2010 Fritsche 2010 US EPA 2010 Taheripouri 2013
Butanol - Maize Fisher-Tropsch Diesel – Short
Rotation Forest
Fischer-Tropsch Diesel –
Lignocellulose
Renewable Gasoline –
Lignocellulose
2012
2017
2022
2017
2022
(a)
Arable
Grass
2012
2017
2022
Degraded
Grass
Forest
Arable
Grass
Degraded
Arable
Grass
Savannah
(a)
Maize Wheat Sugarbeet Sugarcane Lignocellulose
2012
2017
2022
(1 of 4 Shown)
(3 of 4 Shown)
2017
2022
Degraded
Grass
Savannah
Arable
Grass
(a)
Lywood 2008
Bauen 2010
Tipper 2010
Fritsche 2010
Panichelli 2008
Laborde 2011
CARB 2010
US EPA 2010
Searchinger 2008b
Lywood 2008
Bauen 2010
Tipper 2010
Fritsche 2010
Labrode 2011
Lywood 2008
Bauen 2010
Tipper 2010
Fritsche 2010
Labrode 2011
Fritsche 2010
Laborde 2011
500
300
200
150
100
50
0
-50
-100
(B) Biodiesel
[gCO
2
eq/MJ
Fuel Produced
]*
150
100
50
-50
(C) Butanol and Fischer-Tropsch Diesel
[gCO
2
eq/MJ
fuel produced
]*
GHG
LUC
Emissions per Unit Fuel Produced
[gCO
2
eq/MJ
fuel produced
]*
Lywood 2008
Tipper 2010
Kim 2012
Kim 2009
Taheripouri 2013
Mueller 2012
Laborde 2011
Kløverpris 2012
Tyner 2010
CARB 2010
Hertel 2010a
US EPA 2010
Dumortier 2009
Searchinger 2008a
Plevin 2010
Lywood 2008
Bauen 2010
Tipper 2010
Fritsche 2010
Laborde 2011
Lywood 2008
Tipper 2010
Laborde 2011
Lywood 2008
Bauen 2010
Tipper 2010
Fritsche 2010
US EPA 2010
Laborde 2011
CARB 2010
Teheripouri 2013
Mueller 2012
US EPA 2010
300
250
200
150
100
50
0
-50
-100
(A) Ethanol
⇒

879879
Agriculture, Forestry and Other Land Use (AFOLU)
11
Chapter 11
(e. g., from changes in surface albedo, heat and water fluxes, surface
roughness, etc.; (Bonan, 2008; West et al., 2010a; Pielke Sr. et al.,
2011); and (vi) GHGs from land management and perturbations to soil
biogeochemistry, e. g., N
2
O from fertilizers, CH
4
, etc. (Cai, 2001; Allen
etal., 2009). Indirect effects include the partial or complete substitu-
tion of fossil fuels and the indirect transformation of land use by equi-
librium effects. Hence, the total climate forcing of bioenergy depends
on feedstock, site-specific climate and ecosystems, management con-
ditions, production pathways, end use, and on the interdependencies
with energy and land markets.
In contrast, bioenergy systems have often been assessed (e. g., in LCA
studies, integrated models, policy directives, etc.) under the assump-
tion that the CO
2
emitted from biomass combustion is climate neutral
14
because the carbon that was previously sequestered from the atmo-
sphere will be re-sequestered if the bioenergy system is managed sus-
tainably (Chum etal., 2011; Creutzig etal., 2012a; b). The shortcomings
of this assumption have been extensively discussed in environmental
impact studies and emission accounting mechanisms (Searchinger
etal., 2009; Searchinger, 2010; Cherubini etal., 2011; Haberl, 2013).
Studies also call for a consistent and case-specific carbon stock / flux
change accounting that integrates the biomass system with the
global carbon cycle (Mackey etal., 2013). As shown in Chapter 8 of
WGI (Myhre and Shindell, 2013) and (Plattner etal., 2009; Fuglestvedt
etal., 2010), the climate impacts can be quantified at different points
along a cause-effect chain, from emissions to changes in temperature
and sea level rise. While a simple sum of the net CO
2
fluxes over time
can inform about the skewed time distribution between sources and
sinks (‘C debt’; Marland and Schlamadinger, 1995; Fargione et al.,
2008; Bernier and Paré, 2013), understanding the climate implication
as it relates to policy targets (e. g., limiting warming to 2 °C) requires
models and / or metrics that also include temperature effects and cli-
mate consequence (Smith etal., 2012c; Tanaka etal., 2013). While the
warming from fossil fuels is nearly permanent as it persists for thou-
sands of years, direct impacts from renewable bioenergy systems cause
a perturbation in global temperature that is temporary and even at
14
The neutrality perception is linked to a misunderstanding of the guidelines for
GHG inventories, e. g., IPCC — Land Use, Land-Use Change and Forestry (2000)
states “Biomass fuels are included in the national energy and carbon dioxide
emissions accounts for informational purposes only. Within the energy module
biomass consumption is assumed to equal its regrowth. Any departures from this
hypothesis are counted within the Land Use Change and Forestry Model.” Carbon
neutrality is valid if the countries account for LUC in their inventories for self-
produced bioenergy.
times cooling if terrestrial carbon stocks are not depleted (House etal.,
2002; Cherubini etal., 2013; Joos etal., 2013; Mackey etal., 2013). The
direct, physical climate effects at various end-points need to be fully
understood and characterized — despite the measurement challenges
that some climate forcing mechanisms can entail (West etal., 2010b;
Anderson-Teixeira etal., 2012), and coherently embedded in mitiga-
tion policy scenarios along with the possible counterfactual effects. For
example, in the specific case of existing forests that may continue to
grow if not used for bioenergy, some studies employing counterfactual
baselines show that forest bioenergy systems can temporarily have
higher cumulative CO
2
emissions than a fossil reference system (for a
time period ranging from a few decades up to several centuries; (Repo
etal., 2011; Mitchell etal., 2012; Pingoud et al., 2012; Bernier and
Paré, 2013; Guest etal., 2013; Helin etal., 2013; Holtsmark, 2013).
In some cases, cooling contributions from changes in surface albedo
can mitigate or offset these effects (Arora and Montenegro, 2011;
O’Halloran etal., 2012; Anderson-Teixeira etal., 2012; Hallgren etal.,
2013).
Accounting always depends on the time horizon adopted when assess-
ing climate change impacts, and the assumed baseline, and hence
includes value judgements (Schwietzke etal., 2011; Cherubini etal.,
2013; Kløverpris and Mueller, 2013).
Two specific contributions to the climate forcing of bioenergy, not
addressed in detail in SRREN include N
2
O and biogeophysical factors.
Nitrous oxide emissions: For first-generation crop-based biofuels, as
with food crops (see Chapter 11), emissions of N
2
O from agricultural
soils is the single largest contributor to direct lifecycle GHG emissions,
and one of the largest contributors across many biofuel production
cycles (Smeets etal., 2009a; Hsu etal., 2010). Emission rates can vary
by as much as 700 % between different crop types for the same site,
fertilization rate, and measurement period (Kaiser and Ruser, 2000;
Don etal., 2012; Yang etal., 2012). Increased estimates of N
2
O emis-
sions alone can convert some biofuel systems from apparent net sinks
to net sources (Crutzen etal., 2007; Smith etal., 2012c). Improvements
in nitrogen use efficiency and nitrogen inhibitors can substantially
reduce emissions of N
2
O (Robertson and Vitousek, 2009). For some
specific crops, such as sugarcane, N
2
O emissions can be low (Macedo
etal., 2008; Seabra etal., 2011) or high (Lisboa etal., 2011). Other
bioenergy crops require minimal or zero N fertilization and can reduce
GHG emissions relative to the former land use where they replace con-
ventional food crops (Clair etal., 2008).
Figure 11�24 | Estimates of GHG
LUC
emissions — GHG emissions from biofuel production-induced LUC (as gCO
2
eq / MJ
fuel produced
) over a 30-year time horizon organized by fuel(s),
feedstock, and study.Assessment methods, LUC estimate types and uncertainty metrics are portrayed to demonstrate the diversity in approaches and differences in results within
and across any given category. Points labeled ‘a’ on the Y-axis represent a commonly used estimate of lifecycle GHG emissions associated with the direct supply chain of petroleum
gasoline (frame A) and diesel (frame B). These emissions are not directly comparable to GHG
LUC
because the emission sources considered are different, but are potentially of inter-
est for scaling comparison. Based on Warner etal. (2013). Please note: These estimates of global LUC are highly uncertain, unobservable, unverifiable, and dependent on assumed
policy, economic contexts, and inputs used in the modelling. All entries are not equally valid nor do they attempt to measure the same metric despite the use of similar naming
conventions (e. g., iLUC). In addition, many different approaches to estimating GHG
LUC
have been used. Therefore, each paper has its own interpretation and any comparisons should
be made only after careful consideration. *CO
2
eq includes studies both with and without CH
4
and N
2
O accounting.
-
0
LUC Estimate Type Assessment Method Uncertainty Bars
Scenarios, Marginal LUC
Miscanthus
Maize Stover
Switchgrass
Scenarios, Average LUC
iLUC Factor
Arithmetic Mean, Marginal LUC
Switchgrass
Median, Marginal LUC
Maximum
Minimum
Deterministic (Simplified)
Causal Descriptive
Optimization Modeling
Economic Equilibrium Modeling
Meta-analysis
Distribution
Statistics
97.5
th
Percentile
2.5
th
Percentile
iLUC
Factor
+iLUC 100%
+iLUC 75%
+iLUC 50%
+iLUC 25%
dLUC
150
100
50
0
-50
Soy Palm Rapeseed
SunflowerJatropha
Yeh 2010 Unnasch 2009
(D) Petroleum Fuel
(GHG Emissions from
Land Disturbance Only)
US EPA 2010 Fritsche 2010 US EPA 2010 Taheripouri 2013
Butanol - Maize Fisher-Tropsch Diesel – Short
Rotation Forest
Fischer-Tropsch Diesel –
Lignocellulose
Renewable Gasoline –
Lignocellulose
2012
2017
2022
2017
2022
(a)
Arable
Grass
2012
2017
2022
Degraded
Grass
Forest
Arable
Grass
Degraded
Arable
Grass
Savannah
(a)
Maize Wheat Sugarbeet Sugarcane Lignocellulose
2012
2017
2022
(1 of 4 Shown)
(3 of 4 Shown)
2017
2022
Degraded
Grass
Savannah
Arable
Grass
(a)
Lywood 2008
Bauen 2010
Tipper 2010
Fritsche 2010
Panichelli 2008
Laborde 2011
CARB 2010
US EPA 2010
Searchinger 2008b
Lywood 2008
Bauen 2010
Tipper 2010
Fritsche 2010
Labrode 2011
Lywood 2008
Bauen 2010
Tipper 2010
Fritsche 2010
Labrode 2011
Fritsche 2010
Laborde 2011
500
300
200
150
100
50
0
-50
-100
(B) Biodiesel
[gCO
2
eq/MJ
Fuel Produced
]*
150
100
50
-50
(C) Butanol and Fischer-Tropsch Diesel
[gCO
2
eq/MJ
fuel produced
]*
GHG
LUC
Emissions per Unit Fuel Produced
[gCO
2
eq/MJ
fuel produced
]*
Lywood 2008
Tipper 2010
Kim 2012
Kim 2009
Taheripouri 2013
Mueller 2012
Laborde 2011
Kløverpris 2012
Tyner 2010
CARB 2010
Hertel 2010a
US EPA 2010
Dumortier 2009
Searchinger 2008a
Plevin 2010
Lywood 2008
Bauen 2010
Tipper 2010
Fritsche 2010
Laborde 2011
Lywood 2008
Tipper 2010
Laborde 2011
Lywood 2008
Bauen 2010
Tipper 2010
Fritsche 2010
US EPA 2010
Laborde 2011
CARB 2010
Teheripouri 2013
Mueller 2012
US EPA 2010
300
250
200
150
100
50
0
-50
-100
(A) Ethanol

880880
Agriculture, Forestry and Other Land Use (AFOLU)
11
Chapter 11
Biogeophysical factors: Land cover changes or land-use distur-
bances of the surface energy balance, such as surface albedo, sur-
face roughness, and evapotranspiration influence the climate system
(Betts, 2001; Marland etal., 2003; Betts etal., 2007; Bonan, 2008;
Jackson etal., 2008; Mahmood etal., 2013). Perturbations to these
can lead to both direct and indirect climate forcings whose impacts
can differ in spatial extent (global and / or local) (Bala etal., 2007;
Davin et al., 2007). Surface albedo is found to be the dominant
direct biogeophysical climate impact mechanism linked to land
cover change at the global scale, especially in areas with seasonal
snow cover (Claussen etal., 2001; Bathiany etal., 2010), with radia-
tive forcing effects possibly stronger than those of the co-occuring
C-cycle changes (Randerson etal., 2006; Lohila etal., 2010; Bright
et al., 2011; Cherubini et al., 2012; O’Halloran et al., 2012). Land
cover changes can also affect other biogeophysical factors like
evapotranspiration and surface roughness, which can have important
local (Loarie etal., 2011; Georgescu etal., 2011) and global climatic
consequences (Bala etal., 2007; Swann etal., 2010, 2011). Biogeo-
physical climate impacts from changes in land use are site-specific
and show variations in magnitude across different geographic
regions and biomes (Bonan, 2008; Anderson, 2010; Pielke Sr. etal.,
2011; Anderson-Teixeira etal., 2012). Biogeophysical impacts should
be considered in climate impact assessments and in the design of
land-use policies to adequately assess the net impacts of land-use
mitigation options (Jackson etal., 2008; Betts, 2011; Arora and Mon-
tenegro, 2011) as their size may be comparable to impacts from
changes to the C cycle.
Figure 11.23 illustrates the range of lifecycle global direct climate
impact (in g CO
2
equivalents per MJ, after characterization with GWP
time horizon=100 years) attributed to major global bioenergy products
reported in the peer-reviewed literature after 2010. Results are broadly
comparable to those of Chapter 2 in SRREN (Figures 2.10 and 2.11 in
SRREN; Chum etal., 2011) Those figures displayed negative emissions,
resulting from crediting emission reduction due to substitution effects.
This appendix refrains from allocating credits to feedstocks to avoid
double accounting.
Significant variation in the results reflects the wide range of conver-
sion technologies and the reported performances in addition to analyst
assumptions affecting system boundary completeness, emission inven-
tory completeness, and choice of allocation method (among others).
Additional ‘site-specific’ land-use considerations such as changes in soil
organic carbon stocks (∆SOC), changes in surface albedo (∆albedo),
and the skewed time distribution of terrestrial biogenic CO
2
fluxes
can either reduce or compound land-use impacts and are presented
to exemplify that, for some bioenergy systems, these impacts can be
greater in magnitude than lifecycle impacts from feedstock cultivation
and bioenergy product conversion. ‘Site-specific’ land-use consider-
ations are geographically explicit and highly sensitive to background
climate conditions, soil properties, biomass yields, and land manage-
ment regimes. The figure reveals that studies find very different values
depending on the boundaries of analysis chosen, site-specific effects,
and management methods. Nonetheless, it is clear that fuels from
sugarcane, perennial grasses, crop residues, and waste cooking oil are
more beneficial than other fuels (LUC emissions can still be relevant,
see Figure 11.23). Another important result is that albedo effects and
site-specific CO
2
fluxes are highly variable for different forest systems
and environmental conditions and determine the total climate forcing
of bioenergy from forestry.
Direct and indirect land-use change: Direct land-use change
occurs when bioenergy crops displace other crops or pastures or for-
ests, while iLUC results from bioenergy deployment triggering the
conversion to cropland of lands, somewhere on the globe, to replace
some portion of the displaced crops (Searchinger etal., 2008; Kløver-
pris etal., 2008; Delucchi, 2010; Hertel etal., 2010). Direct LUC to
establish biomass cropping systems can increase the net GHG emis-
sions, for example, if carbon-rich ecosystems such as wetlands, for-
ests, or natural grasslands are brought into cultivation (Gibbs etal.,
2008; UNEP, 2009, p.2009; Chum etal., 2011). Biospheric C losses
associated with LUC from some bioenergy schemes can be, in some
cases, more than hundred times larger than the annual GHG savings
from the assumed fossil fuel replacement (Gibbs etal., 2008; Chum
etal., 2011). Impacts have been shown to be significantly reduced
when a dynamic baseline includes future trends in global agricultural
land use (Kløverpris and Mueller, 2013). Albeit at lower magnitude,
beneficial LUC effects can also be observed, for example, when some
semi-perennial crops, perennial grasses or woody plants replace
annual crops grown with high fertilizer levels, or where such plants
are produced on lands with carbon-poor soils (Tilman etal., 2006;
Harper etal., 2010; Sterner and Fritsche, 2011; Sochacki etal., 2012).
In particular, Miscanthus improves soil organic carbon reducing over-
all GHG emissions (Brandão et al., 2011); degraded USA Midwest
land for economic agriculture, over a 20-year period, shows succes-
sional perennial crops without the initial carbon debt and indirect
land-use costs associated with food-based biofuels (Gelfand etal.,
2013). Palm oil, when grown on more marginal grasslands, can
deliver a good GHG balance and net carbon storage in soil (Wicke
etal., 2008). Such lands represent a substantial potential for palm
oil expansion in Indonesia without deforestation and draining peat
lands (Wicke etal., 2011a).
In long-term rotation forests, the increased removal of biomass for
bioenergy may be beneficial or not depending on the site-specific
forest conditions (Cherubini et al., 2012b). For long-term rotation
biomass, the carbon debt (increased cumulative CO
2
emissions for a
duration in the order of a rotation cycle or longer) becomes increas-
ingly important (Schlamadinger and Marland, 1996; Marland and
Schlamadinger, 1997; Fargione etal., 2008; McKechnie et al., 2011;
Hudiburg etal., 2011). Calculations of specific GHG emissions from
long-term rotation forests need to account for the foregone CO
2
-accu-
mulation (Searchinger, 2010; Holtsmark, 2012; Pingoud etal., 2012;
Haberl etal., 2012).

881881
Agriculture, Forestry and Other Land Use (AFOLU)
11
Chapter 11
If part of a larger forest is used as a feedstock for bioenergy while
the overall forest carbon stock increases (the so-called landscape
perspective), then the overall mitigation effects are positive, in par-
ticular over several harvesting cycles making use of the faster car-
bon sequestration rates of younger forests (Daigneault etal., 2012;
Ximenes etal., 2012; Lamers and Junginger, 2013; Latta etal., 2013).
Nabuurs etal. (2013) observe first signs of a carbon sink saturation
in European forest biomass and suggest to focus less on the forest
biomass sink strength but to consider a mitigation strategy that max-
imizes the sum of all the possible components: (1) carbon sequestra-
tion in forest biomass; (2) soil and wood products; and (3) the effects
of material and energy substitution of woody biomass. In general, the
use of easily decomposable residues and wastes for bioenergy can
produce GHG benefits (Zanchi etal., 2012), similarly to increasing the
biomass outtake from forests affected by high mortality rates (Lamers
etal., 2013), whereas the removal of slowly decomposing residues
reduces soil carbon accumulation at a site and results in net emis-
sions (Repo etal., 2011). The anticipation of future bioenergy mar-
kets may promote optimized forest management practices or affor-
estation of marginal land areas to establish managed plantations,
thus contributing to increased forest carbon stocks (Sedjo and Tian,
2012). Rather than leading to wide-scale loss of forest lands, growing
markets for tree products can provide incentives for maintaining or
increasing forest stocks and land covers, and improving forest health
through management (Eisenbies et al., 2009; Dale et al., 2013). If
managed to maximize CO
2
storage rate over the long-term, long-term
rotation forests offer low-cost mitigation options, in particular, when
woody products keep carbon within the human-built environment
over long time-scales (e. g., wood substituting for steel joist; (Lippke
etal., 2011).
Indirect land-use change is difficult to ascertain because the magni-
tude of these effects must be modelled (Nassar etal., 2011) raising
important questions about model validity and uncertainty (Liska and
Perrin, 2009; Plevin etal., 2010; Khanna etal., 2011; Gawel and Lud-
wig, 2011; Wicke etal., 2012) and policy implications (DeCicco, 2013;
Finkbeiner, 2013; Plevin etal., 2013). Available model-based studies
have consistently found positive and, in some cases, high emissions
from LUC and iLUC, mostly of first-generation biofuels (Figure 11.23),
albeit with high variability and uncertainty in results (Hertel et al.,
2010; Taheripour etal., 2011; Dumortier etal., 2011; Havlík etal., 2011;
Chen etal., 2012; Timilsina etal., 2012; Warner etal., 2014). Causes
of the great uncertainty include: incomplete knowledge on global
economic dynamics (trade patterns, land-use productivity, diets, use
of by-products, fuel prices, and elasticities); selection of specific poli-
cies modelled; and the treatment of emissions over time (O’Hare etal.,
2009; Khanna etal., 2011; Wicke etal., 2012). In addition, LUC mod-
elling philosophies and model structures and features (e. g., dynamic
vs. static model) differ among studies. Variations in estimated GHG
emissions from biofuel-induced LUC are also driven by differences
in scenarios assessed, varying assumptions, inconsistent definitions
across models (e. g., LUC, land type), specific selection of reference sce-
narios against which (marginal) LUC is quantified, and disparities in
data availability and quality. The general lack of thorough sensitivity
and uncertainty analysis hampers the evaluation of plausible ranges of
estimates of GHG emissions from LUC.
Wicke etal. (2012) identified the need to incorporate the impacts of
iLUC prevention or mitigation strategies in future modelling efforts,
including the impact of zoning and protection of carbon stocks, selec-
tive sourcing from low risk-areas, policies and investments to improve
agricultural productivity, double cropping, agroforestry schemes, and
the (improved) use of degraded and marginal lands (see Box 7.1).
Indirect land-use change is mostly avoided in the modelled mitiga-
tion pathways in Chapter 6. The relatively limited fuel coverage in
the literature precludes a complete set of direct comparisons across
alternative and conventional fuels sought by regulatory bodies and
researchers.
GHG emissions from LUC can be reduced, for instance through pro-
duction of bioenergy co-products that displace additional feedstock
requirements, thus decreasing the net area needed (e. g., for corn,
Wang etal., 2011a; for wheat, Berndes et al., 2011). Proper man-
agement of livestock and agriculture can lead to improved resource
efficiency, lower GHG emissions, and lower land use while releas-
ing land for bioenergy production as demonstrated for Europe (de
Wit etal., 2013) and Mozambique (van der Hilst etal., 2012b). For
land transport, cellulosic biomass, such as Miscanthus, has been sug-
gested as a relatively low-carbon source for bioethanol that could
be produced at scale, but only if iLUC can be avoided by not displac-
ing food and other commodities and if comprehensive national land
management strategies are developed (e. g., Dornburg etal., 2010;
Scown etal., 2012). Negative iLUC values are theoretically possible
(RFA, 2008). Producing biofuels from wastes and sustainably har-
vested residues, and replacing first-generation biofuel feedstocks
with lignocellulosic crops (e. g., grasses) would induce little or no
iLUC (Davis etal., 2011b; Scown etal., 2012). While iLUC quanti-
fications remain uncertain, lower agricultural yields, land-intensive
diets, and livestock feeding efficiencies, stronger climate impacts and
higher energy crop production levels can result in higher LUC-related
GHG emissions. Strong global and regional governance (forest pro-
tection, zoning), technological change in agriculture and biobased
options, and high-yield bioenergy crops and use of residues and
degraded land (if available) could all reduce iLUC (Van Dam etal.,
2009a; b; Wicke etal., 2009; Fischer etal., 2010; de Wit etal., 2011,
2013; van der Hilst etal., 2012a; Rose etal., 2013). As with any other
renewable fuel, bioenergy can replace or complement fossil fuel.
The fossil fuel replacement effect, relevant when a global cap on
CO
2
emissions is absent, is discussed in Chapter 8.7. Indirect effects
are not restricted to indirect GHG effects of production of biomass
in agricultural systems; there are also indirect (market-mediated)
effects of wood energy, but also effects in terms of biodiversity
threats, environmental degradation, and external social costs, which
are not considered here.

882882
Agriculture, Forestry and Other Land Use (AFOLU)
11
Chapter 11
11�13�5 Aggregate future potential deployment
in integrated models
In SRREN scenarios (IPCC, 2011), bioenergy is projected to contribute
80 – 190 EJ / yr to global primary energy supply by 2050 for 50 % of
the scenarios in the two mitigation levels modelled. The min to max
ranges were 20 – 265 EJ / yr for the less stringent scenarios and 25 – 300
EJ for the tight mitigation scenarios (<440 ppm). Many of these
scenarios coupled bioenergy with CCS. The Global Energy Assessment
(GEA, 2012) scenarios project 80 – 140 EJ by 2050, including extensive
use of agricultural residues and second-generation bioenergy to try to
reduce the adverse impacts on land use and food production, and the
co-processing of biomass with coal or natural gas with CCS to make
low net GHG-emitting transport fuels and or electricity.
Traditional biomass demand is steady or declines in most scenarios
from 34 EJ / yr. The transport sector increases nearly ten-fold from 2008
to 18 – 20 EJ / yr while modern uses for heat, power, combinations, and
industry increase by factors of 2 – 4 from 18 EJ in 2008 (Fischedick
etal., 2011). The 2010 International Energy Agency (IEA) model proj-
ects a contribution of 12 EJ / yr (11 %) by 2035 to the transport sector,
including 60 % of advanced biofuels for road and aviation. Bioenergy
supplies 5 % of global power generation in 2035, up from 1 % in 2008.
Modern heat and industry doubles their contributions from 2008 (IEA,
2010). The future potential deployment level varies at the global and
national level depending on the technological developments, land
availability, financial viability, and mitigation policies.
The WGIII AR5 transformation pathway studies suggest that modern
bioenergy could play a significant role within the energy system (Sec-
tion 6.3.5) providing 5 to 95 EJ / yr in 2030, 10 to 245 EJ / yr in 2050, and
105 to 325 EJ / yr in 2100 under idealized full implementation scenarios
(see also Figure 7.12), with immediate, global, and comprehensive
incentives for land-related mitigation options. The scenarios project
increasing deployment of bioenergy with tighter climate change tar-
gets, both in a given year as well as earlier in time (see Figure 6.20).
Models project increased dependence, as well as increased deploy-
ment, of modern bioenergy, with some models projecting 35 % of total
primary energy from bioenergy in 2050, and as much as 50 % of total
primary energy from modern bioenergy in 2100. Bioenergy’s share of
regional total electricity and liquid fuels could be significant — up to
35 % of global regional electricity from biopower by 2050, and up to
70 % of global regional liquid fuels from biofuels by 2050. However,
the cost-effective allocation of bioenergy within the energy system
varies across models. Several sectoral studies, focusing on biophysical
constraints, model assumptions (e. g., estimated increase in crop yields
over large areas) and current observations, suggest to focus on the
lower half of the ranges reported above (Field etal., 2008; Campbell
etal., 2008; Johnston etal., 2009a, 2011; Haberl etal., 2013b).
BECCS features prominently in many mitigation scenarios. BECCS
is deployed in greater quantities and earlier in time the more strin-
gent the climate policy (Section 6.3.5). Whether BECCS is essential for
mitigation, or even sufficient, is unclear. In addition, the likelihood of
BECCS deployment is difficult to evaluate and depends on safety con-
Box 11�9 | Examples of co-benefits from biofuel production
Brazilian sugar cane ethanol production provides six times more
jobs than the Brazilian petroleum sector and spreads income bene-
fits across numerous municipalities (de Moraes etal., 2010). Worker
income is higher than in nearly all other agricultural sectors (de
Moraes etal., 2010; Satolo and Bacchi, 2013) and several sustain-
ability standards have been adopted (Viana and Perez, 2013). When
substituting gasoline, ethanol from sugar cane also eliminates lead
compounds and reduces noxious emissions (Goldemberg etal.,
2008). Broader strategic planning, understanding of cumulative
impacts, and credible and collaborative decision making processes
can help to enhance biodiversity and reverse ecological fragmenta-
tion, address direct and iLUC, improve the quality and durability of
livelihoods, and other sustainability issues (Duarte etal., 2013).
Co-benefits of palm oil production have been reported in the
major producer countries, Malaysia and Indonesia (Sumathi etal.,
2008; Lam etal., 2009) as well as from new producer countries
(Garcia-Ulloa etal., 2012). Palm oil production results in employ-
ment creation as well as in increment state and individual income
(Sumathi etal., 2008; Tan etal., 2009; Lam etal., 2009; Sayer
etal., 2012; von Geibler, 2013). When combined with agroforestry,
palm oil plantations can increase food production locally and
have a positive impact on biodiversity (Lam etal., 2009; Garcia-
Ulloa etal., 2012) and when palm oil plantations are installed
on degraded land further co-benefits on biodiversity and carbon
enhancement (Sumathi etal., 2008; Garcia-Ulloa etal., 2012;
Sayer etal., 2012). Further, due to its high productivity, palm oil
plantations can produce the same bioenergy input using less
land than other bio-energy crops (Sumathi etal., 2008; Tan etal.,
2009). Certification in palm oil production can become a means
for increasing sustainable production of biofuels (Tan etal., 2009;
Edser, 2012; von Geibler, 2013).
Similarly, co-benefits from the production of Jatropha as a biofuel
crop in developing countries have been reported, mainly when
Jatropha is planted on degraded land. These include increases
in individuals’ incomes (Garg etal., 2011; Arndt etal., 2012),
improvement in energy security at the local level (von Maltitz and
Setzkorn, 2013; Muys etal., 2014), and reducing soil erosion (Garg
etal., 2011).

883883
Agriculture, Forestry and Other Land Use (AFOLU)
11
Chapter 11
firmations, affordability and public acceptance (see Section 11.13.3 for
details). BECCS may also affect the cost-effective emissions trajectory
(Richels etal., In Review; Rose etal., 2013).
Some integrated models are cost-effectively trading off lower land car-
bon stocks and increased land N
2
O emissions for the long-run mitiga-
tion benefits of bioenergy (Rose etal., 2013; Popp etal., 2013). The
models find that bioenergy could contribute effectively to climate
change mitigation despite land conversion and intensification emis-
sions. However, as discussed below and in Section 11.9, policy imple-
mentation and coordination are factors to consider. In these models,
constraining bioenergy has a cost. For instance, limiting global bioen-
ergy availability to 100 EJ / year tripled marginal abatement costs and
doubled consumption losses associated with transformation pathways
(Rose etal., 2013). Overall outcomes may depend strongly on gover-
nance of land use and deployment of best practices in agricultural pro-
duction (see sections above). Progressive developments in governance
of land and modernization of agriculture and livestock and effective
sustainability frameworks can help realize large parts of the technical
bioenergy potential with low associated GHG emissions.
With increasing scarcity of productive land, the growing demand for
food and bioenergy could induce substantial LUC causing high GHG
emissions and / or increased agricultural intensification and higher N
2
O
emissions unless wise integration of bioenergy into agriculture and for-
estry landscapes occurs (Delucchi, 2010). Consideration of LUC emis-
sions in integrated models show that valuing or protecting global ter-
restrial carbon stocks reduces the potential LUC-related GHG emissions
of energy crop deployment, and could lower the cost of achieving cli-
mate change objectives, but could exacerbate increases in agricultural
commodity prices (Popp etal., 2011; Reilly etal., 2012). Many inte-
grated models are investigating idealized policy implementation path-
ways, assuming global prices on GHG (including the terrestrial land
carbon stock); if such conditions cannot be realized, certain types of
bioenergy could lead to additional GHG emissions. More specifically, if
the global terrestrial land carbon stock remains unprotected, large GHG
emissions from bioenergy-related LUC alone are possible (Melillo etal.,
2009; Wise etal., 2009; Creutzig etal., 2012a; Calvin etal., 2013b).
In summary, recent integrated model scenarios project between
10 – 245 EJ / yr modern bioenergy deployment in 2050. Good gover-
nance and favourable conditions for bioenergy development may facil-
itate higher bioenergy deployment while sustainability and livelihood
concerns might constrain deployment of bioenergy scenarios to low
values (see Section 11.13.6).
11�13�6 Bioenergy and sustainable development
The nature and extent of the impacts of implementing bioenergy
depend on the specific system, the development context, and on the
size of the intervention (Section 11.4.5). The effects on livelihoods
have not yet been systematically evaluated in integrated models (Davis
etal., 2013; Creutzig etal., 2012b; Creutzig etal., 2013; Muys etal.,
2014), even if human geography studies have shown that bioenergy
deployment can have strong distributional impacts (Davis etal., 2013;
Muys etal., 2014). The total effects on livelihoods will be mediated
by global market dynamics, including policy regulations and incentives,
the production model and deployment scale, and place-specific factors
such as governance, land tenure security, labour and financial capabili-
ties, among others (Creutzig etal., 2013).
Bioenergy projects can be economically beneficial, e. g., by raising and
diversifying farm incomes and increasing rural employment through
the production of biofuels for domestic use (Gohin, 2008) or export
markets (Wicke etal., 2009; Arndt etal., 2011).
The establishment of large-scale biofuels feedstock production can
also cause smallholders, tenants, and herders to lose access to pro-
ductive land, while other social groups such as workers, investors,
company owners, biofuels consumers, and populations who are
more responsible for GHG emission reductions enjoy the benefits of
this production (van der Horst and Vermeylen, 2011). This is particu-
larly relevant where large areas of land are still unregistered or are
being claimed and under dispute by several users and ethnic groups
(Dauvergne and Neville, 2010). Furthermore, increasing demand for
first-generation biofuels is partly driving the expansion of crops like
soy and oil palm, which in turn contribute to promote large-scale agri-
businesses at the expense of family and community-based agriculture,
in some cases (Wilkinson and Herrera, 2010). Biofuels deployment can
also translate into reductions of time invested in on-farm subsistence
and community-based activities, thus translating into lower produc-
tivity rates of subsistence crops and an increase in intra-community
conflicts as a result of the uneven share of collective responsibilities
(Mingorría etal., 2010).
Bioenergy deployment is more beneficial when it is not an additional
land-use activity expanding over the landscape, but rather integrates
into existing land uses and influences the way farmers and forest
owners use their land. Various studies indicate the ecosystem services
and values that perennial crops have in restoring degraded lands, via
agroforestry systems, controlling erosion, and even in regional climate
effects such as improved water retention and precipitation (Faaij, 2006;
Wicke etal., 2011c; Immerzeel etal., 2013). Examples include adjust-
ments in agriculture practices where farmers, for instance, change their
manure treatment to produce biogas, reduce methane and N losses.
Changes in management practice may swing the net GHG balance
of options and also have clear sustainable development implications
(Davis etal., 2013).
Small-scale bioenergy options can provide cost-effective alternatives
for mitigating climate change, at the same time helping advance sus-
tainable development priorities, particularly in rural areas of devel-
oping countries. IEA (2012b) estimates that 2.6 billion people world-

884884
Agriculture, Forestry and Other Land Use (AFOLU)
11
Chapter 11
Table 11�12 | Potential institutional, social, environmental, economic and technological implications of bioenergy options at local to global scale.
Institutional Scale
May contribute to energy independence (+), especially at the local level (reduce dependency on fossil fuels) (2, 20, 32, 39,50) + Local to national
Can improve (+) or decrease (–) land tenure and use rights for local stakeholders (2, 17, 38, 50) + / – Local
Cross-sectoral coordination (+) or conflicts (–) between forestry, agriculture, energy, and / or mining (2, 13, 26, 31, 60) + / – Local to national
Impacts on labor rights among the value chain (2, 6, 17) + / – Local to national
Promoting of participative mechanisms for small-scale producers (14, 15) + Local to national
Social Scale
Competition with food security including food availability (through reduced food production at the local level), food
access (due to price volatility), usage (as food crops can be diverted towards biofuel production), and consequently to
food stability. Bio-energy derived from residues, wastes, or by-products is an exception (1,2, 7, 9, 12, 18, 23)
– Local to global
Integrated systems (including agroforestry) can improve food production at the local level creating a positive impact towards food security (51, 52,
53, 69, 73, 74). Further, biomass production combined with improved agricultural management can avoid such competition and bring investment
in agricultural production systems with overall improvements of management as a result (as observed in Brazil) (60, 63 66, 67, 70, 71)
+ Local
Increasing (+) or decreasing (–) existing conflicts or social tension (9, 14, 19, 26) + / – Local to national
Impacts on traditional practices: using local knowledge in production and treatment of bioenergy
crops (+) or discouraging local knowledge and practices (–) (2, 50)
+ / – Local
Displacement of small-scale farmers (14, 15, 19). Bioenergy alternatives can also empower local farmers by creating local income opportunities + / – Local
Promote capacity building and new skills (3, 15, 50) + Local
Gender impacts (2, 4, 14, 15, 27) + / – Local to national
Efficient biomass techniques for cooking (e. g., biomass cookstoves) can have positive impacts on
health, especially for women and children in developing countries (42, 43, 44)
+ Local to national
Environmental Scale
Biofuel plantations can promote deforestation and / or forest degradation, under weak or no regulation (1, 8, 22) – Local to global
When used on degraded lands, perennial crops offer large-scale potential to improve soil carbon and structure, abate
erosion and salinity problems. Agroforestry schemes can have multiple benefits including increased overall biomass
production, increase biodiversity and higher resilience to climate changes. (59, 64, 65, 69, 73)
+ Local to global
Some large-scale bio-energy crops can have negative impacts on soil quality, water pollution, and biodiversity. Similarly potential adverse side-effects
can be a consequence of increments in use of fertilizers for increasing productivity (7, 12, 26, 30). Experience with sugarcane plantations has shown
that they can maintain soil structure (56) and application of pesticides can be substituted by the use of natural predators and parasitoids (57, 71)
– / + Local to transboundary
Can displace activities or other land uses (8, 26) – Local to global
Smart modernization and intensification can lead to lower environmental impacts and more efficient land use (75, 76) + Local to transboundary
Creating bio-energy plantations on degraded land can have positive impacts on soil and biodiversity (12) + Local to transboundary
There can be tradeoffs between different land uses, reducing land availability for local stakeholders (45, 46, 47,48, 49). Multicropping
system provide bioenergy while better maintaining ecological diversity and reducing land-use competition (58)
– / + Local to national
Ethanol utilization leads to the phaseout of lead addititives and methyl tertiary-butyl ether (MBTE)
and reduces sulfur, particulate matter, and carbon monoxide emissions (55)
+ Local to global
Economic Scale
Increase in economic activity, income generation, and income diversification (1, 2, 3, 12, 20, 21, 27, 54) + Local
Increase (+) or decrease (–) market opportunities (16, 27, 31) + / – Local to national
Contribute to the changes in prices of feedstock (2, 3, 5, 21) + / – Local to global
May promote concentration of income and / or increase poverty if sustainability criteria and strong governance is not in place (2, 16, 26) – Local to regional
Using waste and residues may create socio-economic benefits with little environmental risks (2, 41, 36) + Local to regional
Uncertainty about mid- and long-term revenues (6, 30) – National
Employment creation (3, 14, 15) + Local to regional
Technological Scale
Can promote technology development and / or facilitate technology transfer (2, 27, 31) + Local to global
Increasing infrastructure coverage (+). However if access to infrastructure and / or technology is
reduced to few social groups it can increase marginalization (–) (27, 28, 29)
+ / – Local
Bioenergy options for generating local power or to use residues may increase labor demand, creating new job opportunities.
Participatory technology development also increases acceptance and appropriation (6, 8, 10, 37, 40)
+ Local
Technology might reduce labor demand (–). High dependent of tech. transfer and / or acceptance – Local
⇒

885885
Agriculture, Forestry and Other Land Use (AFOLU)
11
Chapter 11
wide depend on traditional biomass for cooking, while 84 % of these
belong to rural communities. Use of low-quality fuels and inefficient
cooking and heating devices leads to pollution resulting in nearly 4
million premature deaths every year, and a range of chronic illnesses
and other health problems (Lim et al., 2012; see Section 9.7.3.1).
Modern small-scale bioenergy technologies such as advanced / effi-
cient cook stoves, biogas for cooking and village electrification, bio-
mass gasifiers, and bagasse-based co-generation systems for decen-
tralized power generation, can provide energy for rural communities
with energy services that also promote rural development (IEA, 2011).
Such bioenergy systems reduce CO
2
emissions from unsustainable
biomass harvesting and short-lived climate pollutants, e. g., black car-
bon, from cleaner combustion (Chung etal., 2012). Scaling up clean
cookstove initiatives could not only save 2 million lives a year, but
also significantly reduce GHG emissions (Section 11.13.3). Efficient
biomass cook stoves and biogas stoves at the same time provide mul-
tiple benefits: They reduce the pressure on forests and biodiversity;
they reduce exposure to smoke-related health hazards; they reduce
drudgery for women in collection fuelwood; and they save money if
fuel needs to be purchased (Martin etal., 2011). Benefits from the
dissemination of improved cookstoves outweigh their costs by seven-
fold, when their health, economic, and environmental benefits are
accounted for (Garcia-Frapolli etal., 2010).
Table 11.12 presents the implications of bioenergy options in the light
of social, institutional, environmental, economic, and technological
conditions. The relationship between bioenergy and these conditions is
complex and there could be negative or positive implications, depend-
ing on the type of bioenergy option, the scale of the production sys-
tem and the local context. While biofuels can allow the reduction of
fossil fuel use and of GHG emissions, they often shift environmental
burdens towards land use-related impacts (i. e., eutrophication, acidifi-
cation, water depletion, ecotoxicity; EMPA, 2012; Smith and Torn, 2013;
Tavoni and Socolow, 2013). Co-benefits and adverse side-effects do
not necessarily overlap, neither geographically nor socially (Dauvergne
and Neville, 2010; Wilkinson and Herrera, 2010; van der Horst and Ver-
meylen, 2011). The main potential co-benefits are related to access
to energy and impacts on the economy and well-being, jobs creation,
and improvement of local resilience (Walter etal., 2011; Creutzig etal.,
2013). Main risks of crop-based bioenergy for sustainable develop-
ment and livelihoods include competition for arable land (Haberl etal.,
2013b) and consequent impact on food security, tenure arrangements,
displacement of communities and economic activities, creation of a
driver of deforestation, impacts on biodiversity, water, and soil, or incre-
ment in vulnerability to climate change, and unequal distribution of
benefits (Sala etal., 2000; Hall etal., 2009; German etal., 2011; Thomp-
son etal., 2011b; IPCC, 2012).
Good governance is an essential component of a sustainable energy
system. Integrated studies that compare impacts of bioenergy produc-
tion between different crops and land management strategies show
that the overall impact (both ecological and socio-economic) depends
strongly on the governance of land use and design of the bioenergy
system see van der Hilst etal. (2012) in the European context, and Van
Dam etal. (2009a; b) for different crops and scenarios in Argentina).
Van Eijck etal. (2012) show similar differences in impacts between
the production and use of Jatropha based on smallholder production
versus plantation models. This implies that governance and planning
have a strong impact on the ultimate result and impact of large-scale
bioenergy deployment. Legislation and regulation of bioenergy as well
as voluntary certification schemes are required to guide bioenergy
production system deployment so that the resources and feedstocks
be put to best use, and that (positive and negative) socioeconomic
and environmental issues are addressed as production grows (van
Dam etal., 2010). There are different options, from voluntary to legal
and global agreements, to improve governance of biomass markets
and land use that still require much further attention (Verdonk etal.,
2007). The integration of bioenergy systems into agriculture and for-
est landscapes can improve land and water use efficiency and help
address concerns about environmental impacts of present land use
(Berndes etal., 2004, 2008; Börjesson and Berndes, 2006; Sparovek
etal., 2007; Gopalakrishnan et al., 2009, 2011a; b, 2012; Dimitriou
etal., 2009, 2011; Dornburg etal., 2010; Batidzirai etal., 2012; Parish
etal., 2012; Baum et al., 2012; Busch, 2012), but the global poten-
tials of such systems are difficult to determine (Berndes and Börjesson,
2007; Dale and Kline, 2013). Similarly, existing and emerging guiding
principles and governance systems influence biomass resources avail-
ability (Stupak etal., 2011). Certification approaches can be useful, but
they should be accompanied by effective territorial policy frameworks
(Hunsberger etal., 2012).
1
Alves Finco and Doppler (2010);
2
Amigun etal. (2011);
3
Arndt etal. (2012);
4
Arndt etal. (2011);
5
Arndt etal.(2012);
6
Awudu and Zhang (2012);
7
Beringer etal. (2011);
8
Borzoni
(2012);
9
Bringezu etal. (2012);
10
Cacciatore etal. (2012);
11
Cançado etal. (2006);
12
Danielsen etal. (2009);
13
Diaz-Chavez (2011);
14
Duvenage etal. (2013);
15
Ewing and Msangi
(2009);
16
Gasparatos etal. (2011);
17
German and Schoneveld (2012);
18
Haberl etal. (2011a);
19
Hall etal. (2009);
20
Hanff etal. (2011);
21
Huang etal. (2012);
22
Koh and Wilcove
(2008);
23
Koizumi (2013);
24
Kyu etal. (2010);
25
Madlener etal. (2006);
26
Martinelli and Filoso (2008);
27
Mwakaje (2012);
28
Oberling etal. (2012);
29
Schut etal. (2010);
30
Selfa etal.
(2011);
31
Steenblik (2007);
32
Stromberg and Gasparatos (2012);
33
Searchinger etal. (2009);
34
Searchinger etal. (2008);
35
Smith and Searchinger (2012);
36
Tilman etal. (2009);
37
Van
de Velde etal. (2009);
38
von Maltitz and Setzkorn (2013);
39
Wu and Lin (2009);
40
Zhang etal. (2011);
41
Fargione etal. (2008);
42
Jerneck and Olsson (2013);
43
Gurung and Oh (2013);
44
O’Shaughnessy etal. (2013);
45
German etal. (2013);
46
Cotula (2012);
47
Mwakaje (2012);
48
Scheidel and Sorman (2012);
49
Haberl etal.(2013b);
50
Muys etal. (2014);
51
Egeskog
etal. (2011);
52
Diaz-Chavez (2012);
53
Ewing and Msangi (2009);
54
de Moraes etal. (2010);
55
Goldemberg (2007);
56
Walter etal. (2011);
57
Macedo (2005);
58
Langeveld etal. (2013);
59
Van Dam etal. (2009a; b);
60
van Dam etal. (2010);
61
van Eijck etal. (2012);
62
van Eijck etal. (2014);
63
Martínez etal. (2013);
64
van der Hilst etal. (2010);
65
van der Hilst etal.
(2012);
66
van der Hilst and Faaij (2012);
67
van der Hilst etal. (2012b);
68
Hoefnagels etal. (2013);
69
Immerzeel etal. (2013);
70
Lynd etal. (2011);
71
Smeets etal. (2008);
72
Smeets and
Faaij (2010);
73
Wicke etal. (2013);
74
Wiskerke etal. (2010);
75
De Wit etal. (2011);
76
de Wit etal. (2013)

886886
Agriculture, Forestry and Other Land Use (AFOLU)
11
Chapter 11
11�13�7 Tradeoffs and synergies with land,
water, food, and biodiversity
This section summarizes results from integrated models (models that
have a global aggregate view, but cannot disaggregate place-specific
effects in biodiversity and livelihoods discussed above) on land, water,
food, and biodiversity. In these models, at any level of future bioenergy
supply, land demand for bioenergy depends on (1) the share of bioen-
ergy derived from wastes and residues (Rogner etal., 2012); (2) the
extent to which bioenergy production can be integrated with food or
fiber production, which ideally results in synergies (Garg etal., 2011;
Sochacki etal., 2013) or at least mitigates land-use competition (Ber-
ndes etal., 2013); (3) the extent to which bioenergy can be grown
on areas with little current or future production, taking into account
growing land demand for food (Nijsen etal., 2012); and (4) the vol-
ume of dedicated energy crops and their yields (Haberl etal., 2010;
Batidzirai etal., 2012; Smith etal., 2012d). Energy crop yields per unit
area may differ by factors of >10 depending on differences in natural
fertility (soils, climate), energy crop plants, previous land use, manage-
ment and technology (Johnston etal., 2009a; Lal, 2010; Beringer etal.,
2011; Pacca and Moreira, 2011; Smith etal., 2012a; Erb etal., 2012a).
Assumptions on energy crop yields are one of the main reasons for
the large differences in estimates of future area demand of energy
crops (Popp etal., 2013). Likewise, assumptions on yields, strategies,
and governance on future food / feed crops have large implications for
assessments of the degree of land competition between biofuels and
these land uses (Batidzirai etal., 2012; de Wit etal., 2013).
However, across models, there are very different potential landscape
transformation visions in all regions (Sections 6.3.5 and 11.9.). Overall,
it is difficult to generalize on regional land cover effects of mitigation.
Some models assume significant land conversion while other models
do not. In idealized implementation scenarios, there is expansion of
energy cropland and forest land in many regions, with some models
exhibiting very strong forest land expansion and others very little by
2030. Land conversion is increased in the 450 ppm scenarios compared
to the 550 ppm scenarios, but at a declining share, a result consistent
with a declining land-related mitigation rate with policy stringency.
The results of these integrated model studies need to be interpreted
with caution, as not all GHG emissions and biogeophysical or socio-
economic effects of bioenergy deployment are incorporated into these
models, and as not all relevant technologies are represented (e. g., cas-
cade utilization).
Large-scale bioenergy production from dedicated crops may affect
water availability and quality (see Section 6.6.2.6), which are highly
dependent on (1) type and quantity of local freshwater resources;
(2) necessary water quality; (3) competition for multiple uses (agri-
cultural, urban, industrial, power generation), and (4) efficiency in all
sector end uses (Gerbens-Leenes etal., 2009; Coelho etal., 2012). In
many regions, additional irrigation of energy crops could further inten-
sify existing pressures on water resources (Popp etal., 2011). Studies
indicate that an exclusion of severe water scarce areas for bioenergy
production (mainly to be found in the Middle East, parts of Asia, and
western United States) would reduce global technical bioenergy poten-
tials by 17 % until 2050 (van Vuuren etal., 2009). A model compari-
son study with five global economic models shows that the aggregate
food price effect of large-scale lignocellulosic bioenergy deployment
(i. e., 100 EJ globally by the year 2050) is significantly lower (+5 %
on average across models) than the potential price effects induced
by climate impacts on crop yields (+25 % on average across models
(Lotze-Campen etal., 2013). Possibly hence, ambitious climate change
mitigation need not drive up global food prices much, if the extra land
required for bioenergy production is accessible or if the feedstock, e. g.,
from forests, does not directly compete for agricultural land. Effective
land-use planning and strict adherence to sustainability criteria need to
be integrated into large-scale bioenergy projects to minimize competi-
tions for water (for example, by excluding the establishment of biofuel
projects in irrigated areas). If bioenergy is not managed properly, addi-
tional land demand and associated LUC may put pressures on biodi-
versity (Groom etal., 2008; see Section 6.6.2.5). However, implement-
ing appropriate management, such as establishing bioenergy crops
in degraded areas represents an opportunity where bioenergy can be
used to achieve positive environmental outcomes (Nijsen etal., 2012).

887887
Agriculture, Forestry and Other Land Use (AFOLU)
11
Chapter 11
References
Abdalla M�, B� Osborne, G� Lanigan, D� Forristal, M� Williams, P� Smith, and
M� B� Jones (2013)� Conservation tillage systems: a review of its consequences
for greenhouse gas emissions. Soil Use and Management 29, 199 – 209. doi:
10.1111 / sum.12030, ISSN: 02660032.
Ackerman F�, S� J� DeCanio, R� B� Howarth, and K� Sheeran (2009)� Limitations
of integrated assessment models of climate change. Climatic Change 95,
297 – 315. doi: 10.1007 / s10584 - 009 - 9570-x, ISSN: 0165-0009, 1573 – 1480.
Acuff K�, and D� T� Kaffine (2013)� Greenhouse gas emissions, waste and recycling
policy. Journal of Environmental Economics and Management 65, 74 – 86. doi:
10.1016 / j.jeem.2012.05.003, ISSN: 00950696.
Agrawal A�, A� Chhatre, and R� Hardin (2008)� Changing Governance of the
World’s Forests. Science 320, 1460 – 1462. doi: 10.1126 / science.1155369, ISSN:
0036-8075, 1095 – 9203.
Akiyama H�, X� Yan, and K� Yagi (2010)� Evaluation of effectiveness of enhanced-
efficiency fertilizers as mitigation options for N
2
O and NO emissions from agri-
cultural soils: meta-analysis: Mitigation options for N
2
O and NO emissions.
Global Change Biology 16, 1837 – 1846. doi: 10.1111 / j.1365 - 2486.2009.0203
1.x, ISSN: 13541013, 13652486.
Albers H� J�, and E� J� Z� Robinson (2013)� A review of the spatial economics of
non-timber forest product extraction: Implications for policy. Ecological Eco-
nomics 92, 87 – 95. doi: 10.1016 / j.ecolecon.2012.01.021, ISSN: 09218009.
Alig R�, G� Latta, D� Adams, and B� McCarl (2010)� Mitigating greenhouse gases:
The importance of land base interactions between forests, agriculture, and resi-
dential development in the face of changes in bioenergy and carbon prices. For-
est Policy and Economics 12, 67 – 75. doi: 10.1016 / j.forpol.2009.09.012, ISSN:
1389-9341.
Allen C� D�, A� K� Macalady, H� Chenchouni, D� Bachelet, N� McDowell, M�
Vennetier, T� Kitzberger, A� Rigling, D� D� Breshears, E� Hogg, and others
(2010)� A global overview of drought and heat-induced tree mortality reveals
emerging climate change risks for forests. Forest Ecology and Management
259, 660 – 684.
Allen D� E�, D� S� Mendham, Bhupinderpal-Singh, A� Cowie, W� Wang, R� C�
Dalal, and R� J� Raison (2009)� Nitrous oxide and methane emissions from
soil are reduced following afforestation of pasture lands in three contrast-
ing climatic zones. Soil Research 47, 443 – 458. Available at: http: / / dx.doi.
org / 10.1071 / SR08151.
Alves Finco M� V�, and W� Doppler (2010)� Bioenergy and sustainable develop-
ment: The dilemma of food security in the Brazilian savannah. Energy for Sus-
tainable Development 14, 194 – 199.
Amazon Fund Fundo Amazônia. Available at: http: / / www. amazonfund. gov. br / Fun-
doAmazonia / fam / site_en.
Amigun B�, J� K� Musango, and W� Stafford (2011)� Biofuels and sustainability
in Africa. Renewable and Sustainable Energy Reviews 15, 1360 – 1372. doi:
10.1016 / j.rser.2010.10.015, ISSN: 1364-0321.
Anderson K� (2010)� Globalization’s effects on world agricultural trade,
1960 – 2050. Philosophical Transactions of the Royal Society B: Biological Sci-
ences 365, 3007 – 3021. doi: 10.1098 / rstb.2010.0131.
Anderson R� C�, N� A� Krueger, T� B� Stanton, T� R� Callaway, T� S� Edrington, R� B�
Harvey, Y� S� Jung, and D� J� Nisbet (2008)� Effects of select nitrocompounds
on in vitro ruminal fermentation during conditions of limiting or excess added
reductant. Bioresource Technology 99, 8655 – 8661.
Anderson-Teixeira K� J�, S� C� Davis, M� D� Masters, and E� H� Delucia (2009)�
Changes in soil organic carbon under biofuel crops. GCB Bioenergy 1, 75 – 96.
doi: 10.1111 / j.1757 - 1707.2008.01001.x, ISSN: 1757-1707.
Anderson-Teixeira K� J�, P� K� Snyder, T� E� Twine, S� V� Cuadra, M� H� Costa,
and E� H� DeLucia (2012)� Climate-regulation services of natural and agri-
cultural ecoregions of the Americas. Nature Climate Change 2, 177 – 181. doi:
10.1038 / nclimate1346, ISSN: 1758-678X.
Anenberg S� C�, K� Balakrishnan, J� Jetter, O� Masera, S� Mehta, J� Moss, and V�
Ramanathan (2013)� Cleaner Cooking Solutions to Achieve Health, Climate,
and Economic Cobenefits. Environmental Science & Technology 47, 3944 – 3952.
doi: 10.1021 / es304942e, ISSN: 0013-936X.
Angassa A�, and G� Oba (2008)� Effects of management and time on mechanisms
of bush encroachment in southern Ethiopia. African Journal of Ecology 46,
186 – 196. doi: 10.1111 / j.1365 - 2028.2007.00832.x, ISSN: 1365-2028.
Angelsen A� (2008)� Moving Ahead with REDD: Issues, Options and Implications.
CIFOR, Bogor Barat, Indonesia, 172 pp. ISBN: 9789791412766.
Angelsen A�, C� Streck, L� Peskett, J� Brown, and C� Luttrell (2008)� What Is
the Right Scale for REDD? The Implications of National, Subnational and
Nested Approaches. CIFOR, Bogor Barat, Indonesia, 6 pp. Available at:
http: / / 62.225.2.55 / files / methods_science / redd / application / pdf / what_is_the_
right_scale_for_redd.pdf.
Angst T� E�, C� J� Patterson, D� S� Reay, P� Anderson, T� A� Peshkur, and S� P�
Sohi (2013)� Biochar Diminishes Nitrous Oxide and Nitrate Leaching from
Diverse Nutrient Sources. Journal of Environment Quality 42, 672. doi:
10.2134 / jeq2012.0341, ISSN: 0047-2425.
Araujo C�, C� A� Bonjean, J�-L� Combes, P� Combes Motel, and E� J� Reis (2009)�
Property rights and deforestation in the Brazilian Amazon. Ecological Econom-
ics 68, 2461 – 2468. doi: 10.1016 / j.ecolecon.2008.12.015, ISSN: 0921-8009.
Arcidiacono-Bársony C�, P� Ciais, N� Viovy, and N� Vuichard (2011)� REDD
Mitigation. Procedia Environmental Sciences 6, 50 – 59. doi: 10.1016 / j.pro-
env.2011.05.006, ISSN: 18780296.
Argo A� M�, E� C� Tan, D� Inman, M� H� Langholtz, L� M� Eaton, J� J� Jacobson,
C� T� Wright, D� J� Muth, M� M� Wu, Y�-W� Chiu, and R� L� Graham (2013)�
Investigation of biochemical biorefinery sizing and environmental sustain-
ability impacts for conventional bale system and advanced uniform biomass
logistics designs. Biofuels, Bioproducts and Biorefining 7, 282 – 302. doi:
10.1002 / bbb.1391, ISSN: 1932-1031.
Arnalds A� (2004)� Carbon sequestration and the restoration of land health: an
example from Iceland. Climatic Change 65, 333 – 346.
Arndt C�, R� Benfica, and J� Thurlow (2011)� Gender Implications of Biofu-
els Expansion in Africa: The Case of Mozambique. World Development 39,
1649 – 1662. doi: 10.1016 / j.worlddev.2011.02.012, ISSN: 0305-750X.
Arndt C�, K� Pauw, and J� Thurlow (2012)� Biofuels and economic development:
A computable general equilibrium analysis for Tanzania. Energy Economics 34,
1922 – 1930. doi: 10.1016 / j.eneco.2012.07.020, ISSN: 0140-9883.
Arora V� K�, and A� Montenegro (2011)� Small temperature benefits pro-
vided by realistic afforestation efforts. Nature Geoscience 4, 514 – 518. doi:
10.1038 / ngeo1182, ISSN: 1752-0894.

888888
Agriculture, Forestry and Other Land Use (AFOLU)
11
Chapter 11
Asante P�, and G� W� Armstrong (2012)� Optimal forest harvest age considering
carbon sequestration in multiple carbon pools: A comparative statics analysis.
Journal of Forest Economics 18, 145 – 156. doi: 10.1016 / j.jfe.2011.12.002, ISSN:
1104-6899.
Asante P�, G� W� Armstrong, and W� L� Adamowicz (2011)� Carbon sequestration
and the optimal forest harvest decision: A dynamic programming approach
considering biomass and dead organic matter. Journal of Forest Economics 17,
3 – 17. doi: 10.1016 / j.jfe.2010.07.001, ISSN: 1104-6899.
Assogbadjo A� E�, R� G� Kakaï, F� G� Vodouhê, C� A� M� S� Djagoun, J� T� C� Cod-
jia, and B� Sinsin (2012)� Biodiversity and socioeconomic factors supporting
farmers’ choice of wild edible trees in the agroforestry systems of Benin (West
Africa). Forest Policy and Economics 14, 41 – 49.
Attwood G� T�, E� Altermann, W� J� Kelly, S� C� Leahy, L� Zhang, and M� Morrison
(2011)� Exploring rumen methanogen genomes to identify targets for methane
mitigation strategies. Animal Feed Science and Technology 166 – 167, 65 – 75.
doi: 10.1016 / j.anifeedsci.2011.04.004, ISSN: 0377-8401.
Attwood G� T�, and C� S� McSweeney (2008)� Methanogen genomics to discover
targets for methane mitigation technologies and options for alternative H
2
utili-
sation in the rumen. Australian Journal of Experimental Agriculture 48, 28 – 37.
Auld G�, L� H� Gulbrandsen, and C� L� McDemott (2008)� Certification Schemes
and the Impacts on Forests and Forestry. Annual Review of Environment and
Resources. 33, 187 – 211. doi: 10.1146 / annurev.environ.33.013007.103754.
Awudu I�, and J� Zhang (2012)� Uncertainties and sustainability concepts in bio-
fuel supply chain management: A review. Renewable and Sustainable Energy
Reviews 16, 1359 – 1368. doi: 10.1016 / j.rser.2011.10.016, ISSN: 1364-0321.
Baccini A�, S� J� Goetz, W� S� Walker, N� T� Laporte, M� Sun, D� Sulla-Menashe,
J� Hackler, P� S� A� Beck, R� Dubayah, M� A� Friedl, S� Samanta, and R� A�
Houghton (2012)� Estimated carbon dioxide emissions from tropical defores-
tation improved by carbon-density maps. Nature Climate Change 2, 182 – 185.
doi: 10.1038 / nclimate1354, ISSN: 1758-678X.
Bacenetti J�, S� G� Garcia, A� Mena, and M� Fiala (2012)� Life cycle assessment:
an application to poplar for energy cultivated in Italy. Journal of Agricultural
Engineering 43, 72 – 78.
Bacovsky D�, M� Dallos, and M� Wörgetter (2010)� Status of 2nd Generation
Biofuels Demonstration Facilities in June 2010: A Report to IEA Bioenergy Task
39. Available at: http: / / library.certh.gr / libfiles / PDF / GEN-SPIN-711-STATUS-by-
BACOVSKY-in-RPT-BIOENERGY-TASK-39-PP-126-Y-JUL-2010.pdf.
Bacovsky D�, L� Nikolaus, O� Monica, and W� Manfred (2013)� Status of
Advanced Biofuels Demonstration Facilities in 2012. International Energy
Agency Bioenergy, 209 pp. Available at: http: / / demoplants.bioenergy2020.
eu / files / Demoplants_Report_Final.pdf.
Bai Y�, L� Luo, and E� Voet (2010)� Life cycle assessment of switchgrass-derived
ethanol as transport fuel. The International Journal of Life Cycle Assessment 15,
468 – 477. doi: 10.1007 / s11367 - 010 - 0177 - 2, ISSN: 0948-3349.
Bailis R�, and H� McCarthy (2011)� Carbon impacts of direct land use change in
semiarid woodlands converted to biofuel plantations in India and Brazil. GCB
Bioenergy 3, 449 – 460. doi: 10.1111 / j.1757 - 1707.2011.01100.x, ISSN: 1757-
1707.
Baker J� M�, T� E� Ochsner, R� T� Venterea, and T� J� Griffis (2007)� Tillage and soil
carbon sequestration – What do we really know? Agriculture, Ecosystems &
Environment 118, 1 – 5.
Baker D� J�, G� Richards, A� Grainger, P� Gonzalez, S� Brown, R� DeFries, A� Held,
J� Kellndorfer, P� Ndunda, D� Ojima, P�-E� Skrovseth, C� Souza Jr�, and F�
Stolle (2010)� Achieving forest carbon information with higher certainty: A
five-part plan. Environmental Science & Policy 13, 249 – 260. doi: 10.1016 / j.
envsci.2010.03.004, ISSN: 1462-9011.
Bala G�, K� Caldeira, M� Wickett, T� J� Phillips, D� B� Lobell, C� Delire, and A�
Mirin (2007)� Combined climate and carbon-cycle effects of large-scale defor-
estation. Proceedings of the National Academy of Sciences 104, 6550 – 6555.
doi: 10.1073 / pnas.0608998104.
Balan V�, D� Chiaramonti, and S� Kumar (2013)� Review of US and EU initiatives
toward development, demonstration, and commercialization of lignocellulosic
biofuels. Biofuels, Bioproducts and Biorefining 7, 732 – 759.
Baliban R� C�, J� A� Elia, and C� A� Floudas (2013)� Biomass and natural gas to
liquid transportation fuels: process synthesis, global optimization, and topology
analysis. Industrial & Engineering Chemistry Research 52, 3381 – 3406.
Barbier E� B� (2007)� Valuing ecosystem services as productive inputs. Economic
Policy 22, 177 – 229.
Barrow C� J� (2012)� Biochar: Potential for countering land degradation and
for improving agriculture. Applied Geography 34, 21 – 28. doi: 10.1016 / j.
apgeog.2011.09.008, ISSN: 0143-6228.
Barton L�, K� Butterbach-Bahl, R� Kiese, and D� V� Murphy (2011)� Nitrous
oxide fluxes from a grain-legume crop (narrow-leafed lupin) grown in a semi-
arid climate: Soil N
2
O from a grain-legume crop. Global Change Biology 17,
1153 – 1166. doi: 10.1111 / j.1365 - 2486.2010.02260.x, ISSN: 13541013.
Bathiany S�, M� Claussen, V� Brovkin, T� Raddatz, and V� Gayler (2010)� Com-
bined biogeophysical and biogeochemical effects of large-scale forest cover
changes in the MPI earth system model. Biogeosciences 7, 1383 – 1399. doi:
10.5194 / bg-7 - 1383 - 2010, ISSN: 1726-4189.
Batidzirai B�, E� Smeets, and A� Faaij (2012)� Harmonising bioenergy resource
potentials — Methodological lessons from review of state of the art bioen-
ergy potential assessments. Renewable and Sustainable Energy Reviews 16,
6598 – 6630.
Batjes N� H� (2004)� Estimation of soil carbon gains upon improved management
within croplands and grasslands of Africa. Environment, Development and Sus-
tainability 6, 133 – 143.
Baum S�, A� Bolte, and M� Weih (2012)� Short rotation coppice (SRC) plantations
provide additional habitats for vascular plant species in agricultural mosaic
landscapes. Bioenergy Research 5, 573 – 583.
Bayala J�, L� K� Heng, M� van Noordwijk, and S� J� Ouedraogo (2008)� Hydraulic
redistribution study in two native tree species of agroforestry parklands of West
African dry savanna. Acta Oecologica 34, 370 – 378. Available at: http: / / www.
sciencedirect. com / science / article / pii / S1146609X08001033.
Bayala J�, A� Kalinganire, Z� Tchoundjeu, P� Sinclair, and D� Garrity (2011)�
Conservation Agriculture with Trees in the West African Sahel: A Review. World
Agroforestry Centre, Bamako, Mali, 72 pp. ISBN: 978 - 92 - 9059 - 295 - 2.
Beach R� H�, A� J� Daigneault, B� A� Mccarl, and S� Rose (2009)� Modeling Alterna-
tive Policies for Forestry and Agricultural Bioenergy Production and GHG Miti-
gation. Washington, D. C., 27 pp.
Beauchemin K� A�, M� Kreuzer, F� O’Mara, and T� A� McAllister (2008)� Nutritional
management for enteric methane abatement: a review. Australian Journal of
Experimental Agriculture 48, 21 – 27. doi: 10.1071 / EA07199, ISSN: 0816-1089.

889889
Agriculture, Forestry and Other Land Use (AFOLU)
11
Chapter 11
Beauchemin K� A�, T� A� McAllister, and S� M� McGinn (2009)� Dietary mitiga-
tion of enteric methane from cattle. CAB Reviews: Perspectives in Agriculture,
Veterinary Science, Nutrition and Natural Resources 4, 1 – 18. Available at:
http: / / www. cabi. org / cabreviews / ?loadmodule=review&page=4051&reviewid
=112308&Site=167.
Beckham G� T�, Z� Dai, J� F� Matthews, M� Momany, C� M� Payne, W� S� Adney,
S� E� Baker, and M� E� Himmel (2012)� Harnessing glycosylation to improve
cellulase activity. Energy Biotechnology • Environmental Biotechnology 23,
338 – 345. doi: 10.1016 / j.copbio.2011.11.030, ISSN: 0958-1669.
Bellarby J�, R� Tirado, A� Leip, F� Weiss, J� P� Lesschen, and P� Smith (2012)�
Livestock greenhouse gas emissions and mitigation potential in Europe. Global
Change Biology, n / a – n / a. doi: 10.1111 / j.1365 - 2486.2012.02786.x, ISSN:
1365-2486.
Benayas J� M� R�, A� C� Newton, A� Diaz, and J� M� Bullock (2009)� Enhancement
of Biodiversity and Ecosystem Services by Ecological Restoration: A Meta-Anal-
ysis. Science 325, 1121 – 1124. doi: 10.1126 / science.1172460, ISSN: 0036-8075,
1095 – 9203.
Benítez P� C�, I� McCallum, M� Obersteiner, and Y� Yamagata (2007)� Global
potential for carbon sequestration: Geographical distribution, country risk and
policy implications. Ecological Economics 60, 572 – 583. doi: 10.1016 / j.ecole-
con.2005.12.015, ISSN: 0921-8009.
Bennetzen E� H�, P� Smith, J�-F� Soussana, and J� R� Porter (2012)� Identity-based
estimation of greenhouse gas emissions from crop production: Case study
from Denmark. European Journal of Agronomy 41, 66 – 72. doi: 10.1016 / j.
eja.2012.03.010, ISSN: 11610301.
Beringer T�, W� Lucht, and S� Schaphoff (2011)� Bioenergy production potential
of global biomass plantations under environmental and agricultural constraints.
GCB Bioenergy 3, 299 – 312. doi: 10.1111 / j.1757 - 1707.2010.01088.x, ISSN:
1757-1707.
Berndes G� (2012)� Bioenergy’s contribution to climate change mitigation — a
matter of perspectives. Biofuels, Bioproducts and Biorefining 6, 233 – 235. doi:
10.1002 / bbb.1343, ISSN: 1932-1031.
Berndes G�, S� Ahlgren, P� Börjesson, and A� L� Cowie (2013)� Bioenergy and
land use change — state of the art. Wiley Interdisciplinary Reviews: Energy and
Environment 2, 282 – 303. doi: 10.1002 / wene.41, ISSN: 2041-840X.
Berndes G�, N� Bird, and A� Cowie (2011)� Bioenergy, Land Use Change and Cli-
mate Change Mitigation. Technical Report. International Energy Agency, Avail-
able at: http: / / www. ieabioenergy. com / LibItem.aspx?id=6927.
Berndes G�, and P� Börjesson (2007)� Multifunctional Bioenergy Systems. The AGS
Pathways Report 2007: EU1. AGS — Alliance for Global Sustainability: Swiss
Federal Institute of Technology, Massachusetts Institute of Technology, Chalm-
ers University of Technology, Tokyo University, 26 pp.
Berndes G�, P� Börjesson, M� Ostwald, and M� Palm (2008)� Multifunctional bio-
mass production systems — an introduction with presentation of specific appli-
cations in India and Sweden. Biofuels, Bioproducts and Biorefining 2, 16 – 25.
Berndes G�, F� Fredriksson, and P� Börjesson (2004)� Cadmium accumulation
and Salix based phytoextraction on arable land in Sweden. Agriculture, Ecosys-
tems & Environment 103, 207 – 223.
Berners-Lee M�, C� Hoolohan, H� Cammack, and C� N� Hewitt (2012)� The
relative greenhouse gas impacts of realistic dietary choices. Energy Policy 43,
184 – 190. doi: 10.1016 / j.enpol.2011.12.054, ISSN: 0301-4215.
Bernier P�, and D� Paré (2013)� Using ecosystem CO
2
measurements to estimate
the timing and magnitude of greenhouse gas mitigation potential of forest bio-
energy. GCB Bioenergy 5, 67 – 72.
Betts R� A� (2001)� Biogeophysical impacts of land use on present-day climate:
near-surface temperature change and radiative forcing. Atmospheric Science
Letters 2, 39 – 51. doi: 10.1006 / asle.2001.0037, ISSN: 1530-261X.
Betts R� A� (2011)� Mitigation: A sweetener for biofuels. Nature Clim. Change 1,
99 – 101. ISSN: 1758-678X.
Betts R� A�, P� D� Falloon, K� K� Goldewijk, and N� Ramankutty (2007)� Biogeo-
physical effects of land use on climate: Model simulations of radiative forcing
and large-scale temperature change. Agricultural and Forest Meteorology 142,
216 – 233. doi: 10.1016 / j.agrformet.2006.08.021, ISSN: 0168-1923.
Bhattacharyya P�, D� P� Sinhababu, K� S� Roy, P� K� Dash, P� K� Sahu, R� Dan-
dapat, S� Neogi, and S� Mohanty (2013)� Effect of fish species on meth-
ane and nitrous oxide emission in relation to soil C, N pools and enzymatic
activities in rainfed shallow lowland rice-fish farming system. Agriculture, Eco-
systems & Environment 176, 53 – 62. doi: 10.1016 / j.agee.2013.05.015, ISSN:
01678809.
Bhuiyan M� A� H�, R� Islam, C� Siwar, and S� M� Ismail (2010)� Educational Tourism
and Forest Conservation: Diversification for Child Education. Procedia — Social
and Behavioral Sciences 7, 19 – 23. doi: 10.1016 / j.sbspro.2010.10.003, ISSN:
1877-0428.
Biederman L� A�, and W� S� Harpole (2013)� Biochar and its effects on plant pro-
ductivity and nutrient cycling: a meta-analysis. GCB Bioenergy 5, 202 – 214. doi:
10.1111 / gcbb.12037, ISSN: 17571693.
Blanco-Canqui H�, and R� Lal (2009)� Crop Residue Removal Impacts on Soil
Productivity and Environmental Quality. Critical Reviews in Plant Sciences 28,
139 – 163. doi: 10.1080 / 07352680902776507, ISSN: 0735-2689, 1549 – 7836.
Blengini G� A�, E� Brizio, M� Cibrario, and G� Genon (2011)� LCA of bioenergy
chains in Piedmont (Italy): A case study to support public decision makers
towards sustainability. Resources, Conservation and Recycling 57, 36 – 47. doi:
10.1016 / j.resconrec.2011.10.003, ISSN: 0921-3449.
Blom B�, T� Sunderland, and D� Murdiyarso (2010)� Getting REDD to work locally:
lessons learned from integrated conservation and development projects. Envi-
ronmental Science & Policy 13, 164 – 172.
Von Blottnitz H�, and M� A� Curran (2007)� A review of assessments conducted
on bio-ethanol as a transportation fuel from a net energy, greenhouse gas,
and environmental life cycle perspective. Journal of Cleaner Production 15,
607 – 619. doi: 10.1016 / j.jclepro.2006.03.002, ISSN: 0959-6526.
Bockel L�, A� Gentien, M� Tinlot, and M� Bromhead (2010)� From Nationally
Appropriate Mitigation Actions (NAMAs) to Low-Carbon Development in Agri-
culture: NAMAs as Pathway at Country Level. Food and Agricultural Organiza-
tion, Rome, Italy, 32 pp. Available at: http: / / www. nama-database. org / index.
php / From_Nationally_Appropriate_Mitigation_Actions_(NAMAs)_to_Low-
Carbon_Development_in_Agriculture.
Van Bodegom J� A�, A� Jan, H� Savenije, and M� Wit (Eds.) (2009)� Forests and
Climate Change: Adaptation and Mitigation. Tropenbos International, Wagenin-
gen, The Netherlands, 160 pp. ISBN: 9789051131000.
Boden T�, G� Marland, and R� Andres (2011)� Global CO
2
Emissions from Fossil-
Fuel Burning, Cement Manufacture, and Gas Flaring: 1751 – 2008. Available at:
http: / / cdiac.ornl.gov / trends / emis / meth_reg.html.

890890
Agriculture, Forestry and Other Land Use (AFOLU)
11
Chapter 11
De Boer I�, C� Cederberg, S� Eady, S� Gollnow, T� Kristensen, M� Macleod, M�
Meul, T� Nemecek, L� Phong, G� Thoma, H� van der Werf, A� Williams, and M�
Zonderland-Thomassen (2011)� Greenhouse gas mitigation in animal produc-
tion: towards an integrated life cycle sustainability assessment. Carbon and Nitro-
gen Cycles 3, 423 – 431. doi: 10.1016 / j.cosust.2011.08.007, ISSN: 1877-3435.
Bonan G� B� (2008)� Forests and Climate Change: Forcings, Feedbacks, and the
Climate Benefits of Forests. Science 320, 1444 – 1449. doi: 10.1126 / sci-
ence.1155121, ISSN: 0036-8075, 1095 – 9203.
Börjesson P�, and G� Berndes (2006)� The prospects for willow plantations for
wastewater treatment in Sweden. Biomass and Bioenergy 30, 428 – 438.
Börjesson P�, and L� M� Tufvesson (2011)� Agricultural crop-based biofu-
els – resource efficiency and environmental performance including direct land
use changes. Journal of Cleaner Production 19, 108 – 120.
Bostock J�, B� McAndrew, R� Richards, K� Jauncey, T� Telfer, K� Lorenzen, D�
Little, L� Ross, N� Handisyde, I� Gatward, and R� Corner (2010)� Aquacul-
ture: global status and trends. Philosophical Transactions of the Royal Society B:
Biological Sciences 365, 2897 – 2912. doi: 10.1098 / rstb.2010.0170, ISSN: 0962-
8436, 1471 – 2970.
Böttcher H�, K� Eisbrenner, S� Fritz, G� Kindermann, F� Kraxner, I� McCallum,
and M� Obersteiner (2009)� An assessment of monitoring requirements and
costs of “Reduced Emissions from Deforestation and Degradation.” Carbon
Balance and Management 4, 7. doi: 10.1186 / 1750 - 0680 - 4-7, ISSN: 1750-0680.
Böttcher H�, P� J� Verkerk, M� Gusti, P� HavlÍk, and G� Grassi (2012)� Projection of
the future EU forest CO
2
sink as affected by recent bioenergy policies using two
advanced forest management models. GCB Bioenergy 4, 773 – 783. doi: 10.111
1 / j.1757 - 1707.2011.01152.x, ISSN: 1757-1707.
Boulamanti A� K�, S� Donida Maglio, J� Giuntoli, and A� Agostini (2013)� Influ-
ence of different practices on biogas sustainability. Biomass and Bioenergy 53,
149 – 161. doi: 10.1016 / j.biombioe.2013.02.020, ISSN: 0961-9534.
Boutton T� W�, J� D� Liao, T� R� Filley, and S� R� Archer (2009)� Belowground Carbon
Storage and Dynamics Accompanying Woody Plant Encroachment in a Sub-
tropical Savanna. SSSA Special Publications. In: Soil Carbon Sequestration and
the Greenhouse Effect. Soil Science Society of America, Madison, WI, USA, pp.
181 – 205.
Bradley R� S�, M� Vuille, H� F� Diaz, and W� Vergara (2006)� Threats to Water
Supplies in the Tropical Andes. Science 312, 1755 – 1756. doi: 10.1126 / sci-
ence.1128087.
Bradstock R� A�, G� J� Cary, I� Davies, D� B� Lindenmayer, O� Price, and R� J� Wil-
liams (2012)� Wildfires, fuel treatment and risk mitigation in Australian euca-
lypt forests: insights from landscape-scale simulation. Journal of Environmental
Management 105, 66 – 75.
Branca G�, H� Hissa, M� C� Benez, K� Medeiros, L� Lipper, M� Tinlot, L� Bockel,
and M� Bernoux (2013)� Capturing synergies between rural development and
agricultural mitigation in Brazil. Land Use Policy 30, 507 – 518. doi: 10.1016 / j.
landusepol.2012.04.021, ISSN: 0264-8377.
Brandão M�, L� Milà i Canals, and R� Clift (2011)� Soil organic carbon changes in
the cultivation of energy crops: Implications for GHG balances and soil quality
for use in LCA. Biomass and Bioenergy 35, 2323 – 2336. doi: 10.1016 / j.biom-
bioe.2009.10.019, ISSN: 0961-9534.
Bridgwater A� V� (2012)� Upgrading biomass fast pyrolysis liquids. Environmental
Progress & Sustainable Energy 31, 261 – 268. doi: 10.1002 / ep.11635, ISSN:
1944-7450.
Bright R� M�, and A� H� Strømman (2009)� Life Cycle Assessment of Second Gen-
eration Bio-ethanol Produced from Scandinavian Boreal Forest Resources:
A Regional Analysis for Middle Norway. Journal of Industrial Ecology 13,
514 – 531.
Bright R� M�, and A� H� Strømman (2010)� Fuel-mix, Vehicle technologies, and
Transport Demand Affect Prospects for Biofuels in Northern Europe. Environ-
mental Science & Technology 44, 2261 – 2269.
Bright R� M�, A� H� Strømman, and T� R� Hawkins (2010)� Environmental Assess-
ment of Wood-based Biofuel Production and Consumption Scenarios in Nor-
way. Journal of Industrial Ecology 14, 422 – 439.
Bright R� M�, A� H� Strømman, and G� P� Peters (2011)� Radiative Forcing Impacts
of Boreal Forest Biofuels: A Scenario Study for Norway in Light of Albedo. Envi-
ronmental Science & Technology 45, 7570 – 7580. doi: 10.1021 / es201746b,
ISSN: 0013-936X.
Bringezu S�, M� O’Brien, and H� Schütz (2012)� Beyond biofuels: Assessing global
land use for domestic consumption of biomass: A conceptual and empirical
contribution to sustainable management of global resources. Land Use Policy
29, 224 – 232. doi: 16 / j.landusepol.2011.06.010, ISSN: 0264-8377.
Brockhaus M�, M� Di Gregorio, and S� Mardiah (2013)� Governing the design
of national REDD +: An analysis of the power of agency. Forest Policy and Eco-
nomics. doi: 10.1016 / j.forpol.2013.07.003, ISSN: 1389-9341.
Brown E� G�, R� C� Anderson, G� E� Carstens, H� Gutierrez-Banuelos, J� L�
McReynolds, L� J� Slay, T� R� Callaway, and D� J� Nisbet (2011)� Effects of oral
nitroethane administration on enteric methane emissions and ruminal fermen-
tation in cattle. Animal Feed Science and Technology 166 – 67, 275 – 281. doi:
10.1016 / j.anifeedsci.2011.04.017, ISSN: 0377-8401.
Brown C� D�, and J� F� Johnstone (2011)� How does increased fire frequency affect
carbon loss from fire? A case study in the northern boreal forest. International
Journal of Wildland Fire 20, 829 – 837. doi: 10.1071 / WF10113.
Bryan E�, C� Ringler, B� Okaba, J� Koo, M� Herrero, and S� Silvestri (2013)� Can
agriculture support climate change adaptation, greenhouse gas mitigation and
rural livelihoods? Insights from Kenya. Climatic Change 118, 151 – 165. doi: 10.
1007 / s10584 - 012 - 0640 - 0, ISSN: 1473300800.
Bryant J� R�, V� O� Snow, R� Cichota, and B� H� Jolly (2011)� The effect of situational
variability in climate and soil, choice of animal type and N fertilisation level
on nitrogen leaching from pastoral farming systems around Lake Taupo, New
Zealand. Agricultural Systems 104, 271 – 280. doi: 10.1016 / j.agsy.2010.11.001,
ISSN: 0308-521X.
Budsberg E�, M� Rastogi, M� E� Puettmann, J� Caputo, S� Balogh, T� A� Volk, R�
Gustafson, and L� Johnson (2012)� Life-cycle assessment for the production
of bioethanol from willow biomass crops via biochemical conversion. Forest
Products Journal 62, 305.
Buonocore E�, P� P� Franzese, and S� Ulgiati (2012)� Assessing the environ-
mental performance and sustainability of bioenergy production in Swe-
den: A life cycle assessment perspective. Energy 37, 69 – 78. doi: 10.1016 / j.
energy.2011.07.032.
Burney J� A�, S� J� Davis, and D� B� Lobell (2010)� Greenhouse gas mitigation by
agricultural intensification. Proceedings of the National Academy of Sciences
107, 12052 – 12057. doi: 10.1073 / pnas.0914216107.
Busch G� (2012)� GIS-based tools for regional assessments and planning processes
regarding potential environmental effects of poplar SRC. Bioenergy Research
5, 584 – 605.

891891
Agriculture, Forestry and Other Land Use (AFOLU)
11
Chapter 11
Busch J�, F� Godoy, W� R� Turner, and C� A� Harvey (2011)� Biodiversity co-benefits
of reducing emissions from deforestation under alternative reference levels and
levels of finance. Conservation Letters 4, 101 – 115. doi: 10.1111 / j.1755 - 263X.2
010.00150.x, ISSN: 1755-263X.
Bustamante M� M� C�, C� A� Nobre, R� Smeraldi, A� P� D� Aguiar, L� G� Barioni, L� G�
Ferreira, K� Longo, P� May, A� S� Pinto, and J� P� H� B� Ometto (2012)� Esti-
mating greenhouse gas emissions from cattle raising in Brazil. Climatic Change,
1 – 19. Available at: http: / / www. springerlink. com / index / WT2702446216702X.
pdf.
Cacciatore M� A�, D� A� Scheufele, and B� R� Shaw (2012)� Labeling renewable
energies: How the language surrounding biofuels can influence its public
acceptance. Energy Policy 51, 673 – 682. doi: 10.1016 / j.enpol.2012.09.005,
ISSN: 0301-4215.
Cai Y�-I� (2001)� A study on land use / cover change: the need for a new integrated
approach. Geographical Research. Available at: http: / / en.cnki.com.cn / Article_
en / CJFDTotal-DLYJ200106000.htm.
Calegari A�, W� L� Hargrove, D� dos S� Rheinheimer, R� Ralisch, D� Tessier, S�
Tourdonnet, and M� de F� Guimaraes (2008)� Impact of Long-Term No-Till-
age and Cropping System Management on Soil Organic Carbon in an Oxisol: A
Model for Sustainability. Agronomy Journal 100, 1013 – 1019.
Calfapietra C�, B� Gielen, D� Karnosky, R� Ceulemans, and G� Scarascia
Mugnozza (2010)� Response and potential of agroforestry crops under
global change. Environmental Pollution 158, 1095 – 1104. doi: 10.1016 / j.
envpol.2009.09.008, ISSN: 0269-7491.
California Environmental Protection Agency Air Resources Board — Homepage.
Available at: http: / / www. arb. ca. gov / homepage.htm.
Calvin K�, P� Patel, A� Fawcett, L� Clarke, K� Fisher-Vanden, J� Edmonds, S� H�
Kim, R� Sands, and M� Wise (2009)� The distribution and magnitude of emis-
sions mitigation costs in climate stabilization under less than perfect inter-
national cooperation: SGM results. Energy Economics 31, S187 – S197. doi:
10.1016 / j.eneco.2009.06.014, ISSN: 01409883.
Calvin K�, M� Wise, P� Kyle, P� Patel, L� Clarke, and J� Edmonds (2013a)� Trade-
offs of different land and bioenergy policies on the path to achieving climate
targets. Climatic Change in press. doi: DOI: 10.1007 / s10584 – 013 – 0897-y.
Calvin K�, M� Wise, P� Luckow, P� Kyle, L� Clarke, and J� Edmonds (2013b)� Impli-
cations of uncertain future fossil energy resources on bioenergy use and ter-
restrial carbon emissions. Climatic Change, 1 – 12. doi: 10.1007 / s10584 - 013 - 09
23 - 0, ISSN: 0165-0009.
Campbell J� E�, D� B� Lobell, and C� B� Field (2009)� Greater Transportation Energy
and GHG Offsets from Bioelectricity Than Ethanol. Science 324, 1055 – 1057.
Available at: http: / / www. sciencemag. org / content / 324 / 5930 / 1055.abstract.
Campbell J� E�, D� B� Lobell, R� C� Genova, and C� B� Field (2008)� The Global
Potential of Bioenergy on Abandoned Agriculture Lands. Environmental Science
& Technology 42, 5791 – 5794. doi: 10.1021 / es800052w, ISSN: 0013-936X.
Canadell J� G�, and M� R� Raupach (2008)� Managing Forests for Climate Change
Mitigation. Science 320, 1456 – 1457. doi: 10.1126 / science.1155458, ISSN:
0036-8075, 1095 – 9203.
Cançado J� E� D�, P� H� N� Saldiva, L� A� A� Pereira, L� B� L� S� Lara, P� Artaxo, L� A�
Martinelli, M� A� Arbex, A� Zanobetti, and A� L� F� Braga (2006)� The impact
of sugar cane-burning emissions on the respiratory system of children and the
elderly. Environmental Health Perspectives 114, 725 – 729. ISSN: 0091-6765.
Carlsson-Kanyama A�, and A� D� González (2009)� Potential contributions of
food consumption patterns to climate change. The American Journal of Clini-
cal Nutrition 89, 1704S – 1709S. doi: 10.3945 / ajcn.2009.26736AA, ISSN: 0002-
9165, 1938 – 3207.
Carpita N� C� (2012)� Progress in the biological synthesis of the plant cell wall: new
ideas for improving biomass for bioenergy. Current Opinion in Biotechnology
23, 330 – 337. doi: 10.1016 / j.copbio.2011.12.003, ISSN: 0958-1669.
Cattaneo A�, R� Lubowski, J� Busch, A� Creed, B� Strassburg, F� Boltz, and R�
Ashton (2010)� On international equity in reducing emissions from defor-
estation. Environmental Science & Policy 13, 742 – 753. doi: 10.1016 / j.
envsci.2010.08.009, ISSN: 1462-9011.
Cayuela M� L�, M� A� Sánchez-Monedero, A� Roig, K� Hanley, A� Enders, and
J� Lehmann (2013)� Biochar and denitrification in soils: when, how much
and why does biochar reduce N
2
O emissions? Scientific Reports 3. doi:
10.1038 / srep01732, ISSN: 2045-2322.
CBD, and GiZ (2011)� Biodiversity and Livelihoods: REDD-plus Benefits. Secre-
tariat of the Convention on Biological Diversity and Deutsche Gesellschaft
Für Internationale Zusammenarbeit (GIZ) GmbH, Canada, 41 pp. Available at:
https: / / www. cbd. int / doc / publications / for-redd-en.pdf.
CDM-SSC WG (2011)� Thirty-Third Meeting Report, Annex 8: Call for Public Inputs
in Relation to Standardized Approaches for Facilitating the Baseline Emission
Calculations under SSC CDM Methodologies for Displacement of Non-Renew-
able Biomass. UNFCCC, Bonn, Germany, 52 pp. Available at: http: / / cdm.unfccc.
int / Panels / ssc_wg / meetings / 033 / ssc_033_an08.pdf.
Cederberg C�, U� M� Persson, K� Neovius, S� Molander, and R� Clift (2011)�
Including carbon emissions from deforestation in the carbon footprint of Bra-
zilian beef. Environmental Science & Technology 45, 1773 – 1779. Available at:
http: / / pubs.acs.org / doi / abs / 10.1021 / es103240z.
Ceschia E�, P� Béziat, J� F� Dejoux, M� Aubinet, C� Bernhofer, B� Bodson, N�
Buchmann, A� Carrara, P� Cellier, P� Di Tommasi, and others (2010)� Man-
agement effects on net ecosystem carbon and GHG budgets at European crop
sites. Agriculture, Ecosystems & Environment 139, 363 – 383.
Chadwick D�, S� Sommer, R� Thorman, D� Fangueiro, L� Cardenas, B� Amon, and
T� Misselbrook (2011)� Manure management: Implications for greenhouse
gas emissions. Animal Feed Science and Technology 166 – 67, 514 – 531. doi:
10.1016 / j.anifeedsci.2011.04.036, ISSN: 0377-8401.
Chakrabarti S� (2010)� Factors influencing organic food purchase in
India — expert survey insights. British Food Journal 112, 902 – 915. doi:
10.1108 / 00070701011067497, ISSN: 0007-070X.
Chatterjee A�, and R� Lal (2009)� On farm assessment of tillage impact on soil
carbon and associated soil quality parameters. Soil and Tillage Research 104,
270 – 277. doi: 10.1016 / j.still.2009.03.006, ISSN: 0167-1987.
Chen M�, and R� E� Blankenship (2011)� Expanding the solar spectrum used by
photosynthesis. Trends in Plant Science 16, 427 – 431.
Chen X�, M� Khanna, H� Huang, and H� Önal (2012)� Meeting the Mandate for
Biofuels: Implications for Land Use, Food, and Fuel Prices.
Cherubini F�, N� D� Bird, A� Cowie, G� Jungmeier, B� Schlamadinger, and S�
Woess-Gallasch (2009)� Energy- and greenhouse gas-based LCA of bio-
fuel and bioenergy systems: Key issues, ranges and recommendations.
Resources, Conservation, and Recycling 53, 434 – 447. doi: 10.1016 / j.rescon-
rec.2009.03.013, ISSN: 0921-3449.

892892
Agriculture, Forestry and Other Land Use (AFOLU)
11
Chapter 11
Cherubini F�, R� M� Bright, and A� H� Stromman (2013)� Global climate impacts
of forest bioenergy: what, when and how to measure? Environmental Research
Letters in press.
Cherubini F�, G� Guest, and A� Strømman (2012)� Application of probability distri-
butions to the modeling of biogenic CO
2
fluxes in life cycle assessment. GCB Bio-
energy 4, 784 – 798. doi: 10.1111 / j.1757 - 1707.2011.01156.x, ISSN: 1757-1707.
Cherubini F�, and G� Jungmeier (2010)� LCA of a biorefinery concept produc-
ing bioethanol, bioenergy, and chemicals from switchgrass. The International
Journal of Life Cycle Assessment 15, 53 – 66. doi: 10.1007 / s11367 - 009 - 0124 -
2, ISSN: 0948-3349.
Cherubini F�, G� P� Peters, T� Berntsen, A� H� Strømman, and E� Hertwich (2011)�
CO
2
emissions from biomass combustion for bioenergy: atmospheric decay and
contribution to global warming. GCB Bioenergy 3, 413 – 426. doi: 10.1111 / j.175
7 - 1707.2011.01102.x, ISSN: 1757-1707.
Cherubini F�, and S� Ulgiati (2010)� Crop residues as raw materials for biorefinery
systems — A LCA case study. Applied Energy 87, 47 – 57. doi: 10.1016 / j.apen-
ergy.2009.08.024, ISSN: 0306-2619.
Chhatre A�, and A� Agrawal (2009)� Trade-offs and synergies between carbon
storage and livelihood benefits from forest commons. Proceedings of the
National Academy of Sciences 106, 17667 – 17670.
Chhatre A�, S� Lakhanpal, A� M� Larson, F� Nelson, H� Ojha, and J� Rao (2012)�
Social safeguards and co-benefits in REDD+: a review of the adjacent possible.
Current Opinion in Environmental Sustainability 4, 654 – 660. doi: 10.1016 / j.
cosust.2012.08.006, ISSN: 1877-3435.
Choo Y� M�, H� Muhamad, Z� Hashim, V� Subramaniam, C� W� Puah, and Y� Tan
(2011)� Determination of GHG contributions by subsystems in the oil palm
supply chain using the LCA approach. The International Journal of Life Cycle
Assessment 16, 669 – 681. doi: 10.1007 / s11367 - 011 - 0303 - 9, ISSN: 0948-3349.
Chum H�, A� Faaij, J� Moreira, G� Berndes, P� Dhamija, H� Dong, B� Gabrielle,
A� G� Eng, W� Lucht, M� Mapako, O� M� Cerutti, T� McIntyre, T� Minowa, and
K� Pingoud (2011)� Bioenergy. In: IPCC Special Report on Renewable Energy
Sources and Climate Change Mitigation [O. Edenhofer, R. Pichs-Madruga, Y.
Sokona, K. Seyboth, P. Matschoss, S. Kadner, T. Zwickel, P. Eickemeier, G. Hansen,
S. Schlömer, C. von Stechow (eds)],. Cambridge University Press, Cambridge,
United Kingdom and New York, NY, USA, pp. 209 – 332.
Chundawat S� P� S�, G� T� Beckham, M� E� Himmel, and B� E� Dale (2011)� Decon-
struction of Lignocellulosic Biomass to Fuels and Chemicals. Annual Review of
Chemical and Biomolecular Engineering 2, 121 – 145. doi: 10.1146 / annurev-
chembioeng-061010 - 114205.
Chung C� E�, V� Ramanathan, and D� Decremer (2012)� Observationally con-
strained estimates of carbonaceous aerosol radiative forcing. Proceedings of
the National Academy of Sciences 109, 11624 – 11629.
Ciais P�, M� J� Schelhaas, S� Zaehle, S� L� Piao, A� Cescatti, J� Liski, S� Luyssaert,
G� Le-Maire, E�-D� Schulze, O� Bouriaud, A� Freibauer, R� Valentini, and G� J�
Nabuurs (2008)� Carbon accumulation in European forests. Nature Geoscience
1, 425 – 429. doi: 10.1038 / ngeo233, ISSN: 1752-0894.
Clair T� A�, P� Arp, T�� Moore, M� Dalva, and F�-R� Meng (2002)� Gaseous carbon
dioxide and methane, as well as dissolved organic carbon losses from a small
temperate wetland under a changing climate. Environmental Pollution 116,
Supplement 1, 143 – 148. doi: 10.1016 / S0269 - 7491(01)00267 - 6, ISSN: 0269-
7491.
Clair S� S�, J� Hillier, and P� Smith (2008)� Estimating the pre-harvest greenhouse
gas costs of energy crop production. Biomass and Bioenergy 32, 442 – 452. doi:
10.1016 / j.biombioe.2007.11.001, ISSN: 0961-9534.
Clark H� (2013)� Nutritional and host effects on methanogenesis in the grazing
ruminant. Animal 7 Suppl 1, 41 – 48. doi: 10.1017 / S1751731112001875, ISSN:
1751-732X.
Claussen M�, V� Brovkin, and A� Ganopolski (2001)� Biogeophysical versus bio-
geochemical feedbacks of large-scale land cover change. Geophys. Res. Lett.
28, 1011 – 1014. doi: 10.1029 / 2000gl012471, ISSN: 0094-8276.
Clough T�, L� Condron, C� Kammann, and C� Müller (2013)� A Review of Bio-
char and Soil Nitrogen Dynamics. Agronomy 3, 275 – 293. doi: 10.3390 / agron-
omy3020275, ISSN: 2073-4395.
Coelho S�, O� Agbenyega, A� Agostini, K� H� Erb, H� Haberl, M� Hoogwijk, R�
Lal, O� Lucon, O� Masera, and J� R� Moreira (2012)� Chapter 20 — Land and
Water: Linkages to Bioenergy. In: Global Energy Assessment — Toward a Sus-
tainable Future. Cambridge University Press, Cambridge, UK and New York, NY,
USA and the International Institute for Applied Systems Analysis, Laxenburg,
Austria, Cambridge, UK, pp. 1459 – 1526. ISBN: 9780521182935.
Colfer C� J� P� (2011)� Marginalized Forest Peoples’ Perceptions of the Legitimacy
of Governance: An Exploration. World Development 39, 2147 – 2164. doi:
10.1016 / j.worlddev.2011.04.012, ISSN: 0305-750X.
Combes Motel P�, R� Pirard, and J�-L� Combes (2009)� A methodology to esti-
mate impacts of domestic policies on deforestation: Compensated Successful
Efforts for “avoided deforestation” (REDD). Ecological Economics 68, 680 – 691.
doi: 10.1016 / j.ecolecon.2008.06.001, ISSN: 0921-8009.
Conant R� T�, M� Easter, K� Paustian, A� Swan, and S� Williams (2007)� Impacts of
periodic tillage on soil C stocks: A synthesis. Soil and Tillage Research 95, 1 – 10.
doi: 10.1016 / j.still.2006.12.006, ISSN: 01671987.
Corbera E�, and K� Brown (2008)� Building Institutions to Trade Ecosystem Ser-
vices: Marketing Forest Carbon in Mexico. World Development 36, 1956 – 1979.
doi: 10.1016 / j.worlddev.2007.09.010, ISSN: 0305-750X.
Corbera E�, and H� Schroeder (2011)� Governing and implementing REDD+.
Environmental Science & Policy 14, 89 – 99. doi: 10.1016 / j.envsci.2010.11.002,
ISSN: 1462-9011.
Cordes L� (2011)� Igniting Change: A Strategy for Universal Adoption of Clean
Cookstoves and Fuels. Global Alliance for Clean Cookstoves, Washington DC,
USA, Available at: www. cleancookstoves. org.
Cottle D� J�, J� V� Nolan, and S� G� Wiedemann (2011)� Ruminant enteric
methane mitigation: a review. Animal Production Science 51, 491. doi:
10.1071 / AN10163, ISSN: 1836-0939.
Cotula L� (2012)� The international political economy of the global land rush: A
critical appraisal of trends, scale, geography and drivers. Journal of Peasant
Studies 39, 649 – 680. doi: 10.1080 / 03066150.2012.674940, ISSN: 0306-
6150.
Cotula L�, S� Vermeulen, R� Leonard, and J� Keeley (2009)� Land Grab or Devel-
opment Opportunity? Agricultural Investment and International Land Deals in
Africa. 130 pp.
Cox P� M�, D� Pearson, B� B� Booth, P� Friedlingstein, C� Huntingford, C� D�
Jones, and C� M� Luke (2013)� Sensitivity of tropical carbon to climate
change constrained by carbon dioxide variability. Nature 494, 341 – 344. doi:
10.1038 / nature11882, ISSN: 0028-0836.

893893
Agriculture, Forestry and Other Land Use (AFOLU)
11
Chapter 11
Creutzig F�, E� Corbera, S� Bolwig, and C� Hunsberger (2013)� Integrating place-
specific livelihood and equity outcomes into global assessments of bioenergy
deployment. Environmental Research Letters 8, 035047 (11pp). doi: 10.1088 / 1
748 - 9326 / 8 / 3 / 035047, ISSN: 1748-9326.
Creutzig F�, A� Popp, R� Plevin, G� Luderer, J� Minx, and O� Edenhofer (2012a)�
Reconciling top-down and bottom-up modelling on future bioenergy deploy-
ment. Nature Climate Change 2, 320 – 327. doi: 10.1038 / nclimate1416, ISSN:
1758-678X.
Creutzig F�, C� von Stechow, D� Klein, C� Hunsberger, N� Bauer, A� Popp,
and O� Edenhofer (2012b)� Can bioenergy assessments deliver? Econom-
ics of Energy & Environmental Policy 1. doi: 10.5547 / 2160-5890.1.2.5, ISSN:
21605882.
Crutzen P� J�, A� R� Mosier, K� A� Smith, and W� Winiwarter (2007)� N
2
O release
from agro-biofuel production negates global warming reduction by replacing
fossil fuels. Atmospheric Chemistry and Physics Discussions 7, 11191 – 11205.
doi: 10.5194 / acpd-7 - 11191 - 2007, ISSN: 1680-7375.
Daigneault A�, B� Sohngen, and R� Sedjo (2012)� Economic Approach to Assess
the Forest Carbon Implications of Biomass Energy. Environmental Science &
Technology 46, 5664 – 5671. doi: 10.1021 / es2030142, ISSN: 0013-936X.
Dale B� E�, M� S� Allen, M� Laser, and L� R� Lynd (2009)� Protein feeds coproduction
in biomass conversion to fuels and chemicals. Biofuels, Bioproducts and Biore-
fining 3, 219 – 230. doi: 10.1002 / bbb.132, ISSN: 1932-1031.
Dale V� H�, and K� L� Kline (2013)� Issues in using landscape indicators to assess
land changes. Ecological Indicators 28, 91 – 99.
Dale V� H�, K� L� Kline, D� Perla, and A� Lucier (2013)� Communicating about bio-
energy sustainability. Environmental Management 51, 279 – 290.
Dale V� H�, R� Lowrance, P� Mulholland, and G� P� Robertson (2010)� Bioenergy
sustainability at the regional scale. Ecology and Society 15, 23. Available at:
https: / / www. kbs. msu. edu / images / stories / docs / robertson / Dale_et_al._2010_
SSSAJ.pdf.
Van Dam J�, A� P� C� Faaij, J� Hilbert, H� Petruzzi, and W� C� Turkenburg (2009a)�
Large-scale bioenergy production from soybeans and switchgrass in Argentina:
Part A: Potential and economic feasibility for national and international mar-
kets. Renewable and Sustainable Energy Reviews 13, 1710 – 1733.
Van Dam J�, A� P� Faaij, J� Hilbert, H� Petruzzi, and W� C� Turkenburg (2009b)�
Large-scale bioenergy production from soybeans and switchgrass in Argentina:
Part B. Environmental and socio-economic impacts on a regional level. Renew-
able and Sustainable Energy Reviews 13, 1679 – 1709.
Van Dam J�, M� Junginger, and A� P� C� Faaij (2010)� From the global efforts on
certification of bioenergy towards an integrated approach based on sustainable
land use planning. Renewable and Sustainable Energy Reviews 14, 2445 – 2472.
doi: 16 / j.rser.2010.07.010, ISSN: 1364-0321.
Danielsen F�, H� Beukema, N� D� Burgess, F� Parish, C� A� Brühl, P� F� Donald, D�
Murdiyarso, B� Phalan, L� Reijnders, M� Struebig, and E� B� Fitzherbert
(2009)� Biofuel Plantations on Forested Lands: Double Jeopardy for Biodiversity
and Climate. Conservation Biology 23, 348 – 358. doi: 10.1111 / j.1523 - 1739.200
8.01096.x, ISSN: 1523-1739.
Datta A�, D� R� Nayak, D� P� Sinhababu, and T� K� Adhya (2009)� Methane and
nitrous oxide emissions from an integrated rainfed rice – fish farming system
of Eastern India. Agriculture, Ecosystems & Environment 129, 228 – 237. doi:
10.1016 / j.agee.2008.09.003, ISSN: 01678809.
Dauvergne P�, and K� J� Neville (2010)� Forests, food, and fuel in the tropics: the
uneven social and ecological consequences of the emerging political economy
of biofuels. Journal of Peasant Studies 37, 631 – 660.
Davidson E� A� (2012)� Representative concentration pathways and mitigation sce-
narios for nitrous oxide. Environmental Research Letters 7, 024005. doi: 10.108
8 / 1748 - 9326 / 7 / 2 / 024005, ISSN: 1748-9326.
Davidson E� A�, and I� A� Janssens (2006)� Temperature sensitivity of soil carbon
decomposition and feedbacks to climate change. Nature 440, 165 – 173. doi:
10.1038 / nature04514, ISSN: 0028-0836, 1476 – 4679.
Davin E� L�, N� de Noblet-Ducoudré, and P� Friedlingstein (2007)� Impact of land
cover change on surface climate: Relevance of the radiative forcing concept.
Geophys. Res. Lett. 34, L13702. doi: 10.1029 / 2007gl029678, ISSN: 0094-8276.
Davis R�, A� Aden, and P� T� Pienkos (2011a)� Techno-economic analysis of autotro-
phic microalgae for fuel production. Applied Energy 88, 3524 – 3531. Available
at: http: / / www. sciencedirect. com / science / article / pii / S0306261911002406.
Davis S� C�, R� M� Boddey, B� J� R� Alves, A� L� Cowie, B� H� George, S� M� Ogle,
P� Smith, M� van Noordwijk, and M� T� van Wijk (2013)� Manage-
ment swing potential for bioenergy crops. GCB Bioenergy 5, 623 – 638. doi:
10.1111 / gcbb.12042, ISSN: 1757-1707.
Davis S� C�, W� J� Parton, S� J� D� Grosso, C� Keough, E� Marx, P� R� Adler, and E� H�
DeLucia (2011b)� Impact of second-generation biofuel agriculture on green-
house-gas emissions in the corn-growing regions of the US. Frontiers in Ecology
and the Environment 10, 69 – 74. doi: 10.1890 / 110003, ISSN: 1540-9295.
Dawson T� P�, S� T� Jackson, J� I� House, I� C� Prentice, and G� M� Mace (2011)�
Beyond Predictions: Biodiversity Conservation in a Changing Climate. Science
332, 53 – 58. doi: 10.1126 / science.1200303, ISSN: 0036-8075, 1095 – 9203.
Deal R� L�, B� Cochran, and G� LaRocco (2012)� Bundling of ecosystem services to
increase forestland value and enhance sustainable forest management. Forest
Policy and Economics 17, 69 – 76.
Deal R� L�, and R� White (2012)� Integrating forest products with ecosystem ser-
vices: A global perspective. Forest Policy and Economics 17, 1 – 2.
DeAngelo B� J�, F� C� de la Chesnaye, R� H� Beach, A� Sommer, and B� C� Mur-
ray (2006)� Methane and Nitrous Oxide Mitigation in Agriculture. The Energy
Journal, 89 – 108.
DeCicco J� (2013)� Biofuel’s carbon balance: doubts, certainties and implications.
Climatic Change 121, 801 – 814. doi: 10.1007 / s10584 - 013 - 0927 - 9, ISSN: 0165-
0009.
DeFries R�, and C� Rosenzweig (2010)� Toward a whole-landscape approach for
sustainable land use in the tropics. Proceedings of the National Academy of Sci-
ences 107, 19627 – 19632. doi: 10.1073 / pnas.1011163107.
Delucchi M� A� (2010)� Impacts of biofuels on climate change, water use, and land
use. Annals of the New York Academy of Sciences 1195, 28 – 45. doi: 10.1111 / j.
1749 - 6632.2010.05457.x, ISSN: 1749-6632.
Dezzeo, N�, Chacon, and N� (2005)� Carbon and nutrients loss in aboveground
biomass a long a fire induced forest-savanna gradient in the Gran Sabana,
Southern Venezuela. Forest Ecology and Management 209, 343 – 352.
Dias A� C�, and L� Arroja (2012)� Environmental impacts of eucalypt and maritime
pine wood production in Portugal. Journal of Cleaner Production 37, 368 – 376.
doi: 10.1016 / j.jclepro.2012.07.056, ISSN: 0959-6526.
Díaz S�, J� Fargione, F� S� Chapin, and D� Tilman (2006)� Biodiversity loss threat-
ens human well-being. PLoS Biology 4, e277.

894894
Agriculture, Forestry and Other Land Use (AFOLU)
11
Chapter 11
Diaz-Chavez R� A� (2011)� Assessing biofuels: Aiming for sustainable development
or complying with the market? Energy Policy 39, 5763 – 5769. doi: 10.1016 / j.
enpol.2011.03.054, ISSN: 0301-4215.
Diaz-Chavez R� A� (2012)� Land use for integrated systems: A bioenergy perspec-
tive. Environmental Development 3, 91 – 99. doi: 10.1016 / j.envdev.2012.03.018,
ISSN: 2211-4645.
Dijkstra J�, O� Oenema, and A� Bannink (2011)� Dietary strategies to reducing
N excretion from cattle: implications for methane emissions. Current Opinion
in Environmental Sustainability 3, 414 – 422. doi: 10.1016 / j.cosust.2011.07.008,
ISSN: 1877-3435.
Dimitriou I�, C� Baum, S� Baum, G� Busch, U� Schulz, J� Köhn, N� Lamersdorf, P�
Leinweber, P� Aronsson, M� Weih, G� Berndes, and A� Bolte (2009)� Short
Rotation Coppice (SRC) cultivation and local impact on the environment. Land-
bauforschung vTI Agriculture and Forestry Research 3, 159 – 162.
Dimitriou I�, C� Baum, S� Baum, G� Busch, U� Schulz, J� Köhn, N� Lamersdorf, P�
Leinweber, P� Aronsson, M� Weih, G� Berndes, and A� Bolte (2011)� Quanti-
fying environmental effects of short rotation coppice (SRC) on biodiversity, soil
and water. IEA Bioenergy Task 43.
Ding X� Z�, R� J� Long, M� Kreuzer, J� D� Mi, and B� Yang (2010)� Methane emis-
sions from yak (Bos grunniens) steers grazing or kept indoors and fed diets with
varying forage: concentrate ratio during the cold season on the Qinghai-Tibetan
Plateau. Animal Feed Science and Technology 162, 91 – 98.
DiPietro P�, P� Balash, and M� Wallace (2012)� A Note on Sources of CO
2
Sup-
ply for Enhanced-Oil-Recovery Operations. SPE Economics & Management,
pp.69 – 74.
Djomo S� N�, O� E� Kasmioui, and R� Ceulemans (2011)� Energy and greenhouse
gas balance of bioenergy production from poplar and willow: a review. GCB
Bioenergy 3, 181 – 197. doi: 10.1111 / j.1757 - 1707.2010.01073.x, ISSN: 1757-
1707.
Don A�, B� Osborne, A� Hastings, U� Skiba, M� S� Carter, J� Drewer, H� Flessa, A�
Freibauer, N� Hyvönen, M� B� Jones, G� J� Lanigan, Ü� Mander, A� Monti, S� N�
Djomo, J� Valentine, K� Walter, W� Zegada-Lizarazu, and T� Zenone (2012)�
Land-use change to bioenergy production in Europe: implications for the green-
house gas balance and soil carbon. GCB Bioenergy 4, 372 – 391. doi: 10.1111 / j.
1757 - 1707.2011.01116.x, ISSN: 1757-1707.
Donato D� C�, J� B� Kauffman, D� Murdiyarso, S� Kurnianto, M� Stidham, and M�
Kanninen (2011)� Mangroves among the most carbon-rich forests in the trop-
ics. Nature Geoscience 4, 293 – 297. doi: 10.1038 / ngeo1123, ISSN: 1752-0894.
Dornburg V�, D� van Vuuren, G� van de Ven, H� Langeveld, M� Meeusen, M�
Banse, M� van Oorschot, J� Ros, G� Jan van den Born, H� Aiking, M� Londo,
H� Mozaffarian, P� Verweij, E� Lysen, and A� Faaij (2010)� Bioenergy revis-
ited: Key factors in global potentials of bioenergy. Energy and Environmental
Science 3, 258 – 267. doi: 10.1039 / b922422j, ISSN: 1754-5692.
Douglas E�, A� Beltrán-Przekurat, D� Niyogi, R� Pielke Sr, and C� Vörösmarty
(2009)� The impact of agricultural intensification and irrigation on land-atmo-
sphere interactions and Indian monsoon precipitation – A mesoscale modeling
perspective. Global and Planetary Change 67, 117 – 128.
Downie A�, P� Munroe, A� Cowie, L� Van Zwieten, and D� M� S� Lau (2012)�
Biochar as a Geoengineering Climate Solution: Hazard Identification and
Risk Management. Critical Reviews in Environmental Science and Technol-
ogy 42, 225 – 250. doi: 10.1080 / 10643389.2010.507980, ISSN: 1064-3389,
1547 – 6537.
Duarte C� G�, K� Gaudreau, R� B� Gibson, and T� F� Malheiros (2013)� Sustain-
ability assessment of sugarcane-ethanol production in Brazil: A case study of
a sugarcane mill in São Paulo state. Ecological Indicators 30, 119 – 129. doi:
10.1016 / j.ecolind.2013.02.011, ISSN: 1470-160X.
Dumortier J�, D� J� Hayes, M� Carriquiry, F� Dong, X� Du, A� Elobeid, J� F� Fabiosa,
and S� Tokgoz (2011)� Sensitivity of Carbon Emission Estimates from Indirect
Land-Use Change. Applied Economic Perspectives and Policy 33, 428 – 448. doi:
10.1093 / aepp / ppr015, ISSN: 2040-5790, 2040 – 5804.
Dunlap R� E�, and W� R� Catton, Jr� (2002)� Which Function(s) of the Environment
Do We Study? A Comparison of Environmental and Natural Resource Sociology.
Society & Natural Resources 15, 239 – 249. doi: 10.1080 / 089419202753445070,
ISSN: 0894-1920, 1521 – 0723.
Durand L�, and E� Lazos (2008)� The Local Perception of Tropical Deforestation and
its Relation to Conservation Policies in Los Tuxtlas Biosphere Reserve, Mexico.
Human Ecology 36, 383 – 394. doi: 10.1007 / s10745 - 008 - 9172 - 7, ISSN: 0300-
7839.
Durand L�, and L� B� Vázquez (2011)� Biodiversity conservation discourses. A
case study on scientists and government authorities in Sierra de Huautla Bio-
sphere Reserve, Mexico. Land Use Policy 28, 76 – 82. doi: 10.1016 / j.landuse-
pol.2010.04.009, ISSN: 0264-8377.
Durst P� B�, P� J� McKenzie, C� L� Brown, and S� Appanah (2006)� Challenges fac-
ing certification and eco-labelling of forest products in developing countries.
International Forestry Review 8, 193 – 200. Available at: http: / / www. bioone.
org / doi / abs / 10.1505 / ifor.8.2.193.
Duvenage I�, C� Langston, L� C� Stringer, and K� Dunstan (2013)� Grappling
with biofuels in Zimbabwe: depriving or sustaining societal and environmen-
tal integrity? Journal of Cleaner Production 42, 132 – 140. doi: 10.1016 / j.
jclepro.2012.11.011, ISSN: 0959-6526.
Eagle A� J�, and L� P� Olander (2012)� Chapter 3: Greenhouse Gas Mitigation with
Agricultural Land Management Activities in the United States — A Side-by-Side
Comparison of Biophysical Potentia. In: Advances in Agronomy. Academic Press,
New York, NY, pp. 79 – 179. ISBN: 0065 - 2113.
Eckard R� J�, C� Grainger, and C� A� M� de Klein (2010)� Options for the abatement
of methane and nitrous oxide from ruminant production: A review. Livestock
Science 130, 47 – 56. doi: 10.1016 / j.livsci.2010.02.010, ISSN: 1871-1413.
Eckert C�, A� Dubini, J� Yu, P� King, M� Ghirardi, M� Seibert, and P�-C� Maness
(2012)� Hydrogenase Genes and Enzymes Involved in Solar Hydrogen Produc-
tion. In: State of the Art and Progress in Production of Biohydrogen. Biosciences
Center, National Renewable Energy Laboratory, Golden, CO, USA, pp. 8 – 24
(17). ISBN: 978 - 1-60805 - 411 - 4.
Edser C� (2012)� Inaugural report shows impressive uptake of RSPO-certified
sustainable palm oil in 2011. Focus on Surfactants 2012, 1 – 2. doi: 10.1016 /
S1351 - 4210(12)70119 - 1, ISSN: 1351-4210.
Egeskog A�, G� Berndes, F� Freitas, S� Gustafsson, and G� Sparovek (2011)�
Integrating bioenergy and food production — A case study of combined ethanol
and dairy production in Pontal, Brazil. Energy for Sustainable Development 15,
8 – 16. doi: 10.1016 / j.esd.2011.01.005, ISSN: 0973-0826.
Van Eijck J�, H� Romijn, E� Smeets, R� Bailis, M� Rooijakkers, N� Hooijkaas, P�
Verweij, and A� Faaij (2014)� Comparative analysis of key socio-economic
and environmental impacts of smallholder and plantation based jatropha bio-
fuel production systems in Tanzania. Biomass and Bioenergy 61, 25 – 45. doi:
10.1016 / j.biombioe.2013.10.005, ISSN: 0961-9534.

895895
Agriculture, Forestry and Other Land Use (AFOLU)
11
Chapter 11
Van Eijck J�, E� Smeets, and A� Faaij (2012)� The economic performance of jatro-
pha, cassava and Eucalyptus production systems for energy in an East African
smallholder setting. GCB Bioenergy 4, 828 – 845. doi: 10.1111 / j.1757 - 1707.201
2.01179.x, ISSN: 1757-1707.
Eisenbies M� H�, E� D� Vance, W� M� Aust, and J� R� Seiler (2009)� Intensive utiliza-
tion of harvest residues in southern pine plantations: quantities available and
implications for nutrient budgets and sustainable site productivity. BioEnergy
Research 2, 90 – 98.
Elliott D� C� (2013)� Transportation fuels from biomass via fast pyrolysis and
hydroprocessing. Wiley Interdisciplinary Reviews: Energy and Environment 2,
525 – 533. doi: 10.1002 / wene.74, ISSN: 2041-840X.
Ellis E� C�, K� Klein Goldewijk, S� Siebert, D� Lightman, and N� Ramankutty
(2010)� Anthropogenic transformation of the biomes, 1700 to 2000. Global
Ecology and Biogeography 19, 589 – 606. doi: 10.1111 / j.1466 - 8238.2010.005
40.x, ISSN: 1466-8238.
EMPA (2012)� Harmonisation and Extension of the Bioenergy Inventories and
Assessment: End Report. EMPA, Bern, Switzerland, 97 pp. Available at:
http: / / www. empa. ch / plugin / template / empa / * / 125527 / --- / l=1.
Engel S�, S� Pagiola, and S� Wunder (2008)� Designing payments for environmen-
tal services in theory and practice: An overview of the issues. Ecological Eco-
nomics 65, 663 – 674. doi: 10.1016 / j.ecolecon.2008.03.011, ISSN: 0921-8009.
Eranki P� L�, and B� E� Dale (2011)� Comparative life cycle assessment of central-
ized and distributed biomass processing systems combined with mixed feed-
stock landscapes. GCB Bioenergy 3, 427 – 438. doi: 10.1111 / j.1757 - 1707.2011.
01096.x, ISSN: 1757-1707.
Erb K�-H� (2012)� How a socio-ecological metabolism approach can help to advance
our understanding of changes in land-use intensity. Ecological Economics 76,
8 – 14. doi: 10.1016 / j.ecolecon.2012.02.005, ISSN: 0921-8009.
Erb K�-H�, V� Gaube, F� Krausmann, C� Plutzar, A� Bondeau, and H� Haberl
(2007)� A comprehensive global 5 min resolution land-use data set for the
year 2000 consistent with national census data. Journal of Land Use Science 2,
191 – 224. doi: 10.1080 / 17474230701622981, ISSN: 1747-423X.
Erb K�-H�, H� Haberl, and C� Plutzar (2012a)� Dependency of global primary
bioenergy crop potentials in 2050 on food systems, yields, biodiversity con-
servation and political stability. Energy Policy 47, 260 – 269. doi: 10.1016 / j.
enpol.2012.04.066, ISSN: 0301-4215.
Erb K�-H�, T� Kastner, S� Luyssaert, R� A� Houghton, T� Kuemmerle, P� Olofsson,
and H� Haberl (2013)� Bias in the attribution of forest carbon sinks. Nature
Climate Change 3, 854 – 856. doi: 10.1038 / nclimate2004, ISSN: 1758-678X,
1758 – 6798.
Erb K�-H�, A� Mayer, F� Krausmann, C� Lauk, C� Plutzar, J� Steinberger, and H�
Haberl (2012b)� The interrelations of future global bioenergy potentials, food
demand and agricultural technology. In: Socioeconomic and Environmental
Impacts of Biofuels: Evidence from Developing Nations. A. Gasparatos, P. Strom-
berg, (eds.), Cambridge University Press, Cambridge, UK, pp. 27 – 52.
Ericksen P� J�, J� S� Ingram, and D� M� Liverman (2009)� Food security and global
environmental change: emerging challenges. Environmental Science & Pol-
icy 12, 373 – 377. Available at: http: / / www. sciencedirect. com / science / arti-
cle / pii / S1462901109000653.
Eugene M�, C� Martin, M� M� Mialon, D� Krauss, G� Renand, and M� Doreau
(2011)� Dietary linseed and starch supplementation decreases methane pro-
duction of fattening bulls. Animal Feed Science and Technology 166 – 167,
330 – 337.
Ewing M�, and S� Msangi (2009)� Biofuels production in developing countries:
assessing tradeoffs in welfare and food security. Environmental Science & Pol-
icy 12, 520 – 528. doi: 10.1016 / j.envsci.2008.10.002, ISSN: 1462-9011.
Faaij A� (2006)� Modern Biomass Conversion Technologies. Mitigation and Adapta-
tion Strategies for Global Change 11, 335 – 367. doi: 10.1007 / s11027 - 005 - 900
4 - 7, ISSN: 1381-2386, 1573 – 1596.
FAO (2006a)� World Agriculture: Towards 2030 / 2050 — Interim Report. Prospects
for Food, Nutrition, Agriculture and Major Commodity Groups. Food and Agri-
culture Organization of the United Nations (FAO), Rome, 71 pp. Available at:
http: / / www. fao. org / es / ESD / AT2050web.pdf.
FAO (2006b)� Global Planted Forest Thematic Study, Results and Analysis. Planted
Forests and Trees Working Paper FP38E. Rome, Italy, Food and Agriculture Orga-
nization of the United Nations, 168 pp. Available at: http: / / www. fao. org / for-
estry / 12139 - 03441d093f070ea7d7c4e3ec3f306507.pdf.
FAO (2007)� The World’s Mangroves: 1980 – 2005. Food and Agricultural Orga-
nization of the United Nations, Rome, 153 pp. Available at: http: / / www. fao.
org / docrep / 010 / a1427e / a1427e00.htm.
FAO (2008)� The State of Food and Agriculture 2008 — Biofuels: Prospects, Risks
and Opportunities. Food and Agricultural Organization, Rome, Italy, 128 pp.
Available at: http: / / www. un-energy. org / publications / 98-the-state-of-food-
and-agriculture-2008-biofuels-prospects-risks-and-opportunities.
FAO (2009)� State of the World’s Forests 2009. Food and Agriculture Organiza-
tion of the United Nations, Rome, Italy, 168 pp. Available at: http: / / www. fao.
org / docrep / 011 / i0350e / i0350e00.htm.
FAO (2010)� Global Forest Resources Assessment 2010. Rome, Italy, Available at:
http: / / www. fao. org / forestry / fra / fra2010 / en / .
FAO (2011)� Energy-Smart Food for People and Climate. Food and Agriculture
Organization of the United Nations (FAO), Rome, Italy, 66 pp. Available at:
http: / / www. fao. org / docrep / 014 / i2454e / i2454e00.pdf.
FAO (2012)� The State of World Fisheries and Aquaculture. Food and Agricultural
Organization, Rome, 209 pp.
FAO, WFP, and IFAD (2012)� The State of Food Insecurity in the World 2012.
Economic Growth Is Necessary but Not Sufficient to Accelerate Reduc-
tion of Hunger and Malnutrition. Food and Agricultural Organization of
the United Nations, Rome, Italy, 61 pp. Available at: http: / / www. fao.
org / docrep / 016 / i3027e / i3027e00.htm.
FAOSTAT (2012)� FAO Statistics. Food and Agriculture Organization of the United
Nations, Rome, Italy, 352 pp.
FAOSTAT (2013)� FAOSTAT database. Food and Agriculture Organization of the
United Nations. Available at: http: / / faostat.fao.org / .
Farage, P� K�, Ardo, J�, Olsson, L�, Rienzi, E� A�, Ball, A� S�, Pretty, and J� N� (2007)�
The potential for soil carbon sequestration in three tropical dryland farming
systems of Africa and Latin America: A modelling approach. Soil and Tillage
Research 94, 457 – 472.
Fargione J�, J� Hill, D� Tilman, S� Polasky, and P� Hawthorne (2008)� Land Clear-
ing and the Biofuel Carbon Debt. Science 319, 1235 – 1238. doi: 10.1126 / sci-
ence.1152747, ISSN: 0036-8075.
Farley J�, and R� Costanza (2010)� Payments for ecosystem services: From local to
global. Ecological Economics 69, 2060 – 2068.
Favaro L�, T� Jooste, M� Basaglia, S� H� Rose, M� Saayman, J� F� Görgens, S�
Casella, and W� H� van Zyl (2012)� Designing industrial yeasts for the consoli-
dated bioprocessing of starchy biomass to ethanol. Bioengineered 4, 97 – 102.
doi: 10.4161 / bioe.22268, ISSN: 2165-5979, 2165 – 5987.

896896
Agriculture, Forestry and Other Land Use (AFOLU)
11
Chapter 11
Fazio S�, and A� Monti (2011)� Life cycle assessment of different bioenergy produc-
tion systems including perennial and annual crops. Biomass and Bioenergy 35,
4868 – 4878. doi: 10.1016 / j.biombioe.2011.10.014, ISSN: 0961-9534.
Felder R�, and R� Dones (2007)� Evaluation of ecological impacts of synthetic nat-
ural gas from wood used in current heating and car systems. Biomass and Bio-
energy 31, 403 – 415. doi: 10.1016 / j.biombioe.2006.08.005, ISSN: 0961-9534.
Feng J�, C� Chen, Y� Zhang, Z� Song, A� Deng, C� Zheng, and W� Zhang (2013)�
Impacts of cropping practices on yield-scaled greenhouse gas emissions from
rice fields in China: A meta-analysis. Agriculture, Ecosystems & Environment
164, 220 – 228. doi: 10.1016 / j.agee.2012.10.009, ISSN: 01678809.
Fenner A� L�, S� S� Godfrey, and M� C� Bull (2011)� Using social networks to deduce
whether residents or dispersers spread parasites in a lizard population: Social
networks and parasite transmission. Journal of Animal Ecology 80, 835 – 843.
doi: 10.1111 / j.1365 - 2656.2011.01825.x, ISSN: 00218790.
Field C� B�, J� E� Campbell, and D� B� Lobell (2008)� Biomass energy: the scale
of the potential resource. Trends in Ecology and Evolution 23, 65 – 72. doi:
10.1016 / j.tree.2007.12.001, ISSN: 0169-5347.
Field J� L�, C� M� H� Keske, G� L� Birch, M� W� DeFoort, and M� F� Cotrufo (2013)�
Distributed biochar and bioenergy coproduction: a regionally specific case study
of environmental benefits and economic impacts. GCB Bioenergy 5, 177 – 191.
doi: 10.1111 / gcbb.12032, ISSN: 17571693.
Finkbeiner M� (2013)� Indirect Land Use Change (iLUC) within Life Cycle Assess-
ment (LCA) — Scientific Robustness and Consistency with International
Standards. Publication of the Association of the German Biofuel Indus-
try, Berlin, Germany, 65 pp. Available at: http: / / www. fediol. eu / data / RZ_
VDB_0030_Vorstudie_ENG_Komplett.pdf.
Fischedick M�, R� Schaeffer, A� Adedoyin, M� Akai, T� Bruckner, L� Clarke, V�
Krey, I� Savolainen, S� Teske, D� Ürge-Vorsatz, and R� Wright (2011)�
Mitigation Potential and Costs. In: IPCC Special Report on Renewable Energy
Sources and Climate change Mitigation [O. Edenhofer, R. Pichs-Madruga, Y.
Sokona, K. Seyboth, P. Matschoss, S. Kadner, T. Zwickel, P. Eickemeier, G. Han-
sen, S. Schlömer, C.von Stechow (eds)]. Cambridge University Press, Cambridge,
United Kingdom and New York, NY, USA, pp. 791 – 864.
Fischer J�, B� Brosi, G� C� Daily, P� R� Ehrlich, R� Goldman, J� Goldstein, D� B� Lin-
denmayer, A� D� Manning, H� A� Mooney, L� Pejchar, J� Ranganathan, and
H� Tallis (2008)� Should agricultural policies encourage land sparing or wild-
life-friendly farming? Frontiers in Ecology and the Environment 6, 380 – 385.
doi: 10.1890 / 070019, ISSN: 1540-9295.
Fischer G�, S� Prieler, H� Van Velthuizen, G� Berndes, A� Faaij, M� Londo, and
M� De Wit (2010)� Biofuel production potentials in Europe: Sustainable use of
cultivated land and pastures, Part II: Land use scenarios. Biomass and Bioenergy
34, 173 – 187.
Fischer-Kowalski M� (2011)� Analyzing sustainability transitions as a shift between
socio-metabolic regimes. Environmental Innovation and Societal Transitions 1,
152 – 159. doi: 16 / j.eist.2011.04.004, ISSN: 2210-4224.
Flannigan M�, B� Stocks, M� Turetsky, and M� Wotton (2009)� Impacts of climate
change on fire activity and fire management in the circumboreal forest. Global
Change Biology 15, 549 – 560. doi: 10.1111 / j.1365 - 2486.2008.01660.x, ISSN:
1365-2486.
FLEG Regional Forest Law Enforcement and Governance (FLEG) Initiatives. Available
at: http: / / www. worldbank. org / en / topic / forests / brief / fleg-regional-forest-law-
enforcement-governance.
Foley J� A�, R� DeFries, G� P� Asner, C� Barford, G� Bonan, S� R� Carpenter, F� S�
Chapin, M� T� Coe, G� C� Daily, H� K� Gibbs, J� H� Helkowski, T� Holloway, E� A�
Howard, C� J� Kucharik, C� Monfreda, J� A� Patz, I� C� Prentice, N� Raman-
kutty, and P� K� Snyder (2005)� Global Consequences of Land Use. Science
309, 570 – 574. doi: 10.1126 / science.1111772, ISSN: 0036-8075, 1095 – 9203.
Foley P� A�, D� A� Kenny, J� J� Callan, T� M� Boland, and F� P� O’Mara (2009)� Effect
of DL-malic acid supplementation on feed intake, methane emission, and
rumen fermentation in beef cattle. Journal of Animal Science 87, 1048 – 1057.
doi: 10.2527 / jas.2008 - 1026, ISSN: 0021-8812, 1525 – 3163.
Foley J� A�, N� Ramankutty, K� A� Brauman, E� S� Cassidy, J� S� Gerber, M� John-
ston, N� D� Mueller, C� O’Connell, D� K� Ray, P� C� West, C� Balzer, E� M� Ben-
nett, S� R� Carpenter, J� Hill, C� Monfreda, S� Polasky, J� Rockstrom, J� Shee-
han, S� Siebert, D� Tilman, and D� P� M� Zaks (2011)� Solutions for a cultivated
planet. Nature 478, 337 – 342. doi: 10.1038 / nature10452, ISSN: 0028-0836.
Follett R� F�, and D� A� Reed (2010)� Soil Carbon Sequestration in Grazing Lands:
Societal Benefits and Policy Implications. Rangeland Ecology & Management
63, 4 – 15. doi: 10.2111 / 08 - 225.1, ISSN: 1550-7424, 1551 – 5028.
Forner C�, J� Blaser, F� Jotzo, and C� Robledo (2006)� Keeping the forest for
the climate’s sake: avoiding deforestation in developing countries under the
UNFCCC. Climate Policy 6, 275 – 294. doi: 10.1080 / 14693062.2006.9685602,
ISSN: 1469-3062.
Frank S�, H� Böttcher, P� Havlík, H� Valin, A� Mosnier, M� Obersteiner, E� Schmid,
and B� Elbersen (2013)� How effective are the sustainability criteria accompa-
nying the European Union 2020 biofuel targets? GCB Bioenergy, n / a – n / a. doi:
10.1111 / j.1757 - 1707.2012.01188.x, ISSN: 1757-1707.
Franzluebbers A� J�, and J� A� Stuedemann (2009)� Soil-profile organic carbon and
total nitrogen during 12 years of pasture management in the Southern Pied-
mont USA. Agriculture, Ecosystems & Environment 129, 28 – 36. doi: 10.1016 / j.
agee.2008.06.013, ISSN: 01678809.
Frei M�, M� A� Razzak, M� M� Hossain, M� Oehme, S� Dewan, and K� Becker
(2007)� Methane emissions and related physicochemical soil and water param-
eters in rice – fish systems in Bangladesh. Agriculture, Ecosystems & Environ-
ment 120, 391 – 398. doi: 10.1016 / j.agee.2006.10.013, ISSN: 01678809.
Fuglestvedt J� S�, K� P� Shine, T� Berntsen, J� Cook, D� S� Lee, A� Stenke, R� B�
Skeie, G� J� M� Velders, and I� A� Waitz (2010)� Transport impacts on atmo-
sphere and climate: Metrics. Atmospheric Environment 44, 4648 – 4677.
Gabrielle B�, and N� Gagnaire (2008)� Life-cycle assessment of straw use in bio-
ethanol production: A case study based on biophysical modelling. Biomass and
Bioenergy 32, 431 – 441. doi: 10.1016 / j.biombioe.2007.10.017, ISSN: 0961-
9534.
Gabrielle B�, P� Maupu, and E� Vial (2013)� Life cycle assessment of eucalyptus
short rotation coppices for bioenergy production in southern France. GCB Bio-
energy 5, 30 – 42. doi: 10.1111 / gcbb.12008, ISSN: 1757-1707.
Galinato S� P�, J� K� Yoder, and D� Granatstein (2011)� The economic value
of biochar in crop production and carbon sequestration. Energy Policy 39,
6344 – 6350. doi: 10.1016 / j.enpol.2011.07.035, ISSN: 0301-4215.
Garcia-Frapolli E�, A� Schilmann, V� Berrueta, H� Riojas-Rodriguez, R� Edwards,
M� Johnson, A� Guevara-Sangines, C� Armendariz, and O� R� Masera
(2010)� Beyond Fuelwood Savings: Valuing the economic benefits of introduc-
ing improved biomass cookstoves in the Purépecha region of Mexico. Ecologi-
cal Economics 69, 2598 – 2605.

897897
Agriculture, Forestry and Other Land Use (AFOLU)
11
Chapter 11
Garcia-Ulloa J�, S� Sloan, P� Pacheco, J� Ghazoul, and L� P� Koh (2012)� Lowering
environmental costs of oil-palm expansion in Colombia. Conservation Letters 5,
366 – 375. doi: 10.1111 / j.1755 - 263X.2012.00254.x, ISSN: 1755263X.
Gardner T� A�, N� D� Burgess, N� Aguilar-Amuchastegui, J� Barlow, E� Berenguer,
T� Clements, F� Danielsen, J� Ferreira, W� Foden, V� Kapos, S� M� Khan, A� C�
Lees, L� Parry, R� M� Roman-Cuesta, C� B� Schmitt, N� Strange, I� Theilade,
and I� C� G� Vieira (2012)� A framework for integrating biodiversity concerns
into national REDD+ programmes. Biological Conservation 154, 61 – 71. doi:
10.1016 / j.biocon.2011.11.018, ISSN: 0006-3207.
Garg K� K�, L� Karlberg, S� P� Wani, and G� Berndes (2011)� Jatropha production
on wastelands in India: opportunities and trade-offs for soil and water manage-
ment at the watershed scale. Biofuels, Bioproducts and Biorefining 5, 410 – 430.
doi: 10.1002 / bbb.312, ISSN: 1932-1031.
Garnett T� (2011)� Where are the best opportunities for reducing greenhouse gas
emissions in the food system (including the food chain)? Food Policy 36, Sup-
plement 1, 23 – 32. doi: 10.1016 / j.foodpol.2010.10.010, ISSN: 0306-9192.
Garnett T�, M� C� Appleby, A� Balmford, I� J� Bateman, T� G� Benton, P� Bloomer,
B� Burlingame, M� Dawkins, L� Dolan, D� Fraser, M� Herrero, I� Hoffmann,
P� Smith, P� K� Thornton, C� Toulmin, S� J� Vermeulen, and H� C� J� Godfray
(2013)� Sustainable Intensification in Agriculture: Premises and Policies. Science
341, 33 – 34. doi: 10.1126 / science.1234485, ISSN: 0036-8075, 1095 – 9203.
Gasparatos A�, P� Stromberg, and K� Takeuchi (2011)� Biofuels, ecosystem
services and human wellbeing: Putting biofuels in the ecosystem services
narrative. Agriculture, Ecosystems & Environment 142, 111 – 128. doi: 16 / j.
agee.2011.04.020, ISSN: 0167-8809.
Gattinger A�, A� Muller, M� Haeni, C� Skinner, A� Fliessbach, N� Buch-
mann, P� Mader, M� Stolze, P� Smith, N� E�-H� Scialabba, and U� Nig-
gli (2012)� Enhanced top soil carbon stocks under organic farming. Pro-
ceedings of the National Academy of Sciences 109, 18226 – 18231. doi:
10.1073 / pnas.1209429109, ISSN: 0027-8424, 1091 – 6490.
Gawel E�, and G� Ludwig (2011)� The iLUC dilemma: How to deal with indirect
land use changes when governing energy crops? Land Use Policy 28, 846 – 856.
doi: 10.1016 / j.landusepol.2011.03.003, ISSN: 0264-8377.
GEA (2012)� Global Energy Assessment — Toward a Sustainable Future. Cambridge
University Press, Cambridge, UK and New York, NY, USA and the International
Institute for Applied Systems Analysis, Laxenburg, Austria, 1802 pp.
Von Geibler J� (2013)� Market-based governance for sustainability in value chains:
conditions for successful standard setting in the palm oil sector. Journal of
Cleaner Production 56, 39 – 53. doi: 10.1016 / j.jclepro.2012.08.027, ISSN: 0959-
6526.
Gelfand I�, R� Sahajpal, X� Zhang, R� C� Izaurralde, K� L� Gross, and G� P� Robert-
son (2013)� Sustainable bioenergy production from marginal lands in the US
Midwest. Nature 493, 514 – 517. doi: 10.1038 / nature11811, ISSN: 0028-0836,
1476 – 4687.
Gelfand I�, T� Zenone, P� Jasrotia, J� Chen, S� K� Hamilton, and G� P� Robertson
(2011)� Carbon debt of Conservation Reserve Program (CRP) grasslands con-
verted to bioenergy production. Proceedings of the National Academy of Sci-
ences of the United States 108, 13864 – 13869.
Georgescu M�, D� B� Lobell, and C� B� Field (2011)� Direct climate effects of peren-
nial bioenergy crops in the United States. Proceedings of the National Academy
of Sciences 108, 4307 – 4312. doi: 10.1073 / pnas.1008779108, ISSN: 0027-
8424, 1091 – 6490.
Gerbens-Leenes W�, A� Y� Hoekstra, and T� H� Van der Meer (2009)� The water
footprint of bioenergy. Proceedings of the National Academy of Sciences 106,
10219 – 10223. Available at: http: / / www. pnas. org / content / 106 / 25 / 10219.
short.
Gerber P�, H� A� Mooney, J� Dijkman, S� Tarawali, and C� de Haan (Eds.) (2010)�
Livestock in a Changing Landscpape. Experiences and Regional Perspectives.
Island Press, Washington, D. C., 189 pp. ISBN: 9781597266734.
German L�, and G� Schoneveld (2012)� A review of social sustainability consider-
ations among EU-approved voluntary schemes for biofuels, with implications for
rural livelihoods. Energy Policy 51, 765 – 778. doi: 10.1016 / j.enpol.2012.09.022,
ISSN: 0301-4215.
German L�, G� C� Schoneveld, and D� Gumbo (2011)� The Local Social and Envi-
ronmental Impacts of Smallholder-Based Biofuel Investments in Zambia. Ecol-
ogy and Society 16. doi: 10.5751 / es-04280 - 160412, ISSN: 1708-3087.
German L�, G� Schoneveld, and E� Mwangi (2013)� Contemporary Processes of
Large-Scale Land Acquisition in Sub-Saharan Africa: Legal Deficiency or Elite
Capture of the Rule of Law? World Development 48, 1 – 18. doi: 10.1016 / j.
worlddev.2013.03.006, ISSN: 0305-750X.
Gibbs H� K�, M� Johnston, J� A� Foley, T� Holloway, C� Monfreda, N� Ramankutty,
and D� Zaks (2008)� Carbon payback times for crop-based biofuel expansion
in the tropics: the effects of changing yield and technology. Environmental
Research Letters 3, 034001 (10pp). doi: 10.1088 / 1748 - 9326 / 3 / 3 / 034001, ISSN:
1748-9326.
Gilg A� (2009)� Perceptions about land use. Land Use Policy 26, Supplement 1,
76 – 82. doi: 10.1016 / j.landusepol.2009.08.018, ISSN: 0264-8377.
Gill M�, P� Smith, and J� M� Wilkinson (2010)� Mitigating climate change: the role
of domestic livestock. Animal 4, 323 – 333. doi: 10.1017 / S1751731109004662.
Giuntoli J�, A� K� Boulamanti, S� Corrado, M� Motegh, A� Agostini, and D� Bax-
ter (2013)� Environmental impacts of future bioenergy pathways: the case of
electricity from wheat straw bales and pellets. GCB Bioenergy 5, 497 – 512. doi:
10.1111 / gcbb.12012, ISSN: 1757-1707.
Gnansounou E� (2011)� Assessing the sustainability of biofuels: A logic-based
model. Energy 36, 2089 – 2096. doi: 10.1016 / j.energy.2010.04.027, ISSN:
03605442.
Godfray H� C� J�, J� R� Beddington, I� R� Crute, L� Haddad, D� Lawrence, J� F� Muir,
J� Pretty, S� Robinson, S� M� Thomas, and C� Toulmin (2010)� Food Secu-
rity: The Challenge of Feeding 9 Billion People. Science 327, 812 – 818. doi:
10.1126 / science.1185383, ISSN: 0036-8075, 1095 – 9203.
Goglio P�, E� Bonari, and M� Mazzoncini (2012)� LCA of cropping systems with
different external input levels for energetic purposes. Biomass and Bioenergy
42, 33 – 42. doi: 10.1016 / j.biombioe.2012.03.021, ISSN: 0961-9534.
Gohin A� (2008)� Impacts of the European Biofuel Policy on the Farm Sector: A
General Equilibrium Assessment. Applied Economic Perspectives and Policy
30, 623 – 641. doi: 10.1111 / j.1467 - 9353.2008.00437.x, ISSN: 2040-5790,
2040 – 5804.
Goldemberg J� (2007)� Ethanol for a sustainable energy future. Science 315,
808 – 810.
Goldemberg J�, S� T� Coelho, and P� Guardabassi (2008)� The sustainability of
ethanol production from sugarcane. Energy Policy 36, 2086 – 2097.
Goldewijk K� K�, A� Beusen, G� van Drecht, and M� de Vos (2011)� The HYDE 3.1
spatially explicit database of human-induced global land-use change over the
past 12,000 years. Global Ecology and Biogeography 20, 73 – 86. doi: 10.1111 / j
.1466 - 8238.2010.00587.x, ISSN: 1466-822X.

898898
Agriculture, Forestry and Other Land Use (AFOLU)
11
Chapter 11
Gollakota S�, and S� McDonald (2012)� CO
2
capture from ethanol production and
storage into the Mt Simon Sandstone. Greenhouse Gases: Science and Technol-
ogy 2, 346 – 351.
Golub A�, T� Hertel, H� L� Lee, S� Rose, and B� Sohngen (2009)� The opportunity
cost of land use and the global potential for greenhouse gas mitigation in agri-
culture and forestry. Resource and Energy Economics 31, 299 – 319.
González A� D�, B� Frostell, and A� Carlsson-Kanyama (2011)� Protein efficiency
per unit energy and per unit greenhouse gas emissions: Potential contribution
of diet choices to climate change mitigation. Food Policy 36, 562 – 570. doi:
10.1016 / j.foodpol.2011.07.003, ISSN: 0306-9192.
Gonzalez P�, R� P� Neilson, J� M� Lenihan, and R� J� Drapek (2010)� Global pat-
terns in the vulnerability of ecosystems to vegetation shifts due to climate
change. Global Ecology and Biogeography 19, 755 – 768. doi: 10.1111 / j.1466 - 8
238.2010.00558.x, ISSN: 1466-8238.
González-Estrada E�, L� C� Rodriguez, V� K� Walen, J� B� Naab, J� Koo, J� W� Jones,
M� Herrero, and P� K� Thornton (2008)� Carbon sequestration and farm
income in West Africa: Identifying best management practices for smallholder
agricultural systems in northern Ghana. Ecological Economics 67, 492 — 502.
González-García S�, J� Bacenetti, R� J� Murphy, and M� Fiala (2012a)� Present
and future environmental impact of poplar cultivation in the Po Valley (Italy)
under different crop management systems. Journal of Cleaner Production 26,
56 – 66. doi: 10.1016 / j.jclepro.2011.12.020, ISSN: 0959-6526.
González-García S�, M� T� Moreira, G� Feijoo, and R� J� Murphy (2012b)� Compar-
ative life cycle assessment of ethanol production from fast-growing wood crops
(black locust, eucalyptus and poplar). Biomass and Bioenergy 39, 378 – 388. doi:
10.1016 / j.biombioe.2012.01.028, ISSN: 0961-9534.
Gopalakrishnan G�, M� C� Negri, and W� Salas (2012)� Modeling biogeochemi-
cal impacts of bioenergy buffers with perennial grasses for a row-crop field in
Illinois. Global Change Biology Bioenergy 4, 739 – 750. doi: doi: 10.1111 / j.1757
- 1707.2011.01145.x.
Gopalakrishnan G�, M� C� Negri, and S� Snyder (2011a)� A novel framework to
classify marginal land for sustainable biomass feedstock production. Journal of
Environmental Quality 40, 1593 – 1600. Available at: http: / / www. sciencedirect.
com / science / article / pii / S0306261911002406.
Gopalakrishnan G�, M� C� Negri, and S� Snyder (2011b)� Redesigning agricultural
landscapes for sustainability using bioenergy crops: quantifying the tradeoffs
between agriculture, energy and the environment. Aspects of Applied Biology
112, 139 – 146.
Gopalakrishnan G�, M� C� Negri, M� Wang, M� Wu, S� W� Snyder, and L� Lafre-
niere (2009)� Biofuels, land and water: a systems approach to sustainability.
Environmental Science & Technology 43, 6094 – 6100.
Görg C� (2007)� Landscape governance: The “politics of scale” and the “natural”
conditions of places. Pro-Poor Water? The Privatisation and Global Poverty
Debate 38, 954 – 966. doi: 10.1016 / j.geoforum.2007.01.004, ISSN: 0016-
7185.
Gorham E� (1991)� Northern peatlands: role in the carbon cycle and probable
responses to climatic warming. Ecological Applications 1, 182 – 195.
Gottschalk P�, J� U� Smith, M� Wattenbach, J� Bellarby, E� Stehfest, N� Arnell,
T� J� Osborn, and P� Smith (2012)� How will organic carbon stocks in min-
eral soils evolve under future climate? Global projections using RothC for a
range of climate change scenarios. Biogeosciences Discussions 9, 411 – 451. doi:
10.5194 / bgd-9 - 411 - 2012, ISSN: 1810-6285.
Government of New Zealand New Zealand climate change information. Available
at: http: / / www. climatechange. govt. nz / .
Graham-Rowe D� (2011)� Agriculture: Beyond food versus fuel. Nature 474, 6 – 8.
doi: 10.1038 / 474S06a, ISSN: 0028-0836.
Grainger C�, and K� A� Beauchemin (2011)� Can enteric methane emissions from
ruminants be lowered without lowering their production? Animal Feed Science
and Technology 166 – 167, 308 – 320. doi: 10.1016 / j.anifeedsci.2011.04.021,
ISSN: 0377-8401.
Grainger C�, T� Clarke, K� A� Beauchemin, S� M� McGinn, and R� J� Eckard (2008)�
Supplementation with whole cottonseed reduces methane emissions and can
profitably increase milk production of dairy cows offered a forage and cereal
grain diet. Australian Journal of Experimental Agriculture 48, 73 – 76.
Grainger C�, R� Williams, T� Clarke, A� G� Wright, and R� J� Eckard (2010)� Sup-
plementation with whole cottonseed causes long-term reduction of methane
emissions from lactating dairy cows offered a forage and cereal grain diet. Jour-
nal of Dairy Science 93, 2612 – 2619.
Gregg J� S�, and S� J� Smith (2010)� Global and regional potential for bioenergy
from agricultural and forestry residue biomass. Mitigation and Adaptation
Strategies for Global Change 15, 241 – 262. doi: 10.1007 / s11027 - 010 - 9215 - 4,
ISSN: 1381-2386, 1573 – 1596.
Di Gregorio M�, M� Brockhaus, T� Cronin, E� Muharrom, L� Santoso, S� Mar-
diah, and M� Büdenbender (2013)� Equity and REDD+ in the Media: a
Comparative Analysis of Policy Discourses. Ecology and Society 18, 39. doi:
10.5751 / ES-05694 - 180239.
Groom M�, E� Gray, and P� Townsend (2008)� Biofuels and Biodiversity: Principles
for Creating Better Policies for Biofuel Production. Conservation Biology 22,
602 – 609. doi: 10.1111 / j.1523 - 1739.2007.00879.x, ISSN: 1523-1739.
De Groot R� (2006)� Function-analysis and valuation as a tool to assess land use
conflicts in planning for sustainable, multi-functional landscapes. Landscape
and Urban Planning 75, 175 – 186.
Guariguata M� R�, J� P� Cornelius, B� Locatelli, C� Forner, and G� A� Sánchez-
Azofeifa (2008)� Mitigation needs adaptation: Tropical forestry and climate
change. Mitigation and Adaptation Strategies for Global Change 13, 793 – 808.
doi: 10.1007 / s11027 - 007 - 9141 - 2, ISSN: 1381-2386, 1573 – 1596.
Guest G�, R� M� Bright, F� Cherubini, O� Michelsen, and A� H� Strømman (2011)�
Life Cycle Assessment of Biomass-based Combined Heat and Power Plants.
Journal of Industrial Ecology 15, 908 – 921. doi: 10.1111 / j.1530 - 9290.2011.0
0375.x, ISSN: 1530-9290.
Guest G�, R� M� Bright, F� Cherubini, and A� H� Strømman (2013)� Consistent
quantification of climate impacts due to biogenic carbon storage across a range
of bio-product systems. Environmental Impact Assessment Review 43, 21 – 30.
Guldea S�, H� Chung, W� Amelung, C� Chang, and J� Six (2008)� Soil carbon satu-
ration controls labile and stable carbon pool dynamics. Soil Science Society of
America Journal 72, 605 – 612. doi: 10.2136 / sssaj2007.0251.
Gumpenberger M�, K� Vohland, U� Heyder, B� Poulter, K� Macey, A� Rammig, A�
Popp, and W� Cramer (2010)� Predicting pan-tropical climate change induced
forest stock gains and losses — implications for REDD. Environmental Research
Letters 5, 014013 (15pp). doi: 10.1088 / 1748 - 9326 / 5 / 1 / 014013, ISSN: 1748-
9326.
Gupta J� (2012)� Glocal forest and REDD+ governance: win – win or lose – lose?
Current Opinion in Environmental Sustainability 4, 620 – 627. doi: 10.1016 / j.
cosust.2012.09.014, ISSN: 1877-3435.

899899
Agriculture, Forestry and Other Land Use (AFOLU)
11
Chapter 11
Gurung A�, and S� E� Oh (2013)� Conversion of traditional biomass into modern
bioenergy systems: A review in context to improve the energy situation in
Nepal. Renewable Energy 50, 206 – 213. doi: 10.1016 / j.renene.2012.06.021,
ISSN: 0960-1481.
Gustavsson J�, C� Cederberg, U� Sonesson, R� van Otterdijk, and A� Meybeck
(2011)� Global Food Losses and Food Waste. Extent, Causes and Prevention.
Food and Agricultural Organization of the United Nations, Rome, 29 pp.
Gustavsson L�, K� Pingoud, and R� Sathre (2006)� Carbon Dioxide Balance of
Wood Substitution: Comparing Concrete- and Wood-Framed Buildings. Mitiga-
tion and Adaptation Strategies for Global Change 11, 667 – 691. doi: 10.1007 / s
11027 - 006 - 7207 - 1, ISSN: 1381-2386.
Guthinga P� M� (2008)� Understanding local communitities’ perceptions of exist-
ing forest management regimes of Kenyan rainforest. International Journal of
Social Forestry (IJSF) 1, 145 – 166.
Haberl H� (2013)� Net land-atmosphere flows of biogenic carbon related to bioen-
ergy: towards an understanding of systemic feedbacks. Global Change Biology
Bioenergy.
Haberl H�, T� Beringer, S� C� Bhattacharya, K�-H� Erb, and M� Hoogwijk (2010)�
The global technical potential of bio-energy in 2050 considering sustainability
constraints. Current Opinion in Environmental Sustainability 2, 394 – 403. doi:
10.1016 / j.cosust.2010.10.007, ISSN: 1877-3435.
Haberl H�, K�-H� Erb, F� Krausmann, A� Bondeau, C� Lauk, C� Müller, C� Plutzar,
and J� K� Steinberger (2011a)� Global bioenergy potentials from agricultural
land in 2050: Sensitivity to climate change, diets and yields. Biomass and Bioen-
ergy 35, 4753 – 4769. doi: 10.1016 / j.biombioe.2011.04.035, ISSN: 0961-9534.
Haberl H�, K� H� Erb, F� Krausmann, V� Gaube, A� Bondeau, C� Plutzar, S� Gin-
grich, W� Lucht, and M� Fischer-Kowalski (2007)� Quantifying and mapping
the human appropriation of net primary production in earth’s terrestrial eco-
systems. Proceedings of the National Academy of Sciences 104, 12942 – 12947.
doi: 10.1073 / pnas.0704243104.
Haberl H�, M� Fischer-Kowalski, F� Krausmann, J� Martinez-Alier, and V� Win-
iwarter (2011b)� A socio-metabolic transition towards sustainability? Chal-
lenges for another Great Transformation. Sustainable Development 19, 1 – 14.
doi: 10.1002 / sd.410, ISSN: 1099-1719.
Haberl H�, C� Mbow, X� Deng, E� G� Irwin, S� Kerr, T� Kuemmerle, O� Mertz, P�
Meyfroidt, and B� L� Turner II (2013a)� Finite Land Resources and Competi-
tion. Strüngmann Forum Reports. In: Rethinking global land use in an urban era,
edited by Karen C. Seto and Anette Reenberg. MIT Press, Cambridge, MA, pp.
33 – 67. ISBN: 9780262026901.
Haberl H�, E�-D� Schulze, C� Körner, B� E� Law, B� Holtsmark, and S� Luyssaert
(2013b)� Response: complexities of sustainable forest use. GCB Bioenergy 5,
1 – 2. doi: 10.1111 / gcbb.12004, ISSN: 17571693.
Haberl H�, D� Sprinz, M� Bonazountas, P� Cocco, Y� Desaubies, M� Henze, O� Her-
tel, R� K� Johnson, U� Kastrup, P� Laconte, E� Lange, P� Novak, J� Paavola, A�
Reenberg, S� van den Hove, T� Vermeire, P� Wadhams, and T� Searchinger
(2012)� Correcting a fundamental error in greenhouse gas accounting related
to bioenergy. Energy Policy 45, 18 – 23. doi: 10.1016 / j.enpol.2012.02.051, ISSN:
0301-4215.
Hakala K�, M� Kontturi, and K� Pahkala (2009)� Field biomass as global energy
source. Agricultural and Food Science 18, 347 – 365. ISSN: 1459-6067.
Hall J�, S� Matos, L� Severino, and N� Beltrão (2009)� Brazilian biofuels and social
exclusion: established and concentrated ethanol versus emerging and dis-
persed biodiesel. Journal of Cleaner Production 17, Supplement 1, S77 – S85.
doi: 10.1016 / j.jclepro.2009.01.003, ISSN: 0959-6526.
Hallgren W�, C� A� Schlosser, E� Monier, D� Kicklighter, A� Sokolov, and J� Meli-
llo (2013)� Climate impacts of a large-scale biofuels expansion. Geophysical
Research Letters 40, 1624 – 1630. doi: 10.1002 / grl.50352, ISSN: 1944-8007.
Halsnæs K�, and J� Verhagen (2007)� Development based climate change adap-
tation and mitigation — conceptual usues and lessons learned in studies in
developing countries. Mitigation and Adaptation Strategies for Global Change
Volume 12, 665 – 684.
Halvorson J� J�, J� M� Gonzalez, and A� E� Hagerman (2011)� Repeated applica-
tions of tannins and related phenolic compounds are retained by soil and affect
cation exchange capacity. Soil Biology and Biochemistry 43, 1139 – 1147. doi:
10.1016 / j.soilbio.2011.01.023, ISSN: 0038-0717.
Hamelinck C� N�, and A� P� Faaij (2006)� Outlook for advanced biofuels. Energy
Policy 34, 3268 – 3283.
Hanff E�, M�-H� Dabat, and J� Blin (2011)� Are biofuels an efficient technology
for generating sustainable development in oil-dependent African nations? A
macroeconomic assessment of the opportunities and impacts in Burkina Faso.
Renewable and Sustainable Energy Reviews 15, 2199 – 2209. doi: 10.1016 / j.
rser.2011.01.014, ISSN: 1364-0321.
Hansen M� C�, S� V� Stehman, and P� V� Potapov (2010)� Quantification of global
gross forest cover loss. Proceedings of the National Academy of Sciences of
the United States of America 107, 8650 – 8655. doi: 10.1073 / pnas.0912668107,
ISSN: 0027-8424.
Hardner J� J�, P� C� Frumhoff, and D� C� Goetze (2000)� Prospects for mitigating
carbon, conserving biodiversity, and promoting socioeconomic development
objectives through the clean development mechanism. Mitigation and Adapta-
tion Strategies for Global Change 5, 61 – 80. doi: 10.1023 / A:1009685323704,
ISSN: 1381-2386, 1573 – 1596.
Harper R� J�, A� C� Beck, P� Ritson, M� J� Hill, C� D� Mitchell, D� J� Barrett, K� R� J�
Smettem, and S� S� Mann (2007)� The potential of greenhouse sinks to under-
write improved land management. Ecological Engineering 29, 329 – 341.
Harper R� J�, S� J� Sochacki, K� R� J� Smettem, and N� Robinson (2010)� Bioenergy
Feedstock Potential from Short-Rotation Woody Crops in a Dryland Environ-
ment†. Energy & Fuels 24, 225 – 231. doi: 10.1021 / ef9005687, ISSN: 0887-0624.
Harris N� L�, S� Brown, S� C� Hagen, S� S� Saatchi, S� Petrova, W� Salas, M� C�
Hansen, P� V� Potapov, and A� Lotsch (2012)� Baseline Map of Carbon Emis-
sions from Deforestation in Tropical Regions. Science 336, 1573 – 1576. doi:
10.1126 / science.1217962, ISSN: 0036-8075, 1095 – 9203.
Harsono S� S�, A� Prochnow, P� Grundmann, A� Hansen, and C� Hallmann
(2012)� Energy balances and greenhouse gas emissions of palm oil biodiesel
in Indonesia. GCB Bioenergy 4, 213 – 228. doi: 10.1111 / j.1757 - 1707.2011.011
18.x, ISSN: 1757-1707.
Harvey C� A�, B� Dickson, and C� Kormos (2010)� Opportunities for achieving bio-
diversity conservation through REDD. Conservation Letters 3, 53 – 61. doi: 10.11
11 / j.1755 - 263X.2009.00086.x.
Harvey C� A�, O� Komar, R� Chazdon, B� G� Ferguson, B� Finegan, D� M� Griffith, M�
Martinez-Ramos, H� Morales, R� Nigh, L� Soto-Pinto, M� van Breugel, and
M� Wishnie (2008)� Integrating agricultural landscapes with biodiversity conser-
vation in the Mesoamerican hotspot. Conservation Biology 22, 8 – 15. Available
at: http: / / onlinelibrary.wiley.com / doi / 10.1111 / j.1523 - 1739.2007.00863.x / full.

900900
Agriculture, Forestry and Other Land Use (AFOLU)
11
Chapter 11
Harvey M�, and S� Pilgrim (2011)� The new competition for land: Food, energy,
and climate change. Food Policy 36, 40 – 51.
Havemann T� (2011)� Financing Mitigation in Smallholder Agricultural Systems:
Issues and Opportunities. CGIAR Research Program on Climate Change, Agri-
culture and Food Security (CCAFS), Copenhagen, Denmark, 27 pp. Available at:
http: / / cgspace.cgiar.org / handle / 10568 / 6576.
Havlík P�, U� A� Schneider, E� Schmid, H� Böttcher, S� Fritz, R� Skalský, K� Aoki,
S� D� Cara, G� Kindermann, F� Kraxner, S� Leduc, I� McCallum, A� Mosnier,
T� Sauer, and M� Obersteiner (2011)� Global land-use implications of first
and second generation biofuel targets. Energy Policy 39, 5690 – 5702. doi:
10.1016 / j.enpol.2010.03.030, ISSN: 0301-4215.
Hegarty R� S�, J� P� Goopy, R� M� Herd, and B� McCorkell (2007)� Cattle selected
for lower residual feed intake have reduced daily methane production. Jour-
nal of Animal Science 85, 1479 – 1486. doi: 10.2527 / jas.2006 - 236, ISSN: 0021-
8812, 1525 – 3163.
Heggenstaller A� H�, R� P� Anex, M� Liebman, D� N� Sundberg, and L� R� Gibson
(2008)� Productivity and Nutrient Dynamics in Bioenergy Double-Cropping
Systems. Agronomy Journal 100, 1740. doi: 10.2134 / agronj2008.0087, ISSN:
1435-0645.
Hein L�, and P� J� van der Meer (2012)� REDD+ in the context of ecosystem man-
agement. Current Opinion in Environmental Sustainability 4, 604 – 611. doi:
10.1016 / j.cosust.2012.09.016, ISSN: 1877-3435.
Helin T�, L� Sokka, S� Soimakallio, K� Pingoud, and T� Pajula (2013)� Approaches
for inclusion of forest carbon cycle in life cycle assessment — a review. GCB
Bioenergy 5, 475 – 486. doi: 10.1111 / gcbb.12016, ISSN: 1757-1707.
Heller N� E�, and E� S� Zavaleta (2009)� Biodiversity management in the face of
climate change: A review of 22 years of recommendations. Biological Conserva-
tion 142, 14 – 32. doi: 10.1016 / j.biocon.2008.10.006, ISSN: 00063207.
Hennig C�, and M� Gawor (2012)� Bioenergy production and use: Comparative
analysis of the economic and environmental effects. Energy Conversion and
Management 63, 130 – 137. doi: 10.1016 / j.enconman.2012.03.031, ISSN: 0196-
8904.
Herawati H�, and H� Santoso (2011)� Tropical forest susceptibility to and risk of
fire under changing climate: A review of fire nature, policy and institutions in
Indonesia. Forest Policy and Economics 13, 227 – 233.
Herold M�, and T� Johns (2007)� Linking requirements with capabilities for defor-
estation monitoring in the context of the UNFCCC-REDD process. Environmen-
tal Research Letters 2, 045025. doi: 10.1088 / 1748 - 9326 / 2 / 4 / 045025, ISSN:
1748-9326.
Herold M�, and M� Skutsch (2011)� Monitoring, reporting and verification for
national REDD+ programmes: two proposals. Environmental Research Letters
6, doi:10.1088 / 1748 – 9326 / 6 / 1 / 014002.
Herrero M�, P� Havlík, H� Valin, A� Notenbaert, M�C� Rufino, P�K� Thornton, M�
Blümmel, F� Weiss, D� Grace, and M� Obersteiner (2013)� Biomass use, pro-
duction, feed efficiencies, and greenhouse gas emissions from global livestock
systems. Proceedings of the National Academy of Sciences 110, 20888 – 20893.
doi: 10.1073 / pnas.1308149110, ISSN: 0027-8424, 1091 – 6490.
Herrero M�, P� K� Thornton, A� M� Notenbaert, S� Wood, S� Msangi, H� A� Free-
man, D� Bossio, J� Dixon, M� Peters, J� van de Steeg, J� Lynam, P� P� Rao, S�
Macmillan, B� Gerard, J� McDermott, C� Sere, and M� Rosegrant (2010)�
Smart Investments in Sustainable Food Production: Revisiting Mixed Crop-
Livestock Systems. Science 327, 822 – 825. doi: 10.1126 / science.1183725, ISSN:
0036-8075, 1095 – 9203.
Hertel T� W�, A� A� Golub, A� D� Jones, M� O’Hare, R� J� Plevin, and D� M� Kammen
(2010)� Effects of US Maize Ethanol on Global Land Use and Greenhouse Gas
Emissions: Estimating Market-mediated Responses. BioScience 60, 223 – 231.
doi: 10.1525 / bio.2010.60.3.8, ISSN: 0006-3568, 1525 – 3244.
Hertwich E� (2012)� Biodiversity: Remote responsibility. Nature 486, 36 – 37. doi:
10.1038 / 486036a, ISSN: 0028-0836.
Hill J�, E� Nelson, D� Tilman, S� Polasky, and D� Tiffany (2006)� Environmental,
economic, and energetic costs and benefits of biodiesel and ethanol biofuels.
Proceedings of the National Academy of Sciences 103, 11206 – 11210. doi:
10.1073 / pnas.0604600103, ISSN: 0027-8424, 1091 – 6490.
Van der Hilst F�, V� Dornburg, J� P� M� Sanders, B� Elbersen, A� Graves, W� C�
Turkenburg, H� W� Elbersen, J� M� C� van Dam, and A� P� C� Faaij (2010)�
Potential, spatial distribution and economic performance of regional biomass
chains: The North of the Netherlands as example. Agricultural Systems 103,
403 – 417.
Van der Hilst F�, and A� P� Faaij (2012)� Spatiotemporal cost-supply curves for
bioenergy production in Mozambique. Biofuels, Bioproducts and Biorefining 6,
405 – 430.
Van der Hilst F�, J� P� Lesschen, J� M� C� van Dam, M� Riksen, P� A� Verweij, J� P� M�
Sanders, and A� P� C� Faaij (2012a)� Spatial variation of environmental impacts
of regional biomass chains. Renewable and Sustainable Energy Reviews 16,
2053 – 2069. doi: 10.1016 / j.rser.2012.01.027, ISSN: 1364-0321.
Van der Hilst F�, J� A� Verstegen, D� Karssenberg, and A� P� C� Faaij (2012b)�
Spatiotemporal land use modelling to assess land availability for energy
crops — illustrated for Mozambique. GCB Bioenergy 4, 859 – 874. doi: 10.1111 / j
.1757 - 1707.2011.01147.x, ISSN: 1757-1707.
Hodges R� J�, J� C� Buzby, and B� Bennett (2011)� Postharvest Losses and
Waste in Developed and Less Developed Countries: Opportunities to
Improve Resource Use. The Journal of Agricultural Science 149, 37 – 45. doi:
10.1017 / S0021859610000936.
Hoefnagels R�, M� Banse, V� Dornburg, and A� Faaij (2013)� Macro-economic
impact of large-scale deployment of biomass resources for energy and mate-
rials on a national level — A combined approach for the Netherlands. Energy
Policy 59, 727 – 744. doi: 10.1016 / j.enpol.2013.04.026, ISSN: 0301-4215.
Hoefnagels R�, E� Smeets, and A� Faaij (2010)� Greenhouse gas footprints of dif-
ferent biofuel production systems. Renewable and Sustainable Energy Reviews
14, 1661 – 1694. doi: 10.1016 / j.rser.2010.02.014, ISSN: 1364-0321.
Holtsmark B� (2012)� Harvesting in boreal forests and the biofuel carbon debt. Cli-
matic Change 112, 415 – 428. doi: 10.1007 / s10584 - 011 - 0222 - 6, ISSN: 0165-
0009, 1573 – 1480.
Holtsmark B� (2013)� The outcome is in the assumptions: analyzing the effects
on atmospheric CO
2
levels of increased use of bioenergy from forest biomass.
Global Change Biology Bioenergy in print.
Hoogwijk M�, A� Faaij, B� Eickhout, B� De Vries, and W� Turkenburg (2005)�
Potential of biomass energy out to 2100, for four IPCC SRES land-use scenarios.
Biomass and Bioenergy 29, 225 – 257. doi: 10.1016 / j.biombioe.2005.05.002,
ISSN: 09619534.
Hoogwijk M�, A� Faaij, B� de Vries, and W� Turkenburg (2009)� Exploration
of regional and global cost – supply curves of biomass energy from short-
rotation crops at abandoned cropland and rest land under four IPCC SRES
land-use scenarios. Biomass and Bioenergy 33, 26 – 43. doi: 10.1016 / j.biom-
bioe.2008.04.005, ISSN: 0961-9534.

901901
Agriculture, Forestry and Other Land Use (AFOLU)
11
Chapter 11
Hooijer A�, S� Page, J� G� Canadell, M� Silvius, J� Kwadijk, H� Wösten, and J�
Jauhiainen (2010)� Current and future CO
2
emissions from drained peatlands
in Southeast Asia. Biogeosciences 7, 1505 – 1514.
Hook S� E�, A� Wright, and B� W� McBride (2010)� Methanogens: Methane
Producers of the Rumen and Mitigation Strategies. Archaea 2010. doi:
10.1155 / 2010 / 945785, ISSN: 1472-3646.
Van der Horst D�, and S� Vermeylen (2011)� Spatial scale and social impacts of
biofuel production. Biomass and Bioenergy 35, 2435 – 2443. doi: 10.1016 / j.
biombioe.2010.11.029, ISSN: 0961-9534.
Houghton R� A� (2003)� Revised estimates of the annual net flux of carbon to the
atmosphere from changes in land use and land management 1850 – 2000. Tel-
lus B 55, 378 – 390.
Houghton R�� (2012)� Carbon emissions and the drivers of deforestation and forest
degradation in the tropics. Current Opinion in Environmental Sustainability 4,
597 – 603. doi: 10.1016 / j.cosust.2012.06.006, ISSN: 1877-3435.
Houghton R� A� (2013)� The emissions of carbon from deforestation and degrada-
tion in the tropics: past trends and future potential. Carbon Management 4,
539 – 546. doi: 10.4155 / cmt.13.41, ISSN: 1758-3004.
Houghton R� A�, J� I� House, J� Pongratz, G� R� van der Werf, R� S� DeFries,
M� C� Hansen, C� Le Quéré, and N� Ramankutty (2012)� Carbon emissions
from land use and land-cover change. Biogeosciences 9, 5125 – 5142. doi:
10.5194 / bg-9 - 5125 - 2012, ISSN: 1726-4189.
House J� I�, I� Colin Prentice, and C� Le Quéré (2002)� Maximum impacts of future
reforestation or deforestation on atmospheric CO
2
. Global Change Biology 8,
1047 – 1052.
Howden S� M�, S� J� Crimp, and C� J� Stokes (2008)� Climate change and Austra-
lian livestock systems: impacts, research and policy issues. Australian Journal of
Experimental Agriculture 48, 780 – 788.
Hristov A� N�, J� Oh, C� Lee, R� Meinen, F� Montes, T� Ott, J� Firkins, A� Rotz, C�
Dell, A� Adesogan, W� Yang, J� Tricarico, E� Kebreab, G� Waghorn, J� Dijks-
tra, and S� Oosting (2013)� Food Value Chain Transformations in Developing
Countries. FAO, Food and Agriculture Organization of the United Nations, Rome,
Italy, 210 pp.
Hsu D� D�, D� Inman, G� A� Heath, E� J� Wolfrum, M� K� Mann, and A� Aden (2010)�
Life Cycle Environmental Impacts of Selected U. S. Ethanol Production and Use
Pathways in 2022. Environmental Science & Technology 44, 5289 – 5297. doi:
10.1021 / es100186h, ISSN: 0013-936X.
Hu Z�, J� W� Lee, K� Chandran, S� Kim, and S� K� Khanal (2012)� Nitrous Oxide
(N
2
O) Emission from Aquaculture: A Review. Environmental Science & Technol-
ogy 46, 6470 – 6480. doi: 10.1021 / es300110x, ISSN: 0013-936X, 1520 – 5851.
Hu Z�, J� W� Lee, K� Chandran, S� Kim, K� Sharma, A� C� Brotto, and S� K� Khanal
(2013)� Nitrogen transformations in intensive aquaculture system and its impli-
cation to climate change through nitrous oxide emission. Bioresource Technol-
ogy 130, 314 – 320. doi: 10.1016 / j.biortech.2012.12.033, ISSN: 09608524.
Huang M�, and G� P� Asner (2010)� Long-term carbon loss and recovery following
selective logging in Amazon forests. Global Biogeochemical Cycles 24, 15. doi:
201010.1029 / 2009GB003727.
Huang Y�, and Y� Tang (2010)� An estimate of greenhouse gas (N
2
O and CO
2
) miti-
gation potential under various scenarios of nitrogen use efficiency in Chinese
croplands: Mitigating n-induced ghg emission in China. Global Change Biology
16, 2958 – 2970. doi: 10.1111 / j.1365 - 2486.2010.02187.x, ISSN: 13541013.
Huang J�, J� Yang, S� Msangi, S� Rozelle, and A� Weersink (2012)� Biofuels and
the poor: Global impact pathways of biofuels on agricultural markets. Food Pol-
icy 37, 439 – 451. doi: 10.1016 / j.foodpol.2012.04.004, ISSN: 0306-9192.
Hudiburg T� W�, B� E� Law, C� Wirth, and S� Luyssaert (2011)� Regional carbon
dioxide implications of forest bioenergy production. Nature Climate Change 1,
419 – 423. doi: 10.1038 / nclimate1264, ISSN: 1758-678X.
Huettner M� (2012)� Risks and opportunities of REDD+ implementation for envi-
ronmental integrity and socio-economic compatibility. Environmental Science &
Policy 15, 4 – 12. doi: 10.1016 / j.envsci.2011.10.002, ISSN: 1462-9011.
Hughes R� F�, S� R� Archer, G� P� Asner, C� A� Wessman, C� McMURTRY, J� Nelson,
and R� J� Ansley (2006)� Changes in aboveground primary production and car-
bon and nitrogen pools accompanying woody plant encroachment in a temper-
ate savanna. Global Change Biology 12, 1733 – 1747. doi: 10.1111 / j.1365 - 2486
.2006.01210.x, ISSN: 1365-2486.
Hunsberger C�, S� Bolwig, E� Corbera, and F� Creutzig (2012)� Livelihood
impacts of biofuel crop production: mediating factors and implications for
governance. Copenhagen Biofuels Research Network — COBREN, Copenhagen,
19 – 20 November 2012.
Hunsberger C�, and T� P� Evans (2012)� Chapter 3 — Land. In: Fith Global Environ-
ment Outlook (GEO 5). United Nations Environment Programme (UNEP), Lon-
don, 65 — 97.
Huntingford C�, P� Zelazowski, D� Galbraith, L� M� Mercado, S� Sitch, R� Fisher,
M� Lomas, A� P� Walker, C� D� Jones, B� B� B� Booth, Y� Malhi, D� Hemming,
G� Kay, P� Good, S� L� Lewis, O� L� Phillips, O� K� Atkin, J� Lloyd, E� Gloor, J�
Zaragoza-Castells, P� Meir, R� Betts, P� P� Harris, C� Nobre, J� Marengo, and
P� M� Cox (2013)� Simulated resilience of tropical rainforests to CO
2
-induced
climate change. Nature Geoscience 6, 268 – 273. doi: 10.1038 / ngeo1741, ISSN:
1752-0894.
Hurtt G�, L� Chini, S� Frolking, R� Betts, J� Feddema, G� Fischer, J� Fisk, K� Hib-
bard, R� Houghton, A� Janetos, C� Jones, G� Kindermann, T� Kinoshita,
K� Klein Goldewijk, K� Riahi, E� Shevliakova, S� Smith, E� Stehfest, A�
Thomson, P� Thornton, D� van Vuuren, and Y� Wang (2011)� Harmonization
of land-use scenarios for the period 1500 – 2100: 600 years of global gridded
annual land-use transitions, wood harvest, and resulting secondary lands. Cli-
matic Change 109, 117 – 161. doi: 10.1007 / s10584 - 011 - 0153 - 2, ISSN: 0165-
0009.
IAASTD (2009)� Agriculture at a Crossroads: Global Report. International Assess-
ment of Agricultural Knowledge, Science and Technology for Development
(IAASTD), 590 pp.
IBI Biochar (2012)� Standardized Product Definition and Product Testing Guide-
lines for Biochar That Is Used in Soil | International Biochar Initiative. Interna-
tional Biochar Initiative, 47 pp. Available at: http: / / www. biochar-international.
org / characterizationstandard.
IEA (2010)� Energy Technology Perspectives 2010. Scenarios & Strategies to 2050.
International Energy Agency, Paris, France, 706 pp.
IEA (2011)� Energy for All: Financing Access for the Poor. Special Early Excerpt of
the World Energy Outlook 2011. Organisation for Economic Co-Operation and
Development / International Energy Agency, Paris, France, 48 pp.
IEA (2012a)� Tracking Clean Energy Progress. Energy Technology Perspectives 2012
Excerpt as IEA Input to the Clean Energy Ministerial. Paris, France, 82 pp. Avail-
able at: https: / / www. iea. org / publications / freepublications / publication / Track-
ing_Clean_Energy_Progress.pdf.

902902
Agriculture, Forestry and Other Land Use (AFOLU)
11
Chapter 11
IEA (2012b)� World Energy Outlook 2012. OECD / IEA, Paris, France, 690 pp. Avail-
able at: http: / / www. worldenergyoutlook. org / publications / weo-2012 / #d.
en.26099.
IEA (2012c)� Technology Roadmaps: Bioenergy for Heat and Power. International
Energy Agency, Paris, France, 62 pp.
IEA (2013)� World Energy Outlook 2013. OECD, Paris, France, 708 pp. Available at:
http: / / www. worldenergyoutlook. org / publications / weo-2013 / .
IEA-ETSAP, and IRENA (2013)� Production of Bio-Ethylene: Technology Brief.
Nternational Renewable Energy Agency and Energy Technology Systems
Analysis Programme of the International Energy Agency, 20 pp. Available at:
http: / / www. irena. org / DocumentDownloads / Publications / IRENA-ETSAP%20
Tech%20Brief%20I13 %20Production_of_Bio-ethylene.pdf.
Imhoff M� L�, L� Bounoua, T� Ricketts, C� Loucks, R� Harriss, and W� T� Lawrence
(2004)� Global patterns in human consumption of net primary production.
Nature 429, 870 – 873. doi: 10.1038 / nature02619, ISSN: 0028-0836.
Immerzeel D� J�, P� Verweij, F� Hilst, and A� P� Faaij (2013)� Biodiversity impacts of
bioenergy crop production: a state-of-the-art review. GCB Bioenergy.
Ingerson A� (2011)� Carbon storage potential of harvested wood: summary and
policy implications. Mitigation and Adaptation Strategies for Global Change 16,
307 – 323. doi: 10.1007 / s11027 - 010 - 9267 - 5, ISSN: 1381-2386, 1573 – 1596.
IPCC (1996)� Climate Change 1995: The Science of Climate Change. Contribution
of Working Group I to the Second Assessment Report of the Intergovernmen-
tal Panel on Climate Change [J. T. Houghton, L. G. Meira Filho, B. A. Callander,
N. Harris, A. Kattenberg, K. Maskell (eds.)]. Cambridge University Press, Cam-
bridge, UK and New York, NY USA, 588 pp. ISBN: 0 521 56436 0.,
IPCC (2000)� Special Report on Land Use, Land Use Change and Forestry [ R. T. Wa t-
son, I. Noble, B. Bolin, N. H. Ravindranath, D. J. Verardo, and D. J. Dokken (eds.)].
Cambridge University Press, Cambridge, MA, 377 pp.
IPCC (2001)� Summary for Policy Makers. In: Climate Change 2001: Impacts
Adaptation and Vulnerability. Contribution of Working Group I to the Third
Assessment Report of the Intergovernmental Panel on Climate Change [J. J.
McCarthy, O. F. Canziani, N. A. Leary, D. J. Dokken, K. S. White (eds.)]. Cam-
bridge University Press, Cambridge, United Kingdom and New York, NY, USA.
Available at: http: / / ipcc.ch / publications_and_data / publications_and_data_
reports.shtml.
IPCC (2003)� Good Practice Guidance for Land Use, Land-Use Change and Forestry
[J. Penman, M. Gytarsky, T. Hiraishi, T. Krug, D. Kruger, R. Pipatti, L. Buendia, K.
Miwa, T. Ngara, K. Tanabe, F. Wagner (eds.)]. IPCC / OECD / IEA / IGES, Hayama,
Japan, 580 pp.
IPCC (2006)� 2006 National Greenhouse Gas Inventory Guidelines [S. Eggelston, L.
Buendia, K. Miwa, T. Ngara, K. Tanabe (eds.)]. Institute of Global Environmental
Strategies (IGES), Kanagawa, Japan, 20 pp.
IPCC (2007a)� Climate Change Mitigation: Contribution of Working Group III to the
Fourth Assessment Report of the Intergovernmental Panel on Climate Change
[B. Metz, O. R. Davidson, P. R. Bosch, R. Dave, L. A. Meyer (eds)]. Cambridge Uni-
versity Press, Cambridge, United Kingdom and New York, NY, USA, 862pp. Avail-
able at: http: / / www. ipcc. ch / pdf / assessment-report / ar4 / wg3 / ar4-wg3-index.
pdf.
IPCC (2007b)� Impacts, Adaptation and Vulnerability: Contribution of Working
Group II to the Fourth Assessment Report of the Intergovernmental Panel on
Climate Change [M. L. Parry, O. F. Canziani, J. P. Palutikof, P. J. van der Linden and
C. E. Hanson (eds)]. Cambridge University Press, Cambridge, United Kingdom
and New York, NY, USA, 986pp.
IPCC (2011)� IPCC Special Report on Renewable Energy Sources and Climate
Change Mitigation. Prepared by Working Group III of the Intergovernmen-
tal Panel on Climate Change [O. Edenhofer, R. Pichs-Madruga, Y. Sokona,
K. Seyboth, P. Matschoss, S. Kadner, T. Zwickel, P. Eickemeier, G. Hansen, S.
Schlömer, C. von Stechow (eds.)]. Cambridge University Press, Cambridge,
United Kingdom and New York, NY, USA, 1075 pp.
IPCC (2012)� Managing the Risks of Extreme Events and Disasters to Advance
Climate Change Adaption. A Special Report of Working Groups I and II of the
Intergovernmental Panel on Climate Change [Field, C. B., V. Barros, T. F. Stocker,
D. Qin, D. J. Dokken, K. L. Ebi, M. D. Mastrandrea, K. J. Mach, G.-K. Plattner, S. K.
Allen, M. Tignor, and P. M. Midgley (eds.)] Cambridge University Press, Cam-
bridge, UK, and New York, NY, USA, 582 pp.
Ito A� (2005)� Modelling of carbon cycle and fire regime in an east Siberian
larch forest. Ecological Modelling 187, 121 – 139. doi: 10.1016 / j.ecol-
model.2005.01.037, ISSN: 03043800.
ITTO (2008)� Developing Forest Certification: Towards Increasing the Comparabil-
ity and Acceptance of Forest Certification Systems Worldwide. International
Tropical Timber Organization, Yokohama, Japan, 126 pp. ISBN: 4902045397
9784902045390.
Jackson T� (2009)� Prosperity without Growth. Economics for a Finite Planet. Earth-
scan, UK and USA, 264 pp. ISBN: 1844078949.
Jackson R� B�, and J� S� Baker (2010)� Opportunities and Constraints for Forest Cli-
mate Mitigation. BioScience 60, 698 – 707. doi: 10.1525 / bio.2010.60.9.7, ISSN:
0006-3568, 1525 – 3244.
Jackson R� B�, K� A� Farley, W� A� Hoffman, E� G� Jobbágy, and R� L� McCulley
(2007)� Carbon and water tradeoffs in conversions to forests and shrublands.
Global Change — The IGBP Series. In: Terrestrial Ecosystems in a Changing
World. J. G. Canadell, D. E. Pataki, L. F. Pitelka, (eds.), Springer, Berlin, Germany,
pp. 237 – 246. ISBN: 978 - 3-540 - 32730 - 1.
Jackson R� B�, E� G� Jobbágy, R� Avissar, S� B� Roy, D� J� Barrett, C� W� Cook, K� A�
Farley, D� C� Le Maitre, B� A� McCarl, and B� C� Murray (2005)� Trading water
for carbon with biological carbon sequestration. Science 310, 1944.
Jackson R� B�, J� T� Randerson, J� G� Canadell, R� G� Anderson, R� Avissar, D� D�
Baldocchi, G� B� Bonan, K� Caldeira, N� S� Diffenbaugh, C� B� Field, and oth-
ers (2008)� Protecting climate with forests. Environmental Research Letters 3,
044006. ISSN: 1748-9326.
Jain A� K�, P� Meiyappan, Y� Song, and J� I� House (2013)� CO
2
emissions from
land-use change affected more by nitrogen cycle, than by the choice of land-
cover data. Global Change Biology 19, 2893 – 2906. doi: 10.1111 / gcb.12207,
ISSN: 13541013.
Jakobsson E� B�, E� B� Sommer, P� De Clercq, G� Bonazzi, and B� Schröder (2002)�
The policy implementation of nutrient management legislation and effects in
some European Countries. In: The Final Workshop of the EU Concerted Action
Nutrient Management Legislation in European Countries NUMALEC. Pand.
Oderberg, Gent, Belgium.
Janssen P� H�, and M� Kirs (2008)� Structure of the Archaeal Community of the
Rumen. Applied and Environmental Microbiology 74, 3619 – 3625. doi:
10.1128 / AEM.02812 - 07, ISSN: 0099-2240.
Janzen H� H� (2011)� What place for livestock on a re-greening earth? Animal
Feed Science and Technology 166 – 67, 783 – 796. doi: 10.1016 / j.anifeed-
sci.2011.04.055, ISSN: 0377-8401.

903903
Agriculture, Forestry and Other Land Use (AFOLU)
11
Chapter 11
Jaramillo P�, W� M� Griffin, and H� S� Matthews (2008)� Comparative Analysis of
the Production Costs and Life-Cycle GHG Emissions of FT Liquid Fuels from Coal
and Natural Gas. Environmental Science & Technology 42, 7559 – 7565. doi:
10.1021 / es8002074, ISSN: 0013-936X, 1520 – 5851.
Jeffery S�, F� G� A� Verheijen, M� van der Velde, and A� C� Bastos (2011)� A quan-
titative review of the effects of biochar application to soils on crop productiv-
ity using meta-analysis. Agriculture, Ecosystems & Environment 144, 175 – 187.
doi: 10.1016 / j.agee.2011.08.015, ISSN: 0167-8809.
Jerneck A�, and L� Olsson (2013)� A smoke-free kitchen: initiating community
based co-production for cleaner cooking and cuts in carbon emissions. Journal
of Cleaner Production 60, 208 – 215. doi: 10.1016 / j.jclepro.2012.09.026, ISSN:
0959-6526.
Jetter J�, Y� Zhao, K� R� Smith, B� Khan, T� Yelverton, P� DeCarlo, and M� D� Hays
(2012)� Pollutant Emissions and Energy Efficiency under Controlled Condi-
tions for Household Biomass Cookstoves and Implications for Metrics Useful in
Setting International Test Standards. Environmental Science & Technology 46,
10827 – 10834. doi: 10.1021 / es301693f, ISSN: 0013-936X.
Johansson T� B�, N� Nakicenovic, A� Patwardhan, L� Gomez-Echeverri, and
W� C� Turkenburg (2012)� Summary for policymakers. Global Energy Assess-
ment — Toward a Sustainable Future, 3 – 30.
Johnston M�, J� A� Foley, T� Holloway, C� Kucharik, and C� Monfreda (2009a)�
Resetting global expectations from agricultural biofuels. Environmental
Research Letters 4, 014004 (9pp). doi: 10.1088 / 1748 - 9326 / 4 / 1 / 014004, ISSN:
1748-9326.
Johnston M�, R� Licker, J� A� Foley, T� Holloway, N� D� Mueller, C� Barford, and
C� J� Kucharik (2011)� Closing the gap: global potential for increasing biofuel
production through agricultural intensification. Environmental Research Letters
6.
Johnston A� E�, P� R� Poulton, and K� Coleman (2009b)� Chapter 1 Soil Organic
Matter. In: Advances in Agronomy. Elsevier, pp. 1 – 57. ISBN: 9780123748171.
Jones C� S�, and S� P� Mayfield (2012)� Algae biofuels: versatility for the future of
bioenergy. Current Opinion in Biotechnology 23, 346 – 351. doi: 10.1016 / j.cop-
bio.2011.10.013, ISSN: 0958-1669.
Jonker J� G� G�, and A� P� C� Faaij (2013)� Techno-economic assessment of micro-
algae as feedstock for renewable bio-energy production. Applied Energy 102,
461 – 475.
Jonker J� G� G�, M� Junginger, and A� Faaij (2013)� Carbon payback period and
carbon offset parity point of wood pellet production in the South-eastern
United States. GCB Bioenergy, n / a – n / a. doi: 10.1111 / gcbb.12056, ISSN: 1757-
1707.
Joos F�, R� Roth, J� S� Fuglestvedt, G� P� Peters, I� G� Enting, W� von Bloh, V�
Brovkin, E� J� Burke, M� Eby, N� R� Edwards, T� Friedrich, T� L� Frölicher, P� R�
Halloran, P� B� Holden, C� Jones, T� Kleinen, F� Mackenzie, K� Matsumoto,
M� Meinshausen, G�-K� Plattner, A� Reisinger, J� Segschneider, G� Shaf-
fer, M� Steinacher, K� Strassmann, K� Tanaka, A� Timmermann, and A� J�
Weaver (2013)� Carbon dioxide and climate impulse response functions for the
computation of greenhouse gas metrics: a multi-model analysis. Atmospheric
Chemistry and Physics Discussions 12, 19799 – 19869. doi: 10.5194 / acpd-
12 - 19799 - 2012, ISSN: 1680-7375.
Joosten H� (2010)� The Global Peatland CO
2
Picture: Peatland Status and
Drainage Related Emissions in All Countries of the World. Wetlands Inter-
national, Wageningen, Netherlands, 36 pp. Available at: http: / / www.
wetlands. org / WatchRead / Currentpublications / tabid / 56 / mod / 1570 / article-
Type / ArticleView / articleId / 2418 / The-Global-Peatland-CO
2
-Picture.aspx.
JRC / PBL (2013)� Emission Database for Global Atmospheric Research (EDGAR),
Release Version 4.2 FT2010. European Commission, Joint Research Cen-
tre (JRC) / PBL Netherlands Environmental Assessment Agency, Available at:
http: / / edgar.jrc.ec.europa.eu.
Jull C�, P� C� Redondo, V� Mosoti, and J� Vapnek (2007)� Recent Trends in the Law
and Policy of Bioenergy Production, Promotion and Use. FAO, Food and Agricul-
ture Organization of the United Nations, Rome, Italy, 55 pp.
Junginger M�, J� van Dam, S� Zarrilli, F� Ali Mohamed, D� Marchal, and A� Faaij
(2011)� Opportunities and barriers for international bioenergy trade. Energy
Policy 39, 2028 – 2042. doi: 16 / j.enpol.2011.01.040, ISSN: 0301-4215.
Junginger M�, C� S� Goh, and A� Faaij (2014)� International Bioenergy Trade: His-
tory, Status & Outlook on Securing Sustainable Bioenergy Supply, Demand and
Markets. 233 pp. ISBN: 978 - 94 - 007 - 6982 - 3.
Kaiser E�-A�, and R� Ruser (2000)� Nitrous oxide emissions from ara-
ble soils in Germany — An evaluation of six long-term field experi-
ments. Journal of Plant Nutrition and Soil Science 163, 249 – 259. doi:
10.1002 / 1522 - 2624(200006)163:3< 249::AID-JPLN249> 3.0.CO;2-Z, ISSN:
1522-2624.
Kandji S� T�, L� V� Verchot, and J� Mackensen (2006)� Climate Change and Vari-
ability in the Sahel Region: Impacts and Adaptation Strategies in the Agricul-
tural Sector. World Agroforestry Centre (ICRAF) / United Nations Environment
Programme (UNEP), Nairobi, Kenya, 58 pp.
Kaphengst T�, M� S� Ma, and S� Schlegel (2009)� At a Tipping Point? How the
Debate on Biofuel Standards Sparks Innovative Ideas for the General Future of
Standardization and Certification Schemes. Journal of Cleaner Production 17,
99 – 101.
Kar A�, I� H� Rehman, J� Burney, S� P� Puppala, R� Suresh, L� Singh, V� K� Singh, T�
Ahmed, N� Ramanathan, and V� Ramanathan (2012)� Real-time assessment
of black carbon pollution in Indian households due to traditional and improved
biomass cookstoves. Environmental Science & Technology 46, 2993 – 3000.
Karipidis P�, E� Tsakiridou, S� Aggelopoulos, and A� Belidis (2010)� Consumers’
purchasing and store switching intentions in respect of eco-marked products.
International Journal of Economics and Business Research 2, 511 – 524. doi:
10.1504 / IJEBR.2010.035702, ISSN: 1756-9850.
Karsenty A�, A� Vogel, and F� Castell (2014)� “Carbon rights”, REDD+ and pay-
ments for environmental services. Environmental Science & Policy 35, 20 – 29.
doi: 10.1016 / j.envsci.2012.08.013, ISSN: 1462-9011.
Kastner T�, K�-H� Erb, and S� Nonhebel (2011a)� International wood trade and
forest change: A global analysis. Global Environmental Change 21, 947 – 956.
doi: 16 / j.gloenvcha.2011.05.003, ISSN: 0959-3780.
Kastner T�, M� Kastner, and S� Nonhebel (2011b)� Tracing distant environmental
impacts of agricultural products from a consumer perspective. Ecological Eco-
nomics 70, 1032 – 1040. doi: 16 / j.ecolecon.2011.01.012, ISSN: 0921-8009.
Kastner T�, M� J� I� Rivas, W� Koch, and S� Nonhebel (2012)� Global changes
in diets and the consequences for land requirements for food. Pro-
ceedings of the National Academy of Sciences 109, 6868 – 6872. doi:
10.1073 / pnas.1117054109, ISSN: 0027-8424, 1091 – 6490.

904904
Agriculture, Forestry and Other Land Use (AFOLU)
11
Chapter 11
Kataeva I�, M� B� Foston, S�-J� Yang, S� Pattathil, A� K� Biswal, F� L� P� Ii, M� Basen,
A� M� Rhaesa, T� P� Thomas, P� Azadi, V� Olman, T� D� Saffold, K� E� Mohler,
D� L� Lewis, C� Doeppke, Y� Zeng, T� J� Tschaplinski, W� S� York, M� Davis, D�
Mohnen, Y� Xu, A� J� Ragauskas, S�-Y� Ding, R� M� Kelly, M� G� Hahn, and
M� W� W� Adams (2013)� Carbohydrate and lignin are simultaneously solubi-
lized from unpretreated switchgrass by microbial action at high temperature.
Energy & Environmental Science 6, 2186 – 2195. doi: 10.1039 / C3EE40932E,
ISSN: 1754-5706.
Katila P� (2008)� Devolution of Forest-Related Rights: Comparative Analyses of Six
Developing Countries. University of Helsinki, Vikki Tropical Resources Institute,
Helsinki, Finland, 162 pp. ISBN: 978 - 952 - 10 - 4518 - 9.
Kato E�, T� Kinoshita, A� Ito, M� Kawamiya, and Y� Yamagata (2011)� Evaluation
of spatially explicit emission scenario of land-use change and biomass burning
using a process-based biogeochemical model. Journal of Land Use Science 8,
104 – 122. doi: 10.1080 / 1747423X.2011.628705, ISSN: 1747-423X.
Kaufman A� S�, P� J� Meier, J� C� Sinistore, and D� J� Reinemann (2010)� Applying
life-cycle assessment to low carbon fuel standards — How allocation choices
influence carbon intensity for renewable transportation fuels. Energy Policy 38,
5229 – 5241. doi: 10.1016 / j.enpol.2010.05.008, ISSN: 0301-4215.
Keating B� A�, P� S� Carberry, and J� Dixon (2013)� Agricultural intensification and
the food security challenge in Sub Saharan Africa. In: Agro-Ecological Inten-
sification of Agricultural Systems in the African Highlands. Routledge, US and
Canada, pp. 20 – 35. ISBN: 978 - 0-415 - 53273 - 0.
Keeling L� J�, J� Rushen, and I� J� H� Duncan (2011)� Understanding animal welfare.
In: Animal welfare. M. C. Appleby, J. A. Mench, I. a. S. Olsson, B. O. Hughes, (eds.),
CABI, Wallingford, UK, pp. 13 – 26. ISBN: 978 - 1-84593 - 659 - 4.
Kehlbacher A�, R� Bennett, and K� Balcombe (2012)� Measuring the consumer
benefits of improving farm animal welfare to inform welfare labelling. Food
Policy 37, 627 – 633. doi: 10.1016 / j.foodpol.2012.07.002, ISSN: 0306-9192.
Van Kessel C�, R� Venterea, J� Six, M� A� Adviento-Borbe, B� Linquist, and K� J�
van Groenigen (2013)� Climate, duration, and N placement determine N
2
O
emissions in reduced tillage systems: a meta-analysis. Global Change Biology
19, 33 – 44. doi: 10.1111 / j.1365 - 2486.2012.02779.x, ISSN: 13541013.
Khanna M�, C� L� Crago, and M� Black (2011)� Can biofuels be a solution to cli-
mate change? The implications of land use change-related emissions for policy.
Interface Focus 1, 233 – 247. doi: 10.1098 / rsfs.2010.0016, ISSN: 2042-8898,
2042 – 8901.
Kim D�-G�, G� Hernandez-Ramirez, and D� Giltrap (2013)� Linear and nonlin-
ear dependency of direct nitrous oxide emissions on fertilizer nitrogen input:
A meta-analysis. Agriculture, Ecosystems & Environment 168, 53 – 65. doi:
10.1016 / j.agee.2012.02.021, ISSN: 01678809.
Kim M� K�, and B� A� McCarl (2009)� Uncertainty discounting for land-based carbon
sequestration. Journal of Agricultural and Applied Economics 41, 1 – 11.
Kiptot E�, and S� Franzel (2012)� Gender and agroforestry in Africa: a
review of women’s participation. Agroforest Systems 84, 35 – 58. doi:
10.1007 / s10457 - 011 - 9419-y.
De Klein C� A� M�, and R� J� Eckard (2008)� Targeted technologies for nitrous oxide
abatement from animal agriculture. Australian Journal of Experimental Agricul-
ture 48, 14 – 20. Available at: http: / / dx.doi.org / 10.1071 / EA07217.
De Klein C� A� M�, R� J� Eckard, and T� J� van der Weerden (2010)� Nitrous Oxide
Emissions from the Nitrogen Cycle in Livestock Agriculture: Estimation and
Mitigation. In: Nitrous Oxide and Climate Change. K. Smith, (ed.), Earthscan
Publications, London, pp. 107 – 144. ISBN: 978 - 1-84407 - 757 - 1.
Kløverpris J� H�, and S� Mueller (2013)� Baseline time accounting: Considering
global land use dynamics when estimating the climate impact of indirect land
use change caused by biofuels. The International Journal of Life Cycle Assess-
ment 18, 319 – 330.
Kløverpris J�, H� Wenzel, M� Banse, L� M� i Canals, and A� Reenberg (2008)�
Conference and workshop on modelling global land use implications in the
environmental assessment of biofuels. The International Journal of Life Cycle
Assessment 13, 178 – 183. doi: 10.1065 / lca2008.03.381, ISSN: 0948-3349,
1614 – 7502.
Kochsiek A� E�, and J� M� Knops (2012)� Maize cellulosic biofuels: soil carbon loss
can be a hidden cost of residue removal. GCB Bioenergy 4, 229 – 233.
Koehler K� A�, S� M� Kreidenweis, P� J� DeMott, M� D� Petters, A� J� Prenni, and
O� Möhler (2010)� Laboratory investigations of the impact of mineral dust
aerosol on cold cloud formation. Atmos. Chem. Phys. 10, 11955 – 11968. doi:
10.5194 / acp-10 - 11955 - 2010, ISSN: 1680-7324.
Koh L� P�, and J� Ghazoul (2008)� Biofuels, biodiversity, and people: Understand-
ing the conflicts and finding opportunities. Biological Conservation 141,
2450 – 2460. doi: 10.1016 / j.biocon.2008.08.005, ISSN: 0006-3207.
Koh L� P�, and D� S� Wilcove (2008)� Is oil palm agriculture really destroying tropical
biodiversity? Conservation Letters 1, 60 – 64. doi: 10.1111 / j.1755 - 263X.2008.0
0011.x, ISSN: 1755-263X.
Koizumi T� (2013)� Biofuel and food security in China and Japan. Renewable and
Sustainable Energy Reviews 21, 102 – 109. doi: 10.1016 / j.rser.2012.12.047,
ISSN: 1364-0321.
Koknaroglu H�, and T� Akunal (2013)� Animal welfare: An animal science
approach. 59th International Congress of Meat Science and Technology, 18 – 23
August 2013 Izmir / Turkey 95, 821 – 827. doi: 10.1016 / j.meatsci.2013.04.030,
ISSN: 0309-1740.
Kollmuss A�, M� Lazarus, C� M� Lee, M� LeFranc, and C� Polycarp (2010)� Hand-
book of Carbon Offset Programs Trading Systems, Funds, Protocols and Stan-
dards. Earthscan, London, 240 pp. ISBN: 978 - 1-84407 - 929 - 2(Hb).
Kontur W� S�, D� R� Noguera, and T� J� Donohue (2012)� Maximizing reductant flow
into microbial H
2
production. Current Opinion in Biotechnology 23, 382 – 389.
doi: 10.1016 / j.copbio.2011.10.003, ISSN: 0958-1669.
Koornneef J�, P� van Breevoort, C� Hamelinck, C� Hendriks, M� Hoogwijk, K�
Koop, M� Koper, T� Dixon, and A� Camps (2012)� Global potential for bio-
mass and carbon dioxide capture, transport and storage up to 2050. Inter-
national Journal of Greenhouse Gas Control 11, 117 – 132. doi: 10.1016 / j.
ijggc.2012.07.027, ISSN: 1750-5836.
Koornneef J�, P� van Breevoort, P� Noothout, C� Hendriks, uchien Luning, and
A� Camps (2013)� Global Potential for Biomethane Production with Carbon
Capture, Transport and Storage up to 2050. GHGT-11 37, 6043 – 6052. doi:
10.1016 / j.egypro.2013.06.533, ISSN: 1876-6102.
Körner C� (2006)� Plant CO
2
responses: an issue of definition, time and resource
supply. New Phytologist 172, 393 – 411. doi: 10.1111 / j.1469 - 8137.2006.01886
.x, ISSN: 0028-646X, 1469 – 8137.
Körner C� (2009)� Biologische Kohlenstoffsenken: Umsatz und Kapital nicht ver-
wechseln (Biological Carbon Sinks: Turnover Must Not Be Confused with Capi-
tal). Gaia — Ecological Perspectives for Science and Society 18, 288 – 293.
Krausmann F�, K�-H� Erb, S� Gingrich, H� Haberl, A� Bondeau, V� Gaube, C� Lauk,
C� Plutzar, and T� Searchinger (2013)� Global human appropriation of net
primary production doubled in the 20th century. Proceedings of the National
Academy of Sciences of the USA submitted.

905905
Agriculture, Forestry and Other Land Use (AFOLU)
11
Chapter 11
Krausmann F�, K�-H� Erb, S� Gingrich, C� Lauk, and H� Haberl (2008)� Global
patterns of socioeconomic biomass flows in the year 2000: A comprehensive
assessment of supply, consumption and constraints. Ecological Economics 65,
471 – 487. doi: 16 / j.ecolecon.2007.07.012, ISSN: 0921-8009.
Krausmann F�, S� Gingrich, H� Haberl, K�-H� Erb, A� Musel, T� Kastner, N� Kohl-
heb, M� Niedertscheider, and E� Schwarzlmüller (2012)� Long-term trajec-
tories of the human appropriation of net primary production: Lessons from six
national case studies. Ecological Economics 77, 129 – 138. doi: 10.1016 / j.ecole-
con.2012.02.019, ISSN: 0921-8009.
Kriegler E�, P� Weyant, G� Blanford, V� Krey, L� Clarke, J� Edmonds, A� Fawcett,
G� Luderer, K� Riahi, R� Richels, S� K� Rose, M� Tovani, and D� P� van Vuuren
(2013)� The role of technology for achieving climate policy objectives: overview
of the EMF27 study on global technology and climate policy strategies. Climatic
Change in press. doi: 10.1007 / s10584 - 013 - 0953 - 7.
Kummu M�, H� de Moel, M� Porkka, S� Siebert, O� Varis, and P� J� Ward (2012)�
Lost food, wasted resources: Global food supply chain losses and their impacts
on freshwater, cropland, and fertiliser use. Science of The Total Environment
438, 477 – 489. doi: 10.1016 / j.scitotenv.2012.08.092, ISSN: 0048-9697.
Kurz W� A�, G� Stinson, G� J� Rampley, C� C� Dymond, and E� T� Neilson (2008)�
Risk of natural disturbances makes future contribution of Canada’s forests to
the global carbon cycle highly uncertain. Proceedings of the National Academy
of Sciences 105, 1551.
Kyu H� H�, K� Georgiades, and M� H� Boyle (2010)� Biofuel Smoke and Child Ane-
mia in 29 Developing Countries: A Multilevel Analysis. Annals of Epidemiology
20, 811 – 817. doi: 10.1016 / j.annepidem.2010.07.096, ISSN: 1047-2797.
Laganiere J�, D� A� Angers, and D� Pare (2010)� Carbon accumulation in agricul-
tural soils after afforestation: a meta-analysis: SOC accumulation following
deforestation. Global Change Biology 16, 439 – 453. doi: 10.1111 / j.1365 - 2486.
2009.01930.x, ISSN: 13541013, 13652486.
Laitner J� A� S�, S� J� DeCanio, and I� Peters (2000)� Incorporating Behavioral,
Social and Organizational Phenomena in the Assessment of Climate Change
Mitigation Options. In: Society, Behaviour and Climate Change Mitigation. E.
Jochem, (ed.), Kluwer, Amsterdam, pp. 1 – 64.
Lal R� (2010)� Managing soils for a warming earth in a food-insecure and energy-
starved world. Journal of Plant Nutrition and Soil Science 173, 4 – 15. doi:
10.1002 / jpln.200900290, ISSN: 1522-2624.
Lal R� (2011)� Sequestering carbon in soils of agro-ecosystems. Food Policy 36,
S33 – S39. doi: 10.1016 / j.foodpol.2010.12.001, ISSN: 03069192.
Lam M� K�, K� T� Tan, K� T� Lee, and A� R� Mohamed (2009)� Malaysian palm oil:
Surviving the food versus fuel dispute for a sustainable future. Renewable and
Sustainable Energy Reviews 13, 1456 – 1464. doi: 10.1016 / j.rser.2008.09.009,
ISSN: 1364-0321.
Lambin E� F�, and P� Meyfroidt (2011)� Global land use change, economic global-
ization, and the looming land scarcity. Proceedings of the National Academy of
Sciences 108, 3465 – 3472. doi: 10.1073 / pnas.1100480108, ISSN: 0027-8424,
1091 – 6490.
Lamers P�, and M� Junginger (2013)� The “debt” is in the detail: A synthesis of
recent temporal forest carbon analyses on woody biomass for energy. Biofuels,
Bioproducts and Biorefining 7, 373 – 385. doi: 10.1002 / bbb.1407, ISSN: 1932-
1031.
Lamers P�, H� M� Junginger, C� C� Dymond, and A� Faaij (2013)� Damaged forests
provide an opportunity to mitigate climate change. GCB Bioenergy in press.
Landis D� A�, M� M� Gardiner, W� Van Der Werf, and S� M� Swinton (2008)�
Increasing corn for biofuel production reduces biocontrol services in agri-
cultural landscapes. Proceedings of the National Academy of Sciences 105,
20552 – 20557. Available at: http: / / www. pnas. org / content / 105 / 51 / 20552.
short.
Langeveld J� W�, J� Dixon, H� van Keulen, and P� M� Quist-Wessel (2013)� Analyz-
ing the effect of biofuel expansion on land use in major producing countries:
evidence of increased multiple cropping. Biofuels, Bioproducts and Biorefining
8, 49 – 58. Available at: http: / / onlinelibrary.wiley.com / doi / 10.1002 / bbb.1432 / a
bstract.
Lansche J�, and J� Müller (2012)� Life cycle assessment of energy generation of
biogas fed combined heat and power plants: Environmental impact of dif-
ferent agricultural substrates. Engineering in Life Sciences 12, 313 – 320. doi:
10.1002 / elsc.201100061, ISSN: 1618-2863.
Larson A� M� (2011)� Forest tenure reform in the age of climate change: Lessons
for REDD+. Global Environmental Change 21, 540 – 549. doi: 10.1016 / j.gloenv-
cha.2010.11.008, ISSN: 0959-3780.
Larson A� M�, M� Brockhaus, W� D� Sunderlin, A� Duchelle, A� Babon, T� Dok-
ken, T� T� Pham, I� A� P� Resosudarmo, G� Selaya, A� Awono, and T�-B� Huynh
(2013)� Land tenure and REDD+: The good, the bad and the ugly. Global Envi-
ronmental Change 23, 678 – 689. doi: 10.1016 / j.gloenvcha.2013.02.014, ISSN:
0959-3780.
Larson E� D�, Z� Li, and R� H� Williams (2012)� Chapter 12 — Fossil Energy. In:
Global Energy Assessment — Toward a Sustainable Future. Cambridge Uni-
versity Press, Cambridge, UK and New York, NY, USA and the International
Institute for Applied Systems Analysis, Laxenburg, Austria, pp. 901 – 992. ISBN:
052118293X.
Latta G� S�, J� S� Baker, R� H� Beach, S� K� Rose, and B� A� McCarl (2013)� A multi-
sector intertemporal optimization approach to assess the GHG implications of
U. S. forest and agricultural biomass electricity expansion. Journal of Forest Eco-
nomics 19, 361 – 383. doi: 10.1016 / j.jfe.2013.05.003, ISSN: 1104-6899.
Lauder A� R�, I� G� Enting, J� O� Carter, N� Clisby, A� L� Cowie, B� K� Henry, and
M� R� Raupach (2013)� Offsetting methane emissions — An alternative to
emission equivalence metrics. International Journal of Greenhouse Gas Control
12, 419 – 429. doi: 10.1016 / j.ijggc.2012.11.028, ISSN: 17505836.
Lauk C�, H� Haberl, K�-H� Erb, S� Gingrich, and F� Krausmann (2012)� Global
socioeconomic carbon stocks in long-lived products 1900 – 2008. Environmental
Research Letters 7, 34 – 44. doi: 10.1088 / 1748 - 9326 / 7 / 3 / 034023, ISSN: 1748-
9326.
Le Q� B�, R� Seidl, and R� W� Scholz (2012)� Feedback loops and types of adap-
tation in the modelling of land-use decisions in an agent-based simulation.
Environmental Modelling & Software 27 – 28, 83 – 96. doi: 10.1016 / j.env-
soft.2011.09.002, ISSN: 1364-8152.
Lee S�-J�, S�-J� Lee, and D�-W� Lee (2013)� Design and development of synthetic
microbial platform cells for bioenergy. Frontiers in Microbiotechnology, Ecotoxi-
cology and Bioremediation 4, 2 – 94. doi: 10.3389 / fmicb.2013.00092.
Leemans R�, and B� Eickhout (2004)� Another reason for concern: regional and
global impacts on ecosystems for different levels of climate change. Global
Environmental Change Part A 14, 219 – 228.
Lehmann J� (2007)� Bio-energy in the black. Frontiers in Ecology and the Environ-
ment 5, 381 – 387. doi: 10.1890 / 1540 - 9295(2007)5[381:BITB]2.0.CO;2, ISSN:
1540-9295.

906906
Agriculture, Forestry and Other Land Use (AFOLU)
11
Chapter 11
Lehmann J�, J� P� da Silva Jr, C� Steiner, T� Nehls, W� Zech, and B� Glaser (2003)�
Nutrient availability and leaching in an archaeological Anthrosol and a Fer-
ralsol of the Central Amazon basin: fertilizer, manure and charcoal amend-
ments. Plant and Soil 249, 343 – 357. Available at: http: / / link.springer.com / arti-
cle / 10.1023 / A:1022833116184.
Lemke R� L�, A� J� VandenBygaart, C� A� Campbell, G� P� Lafond, and B� Grant
(2010)� Crop residue removal and fertilizer N: Effects on soil organic carbon in
a long-term crop rotation experiment on a Udic Boroll. Agriculture, Ecosystems
& Environment 135, 42 – 51. doi: 10.1016 / j.agee.2009.08.010, ISSN: 01678809.
Levin K�, C� McDermott, and B� Cashore (2008)� The climate regime as global for-
est governance: can reduced emissions from Deforestation and Forest Degrada-
tion (REDD) initiatives pass a “dual effectiveness” test? International Forestry
Review 10, 538 – 549. doi: 10.1505 / ifor.10.3.538, ISSN: 1465-5489.
Lewis S� L�, G� Lopez-Gonzalez, B� Sonke, K� Affum-Baffoe, T� R� Baker, L� O�
Ojo, O� L� Phillips, J� M� Reitsma, L� White, J� A� Comiskey, M� N� Djuikouo,
C� E� N� Ewango, T� R� Feldpausch, A� C� Hamilton, M� Gloor, T� Hart, A� Hla-
dik, J� Lloyd, J� C� Lovett, J� R� Makana, Y� Malhi, F� M� Mbago, H� J� Ndan-
galasi, J� Peacock, K� S� H� Peh, D� Sheil, T� Sunderland, M� D� Swaine, J�
Taplin, D� Taylor, S� C� Thomas, R� Votere, and H� Woll (2009)� Increasing
carbon storage in intact African tropical forests. Nature 457, 1003 – U3. doi:
10.1038 / nature07771, ISSN: 0028-0836.
Li H�, A� F� Cann, and J� C� Liao (2010)� Biofuels: Biomolecular Engineering Funda-
mentals and Advances. Annual Review of Chemical and Biomolecular Engineer-
ing 1, 19 – 36. doi: 10.1146 / annurev-chembioeng-073009 - 100938.
Li X�, E� Mupondwa, S� Panigrahi, L� Tabil, and P� Adapa (2012)� Life cycle
assessment of densified wheat straw pellets in the Canadian Prairies. The Inter-
national Journal of Life Cycle Assessment 17, 420 – 431. doi: 10.1007 / s11367 - 0
11 - 0374 - 7, ISSN: 0948-3349.
Liao J� D�, T� W� Boutton, and J� D� Jastrow (2006)� Storage and dynamics of car-
bon and nitrogen in soil physical fractions following woody plant invasion of
grassland. Soil Biology and Biochemistry 38, 3184 – 3196. doi: 10.1016 / j.soil-
bio.2006.04.003, ISSN: 00380717.
Liao J� C�, and J� Messing (2012)� Energy biotechnology. Current Opinion in Bio-
technology 23, 287 – 289. doi: 10.1016 / j.copbio.2012.03.005, ISSN: 0958-1669.
Lichtfouse E�, M� Navarrete, P� Debaeke, V� Souchère, C� Alberola, and J�
Ménassieu (2009)� Agronomy for sustainable agriculture. A review. Agronomy
for Sustainable Development 29, 1 – 6. doi: 10.1051 / agro:2008054, ISSN: 1774-
0746.
Lim S�, T� Vos, A� D� Flaxman, G� Danaei, K� Shibuja, and etal� (2012)� A Compar-
ative Risk Assessment of Burden of Disease and Injury Attributable to 67 Risk
Factors and Risk Factor Clusters in 21 regions, 1990 – 2010: A Systematic Analy-
sis for the Global Burden of Disease Study 2010. The Lancet 380, 2224 – 2260.
Lindholm E�-L�, J� Stendahl, S� Berg, and P�-A� Hansson (2011)� Green-
house gas balance of harvesting stumps and logging residues for energy
in Sweden. Scandinavian Journal of Forest Research 26, 586 – 594. doi:
10.1080 / 02827581.2011.615337, ISSN: 0282-7581.
Lippke, B� Garcia, J� P�, Manrique, and C� (2003)� The Impact of Forests and Forest
Management on Carbon Storage. Rural Technology Initiative, College of Forest
Resources, University of Washington, Seattle, 7 pp.
Lippke B�, E� Oneil, R� Harrison, K� Skog, L� Gustavsson, and R� Sathre (2011)�
Life cycle impacts of forest management and wood utilization on carbon
mitigation: knowns and unknowns. Carbon Management 2, 303 – 333. doi:
10.4155 / cmt.11.24, ISSN: 1758-3004.
Lisboa C� C�, K� Butterbach-Bahl, M� Mauder, and R� Kiese (2011)� Bioethanol
production from sugarcane and emissions of greenhouse gases — known and
unknowns. GCB Bioenergy 3, 277 – 292. doi: 10.1111 / j.1757 - 1707.2011.0109
5.x, ISSN: 1757-1707.
Liska A� J�, and R� K� Perrin (2009)� Indirect land use emissions in the life cycle
of biofuels: regulations vs science. Biofuels, Bioproducts and Biorefining 3,
318 – 328. doi: 10.1002 / bbb.153, ISSN: 1932-1031.
Liu G�, E� D� Larson, R� H� Williams, T� G� Kreutz, and X� Guo (2010)� Making
Fischer− Tropsch fuels and electricity from coal and biomass: performance and
cost analysis. Energy & Fuels 25, 415 – 437.
Liu X�, J� Qu, L� Li, A� Zhang, Z� Jufeng, J� Zheng, and G� Pan (2012)� Can bio-
char amendment be an ecological engineering technology to depress N
2
O emis-
sion in rice paddies? — A cross site field experiment from South China. Eco-
logical Engineering 42, 168 – 173. doi: 10.1016 / j.ecoleng.2012.01.016, ISSN:
09258574.
Loarie S� R�, D� B� Lobell, G� P� Asner, Q� Mu, and C� B� Field (2011)� Direct impacts
on local climate of sugar-cane expansion in Brazil. Nature Climate Change 1,
105 – 109. doi: 10.1038 / nclimate1067, ISSN: 1758-678X.
Lobell D� B�, U� L� C� Baldos, and T� W� Hertel (2013)� Climate adaptation as mitiga-
tion: the case of agricultural investments. Environmental Research Letters 8,
15 – 28. doi: 10.1088 / 1748 - 9326 / 8 / 1 / 015012, ISSN: 1748-9326.
Lohila A�, M� Aurela, J�-P� Tuovinen, and T� Laurila (2004)� Annual CO
2
exchange
of a peat field growing spring barley or perennial forage grass. Journal of Geo-
physical Research: Atmospheres 109, n / a – n / a. doi: 10.1029 / 2004JD004715,
ISSN: 2156-2202.
Lohila A�, K� Minkkinen, J� Laine, I� Savolainen, J�-P� Tuovinen, L� Korhonen,
T� Laurila, H� Tietäväinen, and A� Laaksonen (2010)� Forestation of boreal
peatlands: Impacts of changing albedo and greenhouse gas fluxes on radiative
forcing. Journal of Geophysical Research 115. doi: 10.1029 / 2010JG001327,
ISSN: 0148-0227.
Lott J� E�, C� K� Ong, and C� R� Black (2009)� Understorey microclimate and crop
performance in a< i> Grevillea robusta< / i>-based agroforestry system in semi-
arid Kenya. Agricultural and Forest Meteorology 149, 1140 – 1151. Available at:
http: / / www. sciencedirect. com / science / article / pii / S0168192309000434.
Lotze-Campen H�, M� von Lampe, P� Kyle, S� Fujimori, P� Havlik, H� van Meijl,
T� Hasegawa, A� Popp, C� Schmitz, A� Tabeau, H� Valin, D� Willenbockel,
and M� Wise (2013)� Impacts of increased bioenergy demand on global food
markets: an AgMIP economic model intercomparison. Agricultural Economics,
n / a – n / a. doi: 10.1111 / agec.12092, ISSN: 1574-0862.
Lotze-Campen H�, A� Popp, T� Beringer, C� Müller, A� Bondeau, S� Rost, and
W� Lucht (2010)� Scenarios of global bioenergy production: The trade-offs
between agricultural expansion, intensification and trade. Ecological Modelling
221, 2188 – 2196.
Loudermilk E� L�, R� M� Scheller, P� J� Weisberg, J� Yang, T� E� Dilts, S� L� Karam,
and C� Skinner (2013)� Carbon dynamics in the future forest: the importance
of long-term successional legacy and climate – fire interactions. Global Change
Biology 19, 3502 – 3515. doi: 10.1111 / gcb.12310, ISSN: 1365-2486.
Lubowski R� N�, and S� K� Rose (2013)� The Potential for REDD+: Key Economic
Modeling Insights and Issues. Review of Environmental Economics and Policy 7,
67 – 90. doi: 10.1093 / reep / res024, ISSN: 1750-6816, 1750 – 6824.
Luedeling E�, and H� Neufeldt (2012)� Carbon sequestration potential of parkland
agroforestry in the Sahel. Climatic Change 115, 443 – 461. doi: 10.1007 / s10584
- 012 - 0438 - 0, ISSN: 0165-0009, 1573 – 1480.

907907
Agriculture, Forestry and Other Land Use (AFOLU)
11
Chapter 11
Lund V�, and B� Algers (2003)� Research on animal health and welfare in organic
farming — a literature review. Livestock Production Science 80, 55 – 68. doi: 10.
1016 / S0301 - 6226(02)00321 - 4, ISSN: 0301-6226.
Lunt I� D�, L� M� Winsemius, S� P� McDonald, J� W� Morgan, and R� L� Dehaan
(2010)� How widespread is woody plant encroachment in temperate Australia?
Changes in woody vegetation cover in lowland woodland and coastal ecosys-
tems in Victoria from 1989 to 2005. Journal of Biogeography 37, 722 – 732. doi:
10.1111 / j.1365 - 2699.2009.02255.x, ISSN: 1365-2699.
Luo Y�, M� Durenkamp, M� De Nobili, Q� Lin, and P� C� Brookes (2011)� Short
term soil priming effects and the mineralisation of biochar following its incor-
poration to soils of different pH. Soil Biology and Biochemistry 43, 2304 – 2314.
doi: 10.1016 / j.soilbio.2011.07.020, ISSN: 0038-0717.
Luo L�, E� Voet, G� Huppes, and H� Udo de Haes (2009)� Allocation issues in LCA
methodology: a case study of corn stover-based fuel ethanol. The International
Journal of Life Cycle Assessment 14, 529 – 539. doi: 10.1007 / s11367 - 009 - 0112
- 6, ISSN: 0948-3349.
Luyssaert S�, E�-D� Schulze, A� Börner, A� Knohl, D� Hessenmöller, B� E� Law, P�
Ciais, and J� Grace (2008)� Old-growth forests as global carbon sinks. Nature
455, 213 – 215. doi: 10.1038 / nature07276, ISSN: 0028-0836.
Lynd L� R�, R� A� Aziz, C� H� de Brito Cruz, A� F� A� Chimphango, L� A� B� Cortez, A�
Faaij, N� Greene, M� Keller, P� Osseweijer, and T� L� Richard (2011)� A global
conversation about energy from biomass: the continental conventions of the
global sustainable bioenergy project. Interface Focus 1, 271 – 279.
Ma J�, E� Ma, H� Xu, K� Yagi, and Z� Cai (2009)� Wheat straw management affects
CH
4
and N
2
O emissions from rice fields. Soil Biology and Biochemistry 41,
1022 – 1028. doi: 10.1016 / j.soilbio.2009.01.024, ISSN: 00380717.
Macauley M� K�, and R� A� Sedjo (2011)� Forests in climate policy: technical, insti-
tutional and economic issues in measurement and monitoring. Mitigation and
Adaptation Strategies for Global Change 16, 499 – 513. doi: 10.1007 / s11027 - 0
10 - 9276 - 4, ISSN: 1381-2386, 1573 – 1596.
Macedo I� C� (2005)� Sugar Cane’s Energy: Twelve Studies on Brazilian Sugar Cane
Agribusiness and Its Sustainability. UNICA, Sao Paulo, Brazil, 237 pp.
Macedo M� N�, R� S� DeFries, D� C� Morton, C� M� Stickler, G� L� Galford, and Y� E�
Shimabukuro (2012)� Decoupling of deforestation and soy production in the
southern Amazon during the late 2000s. Proceedings of the National Academy
of Sciences 109, 1341 – 1346. doi: 10.1073 / pnas.1111374109, ISSN: 0027-
8424, 1091 – 6490.
Macedo I� C�, J� E� A� Seabra, and J� E� A� R� Silva (2008)� Green house gases
emissions in the production and use of ethanol from sugarcane in Brazil: The
2005 / 2006 averages and a prediction for 2020. Biomass and Bioenergy 32,
582 – 595. doi: 10.1016 / j.biombioe.2007.12.006, ISSN: 0961-9534.
Machmuller A�, C� R� Soliva, and M� Kreuzer (2003)� Methane-suppressing effect
of myristic acid in sheep as affected by dietary calcium and forage proportion.
British Journal of Nutrition 90, 529 – 540.
Mackey B�, I� C� Prentice, W� Steffen, J� I� House, D� Lindenmayer, H� Keith,
and S� Berry (2013)� Untangling the confusion around land carbon science
and climate change mitigation policy. Nature Climate Change 3, 552 – 557. doi:
10.1038 / nclimate1804, ISSN: 1758-678X.
MacMillan Uribe A� L�, D� M� Winham, and C� M� Wharton (2012)� Commu-
nity supported agriculture membership in Arizona. An exploratory study of
food and sustainability behaviours. Appetite 59, 431 – 436. doi: 10.1016 / j.
appet.2012.06.002, ISSN: 0195-6663.
Madlener R�, C� Robledo, B� Muys, and J� T� B� Freja (2006)� A Sustainability
Framework for Enhancing the Long-Term Success of Lulucf Projects. Climatic
Change 75, 241 – 271. doi: 10.1007 / s10584 - 005 - 9023 - 0, ISSN: 0165-0009,
1573 – 1480.
Mahmood R�, R� A� Pielke, K� G� Hubbard, D� Niyogi, P� A� Dirmeyer, C� McAl-
pine, A� M� Carleton, R� Hale, S� Gameda, A� Beltrán-Przekurat, B� Baker,
R� McNider, D� R� Legates, M� Shepherd, J� Du, P� D� Blanken, O� W� Frauen-
feld, U� s� Nair, and S� Fall (2013)� Land cover changes and their biogeo-
physical effects on climate. International Journal of Climatology, n / a – n / a. doi:
10.1002 / joc.3736, ISSN: 1097-0088.
Mallia E�, and G� Lewis (2013)� Life cycle greenhouse gas emissions of electric-
ity generation in the province of Ontario, Canada. The International Journal of
Life Cycle Assessment 18, 377 – 391. doi: 10.1007 / s11367 - 012 - 0501 - 0, ISSN:
0948-3349.
Malmsheimer R� W�, P� Heffernan, S� Brink, D� Crandall, F� Deneke, C� Galik,
E� Gee, J� A� Helms, N� McClure, and M� Mortimer (2008)� Forest man-
agement solutions for mitigating climate change in the United States. Jour-
nal of Forestry 106, 173 – 239. Available at: http: / / 152.99.88.238 / KFRI-
CAB / IMG / 006 / 002 / 157431.pdf#page=173.
Von Maltitz G� P�, and K� A� Setzkorn (2013)� A typology of Southern African
biofuel feedstock production projects. Biomass and Bioenergy 59, 33 – 59. doi:
10.1016 / j.biombioe.2012.11.024, ISSN: 0961-9534.
Mao H� L�, J� K� Wang, Y� Y� Zhou, and J� X� Liu (2010)� Effects of addition of tea
saponins and soybean oil on methane production, fermentation and microbial
population in the rumen of growing lambs. Livestock Science 129, 56 – 62.
Markus L� (2011)� From CDM to REDD+ — What do we know for setting up effec-
tive and legitimate carbon governance? Ecological Economics 70, 1900 – 1907.
doi: 10.1016 / j.ecolecon.2011.02.003, ISSN: 0921-8009.
Marland G�, R� A� Pielke Sr�, M� Apps, R� Avissar, R� A� Betts, K� J� Davis, P� C�
Frumhoff, S� T� Jackson, L� A� Joyce, P� Kauppi, J� Katzenberger, K� G�
MacDicken, R� P� Neilson, J� O� Niles, D� dutta S� Niyogi, R� J� Norby, N�
Pena, N� Sampson, and Y� Xue (2003)� The climatic impacts of land surface
change and carbon management, and the implications for climate-change miti-
gation policy. Climate Policy 3, 149 – 157. doi: 10.1016 / S1469 - 3062(03)00028
- 7, ISSN: 1469-3062.
Marland G�, and B� Schlamadinger (1995)� Biomass fuels and forest-manage-
ment strategies: how do we calculate the greenhouse-gas emissions benefits?
Energy 20, 1131 – 1140.
Marland G�, and B� Schlamadinger (1997)� Forests for carbon sequestration
or fossil fuel substitution? A sensitivity analysis. Biomass and Bioenergy 13,
389 – 397. doi: 10.1016 / S0961 - 9534(97)00027 - 5, ISSN: 0961-9534.
Marlow H� J�, W� K� Hayes, S� Soret, R� L� Carter, E� R� Schwab, and J� Sabaté
(2009)� Diet and the environment: does what you eat matter? The American
Journal of Clinical Nutrition 89, 1699S – 1703S. doi: 10.3945 / ajcn.2009.26736Z,
ISSN: 0002-9165, 1938 – 3207.
Martin C�, D� P� Morgavi, and M� Doreau (2010)� Methane mitigation in
ruminants: from microbe to the farm scale. Animal 4, 351 – 365. doi:
10.1017 / S1751731109990620.
Martin C�, J� Rouel, J� P� Jouany, M� Doreau, and Y� Chilliard (2008)� Methane
output and diet digestibility in response to feeding dairy cows crude linseed,
extruded linseed, or linseed oil. Journal of Animal Science 86, 2642 – 2650. doi:
10.2527 / jas.2007 - 0774, ISSN: 0021-8812, 1525 – 3163.

908908
Agriculture, Forestry and Other Land Use (AFOLU)
11
Chapter 11
Martinelli L� A�, and S� Filoso (2008)� Expansion of sugarcane ethanol produc-
tion in Brazil: environmental and social challenges. Ecological Applications: A
Publication of the Ecological Society of America 18, 885 – 898. ISSN: 1051-0761.
Martínez S� H�, J� van Eijck, M� P� da Cunha, A� Walter, J� J� Guilhoto, and A� Faaij
(2013)� Analysis of socio-economic impacts of sustainable sugarcane-ethanol
production by means of inter-regional input-output analysis: A case study on
Northeast Brazil. Renewable & Sustainable Energy Reviews 28, 290 – 316.
Martinez-Alier J� (2002)� The Environmentalism of the Poor: A Study of Ecologi-
cal Conflicts and Valuation. Edward Elgar Publishing, Cheltenham, UK and
Northampton, USA, 325 pp. ISBN: 9781840649093.
Masera O� R�, J� F� Garza-Caligaris, M� Kanninen, T� Karjalainen, J� Liski, G� J�
Nabuurs, A� Pussinen, B� H� J� de Jong, and G� M� J� Mohren (2003)� Model-
ing carbon sequestration in afforestation, agroforestry and forest management
projects: the CO
2
FIX V.2 approach. Ecological Modelling 164, 177 – 199. doi: 10.
1016 / S0304 - 3800(02)00419 - 2, ISSN: 03043800.
Matson P� A�, and P� M� Vitousek (2006)� Agricultural Intensification: Will Land
Spared from Farming be Land Spared for Nature? Conservation Biology 20,
709 – 710. doi: 10.1111 / j.1523 - 1739.2006.00442.x, ISSN: 1523-1739.
Mattoo A�, and A� Subramanian (2012)� Equity in Climate Change: An Ana-
lytical Review. World Development 40, 1083 – 1097. doi: 10.1016 / j.world-
dev.2011.11.007, ISSN: 0305-750X.
Matyssek R�, G� Wieser, R� Ceulemans, H� Rennenberg, H� Pretzsch, K� Haberer,
M� Löw, A� J� Nunn, H� Werner, P� Wipfler, W� Osswald, P� Nikolova, D� E�
Hanke, H� Kraigher, M� Tausz, G� Bahnweg, M� Kitao, J� Dieler, H� Sand-
ermann, K� Herbinger, T� Grebenc, M� Blumenröther, G� Deckmyn, T� E� E�
Grams, C� Heerdt, M� Leuchner, P� Fabian, and K�-H� Häberle (2010)�
Enhanced ozone strongly reduces carbon sink strength of adult beech (Fagus
sylvatica)--resume from the free-air fumigation study at Kranzberg Forest. Envi-
ronmental Pollution (Barking, Essex: 1987) 158, 2527 – 2532. doi: 10.1016 / j.
envpol.2010.05.009, ISSN: 1873-6424.
May, P�, Boyd, E�, Chang, M�, V� Neto, and F� C� (2005)� Incorporating sustainable
development into carbon forest projects in Brazil and Bolivia. Estudos Socie-
dade E Agricultura 1, 23 p.
May P� H�, F� Veiga, and M� Chang (2004)� Local Sustainable Development Effects
of Forest Carbon Projects in Brazil and Bolivia: A View from the Field. Environ-
mental Economics Programme, London, 132 pp. ISBN: Earthprint Limited.
Mayrand K�, and M� Paquin (2004)� Payments for Environmental Services: A Sur-
vey and Assessment of Current Schemes. UNISFERA International Centre for the
Commission of Environmental Cooperation of North America, Montreal, Mon-
treal, 60 pp.
Mbow C� (2010)� Africa’s risky gamble. Global Change, IGBP Secretariat, number
75 of June 2010 75, pp.20 – 23.
Mbow, C�, Skole, D�, Dieng, M�, Justice, C�, Kwesha, D�, Mane, L�, E� Gamri, M�,
V� Vordzogbe, V�, Virji, and H� (2012)� Challenges and Prospects for REDD+ in
Africa: Desk Review Of REDD+ Implementation in Africa. GLP-IPO, Copenhagen,
70 pp.
McCarl B� A�, and U� A� Schneider (2001)� Greenhouse Gas Mitigation in U. S. Agri-
culture and Forestry. Science 294, 2481 – 2482. doi: 10.1126 / science.1064193,
ISSN: 0036-8075, 1095 – 9203.
McKechnie J�, S� Colombo, J� Chen, W� Mabee, and H� L� MacLean (2011)�
Forest Bioenergy or Forest Carbon? Assessing Trade-Offs in Greenhouse Gas
Mitigation with Wood-Based Fuels. Environmental Science & Technology 45,
789 – 795. doi: 10.1021 / es1024004, ISSN: 0013-936X.
McLaren D� (2012)� A comparative global assessment of potential negative emis-
sions technologies. Special Issue: Negative Emissions Technology 90, 489 – 500.
doi: 10.1016 / j.psep.2012.10.005, ISSN: 0957-5820.
McMichael A� J�, J� W� Powles, C� D� Butler, and R� Uauy (2007)� Food, livestock
production, energy, climate change, and health. The Lancet 370, 1253 – 1263.
doi: 10.1016 / S0140 - 6736(07)61256 - 2, ISSN: 01406736.
McSherry M� E�, and M� E� Ritchie (2013)� Effects of grazing on grassland
soil carbon: a global review. Global Change Biology 19, 1347 – 1357. doi:
10.1111 / gcb.12144, ISSN: 13541013.
MEA (2005)� Millennium Ecosystem Assessment. United National Environment Pro-
gram, New York, Nairobi, 155 pp.
Meerman J� C�, M� M� J� Knoope, A� Ramírez, W� C� Turkenburg, and A� P� C� Faaij
(2013)� Technical and economic prospects of coal- and biomass-fired inte-
grated gasification facilities equipped with CCS over time. International Jour-
nal of Greenhouse Gas Control 16, 311 – 323. doi: 10.1016 / j.ijggc.2013.01.051,
ISSN: 1750-5836.
Meerman J� C�, A� Ramirez, W� C� Turkenburg, and A� P� C� Faaij (2011)� Perfor-
mance of simulated flexible integrated gasification polygeneration facilities.
Part A: A technical-energetic assessment. Renewable and Sustainable Energy
Reviews 15, 2563 – 2587.
Meerman J� C�, A� Ramírez, W� C� Turkenburg, and A� P� C� Faaij (2012)� Perfor-
mance of simulated flexible integrated gasification polygeneration facilities,
Part B: Economic evaluation. Renewable and Sustainable Energy Reviews 16,
6083 – 6102.
De Meester S�, J� Demeyer, F� Velghe, A� Peene, H� Van Langenhove, and J�
Dewulf (2012)� The environmental sustainability of anaerobic digestion as a
biomass valorization technology. Bioresource Technology 121, 396 – 403. doi:
10.1016 / j.biortech.2012.06.109, ISSN: 0960-8524.
Meier D�, B� van de Beld, A� V� Bridgwater, D� C� Elliott, A� Oasmaa, and F� Preto
(2013)� State-of-the-art of fast pyrolysis in IEA bioenergy member countries.
Renewable and Sustainable Energy Reviews 20, 619 – 641. doi: 10.1016 / j.
rser.2012.11.061, ISSN: 1364-0321.
Melillo J� M�, J� M� Reilly, D� W� Kicklighter, A� C� Gurgel, T� W� Cronin, S� Palt-
sev, B� S� Felzer, X� Wang, A� P� Sokolov, and C� A� Schlosser (2009)� Indi-
rect Emissions from Biofuels: How Important? Science 326, 1397 – 1399. doi:
10.1126 / science.1180251, ISSN: 0036-8075, 1095 – 9203.
Messerli P�, A� Heinimann, M� Giger, T� Breu, and O� Schönweger (2013)� From
“land grabbing” to sustainable investments in land: potential contributions
by land change science. Current Opinion in Environmental Sustainability 5,
528 – 534. doi: 10.1016 / j.cosust.2013.03.004, ISSN: 1877-3435.
Metay A�, R� Oliver, E� Scopel, J�-M� Douzet, J� Aloisio Alves Moreira, F� Maraux,
B� J� Feigl, and C� Feller (2007)� N
2
O and CHsub>4< / sub> emissions from
soils under conventional and no-till management practices in Goiânia (Cer-
rados, Brazil). Geoderma 141, 78 – 88. doi: 10.1016 / j.geoderma.2007.05.010,
ISSN: 00167061.
Milazzo M� F�, F� Spina, A� Vinci, C� Espro, and J� C� J� Bart (2013)� Brassica bio-
diesels: Past, present and future. Renewable and Sustainable Energy Reviews
18, 350 – 389. doi: 10.1016 / j.rser.2012.09.033, ISSN: 1364-0321.
Millar N�, G� P� Robertson, P� R� Grace, R� J� Gehl, and J� P� Hoben (2010)� Nitro-
gen fertilizer management for nitrous oxide (N 2 O) mitigation in intensive corn
(Maize) production: an emissions reduction protocol for US Midwest agricul-
ture. Mitigation and Adaptation Strategies for Global Change 15, 185 – 204. doi:
10.1007 / s11027 - 010 - 9212 - 7.

909909
Agriculture, Forestry and Other Land Use (AFOLU)
11
Chapter 11
Millar C� I�, N� L� Stephenson, and S� L� Stephens (2007)� Climate change and
forests of the future: managing in the face of uncertainty. Ecological Applica-
tions 17, 2145 – 2151.
Mingorría S�, G� Gamboa, and A� Alonso-Fradejas (2010)� Metabolismo Socio-
Ecológico de Comunidades Campesinas Q’eqchi’ Y La Expansión de La Agro-
Industria de Caña de Azúcar Y Palma Africana : Valle Del Río Polochic, Guate-
mala. Instituto de Ciencia y Technología Ambientales and Instituto de Estudios
Agrarios y Rurales, Barcelona and Mexico, 166 pp. ISBN: 9789929561175.
Van Minnen J� G�, K� K� Goldewijk, E� Stehfest, B� Eickhout, G� van Drecht, and
R� Leemans (2009)� The importance of three centuries of land-use change for
the global and regional terrestrial carbon cycle. Climatic Change 97, 123 – 144.
doi: 10.1007 / s10584 - 009 - 9596 - 0, ISSN: 0165-0009.
Mirle C� (2012)� The industrialization of animal agriculture: implications for small
farmers, rural communities, the environment, and animals in the developing
world. The 10th European International Farming Systems Association Sympo-
sium in Aarhus, Denmark, July 1 – 4. Workshop 1.3: Understanding agricultural
structural changes and their impacts, to support inclusive policy dialogue and
formulation. Available at: http: / / www. ifsa2012. dk / downloads / WS1_3 / Cheta-
naMirle.pdf.
Misselhorn A�, P� Aggarwal, P� Ericksen, P� Gregory, L� Horn-Phathano-
thai, J� Ingram, and K� Wiebe (2012)� A vision for attaining food security.
Current Opinion in Environmental Sustainability 4, 7 – 17. doi: 10.1016 / j.
cosust.2012.01.008, ISSN: 1877-3435.
Mitchell C� D�, R� J� Harper, and R� J� Keenan (2012)� Current status and prospects
of carbon forestry in Australia. Australian Forestry 75, 200 – 212. ISSN: 0004-
9158.
Moberg J� (2011)� The Chinese Grain for Green Program — assessment of the land
reform’s carbon mitigation potential. Department of Energy and Environment,
Chalmers University of Technology, Göteborg, Sweden, 54 pp.
Mohlin K� (2013)� Essays on Environmental Taxation and Climate Policy. Göteborgs
Universitet. Handelshögskolan, Department of Economics, Sweden, 155 pp.
Available at: https: / / gupea.ub.gu.se / handle / 2077 / 33425.
Moilanen A�, and A� Arponen (2011)� Administrative regions in conservation: Bal-
ancing local priorities with regional to global preferences in spatial planning.
Ecoregional-Scale Monitoring within Conservation Areas, in a Rapidly Chang-
ing Climate 144, 1719 – 1725. doi: 10.1016 / j.biocon.2011.03.007, ISSN: 0006-
3207.
Monti A�, L� Barbanti, A� Zatta, and W� Zegada-Lizarazu (2012)� The contribu-
tion of switchgrass in reducing GHG emissions. Global Change Biology Bioen-
ergy 4. doi: 10.1117j.1757 - 1707.2011.01142.x.
De Moraes M� A� F� D�, C� C� da Costa, J� J� M� Guilhoto, L� G� A� de Souza, and
F� C� R� de Oliveira (2010)� Social Externalities of Fuels. In: Ethanol and Bio-
electricity: Sugarcane in the Future of the Energy Matrix. UNICA Brazilian Sug-
arcane Industry Association, Sao Paulo, Brazil, pp. 44 – 75.
Morgavi D� P�, E� Forano, C� Martin, and C� J� Newbold (2010)� Microbial
ecosystem and methanogenesis in ruminants. Animal 4, 1024 – 1036. doi:
10.1017 / S1751731110000546.
Morgavi D� P�, J� P� Jouany, and C� Martin (2008)� Changes in methane emis-
sion and rumen fermentation parameters induced by refaunation in sheep.
Australian Journal of Experimental Agriculture 48, 69 – 72. doi: http: / / dx.doi.
org / 10.1071 / EA07236.
Mueller N� D�, J� S� Gerber,, M� Johnston, D� K� Ray, N� Ramankutty, and J� A�
Foley (2012)� Closing yield gaps through nutrient and water management.
Nature 490, 254 – 257. Available at: http: / / dx.doi.org / 10.1038 / nature11420.
Muller A� (2009)� Sustainable agriculture and the production of biomass for energy
use. Climatic Change 94, 319 – 331. doi: 10.1007 / s10584 - 008 - 9501 - 2, ISSN:
0165-0009, 1573 – 1480.
Murdiyarso D�, M� Brockhaus, W� D� Sunderlin, and L� Verchot (2012)� Some
lessons learned from the first generation of REDD+ activities. Current Opinion
in Environmental Sustainability 4, 678 – 685. doi: 10.1016 / j.cosust.2012.10.014,
ISSN: 1877-3435.
Murray B� C�, B� A� McCarl, and H�-C� Lee (2004)� Estimating Leakage from For-
est Carbon Sequestration Programs. Land Economics 80, 109 – 124. doi:
10.3368 / le.80.1.109, ISSN: 0023-7639, 1543 – 8325.
Murtaugh P� A�, and M� G� Schlax (2009)� Reproduction and the carbon legacies of
individuals. Global Environmental Change 19, 14 – 20.
Murthy I� K�, R� Tiwari, and N� H� Ravindranath (2011)� Climate change and forests
in India: adaptation opportunities and challenges. Mitigation and Adaptation
Strategies for Global Change 16, 161 – 175. doi: 10.1007 / s11027 - 010 - 9261-y,
ISSN: 1381-2386, 1573 – 1596.
Muys B�, L� Norgrove, T� Alamirew, R� Birech, E� Chirinian, Y� Delelegn, A�
Ehrensperger, C� A� Ellison, A� Feto, B� Freyer, J� Gevaert, S� Gmünder,
R� E� E� Jongschaap, M� Kaufmann, J� Keane, M� Kenis, B� Kiteme, J� Langat,
R� Lyimo, V� Moraa, J� Muchugu, A� Negussie, C� Ouko, M� W� Rouamba, I�
Soto, M� Wörgetter, R� Zah, and R� Zetina (2014)� Integrating mitigation
and adaptation into development: the case of Jatropha curcas in sub-Saharan
Africa. Global Change Biology Bioenergy 6, 169 – 171. doi: 10.1111 / gcbb.12070,
ISSN: 1757-1707.
Mwakaje A� G� (2012)� Can Tanzania realise rural development through biofuel
plantations? Insights from the study in Rufiji District. Energy for Sustainable
Development 16, 320 – 327. doi: 10.1016 / j.esd.2012.07.001, ISSN: 0973-0826.
Myhre G�, and D� Shindell (2013)� Anthopogenic and Natural Radiative Forcing.
Intergovernmental Panel on Climate Change, Cambridge UK, 124 pp.
Nabuurs G�-J�, M� Lindner, P� J� Verkerk, K� Gunia, P� Deda, R� Michalak, and G�
Grassi (2013)� First signs of carbon sink saturation in European forest biomass.
Nature Climate Change 3, 792 – 796.
Nabuurs G� J�, O� Masera, K� Andrasko, P� Benitez-Ponce, R� Boer, M� Dutschke,
E� Elsiddig, J� Ford-Robertson, P� Frumhoff, T� Karjalainen, O� Krankina,
W� A� Kurz, M� Matsumoto, W� Oyhantcabal, N� H� Ravindranath, M� J� S�
Sanchez, and X� Zhang (2007)� Forestry. In: Climate Change 2007: Contribu-
tion of Working Group III to the Fourth Assessment Report of the Intergoven-
mental Panel on Climate Change. B. Metz, O. R. Davidson, P. R. Bosch, R. Dave,
L. A. Meyer, (eds.), Cambridge University Press, Cambridge, UK and New York,
USA, pp. 541 – 584.
Nassar A� M�, L� Harfuch, L� C� Bachion, and M� R� Moreira (2011)� Biofuels and
land-use changes: searching for the top model. Interface Focus, rsfs20100043.
doi: 10.1098 / rsfs.2010.0043, ISSN: 2042-8898, 2042 – 8901.
Nelissen V�, T� Rütting, D� Huygens, J� Staelens, G� Ruysschaert, and P� Boeckx
(2012)� Maize biochars accelerate short-term soil nitrogen dynamics in a
loamy sand soil. Soil Biology and Biochemistry 55, 20 – 27. doi: 10.1016 / j.soil-
bio.2012.05.019, ISSN: 00380717.

910910
Agriculture, Forestry and Other Land Use (AFOLU)
11
Chapter 11
Nemecek T�, K� Weiler, K� Plassmann, J� Schnetzer, G� Gaillard, D� Jefferies,
T� García – Suárez, H� King, and L� Milà i Canals (2012)� Estimation of the
variability in global warming potential of worldwide crop production using a
modular extrapolation approach. Journal of Cleaner Production 31, 106 – 117.
doi: 10.1016 / j.jclepro.2012.03.005, ISSN: 0959-6526.
Nepstad D� C�, I� M� Tohver, D� Ray, P� Moutinho, and G� Cardinot (2007)� Mor-
tality of large trees and lianas following experimental drought in an Ama-
zon forest. Ecology 88, 2259 – 2269. Available at: http: / / www. esajournals.
org / doi / abs / 10.1890 / 06 - 1046.1.
Newbold C� J�, J� O� Ouda, S� López, N� Nelson, H� Omed, R� J� Wallace, and A� R�
Moss (2002)� Propionate precursors as possible alternative electron acceptors
to methane in ruminal fermentation. In: Greenhouse Gases and Animal Agricul-
ture. J. Takahashi, B. A. Young, (eds.), Elsevier, Amsterdam, pp. 151 – 154.
Nguyen T� L� T�, J� E� Hermansen, and L� Mogensen (2013)� Environmental per-
formance of crop residues as an energy source for electricity production: The
case of wheat straw in Denmark. Applied Energy 104, 633 – 641. doi: 10.1016 / j.
apenergy.2012.11.057, ISSN: 0306-2619.
Nijsen M�, E� Smeets, E� Stehfest, and D� P� Vuuren (2012)� An evaluation of the
global potential of bioenergy production on degraded lands. GCB Bioenergy 4,
130 – 147. doi: 10.1111 / j.1757 - 1707.2011.01121.x, ISSN: 1757-1707.
Njakou Djomo S�, O� El Kasmioui, T� De Groote, L� S� Broeckx, M� S� Verlinden,
G� Berhongaray, R� Fichot, D� Zona, S� Y� Dillen, J� S� King, I� A� Janssens,
and R� Ceulemans (2013)� Energy and climate benefits of bioelectricity from
low-input short rotation woody crops on agricultural land over a two-year
rotation. Applied Energy 111, 862 – 870. doi: 10.1016 / j.apenergy.2013.05.017,
ISSN: 0306-2619.
Nolan J� V�, R� S� Hegarty, J� Hegarty, I� R� Godwin, and R� Woodgate (2010)�
Effects of dietary nitrate on fermentation, methane production and digesta
kinetics in sheep. Animal Production Science 50, 801 – 806.
Nolte C�, A� Agrawal, K� M� Silvius, and B� S� Soares-Filho (2013)� Governance
regime and location influence avoided deforestation success of protected areas
in the Brazilian Amazon. Proceedings of the National Academy of Sciences 110,
4956 – 4961. doi: 10.1073 / pnas.1214786110, ISSN: 0027-8424, 1091 – 6490.
Nonhebel S� (2005)� Renewable energy and food supply: will there be enough
land? Renewable and Sustainable Energy Reviews 9, 191 – 201.
O’Brien K�, R� Leichenko, U� Kelkar, H� Venema, G� Aandahl, H� Tompkins,
A� Javed, S� Bhadwal, S� Barg, L� Nygaard, and others (2004)� Mapping
vulnerability to multiple stressors: climate change and globalization in India.
Global Environmental Change Part A 14, 303 – 313.
O’Halloran T� L�, B� E� Law, M� L� Goulden, Z� Wang, J� G� Barr, C� Schaaf, M�
Brown, J� D� Fuentes, M� Göckede, A� Black, and V� Engel (2012)� Radia-
tive forcing of natural forest disturbances. Global Change Biology 18, 555 – 565.
O’Hare M�, R� J� Plevin, J� I� Martin, A� D� Jones, A� Kendall, and E� Hopson
(2009)� Proper accounting for time increases crop-based biofuels’ greenhouse
gas deficit versus petroleum. Environmental Research Letters 4, 24 – 32. doi: 10.
1088 / 1748 - 9326 / 4 / 2 / 024001, ISSN: 1748-9326.
O’Shaughnessy S� M�, M� J� Deasy, C� E� Kinsella, J� V� Doyle, and A� J� Robinson
(2013)� Small scale electricity generation from a portable biomass cookstove:
Prototype design and preliminary results. Applied Energy 102, 374 – 385. doi:
10.1016 / j.apenergy.2012.07.032, ISSN: 0306-2619.
Oberling D� F�, M� Obermaier, A� Szklo, and E� L� La Rovere (2012)� Investments
of oil majors in liquid biofuels: The role of diversification, integration and tech-
nological lock-ins. Biomass and Bioenergy 46, 270 – 281. doi: 10.1016 / j.biom-
bioe.2012.08.017, ISSN: 0961-9534.
Odongo N� E�, R� Bagg, G� Vessie, P� Dick, M� M� Or-Rashid, S� E� Hook, J� T� Gray,
E� Kebreab, J� France, and B� W� McBride (2007)� Long-term effects of feed-
ing monensin on methane production in lactating dairy cows. Journal of Dairy
Science 90, 1781 – 1788. ISSN: 0022-0302.
Oke D� O�, and K� A� Odebiyi (2007)� Traditional cocoa-based agroforestry and
forest species conservation in Ondo State, Nigeria. Agriculture, Ecosystems &
Environment 122, 305 – 311. Available at: http: / / www. sciencedirect. com / sci-
ence / article / pii / S0167880907000540.
Olson D� G�, J� E� McBride, A� Joe Shaw, and L� R� Lynd (2012)� Recent progress
in consolidated bioprocessing. Current Opinion in Biotechnology 23, 396 – 405.
doi: 10.1016 / j.copbio.2011.11.026, ISSN: 0958-1669.
Oosterveer P�, and A� P� Mol (2010)� Biofuels, trade and sustainability: a review of
perspectives for developing countries. Biofuels, Bioproducts and Biorefining 4,
66 – 76. Available at: http: / / onlinelibrary.wiley.com / doi / 10.1002 / bbb.194 / full.
Osmond D� L�, N� M� Nadkarni, C� T� Driscoll, E� Andrews, A� J� Gold, S� R� B� Allred,
A� R� Berkowitz, M� W� Klemens, T� L� Loecke, M� A� McGarry, K� Schwarz,
M� L� Washington, and P� M� Groffman (2010)� The role of interface organiza-
tions in science communication and understanding. Frontiers in Ecology and
the Environment 8, 306 – 313. doi: 10.1890 / 090145, ISSN: 1540-9295.
Pa A�, J� Craven, X� Bi, S� Melin, and S� Sokhansanj (2012)� Environmental foot-
prints of British Columbia wood pellets from a simplified life cycle analysis. The
International Journal of Life Cycle Assessment 17, 220 – 231. doi: 10.1007 / s113
67 - 011 - 0358 - 7, ISSN: 0948-3349.
Pacca S�, and J� R� Moreira (2011)� A Biorefinery for Mobility? Environmental Sci-
ence & Technology 45, 9498 – 9505. doi: 10.1021 / es2004667, ISSN: 0013-936X.
Palm, C�, Tomich, T�, V� Noordwijk, M�, Vosti, S�, Gockowski, J�, Alegre, J�, Ver-
chot, and L� (2004)� Mitigation GHG emissions in the humid tropics: case
studies from the alternative to slash-and-burn program (ASB). Environment,
Development and Sustainability 6, 145 – 162. Available at: http: / / link.springer.
com / article / 10.1023 %2FB%3AENVI.0000003634.50442.ca.
Palmer C� (2011)� Property rights and liability for deforestation under REDD+:
Implications for “permanence” in policy design. Ecological Economics 70,
571 – 576. doi: 10.1016 / j.ecolecon.2010.10.011, ISSN: 0921-8009.
Pan Y�, R� A� Birdsey, J� Fang, R� Houghton, P� E� Kauppi, W� A� Kurz, O� L� Phillips,
A� Shvidenko, S� L� Lewis, J� G� Canadell, P� Ciais, R� B� Jackson, S� W� Pacala,
A� D� McGuire, S� Piao, A� Rautiainen, S� Sitch, and D� Hayes (2011)� A Large
and Persistent Carbon Sink in the World’s Forests. Science 333, 988 – 993. doi:
10.1126 / science.1201609, ISSN: 0036-8075, 1095 – 9203.
Pandit M� K�, and R� E� Grumbine (2012)� Potential Effects of Ongoing and Pro-
posed Hydropower Development on Terrestrial Biological Diversity in the Indian
Himalaya. Conservation Biology 26, 1061 – 1071. doi: 10.1111 / j.1523 - 1739.201
2.01918.x, ISSN: 1523-1739.
Parfitt J�, M� Barthel, and S� Macnaughton (2010)� Food waste within food
supply chains: quantification and potential for change to 2050. Philosophical
Transactions of the Royal Society B: Biological Sciences 365, 3065 – 3081. doi:
10.1098 / rstb.2010.0126.

911911
Agriculture, Forestry and Other Land Use (AFOLU)
11
Chapter 11
Parish E� S�, M� R� Hilliard, L� M� Baskaran, V� H� Dale, N� A� Griffiths, P� J� Mul-
holland, A� Sorokine, N� A� Thomas, M� E� Downing, and R� S� Middleton
(2012)� Multimetric spatial optimization of switchgrass plantings across
a watershed. Biofuels, Bioproducts and Biorefining 6, 58 – 72. Available at:
http: / / onlinelibrary.wiley.com / doi / 10.1002 / bbb.342 / abstract.
Pathak H�, N� Jain, A� Bhatia, J� Patel, and P� K� Aggarwal (2010)� Carbon foot-
prints of Indian food items. Agriculture, Ecosystems & Environment 139, 66 – 73.
doi: 10.1016 / j.agee.2010.07.002, ISSN: 0167-8809.
Patrizi N�, D� Caro, F� M� Pulselli, A� B� Bjerre, and S� Bastianoni (2013)� Environ-
mental feasibility of partial substitution of gasoline with ethanol in the Prov-
ince of Siena (Italy). Journal of Cleaner Production 47, 388 – 395. doi: 10.1016 / j.
jclepro.2012.11.023, ISSN: 0959-6526.
Pawelzik P�, M� Carus, J� Hotchkiss, R� Narayan, S� Selke, M� Wellisch, M� Weiss,
B� Wicke, and M� K� Patel (2013)� Critical aspects in the life cycle assess-
ment (LCA) of bio-based materials — Reviewing methodologies and deriving
recommendations. Resources, Conservation and Recycling 73, 211 – 228. doi:
10.1016 / j.resconrec.2013.02.006, ISSN: 0921-3449.
Peralta-Yahya P� P�, F� Zhang, S� B� del Cardayre, and J� D� Keasling (2012)�
Microbial engineering for the production of advanced biofuels. Nature 488,
320 – 328. doi: 10.1038 / nature11478, ISSN: 0028-0836.
Petersen J�-E� (2008)� Energy production with agricultural biomass: environmental
implications and analytical challenges†. European Review of Agricultural Eco-
nomics 35, 385 – 408. doi: 10.1093 / erae / jbn016, ISSN: 0165-1587, 1464 – 3618.
Petersen S� O�, and S� G� Sommer (2011)� Ammonia and nitrous oxide interactions:
Roles of manure organic matter management. Animal Feed Science and Tech-
nology 166 – 67, 503 – 513. doi: 10.1016 / j.anifeedsci.2011.04.077, ISSN: 0377-
8401.
Peters-Stanley M�, K� Hamilton, T� Marcello, and M� Sjardin (2011)� Back to the
Future: State of the Voluntary Carbon Markets 2011. Ecosystem Marketplace
& Bloomberg New Energy Finance, Washington, D. C. and New York, NY, USA,
93 pp.
Pettenella D�, and L� Brotto (2011)� Governance features for successful REDD+
projects organization. Forest Policy and Economics 18, 46 – 52. doi: 10.1016 / j.
forpol.2011.09.006, ISSN: 1389-9341.
Phalan B�, M� Onial, A� Balmford, and R� E� Green (2011)� Reconciling Food Pro-
duction and Biodiversity Conservation: Land Sharing and Land Sparing Com-
pared. Science 333, 1289 – 1291. doi: 10.1126 / science.1208742, ISSN: 0036-
8075, 1095 – 9203.
Phelps J�, M� C� Guerrero, D� A� Dalabajan, B� Young, and E� L� Webb (2010a)�
What makes a “REDD”country? Global Environmental Change 20, 322 – 332.
Phelps J�, E� L� Webb, and A� Agrawal (2010b)� Does REDD+ Threaten to
Recentralize Forest Governance? Science 328, 312 – 313. doi: 10.1126 / sci-
ence.1187774.
Phillips O� L�, L� E� O� C� Aragão, S� L� Lewis, J� B� Fisher, J� Lloyd, G� López-
González, Y� Malhi, A� Monteagudo, J� Peacock, C� A� Quesada, and others
(2009)� Drought sensitivity of the Amazon rainforest. Science 323, 1344.
Phillips O� L�, Y� Malhi, N� Higuchi, W� F� Laurance, P� V� Nunez, R�� Vasquez, S� G�
Laurance, L� V� Ferreira, M� Stern, S� Brown, and J� Grace (1998)� Changes
in the carbon balance of tropical forests: Evidence from long-term plots. Science
282, 439 – 442.
Pielke Sr� R� A�, A� Pitman, D� Niyogi, R� Mahmood, C� McAlpine, F� Hossain,
K� K� Goldewijk, U� Nair, R� Betts, S� Fall, M� Reichstein, P� Kabat, and N� de
Noblet (2011)� Land use / land cover changes and climate: modeling analysis
and observational evidence. Wiley Interdisciplinary Reviews: Climate Change 2,
828 – 850. doi: 10.1002 / wcc.144, ISSN: 1757-7799.
Pingoud K�, T� Ekholm, and I� Savolainen (2012)� Global warming potential fac-
tors and warming payback time as climate indicators of forest biomass use.
Mitigation and Adaptation Strategies for Global Change 17, 369 – 386. doi: 10.1
007 / s11027 - 011 - 9331 - 9, ISSN: 1381-2386, 1573 – 1596.
Place S� E�, and F� M� Mitloehner (2010)� Invited review: Contemporary environ-
mental issues: A review of the dairy industry’s role in climate change and air
quality and the potential of mitigation through improved production efficiency.
Journal of Dairy Science 93, 3407 – 3416. doi: 10.3168 / jds.2009 - 2719, ISSN:
0022-0302.
Plattner G�-K�, T� Stocker, P� Midgley, and M� Tignor (2009)� IPCC expert meet-
ing on the science of alternative metrics. IPCC Working Group I Technical Sup-
port Unit, Bern.
Plevin R� J�, M� A� Delucchi, and F� Creutzig (2013)� Using Attributional Life Cycle
Assessment to Estimate Climate-Change Mitigation Benefits Misleads Policy
Makers. Journal of Industrial Ecology 18, 73 – 83. doi: 10.1111 / jiec.12074, ISSN:
1530-9290.
Plevin R� J�, M� O’Hare, A� D� Jones, M� S� Torn, and H� K� Gibbs (2010)� Green-
house Gas Emissions from Biofuels’ Indirect Land Use Change Are Uncertain
but May Be Much Greater than Previously Estimated. Environmental Science &
Technology 44, 8015 – 8021. doi: 10.1021 / es101946t, ISSN: 0013-936X.
Pongratz J�, C� H� Reick, R� A� Houghton, and J� House (2013)� Terminology as a
key uncertainty in net land use flux estimates. Earth System Dynamics Discus-
sions 4, 677 – 716. doi: 10.5194 / esdd-4 - 677 - 2013, ISSN: 2190-4995.
Popp A�, J� P� Dietrich, H� Lotze-Campen, D� Klein, N� Bauer, M� Krause, T� Berin-
ger, D� Gerten, and O� Edenhofer (2011)� The economic potential of bioen-
ergy for climate change mitigation with special attention given to implications
for the land system. Environmental Research Letters 6, 34 – 44. doi: 10.1088 / 17
48 - 9326 / 6 / 3 / 034017, ISSN: 1748-9326.
Popp A�, M� Krause, J� P� Dietrich, H� Lotze-Campen, M� Leimbach, T� Beringer,
and N� Bauer (2012)� Additional CO
2
emissions from land use change — For-
est conservation as a precondition for sustainable production of second gen-
eration bioenergy. Ecological Economics 74, 64 – 70. doi: 10.1016 / j.ecole-
con.2011.11.004, ISSN: 0921-8009.
Popp A�, H� Lotze-Campen, and B� Bodirsky (2010)� Food consumption, diet
shifts and associated non-CO
2
greenhouse gases from agricultural production.
Global Environmental Change 20, 451 – 462.
Popp A�, S� Rose, K� Calvin, D� Vuuren, J� Dietrich, M� Wise, E� Stehfest, F�
Humpenöder, P� Kyle, J� Vliet, N� Bauer, H� Lotze-Campen, D� Klein, and E�
Kriegler (2013)� Land-use transition for bioenergy and climate stabilization:
model comparison of drivers, impacts and interactions with other land use based
mitigation options. Climatic Change, 1 – 15. doi: 10.1007 / s10584 - 013 - 0926-x,
ISSN: 0165-0009.
Potter C�, S� Klooster, C� Hiatt, V� Genovese, and J� C� Castilla-Rubio (2011)�
Changes in the carbon cycle of Amazon ecosystems during the 2010 drought.
Environmental Research Letters 6, 1 – 5.

912912
Agriculture, Forestry and Other Land Use (AFOLU)
11
Chapter 11
Poulter B�, L� Aragao, U� Heyder, M� Gumpenberger, J� Heinke, F� Langerwisch,
A� Rammig, K� Thonicke, and W� Cramer (2010)� Net biome production of
the Amazon Basin in the 21st century. Global Change Biology 16, 2062 – 2075.
doi: 10.1111 / j.1365 - 2486.2009.02064.x, ISSN: 1354-1013.
Powlson D� S�, A� P� Whitmore, and K� W� T� Goulding (2011)� Soil carbon seques-
tration to mitigate climate change: a critical re-examination to identify the true
and the false. European Journal of Soil Science 62, 42 – 55. doi: 10.1111 / j.1365 -
2389.2010.01342.x, ISSN: 1365-2389.
Pretty J� (2008)� Agricultural sustainability: concepts, principles and evidence.
Philosophical Transactions of the Royal Society B: Biological Sciences 363,
447 – 465. doi: 10.1098 / rstb.2007.2163, ISSN: 0962-8436, 1471 – 2970.
Pretty J� (2013)� The Consumption of a Finite Planet: Well-Being, Convergence,
Divergence and the Nascent Green Economy. Environmental and Resource
Economics 55, 475 – 499. doi: 10.1007 / s10640 - 013 - 9680 - 9, ISSN: 0924-6460,
1573 – 1502.
Primmer E�, and H� Karppinen (2010)� Professional judgment in non-industrial
private forestry: Forester attitudes and social norms influencing biodiversity
conservation. Forest Policy and Economics 12, 136 – 146. doi: 10.1016 / j.for-
pol.2009.09.007, ISSN: 1389-9341.
Pucker J�, R� Zwart, and G� Jungmeier (2012)� Greenhouse gas and energy analy-
sis of substitute natural gas from biomass for space heat. Biomass and Bioen-
ergy 38, 95 – 101. doi: 10.1016 / j.biombioe.2011.02.040, ISSN: 0961-9534.
Puettmann M� E�, R� Bergman, S� Hubbard, L� Johnson, B� Lippke, E� Oneil, and
F� G� Wagner (2010)� Cradle-to-gate life-cycle inventory of the U. S. Wood prod-
ucts production: CORRIM Phase I and Phase II products. Wood and Fiber Sci-
ence 42, 15 – 28.
Pullin R� S� V�, R� Froese, and D� Pauly (2007)� Indicators for the sustainability of
aquaculture. In: Ecological and Genetic Implications of Aquaculture Activities.
T. M. Bert, (ed.), Kluwer Academic Publishers, Dordrecht, The Netherlands, pp.
53 – 72.
Putz F� E�, and K� H� Redford (2009)� Dangers of carbon-based conservation.
Global Environmental Change 19, 400 – 401.
Putz F� E�, and C� Romero (2012)� Helping curb tropical forest degradation by
linking REDD+ with other conservation interventions: a view from the forest.
Current Opinion in Environmental Sustainability 4, 670 – 677. doi: 10.1016 / j.
cosust.2012.10.003, ISSN: 1877-3435.
Le Quéré C�, R� J� Andres, T� Boden, T� Conway, R� A� Houghton, J� I� House, G�
Marland, G� P� Peters, G� R� van der Werf, A� Ahlström, R� M� Andrew, L�
Bopp, J� G� Canadell, P� Ciais, S� C� Doney, C� Enright, P� Friedlingstein, C�
Huntingford, A� K� Jain, C� Jourdain, E� Kato, R� F� Keeling, K� Klein Gold-
ewijk, S� Levis, P� Levy, M� Lomas, B� Poulter, M� R� Raupach, J� Schwinger,
S� Sitch, B� D� Stocker, N� Viovy, S� Zaehle, and N� Zeng (2013)� The global
carbon budget 1959 – 2011. Earth System Science Data 5, 165 – 185. doi:
10.5194 / essd-5 - 165 - 2013, ISSN: 1866-3516.
Rametsteiner E�, and M� Simula (2003)� Forest certification — an instrument to
promote sustainable forest management? Journal of Environmental Manage-
ment 67, 87 – 98. doi: 10.1016 / S0301 - 4797(02)00191 - 3, ISSN: 03014797.
Randerson J� T�, H� Liu, M� G� Flanner, S� D� Chambers, Y� Jin, P� G� Hess, G� Pfis-
ter, M� C� Mack, K� K� Treseder, L� R� Welp, F� S� Chapin, J� W� Harden, M� L�
Goulden, E� Lyons, J� C� Neff, E� A� G� Schuur, and C� S� Zender (2006)� The
Impact of Boreal Forest Fire on Climate Warming. Science 314, 1130 – 1132. doi:
10.1126 / science.1132075.
Rathmann R�, A� Szklo, and R� Schaeffer (2010)� Land use competition for pro-
duction of food and liquid biofuels: An analysis of the arguments in the current
debate. Renewable Energy 35, 14 – 22.
Ravindranath N� H� (2007)� Mitigation and adaptation synergy in forest sector.
Mitigation and Adaptation Strategies for Global Change 12, 843 – 853. doi: 10.1
007 / s11027 - 007 - 9102 - 9, ISSN: 1381-2386, 1573 – 1596.
Read J� M�, J� M� V� Fragoso, K� M� Silvius, J� Luzar, H� Overman, A� Cummings,
S� T� Giery, and L� F� de Oliveira (2010)� Space, Place, and Hunting Patterns
among Indigenous Peoples of the Guyanese Rupununi Region. Journal of Latin
American Geography 9, 213 – 243. ISSN: 1548-5811.
Rehl T�, J� Lansche, and J� Müller (2012)� Life cycle assessment of energy genera-
tion from biogas — Attributional vs. consequential approach. Renewable and
Sustainable Energy Reviews 16, 3766 – 3775. doi: 10.1016 / j.rser.2012.02.072,
ISSN: 1364-0321.
Reichstein M�, M� Bahn, P� Ciais, D� Frank, M� D� Mahecha, S� I� Seneviratne, J�
Zscheischler, C� Beer, N� Buchmann, D� C� Frank, D� Papale, A� Rammig, P�
Smith, K� Thonicke, M� van der Velde, S� Vicca, A� Walz, and M� Watten-
bach (2013)� Climate extremes and the carbon cycle. Nature 500, 287 – 295.
doi: 10.1038 / nature12350, ISSN: 0028-0836, 1476 – 4687.
Reilly J�, J� Melillo, Y� Cai, D� Kicklighter, A� Gurgel, S� Paltsev, T� Cronin, A� Soko-
lov, and A� Schlosser (2012)� Using Land To Mitigate Climate Change: Hitting
the Target, Recognizing the Trade-offs. Environmental Science & Technology 46,
5672 – 5679. doi: 10.1021 / es2034729, ISSN: 0013-936X, 1520 – 5851.
REN21 (2012)� Renewables 2012 Global Status Report. REN21 Secretariat, Paris,
France, 176 pp. Available at: http: / / www. ren21. net / Resources / Publica-
tions / REN21Publications / Renewables2012GlobalStatusReport.aspx.
REN21 (2013)� Renewables 2013 Global Status Report. REN21 Secretariat, Paris,
France, 178 pp. Available at: http: / / www. ren21. net / ren21activities / globalsta-
tusreport.aspx.
Repo A�, R� Känkänen, J�-P� Tuovinen, R� Antikainen, M� Tuomi, P� Vanhala, and
J� Liski (2012)� Forest bioenergy climate impact can be improved by allocating
forest residue removal. GCB Bioenergy 4, 202 – 212.
Repo A�, M� Tuomi, and J� Liski (2011)� Indirect carbon dioxide emissions from
producing bioenergy from forest harvest residues. GCB Bioenergy 3, 107 – 115.
doi: 10.1111 / j.1757 - 1707.2010.01065.x, ISSN: 1757-1707.
Reyer C�, M� Guericke, and P� L� Ibisch (2009)� Climate change mitigation via
afforestation, reforestation and deforestation avoidance: and what about adap-
tation to environmental change? New Forests 38, 15 – 34. doi: 10.1007 / s11056
- 008 - 9129 - 0, ISSN: 0169-4286, 1573 – 5095.
RFA (2008)� Indirect Effects of Biofuels: Study by the Renewable Fuels Agency.
Renewable Fuels Agency, London, UK, 92 pp.
Rhodes J�, and D� Keith (2008)� Biomass with capture: negative emissions within
social and environmental constraints: an editorial comment. Climatic Change
87, 321 – 328. doi: 10.1007 / s10584 - 007 - 9387 - 4, ISSN: 0165-0009.
Rice R� A� (2008)� Agricultural intensification within agroforestry: the case
of coffee and wood products. Agriculture, Ecosystems & Environment
128, 212 – 218. Available at: http: / / www. sciencedirect. com / science / arti-
cle / pii / S0167880908001874.
Richels R�, J� Merrick, G� Blanford, and S� Rose (In Review)� Trade-offs Between
Mitigation Costs and Temperature Change. Climatic Change.

913913
Agriculture, Forestry and Other Land Use (AFOLU)
11
Chapter 11
Robertson G� P�, T� W� Bruulsema, R� J� Gehl, D� Kanter, D� L� Mauzerall, C� A� Rotz,
and C� O� Williams (2013)� Nitrogen – climate interactions in US agriculture.
Biogeochemistry 114, 41 – 70. doi: 10.1007 / s10533 - 012 - 9802 - 4, ISSN: 0168-
2563, 1573 – 515X.
Robertson G� P�, and P� M� Vitousek (2009)� Nitrogen in Agriculture: Balancing the
Cost of an Essential Resource. Annual Review of Environment and Resources
34, 97 – 125. doi: 10.1146 / annurev.environ.032108.105046, ISSN: 1543-5938.
Robinson N�, R� J� Harper, K� R� J� Smettem, and J� F� McGrath (2004)� Tree
placement strategies for salinity control in dryland farming systems of south-
ern Australia. In: 13th International Soil Conservation Organization Confer-
ence. Brisbrane, Australia. 6 pp. Available at: http: / / www. tucson. ars. ag.
gov / isco / isco13 / PAPERS%20R-Z / ROBINSON.pdf.
Robinson B� E�, M� Holland, and L� Naughton-Treves (2011)� Does secure
land tenure save forest? A review of the relationship between land tenure
and tropical deforestation. CCAFS Working Paper no.7. CGIAR Research Pro-
gram on Climate Change, Agriculture and Food Security (CCAFS). Available at:
http: / / cgspace.cgiar.org / handle / 10568 / 10720.
Robledo C�, N� Clot, A� Hammill, and B� Riché (2011)� The role of forest ecosys-
tems in community-based coping strategies to climate hazards: Three exam-
ples from rural areas in Africa. Forest Policy and Economics 24, 20 – 28. doi:
10.1016 / j.forpol.2011.04.006, ISSN: 13899341.
Rochette P� (2008)� No-till only increases N
2
O emissions in poorly-aerated soils.
Soil and Tillage Research 101, 97 – 100. doi: 10.1016 / j.still.2008.07.011, ISSN:
01671987.
Roedl A� (2010)� Production and energetic utilization of wood from short rota-
tion coppice — a life cycle assessment. The International Journal of Life Cycle
Assessment 15, 567 – 578. doi: 10.1007 / s11367 - 010 - 0195 - 0, ISSN: 0948-3349.
Rogner H� H�, R� F� Aguilera, C� L� Archer, R� Bertani, S� C� Bhattacharya, I�
Bryden, R� R� Charpentier, M� B� Dusseault, L� Gagnon, Y� Goswami, H�
Haberl, M� M� Hoogwijk, A� Johnson, P� Odell, H� Wagner, and V� Yaku-
shev (2012)� Chapter 7 — Energy resources and potentials. In: Global Energy
Assessment: Toward a Sustainable Future. L. Gomez-Echeverri, T. B. Johansson,
N. Nakicenovic, A. Patwardhan, (eds.), IIASA and Cambridge University Press,
Laxenburg, Austria, Cambridge, UK, pp. 425 – 512.
Rohde R� F�, and M� T� Hoffman (2012)� The historical ecology of Namibian
rangelands: Vegetation change since 1876 in response to local and global
drivers. Science of The Total Environment 416, 276 – 288. doi: 10.1016 / j.scito-
tenv.2011.10.067, ISSN: 00489697.
Rose S� K�, H� Ahammad, B� Eickhout, B� Fisher, A� Kurosawa, S� Rao, K� Riahi,
and D� P� van Vuuren (2012)� Land-based mitigation in climate stabilization.
Energy Economics 34, 365 – 380. doi: 10.1016 / j.eneco.2011.06.004, ISSN: 0140-
9883.
Rose S�, R� Beach, K� Calvin, B� McCarl, J� Petrusa, B� Sohngen, R� Youngman,
A� Diamant, F� de la Chesnaye, J� Edmonds, R� Rosenzweig, and M� Wise
(2013)� Estimating Global Greenhouse Gas Emissions Offset Supplies: Account-
ing for Investment Risks and Other Market Realties. EPRI, Palo Alto, CA, 23 pp.
Rose S� K�, and B� Sohngen (2011)� Global forest carbon sequestration and climate
policy design. Environment and Development Economics 16, 429 – 454. doi:
10.1017 / S1355770X11000027, ISSN: 1355-770X, 1469 – 4395.
Rosemary L� (2011)� REDD+, transparency, participation and resource rights:
the role of law. Environmental Science & Policy 14, 118 – 126. doi: 10.1016 / j.
envsci.2010.11.008, ISSN: 1462-9011.
Rosendal G� K�, and S� Andresen (2011)� Institutional design for improved forest
governance through REDD: Lessons from the global environment facility. Eco-
logical Economics 70, 1908 – 1915. doi: 10.1016 / j.ecolecon.2011.04.001, ISSN:
0921-8009.
Rosenzweig C�, and F� N� Tubiello (2007)� Adaptation and mitigation strategies in
agriculture: an analysis of potential synergies. Mitigation, Adaptation Strategies
to Global Change 12, 855 – 873. doi: 10.1007 / s11027 - 007 - 9103 - 8.
Rosillo-Calle F�, S� Teelucksingh, D� Thrän, and M� Seiffert (2012)� The Potential
Role of Biofuels in Commercial Air Transport — Biojetfuel. IEA, Paris, France, 56
pp.
Rotenberg E�, and D� Yakir (2010)� Contribution of Semi-Arid Forests to the Cli-
mate System. Science 327, 451 – 454. doi: 10.1126 / science.1179998.
Roy P�, T� Orikasa, M� Thammawong, N� Nakamura, Q� Xu, and T� Shiina (2012)�
Life cycle of meats: An opportunity to abate the greenhouse gas emission from
meat industry in Japan. Journal of Environmental Management 93, 218 – 224.
doi: 10.1016 / j.jenvman.2011.09.017, ISSN: 0301-4797.
Royal Society (2009)� Reaping the Benefits: Science and the Sustainable Intensifi-
cation of Global Agriculture. The Royal Society, London, 86 pp.
Rubin E� M� (2008)� Genomics of cellulosic biofuels. Nature 454, 841 – 845. doi:
10.1038 / nature07190, ISSN: 0028-0836.
Saatchi S� S�, N� L� Harris, S� Brown, M� Lefsky, E� T� A� Mitchard, W� Salas,
B� R� Zutta, W� Buermann, S� L� Lewis, S� Hagen, S� Petrova, L� White,
M� Silman, and A� Morel (2011)� Benchmark map of forest carbon stocks
in tropical regions across three continents. Proceedings of the National
Academy of Sciences of the United States of America 108, 9899 – 9904. doi:
10.1073 / pnas.1019576108, ISSN: 0027-8424.
Saddler J�, and L� Kumar (2013)� Special Issue from the NSERC Bioconversion net-
work workshop: pretreatment and fractionation of biomass for biorefinery / bio-
fuels. Biotechnology for Biofuels 6, 17. doi: 10.1186 / 1754 - 6834 - 6-17, ISSN:
1754-6834.
Saggar S�, R� M� Andrew, K� R� Tate, C� B� Hedley, N� J� Rodda, and J� A� Townsend
(2004)� Modelling nitrous oxide emissions from dairy-grazed pastures. Nutri-
ent Cycling in Agroecosystems 68, 243 – 255. Available at: http: / / link.springer.
com / article / 10.1023 / B:FRES.0000019463.92440.a3.
Sala O� E�, F� S� Chapin, J� J� Armesto, E� Berlow, J� Bloomfield, R� Dirzo, E�
Huber-Sanwald, L� F� Huenneke, R� B� Jackson, A� Kinzig, R� Leemans, D� M�
Lodge, H� A� Mooney, M� Oesterheld, N� L� Poff, M� T� Sykes, B� H� Walker,
M� Walker, and D� H� Wall (2000)� Global Biodiversity Scenarios for the Year
2100. Science 287, 1770 – 1774. doi: 10.1126 / science.287.5459.1770, ISSN:
0036-8075, 1095 – 9203.
Sandor R� L�, E� C� Bettelheim, and I� R� Swingland (2002)� An overview of a free-
market approach to climate change and conservation. Philosophical Transac-
tions of the Royal Society of London Series a-Mathematical Physical and Engi-
neering Sciences 360, 1607 – 1620. ISSN: 1364-503X.
Santilli M�, P� Moutinho, S� Schwartzman, D� Nepstad, L� Curran, and C� Nobre
(2005)� Tropical Deforestation and the Kyoto Protocol. Climatic Change 71,
267 – 276. doi: 10.1007 / s10584 - 005 - 8074 - 6, ISSN: 0165-0009, 1573 – 1480.
Sathaye J�, W� Makundi, L� Dale, P� Chan, and K� Andrasko (2005)� Generalized
Comprehensive Mitigation Assessment Process (GCOMAP): A Dynamic Partial
Equilibrium Model for. U. S. Environmental Protection Agency, Washington,
D. C., 93 pp. Available at: http: / / eetd.lbl.gov / sites / all / files / lbnl-58291.pdf.

914914
Agriculture, Forestry and Other Land Use (AFOLU)
11
Chapter 11
Sathaye J�, W� Makundi, L� Dale, P� Chan, and K� Andrasko (2006)� GHG Mitiga-
tion Potential, Costs and Benefits in Global Forests: A Dynamic Partial Equilib-
rium Approach. The Energy Journal Multi-Greenhouse Gas Mitigation and
Climate Policy, 127 – 162. ISSN: 0195-6574.
Sathre R�, and J� O’Connor (2010)� Meta-analysis of greenhouse gas displace-
ment factors of wood product substitution. Environmental Science & Policy 13,
104 – 114. doi: 10.1016 / j.envsci.2009.12.005, ISSN: 1462-9011.
Satolo L�, and M� Bacchi (2013)� Impacts of the Recent Expansion of the Sugar-
cane Sector on Municipal per Capita Income in São Paulo State. ISRN Econom-
ics 2013, 14.
Sauvant D�, and S� Giger-Reverdin (2007)� Empirical modelling meta-analysis of
digestive interactions and CH
4
production in ruminants. In: Energy and protein
metabolism and nutrition. I. Ortigues-Marty, N. Miraux, W. Brand-Williams,
(eds.), Wageningen Academic Publishers, Wageningen, The Netherlands, pp.
561 – 563. ISBN: 978 - 90 - 8686 - 041 - 8.
Sayer J�, J� Ghazoul, P� Nelson, and A� Klintuni Boedhihartono (2012)� Oil palm
expansion transforms tropical landscapes and livelihoods. Global Food Security
1, 114 – 119. doi: 10.1016 / j.gfs.2012.10.003, ISSN: 2211-9124.
Scheidel A�, and A� H� Sorman (2012)� Energy transitions and the global land rush:
Ultimate drivers and persistent consequences. Global Transformations, Social
Metabolism and the Dynamics of Socio-Environmental Conflicts 22, 588 – 595.
doi: 10.1016 / j.gloenvcha.2011.12.005, ISSN: 0959-3780.
Schils R� L� M�, J� Eriksen, S� F� Ledgard, T� V� Vellinga, P� J� Kuikman, J� Luo,
S� O� Petersen, and G� L� Velthof (2013)� Strategies to mitigate nitrous
oxide emissions from herbivore production systems. Animal 7, 29 – 40. doi:
10.1017 / S175173111100187X.
Schlamadinger B�, and G� Marland (1996)� The role of forest and bioenergy strat-
egies in the global carbon cycle. Biomass and Bioenergy 10, 275 – 300. doi: 10.1
016 / 0961 - 9534(95)00113 - 1, ISSN: 0961-9534.
Schmidinger K�, and E� Stehfest (2012)� Including CO
2
implications of land occu-
pation in LCAs — method and example for livestock products. The International
Journal of Life Cycle Assessment 17, 962 – 972. doi: 10.1007 / s11367 - 012 - 0434
- 7, ISSN: 0948-3349, 1614 – 7502.
Schmidt J�, V� Gass, and E� Schmid (2011)� Land use changes, greenhouse gas
emissions and fossil fuel substitution of biofuels compared to bioelectricity pro-
duction for electric cars in Austria. Biomass and Bioenergy 35, 4060 – 4074. doi:
10.1016 / j.biombioe.2011.07.007, ISSN: 0961-9534.
Schmitz C�, A� Biewald, H� Lotze-Campen, A� Popp, J� P� Dietrich, B� Bodirsky,
M� Krause, and I� Weindl (2011)� Trading more food: Implications for land
use, greenhouse gas emissions, and the food system. Global Environmental
Change 22, 189 – 209. doi: 10.1016 / j.gloenvcha.2011.09.013, ISSN: 0959-3780.
Schneider A�, M� A� Friedl, and D� Potere (2009)� A new map of global urban
extent from MODIS satellite data. Environmental Research Letters 4, 12. doi:
10.1088 / 1748 - 9326 / 4 / 4 / 044003, ISSN: 1748-9326.
Schneider U� A�, P� Havlík, E� Schmid, H� Valin, A� Mosnier, M� Obersteiner, H�
Böttcher, R� Skalský, J� Balkovič, T� Sauer, and S� Fritz (2011)� Impacts of
population growth, economic development, and technical change on global
food production and consumption. Agricultural Systems 104, 204 – 215. doi:
10.1016 / j.agsy.2010.11.003, ISSN: 0308-521X.
Schut M�, M� Slingerland, and A� Locke (2010)� Biofuel developments in Mozam-
bique. Update and analysis of policy, potential and reality. Energy Policy 38,
5151 – 5165. doi: 10.1016 / j.enpol.2010.04.048, ISSN: 0301-4215.
Schuur E� A� G�, J� Bockheim, J� G� Canadell, E� Euskirchen, C� B� Field, S� V�
Goryachkin, S� Hagemann, P� Kuhry, P� M� Lafleur, H� Lee, G� Mazhitova,
F� E� Nelson, A� Rinke, V� E� Romanovsky, N� Shiklomanov, C� Tarnocai, S�
Venevsky, J� G� Vogel, and S� A� Zimov (2008)� Vulnerability of Permafrost
Carbon to Climate Change: Implications for the Global Carbon Cycle. BioSci-
ence 58, 701. doi: 10.1641 / B580807, ISSN: 0006-3568.
Schwietzke S�, W� M� Griffin, and H� S� Matthews (2011)� Relevance of Emissions
Timing in Biofuel Greenhouse Gases and Climate Impacts. Environmental Sci-
ence & Technology 45, 8197 – 8203. doi: 10.1021 / es2016236, ISSN: 0013-936X.
Scown C� D�, W� W� Nazaroff, U� Mishra, B� Strogen, A� B� Lobscheid, E� Masanet,
N� J� Santero, A� Horvath, and T� E� McKone (2012)� Lifecycle greenhouse gas
implications of US national scenarios for cellulosic ethanol production. Envi-
ronmental Research Letters 7, 014011. doi: 10.1088 / 1748 - 9326 / 7 / 1 / 014011,
ISSN: 1748-9326.
Seabra J� E�, I� C� Macedo, H� L� Chum, C� E� Faroni, and C� A� Sarto (2011)� Life
cycle assessment of Brazilian sugarcane products: GHG emissions and energy
use. Biofuels, Bioproducts and Biorefining 5, 519 – 532. doi: 10.1002 / bbb.289,
ISSN: 1932-1031.
Seaquist, J� W�, Hickler, T�, Eklundh, L�, Ardö, J�, and Heumann, and B� W� (2008)�
Disentangling the effects of climate and people on Sahel vegetation dynamics.
Biogeosciences Discussions 5, 3045 – 3067.
Searchinger T� D� (2010)� Biofuels and the need for additional carbon. Environmen-
tal Research Letters 5, 11. doi: 10.1088 / 1748 - 9326 / 5 / 2 / 024007, ISSN: 1748-
9326.
Searchinger T� D�, S� P� Hamburg, J� Melillo, W� Chameides, P� Havlik, D� M� Kam-
men, G� E� Likens, R� N� Lubowski, M� Obersteiner, M� Oppenheimer, G�
Philip Robertson, W� H� Schlesinger, and G� David Tilman (2009)� Fixing
a Critical Climate Accounting Error. Science 326, 527 – 528. doi: 10.1126 / sci-
ence.1178797.
Searchinger T�, R� Heimlich, R� A� Houghton, F� Dong, A� Elobeid, J� Fabiosa,
S� Tokgoz, D� Hayes, and T�-H� Yu (2008)� Use of U. S. Croplands for Biofu-
els Increases Greenhouse Gases Through Emissions from Land-Use Change.
Science 319, 1238 – 1240. doi: 10.1126 / science.1151861, ISSN: 0036-8075,
1095 – 9203.
Searcy E�, and P� C� Flynn (2008)� Processing of Straw / Corn Stover: Comparison
of Life Cycle Emissions. International Journal of Green Energy 5, 423 – 437. doi:
10.1080 / 15435070802498010, ISSN: 1543-5075.
Sedjo R�, and X� Tian (2012)� Does Wood Bioenergy Increase Carbon Stocks in
Forests? Journal of Forestry 110, 304 – 311.
Seitzinger S� P�, U� Svedin, C� L� Crumley, W� Steffen, S� A� Abdullah, C� Alf-
sen, W� J� Broadgate, F� Biermann, N� R� Bondre, J� A� Dearing, L� Deutsch,
S� Dhakal, T� Elmqvist, N� Farahbakhshazad, O� Gaffney, H� Haberl, S�
Lavorel, C� Mbow, A� J� McMichael, J� M� F� deMorais, P� Olsson, P� F� Pinho,
K� C� Seto, P� Sinclair, M� S� Smith, and L� Sugar (2012)� Planetary Steward-
ship in an Urbanizing World: Beyond City Limits. AMBIO 41, 787 – 794. doi: 10.1
007 / s13280 - 012 - 0353 - 7, ISSN: 0044-7447, 1654 – 7209.
Selfa T�, L� Kulcsar, C� Bain, R� Goe, and G� Middendorf (2011)� Biofuels
Bonanza?: Exploring community perceptions of the promises and perils of bio-
fuels production. Biomass and Bioenergy 35, 1379 – 1389. doi: 10.1016 / j.biom-
bioe.2010.09.008, ISSN: 0961-9534.
Semere T�, and F� M� Slater (2007)� Ground flora, small mammal and bird species
diversity in miscanthus (Miscanthus giganteus) and reed canary-grass (Phalaris
arundinacea) fields. Biomass and Bioenergy 31, 20 – 29. ISSN: 09619534.

915915
Agriculture, Forestry and Other Land Use (AFOLU)
11
Chapter 11
Semroc B� L�, G� Schroth, C� A� Harvey, Y� Zepeda, and F� Boltz (2012)� Climate
Change mitigation in agroforestry systems. linking smallholders to forest car-
bon markets. In: Climate Change Mitigation and Agriculture. E. Wollenberg,
M.-L. Tapio-Bistrom, M. Grieg-Gran, A. Nihart, (eds.), Routledge, London-New
York, pp. 360 – 369. ISBN: 1849713936.
Senel O�, and N� Chugunov (2013)� CO
2
Injection in a Saline Formation: Pre-Injec-
tion Reservoir Modeling and Uncertainty Analysis for Illinois Basin — Decatur
Project. Energy Procedia 37, 4598 – 4611. doi: 10.1016 / j.egypro.2013.06.368,
ISSN: 1876-6102.
Seppälä R�, A� Buck, and P� Katila (Eds.) (2009)� Adaptation of Forests and People
to Climate Change. A Global Assessment Report. International Union of Forest
Research Organizations, Helsinki, 224 pp. ISBN: 978 - 3-901347 - 80 - 1.
Serrano-Ruiz J� C�, R� M� West, and J� A� Dumesic (2010)� Catalytic Conversion
of Renewable Biomass Resources to Fuels and Chemicals. Annual Review of
Chemical and Biomolecular Engineering 1, 79 – 100. doi: 10.1146 / annurev-
chembioeng-073009 - 100935.
Seto K� C�, B� Güneralp, and L� R� Hutyra (2012a)� Global forecasts of urban
expansion to 2030 and direct impacts on biodiversity and carbon pools. Pro-
ceedings of the National Academy of Sciences 109, 16083 – 16088. doi:
10.1073 / pnas.1211658109, ISSN: 0027-8424, 1091 – 6490.
Seto K� C�, A� Reenberg, C� G� Boone, M� Fragkias, D� Haase, T� Langanke, P�
Marcotullio, D� K� Munroe, B� Olah, and D� Simon (2012b)� Urban Land
Teleconnections and Sustainability. Proceedings of the National Academy of
Sciences 109, 7687 – 7692. doi: 10.1073 / pnas.1117622109, ISSN: 0027-8424,
1091 – 6490.
Shackley S�, S� Carter, T� Knowles, E� Middelink, S� Haefele, S� Sohi, A� Cross,
and S� Haszeldine (2012)� Sustainable gasification – biochar systems? A case-
study of rice-husk gasification in Cambodia, Part I: Context, chemical proper-
ties, environmental and health and safety issues. Energy Policy 42, 49 – 58. doi:
10.1016 / j.enpol.2011.11.026, ISSN: 03014215.
Shen H�, C� Poovaiah, A� Ziebell, T� Tschaplinski, S� Pattathil, E� Gjersing, N�
Engle, R� Katahira, Y� Pu, R� Sykes, F� Chen, A� Ragauskas, J� Mielenz,
M� Hahn, M� Davis, C� N� Stewart, and R� Dixon (2013)� Enhanced char-
acteristics of genetically modified switchgrass (Panicum virgatum L.) for high
biofuel production. Biotechnology for Biofuels 6, 71. Available at: http: / / www.
biotechnologyforbiofuels. com / content / 6 / 1 / 71.
Siangjaeo S�, S� H� Gheewala, K� Unnanon, and A� Chidthaisong (2011)� Impli-
cations of land use change on the life cycle greenhouse gas emissions from
palm biodiesel production in Thailand. Energy for Sustainable Development 15,
1 – 7. doi: 10.1016 / j.esd.2011.01.002, ISSN: 0973-0826.
Sikor T�, J� Stahl, T� Enters, J� C� Ribot, N� Singh, W� D� Sunderlin, and L� Wol-
lenberg (2010)� REDD-plus, forest people’s rights and nested climate gover-
nance. Global Environmental Change 20, 423 – 425. doi: 10.1016 / j.gloenv-
cha.2010.04.007, ISSN: 0959-3780.
Silalertruksa T�, and S� H� Gheewala (2012)� Environmental sustainability assess-
ment of palm biodiesel production in Thailand. Energy 43, 306 – 314. doi:
10.1016 / j.energy.2012.04.025, ISSN: 0360-5442.
Silver W�, R� Ostertag, and A� Lugo (2000)� The potential for carbon sequestra-
tion through reforestation of abandoned tropical agricultural and pasture lands.
Restoration Ecology 8, 394 – 407.
Sims R�, A� Hastings, B� Schlamadinger, G� Taylor, and P� Smith (2006)�
Energy crops: current status and future prospects. Global Change Biology 12,
2054 – 2076. doi: 10.1111 / j.1365 - 2486.2006.01163.x, ISSN: 1365-2486.
Singh P� P� (2008)� Exploring biodiversity and climate change benefits of commu-
nity-based forest management. Global Environmental Change 18, 468 – 478.
doi: 10.1016 / j.gloenvcha.2008.04.006, ISSN: 0959-3780.
Singh B� P�, A� L� Cowie, and R� J� Smernik (2012)� Biochar Carbon Stability in a
Clayey Soil As a Function of Feedstock and Pyrolysis Temperature. Environmen-
tal Science & Technology 46, 11770 – 11778. doi: 10.1021 / es302545b, ISSN:
0013-936X, 1520 – 5851.
Singh B� P�, B� J� Hatton, B� Singh, A� L� Cowie, and A� Kathuria (2010)� Influ-
ence of Biochars on Nitrous Oxide Emission and Nitrogen Leaching from
Two Contrasting Soils. Journal of Environment Quality 39, 1224. doi:
10.2134 / jeq2009.0138, ISSN: 1537-2537.
Sitch S�, C� Huntingford, N� Gedney, P� E� Levy, M� Lomas, S� L� Piao, R� Betts,
P� Ciais, P� Cox, P� Friedlingstein, C� D� Jones, I� C� Prentice, and F� I� Wood-
ward (2008)� Evaluation of the terrestrial carbon cycle, future plant geography
and climate-carbon cycle feedbacks using five Dynamic Global Vegetation Mod-
els (DGVMs). Global Change Biology 14, 2015 – 2039. doi: 10.1111 / j.1365 - 248
6.2008.01626.x, ISSN: 1365-2486.
Skutsch M�, B� Vickers, Y� Georgiadou, and M� McCall (2011)� Alternative mod-
els for carbon payments to communities under REDD+: A comparison using the
Polis model of actor inducements. Environmental Science & Policy 14, 140 – 151.
doi: 10.1016 / j.envsci.2010.12.005, ISSN: 1462-9011.
Smeets E� M� W�, L� F� Bouwman, E� Stehfest, D� P� Van VUUREN, and A� Post-
huma (2009a)� Contribution of N
2
O to the greenhouse gas balance of first-
generation biofuels. Global Change Biology 15, 1 – 23. doi: 10.1111 / j.1365 - 248
6.2008.01704.x, ISSN: 1365-2486.
Smeets E� M� W�, and A� P� C� Faaij (2007)� Bioenergy potentials from forestry in
2050. Climatic Change 81, 353 – 390. doi: 10.1007 / s10584 - 006 - 9163-x, ISSN:
0165-0009, 1573 – 1480.
Smeets E� M�, and A� P� Faaij (2010)� The impact of sustainability criteria on the
costs and potentials of bioenergy production – Applied for case studies in Brazil
and Ukraine. Biomass and Bioenergy 34, 319 – 333.
Smeets E� M� W�, A� P� C� Faaij, I� M� Lewandowski, and W� C� Turkenburg (2007)�
A bottom-up assessment and review of global bio-energy potentials to 2050.
Progress in Energy and Combustion Science 33, 56 – 106. doi: 10.1016 / j.
pecs.2006.08.001, ISSN: 0360-1285.
Smeets E�, M� Junginger, A� Faaij, A� Walter, P� Dolzan, and W� Turkenburg
(2008)� The sustainability of Brazilian ethanol — An assessment of the pos-
sibilities of certified production. Biomass and Bioenergy 32, 781 – 813. doi:
10.1016 / j.biombioe.2008.01.005, ISSN: 09619534.
Smeets E� M� W�, I� M� Lewandowski, and A� P� C� Faaij (2009b)� The economical
and environmental performance of miscanthus and switchgrass production
and supply chains in a European setting. Renewable and Sustainable Energy
Reviews 13, 1230 – 1245. doi: 10.1016 / j.rser.2008.09.006, ISSN: 1364-0321.
Smith P� (2005)� An overview of the permanence of soil organic carbon stocks:
Influence of direct human-induced, indirect and natural effects. European Jour-
nal of Soil Science 56, 673 – 680.
Smith P� (2008)� Land use change and soil organic carbon dynamics. Nutrient
Cycling in Agroecosystems 81, 169 – 178. doi: 10.1007 / s10705 - 007 - 9138-y,
ISSN: 1385-1314, 1573 – 0867.
Smith P� (2012)� Agricultural greenhouse gas mitigation potential globally, in
Europe and in the UK: what have we learnt in the last 20 years? Global Change
Biology 18, 35 – 43. doi: 10.1111 / j.1365 - 2486.2011.02517.x, ISSN: 1365-2486.

916916
Agriculture, Forestry and Other Land Use (AFOLU)
11
Chapter 11
Smith P� (2013)� Delivering food security without increasing pressure on land.
Global Food Security 2, 18 – 23. doi: 10.1016 / j.gfs.2012.11.008, ISSN: 22119124.
Smith P�, M� R� Ashmore, H� I� J� Black, P� J� Burgess, C� D� Evans, T� A� Quine,
A� M� Thomson, K� Hicks, and H� G� Orr (2013a)� The role of ecosystems and
their management in regulating climate, and soil, water and air quality. Jour-
nal of Applied Ecology 50, 812 – 829. doi: 10.1111 / 1365 - 2664.12016, ISSN:
00218901.
Smith W� K�, C� C� Cleveland, S� C� Reed, N� L� Miller, and S� W� Running (2012a)�
Bioenergy Potential of the United States Constrained by Satellite Observations
of Existing Productivity. Environmental Science & Technology 46, 3536 – 3544.
doi: 10.1021 / es203935d, ISSN: 0013-936X.
Smith W� N�, B� B� Grant, C� A� Campbell, B� G� McConkey, R� L� Desjardins, R�
Kröbel, and S� S� Malhi (2012b)� Crop residue removal effects on soil carbon:
Measured and inter-model comparisons. Agriculture, Ecosystems & Environ-
ment 161, 27 – 38. doi: 10.1016 / j.agee.2012.07.024, ISSN: 0167-8809.
Smith P�, P� J� Gregory, D� P� van Vuuren, M� Obersteiner, P� Havlík, M� Roun-
sevell, J� Woods, E� Stehfest, and J� Bellarby (2010)� Competition for land.
Philosophical Transactions of the Royal Society B: Biological Sciences 365,
2941 – 2957. doi: 10.1098 / rstb.2010.0127.
Smith P�, H� Haberl, A� Popp, K� Erb, C� Lauk, R� Harper, F� N� Tubiello, A� de
Siqueira Pinto, M� Jafari, S� Sohi, O� Masera, H� Böttcher, G� Berndes, M�
Bustamante, H� Ahammad, H� Clark, H� Dong, E� A� Elsiddig, C� Mbow,
N� H� Ravindranath, C� W� Rice, C� Robledo Abad, A� Romanovskaya, F�
Sperling, M� Herrero, J� I� House, and S� Rose (2013b)� How much land-
based greenhouse gas mitigation can be achieved without compromising food
security and environmental goals? Global Change Biology 19, 2285 – 2302. doi:
10.1111 / gcb.12160, ISSN: 1365-2486.
Smith P�, D� Martino, Z� Cai, D� Gwary, H� H� Janzen, P� Kumar, B� McCarl, S�
Ogle, F� O’Mara, C� Rice, R� J� Scholes, O� Sirotenko, M� Howden, T� McAl-
lister, G� Pan, V� Romanenkov, S� Rose, U� Schneider, and S� Towprayoon
(2007)� Agriculture. In: Chapter 8 of Climate change 2007: Mitigation. Contri-
bution of Working group III to the Fourth Assessment Report of the Intergovern-
mental Panel on Climate Change. B. Metz, O. R. Davidson, P. R. Bosch, R. Dave,
L. A. Meyer, (eds.), Cambridge University Press, Cambridge, UK and New York,
USA, pp. 497 – 540.
Smith P�, D� Martino, Z� Cai, D� Gwary, H� Janzen, P� Kumar, B� McCarl, S� Ogle,
F� O’Mara, C� Rice, B� Scholes, O� Sirotenko, M� Howden, T� McAllister, G�
Pan, V� Romanenkov, U� Schneider, S� Towprayoon, M� Wattenbach, and
J� Smith (2008)� Greenhouse gas mitigation in agriculture. Philosophical
Transactions of the Royal Society B: Biological Sciences 363, 789 – 813. doi:
10.1098 / rstb.2007.2184, ISSN: 0962-8436, 1471 – 2970.
Smith K� A�, A� R� Mosier, P� J� Crutzen, and W� Winiwarter (2012c)� The role
of N
2
O derived from crop-based biofuels, and from agriculture in general, in
Earth’s climate. Philosophical Transactions of the Royal Society B: Biological
Sciences 367, 1169 – 1174. doi: 10.1098 / rstb.2011.0313, ISSN: 0962-8436,
1471 – 2970.
Smith P�, and J� E� Olesen (2010)� Synergies between the mitigation of, and adap-
tation to, climate change in agriculture. Journal of Agricultural Science 148,
543 – 552. Available at: http: / / journals.cambridge.org / production / action / cjoGe
tFulltext?fulltextid=7796512.
Smith P�, D� S� Powlson, J� U� Smith, P� Falloon, and K� Coleman (2000)� Meeting
Europe’s climate change commitments: quantitative estimates of the potential
for carbon mitigation by agriculture. Global Change Biology 6, 525 – 539. doi:
10.1046 / j.1365 - 2486.2000.00331.x, ISSN: 1365-2486.
Smith K� A�, and T� D� Searchinger (2012)� Crop-based biofuels and associated
environmental concerns. GCB Bioenergy 4, 479 – 484. doi: 10.1111 / j.1757 - 1707
.2012.01182.x, ISSN: 1757-1707.
Smith L�, and M� Torn (2013)� Ecological limits to terrestrial biological carbon
dioxide removal. Climatic Change 118, 89 – 103. doi: 10.1007 / s10584 - 012 - 06
82 - 3, ISSN: 0165-0009.
Smith P�, and E� Trines (2006)� COMMENTARY: Agricultural measures for mitigat-
ing climate change: will the barriers prevent any benefits to developing coun-
tries? International Journal of Agricultural Sustainability 4, 173 – 175.
Smith P�, and E� Wollenberg (2012)� Achieving mitigation through synergies with
adaptation. In: Climate Change Mitigation and Agriculture. E. Wollenberg, A.
Nihart, M. Tapio-Biström, M. Grieg-Gran, (eds.), Earthscan, London, UK, pp.
50 – 57.
Smith W� K�, M� Zhao, and S� W� Running (2012d)� Global Bioenergy Capac-
ity as Constrained by Observed Biospheric Productivity Rates. BioScience 62,
911 – 922. doi: 10.1525 / bio.2012.62.10.11, ISSN: 0006-3568, 1525 – 3244.
Sneddon C�, R� B� Howarth, and R� B� Norgaard (2006)� Sustainable development
in a post-Brundtland world. Ecological Economics 57, 253 – 268.
Snyder C� S�, T� W� Bruulsema, and T� L� Jensen (2007)� Greenhouse Gas Emissions
from Cropping Systems and the Influence of Fertilizer Management. Interna-
tional Plant Nutrition Institute, Norcross, Georgia, USA, 36 pp. Available at:
http: / / npg.ipni.net / article / NPG-3004.
Soares-Filho B�, P� Moutinho, D� Nepstad, A� Anderson, H� Rodrigues, R� Garcia,
L� Dietzsch, F� Merry, M� Bowman, L� Hissa, R� Silvestrini, and C� Maretti
(2010)� Role of Brazilian Amazon protected areas in climate change mitigation.
Proceedings of the National Academy of Sciences 107, 10821 – 10826. Avail-
able at: http: / / www. pnas. org / content / 107 / 24 / 10821.short.
Sochacki S� J�, R� J� Harper, and K� R� J� Smettem (2012)� Bio-mitigation of car-
bon following afforestation of abandoned salinized farmland. GCB Bioenergy 4,
193 – 201. doi: 10.1111 / j.1757 - 1707.2011.01139.x, ISSN: 17571693.
Sochacki S� J�, R� J� Harper, K� R� J� Smettem, B� Dell, and H� Wu (2013)� Evalu-
ating a sustainability index for nutrients in a short rotation energy cropping
system. GCB Bioenergy 5, 315 – 326. doi: 10.1111 / j.1757 - 1707.2012.01202.x,
ISSN: 1757-1707.
Sohi S� P� (2012)� Carbon storage with benefits. Science 338, 1034 – 1035.
Sohngen B�, and R� Sedjo (2006)� Carbon Sequestration in Global Forests Under
Different Carbon Price Regimes. The Energy Journal 27, 109. Available at:
http: / / www. iaee. org / en / publications / ejarticle.aspx?id=2188.
Solli C�, M� Reenaas, A� Strømman, and E� Hertwich (2009)� Life cycle assess-
ment of wood-based heating in Norway. The International Journal of Life Cycle
Assessment 14, 517 – 528. doi: 10.1007 / s11367 - 009 - 0086 - 4, ISSN: 0948-3349.
Sood K� K�, and C� P� Mitchell (2011)� Household level domestic fuel consump-
tion and forest resource in relation to agroforestry adoption: Evidence against
need-based approach. Biomass and Bioenergy 35, 337 – 345. Available at:
http: / / www. sciencedirect. com / science / article / pii / S0961953410003028.
Souza S� P�, M� T� de Ávila, and S� Pacca (2012a)� Life cycle assessment of sugar-
cane ethanol and palm oil biodiesel joint production. Biomass and Bioenergy
44, 70 – 79. doi: 10.1016 / j.biombioe.2012.04.018, ISSN: 0961-9534.

917917
Agriculture, Forestry and Other Land Use (AFOLU)
11
Chapter 11
Souza H� N� de, R� G� M� de Goede, L� Brussaard, I� M� Cardoso, E� M� G� Duarte,
R� B� A� Fernandes, L� C� Gomes, and M� M� Pulleman (2012b)� Protec-
tive shade, tree diversity and soil properties in coffee agroforestry systems in
the Atlantic Rainforest biome. Agriculture, Ecosystems & Environment 146,
179 – 196. doi: 10.1016 / j.agee.2011.11.007, ISSN: 01678809.
Sow M�, C� Hély, C� Mbow, and B� Sambou (2013)� Fuel and fire behavior analy-
sis for early-season prescribed fire planning in Sudanian and Sahelian savannas.
Journal of Arid Environments 89, 84 – 93. doi: 10.1016 / j.jaridenv.2012.09.007,
ISSN: 01401963.
Sparovek G�, G� Berndes, A� Egeskog, F� L� M� de Freitas, S� Gustafsson, and J�
Hansson (2007)� Sugarcane ethanol production in Brazil: an expansion model
sensitive to socioeconomic and environmental concerns. Biofuels, Bioproducts
and Biorefining 1, 270 – 282. doi: 10.1002 / bbb.31, ISSN: 1932-1031.
Spath P� L�, and M� K� Mann (2004)� Biomass Power and Conventional Fossil Sys-
tems with and without CO
2
Sequestration — Comparing the Energy Balance,
Greenhouse Gas Emissions and Economics. National Renewable Energy Labora-
tory (NREL), Golden, CO., 38 pp. Available at: http: / / www. nrel. gov / docs / fy04o-
sti / 32575.pdf.
Sperling F�, C� Validivia, R� Quiroz, R� Valdivia, L� Angulo, A� Seimon, and I�
Noble (2008)� Transitioning to Climate Resilient Development: Perspectives
from Communities in Peru. The World Bank, Washington, D. C., 103 pp.
Spokas K� A� (2013)� Impact of biochar field aging on laboratory greenhouse gas
production potentials. GCB Bioenergy 5, 165 – 176. doi: 10.1111 / gcbb.12005,
ISSN: 17571693.
Steenblik R� (2007)� Biofuels — At What Cost? Government Support for Ethanol
in Selected OECD. International Institute for Sustainable Development, Win-
nipeg, Canada, 82 pp. Available at: http: / / www. iisd. org / publications / pub.
aspx?id=895.
Stehfest E�, L� Bouwman, D� P� Vuuren, M� G� J� Elzen, B� Eickhout, and P� Kabat
(2009)� Climate benefits of changing diet. Climatic Change 95, 83 – 102. doi:
10.1007 / s10584 - 008 - 9534 - 6, ISSN: 0165-0009, 1573 – 1480.
Steiner C�, K� C� Das, N� Melear, and D� Lakly (2010)� Reducing Nitrogen Loss
during Poultry Litter Composting Using Biochar. Journal of Environment Quality
39, 1236. doi: 10.2134 / jeq2009.0337, ISSN: 1537-2537.
Steinfeld H�, P� Gerber, T� Wassenaar, V� Castel, M� Rosales, and C� de Haan
(2008)� Livestock’s Long Shadow. Environmental Issues and Options. Food and
Agriculture Organization of the United Nations (FAO), Rome, 416 pp. Available
at: http: / / www. fao. org / docrep / 010 / a0701e / a0701e00.HTM.
Steinfeld H�, H� A� Mooney, F� Schneider, and L� E� Neville (Eds.) (2010)� Live-
stock in a Changing Landscape: Drivers, Consequences, and Responses. Island
Press, Washington, DC, 416 pp. ISBN: ISBN-13: 9781597266703.
Stephenson A� L�, P� Dupree, S� A� Scott, and J� S� Dennis (2010)� The environmen-
tal and economic sustainability of potential bioethanol from willow in the UK.
Bioresource Technology 101, 9612 – 9623. doi: 10.1016 / j.biortech.2010.07.104,
ISSN: 0960-8524.
Sterner M�, and U� Fritsche (2011)� Greenhouse gas balances and mitigation
costs of 70 modern Germany-focused and 4 traditional biomass pathways
including land-use change effects. Biomass and Bioenergy 35, 4797 – 4814. doi:
10.1016 / j.biombioe.2011.08.024, ISSN: 0961-9534.
Stevenson B� A�, R� L� Parfitt, L� A� Schipper, W� T� Baisden, and P� Mudge (2010)�
Relationship between soil delta(15)N, C / N and N losses across land uses in New
Zealand. Agriculture Ecosystems & Environment 139, 736 – 741. doi: 10.1016 / j.
agee.2010.10.020, ISSN: 0167-8809.
Stickler C� M�, D� C� Nepstad, M� T� Coe, D� G� McGRATH, H� O� Rodrigues, W� S�
Walker, B� S� Soares-Filho, and E� A� Davidson (2009)� The potential eco-
logical costs and cobenefits of REDD: a critical review and case study from the
Amazon region. Global Change Biology 15, 2803 – 2824. doi: 10.1111 / j.1365 - 2
486.2009.02109.x, ISSN: 1365-2486.
Stocker B� D�, K� Strassmann, and F� Joos (2011)� Sensitivity of Holocene
atmospheric CO
2
and the modern carbon budget to early human land
use: analyses with a process-based model. Biogeosciences 8, 69 – 88. doi:
10.5194 / bg-8 - 69 - 2011, ISSN: 1726-4170.
Strassburg B� B� N�, A� S� L� Rodrigues, M� Gusti, A� Balmford, S� Fritz, M� Ober-
steiner, R� K� Turner, and T� M� Brooks (2012)� Impacts of incentives to reduce
emissions from deforestation on global species extinctions. Nature Climate
Change 2, 350 – 355. doi: 10.1038 / nclimate1375, ISSN: 1758-678X.
Strassburg B�, K� Turner, B� Fisher, R� Schaeffer, and A� Lovett (2008)� An Empir-
ically-Derived Mechanism of Combined Incentives to Reduce Emissions from
Deforestation. Centre for Social and Economic Research on the Global Environ-
ment, Norwich, UK, 1 – 42 pp. Available at: https: / / ueaeprints.uea.ac.uk / 24686 / .
Strassburg B�, R� K� Turner, B� Fisher, R� Schaeffer, and A� Lovett (2009)� Reduc-
ing emissions from deforestation — The “combined incentives” mechanism
and empirical simulations. Global Environmental Change 19, 265 – 278. doi:
10.1016 / j.gloenvcha.2008.11.004, ISSN: 09593780.
Stratton R� W�, H� M� Wong, and J� I� Hileman (2011)� Quantifying Variability in
Life Cycle Greenhouse Gas Inventories of Alternative Middle Distillate Trans-
portation Fuels. Environmental Science & Technology 45, 4637 – 4644. doi:
10.1021 / es102597f, ISSN: 0013-936X.
Streck C� (2012)� Financing REDD+: matching needs and ends. Current Opinion in
Environmental Sustainability 4, 628 – 637. doi: 10.1016 / j.cosust.2012.10.001,
ISSN: 1877-3435.
Stromberg P�, and A� Gasparatos (2012)� Biofuels at the confluence of energy
security, rural development and food security: a developing country perspec-
tive. In: Socio-economic and environmental impacts of biofuels. Evidence from
developing countries. Cambridge University Press, Cambridge, UK and New
York, USA, pp. 1 – 375.
Stupak I�, B� Lattimore, B� D� Titus, and C� Tattersall Smith (2011)� Criteria and
indicators for sustainable forest fuel production and harvesting: A review of
current standards for sustainable forest management. Biomass and Bioenergy
35, 3287 – 3308. doi: 10.1016 / j.biombioe.2010.11.032, ISSN: 09619534.
Sumathi S�, S� P� Chai, and A� R� Mohamed (2008)� Utilization of oil palm as a
source of renewable energy in Malaysia. Renewable and Sustainable Energy
Reviews 12, 2404 – 2421. doi: 10.1016 / j.rser.2007.06.006, ISSN: 1364-0321.
Sun A�, R� Davis, M� Starbuck, A� Ben-Amotz, R� Pate, and P� T� Pienkos
(2011)� Comparative cost analysis of algal oil production for biofuels. Energy
36, 5169 – 5179. Available at: http: / / www. sciencedirect. com / science / arti-
cle / pii / S0360544211003975.
Sunde K�, A� Brekke, and B� Solberg (2011)� Environmental Impacts and Costs of
Hydrotreated Vegetable Oils, Transesterified Lipids and Woody BTL — A Review.
Energies 4, 845 – 877. ISSN: 1996-1073.
Sunderlin W� D�, A� Angelsen, B� Belcher, P� Burgers, R� Nasi, L� Santoso, and
S� Wunder (2005)� Livelihoods, forests, and conservation in developing coun-
tries: An Overview. World Development 33, 1383 – 1402. doi: 10.1016 / j.world-
dev.2004.10.004, ISSN: 0305-750X.

918918
Agriculture, Forestry and Other Land Use (AFOLU)
11
Chapter 11
Sundrum A� (2001)� Organic livestock farming: A critical review. Livestock Produc-
tion Science 67, 207 – 215. doi: 10.1016 / S0301 - 6226(00)00188 - 3, ISSN: 0301-
6226.
Swann A�, I� Fung, and J� Chiang (2011)� Mid-latitude afforestation shifts general
circulation and tropical precipitation. PNAS.
Swann A� L�, I� Y� Fung, S� Levis, G� B� Bonan, and S� C� Doney (2010)� Changes in
Arctic vegetation amplify high-latitude warming through the greenhouse effect.
Proceedings of the National Academy of Sciences 107, 1295.
Swingland I� R�, E� C� Bettelheim, J� Grace, G� T� Prance, and L� S� Saunders
(2002)� Carbon, biodiversity, conservation and income: an analysis of a free-
market approach to land-use change and forestry in developing and developed
countries. Philosophical Transactions of the Royal Society of London Series
a-Mathematical Physical and Engineering Sciences 360, 1563 – 1565. ISSN:
1364-503X.
Taghizadeh-Toosi A�, T� J� Clough, L� M� Condron, R� R� Sherlock, C� R� Anderson,
and R� A� Craigie (2011)� Biochar Incorporation into Pasture Soil Suppresses in
situ Nitrous Oxide Emissions from Ruminant Urine Patches. Journal of Environ-
ment Quality 40, 468. doi: 10.2134 / jeq2010.0419, ISSN: 1537-2537.
Taheripour F�, T� W� Hertel, and W� E� Tyner (2011)� Implications of biofuels man-
dates for the global livestock industry: a computable general equilibrium analy-
sis. Agricultural Economics 42, 325 – 342. doi: 10.1111 / j.1574 - 0862.2010.0051
7.x, ISSN: 1574-0862.
Takimoto, A�, Nair, P� K� R�, Nair, and V� D� (2008)� Carbon stock and sequestration
potential of traditional and improved agroforestry systems in the West African
Sahel. Agriculture, Ecosystems and Environment, 159 – 166.
Talens Peiró L�, L� Lombardi, G� Villalba Méndez, and X� Gabarrell i Durany
(2010)� Life cycle assessment (LCA) and exergetic life cycle assessment
(ELCA) of the production of biodiesel from used cooking oil (UCO). Energy 35,
889 – 893. doi: 10.1016 / j.energy.2009.07.013, ISSN: 0360-5442.
Tan K� T�, K� T� Lee, A� R� Mohamed, and S� Bhatia (2009)� Palm oil: Addressing
issues and towards sustainable development. Renewable and Sustainable
Energy Reviews 13, 420 – 427. doi: 10.1016 / j.rser.2007.10.001, ISSN: 1364-
0321.
Tanaka K�, D� J� A� Johansson, B� C� O’Neill, and J� S� Fuglestvedt (2013)� Emis-
sion metrics under the 2 °C climate stabilization target. Climatic Change 117,
933 – 941. doi: 10.1007 / s10584 - 013 - 0693 - 8, ISSN: 0165-0009, 1573 – 1480.
Tarnocai C� (2006)� The effect of climate change on carbon in Canadian peatlands.
Global and Planetary Change 53, 222 – 232.
Tavoni M�, and R� Socolow (2013)� Modeling meets science and technology: an
introduction to a special issue on negative emissions. Climatic Change 118,
1 – 14. doi: 10.1007 / s10584 - 013 - 0757 - 9, ISSN: 0165-0009.
Thamsiriroj T�, and J� D� Murphy (2011)� The impact of the life cycle analysis meth-
odology on whether biodiesel produced from residues can meet the EU sustain-
ability criteria for biofuel facilities constructed after 2017. Renewable Energy
36, 50 – 63. doi: 10.1016 / j.renene.2010.05.018, ISSN: 0960-1481.
Thomas S�, P� Dargusch, S� Harrison, and J� Herbohn (2010)� Why are there so
few afforestation and reforestation Clean Development Mechanism projects?
Land Use Policy 27, 880 – 887. Available at: http: / / www. sciencedirect. com / sci-
ence / article / pii / S026483770900204X.
Thomassen M� A�, R� Dalgaard, R� Heijungs, and I� de Boer (2008)� Attributional
and consequential LCA of milk production. The International Journal of Life
Cycle Assessment 13, 339 – 349. doi: 10.1007 / s11367 - 008 - 0007-y, ISSN: 0948-
3349, 1614 – 7502.
Thompson M� C�, M� Baruah, and E� R� Carr (2011a)� Seeing REDD+ as a project
of environmental governance. Environmental Science & Policy 14, 100 – 110.
doi: 10.1016 / j.envsci.2010.11.006, ISSN: 1462-9011.
Thompson I�, B� Mackey, S� McNulty, and A� Mosseler (2009)� Forest Resil-
ience, Biodiversity, and Climate Change: A Synthesis of the Biodiversity / Resil-
ience / Stability Relationship in Forest Ecosystems. Secretariat of the Convention
on Biological Diversity, Montreal, Canada, 67 pp. Available at: http: / / www.
cakex. org / virtual-library / 1233.
Thompson W�, J� Whistance, and S� Meyer (2011b)� Effects of US biofuel policies
on US and world petroleum product markets with consequences for greenhouse
gas emissions. Energy Policy 39, 5509 – 5518. doi: 10.1016 / j.enpol.2011.05.011,
ISSN: 0301-4215.
Thornton P� K�, and M� Herrero (2010)� Potential for Reduced Methane and Car-
bon Dioxide Emissions from Livestock and Pasture Management in the Trop-
ics. Proceedings of the National Academy of Sciences 107, 19667 – 19672. doi:
10.1073 / pnas.0912890107, ISSN: 0027-8424, 1091 – 6490.
Throop H� L�, and S� R� Archer (2008)� Shrub (Prosopis velutina) encroachment in
a semidesert grassland: spatial – temporal changes in soil organic carbon and
nitrogen pools. Global Change Biology 14, 2420 – 2431. doi: 10.1111 / j.1365 - 24
86.2008.01650.x, ISSN: 1365-2486.
Tilman D�, C� Balzer, J� Hill, and B� L� Befort (2011)� Global food demand and the
sustainable intensification of agriculture. Proceedings of the National Academy
of Sciences 108, 20260 – 20264. doi: 10.1073 / pnas.1116437108, ISSN: 0027-
8424, 1091 – 6490.
Tilman D�, J� Hill, and C� Lehman (2006)� Carbon-Negative Biofuels from Low-
Input High-Diversity Grassland Biomass. Science 314, 1598 – 1600. doi:
10.1126 / science.1133306, ISSN: 0036-8075, 1095 – 9203.
Tilman D�, R� Socolow, J� A� Foley, J� Hill, E� Larson, L� Lynd, S� Pacala, J� Reilly,
T� Searchinger, C� Somerville, and R� Williams (2009)� Beneficial Biofuels
-The Food, Energy, and Environment Trilemma. Science 325, 270 – 271. doi:
10.1126 / science.1177970, ISSN: 0036-8075, 1095 – 9203.
Timilsina G� R�, J� C� Beghin, D� van der Mensbrugghe, and S� Mevel (2012)� The
impacts of biofuels targets on land-use change and food supply: A global CGE
assessment. Agricultural Economics 43, 315 – 332. doi: 10.1111 / j.1574 - 0862.20
12.00585.x, ISSN: 1574-0862.
Tiwary A�, and J� Colls (2010)� Mitigating secondary aerosol generation potentials
from biofuel use in the energy sector. Science of The Total Environment 408,
607 – 616. doi: 10.1016 / j.scitotenv.2009.10.019, ISSN: 0048-9697.
Townsend P� V�, R� J� Harper, P� D� Brennan, C� Dean, S� Wu, K� R� J� Smettem,
and S� E� Cook (2012)� Multiple environmental services as an opportunity for
watershed restoration. Forest Policy and Economics 17, 45 – 58.
Trabucco A�, R� J� Zomer, D� A� Bossio, O� van Straaten, and L� V� Verchot (2008)�
Climate change mitigation through afforestation / reforestation: A global analy-
sis of hydrologic impacts with four case studies. Agriculture, Ecosystems & Envi-
ronment 126, 81 – 97. doi: 10.1016 / j.agee.2008.01.015, ISSN: 0167-8809.
Tracy B� P�, S� W� Jones, A� G� Fast, D� C� Indurthi, and E� T� Papoutsakis (2012)�
Clostridia: the importance of their exceptional substrate and metabolite diver-
sity for biofuel and biorefinery applications. Current Opinion in Biotechnology
23, 364 – 381. doi: 10.1016 / j.copbio.2011.10.008, ISSN: 0958-1669.
Triantafyllidis K�, A� Lappas, and M� Stöcker (2013)� The Role of Catalysis for the
Sustainable Production of Bio-Fuels and Bio-Chemicals. Elsevier, Oxford, UK,
608 pp. ISBN: 0444563326.

919919
Agriculture, Forestry and Other Land Use (AFOLU)
11
Chapter 11
Tsao C�-C�, J� E� Campbell, M� Mena-Carrasco, S� N� Spak, G� R� Carmichael, and
Y� Chen (2012)� Increased estimates of air-pollution emissions from Brazil-
ian sugar-cane ethanol. Nature Climate Change 2, 53 – 57. doi: 10.1038 / ncli-
mate1325, ISSN: 1758-678X, 1758 – 6798.
Tubiello F� N�, A� Rahman, W� Mann, J� Schmidhuber, M� Koleva, and A� Müller
(2009)� Carbon financial mechanisms for agriculture and rural development:
challenges and opportunities along the Bali roadmap. An editorial essay. Cli-
matic Change 97, 3 – 21.
Tubiello F�, M� Salvatore, S� Rossi, and A� Ferrara (2012)� Analysis of global
emissions, carbon intensity and efficiency of food production. Energia Ambiente
e Innovazione Anno 2012, 87 – 93. Available at: http: / / www. enea. it / it / produzi-
one-scientifica / EAI / anno-2012 / n.-4 - 5-luglio-ottobre-parte-I / analysis-of-global-
emissions-carbon-intensity-and-efficiency-of-food-production.
Tubiello F� N�, M� Salvatore, S� Rossi, A� Ferrara, N� Fitton, and P� Smith (2013)�
The FAOSTAT database of greenhouse gas emissions from agriculture. Environ-
mental Research Letters 8, 1 – 11. doi: 10.1088 / 1748 - 9326 / 8 / 1 / 015009, ISSN:
1748-9326.
Turconi R�, A� Boldrin, and T� Astrup (2013)� Life cycle assessment (LCA) of
electricity generation technologies: Overview, comparability and limitations.
Renewable and Sustainable Energy Reviews 28, 555 – 565. doi: 10.1016 / j.
rser.2013.08.013, ISSN: 1364-0321.
Turkenburg W� C�, D� J� Arent, R� Bertani, A� Faaij, M� Hand, W� Krewitt, E� D� Lar-
son, J� Lund, M� Mehos, T� Merrigan, C� Mitchell, J� R� Moreira, W� Sinke, V�
Sonntag-O’Brien, B� Thresher, W� van Sark, E� Usher, and E� Usher (2012)�
Chapter 11 — Renewable Energy. In: Global Energy Assessment — Toward a
Sustainable Future.Cambridge University Press, Cambridge, UK and New York,
NY, USA and the International Institute for Applied Systems Analysis, Laxen-
burg, Austria, pp. 761 – 900. ISBN: 9781 10700 5198 HARDBACK 9780 52118
2935 PAPERBACK.
Turner B� L�, E� F� Lambin, and A� Reenberg (2007)� The emergence of land
change science for global environmental change and sustainability. Pro-
ceedings of the National Academy of Sciences 104, 20666 – 20671. doi:
10.1073 / pnas.0704119104.
Tyagi L�, B� Kumari, and S� N� Singh (2010)� Water management — A tool for
methane mitigation from irrigated paddy fields. Science of The Total Environ-
ment 408, 1085 – 1090. doi: 10.1016 / j.scitotenv.2009.09.010, ISSN: 00489697.
U� S� DOE (2011)� Billion-Ton Update: Biomass Supply for a Bioenergy and Bioprod-
ucts Industry. U. S. Department of Energy, Washington, DC, 235 pp.
U� S� EPA (2006)� Global Mitigation of Non-CO
2
Greenhouse Gases (EPA Report
430-R-06 – 005). Available at: http: / / www. epa. gov / climatechange / econom-
ics / international.html.
U� S� EPA (2011)� Draft: Global Antropogenic Non-CO
2
Greenhouse Gas Emissions:
1990 — 2030. Washington, DC, Available at: internal-pdf: / / US-EPA_NonCO2_
Projections_2011_draft-2650857473 / US-EPA_NonCO2_Projections_2011_
draft.pdf.
U� S� EPA (2013)� U. S. Environmental Protection Agency Global Emissions Database.
Global Emissions. Available at: http: / / www. epa. gov / climatechange / ghgemis-
sions / global.html.
UNCCD (2011)� UNCCD Statement at UNFCCC COP17 SBSTA, Agenda Item Three.
28 November 2011. United Nations Convention to Combat Desertification,
Bonn, 45 pp.
UNDP International Poverty Centre (2006)� What Is Poverty? Concept and Mea-
sures. United Nations Development Programme, Brasilia, Brazil, 24 pp. Available
at: www. ipc-undp. org / pub / IPCPovertyInFocus9.pdf.
UNEP (2009)� Assessing Biofuels, Towards Sustainable Production and Use of
Resources. United Nations Environment Programme (UNEP), Division of Tech-
nology, Industry and Ecocnomics, Paris, 120 pp.
UNEP-WCMC (2011)� The UK National Ecosystem Assessment: Technical Report.
UK National Ecosystem Assessment, Cambridge, UK, 6 pp. Available at:
http: / / uknea.unep-wcmc.org / Resources / tabid / 82 / Default.aspx.
UNFCCC United Nations Framework Convention on Climate Change. Available at:
http: / / unfccc.int / 2860.php.
UNFCCC — CDM CDM: CDM insights — intelligence about the CDM at the end
of each month. Available at: http: / / cdm.unfccc.int / Statistics / Public / CDMin-
sights / index.html.
Ungerer J�, L� Tao, M� Davis, M� Ghirardi, P�-C� Maness, and J� Yu (2012)� Sus-
tained photosynthetic conversion of CO
2
to ethylene in recombinant cyanobac-
terium Synechocystis 6803. Energy & Environmental Science 5, 8998 – 9006.
UN-REDD Programme UN-REDD Programme. Available at: http: / / www. un-redd.
org / .
UN-REDD Programme -- Support to Partner Countries UN-REDD Programme
-- Support to Partner Countries. Available at: http: / / www. un-redd. org / Partner_
Countries / tabid / 102663 / Default.aspx.
Ürge-Vorsatz D�, N� Eyre, P� Graham, D� Harvey, E� Hertwich, Y� Jiang, and
C� Kornevall (2012)� Towards Sustainable Energy End-Use: Buildings Chapter
10. In: Global Energy Assessment. Cambridge University Press, Cambridge, pp.
649 – 760.
Valente C�, R� Spinelli, and B� G� Hillring (2011)� LCA of environmental and socio-
economic impacts related to wood energy production in alpine conditions: Valle
di Fiemme (Italy). Journal of Cleaner Production 19, 1931 – 1938. doi: 10.1016 / j.
jclepro.2011.06.026, ISSN: 0959-6526.
VanderZaag A� C�, S� Jayasundara, and C� Wagner-Riddle (2011)� Strate-
gies to mitigate nitrous oxide emissions from land applied manure. Animal
Feed Science and Technology 166 – 167, 464 – 479. doi: 10.1016 / j.anifeed-
sci.2011.04.034, ISSN: 0377-8401.
Van de Velde L�, W� Verbeke, M� Popp, J� Buysse, and G� Van Huylenbroeck
(2009)� Perceived importance of fuel characteristics and its match with con-
sumer beliefs about biofuels in Belgium. Energy Policy 37, 3183 – 3193. doi:
10.1016 / j.enpol.2009.04.022, ISSN: 0301-4215.
Venter O�, W� F� Laurance, T� Iwamura, K� A� Wilson, R� A� Fuller, and H� P� Pos-
singham (2009)� Harnessing Carbon Payments to Protect Biodiversity. Science
326, 1368 – 1368. doi: 10.1126 / science.1180289, ISSN: 0036-8075, 1095 – 9203.
Verchot L� V�, M� Noordwijk, S� Kandji, T� Tomich, C� Ong, A� Albrecht, J� Mack-
ensen, C� Bantilan, K� V� Anupama, and C� Palm (2007)� Climate change:
linking adaptation and mitigation through agroforestry. Mitigation and Adapta-
tion Strategies for Global Change 12, 901 – 918. doi: 10.1007 / s11027 - 007 - 910
5 - 6, ISSN: 1381-2386, 1573 – 1596.
Verdonk M�, C� Dieperink, and A� P� C� Faaij (2007)� Governance of the emerging
bio-energy markets. Energy Policy 35, 3909 – 3924.
Vermeulen S� J�, B� M� Campbell, and J� S� I� Ingram (2012)� Climate Change and
Food Systems. Annual Review of Environment and Resources 37, 195 – 222. doi:
10.1146 / annurev-environ-020411 - 130608, ISSN: 1543-5938, 1545 – 2050.

920920
Agriculture, Forestry and Other Land Use (AFOLU)
11
Chapter 11
Viana K� R� O�, and R� Perez (2013)� Survey of sugarcane industry in Minas Gerais,
Brazil: Focus on sustainability. Biomass and Bioenergy 58, 149 – 157. doi:
10.1016 / j.biombioe.2013.08.006, ISSN: 0961-9534.
Villamor G� B�, M� van Noordwijk, Q� B� Le, B� Lusiana, R� Matthews, and P� L� G�
Vlek (2011)� Diversity deficits in modelled landscape mosaics. Ecological Infor-
matics 6, 73 – 82. doi: 10.1016 / j.ecoinf.2010.08.003, ISSN: 1574-9541.
Visseren-Hamakers I� J�, C� McDermott, M� J� Vijge, and B� Cashore (2012)�
Trade-offs, co-benefits and safeguards: current debates on the breadth of
REDD+. Current Opinion in Environmental Sustainability 4, 646 – 653. doi:
10.1016 / j.cosust.2012.10.005, ISSN: 1877-3435.
Vlek C� (2004)� Environmental Versus Individual Risk Taking: Perception, Deci-
sion, Behavior. In: Encyclopedia of Applied Psychology. Elsevier, New York, pp.
825 – 840. ISBN: 978 - 0-12 - 657410 - 4.
Vlek C�, and G� Keren (1992)� Behavioral decision theory and environmental risk
management: Assessment and resolution of four “survival” dilemmas. Acta
Psychologica 80, 249 – 278. doi: 10.1016 / 0001 - 6918(92)90050-N, ISSN: 0001-
6918.
Van Vliet O�, M� van den Broek, W� Turkenburg, and A� Faaij (2011a)� Combin-
ing hybrid cars and synthetic fuels with electricity generation and carbon cap-
ture and storage. Energy Policy 39, 248 – 268. doi: 10.1016 / j.enpol.2010.09.038,
ISSN: 0301-4215.
Van Vliet O�, A� S� Brouwer, T� Kuramochi, M� van den Broek, and A� Faaij
(2011b)� Energy use, cost and CO
2
emissions of electric cars. Journal of Power
Sources 196, 2298 – 2310. doi: 10.1016 / j.jpowsour.2010.09.119, ISSN: 0378-
7753.
Van Vliet O� P�, A� P� Faaij, and W� C� Turkenburg (2009)� Fischer – Tropsch diesel
production in a well-to-wheel perspective: a carbon, energy flow and cost anal-
ysis. Energy Conversion and Management 50, 855 – 876.
Van der Voet E�, R� J� Lifset, and L� Luo (2010)� Life-cycle assessment of biofu-
els, convergence and divergence. Biofuels 1, 435 – 449. doi: 10.4155 / bfs.10.19,
ISSN: 1759-7269, 1759 – 7277.
De Vries M�, and I� J� M� de Boer (2010)� Comparing environmental impacts for
livestock products: A review of life cycle assessments. Livestock Science 128,
1 – 11. doi: 10.1016 / j.livsci.2009.11.007, ISSN: 1871-1413.
Van Vuuren D� P�, J� van Vliet, and E� Stehfest (2009)� Future bio-energy poten-
tial under various natural constraints. Energy Policy 37, 4220 – 4230. doi: 16 / j.
enpol.2009.05.029, ISSN: 0301-4215.
Waghorn G� (2008)� Beneficial and detrimental effects of dietary condensed tan-
nins for sustainable sheep and goat production – Progress and challenges. Ani-
mal Feed Science and Technology 147, 116 – 139.
Waghorn G� C�, and R� S� Hegarty (2011)� Lowering ruminant methane emissions
through improved feed conversion efficiency. Animal Feed Science and Tech-
nology 166 – 167, 291 – 301. doi: 10.1016 / j.anifeedsci.2011.04.019, ISSN: 0377-
8401.
Walter A�, P� Dolzan, O� Quilodrán, J� G� de Oliveira, C� da Silva, F� Piacente,
and A� Segerstedt (2011)� Sustainability assessment of bio-ethanol produc-
tion in Brazil considering land use change, GHG emissions and socio-economic
aspects. Energy Policy 39, 5703 – 5716. doi: 10.1016 / j.enpol.2010.07.043, ISSN:
0301-4215.
Wang M� Q�, J� Han, Z� Haq, W� E� Tyner, M� Wu, and A� Elgowainy (2011a)�
Energy and greenhouse gas emission effects of corn and cellulosic ethanol with
technology improvements and land use changes. Biomass and Bioenergy 35,
1885 – 1896. doi: 10.1016 / j.biombioe.2011.01.028, ISSN: 0961-9534.
Wang M�, H� Huo, and S� Arora (2011b)� Methods of dealing with co-products of
biofuels in life-cycle analysis and consequent results within the U. S. context.
Energy Policy 39, 5726 – 5736. doi: 10.1016 / j.enpol.2010.03.052, ISSN: 0301-
4215.
Wang L�, J� Littlewood, and R� J� Murphy (2013a)� Environmental sustainability
of bioethanol production from wheat straw in the UK. Renewable and Sus-
tainable Energy Reviews 28, 715 – 725. doi: 10.1016 / j.rser.2013.08.031, ISSN:
1364-0321.
Wang X�, O� R� Masera, K� Troncoso, M� X� Rivera, and J� Franco (2013b)�
What Have We Learned about Household Biomass Cooking in Central Amer-
ica? The World Bank, 1 – 134 pp. Available at: http: / / documents.worldbank.
org / curated / en / 2013 / 01 / 17524967 / learned-household-biomass-cooking-cen-
tral-america.
Wang Y�, P� Yu, K�-H� Feger, X� Wei, G� Sun, M� Bonell, W� Xiong, S� Zhang, and
L� Xu (2011c)� Annual runoff and evapotranspiration of forestlands and non-
forestlands in selected basins of the Loess Plateau of China. Ecohydrology 4,
277 – 287. doi: 10.1002 / eco.215, ISSN: 19360584.
Warner E�, Y� Zhang, D� Inman, and G� Heath (2013)� Challenges in the estima-
tion of greenhouse gas emissions from biofuel-induced global land-use change.
Biofuels, Bioproducts and Biorefining 8, 114 – 125. doi: 10.1002 / bbb.1434, ISSN:
1932-1031.
WBGU (2009)� Future Bioenergy and Sustainable Land Use. Earthscan, London, 393
pp.
WBGU (2011)� Welt Im Wandel. Gesellschaftsvertrag Für Eine Große Transforma-
tion. Wissenschaftlicher Beirat Globale Umweltveränderungen (WBGU), Berlin,
421 pp. ISBN: 978 - 3-936191 - 46 - 2.
Van der Werf G� R�, J� T� Randerson, L� Giglio, G� J� Collatz, P� S� Kasibhatla, A� F�
Arellano Jr, and others (2006)� Interannual variability of global biomass
burning emissions from 1997 to 2004. Atmospheric Chemistry and Physics
Discussions 6, 3175 – 3226. Available at: http: / / hal.archives-ouvertes.fr / hal-
00301203 / .
Van der Werf G� R�, J� T� Randerson, L� Giglio, G� J� Collatz, M� Mu, P� S� Kasib-
hatla, D� C� Morton, R� S� DeFries, Y� Jin, and T� T� van Leeuwen (2010)�
Global fire emissions and the contribution of deforestation, savanna, forest,
agricultural, and peat fires (1997 – 2009). Atmospheric Chemistry and Physics
10, 11707 – 11735. doi: 10.5194 / acp-10 - 11707 - 2010, ISSN: 1680-7316.
Werner F�, R� Taverna, P� Hofer, E� Thürig, and E� Kaufmann (2010)� National
and global greenhouse gas dynamics of different forest management and wood
use scenarios: a model-based assessment. Environmental Science & Policy 13,
72 – 85. doi: 10.1016 / j.envsci.2009.10.004, ISSN: 1462-9011.
West P� C�, H� K� Gibbs, C� Monfreda, J� Wagner, C� C� Barford, S� R� Carpenter,
and J� A� Foley (2010a)� Trading carbon for food: Global comparison of carbon
stocks vs. crop yields on agricultural land. Proceedings of the National Academy
of Sciences 107, 19645 – 19648. doi: 10.1073 / pnas.1011078107, ISSN: 0027-
8424, 1091 – 6490.
West P� C�, G� T� Narisma, C� C� Barford, C� J� Kucharik, and J� A� Foley (2010b)� An
alternative approach for quantifying climate regulation by ecosystems. Frontiers
in Ecology and the Environment 9, 126 – 133.
Whitaker J�, K� E� Ludley, R� Rowe, G� Taylor, and D� C� Howard (2010)� Sources
of variability in greenhouse gas and energy balances for biofuel production: a
systematic review. GCB Bioenergy 2, 99 – 112. doi: 10.1111 / j.1757 - 1707.2010.
01047.x, ISSN: 1757-1707.

921921
Agriculture, Forestry and Other Land Use (AFOLU)
11
Chapter 11
Whitehead P�, P� Purdon, J� Russel-Smith, P� M� Cooke, and S� Sutton (2008)�
The management of climate change through prescribed Savanna burning:
Emerging contributions of indigenous people in Northern Australia. Public
Administration and Development Special Issue: Symposium on Climate Change,
Governance and Environmental Services 28, 374 – 385.
Whittaker C�, N� Mortimer, R� Murphy, and R� Matthews (2011)� Energy and
greenhouse gas balance of the use of forest residues for bioenergy produc-
tion in the UK. Biomass and Bioenergy 35, 4581 – 4594. doi: 10.1016 / j.biom-
bioe.2011.07.001, ISSN: 0961-9534.
Wicke B�, V� Dornburg, M� Junginger, and A� Faaij (2008)� Different palm oil
production systems for energy purposes and their greenhouse gas implications.
Biomass and Bioenergy 32, 1322 – 1337.
Wicke B�, R� Sikkema, V� Dornburg, and A� Faaij (2011a)� Exploring land use
changes and the role of palm oil production in Indonesia and Malaysia. Land
Use Policy 28, 193 – 206. doi: 10.1016 / j.landusepol.2010.06.001, ISSN: 0264-
8377.
Wicke B�, E� M� W� Smeets, R� Akanda, L� Stille, R� K� Singh, A� R� Awan, K� Mah-
mood, and A� P� C� Faaij (2013)� Biomass production in agroforestry and
forestry systems on salt-affected soils in South Asia: Exploration of the GHG
balance and economic performance of three case studies. Journal of Environ-
mental Management 127, 324 – 334. doi: 10.1016 / j.jenvman.2013.05.060,
ISSN: 0301-4797.
Wicke B�, E� Smeets, V� Dornburg, B� Vashev, T� Gaiser, W� Turkenburg, and A�
Faaij (2011b)� The global technical and economic potential of bioenergy from
salt-affected soils. Energy & Environmental Science 4, 2669 – 2681.
Wicke B�, E� Smeets, A� Tabeau, J� Hilbert, and A� Faaij (2009)� Macroeconomic
impacts of bioenergy production on surplus agricultural land — A case study
of Argentina. Renewable and Sustainable Energy Reviews 13, 2463 – 2473. doi:
16 / j.rser.2009.05.010, ISSN: 1364-0321.
Wicke B�, E� Smeets, H� Watson, and A� Faaij (2011c)� The current bioenergy pro-
duction potential of semi-arid and arid regions in sub-Saharan Africa. Biomass
and Bioenergy 35, 2773 – 2786. doi: 10.1016 / j.biombioe.2011.03.010, ISSN:
0961-9534.
Wicke B�, P� Verweij, H� van Meijl, D� P� van Vuuren, and A� P� Faaij (2012)� Indi-
rect land use change: review of existing models and strategies for mitigation.
Biofuels 3, 87 – 100. doi: 10.4155 / bfs.11.154, ISSN: 1759-7269, 1759 – 7277.
Wilkinson J�, and S� Herrera (2010)� Biofuels in Brazil: debates and impacts. Jour-
nal of Peasant Studies 37, 749 – 768.
Williams J�, and P� J� Crutzen (2010)� Nitrous oxide from aquaculture. Nature
Geoscience 3, 143 – 143. Available at: http: / / www. nature. com / ngeo / jour-
nal / vaop / ncurrent / full / ngeo804.html.
Williams R� H�, G� Liu, T� G� Kreutz, and E� D� Larson (2011)� Coal and Bio-
mass to Fuels and Power. Annual Review of Chemical and Biomolecu-
lar Engineering 2, 529 – 553. Available at: http: / / www. annualreviews.
org / doi / abs / 10.1146 / annurev-chembioeng-061010 - 114126.
Wilson T� O�, F� M� McNeal, S� Spatari, D� G� Abler, and P� R� Adler (2011)� Den-
sified biomass can cost-effectively mitigate greenhouse gas emissions and
address energy security in thermal applications. Environmental Science & Tech-
nology 46, 1270 – 1277. doi: 10.1021 / es202752b, ISSN: 0013-936X.
Wirsenius S� (2003)� Efficiencies and biomass appropriation of food commodities
on global and regional levels. Agricultural Systems 77, 219 – 255. doi: 10.1016 /
S0308 - 521X(02)00188 - 9, ISSN: 0308-521X.
Wirsenius S�, F� Hedenus, and K� Mohlin (2011)� Greenhouse gas taxes on animal
food products: rationale, tax scheme and climate mitigation effects. Climatic
Change 108, 159 – 184. doi: 10.1007 / s10584 - 010 - 9971-x, ISSN: 0165-0009,
1573 – 1480.
Wise M�, K� Calvin, A� Thomson, L� Clarke, B� Bond-Lamberty, R� Sands, S� J�
Smith, A� Janetos, and J� Edmonds (2009)� Implications of Limiting CO
2
Concentrations for Land Use and Energy. Science 324, 1183 – 1186. doi:
10.1126 / science.1168475, ISSN: 0036-8075, 1095 – 9203.
Wiskerke W� T�, V� Dornburg, C� D� K� Rubanza, R� E� Malimbwi, and A� P� C�
Faaij (2010)� Cost / benefit analysis of biomass energy supply options for rural
smallholders in the semi-arid eastern part of Shinyanga Region in Tanzania.
Renewable and Sustainable Energy Reviews 14, 148 – 165. doi: 10.1016 / j.
rser.2009.06.001, ISSN: 1364-0321.
De Wit M�, M� Junginger, and A� Faaij (2013)� Learning in dedicated wood pro-
duction systems: Past trends, future outlook and implications for bioenergy.
Renewable and Sustainable Energy Reviews 19, 417 – 432. doi: 10.1016 / j.
rser.2012.10.038, ISSN: 1364-0321.
De Wit M�, M� Londo, and A� Faaij (2011)� Productivity developments in European
agriculture: Relations to and opportunities for biomass production. Renewable
and Sustainable Energy Reviews 15, 2397 – 2412. doi: 16 / j.rser.2011.02.022,
ISSN: 1364-0321.
Witt G� B�, R� A� Harrington, and M� J� Page (2009)� Is “vegetation thickening”
occurring in Queensland’s mulga lands — a 50-year aerial photographic analy-
sis. Australian Journal of Botany 57, 572 – 582. Available at: http: / / dx.doi.
org / 10.1071 / BT08217.
Wollenberg, E�, Nihart, A�, Tapio-Bistrom, M-L�, Grieg-Gran, and M� (2012)�
Climate Change Mitigation and Agriculture. Earthscan, London, UK, 419 pp.
Woods J�, A� Williams, J� K� Hughes, M� Black, and R� Murphy (2010)� Energy
and the food system. Philosophical Transactions of the Royal Society B: Biologi-
cal Sciences 365, 2991 – 3006. doi: 10.1098 / rstb.2010.0172.
Woods, M� C�, and etal� (2007)� Cost and Performance Baseline for Fossil Energy
Plants: Volume 1: Bituminous Coal and Natural Gas to Electricity. National
Energy Technology Laboratory (NETL), Department of Energy (DOE), Washing-
ton, D. C., USA., 626 pp.
Woolf D�, J� E� Amonette, F� A� Street-Perrott, J� Lehmann, and S� Joseph (2010)�
Sustainable biochar to mitigate global climate change. Nature Communications
1, 1 – 9. doi: 10.1038 / ncomms1053, ISSN: 2041-1723.
Wright A�-D� G�, and A� V� Klieve (2011)� Does the complexity of the rumen micro-
bial ecology preclude methane mitigation? Animal Feed Science and Technol-
ogy 166 – 67, 248 – 253. doi: 10.1016 / j.anifeedsci.2011.04.015, ISSN: 0377-
8401.
Wu C�, and L� Lin (2009)� Guest editorial. Biotechnology Advances 27, 541. doi:
10.1016 / j.biotechadv.2009.04.018, ISSN: 0734-9750.
Wünscher T�, and S� Engel (2012)� International payments for biodiversity services:
Review and evaluation of conservation targeting approaches. Biological Con-
servation 152, 222 – 230. doi: 10.1016 / j.biocon.2012.04.003, ISSN: 0006-3207.
Ximenes F� de A�, B� H� George, A� Cowie, J� Williams, and G� Kelly (2012)�
Greenhouse Gas Balance of Native Forests in New South Wales, Australia. For-
ests 3, 653 – 683. doi: 10.3390 / f3030653.
Ximenes F� A�, and T� Grant (2013)� Quantifying the greenhouse benefits of the
use of wood products in two popular house designs in Sydney, Australia. The
International Journal of Life Cycle Assessment 18, 891 – 908. doi: 10.1007 / s113
67 - 012 - 0533 - 5, ISSN: 0948-3349, 1614 – 7502.

922922
Agriculture, Forestry and Other Land Use (AFOLU)
11
Chapter 11
Yagi K�, H� Tsuruta, and K� Minami (1997)� Possible options for mitigating methane
emission from rice cultivation. Nutrient Cycling in Agroecosystems 49, 213 – 220.
Available at: http: / / link.springer.com / article / 10.1023 / A:1009743909716.
Yan X�, H� Akiyama, K� Yagi, and H� Akimoto (2009)� Global estimations of the
inventory and mitigation potential of methane emissions from rice cultivation
conducted using the 2006 Intergovernmental Panel on Climate Change Guide-
lines. Global Biogeochemical Cycles 23, 3 – 25. doi: 10.1029 / 2008GB003299.
Yan T�, C� S� Mayne, F� G� Gordon, M� G� Porter, R� E� Agnew, D� C� Patter-
son, C� P� Ferris, and D� J� Kilpatrick (2010)� Mitigation of enteric methane
emissions through improving efficiency of energy utilization and productiv-
ity in lactating dairy cows. Journal of Dairy Science 93, 2630 – 2638. doi:
10.3168 / jds.2009 - 2929, ISSN: 0022-0302.
Yang Y�, J� Bae, J� Kim, and S� Suh (2012)� Replacing Gasoline with Corn Ethanol
Results in Significant Environmental Problem-Shifting. Environmental Science
and Technology 46, 3671 – 3678. doi: 10.1021 / es203641p, ISSN: 0013-936X.
Yao Z�, Z� Zhou, X� Zheng, B� Xie, B� Mei, R� Wang, K� Butterbach-Bahl, and J�
Zhu (2010)� Effects of organic matter incorporation on nitrous oxide emissions
from rice-wheat rotation ecosystems in China. Plant and Soil 327, 315 – 330.
doi: 10.1007 / s11104 - 009 - 0056 - 4, ISSN: 0032-079X, 1573 – 5036.
Yoon J� M�, L� Zhao, and J� V� Shanks (2013)� Metabolic Engineering with Plants
for a Sustainable Biobased Economy. Annual Review of Chemical and Bio-
molecular Engineering 4, 211 – 237. Available at: http: / / www. annualreviews.
org / doi / abs / 10.1146 / annurev-chembioeng-061312 - 103320.
Yu P�, Y� Wang, A� Du, W� Guan, K�-H� Feger, K� Schwärzel, M� Bonell, W� Xiong,
and S� Pan (2013)� The effect of site conditions on flow after forestation in a
dryland region of China. Agricultural and Forest Meteorology 178 – 179, 66 – 74.
doi: 10.1016 / j.agrformet.2013.02.007, ISSN: 01681923.
Zaehle S�, P� Ciais, A� D� Friend, and V� Prieur (2011)� Carbon benefits of anthro-
pogenic reactive nitrogen offset by nitrous oxide emissions. Nature Geoscience
4, 601 – 605. doi: 10.1038 / ngeo1207, ISSN: 1752-0894.
Zaks D� P� M�, C� C� Barford, N� Ramankutty, and J� A� Foley (2009)� Producer and
consumer responsibility for greenhouse gas emissions from agricultural produc-
tion — a perspective from the Brazilian Amazon. Environmental Research Let-
ters 4, 1 – 13. doi: 10.1088 / 1748 - 9326 / 4 / 4 / 044010, ISSN: 1748-9326.
Zanchi G�, N� Pena, and N� Bird (2012)� Is woody bioenergy carbon neutral? A
comparative assessment of emissions from consumption of woody bioenergy
and fossil fuel. GCB Bioenergy 4, 761 – 772. doi: 10.1111 / j.1757 - 1707.2011.01
149.x, ISSN: 1757-1707.
Zhang Y�, Y� Yu, T� Li, and B� Zou (2011)� Analyzing Chinese consumers’ percep-
tion for biofuels implementation: The private vehicles owner’s investigating
in Nanjing. Renewable and Sustainable Energy Reviews 15, 2299 – 2309. doi:
10.1016 / j.rser.2011.02.004, ISSN: 1364-0321.
Zhao M�, and S� W� Running (2010)� Drought-Induced Reduction in Global Terres-
trial Net Primary Production from 2000 Through 2009. Science 329, 940 – 943.
doi: 10.1126 / science.1192666, ISSN: 0036-8075, 1095 – 9203.
Zhao W� Z�, H� L� Xiao, Z� M� Liu, and J� Li (2005)� Soil degradation and restoration
as affected by land use change in the semiarid Bashang area, northern China.
CATENA 59, 173 – 186. doi: 10.1016 / j.catena.2004.06.004, ISSN: 03418162.
Van Zijderveld S� M�, W� J� J� Gerrits, J� A� Apajalahti, J� R� Newbold, J� Dijkstra,
R� A� Leng, and H� B� Perdok (2010)� Nitrate and sulfate: Effective alternative
hydrogen sinks for mitigation of ruminal methane production in sheep. Journal
of Dairy Science 93, 5856 – 5866. doi: DOI: 10.3168 / jds.2010 – 3281, ISSN: 0022-
0302.
Zimmerman A� R�, B� Gao, and M�-Y� Ahn (2011)� Positive and negative carbon
mineralization priming effects among a variety of biochar-amended soils. Soil
Biology and Biochemistry 43, 1169 – 1179. doi: 10.1016 / j.soilbio.2011.02.005,
ISSN: 0038-0717.
Ziv G�, E� Baran, S� Nam, I� Rodríguez-Iturbe, and S� A� Levin (2012)� Trad-
ing-off fish biodiversity, food security, and hydropower in the Mekong River
Basin. Proceedings of the National Academy of Sciences 109, 5609 – 5614. doi:
10.1073 / pnas.1201423109, ISSN: 0027-8424, 1091 – 6490.
Zomer R� J�, A� Trabucco, D� A� Bossio, and L� V� Verchot (2008)� Climate change
mitigation: A spatial analysis of global land suitability for clean development
mechanism afforestation and reforestation. Agriculture, Ecosystems & Environ-
ment 126, 67 – 80. doi: 10.1016 / j.agee.2008.01.014, ISSN: 0167-8809.
Van Zwieten L�, S� W� L� Kimber, S� G� Morris, B� P� Singh, P� R� Grace, C� Scheer, J�
Rust, A� E� Downie, and A� L� Cowie (2013)� Pyrolysing poultry litter reduces
N
2
O and CO
2
fluxes. Science of The Total Environment 465, 279 – 287. doi:
10.1016 / j.scitotenv.2013.02.054, ISSN: 00489697.
